DOCTOR OF PHILOSOPHY Innate memory to bacterial ...
246
DOCTOR OF PHILOSOPHY Innate memory to bacterial infection Inacio, Neusa Award date: 2021 Awarding institution: Queen's University Belfast Link to publication Terms of use All those accessing thesis content in Queen’s University Belfast Research Portal are subject to the following terms and conditions of use • Copyright is subject to the Copyright, Designs and Patent Act 1988, or as modified by any successor legislation • Copyright and moral rights for thesis content are retained by the author and/or other copyright owners • A copy of a thesis may be downloaded for personal non-commercial research/study without the need for permission or charge • Distribution or reproduction of thesis content in any format is not permitted without the permission of the copyright holder • When citing this work, full bibliographic details should be supplied, including the author, title, awarding institution and date of thesis Take down policy A thesis can be removed from the Research Portal if there has been a breach of copyright, or a similarly robust reason. If you believe this document breaches copyright, or there is sufficient cause to take down, please contact us, citing details. Email: [email protected] Supplementary materials Where possible, we endeavour to provide supplementary materials to theses. This may include video, audio and other types of files. We endeavour to capture all content and upload as part of the Pure record for each thesis. Note, it may not be possible in all instances to convert analogue formats to usable digital formats for some supplementary materials. We exercise best efforts on our behalf and, in such instances, encourage the individual to consult the physical thesis for further information. Download date: 11. Jan. 2022
-
Upload
khangminh22 -
Category
Documents
-
view
0 -
download
0
Transcript of DOCTOR OF PHILOSOPHY Innate memory to bacterial ...

DOCTOR OF PHILOSOPHY
Innate memory to bacterial infection
Inacio, Neusa
Award date:2021
Awarding institution:Queen's University Belfast
Link to publication
Terms of useAll those accessing thesis content in Queen’s University Belfast Research Portal are subject to the following terms and conditions of use
• Copyright is subject to the Copyright, Designs and Patent Act 1988, or as modified by any successor legislation • Copyright and moral rights for thesis content are retained by the author and/or other copyright owners • A copy of a thesis may be downloaded for personal non-commercial research/study without the need for permission or charge • Distribution or reproduction of thesis content in any format is not permitted without the permission of the copyright holder • When citing this work, full bibliographic details should be supplied, including the author, title, awarding institution and date of thesis
Take down policyA thesis can be removed from the Research Portal if there has been a breach of copyright, or a similarly robust reason.If you believe this document breaches copyright, or there is sufficient cause to take down, please contact us, citing details. Email:[email protected]
Supplementary materialsWhere possible, we endeavour to provide supplementary materials to theses. This may include video, audio and other types of files. Weendeavour to capture all content and upload as part of the Pure record for each thesis.Note, it may not be possible in all instances to convert analogue formats to usable digital formats for some supplementary materials. Weexercise best efforts on our behalf and, in such instances, encourage the individual to consult the physical thesis for further information.
Download date: 11. Jan. 2022

Innate Memory to Bacterial Infection
A thesis presented for the degree of Doctor of Philosophy,
Centre for Experimental Medicine,
School of Medicine, Dentistry and Biomedical Sciences,
Queen’s University Belfast.
Neusa Filipa Da Silva Inácio
BSc, MSc.
February 2021

I
Declaration
I declare that the work presented in this thesis is based entirely on my own work and
that all results and statements presented are correct and to the best of my knowledge.
None of the material in this thesis has been submitted for which a degree has been
or will be conferred by any other university or institution nor has this thesis already
been submitted to obtain a degree by this university.

II
Acknowledgments
Firstly, I would like to express my utmost gratitude to God for my health, and for lifting
me up, and giving me the strength to carry on when personal circumstances were not
so good.
My sincere thanks to my supervisor Dr Rebecca Ingram for all the support and
guidance over the past four years, and the late hours she spent with me at the BSU
doing the infections. Thank you for the confidence you had in me from the beginning
of the project, allowing me to work independently. I would also like to thank my second
supervisor Prof. Paul Moynagh for the help and support he has given me during the
duration of this project. They have been of great help and encouragement throughout
my years as a PhD student. I would also like to thank my sponsor, the Angolan
government, for all the help during what was a time of national financial difficulties,
and the staff of INTO Queen’s for going above and beyond to make this journey as
easy as possible.
To my sons Mario and Nathan, thank you for being my support, and helping with the
chores around the house, allowing me to focus more time on my studies. Also, thank
you to all my family for the encouragement and financial support.
I cannot forget to thank all the lab colleagues from Beckie’s lab, and from other labs
that have also been of great help. Dr Alice Dubois, who was there to help when I first
started, the post-doctoral researchers Jaime Lindsay, Sheila McCartan, former PhD
colleague Dr Adura Faniyi and present PhD colleague Hossam Amr, and the Masters
and Undergraduate students I was pleased to meet and work with. I am also grateful
for the immunology lab meetings from which I received helpful feedback, and all the
staff from Queen’s that directly or indirectly helped make this project possible.
Finally, thank you to all the BSU staff that helped with the breeding and welfare of the
mice.

III
Preface
Presentations
Poster presentation, Annual REMERGE Symposium, Belfast UK
Paper in preparation
Alice V Dubois1, Neusa Inacio1, Avril Monahan1, Jaime Lindsay1,
SamanthaTiyib1, Paul Monynagh1,2, Rebecca J Ingram1*. Innate lymphoid cell
exposure to bacteria results in a pathogen specific enhancement of bacterial
clearance upon re-exposure.

IV
Abbreviations
Abbreviation: Description:
ACK
A. junnii
Ammonium-Chloride-Potassium
Acinetobacter junnii
AHR
ANOVA
AP-1
APCs
Areg
BCG
BCL11b
BCP
BCR
BFA
Aryl hydrocarbon receptor
Analysis of variance
Activator protein -1
Antigen presenting cells
Amphiregulin
Bacillus Calmette-Guérin
B cell leukaemia 11b
B-cell progenitor
B cell receptor
Brefeldin A
BM
BSA
BSU
CCR
Bone marrow
Bovine serum albumin
Biological Service Unit
Chemokine (C-Motif) receptor
CD
cDNA
CFTR
Cluster of differentiation
Complementary deoxyribonucleic acid
Cystic fibrosis transmembrane conductance regulator
CFU
CHILP
CILPS
C. difficile
Colony forming unit
Common helper-like innate lymphoid preursor
Common innate lymphoid precursors
Clostridium difficile

V
CLP
CLRs
CM
CMP
ConA
cNK
COPD
CO2
CC
C. rodentium
CXC
CXCL
CXCR
CyTOF
DAMPs
Common lymphoid progenitor
C-type lectin receptors
Culture medium
Common myeloid progenitor
Concanavalin A
Conventional NK cell
Chronic obstructive pulmonary disease
Carbon dioxide
C chemokine
Citrobacter rodentium
Inflammatory chemokine
Chemokine (C-X-C motif) ligand
Chemokine (C-X-C motif) receptor
Cytometry by time-of-light mass spectrometry
Danger-associated molecular patterns
DC
DKO
DMSO
Dendritic cell
Double knockout
Dimethyl sulfoxide
DNA
EAE
Deoxyribonucleic acid
Experimental autoimmune encephalomyelitis
E. coli
EDTA
EF-PBS
EILP
Escherichia coli
Ethylenediaminetetraacetic Acid
Endotoxin free PBS
Early innate lymphoid precursor
ELISA
Eomes
EP
Enzyme-linked immunosorbent assay
Eomesodermin
Erythroid progenitor

VI
EPO
ETS1
Erythropoietin
ETS proto-oncogene 1
FACS
FBD
Fluorescence-activated cell sorting
Foetal bovine serum
FCS
FITC
FlowSom
FMO
FSC
FoxP3
GATA3
G-CFS
GFI1
GM-CFS
GMP
HCMV
HIV
HKPa
HRP
HSC
ICAM-1
ICC
ICOS
Foetal calf serum
Fluorescein isothiocyanate
Flow data analysis using Self-Organizing Map
Fluorescence minus one
Forward scatter
Forkhead box protein
GATA-binding protein 3
Granulocyte colony-stimulating factor
Growth factor independent 1 transcriptional repressor
Granulocyte macrophage colony-stimulating factor
Granulocyte-macrophage progenitor
Human cytomegalovirus
Human immunodeficiency virus
Heat killed Pseudomonas aeruginosa
Horseradish peroxidise
Hematopoietic stem cell
Intracellular adhesion molecule -1
Intracellular cytokine flow cytometry
Inducible T cell co-stimulator
IFN-γ
Id2
IFN
Ig
Interferon gamma
Inhibitor of DNA-binding protein 2
Interferon
Immunoglobulin

VII
IgA
IgE
IgG
Immunoglobulin A
Immunoglobulin E
Immunoglobulin G
IGF-1
IRF
IKKα
IKKβ
IKKε
IBD
Insulin growth factor -1
Transcription factor interferon regulatory
Inhibitor of nuclear factor kappa-B kinase subunit alpha
Inhibitor of nuclear factor kappa-B kinase subunit beta
Inhibitor of nuclear factor kappa-B kinase subunit
epsilon
Inflammatory bowel disease
ILCs
ILC1
ILC2
ILC3
ILCP
Innate Lymphoid Cells
Type 1 innate lymphoid cell
Type 2 innate lymphoid cell
Type 3 innate lymphoid cell
Innate lymphoid cell precursor
IL
iNOS
Interleukin
Inducible nitric oxide synthase
IMDM Iscove’s Modified Dulbecco’s Medium
i.p.
IRF
IVC
KARs
KIRs
KLRG1
Intraperitoneal/intraperitoneally
Interferon-regulator factor
Individual ventilated cages
Killer activation receptors
Killer inhibition receptors
Killer cell lectin like receptor G1
KO
KC
LFA-1
Knockout
Keratinocyte-derived chemokine
Lymphocyte function-associated antigen -1

VIII
LPS
LRR
Lin-
Lipopolysaccharide
Leucine-rich repeats
Lineage marker negative
LTi
MAVS
mAb
MAPK
M-SCF
MCMV
MEP
Lymphoid tissue inducer
Mitochondrial antiviral-signalling protein
Monoclonal antibody
Mitogen-activated protein kinase
Macrophage colony-stimulating factor
Monkey cytomegalovirus
Megakaryocyte erythroid progenitor
MHC
M. tuberculosis
MkP
MPP
MPPtype2
MyD88
NCR
NEMO
MEP
NETs
NFAT
Major histocompatibility complex
Mycobacterium tuberculosis
Megakaryocyte progenitor
Multipotent progenitor
Multipotent progenitor type 2
Myeloid differentiation protein 88
Natural cytotoxic receptor
NF-kappa-β essential modulator
Megakaryocyte erythroid progenitor
Neutrophil extracellular traps
Nuclear factor of activated T-cell
NF-κB
NFIL3
Nuclear Factor- Kappa B
Nuclear Factor Interleukin 3 Regulator
NK
NKG2C
NKP
NKT
Natural Killer
NKG2-C type II integral membrane protein
Natural cell precursor
Natural Killer T

IX
NOD
NLRs
Nuclear oligomerisation domain
NOD-like receptors
OD Optical Density
P. aeruginosa
PFA
PMA
Pseudomonas aeruginosa
Paraformaldehyde
Phorbol 12-myristate 13-acetate
PAMPs Pathogen-associated molecular patterns
PBS
PCR
Phosphate buffer saline
Polymerase chain reaction
PBST
PE
PLZF
PMN’s
PMTs
PBS Tween
Phycoerythrin
Promyeloid leukaemia zinc finger
Polymorphonuclear leucocytes
Photomultiplier tubes
PRRs
PS
RA
RIG-I
RLR
Pattern recognition receptors
Penicillin-streptomycin
Rheumatoid arthritis
Retinoic acid-inducible gene-I
RIG-I-like receptor
RORα
RORγt
ROS
RNA
RAG
R2G2
Retinoic Acid Receptor-Related Orphan Receptor
Alpha
Retinoic acid-related orphan receptor gamma t
Reactive oxygen species
Ribonucleic acid
Recombination activating gene

X
ROR
ROS
RPMI
RT
RT-PCR
RUNX3
Backcrossing the IL2RG (common gamma chain)
mutation with mixed background mouse (C57BL/6 and
129 mix) with a mutation in Rag2.
Retinoic acid receptor-related orphan receptor
Reactive oxygen species
Roswell Park Memorial Institute
Room temperature
Real time polymerase chain reaction
Runt-related transcription factor 3
S. aureus
Sca-1
SCF
SD
SEM
SLE
SOM
Staphylococcus aureus
Stem cell antigen 1
SKp1-Cul1-F-box
Standard deviation
Standard error of mean
Systemic lupus erythematosus
Self-Organizing Maps
SSC Side scatter
ST2
TBK1
TCF1
TCR
Tc cells
T-bet
Th
Suppressor of tumorigenicity 2
TANK-binding kinase 1
Transcription factor T-cell factor 1
T cell receptor
Cytotoxic T cells
T-box transcription factor-Tbx21
T-helper
TLR Toll-Like Receptor

XI
TMB 3,3’,5,5’’-tetramethylbenzidine
TNFα
TNK
TOX
TPO
Tregs
TRIF
TSLP
t-SNE
WHO
Tumour necrosis factor alpha
T-cell natural killer cell progenitor
Thymocyte selection associated high mobility group box
Thrombopoietin
Regulatory T cells
TIR domain-containing adaptor-inducing interferon-β
Thymic stromal lymphopoietin
t-distributed stochastic neighbour embedding
World Health Organization
WT
γδ T
Y.
enterocolitica
αLP
Wild type
Gamma delta T cells
Yersinia enterocolitica
alpha-lymphoid progenitor

XII
Abstract
The innate lymphoid cells (ILCs) ILC1, ILC2, and ILC3, which also includes the natural
killer (NK) cells are important regulators and first line responder during pathogen
invasion. The role of ILCs was evaluated using FACS sorting, cytokine production and
surface markers analysis, cell depletion, heat killed bacterial immunisation and
bacterial infection.
This study hypothesised that following immunisation mice would be able to restrain
bacterial growth and aimed to investigate the magnitude and longevity and specificity
of the response. Depletion of CD90+ cells resulted in the inability of mice to control
bacterial infection whereas depletion of NK cells did not affect the control of bacterial
infection. The burden of P. aeruginosa in mice immunised with heat killed P.
aeruginosa and infected with live bacteria 10 days post immunisation was significantly
lower on mice that received the immunisation showing a positive effect of vaccination.
The inability to control the bacterial infection was also observed in mice lacking ILCs;
however, mice with ILCs also failed to completely clear the infection suggesting that
ILCs alone are not able to maintain the protective response. Specificity was
demonstrated here as mice immunised with P. aeruginosa and infected with either E.
coli or S. aureus had higher counts of P. aeruginosa. Experiments in RAG1 knockout
(Ko) mice lacking T and B cells, which received immunisation at different time points
and infection on day 0 post immunisation led to an increased level of the
proinflammatory cytokine IL-22. These results led to the conclusion that specific
resistance to bacterial infection in mice through ILCs is possible and suggests the
infection caused by P. aeruginosa caused activation of ILC3 subset, recruitment of
neutrophils and other immune cells and production of IL-17 and IL-22 cytokines.

Table of Contents
Declaration ............................................................................................................... I
Acknowledgments .................................................................................................... II
Abbreviations .......................................................................................................... IV
Abstract ................................................................................................................. XII
Table of figures ..................................................................................................... XIX
Tables ................................................................................................................. XXV
CHAPTER 1 - GENERAL INTRODUCTION ............................................................ 1
Introduction .......................................................................................................... 2
1.1 Immunity ........................................................................................................ 2
1.2 Immune cells origin ........................................................................................ 3
1.3 Innate Immunity .............................................................................................. 6
1.3.1 Immunological memory ............................................................................ 6
1.3.2 Innate memory ......................................................................................... 7
1.3.3 Innate immunological memory ................................................................. 8
1.3.4 Trained immunity ..................................................................................... 8
1.3.5 Cells of the innate immunity ..................................................................... 9
1.3.5.1 Monocytes and macrophages ............................................................ 9
1.3.5.2 Dendritic cells (DCs) .........................................................................10
1.3.5.3 Neutrophils .......................................................................................10
1.3.5.4 Basophils and mast cells ..................................................................11
1.3.5.5 Eosinophils .......................................................................................12
1.3.5.6 Macrophages ...................................................................................12
1.4 Potential for innate lymphoid cells memory....................................................12
1.4.1 Innate lymphoid cells memory .................................................................13
1.4.2 Natural killer cell memory ........................................................................15
1.5 The Innate immune system ...........................................................................16
1.6 The physical barriers .....................................................................................17
1.6.1 Skin ........................................................................................................17
1.6.2 Respiratory tract .....................................................................................18
1.6.3 Gastrointestinal tract ...............................................................................18
1.6.4 Lacrimal secretions .................................................................................18
1.7 Lymphocytes .................................................................................................19
1.8 Innate Lymphoid Cells (ILCs) ........................................................................20

XIV
1.8.1. Group 1 ILCs .........................................................................................25
1.8.1.1. Natural killer cells ............................................................................25
1.8.1.2 ILC1 .................................................................................................26
1.8.2 Group 2 ILCs ..........................................................................................27
1.8.3 Group 3 ILCs ..........................................................................................28
1.9 Innate lymphoid cells development ................................................................30
1.10 Innate lymphoid cells Plasticity ....................................................................31
1.11 Innate lymphoid cells and bacterial infections ..............................................31
1.12 Interplay between ILCs and other cells of the immune system ....................32
1.13 Human and Mouse Innate Lymphoid Cells ..................................................33
1.14 The adaptive immune system ......................................................................34
1.14.1 B cells ...................................................................................................35
1.14.2 T cells ...................................................................................................36
1.15 Innate and Adaptive immune system ...........................................................39
1.16 Cytokines ....................................................................................................41
1.16.1 Interleukin 17 (IL-17) .............................................................................42
1.16.2 Interleukin 22 (IL-22) .............................................................................42
1.17 Receptors ....................................................................................................43
1.17.1 The innate receptors .............................................................................43
1.17.1.2 Toll-like receptors ...............................................................................44
1.17.1.3 The NOD-like receptors .....................................................................45
1.17.1.4 RLR-I-like receptors ...........................................................................45
1.17.1.5 C-type lectin receptors .......................................................................46
1.17.1.6 Killer activation receptors ...................................................................46
1.17.1.7 Killer inhibition receptors ....................................................................46
1.17.2 The adaptive receptors .............................................................................47
1.17.2.1 B cell receptors ..................................................................................47
1.17.2.2 T cell receptors ..................................................................................47
1.18 The inflammatory response .........................................................................47
1.19 Pseudomonas aeruginosa ...........................................................................51
1.19.1 Pseudomonas aeruginosa mechanism of action ...................................51
1.19.2 Pseudomonas aeruginosa treatment options ........................................52
1.20 The Future ...................................................................................................52
1.21 Mouse models of ILC function during P. aeruginosa infection......................53
1.22 Hypothesis ..................................................................................................54
1.23 Aims ............................................................................................................54

XV
CHAPTER 2 - GENERAL MATERIALS AND METHODS .......................................55
2.1 Materials and equipment ...............................................................................56
2.2 Bacterial isolates ...........................................................................................60
2.2.1 Preparation of heat killed P. aeruginosa ..................................................60
2.2.2 Preparation of Pseudomonas aeruginosa for infection ............................60
2.2.3 Preparation of Staphylococcus aureus for infection.................................61
2.2.4 Preparation of Escherichia Coli for infection ............................................61
2.2.5 Serial dilutions ........................................................................................61
2.3 Mice infection ................................................................................................62
2.3.1 Mice ........................................................................................................62
2.3.2 Intraperitoneal immunisation ...................................................................62
2.3.3 Intraperitoneal infection ...........................................................................62
2.3.4 Culling and Sample collection .................................................................63
2.3.5 Peritoneal lavage ....................................................................................63
2.3.6 Spleen ....................................................................................................63
2.3.6.1 Aseptic splenocytes isolation ............................................................64
2.3.7 Bone marrow ..........................................................................................64
2.3.8 Isolation of bacterial colonies ..................................................................65
2.4 Single cell suspension ...................................................................................65
2.4.1 Red blood cell lysis .................................................................................66
2.4.1.1 Cell counting ....................................................................................66
2.4.1.2 Single staining controls .....................................................................66
2.4.1.3 Fc receptor blockage ........................................................................67
2.4.1.4 Extracellular staining ........................................................................67
2.4.1.5 Intracellular staining.........................................................................68
2.5 Flow cytometry ..............................................................................................69
2.6 Gating strategy ..............................................................................................70
2.7 Sample acquisition ........................................................................................75
2.7.1 Fluorescence-activated cell sorting (FACS) ............................................75
2.7.2 In Vitro Cytokine production ....................................................................76
2.8 Enzyme-linked immunosorbent assay (ELISA) ..............................................77
2.8.1 Plate reading and analysis ......................................................................78
2.9 Magnetic cell isolation ...................................................................................78
2.9.1 Washing the beads .................................................................................79
2.9.2 Preparing the samples ............................................................................79
2.9.3 Negative isolation ...................................................................................80

XVI
2.9.4 Positive isolation .....................................................................................80
2.10 Purity analysis using different methods of magnetic isolation ......................80
2.10.1 Magnetic labelling .................................................................................80
2.10.2 Magnetic labelling for negative selection ...............................................81
2.10.3 Magnetic labelling for positive selection ................................................82
2.10.4 Magnetic labelling for negative selection followed by positive selection 83
2.11 Flow surface staining ...................................................................................83
2.12 ILC2 isolation ..............................................................................................87
2.13 Sample analysis ..........................................................................................88
2.14 Statistical analysis .......................................................................................89
2.15 Study approval ............................................................................................89
CHAPTER 3 - CHARACTERISATION OF INNATE LYMPHOID CELLS MEMORY 90
3.1. Introduction ..................................................................................................91
3.1.1 Intracellular pathogens ............................................................................93
3.1.2 Extracellular parasites .............................................................................93
3.1.3 Extracellular bacteria and fungi ...............................................................94
3.2 Aims ..............................................................................................................95
3.3 Method ..........................................................................................................95
3.3.1 Mice ........................................................................................................95
3.3.1.1 Mice immunisation ............................................................................95
3.3.2 Collection of samples ..............................................................................95
3.3.3 Isolation of cells ......................................................................................96
3.3.4 Extracellular staining ...............................................................................96
3.3.5 Intracellular staining of transcription factors ............................................96
3.3.6 Cytokine staining ....................................................................................97
3.4 Flow cytometry ..............................................................................................98
3.5 Computational analysis of flow cytometry obtained ILCs by FlowSOM and t-
SNE mapping ......................................................................................................98
3.5.1 FlowSOM ................................................................................................99
3.5.2 t-Distributed Stochastic Neighbour Embedding (t-SNE) algorithm
expression of 19 ILCs surface markers ............................................................99
3.5.3 Gating strategy for Symphony ............................................................... 101
3.6 Statistical analysis ....................................................................................... 101
3.7 Results ........................................................................................................ 102
3.7.1 In vitro Characterisation of ILCs surface markers .................................. 102
3.7.2 ILCs markers associated with memory.................................................. 106

XVII
3.7.3 Flow transcription factors associated with ILCs ..................................... 108
3.7.4 Memory markers time course ................................................................ 109
3.7.5 Cytokine production .............................................................................. 110
3.9 Computational analysis of ILC’s data obtained by flow cytometry using
FlowSOM and t-SNE mapping .......................................................................... 115
3.8.1 Multi-dimensional scaling (MDS) plot ................................................. 119
3.8.2 t-SNE metaclusters associated with surface markers ........................ 120
3.8.5 Bar plot of relative abundance of the 6 mice ILC populations from each
sample ....................................................................................................... 125
3.8.6 Heatmap representative of metaclusters from t-SNE map of splenocytes
from heat killed P. aeruginosa immunised C57BL/6 mice. .......................... 127
3.8.7 Clusters with phenotypic similarities. ................................................. 130
3.8.8 Boxplot showing abundance of ILCs populations each sample .......... 130
3.8 Discussion ................................................................................................... 135
CHAPTER 4 - DEMONSTRATION OF NEUTROPHILS RECRUITMENT BY ILC
CELLS DURING AN IMMUNE RESPONSE. ........................................................ 139
4.1 Introduction ................................................................................................. 140
4.2. Aims ........................................................................................................... 141
4.3 Methods ...................................................................................................... 142
4.3.1 Mice ...................................................................................................... 142
4.3.1.1 Mice immunisation .......................................................................... 142
4.3.1.2 In vivo infection............................................................................... 142
4.3.1.3 Bacterial culture .............................................................................. 143
4.3.1.4 Determination of Bacterial burden following immunisation/infection 143
4.3.2 Flow cytometry ...................................................................................... 143
4.3.2.1 Gating strategies for flow cytometry analysis ..................................... 144
4.4 In vivo CD90 Depletion ................................................................................ 144
4.5 NK1.1 Depletion .......................................................................................... 145
4.6 Statistical analysis ....................................................................................... 146
4.7 Results ........................................................................................................ 146
4.7.1 RAG1 KO survival ................................................................................. 146
4.7.2 RAG1 KO Time course ......................................................................... 147
4.7.3 Cytokine measurement analysis ........................................................... 148
4.7.4 Recruitment of innate immune cells ...................................................... 149
4.7.5 RAG1 KO in vivo CD90 depletion ......................................................... 150
4.7.6 NK1.1 in vivo depletion ......................................................................... 152
4.7.7 RAG1 Ko and cγ DKO infection ............................................................ 154

XVIII
4.7.8 R2G2 and RAG1 KO cytokine profile .................................................... 155
4.7.8 Specificity ............................................................................................. 157
4.8 Discussion ................................................................................................... 158
CHAPTER 5 - INTERPLAY BETWEEN NEUTROPHILS AND INNATE LYMPHOID
CELLS .................................................................................................................. 162
5.1 Introduction ................................................................................................. 163
5.2. Aims ........................................................................................................... 165
5.3 Methods ...................................................................................................... 165
5.3.1 Bacterial strains .................................................................................... 165
5.3.2 Mice strains........................................................................................... 165
5.3.3 Mice samples ........................................................................................ 165
5.3.4 Acquisition of bone marrow-derived neutrophils .................................... 166
5.4 Migration assay using the Boyden chamber method ................................... 166
5.5 Phagocytosis assay ..................................................................................... 167
5.5.1 Beads ................................................................................................... 168
5.6 Flow cytometry ............................................................................................ 168
5.7 Statistical analysis ....................................................................................... 168
5.8 Results ........................................................................................................ 168
5.8.1 Neutrophils infiltration ........................................................................... 168
5.8.2 Migration assay ..................................................................................... 169
5.9 Phagocytosis assay ..................................................................................... 171
5.10 Discussion ................................................................................................. 172
CHAPTER 6 - GENERAL DISCUSSION .............................................................. 175
APPENDICES ...................................................................................................... 186
CHAPTER 7 - REFERENCES .............................................................................. 196

XIX
Table of figures
CHAPTER 1
Figure 1.1 - Immune cells formation and cytokines involved ..................................... 5
Figure 1.2 - Innate lymphoid cells origin, subsets and cytokines ............................. 23
Figure 1.3 - Classification of ILC1 on the basis of the transcription factors they require
for normal development, function and cytokine profile ............................................ 26
Figure 1.4 - Classification of ILC2 based on the transcription factors they require for
normal development and function and cytokine profile ............................................ 28
Figure 1.5 - Classification of ILC3 based on the transcription factors they require for
normal development and function and cytokine profile ............................................ 29
Figure 1.6 - Human and mice innate lymphoid cells development ........................... 30
Figure 1.7- B cell activation, proliferation and immune response ........................... 37
Figure 1.8 - Differences between Primary and Secondary Immune Response ....... 38
Figure 1.9 - Innate immune receptors activation .................................................... 44
Figure 1.10 - Innate lymphoid cells (ILCs) and their involvement in inflammatory
disorders tissue repair and homeostasis ................................................................. 49
Figure 1.11 - Innate lymphoid cells and their cytolytic features .............................. 50

XX
CHAPTER 2
Figure 2.1 - Representative gating strategy for spleen and peritoneal lavage ILCs
characterisation ...................................................................................................... 71
Figure 2.2 - Representative gating strategy for macrophages ................................. 72
Figure 2.3 - Representative gating strategy for neutrophils .................................... 73
Figure 2.4 - Representative gating strategy for transcription factors ....................... 74
Figure 2.5 - Representative gating strategy for cytokines ........................................ 74
Figure 2.6 illustration of immunisation and sample processing................................ 75
Figure 2.7 Lineage negative selection only ............................................................. 82
Figure 2.8 CD90 positive selection followed by lineage negative selection ............. 83
Figure 2.9 Lineage negative isolation followed by CD90 positive isolation .............. 83
Figure 2.10 Lineage negative magnetic isolation .................................................... 84
Figure 2.11 Percentage of Biotin positive (Lineage+) cells remaining after the
magnetic separation ............................................................................................... 84
Figure 2.12 Magnetic isolation with different amounts of antibody and magnetic
particles .................................................................................................................. 85
Figure 2.13 Dynal beads and Dynal cell magnetic separator .................................. 86

XXI
Figure 2.14 Dynal beads and Stem cell magnetic separator ................................... 86
Figure 2.15 Lineage biotin beads optimisation ........................................................ 87
Figure 2.16 ILC2 magnetic isolation by EasySep enrichment kit for ILC2 ............... 88
CHAPTER 3
Figure 3.1 - Manual gating strategy for identification of ILC population on spleen by
FlowSOM .............................................................................................................. 101
Figure 3.2 - Phenotypic analysis by flow cytometry of the expression of the
characteristic surface molecules expression of ILCs in spleen ............................. 103
Figure 3.3 - Phenotypic analysis by flow cytometry of the expression of ILCs surface
molecules associated with memory in spleen ...................................................... 107
Figure 3.4 - Intracellular staining of transcription factors in splenic ILCs .............. 109
Figure 3.5 - Flow characterisation of CD44 & CD62L expression in splenic ILCs .. 110
Figure 3.6 - Heat Killed P. aeruginosa stimulated ILCs produced significant levels of
IFN-ү ..................................................................................................................... 112
Figure 3.7 - Heat Killed P. aeruginosa stimulated ILCs produced significant levels of
IL-17A ................................................................................................................... 113
Figure 3.8 - Heat Killed P. aeruginosa stimulated ILCs produced significant levels of
IL-22 ..................................................................................................................... 114

XXII
Figure 3.9 - FlowSOM automatic gating of Lineage negative and CD90 positive from
mice immunised with heat killed P. aeruginosa or PBS in t-SNE clustering .......... 116
Figure 3.10 - FlowSOM clusters in t-SNE dimensional reduced map from splenocytes
of C57BL/6 mice immunised with heat killed P. aeruginosa .................................. 117
Figure 3.11 FlowSOM clusters in t-SNE dimensional reduced map from splenocytes
of C57BL/6N mice immunised with PBS ............................................................... 118
Figure 3.12 t-SNE plot based arcsinh-transformed expression of 10 ILCs surface
markers and 3 transcription factors from splenocytes of C57BL/6N mice .............. 119
Figure 3.13 MDS plot of PBS and P. aeruginosa immunised spleen samples from
C57BL/6N mice .................................................................................................... 120
Figure 3.14 Mapping of ILCs transcription factors in t-SNE on splenocytes from
C57BL/6N mice .................................................................................................... 121
Figure 3.15 Mapping of markers associated with memory markers in t-SNE
dimensional reduced frame on splenocytes from C57BL/6N immunised mice ...... 122
Figure 3.16 t-SNE of individual markers expressed by ILCs from splenocytes of
C57BL/6N mice .................................................................................................... 123
Figure 3.17 Cluster overview ................................................................................ 126
Figure 3.18 Heatmap showing cluster overview and abundance ........................... 128
Figure 3.19 Boxplots representation of the clusters defined by FlowSOM ............. 131

XXIII
CHAPTER 4
Figure 4.1 - Illustration of CD90 in vivo depletion .................................................. 145
Figure 4.2 - Immunisation with heat killed P. aeruginosa increases the survival rate
............................................................................................................................. 147
Figure 4.3 - Bacterial count of P. aeruginosa on a time course experiment of
immunised and non-immunised RAG1 KO............................................................ 148
Figure 4.4 - P. aeruginosa immunisation upregulates the production of IL-17A ..... 149
Figure 4.5 - Immune cells were enhanced in peritoneal lavage following immunisation
and infection by P. aeruginosa .............................................................................. 150
Figure 4.6 - Effect of CD90 depletion in RAG1 KO after P. aeruginosa infection in ILC
depleted mice compared to isotype control ........................................................... 152
Figure 4.7 - Effect of NK 1.1 depletion in RAG1 KO mice after P. aeruginosa infection
compared to isotype control .................................................................................. 153
Figure 4.8 - Immunisation with heat killed P. aeruginosa promote resistance to
bacterial infection in ILC dependent manner (n=7) ................................................ 154
Figure 4.9 - R2G2 mice do not produce significant amount of cytokine ................. 155
Figure 4.10 - CFU of Rag 1 KO infected with S. aureus, E. coli, and P. aeruginosa 10
days after immunisation with heat killed P. aeruginosa ......................................... 157

XXIV
CHAPTER 5
Figure - 5.1 Cell count of neutrophils in peritoneal lavage of RAG 1 KO and RAG cү
DKO mice infected with P. aeruginosa and PBS control ....................................... 169
Figure - 5.2 Determination of the neutrophil capacity for migration ....................... 170
Figure - 5.3 Comparison of bactericidal capacity of neutrophils from P. aeruginosa
immunised and non-immunised or control groups ................................................. 171

XXV
Tables
CHAPTER 1
Table 1.1 – ILCs effector cytokine profile ................................................................ 29
Table 1.2 - Primary immune response vs Secondary immune response ................ 38
Table 1.3 - Features of the immune system ........................................................... 40
CHAPTER 3
Table 3.1 - Antibodies used for ILCs surface marker .............................................. 96
Table 3.2 - Antibodies used for memory time course .............................................. 96
Table 3.3 - Antibodies used for transcription factors staining .................................. 97
Table 3.4 - Antibodies used for cytokine measurement ........................................... 98
Table 3.5 - Antibodies used for ILC Symphony ..................................................... 100
Table 3.6 - Key ILCs Surface markers .................................................................. 108
Table 3.7 - Clusters associated with surface markers ........................................... 125
Table 3.8 - Average number of cells per cluster .................................................... 126
Table 3.9 Clusters to be merged as per the dendrogram ...................................... 130

XXVI
CHAPTER 4
Table 4.1 - Antibodies used for neutrophil infiltration ............................................. 144

1
CHAPTER 1 - GENERAL INTRODUCTION

2
Introduction
Antibiotics were a major achievement in the field of medicine to fight against bacterial
infection; however, the effectiveness of antibiotics is rapidly declining due to the
emergence of mutations resulting in antibiotic resistant strains of bacteria. This
resistance is a result of factors such as genetic alterations, decrease of membrane
and wall permeability (Croughs et al., 2018; Peterson & Kaur, 2018). Antibiotic
resistance is a major cause of hospital acquired infections, with immunocompromised
patients being the most impacted (Bassetti et al., 2018). The increased
ineffectiveness of antibiotics to fight bacterial infections has resulted in an urgent need
to find new strategies to fight these opportunistic infectious diseases.
1.1 Immunity
Our immune system is made of skin, mucosa and mucus of the gastrointestinal,
reproductive and respiratory tract as physical components, for example, tears and the
acidic environment of the stomach as chemical components; complement system,
cytokines and antibodies as part of the humoral immunity and phagocytes of the
innate immune system, T lymphocytes, B lymphocytes and innate lymphoid cells as
components of the cell-mediated immunity. These components of the immune system
have developed to help the body to survive external attack by infectious
microorganisms such as bacteria, viruses, fungi and parasites with the ultimate goal
of acquiring immunity by overpowering and thus surviving the disease caused by the
pathogen (Riera et al., 2016). Immunity was first observed in 1796 when a healthy
boy inoculated, by Jenner, with pus from an animal infected with cowpox survived the
infection after acquiring the disease for the first time and had no signs of disease
when challenged with the same pathogen for the second time (Akira, 2009).
These cellular components of the immune system are found throughout the body and
divided into the innate immune system made of innate immune cells from the myeloid
lineage such as the granulocytes mast cells to produce pro-inflammatory substances,
neutrophils to neutralise and phagocyte bacteria, eosinophils to induce an
inflammatory environment and attract other immune cells and basophils that will also
release the pro-inflammatory histamine and prostaglandin (Riera et al., 2016b). The
myeloid cells which includes the macrophages, monocytes and dendritic cells; the
lymphocytes which includes the natural killer cells and the innate lymphoid cells, are
innate cells that provide a rapid response, acting as the first line of defence protecting

3
the epithelial barrier, secretion of antimicrobial peptides and the activation of the
adaptive immune system if the innate cells fail to contain the infection/pathogen
(Gardiner & Mills, 2016). The cytolytic T cells are activated to fight intracellular viruses,
tumour cells and extracellular parasites (Kumar et al., 2018), and the B cells are
activated to produce antibodies (Cyster & Allen, 2019). Both T and B cells are
lymphocytes of the adaptive immune system that provide a type of delayed response
that leave long lasting and specific immunological memory cells (Riera et al., 2016).
These immune cells when activated will destroy and stop the spread of bacterial, viral
and fungal infection, but when the immune response is not capable of protecting the
host, artificial methods such as antibiotics are used to help control the infection.
1.2 Immune cells origin
Cells of both the innate and adaptive immune systems originate from the bone
marrow, by a process known as haematopoiesis, the process of formation of blood
cells, from which at different stages when stimulated with the appropriate cytokine
such as the hematopoietic stem cell (HSC) a different cell lineage is formed and at
every stage the new lineage becomes more specialised and more restricted to a
particular lineage (Kondo, 2010). The HSC develops into a multipotent progenitor
(MPP) and the MPP gives rise to the common myeloid progenitor (CMP) that can give
origin to all lymphocytes which includes the T, B, NK (Natural Killer) and ILC (Innate
Lymphoid Cells) cells, and the common lymphoid progenitor (CLP) where the
megakaryocytes, erythrocytes, mast cells, basophils, eosinophils, neutrophils,
dendritic cells and macrophages are included, this hematopoietic process is
controlled by cytokines (Figure 1.1) (Perié et al., 2015).
Cytokines are small soluble proteins produced by almost every cell of the immune
system and tissue to communicate with each other. They are key regulators of many
biological processes; their role varies from activation to stimulation of cells and
pathways when they are released from the producing cells and act on the target cell
(Ray, 2016). Their role in haematopoiesis has been described by L. Robb in a study
that describes that the binding of cytokines such as interleukins, colony-stimulating
factors, interferons, erythropoietin and thrombopoietin to their cognate receptor
stimulates colony forming unit and colony forming cells to proliferate and to
differentiate into precursors that will gradually lose the ability to differentiate into
different cell lines and become committed to a particular lineage (Robb, 2007).
4
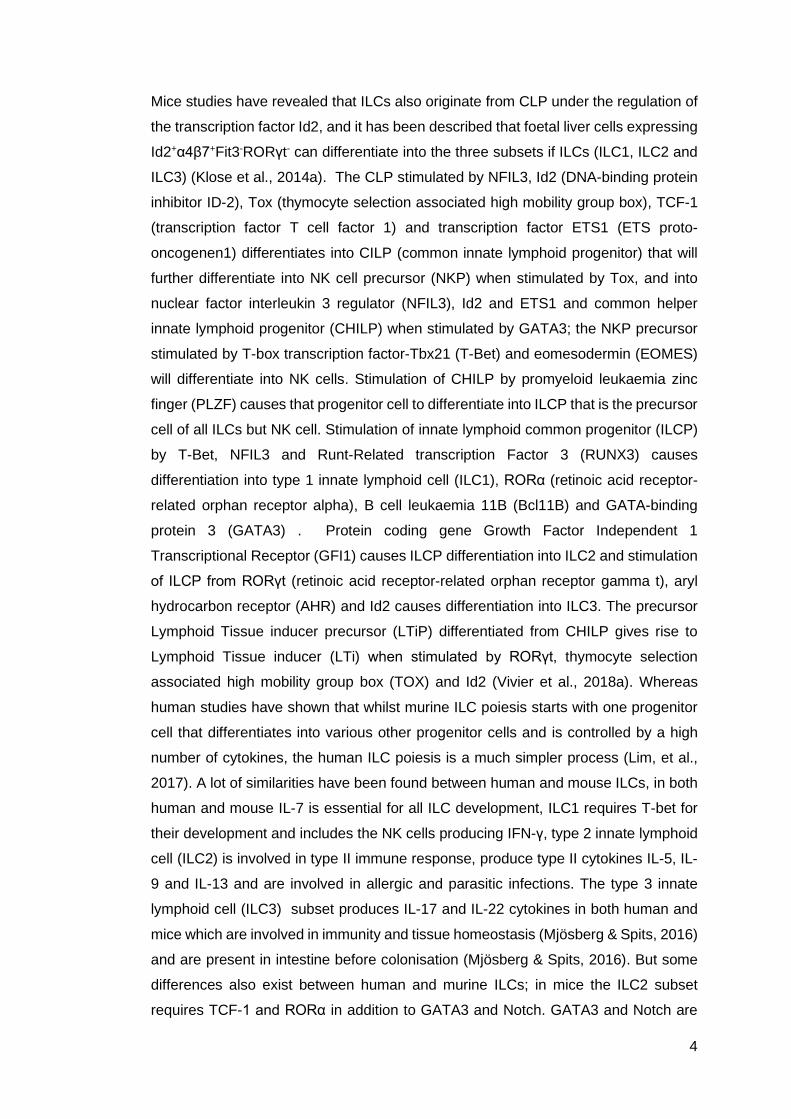
Mice studies have revealed that ILCs also originate from CLP under the regulation of
the transcription factor Id2, and it has been described that foetal liver cells expressing
Id2+α4β7+Fit3-RORγt- can differentiate into the three subsets if ILCs (ILC1, ILC2 and
ILC3) (Klose et al., 2014a). The CLP stimulated by NFIL3, Id2 (DNA-binding protein
inhibitor ID-2), Tox (thymocyte selection associated high mobility group box), TCF-1
(transcription factor T cell factor 1) and transcription factor ETS1 (ETS proto-
oncogenen1) differentiates into CILP (common innate lymphoid progenitor) that will
further differentiate into NK cell precursor (NKP) when stimulated by Tox, and into
nuclear factor interleukin 3 regulator (NFIL3), Id2 and ETS1 and common helper
innate lymphoid progenitor (CHILP) when stimulated by GATA3; the NKP precursor
stimulated by T-box transcription factor-Tbx21 (T-Bet) and eomesodermin (EOMES)
will differentiate into NK cells. Stimulation of CHILP by promyeloid leukaemia zinc
finger (PLZF) causes that progenitor cell to differentiate into ILCP that is the precursor
cell of all ILCs but NK cell. Stimulation of innate lymphoid common progenitor (ILCP)
by T-Bet, NFIL3 and Runt-Related transcription Factor 3 (RUNX3) causes
differentiation into type 1 innate lymphoid cell (ILC1), RORα (retinoic acid receptor-
related orphan receptor alpha), B cell leukaemia 11B (Bcl11B) and GATA-binding
protein 3 (GATA3) . Protein coding gene Growth Factor Independent 1
Transcriptional Receptor (GFI1) causes ILCP differentiation into ILC2 and stimulation
of ILCP from RORγt (retinoic acid receptor-related orphan receptor gamma t), aryl
hydrocarbon receptor (AHR) and Id2 causes differentiation into ILC3. The precursor
Lymphoid Tissue inducer precursor (LTiP) differentiated from CHILP gives rise to
Lymphoid Tissue inducer (LTi) when stimulated by RORγt, thymocyte selection
associated high mobility group box (TOX) and Id2 (Vivier et al., 2018a). Whereas
human studies have shown that whilst murine ILC poiesis starts with one progenitor
cell that differentiates into various other progenitor cells and is controlled by a high
number of cytokines, the human ILC poiesis is a much simpler process (Lim, et al.,
2017). A lot of similarities have been found between human and mouse ILCs, in both
human and mouse IL-7 is essential for all ILC development, ILC1 requires T-bet for
their development and includes the NK cells producing IFN-γ, type 2 innate lymphoid
cell (ILC2) is involved in type II immune response, produce type II cytokines IL-5, IL-
9 and IL-13 and are involved in allergic and parasitic infections. The type 3 innate
lymphoid cell (ILC3) subset produces IL-17 and IL-22 cytokines in both human and
mice which are involved in immunity and tissue homeostasis (Mjösberg & Spits, 2016)
and are present in intestine before colonisation (Mjösberg & Spits, 2016). But some
differences also exist between human and murine ILCs; in mice the ILC2 subset
requires TCF-1 and RORα in addition to GATA3 and Notch. GATA3 and Notch are

5
also required for human ILC2 development and function (Yang et al., 2014),
lymphocyte function-associated antigen 1 (LFA-1) is expressed by human NK cells
but not by murine NK cells but expressed in both human and mouse ILC2 (Schulz-
Kuhnt et al., 2020).
Figure 1.1 Immune cells formation and cytokines involved. The HSC has the
ability to self-renew itself. Stimulation of HSC by SCF and TPO causes differentiation
towards primitive progenitor cells CMP which in presence of IL-3, SCF and TPO
(thrombopoietin) differentiates into the committed precursors MEP, but when
stimulated by GM-CSF CMP differentiates into GMP, further stimulation of GMP by
M-CSF causes this cell to differentiate into monocytes and when stimulated by G-
CFS, IL-5 and SCF GMP differentiates into neutrophils and eosinophils. When
megakaryocyte erythroid progenitor (MEP) is stimulated by TPO differentiates into
lineage committed megakaryocyte progenitor (MkP) which will differentiate into
platelets are created and when stimulated by erythropoietin (EPO) lineage committed
EP (erythroid progenitor) that differentiates into erythrocytes are generated. The

6
lymphoid progenitor CLP is formed from the HSC in the presence of IL-7 which in turn
will differentiate into TNK and BCP (B-cell progenitor) when also stimulated by IL-7,
further stimulation of TNK by IL-7 and IL-12 causes this committed precursor to
differentiate into T cells and NK cells when stimulated by IL-7 and IL-15. The
committed progenitor BCP when stimulated by IL-4 differentiates into B cells. In
human, the ILC differentiation is almost the same a few differences are observed such
as in mice HSC differentiates into CLP and in human HSC gives rise to CLP-like HPC,
early innate lymphoid precursor (EILP) and common helper innate lymphoid precursor
(CHILP) in mice but in human the common lymphoid progenitor-like hematopoietic
progenitor cells (CLP-like HPC) is the precursor to ILCP only (Ai Ing Lim and James
P. Di Santo, 2019) (Robb, 2007).
1.3 Innate Immunity
Much of the potential of innate immunity was first demonstrated in non-vertebrate
models, where it was shown that immunological memory, exhibited by an enhanced
ability to survive infection, is possible in an invertebrate which lack adaptive immune
cells (Sadd & Schmid-Hempel, 2006). This elevation in the response of phagocytic
cells following pathogen exposure has also been observed in vertebrates, including
humans. This is exemplified by the fact that large epidemiological studies have
demonstrated that children immunised with BCG have reduced mortality at levels
beyond simply those attributable to prevention of tuberculosis (Gardiner & Mills,
2016). This is, however, a general non-pathogen specific boost of the function of the
cells was observed after being exposed to a small dose of pathogen or heat killed
pathogen (Levy & Wynn, 2014). This resulted in upregulation in production of
proinflammatory cytokines and enhanced expression of specific surface markers (van
der Meer, Joosten, Riksen, & Netea, 2015).
1.3.1 Immunological memory
Memory is described as the ability to store and recall information on previously
encountered characteristics (Netea & Van Crevel, 2014). The main reason behind the
dogma that the innate immune system cannot develop memory is due to the lack of
other cell mechanism beside the ones found on T and B cells receptors which are
capable of providing immunological memory.

7
Immunological memory is defined as long term acquired protection due to cells’
capability to store and recall information from a previously encountered pathogen to
protect the host from infectious agents (Homann & Kedl, 2018) through the generation
of cells with a long life span specialised in a particular encountered pathogen. Thus,
able to mount a robust and quicker secondary immune response when encountering
the same pathogen or antigen for a second and subsequent time (Moritz et al., 2017).
These features are achieved by a transformation of the previous effector cells into
memory cells which are fewer in numbers but more specialised after the encountered
antigen and require less time to expand (Mantile et al., 2019).
This type of memory has been known for a long time as the hallmark of the adaptive
immune cells, for the past 46 years as also part of the NK cells response features
(Moritz et al., 2017) and more recently in ILC2 cells, a subset of the innate immune
system (Martinez-Gonzalez et al., 2016a). The immunological memory should be
specific for the same pathogen and should not respond with the same strength to a
different pathogen or insult (Martinez-Gonzalez, Mathä, Steer, & Takei, 2017).
1.3.2 Innate memory
Innate memory was first described in vertebrates and later in invertebrates and plants
(Wang et al., 2014), bacteria (Nuñez et al., 2016) then in adaptive B and T immune
cells by somatic recombination (Tom et al., 2003) and later in innate immune cells
such as macrophages (Iwanowycz et al., 2016), monocytes (Hole et al., 2019) and
NK cells (Schlums et al., 2016) generated through germ-line encoded receptors (Negi
et al., 2019).
For many years innate memory was believed to be non-specific and incapable to
adapt to recognise specific pathogen. Long-term memory was considered to require
the antigen-specific receptors of B and T cells (Kurtz, 2004). The innate cells are
traditionally viewed as genetically inherited and static cells that were believed to exist
only to detect the insult or invading pathogen and try to restrain or eliminate without
generating memory. Innate cells were only required to keep fighting for a short period
of time until the adaptive immune system took over and cleared the pathogen and
developed long-term protection (Irving et al., 2004). Long-term innate memory was
considered inexistent and the short existing memory lacking specificity, memory was
considered to be present only in vertebrates lower organisms did not have adaptive
immune cells (Kurtz, 2005).
8
1.3.3 Innate immunological memory
The innate immune response is the host’s primary line of defence, using germ-line
encoded receptors, but the response is non-specific and short lived (Vaz & Pordeus,
2005) compared to the adaptive immune response which uses antigen specific
receptors, takes longer to be activated but lasts longer with specificity and generates
memory against the encountered pathogen (De Grove et al., 2016) enabling these
cells to mount a more efficient response against a previous encountered pathogen.
Sensitisation of animals with an antigen prior to infection has shown to produce a
more effective immune response and also to last for a much longer period than those
not prior exposed to an antigen, a process that is called immunological memory
(Kurtz, 2004). Immunological memory has also in the past always being attributed to
the T and B cells of the adaptive system (Quintin et al., 2012) but a study of
hypersensitivity has found that the NK cells which are part of the innate immune
system and of the ILC1 group have shown that as in the case of the T and B cells,
they are also able to recall information on a previously encountered invading pathogen
(Cooper & Yokoyama, 2010). Specificity within the innate lymphoid cells was first
observed on Natural killer cells (NK) in the year 1985 in a study where mice deficient
on NK cells could not reject allogenic bone marrow grafts (Dennert, 1985).
1.3.4 Trained immunity
Trained immunity is understood as the ability of the innate immune system to enhance
and acquire characteristics of the adaptive immune system following exposure to
certain pathogens or PAMPs (Levy & Wynn, 2014). This type of protection that can
be achieved by prior sensitisation with a pathogen to obtain augmented protection
during the re-exposure (van der Meer et al., 2015). This amelioration is, however,
non-specific as improved responses against different pathogens are also observed
(Boraschi & Italiani, 2018).
Within the immune system, the innate immune response was always considered as
being inferior to the adaptive due to its lack of specificity and inability to mount
memory. But long lasting immune responses were observed in organisms lacking the
adaptive immune system such as plants and mice after appropriated stimulation
(Quintin, Cheng, van der Meer, & Netea, 2014) and it has specificity because each

9
stimulus will only offer protection to a particular number of pathogens. The same
enhanced responses have also been reported in vertebrates and in humans (Kurtz,
2004). Previous studies have shown that the administration of BCG vaccine also
offered protection against other infections to which it was not intended for such as:
Staphylococcus aureus, Candida albicans, or bacteria lipopolysaccharide (LPS) and
they concluded that it was due to the action of an enhanced production of cytokines
like interferon-γ from the population of T lymphocytes specific for BCG (Levy & Netea,
2014).
The processes in which the protections directed to target a particular infection or
pathogen is also able to selectively confer protection against a different range of
pathogens or disease was termed ‘trained’ (innate) immunity (Levy & Wynn, 2014).
Lately, it has been demonstrated that these trained cells undergo epigenetic
modifications, allowing their enhanced response on re-exposure (Berghof et al.,
2013).
1.3.5 Cells of the innate immunity
1.3.5.1 Monocytes and macrophages
Monocytes are non-granular large mononuclear cells from bone marrow. These cells
account for almost 5% to 7% of the circulating leukocytes in peripheral blood (Chaplin,
2010). Monocytes migrate to the tissues and differentiate into macrophages. Some
macrophages are tissue resident cells constantly sampling their surrounding
environment in order to detect anything non-constative in the surrounding location
(Gardiner & Mills, 2016). Whilst in their resting state, macrophages are not efficient
antigen presenting cells (Gordon & Plüddemann, 2017). The macrophages
phagocytic activity is increased by stimulus received through their receptors from
damaged or infected tissue, and there is an upregulation in MHC expression and
antigen activity (Gordon & Plüddemann, 2017). However, if macrophages are directly
activated by a pathogen, macrophages become professional killers as the ability to
phagocyte is increased (Nicola & Casadevall, 2012).
10
1.3.5.2 Dendritic cells (DCs)
Dendritic cells are phagocytic cells with an important role in the development of the
immune response, since these cells as professional antigen presenting cell act as
mediators between the innate and the adaptive immune system (Geissmann et al.,
2010). Upon activation DCs become less phagocytic, but have an increased antigen
presenting capacity (Gordon, 2004). This action helps to detain, process and present
to naïve T cells. This antigen presentation results in the maturation of the naïve T cell
(Jaigirdar & MacLeod, 2015). They are found throughout the body especially at the
entry points for microorganisms such as the skin, lung and gastrointestinal tract (Gray
et al., 2017). Like the macrophages, DCs are also capable of phagocytic activity
(Gordon, 2016).
1.3.5.3 Neutrophils
Neutrophils are part of the polymorphonuclear (PMN) leucocytes which also includes
the basophils, mast cells and eosinophils also called polymorphonuclear (PMN) cells.
They are granulocytes that originate from the bone marrow and are the most abundant
innate immune cell circulating in the peripheral blood, making up to approximately
50% to 70% of the circulating leukocytes (Liew & Kubes, 2019). They are the first cells
to be recruited to the site of infection and have a short half-life of approximately 8
hours (Kolaczkowska & Kubes, 2013) with more than 100 billion neutrophils entering
the circulation every day. They are not generally regarded as antigen presenting cells,
but there is some evidence that they may have this capacity (Vono et al., 2017).
Neutrophils are very powerful killers, and are much better at phagocytosis than
macrophages (Gupta et al., 2018). Upon bacterial invasion, neutrophils are rapidly
recruited to the infected site where they phagocytose the bacteria (Cooper et al.,
2013).
The vast majority of neutrophils are found in the bone marrow as a reserve and a
small number circulating in the blood stream (Liew & Kubes, 2019). When an
inflammatory response is initiated by the immune system, the resulting release of
soluble molecules, or chemotactic signals, cause the neutrophils to start their
migration to the site of infection by adhering to the vascular endothelial cell wall due
to increased concentration of chemokines in a process called chemotaxis (De Oliveira
et al., 2016). They then migrate to tissues to activate more macrophages for the
release of pro-inflammatory cytokines such as IL-1, IL-6, IL-8, TNF-α and C5a (Jones

11
et al., 2016). This in turn results in increased vascular permeability, facilitating cells to
exit the blood vessels and to enter the site of inflammation, and secrete antimicrobial
substances such as lactoferrin, defensins, and cathepsin (Cooper et al., 2013). TNF-
α will help the blood to clot in order to avoid the spread of the infection (Page et al,
2018). The receptors involved in the process are the main receptors found in
pathogens such as bacteria and of the complement system. The complement
opsonises the pathogens to be ingested by neutrophils (De Oliveira et al., 2016).
Inside the neutrophil’s phagosome, reactive oxygen species are produced, and
granules of proteases are released to help in the pathogen’s killing (Kubes, 2018).
1.3.5.4 Basophils and mast cells
Basophils and mast cells contain low pH cytoplasmic granules packed with a
substance known as histamine (St. John & Abraham, 2013). Basophils constitute
about 1% of innate immune circulating cells in the peripheral blood. Whilst the tissue
resident are known as mast cells and they play an important role in controlling allergic
reactions as histamine induces smooth muscle contraction (St. John & Abraham,
2013).
Masts cells are immunoregulators and proinflammatory cells usually found on urinary
and gastrointestinal tract. These cells become activated with the binding of its receptor
to immunoglobulin IgE, the next step is the release of granules such as histamine to
increase vascular permeability (Amin, 2012). Mast cells develop in bone marrow when
maturation is affected by stem cell factor binding to the receptor c-kit and by other
cytokines such as interleukin (IL)-3, IL-4, IL-9, and IL-10. The differentiation and
proliferation of human and mouse mast cells is promoted by the aforementioned
cytokines (Amin, 2012).
The role of mast cells in the immune response is of surveillance, when they sense a
pathogen via their cell surface receptors PRR (Amin, 2012). These cells can produce
IFN-γ to mediate killing of viruses and can recruit neutrophil to fight bacterial invasion.
Organelles are contained in the cytoplasm of the mast cells (St. John & Abraham,
2013).

12
1.3.5.5 Eosinophils
Eosinophils are granular innate lymphoid cells involved in clearing parasites. They are
bilobed granulocytes with cytoplasmic granules that contain basic proteins. Although
they comprise 0% to 5% of the peripheral blood leukocytes, eosinophils are active
participants in innate and adaptive immune responses to parasitic infection (Gordon,
2016).
1.3.5.6 Macrophages
Macrophages are phagocytic cells that express a wide range of pattern recognition
receptors involved in pathogen recognition, phagocytosis and in cytokine production
(Geissmann et al., 2010). They originate from the bone marrow and are found in
different type of tissue throughout the body (Wynn et al., 2013), where they function
as bystanders that will detect invading pathogens at the entry point, phagocyte them
and present to T cells, circulating macrophages will migrate to the affected site to
contain the damage and for tissue repair (Gordon & Martinez, 2010; Wynn et al.,
2013).
1.4 Potential for innate lymphoid cells memory
Among the different subsets of innate lymphoid cells, the member of group ILC1
known as NK cells has shown memory to viral infection (Cerwenka & Lanier, 2016).
These finding open new doors for the basis of immune memory, the need to
understand what biological cells and receptors are required for the generation of an
immunological memory since only just a few years ago memory was associate to
features found only in cells of the adaptive immune system. These features include
the ability to specifically recognise an antigen and it was once thought that only these
two cells alone were enough for the generation of immunological memory but in fact,
T and B cells require the participation of cells from the innate immune arm of the
immune system to be able to generate memory (Hamon & Quintin, 2016). Further
researches in the immunological response led to the discovery that macrophages are
also capable of providing an immunological response (Chan et al., 2018) and later NK
cells were also found to generate memory response against viruses (Cerwenka &
Lanier, 2016). The major difference between NK cells and the other member of group
1 ILC as well as from the other ILC groups it’s the NK cytotoxic activity (Simoni &

13
Newell, 2018b) and since all ILC subsets emerge from the same common progenitor
it seems sensible to question whether the other subsets can also maintain an
immunological memory from a previous encountered pathogen.
1.4.1 Innate lymphoid cells memory
The ILC1 NK cells were the first subset of the innate cells to be studied for
immunological memory on skin graft (Wang et al., 2018), later NK memory could be
found in the liver of mice lacking the adaptive T and B cells but not in mice without the
innate cells (Keppel et al., 2013). NK memory could only be observed in liver and
later it was discovered that this was due to the fact that this memory property was
associated with CD49a receptor that can only be found only on liver resident NK cells
(Peng et al., 2013). This evidence was further corroborated by an adoptive transfer
experiment in which transferred memory NK cells were able to provide immunological
memory to naïve mice lacking T, B and NK cells (Moritz et al, 2018). The NK cell
memory is activated by both specific antigen and cytokines IL-12, IL-15 and IL-18 to
produce IFN-γ (Cooper et al., 2009), the generated cytokine induced memory can last
up to 12 weeks (Keppel et al., 2013).
Innate lymphoid cells are specialised in first line of defence due to their location at
epithelial surfaces as tissue resident cells where they act as sentinels and maintain
tissue homeostasis and protection during an inflammatory process through the
production of type I, II and III cytokines after activated by changes of cytokines in the
vicinity. Once activated ILCs deal with host’s invasion by viruses, bacteria and
parasites through the production of cytokines as in the case of the adaptive T cells,
but due to the lack of antigen rearranged receptors and the fact that these are innate
cells known to able to recognise only pattern-recognition receptors, all innate cells
and ILCs are considered the innate counterpart of T cells (Vivier et al., 2018a).
Another experiment in which ILC1s, more specifically the NK cells resemble T cells is
the generation of specific immunological memory, in an experiment conducted in
humans and mice in which a subset of NK cells became activated and proliferated to
generate an immunological memory response against mice cytomegalovirus (MCMV)
infection and the NK memory cells could still be found years after the infection (Lopez-
Vergès et al., 2011) in rhesus macaque (Wang et al., 2018) and later on diverse
studies with Simian-Human Immunodeficiency (Wang et al., 2019) Virus and Simian
Immunodeficiency Virus (Nishijima et al., 2016) and on human cytomegalovirus
(HCMV) infection through cytokine-induced NK cell memory (Keppel et al., 2013).

14
In 2016 more research was carried out, this time on ILC2 subset by nasal
administration of the allergen papain to normal and to ILC2 deficient mice to activate
lung ILC2 cells. In normal mice the allergen induced ILC2 cells to proliferate and the
activated cells started producing IL-5 and IL-13 cytokines whereas the ILC2 deficient
mice failed to significantly produce the type II cytokines when injected with papain a
month later but were able to significantly increase cytokine production through
transfer of allergen experienced ILC2 cells. ILC2 from naïve and RAG2 mice produced
significantly lower amount of cytokines when challenged for the second time and the
expansion phase was then followed by a contraction phase where the production of
cytokines returned to baseline level although the number of ILC2 was still high
(Martinez-Gonzalez et al., 2016a).
The memory properties of NK cells and ILC2 have been described in the cited studies,
ILC3 memory properties are yet to be discovered (Martinez-Gonzalez et al., 2016a).
The immune system is arbitrarily divided into the innate and adaptive arms. Innate
immunity has also been described as the primitive type of response (Peterson & Kaur,
2018). It engages with microorganisms such as bacteria through the interaction of a
range of receptors, known collectively as pattern recognition receptors (PRR), with
microbial structures also known as pathogen associated molecular patterns (PAMPs)
or with structures released from the host’s damaged tissue, called damage associated
molecular patterns (DAMPs) (Akira et al., 2006c). But the innate response does not
always provide complete protection, as some pathogens are sophisticated enough to
escape under the radar of the innate cells and receptors, thus the intervention of the
highly specific adaptive immune system facilitates successful resolution of infection
(Warner & Ohashi, 2019).
Treatment options in which the host’s immune system is manipulated to boost its
ability to prevent the pathogen from gaining entrance and/or propagation are an
interesting alternative to traditional antibiotic approaches (Luo et al., 2017). As a result
of findings showing that to gain access to the host’s immune system the pathogen
must first downregulate the host’s immune cells, finding ways to boost those immune
cells or other components of the innate immune system, in order to become less
susceptible to bacteria is an interesting proposition (Angeletti et al., 2018).

15
1.4.2 Natural killer cell memory
Within the group of ILC cells, NK cells were the first to be shown to induce a memory
response following infection. In one study using NK cells from lymphoid organs, it was
proven that the priming of NK cells with viral infection enhances the protection against
subsequent infection with the same virus as these previous antigen experienced cells
can readily produce cytokines to fight the infection (Kleinnijenhuis et al., 2014).
A recent research (Martinez-Gonzalez et al, 2017) have identified a set on innate
immune cells that are able to produce immunological memory, the NK cells, these
cells can kill virus infected cells, tumour cells and cells that are missing self-
components such as in the case of apoptotic cells (Peng & Tian, 2017). Since mice
from both groups were deficient in cells of the adaptive immune system but none of
the groups had mice that were deficient in natural killer cells, that has also been
reported to have immunological memory function, the observed response could only
be partially attributed to ILCs and therefore the observed response can be a mutual
response of the innate lymphoid cells and the natural killer cells. Both ILCs and natural
killer cells have some common features such as they are both innate immune cells
they are capable of producing IFN-γ and share activation cytokines (Martinez-
Gonzalez et al., 2017).
NK cells are involved in regulation of immune responses by producing cytokines and
chemokines such as CC-chemokine ligand 5 (CCL5), XC-chemokine ligand 1 (XCL1)
and the XCL2. The NK cell memory is formed in different stages which starts with the
first encounter of naïve NK cells with the invading pathogen, during this period the NK
cells will expand and become effector cells; after the resolution of the infection, some
of the NK cells that were involved in elimination of the pathogen will die by apoptosis
(Abel et al., 2018). The remaining cells will retain a memory of the already
encountered pathogen, forming a pool of NK memory cells (Sun et al., 2011). If during
their life spam they come across the same pathogen, these cells will provide a robust
immune response, that is much quicker and effective than the first immune response
(O’Sullivan et al., 2015).

16
1.5 The Innate immune system
Everyday our body encounters foreign or infectious agents to which it has to respond
for either protection or to make physiological adjustments, by recognising that
something new or unusual and detrimental is happening to the body, this recognition
will activate series of events that will culminate with the neutralisation or destruction
of the encountered threat or containment of the invading pathogen (Hamon & Quintin,
2016). The immune system is divided into the innate and adaptive arms (Montalban-
Arques et al., 2018). Innate immunity has also been described as the primeval type
of response from non-vertebrates and vertebrates organisms, cells of the innate
immune system engage with microorganisms such as bacteria through the
engagement of its cellular receptors as for example the engagement of pattern
recognition receptors with microbial structures also known as pathogen associated
molecular pattern or with structures released from the host’s damaged tissue (Turvey
& Broide, 2010). But the innate response is not effective in providing an complete
immune response as some pathogens are sophisticated enough to escape under the
radar of the innate cells and receptors (Balcewicz-Sablinska et al., 1998), thus the
intervention of the highly specific adaptive immune system is required for a successful
outcome (Turvey & Broide, 2010).
In both humans and animals, when the physical barrier is breached the first
resistance they will encounter are the cells of the innate immune system (Turvey &
Broide, 2010). The innate immune system is also responsible for maintaining a
healthy environment within the tissues and cell surfaces by detecting, repairing and/or
eliminating damaged tissues or dead cells (Annunziato et al., 2015).
The first barrier encountered by the microorganism is the physical one, our skin, which
is made of two layers, the dermis and epidermis is composed of tightly packed
epithelial cells, connective tissue, blood vessels, macrophages and dendritic cells or
mucosa, which is also made of tightly packed epithelial cells. These surfaces are
coated with additional antimicrobial defence, when the organism pathogen associated
molecular patterns are detected by the cells of the skin or mucosa, it triggers
increased secretion of compounds IL-33, IL-25 and TSLP (Jin et al., 2013).
Intact skin is a very powerful defence tool against pathogens, together with the
mucosal barrier that is the lining of the inner surfaces of the body, including many of
the site of entry for pathogens (Marshall et al., 2018). Additionally, the mouth and
nostrils are covered with saliva and nasal fluids respectively, epithelial cells and
commensal bacteria capable of destroying microbes (Klose & Artis, 2016). If none of

17
these barriers are capable of stopping the invading microorganism, cells of the
immune system will be activated (Turvey & Broide, 2010).
The first step after encountering something that does not belong to the organism (non-
self) is to attract immune cells to the affected sites through the production of cytokines
(Newton & Dixit, 2012). Cytokines are small protein molecules that mediate cell-cell
interaction and are produced by the immune system to play a role in the defence
mechanism process (Iwasaki & Medzhitov, 2015). If the innate immune system fails
to efficiently eliminate the foreign microorganism, it will culminate with the activation
of the adaptive immune system through the action of the antigen presenting cells,
including the macrophages and dendritic cells (Boraschi & Italiani, 2018).
The mechanism of defence that requires the antigen specific T lymphocytes and the
production of antibody comes second to the innate or primary immune response.
Innate recognition is mediated by protein structures known as pathogen recognition
receptors that recognise structural repeats found in the microbes but are absent in
the host (Akira et al., 2006a). The DCs engage with the pathogen and activates the
production of cytokines also helps in the immune response as antigen presenting
cells. The majority of the cells that constitute the innate system such as the
macrophages and neutrophils, which eradicate foreign bodies such as bacteria (Akira
et al., 2006a). Another major component of that system is the complement pathways
or humoral immune response, divided in three distinct pathways activated to directly
destroy the invading microorganism or to opsonise it for phagocytosis (Daha, 2011).
The two complementary systems within the immune system are best distinguished by
the time they take to become active (Table 1.2). The innate becomes active within a
short period of time, that system (phagocyte mediated) is available during the first
days of infection (Levy & Netea, 2014). Whereas the adaptive takes a lot longer to
become active, up to two weeks to mount an effective immune response (Marshall et
al., 2018).
1.6 The physical barriers
1.6.1 Skin
The skin protects the internal part of the body from external environmental changes;
external pollutants such as dust; and from pathogens trying to gain entry to the host.
As well as being physical barrier, it is also able to produce antimicrobial peptides such

18
as lactic acid, fatty acids, defensins, cathelicidin (LL-37) and lysosomes from sweat
to restrain microbial growth. The defence of the skin is further bolstered by
constituents of the skin microbiome (Turvey & Broide, 2010). Commensal bacteria
produce substances that will restring attachment and penetration of pathogen, either
directly or by sending signals to other cells such to as neutrophils and macrophages
to migrate to the affected area and help eliminate the invading pathogen by
phagocytosis (Turvey & Broide, 2010).
1.6.2 Respiratory tract
To protect the mucosal surfaces of the lungs from inhaled microorganisms and other
environmental products, the lining of the respiratory epithelium contain epithelial cells
that will produce molecules such as defensins that will opsonise microorganisms to
be phagocyted by macrophages and neutrophils (Lambert & Culley, 2017).
1.6.3 Gastrointestinal tract
The lining of the gastrointestinal tract protects against invading pathogens using
mucus secreted by the cells in the upper gastrointestinal tract to block and trap
pathogens, the cilia which are cellular projections that help to remove trapped bacteria
and foreign bodies, sweeping them up to be destroyed within the acidic pH of the
stomach (Warrington et al., 2011). Some epithelial cells secrete microbial molecules
such as α-defensins and cathelicidin that help to destroy many potential pathogens
(Montalban-Arques et al., 2018).
1.6.4 Lacrimal secretions
Tears are produced by the lacrimal glands in the eye and contain the enzyme
lysozyme that is able to destroy pathogens trying to gain access to inside the host
through the eye (Gordon, 2016).

19
1.7 Lymphocytes
The goal of an immune response is to efficiently destroy anything that poses a threat
to the integrity of the organism such as foreign antigens, independent of the nature of
the foreign body that could be internal or coming from outside the body. The immune
response is coordinated with accuracy to make sure that the necessary component
will get to the local of injury and neutralise the invading pathogens, for the cells of the
immune systems to reach the designate site many obstacles have to be overcome.
Obstacles such as the infiltration of the circulating cells trough the endothelial cells
from the blood and the coordinates are given by the chemokines that will direct the
immune required cells to the local where they are required for pathogen elimination
and tissue homeostasis (Daha, 2011).
Thus, our immune system is made of cells and molecules that act as an army to
protect us against microbial, mechanical and physical injury. Firstly, they recognise
the traumatic event as something that is not part of the normal environment or not
self, and then they set up a series of events that will culminate with the elimination of
the threat.
The immune system is also made of a number of organs and lymphoid tissues, which
act as centre for formation, maturation and differentiation of lymphocytes such as the
bone marrow, thymus, lymph nodes and spleen (Chaplin, 2010). The bone marrow
and the thymus are primary lymphoid organs, whilst the spleen and lymph nodes are
secondary lymphoid organs (Bar-Ephraïm & Mebius, 2016). Lymphocytes originate in
the bone marrow from a precursor stem cell and develop into two distinct lymphocyte
populations the myeloid and lymphocytes (Klose et al., 2014b). One precursor cell will
migrate to mature in the thymus and develop into T cells (Koch & Radtke, 2011).
An alternative precursor lineage will continue their differentiation process in the bone
marrow from where they leave as mature B cells (McHeyzer-William et al., 2012). All
mature lymphocytes leave the primary lymphoid organs to circulate throughout the
body (Melchers, 2015). The cells arising from the bone marrow includes the myeloid
cells which consists of granulocytes (basophils, mast cells, neutrophils and
eosinophils) and dendritic cells, monocytes and macrophages; the lymphocytes
encompassing T cells, B cells and innate lymphoid cells (ILCs) (Geissmann et al.,
2010).
The B cells have specific antigen receptors, these receptors are immunoglobulins
attached to the surface of the cell and are called B cell receptors (BCR)

20
(Schweighoffer & Tybulewicz, 2018). These cells are involved in the presentation of
antigen involved in activating T cells and in the production of pro-inflammatory
cytokines (Häusser-Kinzel & Weber, 2019). After the binding of the antigen to BCR
the B cells become activated and proliferate, some will mature into plasma cells and
start to produce antibodies that are specific to the antigen, others become memory B
cells (Schweighoffer & Tybulewicz, 2018).
T cells have specific receptors on their surfaces, called T-cell receptors (TCR) which
binds to specific antigens displayed in the surface of an antigen presenting cell (APC)
(Turvey & Broide, 2010). Their role is not to destroy or kill the foreign pathogen but to
direct the process so that other cells can perform the task (Min-oo e al., 2014). The
ILCs, are the most recently identified members of the lymphocyte family, they lack the
common lineage markers, the different subsets of share some surface markers but
they differ in the expression of transcription factor (Artis & Spits, 2015). These innate
cells have been demonstrated to play a role in the immune response against viral and
bacterial infection, cancer, and parasitic infections (Chan et al., 2019; Gieseck et al.,
2018). Thus, lymphocytes are divided into innate lymphocytes where the ILCs are and
the adaptive lymphocytes which includes the T and B cells.
1.8 Innate Lymphoid Cells (ILCs)
Innate lymphoid cells are a newly discovered family of heterogeneous innate cells
they display lymphoid morphology but lack the markers commonly associated with
other lymphoid cells (Simoni & Newell, 2018b).
The innate lymphoid cells are cells of the innate immune system, of lymphoid origin
that display effector functions such as cytokine production upon activation, and share
a lot of similarities with the T helper (Th) cells such as the cytokine profile and
transcription factors required for development (Seillet et al., 2014a). They however,
unlike T and B cells ILCs do not express antigen specific receptors and so they are
incapable of interacting directly with invading pathogens to mediate the inflammatory
response. Communication between ILCs and the other cells is made via ILCs
producing cytokines that will activate and or modulate the activity of other cells of the
immune system (Tait Wojno & Artis, 2016).
Through the action of these cytokines, antigen presenting cells, DC and macrophages
are recruited for activation of the adaptive immune system. Among the recruiting cells

21
present at the site of infection to amplify the immune response are the ILCs with his
army of NK cells, to eliminate viral and stressed cells, and the other ILC subsets
(Flores-Borja et al., 2016).
Despite the fact that ILCs lack the hallmarks of other cells from adaptive immune
system as well as the markers of the innate immune cells they respond to insult or
injury by producing cytokines, ILCs are rare population frequently found at mucosal
surfaces but also found in other parts of the body such as spleen, liver and blood
(Simoni & Newell, 2018a) and intestine (Diefenbach et al., 2017a). The ILC cells lack
the receptors found on T and B cells, they are involved not only in the protective
immune response but are also involved in the repairing of damages caused to the
affected tissues during the inflammatory process (Bergstrom et al., 2012).
ILCs develop from common lymphoid progenitors, in the foetal liver during the early
stages of life and later in the bone marrow during the adult life, are present in a much
lower number compared to the other cells of the immune system and are
predominantly found on lymphoid and non-lymphoid tissues, in large number at the
body’s barrier site such as the mucosa, skin and gut (Withers, 2016). All ILC subsets
arise from a common lymphoid progenitor (CLP) the same from which the adaptive
lymphoid cells also originate (figure 1.2).
The first step in their development is the formation of the common innate lymphoid
precursor (CILPs) (Artis & Spits, 2015). Later, the CILPs loses the ability to produce
T or B lymphocytes but give rises to ILCs through the upregulation of the Id2 (Kotas
& Locksley, 2018)
ILCs have lymphoid cell morphology but do no express the cell surface markers that
are associated with T cells and B cells such as the recombination activating gene
(RAG)-dependent rearranged antigen receptors, myeloid cells and granulocytes
phenotypic markers (Yazdani et al, 2015a). Thus, they are called cell lineage marker
negative (Lin⁻) cells (Bar-Ephraïm & Mebius, 2016). They do, however, express the
common gamma chain (γc) CD132, IL-7Rα (CD127), IL-2Rα (CD25) and Thy1 (CD90
) marker (Artis & Spits, 2015).
The ILCs function via cytokine activation and cytokine release to fight the invading
pathogen (Table 1.1). The ILC1 group produce both IFN-γ, by NK cells and TNF-α by
the ILC1. The ILC2s produce cytokines involved in clearing parasitic infections by the
actions of IL-5 that activates eosinophils, the IL-13 that causes muscle contraction to
expulse the parasite and recruit macrophages; this subset also produces IL-4 and IL-
22
9. The ILC3s produce IL-17 to recruit neutrophils and IL-22 for tissue repair and
homeostasis (Figure 1.2) (Xu et al., 2012). There is another group of cytokines called
chemokines with a particular function of attracting cells, they exert their function on
the local in which they are produced and moving towards the affected site in order to
attract the required immune cells to the particular site (Soriani et al., 2018). They are
classified into inflammatory chemokines (CXC) and homeostatic chemokine (CC)
their action absolutely depends on the engagement with the specific cytokine
receptors.
Due to their location at surface barriers ILCs are considered as sentinel cells that once
activated will start producing an array of cytokines that will act directly on the stressing
factor, on other cells to activate them to produce more cytokines and chemokines that
will recruit more defence cells, that will act on cells of the adaptive immune system
and some will even act on the ILCs to continuously stimulate them into producing
more cytokines. One of the effects of these cytokines is the recruitment of one of the
most abundant circulating phagocytic cells such as neutrophils to the affected site
(Rada, 2017).
The innate lymphoid cells are activated by cytokines to produce cytokines (Elemam,
Hannawi, & Maghazachi, 2017a). The pro-inflammatory cytokine profile of innate
lymphoid cells includes the IFN-γ, IL-17A and the IL-22 as the primary responder cells
during infection (Gladiator et al., 2013). These cytokines are usually produced upon
activation to help clearing an ongoing inflammatory or infectious process.
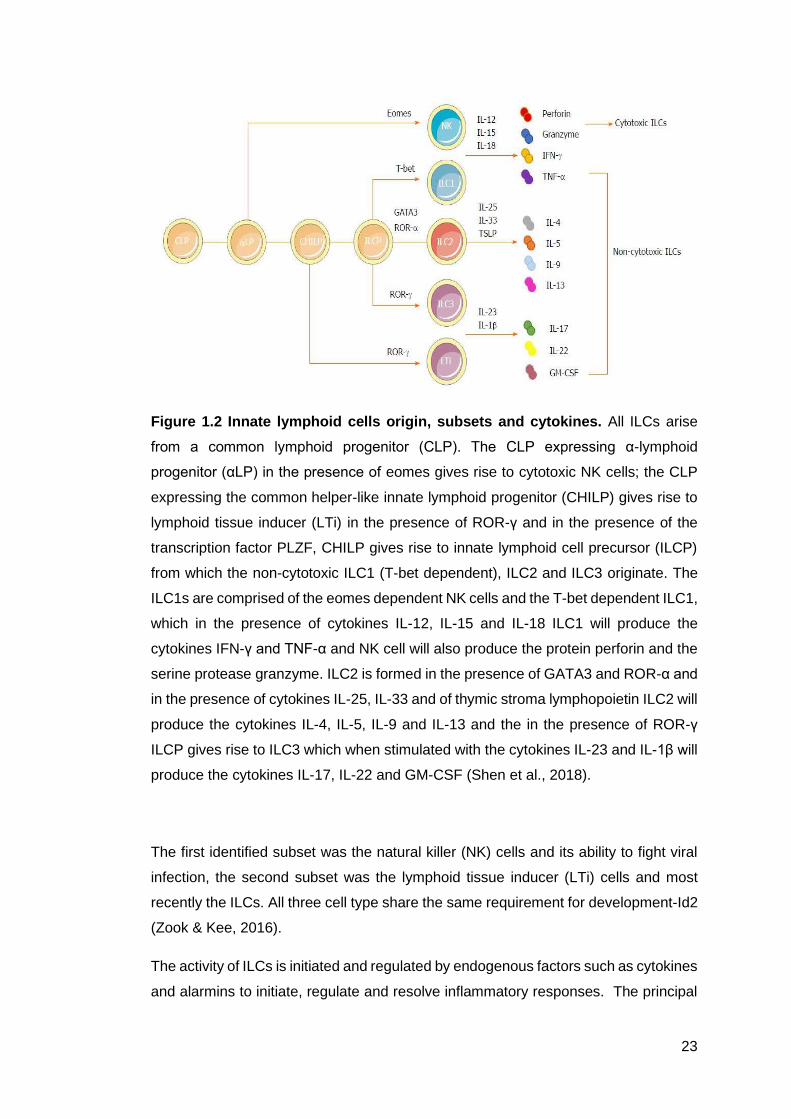
23
Figure 1.2 Innate lymphoid cells origin, subsets and cytokines. All ILCs arise
from a common lymphoid progenitor (CLP). The CLP expressing α-lymphoid
progenitor (αLP) in the presence of eomes gives rise to cytotoxic NK cells; the CLP
expressing the common helper-like innate lymphoid progenitor (CHILP) gives rise to
lymphoid tissue inducer (LTi) in the presence of ROR-γ and in the presence of the
transcription factor PLZF, CHILP gives rise to innate lymphoid cell precursor (ILCP)
from which the non-cytotoxic ILC1 (T-bet dependent), ILC2 and ILC3 originate. The
ILC1s are comprised of the eomes dependent NK cells and the T-bet dependent ILC1,
which in the presence of cytokines IL-12, IL-15 and IL-18 ILC1 will produce the
cytokines IFN-γ and TNF-α and NK cell will also produce the protein perforin and the
serine protease granzyme. ILC2 is formed in the presence of GATA3 and ROR-α and
in the presence of cytokines IL-25, IL-33 and of thymic stroma lymphopoietin ILC2 will
produce the cytokines IL-4, IL-5, IL-9 and IL-13 and the in the presence of ROR-γ
ILCP gives rise to ILC3 which when stimulated with the cytokines IL-23 and IL-1β will
produce the cytokines IL-17, IL-22 and GM-CSF (Shen et al., 2018).
The first identified subset was the natural killer (NK) cells and its ability to fight viral
infection, the second subset was the lymphoid tissue inducer (LTi) cells and most
recently the ILCs. All three cell type share the same requirement for development-Id2
(Zook & Kee, 2016).
The activity of ILCs is initiated and regulated by endogenous factors such as cytokines
and alarmins to initiate, regulate and resolve inflammatory responses. The principal

24
function of ILC is the production of specific cytokines in response to internal or
external signals (Elemam et al., 2017b). When the receptor on the surface of ILC
recognises its cognate cytokine it triggers transmembrane signals that will cause
activation of ILCs (Elemam et al., 2017b). Study of ILCs carried out mainly in mouse
models but also in humans are growing fast and with this new roles and involvement
of ILCs in inflammatory and autoimmune disease are being discovered in a variety of
organs such as gut, lung, spleen, liver, peritoneal cavity and epithelial (Weizman et
al., 2017).
The ILC1 group also includes the NK cells which respond to stimuli by producing type
1 cytokine such as interferon gamma (IFN-γ). ILC2 also known as innate helper type-
2 cell, nuocytes and natural helper cells (Seillet & Belz, 2016), have been identified in
spleen, lung, lymph node and liver; produce type 2 cytokines, IL-4, IL-5, IL-9 and IL-
13 triggered by IL-25 and IL-33. ILC3 produce IL-17 and IL-22, express RORyt, can
be found in spleen, intestine, mucosal tissue, lymph nodes and payer’s patches (Lim
et al., 2017a). Three groups of ILCs have been defined based on their transcription
factors, surface markers and effectors cytokines which share similarities with the T
helper (Th) subsets (Diefenbach et al., 2017). The three subsets are distinguished
from the other innate lymphoid cells for the lack of expression of the lineage markers
characteristic of the T and B lymphocytes, neutrophils, macrophages, monocytes and
dendritic cells and the lack of recombination activating gene (Rag) (X. Wang et al.,
2019).
During their role of immunity, inflammation, tissue repair and homeostasis, ILCs
communicate with other hematopoietic and non-hematopoietic cells through their
cytokine profile providing a response tailored to a specific disease or diseases (Table
1.1). The protective response of ILC2s regulates the process that leads to the
activation of granulocytes and macrophages (Elemam et al., 2017c). ILC3s contribute
to elimination of extracellular bacteria and fungi with help of dendritic cells and T
regulatory cells (Elemam et al., 2017a).

25
1.8.1. Group 1 ILCs
1.8.1.1. Natural killer cells
In 1975 a subset of non-T/B lymphoid cells now called natural killer (NK) cells was
discovered, cells that are able to kill tumour cells, few decades later it was found that
these NK, now called innate lymphoid cells, are capable of mounting an immunologic
memory response against tumour and viral infection (O’Sullivan et al., 2015). At the
time, it was the only known innate lymphoid cell, and remained that way for a long
time until the discovery of the lymphoid tissue inducer cells (LTi) and later the T-helper
cells were also added to the innate lymphoid cells group. The NK cells are now part
of Group 1 innate lymphoid cells (ILC1) (Eberl et al., 2015) became the first ILC cells
subset to be studied.
Contrasting with the B and T lymphocytes, that have receptors capable of recognising
a large number of unknown antigens by rearrangement, only a small number of NK
cell receptors can recognise and become activated by a foreign or damaged self
structure (Jessica Sharrock, 1998). However, they do not have a lag period of
response and are able to undergo immediate proliferation and differentiation in order
to provide the protective immune responses. The NK cell release the lytic proteins
perforin and granzymes to destroy the cells that are emitting signs of distress (Allan
et al., 2015).
The protective activity of the NK cells is aided by IFN-α released during the initial
stages of the viral infection (Abena et al., 2019). Moreover, the activated NK cells not
only produce the cytolytic granules, but they also produce two of the pro-inflammatory
cytokines, TNF-α and IFN-γ that will activate macrophage (Lim et al., 2017a).
NK cells recognise the antigen via the large number of receptors on their surface with
high specificity for a variety of cell surface ligands that function as indicators of
infection, cancer or stress such as the absence of MHC class I in mice or HLA in
humans that is usually expressed by healthy cells (Di Vito et al., 2019).

26
1.8.1.2 ILC1
ILC1s and NK cells are subsets of ILC that express the transcription factor T-bet and
produce interferon-γ (IFN-γ) (Ivanova et al., 2019).
ILC1s are mainly found in the peritoneal cavity, spleen, intestine and liver (Cortez et
al., 2015) liver, intestines, uterine tissues, lung, tonsils, spleen and blood (Eken et al.,
2017). These cells respond to IL-12 and share the same cytokine profile as the Th1
cells in the expression of T-bet and production of interferon IFN-γ and tumour necrosis
factor (TNF) (Figure 1.3). Group ILC1 is involved in protection against viruses, tumour
cells and intracellular bacteria. The ILC1 subsets are distinguishable from NK cells by
the expression of the transcription factor eomes (van de Pavert & Vivier, 2016).
Although recent reports suggest that conventional NK (cNK) cells represent a distinct
lineage, all ILC1 cells express the transcription factor T-box 21 and require interleukin
IL-15 to develop (Figure 1.3) (Cortez et al., 2015).
Figure 1.3 Classification of ILC1 on the basis of the transcription factors they
require for normal development, function and cytokine profile. In the presence
of the transcription factors T-bet and eomes, and of the cytokine IL-12 the precursor
Id2 gives rise to NK cell, and the NK cell will produce the cytokines IFN-γ and TNFα
involved in the clearance of viruses and destruction of tumours; but in presence of T-
bet only the ILC1subset is formed which under the influence of the same cytokines
will be involved in fighting against intracellular bacteria and protozoa (Elemam et al
2017).

27
1.8.2 Group 2 ILCs
ILC2s, which have also been described as innate helper type-2 cell, nuocytes and
natural helper cells, have been identified in adipose tissue, spleen, lung, intestine,
lymph node, liver and blood (Allan et al., 2015). They act promoting immunity to
helminth parasites and viruses. They are a critical early source of IL-4, IL-5 and IL-13
(Figure 1.4) (van de Pavert & Vivier, 2016) and amphiregulin, triggered by the
epithelial derived cytokines IL-25 and TSLP (Meredith et al., 2015).
A common characteristic of ILC2 is their dependence on Gata-3, RORα, TCF-1 and
Notch for their development and maintenance (van de Pavert & Vivier, 2016). ILC2 is
heterogeneous and includes conventional ILC2 and the multipotent progenitor type 2
(MPPtype2) cells that retain the potential to generate macrophages, mast cells, and
basophils. Recent evidence suggests this latter population may form a distinct lineage
from ILC2 (Annunziato et al., 2015). ILC2s are found to be increased in patients with
various chronic diseases such as asthma, chronic rhino sinusitis and atopic dermatitis
(Klose & Artis, 2016).
It has been recently shown that immunological memory can be displayed by mouse
lung ILC2s upon activation. Large amounts of IL-5 and IL-13 inducing eosinophilia in
the airways were it is produced by the expanded effector ILC2 population (Martinez-
Gonzalez et al., 2018). After the expansion phase which lasted a few days, a
contraction phase started where the number of ILC2s declined and cytokine
production ceased (Martinez-Gonzalez et al., 2018).

28
Figure 1.4 Classification of ILC2 based on the transcription factors they require
for normal development, function and cytokine profile. In the presence of the
transcription factors GATA3 and RORα, and of the cytokines IL-7, IL-25 and IL-33 the
precursor Id2 gives rise to ILC2, that will produce the cytokines IL-5 and IL-13 to help
in tissue repair, amphiregulin which is involved in tolerance to allergens and metabolic
homeostasis, the cytokines IL-6 and IL-9 provide protection against helminths (Taken
from (Elemam et al 2017).
1.8.3 Group 3 ILCs
ILC3 are found in spleen, intestine, mucosal tissue, lymph nodes and payer’s patches
(Zook & Kee, 2016; Allan et al., 2015). They are a heterogeneous population of cells,
they comprise the natural cytotoxic receptors (NCR)- cells which includes the classical
lymphoid tissue inducer (LTi) cells, responsible for the generation of secondary
lymphoid tissues such as lymph nodes and Peyer’s patch during embryogenesis, and
a subset of NK cell receptor (NCR)⁺ where we find IL-1 receptor, IL-23R and IL-22
(Tugues et al., 2019). All subsets express the transcription factor RORγt (retinoic acid
receptor-related orphan receptor γ t) which regulates their function and differentiation
of ILC3 (Diefenbach et al., 2014). The subsets do differ in their expression of cell
surface markers, RORγt and in range of cytokines they produce (Cortez et al., 2015).
ILC3s respond to IL-1B, IL-6 and IL-23 and produce IL-17 and IL-22; they are
essential in the response to enteric bacteria (Figure 1.5) (Castleman et al., 2019) and
are also able to fight fungal infection (Sparber et al., 2019). Subsets of ILC3 have
been found to be upregulated in some chronic inflammatory diseases such as
rheumatoid arthritis, systemic lupus and Crohn’s disease (Yazdani et al., 2015b).

29
Figure 1.5 Classification of ILC3 based on the transcription factors they require
for normal development, function and cytokine profile. In the presence of the
transcription factors RORγt and AHR and of the cytokine IL-7 the precursor Id2 gives
rise to ILC3 and LTi. Both ILC3 and LTi will produce the cytokines IL-17 and IL-22
involved in the clearance of extracellular and enteric bacteria, tissue repair and the
formation of the secondary lymphoid organ’s lymph nodes (Elemam et al 2017).
Table 1.1 ILCs effector cytokine profile
ILC group
ILC population
Cytokines Target
1 NK cells IFN-γ, TNF, Perforin, Granzymes, GM-CSF
Tumour and viral infected cells, missing self cells.
1 ILC1 IFN-γ, TNF Intracellular pathogens, helps coordinate cytotoxicity.
2 ILC2 IL-4, IL-5, IL-9, IL-13, Areg
Helminth, enhance IgE and eosinophil production
3 LTi IL-17A, IL-22, LT-α1β2, GM-CSF
Tissue homeostasis and extracellular bacteria.
3 ILC17 NCR+ILC3
IL-17A, IL-22, IFN-γ, TNF-α, LT-α1β2, GM-CSF
Extracellular bacteria, attracts neutrophils.
3 ILC22 NCR-ILC3
IL-22, TNF-α, LT-α1β2, GM-CSF
Extracellular bacteria and homeostasis, induce chemokine.
Adapted from (Guo et al,, 2012; Morita et al., 2016)

30
1.9 Innate lymphoid cells development
As mentioned above, ILCs originate from foetal liver during the early stages of life and
later in the adult life they are produced by the bone marrow from common lymphoid
progenitors (CLP) cells which in turn differentiate and commit to a particular cell group
(Steven et al., 2016). The process that leads to the generation of ILCs is different to
that of the formation of T or B lymphocytes, it does not create antigen specific
receptors, requiring a different transcription factor; the transcriptional inhibitor of DNA
binding protein 2 (Id2) (Sciumè et al., 2017; Juelke & Romagnani, 2016), Id2 inhibits
the production of B and T cells (Diefenbach et al., 2017). Those same CLP can also
differentiate into cells of the adaptive immune system which depends on somatic
recombination for generation of antigen specific receptors, a feature that is not
required for generation of cells of the innate immune system (Figure 1.6). Although,
ILCs are relatively rare compared to cells of the adaptive immune system they can be
found at large numbers in skin, intestine, lung and spleen (Mohammadi et al., 2018).
Figure 1.6 Human and mice innate lymphoid cells development. Similar to all
lymphocytes, human and mouse ILCs originate from hematopoietic stem cell that
gives rise to a common lymphoid progenitor in mice and common lymphoid
progenitor-like HPC in human. From this point mice development trajectory continues
with the formation of αLP, EILP, CHILP and then ILCP, in human from the CLP-like

31
HPC CILCP is formed and then ILCP. ILCP in both human and mice will give rise to
all ILC subsets, with the exception of one extra subset in mice that is the lymphoid
tissue inducers (LTi) (Lim & Di Santo, 2019).
1.10 Innate lymphoid cells Plasticity
Plasticity is a process that allows mature differentiated cells to change their
phenotype, resulting in the acquisition of new function. This process makes it possible
for the immune system to change the type of tailored response without the need to
recruit a new cell population. This plasticity has been reported in ILCs in mouse as
well as in humans (Bal et al., 2020). Similar to Th cells, ILCs can also respond to the
local milieu during infection or inflammation (Bald et al, 2019) by downregulating
and/or upregulating the expression of a particular transcription factors and
consequently altering the profile of cytokine being produced (Vivier et al., 2018b).
When activated by IL-12 and IL-18 ILC3 can downregulate the expression of RORүt
and increase the expression of T-bet, start to produce IFN-γ, they also lose the
capability to produce IL-17 and IL-22, these cells have been termed ex-ILC3s
(Sonnenberg & Artis, 2015a). ILC2s are also able to upregulate T-bet and produce
IFN-γ when in the presence of IL-2, IL-7 in combination with IL-12 (Gronke et al.,
2016). Conversely, in response to IL-23 and IL-1β, ILC1 can be driven towards an
ILC3 phenotype (Lim et al., 2017a).
1.11 Innate lymphoid cells and bacterial infections
ILCs are known to have a role in tissue homeostasis and extracellular bacteria but are
also known to be involved in the immune response of intracellular bacteria through
the production and release of IFN-γ, IL-4, 5, 9, 13, 17 and 22 cytokines (Sonnenberg
& Artis, 2015b). ILC3 is important for the clearance of intracellular bacteria (Sedda
et al., 2014). The ILC3 subset is involved in immune response against the gram
negative enteric bacteria Citrobacter rodentium (C. rodentium), commonly found in
mice but also able to infect humans, causing gastrointestinal infections such as colitis
(Flores-Borja et al., 2016). ILC1 subset is also found during C. rodentium infection
and the presence of this subset may be due to the ability of ILC3 to convert into ILC1
under specific stimuli or physiologic conditions. Group 1 ILC is involved in the immune
response against gram negative bacteria such as Acinetobacter junii ( A. junnii) and
of the gram positive bacteria E.coli (Dillon et al., 2014) and of the Clostridium difficile

32
(C. difficile) infection through the production of IFN-γ (Castleman et al., 2020). The
role of ILCs in Mycobacterium tuberculosis (M. tuberculosis) infection has been
investigated and it was found out that during the early stage of tuberculosis (TB)
infection there is increase in the number of ILC3 in the site of infection that is also
accompanied with an elevated number of macrophages, blockage of IL-23 cytokine
prevented the early recruitment of ILC3 (Ardain et al., 2019). Another study has
demonstrated that IFN-γ produced by ILC3 is important for protection against Yersinia
enterocolitica (Y. enterocolitica) infection (Seo et al., 2019).
1.12 Interplay between ILCs and other cells of the immune system
To provide an efficient immune response, the immune cells communicate with other
cells from the same arm and/or from other arm of the immune system. ILCs are not
an exception, to fulfil their function during an infectious or inflammatory process ILCs
need to communicate with cells such as T cells, neutrophils, eosinophils (Riedel et
al., 2017), mast cells and macrophages through production of cytokines.
Similarities between ILCs and T cells begin as far as the early developments (Figure
1.1), both lymphocytes arise from the same CLP, feature shared by human and mice
(Figure 1.6) but differences also exist as T cells are dependent on the recombination
activating gene (RAG) receptor for antigen recognition, ILCs are not activated by
antigens instead they are activated by alterations in the cytokines from the vicinity. T
cells need to migrate to thymus in order to differentiate whereas ILCs do not need to
stay in thymus for maturation and ILCP that restricts differentiation towards ILCs is
not required for T cells differentiation (Gronke et al., 2016).
Although at some point during ILCs and T cells development diverge, during
inflammation their interaction is important for a good outcome. ILC1 subset is found
of being important for tumour suppression by producing cytokine IL-12 (Nussbaum et
al., 2017) and are upregulated inpatients with Chron’s disease fact that suggests a
role of these cells in inflammation to produce IFN-γ during infection. ILC2s are
essential for formation of Th2 memory response and (Halim et al., 2016) have been
implicated in the regulation of CD4+ T cells during pulmonary infection in mouse and
with Th1 and T reg function through their receptor OX40L and activation of type
immune inflammatory response through the same receptor but by a different subset,
the ILC3 (Tumino et al., 2020). Due to their expression of MHCII ILC3 presents that
regulates the microbial involvement of CD4+ T cells during infection (Flores-Borja et
33
al., 2016) and regulation of Th17 cells (Qiu et al., 2013). In addition to that LT α1β2
produced by ILC3 is important for T cell production of IgA and the LTα also produced
by ILC3 is important in mice lacking T cells (Non redundant function of soluble LT
alpha Produced by innate lymphoid cells in intestinal homeostasis (Kruglov et al
2013).
1.13 Human and Mouse Innate Lymphoid Cells
Both human and mouse ILCs have their origin from a common lymphoid progenitor
and are cells capable of give origin to any cell that later lose the ability to differentiate
into the adaptive lymphocytes T and B cells and become restricted to produce only
ILCs (Nagasawa et al., 2018). In mice and human ILCs are mostly found at barrier
surface such as skin, intestine and lung, lack the recombined activating gene, the
lineage markers (Klose & Artis, 2016) and are dependent on the lymphocyte cytokine
receptor Interleukin-2 common gamma chain (IL-2, γc) (Colonna, 2018).
As well as mouse ILCs, mature human ILCs are also divided into three subsets based
on the transcription factor required for their development and function, and cytokine
profile; with mouse and human ILC1 producing IFN-γ and expressing IL-12RB2, the
expression of the common cytokine receptor CD127 (IL-17Rα) on all Innate Lymphoid
Cells but not the NK cells, ILC2 expressing IL-25R (IL-17RB), IL-33 (ST2) and
producing type II cytokines, and ILC3 expressing IL-23R and producing IL-17 and IL-
22 cytokines (Mjösberg & Spits, 2016). In mice and human, the surface marker eomes
makes the distinction between NK cells and ILCs (O’Sullivan, 2019), ILC3 from mice
differ from human ILC3 in the expression of the surface marker NKp46 whereas in
human ILC3 subset express the NKp44 surface marker, CCR6 is expressed by all
human ILC but in mouse this marker is only found on ILC3 (Hoorweg et al., 2012),
another difference is that human ILCs, in particular ILC3, can be activated by the
innate Toll-like receptors that are not found on mice (Klose & Artis, 2016) and the
NCR receptor NKp30 is found on humans ILC2 where it is implicated on that subset
activation (Klose & Artis, 2016).
Intestinal intraepithelial, tonsils, liver, is where ILCs have been found in humans
(Simoni & Newell, 2018b) whereas in mice because more extensive studies have
been done ILCs have been found on Intestine, liver, uterine tissue, blood, cord blood,
colon, peritoneum, bone marrow, tonsil, lung, spleen, skin and skin (Gasteiger et al.,
2015), in humans ILC3 besides IL-17 and IL-22 also produce GM-CSF and IL-26,

34
have been found in intestine, and tonsils, the same locations as where the ILC1 where
similar to studies from mice produces IFN-γ in response to IL-12 and IL-15 (Cella,
Otero, & Colonna, 2010; Björklund et al., 2016). ILC2 is abundantly found in lungs in
humans but they are generally found on other tissues such as spleen, skin, blood,
liver, lamina propria, bone marrow, thymus, lymphoid tissues, bone, adipose tissue,
and brain (Herbert et al., 2019).
Another resemblance between both subsets is plasticity which a feature that is found
on both human and murine ILCs, as in both cases these cells can switch their cytokine
profile according to the stimulating cytokine by downregulating their initial transcription
factor and upregulating the transcription factor that will induce the production of the
required cytokine to produce a type of response that will be appropriated to the
invading pathogen or insult (Nagasawa et al., 2018). In human the ILC3 subset can
convert into ILC1 and back, the ex-ILC3 converted into ILC1 starts producing IFN-γ,
through upregulation of T-bet instead of IL-17 and IL-22 cytokines (Colonna, 2018).
1.14 The adaptive immune system
The cellular components of the vertebrate’s immune system are composed of both
the adaptive immune system and the innate immune system. The adaptive Immune
system is able to adapt to a specific pathogen encountered and this response is
initiated when the invading pathogen is presented and recognised by the B and T cells
in the lymphoid tissue (Rabb, 2002). These adaptive lymphocytes then mount an
immune response tailored to the particular invading pathogen or to the pathogen
infected cells, by the production of antibodies and/or cytokines (Warrington et al.,
2011). However, a primary adaptive response takes days to become available after
the exposure, during this time the protection is provided solely by the cells of the
innate immune system. After the primary adaptive response there is the formation of
a long-lasting immunologic memory which is able to recognise and more rapidly
respond to a subsequent encounter with the same pathogen (Gasteiger & Rudensky,
2014).

35
1.14.1 B cells
The B cells or B lymphocytes also arise from the bone marrow from which site they
mature and migrate to spleen, where they continue to mature (Schweighoffer &
Tybulewicz, 2018). The process of B cell maturation is controlled by clonal selection,
in which the B cell clones with low affinity are selectively deleted (Stebegg et al.,
2018). The mature B cells have a unique antigen-binding receptor on their
membranes and do not need the action of the APC to recognise an antigen, they are
able to recognise unbound antigens by the membrane bound B cell receptor (BCR)
and the B cell main function is to produce antibodies and is particularly specific to
each cell (Musette & Bouaziz, 2018). They help the immune system through the
production of antibodies directed against the targeted antigenic epitopes to protect
the host by opsonising the invading pathogen for phagocytosis and lysis (Figure 1.6)
(Pieper et al., 2013). Following activation, B cells will proliferate into memory B cells
(Figure 1.7). During a second encounter with the same pathogen, the B cells are
present in an increased number of cells which in turn will activate the memory cells
that does not need to go through the development and will immediately differentiate
into antibody secreting plasma cells (Hofmann et al., 2018). As it occurs with the T
cells, the surviving long lasting B cells will be involved in a much faster response if
the organism ever encounters the same pathogen again (Warrington et al., 2011) by
a process known as somatic hyper mutation (Meffre et al., 2001). Although, these
cells do not belong to the myeloid lineage they are also capable of present antigen,
which they internalised and later present as peptides on their surface (Musette &
Bouaziz, 2018). ILCs have been reported to interact with marginal zone B cells to
ensure these cells survival and differentiate into plasmablasts (Giuliana et al., 2014).

36
Figure 1.7 B cell activation, proliferation and immune response. The binding of
the B cell receptor (BCR) and the antigen causes the B cells to become activated,
some of the activated B cells proliferate and differentiate into short lived plasma cells
that secrete antibodies that will neutralize antigen at an early stage, and others will
become long lived memory B cells (1). Besides the activation of B cells the binding of
pathogen triggers series of responses such as the opsonisation for phagocytosis by
phagocytes such as neutrophils and macrophages (2), agglutination by interaction of
an antigen and it’s corresponding antibody (3), activates cellular immunity (4), mast
cell activation to increase capillary dilatation (5) and the activation of the complement
cascade that will culminate with the of the pathogen (6). (https://ininet.org/bio2305-
immune-system-body-defenses.html)
1.14.2 T cells
T cells originate from the same lymphoid precursor within the bone marrow; however
they migrate to and mature in the thymus (Kumar et al., 2018). It is only cells that are
functional and not self-reactive that will leave the thymus, this selection is an important
process to prevent autoimmune diseases (Pilli et al., 2017). T cells are subdivided
into subsets, firstly based on the expression of the surface receptors CD4 and CD8

37
as CD4+ T cells and CD8+ T cells. They have antigen binding receptors (TCR) that are
germ line encoded and recognise fragments of antigen that are presented to them by
Major Histocompatibility Complex (MHC) molecules (Blum et al., 2013).
The T cells expressing CD4 are known as T helper (Th) cells and recognise antigens
presented via MHC class II. Th cells are involved in the initiation and activation of the
other cells of the immune system and orchestrate the response to the clearance of
pathogens (Tai et al., 2018). Following elimination of the pathogen, a small population
of cells persist as long term memory cells; these are able to initiate a more rapid
response upon pathogen re-exposure (Figure 1.8) (Warrington et al., 2011).
Regulatory CD4+ T (Treg) cells, also express CD25, these cells are the immunological
rheostat and are involved in the inhibition of immune response (Sharma & Rudra,
2018).
The Cytotoxic T (Tc) cells express CD8 and have cytolytic functions that result in the
destruction of target cells (Martin & Badovinac, 2018). Tc cells are activated via the
interaction between TCR and the peptide presented via MHCI, resulting in cellular
proliferation and production of the proteins perforin and granzyme B, which induce
lysis of infected or tumour cells (Takeuchi & Saito, 2017).
Activation of T cells is tightly regulated, 3 signals are required for T cell activation:
TCR/MHC/peptide interaction, co-stimulation (CD80/CD86 – CD28) and a cytokine
signal (Mak & Saunders, 2006).

38
Figure 1.8 Differences between Primary and Secondary Immune Response.
When an organism encounters a pathogen for the first time it will initiate a primary
immune response which is short, less efficient and the amount of IgM antibodies
produced is larger than the produced IgG compared with the secondary immune
response where IgG are produced in larger amounts compared with the IgM. The
secondary immune response is initiated when the same pathogen is encountered
again. That response is faster, more efficient, long lasting than the primary and some
of the cells involved will remain as memory cells after the immune response has
ceased (https://microbiologynotes.com/differences-between-primary-and-secondary-
immune-response/).
Table 1.2 Primary immune response vs Secondary immune response
Primary immune response Secondary immune response
Rapid response as a result of primary
contact with an antigen.
Rapid response to a recognised
specific antigen
Rapid recruitment of immune cells Rapid production of antibodies
Takes 4-7 to respond to a second
encounter with the same pathogen
Takes 1-4 days to respond to a second
encounter with the same pathogen
Level of antibody reaches peak in 7 to
10 days.
Level of antibody reaches peak in 3 to 5
days.
Immunity is achieved in a long period of
time
Immunity is achieved in a short period
of time
Cells involved are: macrophages,
dendritic cells, mast cells, neutrophils,
basophils, eosinophils, NK cells
Cells involved are: T cells and B cells
Molecules: cytokines, complement and
proteins
Molecules: antibodies and cytokines
The strength and magnitude of
response do not change
The response is increased in the
second and subsequent encounters
The primary response is immediate The primary response is delayed
Primary response appears mainly in the
lymph nodes and spleen.
Secondary response appears mainly in
the bone marrow, followed by the
spleen and lymph nodes.
Adapted from (Warrington et al., 2011)

39
1.15 Innate and Adaptive immune system
The immune system allows recognition of self from non-self, thus allowing us to
neutralize and destroy invading organisms. This highly dynamic system is divided
into the innate and adaptive immune systems (Netea et al., 2019). The innate
immunity which is made up of non-cellular components such as the complement
system, epithelial barrier, antimicrobial peptide secretions, chemical barrier, and
cellular components as granulocytes, macrophages, dendritic cells, neutrophils,
eosinophils, mast cells and natural killer cells is ready available to fight against
pathogens in a non-specific manner (Quintin et al, 2014). In contrast, the adaptive or
specific immunity is highly specific and exposure to a specific pathogen creates a
memory response which confers long-lived protection via clonal expansion (Table1.4)
(Netea et al., 2016).
Whilst innate immunity provides immediate and robust response to a pathogen, it is
not enough to control all infection. Some pathogens are sophisticated enough to
escape under the radar of the innate cells and receptors thus an intervention of the
adaptive immune system is required for a successful outcome. A highly regulated
cross talk between the innate and adaptive arms of the immune system is essential
for the successful elimination of a pathogen (Buchmann, 2014).
Whilst the innate and the adaptive immune systems are working to robustly defend
the host, it is also essential to keep regulate the response, this is done by Treg, which
work within the immune system by chaperoning the immune response to limit the
inflammatory response and avoid damage to the surrounding tissue (Shevyrev &
Tereshchenko, 2020).
The concept that an immunological memory response as a feature of the adaptive
immune response has been re-evaluated in light of new studies which revealed long
lasting protection via innate cells, which on immune cell population other than the
well-known are capable of generating an enhanced response upon reinfection (Netea
et al., 2016).
One remarkable feature of the innate cells is the ability to activate and to instruct the
cells of the adaptive immune system on the type of pathogen being dealt with and so,
the type of response required from the adaptive system (Gerard et al., 2015). Once
the adaptive cells, which have specific receptors, are activated they will do a more
specific recognition of the invading pathogen and as a result of that mount a more
tailored response against the pathogen (Chaplin, 2010), at the end of the immune
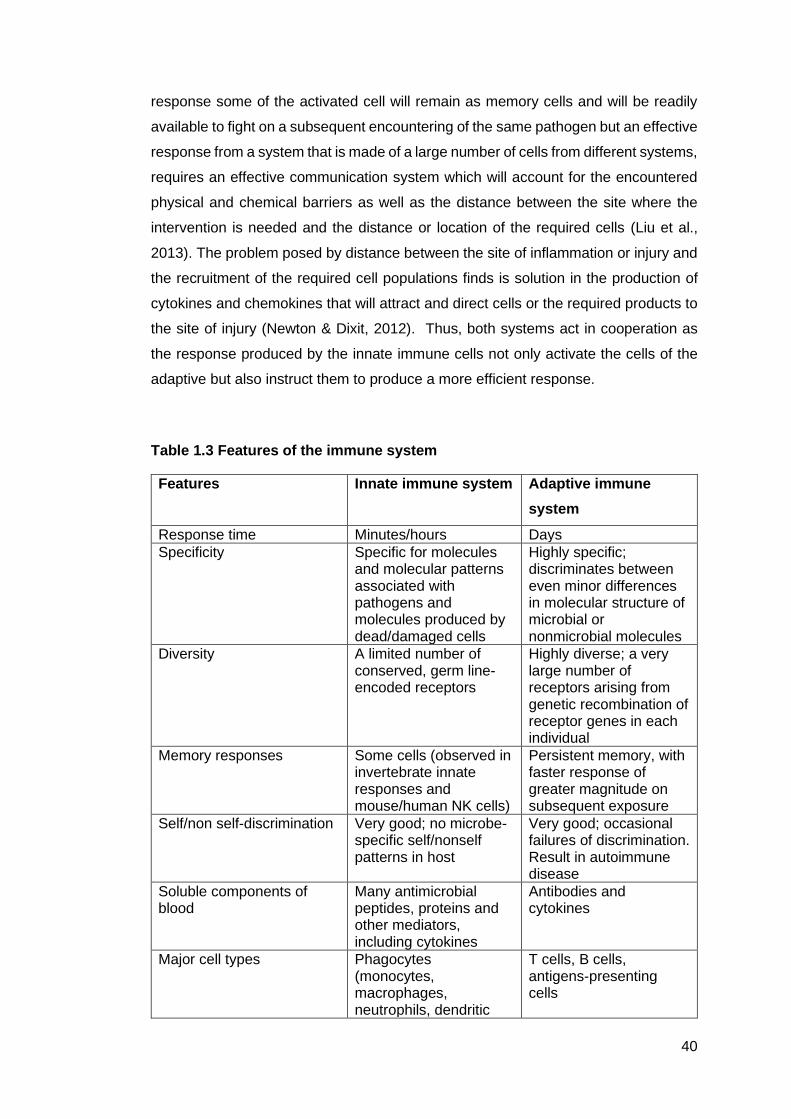
40
response some of the activated cell will remain as memory cells and will be readily
available to fight on a subsequent encountering of the same pathogen but an effective
response from a system that is made of a large number of cells from different systems,
requires an effective communication system which will account for the encountered
physical and chemical barriers as well as the distance between the site where the
intervention is needed and the distance or location of the required cells (Liu et al.,
2013). The problem posed by distance between the site of inflammation or injury and
the recruitment of the required cell populations finds is solution in the production of
cytokines and chemokines that will attract and direct cells or the required products to
the site of injury (Newton & Dixit, 2012). Thus, both systems act in cooperation as
the response produced by the innate immune cells not only activate the cells of the
adaptive but also instruct them to produce a more efficient response.
Table 1.3 Features of the immune system
Features Innate immune system Adaptive immune
system
Response time Minutes/hours Days
Specificity Specific for molecules and molecular patterns associated with pathogens and molecules produced by dead/damaged cells
Highly specific; discriminates between even minor differences in molecular structure of microbial or nonmicrobial molecules
Diversity A limited number of conserved, germ line-encoded receptors
Highly diverse; a very large number of receptors arising from genetic recombination of receptor genes in each individual
Memory responses Some cells (observed in invertebrate innate responses and mouse/human NK cells)
Persistent memory, with faster response of greater magnitude on subsequent exposure
Self/non self-discrimination Very good; no microbe-specific self/nonself patterns in host
Very good; occasional failures of discrimination. Result in autoimmune disease
Soluble components of blood
Many antimicrobial peptides, proteins and other mediators, including cytokines
Antibodies and cytokines
Major cell types Phagocytes (monocytes, macrophages, neutrophils, dendritic
T cells, B cells, antigens-presenting cells

41
cells), (NK) cells, other leukocytes, epithelial and endothelial cells
Adapted from (Chaplin, 2010)
1.16 Cytokines
Cytokines are soluble components more specifically polypeptides and glycoproteins,
secreted by cells of the immune system involved in the transport of signals from the
cells where they are produced to the cell to which they will exert their function (Foster,
2001). Thus, contributing to the activation and regulation and inhibition of cell
proliferation, differentiation and regulation of various cells and tissues that are part of
the adaptive and innate immune response and between cells of these two distinct
systems (Mortha & Burrows, 2018). Their production needs to be stimulated and once
stimulated, the cytokine produced interacts with the receptors present on the surface
of the target cell their action may be directed against local cells, distant cells or tissue.
Among their actions are the increase of blood vessels permeability, activation and
recruitment of cells to the site of injury, signalling the cell that produces the required
enzyme or protein to upregulate or downregulate production (Turner et al., 2014). The
produced cytokine also influence the activity of chemokines and adhesion molecules
by inducing alterations in their surface molecule expression resulting in cell movement
(Jain & Pasare, 2017).
Proinflammatory cytokines are first produced during an innate inflammatory response
by the myeloid cells. The proinflammatory cytokines ( IL-1β, IL-1α, IL-12 and TNF-α)
play a role in the proliferation of B and T cell and in the regulation of the T helper cells,
B cell differentiation and in white cell differentiation (McKenzie et al., 2014). The type
II or anti-inflammatory cytokines (IL-4, IL-6 and IL-10), this type of cytokine are
produce in response to allergens, virus, bacteria, helminths or by self components by
adaptive and innate cells, and are important for control of the temperature, tissue
remodelling, wound healing, eosinophil recruitment, immunoglobulin production
(Lloyd & Snelgrove, 2018).
The IL-17 and IL-22 cytokines are important for neutrophil recruitment to deal with
inflammation caused by bacterial infection by clearing the invading pathogen and
tissue homeostasis and repair respectively after extracellular bacterial infection that
is mediated by the ILC3 subset in response to IL-23 (Zeng et al., 2019).

42
1.16.1 Interleukin 17 (IL-17)
The interleukin-17 (IL-17) is a proinflammatory cytokine which plays an important part
in fighting against fungal infections and are also present in many inflammatory and
autoimmune diseases and dependent of IL-23 (in vivo) (Onishi & Gaffen, 2010) and
on neutrophil recruitment during gram negative bacterial infection (Aujla et al., 2008).
Although, ILCs were never seen as being involved in fighting against bacterial
infection recent studies have shown that ILCs are a major source of IL-17 (Gladiator
et al., 2013). There are six members on the IL-17 family the IL-17A, IL-17B, IL-17C,
IL-17D, IL-17E and IL-17F and express the receptors IL-17RA, IL-17RB, IL-17RC, IL-
17RD, IL-17RE and IL-17RF (Pappu et al., 2011).
The onset of an infection and autoimmune disease activates IL-17A production by
ILC3 (Schulz-Kuhnt et al., 2020). Any ILC3 cell is able to produce both IL- 17A and
IL-17F (Annunziato et al., 2015). ILC3 can detect fungal proteins directly via the
pattern recognition receptor Toll-like receptor 2 (TLR2) or through activation of the IL-
23 (Seillet et al., 2014b).
1.16.2 Interleukin 22 (IL-22)
The interleukin-22 is produced by ILC3 during normal state, at that point the cytokine
IL-22 is also produced to maintain homeostasis by keeping the commensal bacteria
at bay and prevention of systemic propagation and inflammation (Killig et al., 2014),
IL-22 is also important for protection against gram negative bacteria and in the
absence of this cytokine bacteria can easily spread to the spleen (Aujla et al., 2008).
The experiments done on IL-22 aim to elucidate if there are any changes in IL-22
production during gram negative bacteria and if the increase is proportional to the
post infection time. It is also important for maintenance of the epithelial cell barrier, in
restricting the contact between the commensal bacteria and the epithelia and to
protect against bacterial infection with Escherichia coli (E. coli) and Citrobacter
rodentium (C. rodentium) (Via et al., 2001).
All ILC3 subsets can produce IL-22 and are the major source of IL-22 early production
during infection where the cytokine promotes tissue maintenance and immune
protection (Ardain et al, 2019). It is important to mediate inflammation and to promote
protection against invading pathogens. IL-22 is increased in patients with

43
inflammatory bowel disease (IBD) and mice completely lacking IL-22 are more
susceptible to IBD induced in a number of experimental models (Diefenbach et al.,
2014). IL-22 is essential for the best defence against extracellular pathogens, such
as bacteria against extracellular pathogens. In general IL-22 acts at the barrier and is
involved both tissue repair as well as wound healing (Ardain et al., 2019).
1.17 Receptors
1.17.1 The innate receptors
These receptors have been characterised as the endocytic PRRs (macrophage
mannose binding receptor), secreted PRRs (mannose binding lectin), the signalling
PRRs: C-type lectin receptors (CLRs), Toll-like receptors (TLRs), nucleotide-binding
oligomerization domain-like receptors, retinoic acid-inducible gene-I (RIG-I) helicases
and NOD-like receptors (Figure 1.9) (NLRs) (Jin et al., 2013). These receptors play
important roles in fighting the invading pathogen by helping in detection. NLR are
cytosolic thus able to recognise intracellular pathogens and cell products released
during cell damage or stress also known as danger-associated molecular patterns
(DAMPS) (Eisenbarth & Flauell, 2009).
One of the fundamental functions of the innate immune system is the ability to
recognise self from non-self. The innate immune system is activated by the
engagement of the pattern recognition receptors (PRR), which are expressed on the
surface of a range of cells (Eisenbarth & Flauell, 2009), with receptors found on the
foreign or damaged self structure. These receptors can be located either at
extracellularly, within the plasma membrane or intracellular (Kumar et al., 2011). They
are able to recognise, and bind sets of repetitive sequences on the invading pathogen.
These repetitive sequence are called pathogen-associated molecular pattern
(PAMPS) that are only common in the invading pathogen, examples include
Lipopolysaccharide (LPS) (gram negative bacteria), lipoteichoic acid (gram positive
bacteria), mannans (fungi), double stranded DNA (virus) (Ferro et al., 2019).

44
Figure 1.9 Innate immune receptors activation. Pathogens are detected by
proteins called pattern recognition receptors (PRR) located on the cell surface such
as the Toll-like receptors (TLRs), C-type lectin receptors (CLRs) or intracellularly such
as the NOD-like receptors (NLRs). The activation of these receptors will initiate a
cascade of events that are mediated by adaptor proteins MyD88 or TRIF which in turn
will activate the transcription factor nuclear factor kappa B (NF-kB) in the cytosol, that
will translocate to the nucleus to direct the transcription of various genes, changing
the cell’s activation state and as a result immune cells will be recruited to the site of
inflammation, the adaptive immune system is activated, and infected or damaged
cells are destroyed
(https://www.cell.com/trends/immunology/comments/S1471-4906(13)00036-7).
1.17.1.2 Toll-like receptors
Toll-like receptors (TLRs) are transmembrane receptors (Figure 1.9) widely found on
epithelial cells, monocytes, macrophages, dendritic cells and also on B cells and are
able to recognise lipids, nucleic acids, double-stranded RNA and bacterial cell wall
(Mogensen, 2009). In mammals there are 13 known receptors members within this
family, that all share the same leucine-rich repeats (LRR) (Mahla et al., 2013). The
binding of TLR to PAMP will cause TLR to act as mediators for the formation of an
appropriated immune response through the secretion of proinflammatory cytokines

45
and interferons (Chen et al., 2019). This creates an inflammatory environment through
recruitment and enhancing the functionality of phagocytic cells (Biswas, 2018).
TLRs are transmembrane proteins, which are found within both the surface
membrane and intracellular vesicles membranes in human and mice (Okun et al.,
2009). The binding of a conserved PAMP from bacteria or DAMP from damaged cells
via their LRR triggers a signalling cascade, the pathway activated is dependent on
the protein adaptor, either myeloid differentiation factor 88 (MyD88) or the TIR
domain-containing adaptor-inducing IFN-β factor (TRIF) (West et al., 2006). MyD88
activated By TLR1/2 is associated with activation of the transcription factor Nuclear
Factor kappa-light-chain-enhancer of activated B cells (NF-kB), which is translocated
to the nucleus and mitogen-activated protein kinase (MAPK) pathways resulting in
enhanced expression of a number of antimicrobial proteins, chemokines and
proinflammatory cytokines (Hayden et al., 2006). The adaptor TRIF is associated with
TLR3, which binds to viral double-stranded RNA (Mahla et al., 2013). The membrane
TLRs recognise structures from the outside of the microorganism, whilst the
lysosomal TLRs bind components resulting from the degradation of bacteria (Mahla
et al., 2013).
1.17.1.3 The NOD-like receptors
NOD-like receptors (NLRs) are located in the cytosol (Figure 1.9) and recognise
intracellular PAMP and DAMP, such as peptidoglycans found on all gram-negative
bacteria (Velloso et al., 2019) The engagement of NOD receptors results in the
activation of NF-κB pathway and the transcription factors interferon-regulatory factor
(IRF) (Velloso et al., 2019). This in turn results in the induction of expression of the
proinflammatory cytokines IL-1, IL-6 and TNF-α. NLR act via pro-inflammatory
response and also apoptosis (Eisenbarth & Flauell, 2009).
1.17.1.4 RLR-I-like receptors
The RIG-I-like receptors (RLRs) are intracellular receptors of the innate immune
system (Brisse & Ly, 2019) found in the cytoplasm of cells were they respond to type
I interferon and also bind only to double strand RNA from viruses and the binding to
RNA causes that receptor to change its conformation (Takeuchi & Akira, 2010).

46
(Takeuchi & Akira, 2010) allowing it to bind to its adapter molecule, the mitochondrial
antiviral signalling protein (MAVS) (Brisse & Ly, 2019). The RLR recruit copies of
MAVS and other proteins to activate NF- κB nuclear factor (NEMO)/ Inhibitor of NF-
κB kinase alpha (IKKα)/ inhibitor of NF- κB kinase beta (IKKβ) and TANK-binding
kinase 1 (TBK1) Inhibitor of NF-κB kinase epsilon (IKKε) which in turn leads to
activation and nuclear translocation of NF-κB inducing the expression of IFN-α, IFN-
β and other cytokines essential for antiviral defence (Brisse & Ly, 2019).
1.17.1.5 C-type lectin receptors
The C-type lectin receptors (CLRs) are cell surface PRRs (Figure 1.9) expressed by
innate cells by monocytes, macrophages, DCs, neutrophils, and by the adaptive B
and T cells (Velloso et al., 2019). CLRs recognise mannose, fucose and glucans. The
signalling pathway triggered by this receptor activates transcription factors that are
responsible for activation of effector genes expression resulting in the activation of
nuclear factor of activated T-cells (NFAT), MAPK and NF-κB pathways and the
formation of the Activator protein 1 (AP-1) transcription factor, involved in the
upregulation of proinflammatory cytokines such as IL-17, IL-23, TNF-α and IL-1β
(Hayden et al., 2006).
1.17.1.6 Killer activation receptors
NK cells express a characteristic set of receptors known as killer activation receptors
(KARs) that are capable of recognise cellular changes brought about by viral infection,
stress or cancer (Cifaldi et al., 2017). Infected cells will express stress related
molecules that are an indication that the cell is compromised, this will attract NK cells
to the affected cells (Abel et al., 2018). The binding of NK cells with the hosts
defective cell will result in the destruction of the target cell (Abel et al., 2018).
1.17.1.7 Killer inhibition receptors
The cytolytic activity of NK cells require a mechanism of regulation to avoid over
reaction or unnecessarily prolonged immune response. The NK cells are regulated by
a set of inhibitory receptors known as the killer inhibition receptors (KIRs) (Warner &
Ohashi, 2019), these receptors allow the NK cells to bind to MHC class I molecule.

47
Through this binding NK cells can recognise the healthy status of a cell, if insufficient
MHCI is being expressed; the NK cell identifies the cell as a potential target and
eliminates it. On the other hand, lack of inhibitory receptors prevent NK cells from
performing an accurate assessment of MHCI expression and causes hyperreactivity
(Crouse et al., 2015).
1.17.2 The adaptive receptors
1.17.2.1 B cell receptors
B cell receptors (BCR) are cell-surface bound immunoglobulin, when a BCR binds an
antigen it results in cellular activation and both the receptor and the antigen are
internalised by the cell (McHeyzer-Williams et al., 2012). The antigen is degraded
and the fragments obtained by degradation are transported to the cell surface by
cytoplasmatic MHC II to be recognised by the specific surface receptors on T cells
(Friess et al., 2018).
1.17.2.2 T cell receptors
The T cell receptor (TCR) is expressed on the surface of T cells and is composed of
a αβ or a γδ chain pair, TCRs are only able to recognise antigens presented by MHC
molecules. The γδ T cells are less common than αβ T cells and share many
characteristics with the innate immune cells (Kreslavsky et al., 2010).T cell receptors
can be rearranged, it is this property that makes them very diverse and allows for a
repertoire of T cells that can specifically respond to a vast array of pathogens
(Wucherpfennig et al, 2010).
1.18 The inflammatory response
The best way to prevent bacterial infection is to prevent bacteria from gaining access
by the intact physical barriers (skin and mucosa). Once this barrier is broken, the cells
of the immune system (T cells, B cells, monocytes, macrophages, neutrophils,
eosinophils and DCs) come into play to eliminate the invading pathogen (Van Maele
et al., 2014).
48
The breach of the physical and chemical barriers triggers a cascade of events that is
term an inflammatory response (Dantzer, 2009). The response is characterised by
the presence of pain, redness, swelling, heat and loss of function (Takeuchi & Akira,
2010). These symptoms are caused by the influx of blood into the affected area, which
causes the redness and heat, the increase of permeability of the blood vessels causes
oedema due to leakage and accumulation of fluids in the surrounding tissues,
resulting in swelling and loss of function (Turner et al., 2014). The response
culminates with the penetration of immune cells and the initiation on an innate immune
response.
Following a trauma caused by local infection, injury, or exposure to chemical that
causes damage to the physical barriers such as skin and mucosa or internal organs
the infected organism will be in contact with the infecting agent or with proteins from
the infecting agent. This breaching of the barriers is detected and a response
activated via recognition via the PPRs (Languedoc et al., 2015). The tissue resident
immune cells act as sentinels, by constant sampling the surrounds to allow the PRR
to engage with specific PAMPs. This recognition of the PAMP results in the secretion
of proteins such as cytokines and chemokines to orchestrate the inflammatory
response (Kumar et al., 2011). Key cytokines involved in the response include TNF-
α, IL-1β, and IL-6, which will induce fever to stop or retard the replication of pathogens
and induce the production of the acute phase proteins by the liver that that will serve
as opsonising molecules as well as activate the complement system (Zhang & An,
2009).
The immune cells circulating within the capillaries are directed by chemokines and
cell adhesion molecule interactions to adhere to the endothelial tissue cross the walls
and migrate into Infected tissues (Elshal et al., 2007). Neutrophils are the first cells
to arrive to the place of infection to augment the innate immune response then arrive
the macrophages to help in clearing the site of infection from the cellular debris to
avoid the continuity of an unnecessary immune response and to aid tissue repair
(Gupta et al., 2018).
During the early hours of an infection, the activated cells will produce cytokines to
activate the subset of ILC with specificity for the required response (Yazdani et al.,
2015b). The selective activation of ILCs is of great importance as each subset
activates very specific cells of the adaptive system and is able to help the maturation
of T cells (Iwasaki et al., 2015). Thus, ILCs besides controlling the infection from the
first hours also shape the required adaptive response.

49
ILCs have an immediate reaction to signals coming from injured or infected tissues
(alarmins) to which they will respond and produce cytokines that will be specific to the
pathogen or injury (Hazenberg & Spits, 2014a) (Figure 1.11). These are proteins
involved in producing and chaperoning the required immune response, specific to the
injury caused although dysregulation of the appropriated immune response can cause
disease (Figure 1.10). Knowing that, we can speculate that if cytokines can control
the activity of the ILC cells we can also control the generated immune response by
upregulating, downregulating or modifying it to tailor a more specific and faster
response to disease and therapy (O’Sullivan & Sun, 2017). This is evidenced by the
demonstration that neutrophil recruitment into the lungs during bacterial induced
inflammation was shown to be driven by ILC3s via the production of IL-17 (Van Maele
et al., 2014).
Figure 1.10 Innate lymphoid cells (ILCs) and their involvement in inflammatory
disorders tissue repair and homeostasis. ILCs are involved promoting immunity
but are also capable to induce chronic inflammatory diseases. ILC1s are found in lung
and intestine where is involved in type I inflammatory response against intracellular
pathogens, the ILC1subset is expanded in intestine of patients with Crohn’s disease

50
and in lungs of patients with COPD. ILC2s are mainly found in intestine where it is
involved in the elimination of parasites, lungs and skin where it involved in has the
ability to restore tissue after an infection or damage, ILC2 is expanded in patient s
with chronic sinusitis, asthma, lung fibrosis and atopic dermatitis. ILC3 is involved in
maintaining barrier integrity and tissue repair, this subset is also expanded in skin of
patients with psoriasis and in lungs of patients with lung disease (Ebbo et al., 2017a).
Figure 1.11 Innate lymphoid cells and their cytolytic features. The ILC family were
divided in two groups, cytotoxic and non-cytotoxic, based on the presence or absence
of cytolytic activity and further divided into three subsets based on the transcription
factor they express and the type of cytokines they produce. The cytotoxic ILCs
comprised by NK cells and which is part of the group 1 ILC and the non-cytotoxic
group has the T-bet expressing ILC1, the ILC2 and ILC3. The cytotoxic ILC1 when
stimulated by type I cytokines produces perforin, granzyme, IFN-γ and TNF-α involved
in immunity response against viruses and cancer but when dysregulated these cells
can cause chronic inflammatory diseases. The non-cytotoxic ILC1 after stimulation
with the same type I cytokines will also produce TNF-α and IFN-γ but not perforin or
granzyme and has a beneficial role in in intracellular pathogens such as protozoa and
bacteria and dysregulation can also lead to chronic inflammation. The ILC2 produces

51
type II cytokines and is involved in immunity to helminths, asthma and allergic
reactions with a detrimental role in metabolic diseases. The third subset, ILC3 when
stimulated by AHR ligands, IL-1β and IL-23 produces the IL-17, IL-22 ang GM-CSF
cytokines, the ILC3 expressing also T-bet produces IL-22, IFN-γ, TNF-α and GM-
CSF with a beneficial role in lymphoid tissue formation, intestinal function, clearance
of extracellular bacteria but can be dysregulated and cause chronic inflammation
(Hatfield & Brown, 2015).
1.19 Pseudomonas aeruginosa
Pseudomonas aeruginosa is a rod-shaped opportunistic gram negative bacteria,
anaerobic facultative (Bassetti et al., 2018), able to survive under difficult conditions
in the environment such as high temperatures and acidic conditions, able to infect
humans and involved in the complications of patients with hospital and community
acquired infections, cystic fibrosis and burns (Pang et al., 2019). Infections caused by
P. aeruginosa are widely found among the patients requiring hospitalisation and is
one of the leading causes of morbidity and mortality and hospital acquire pneumonia
(Moradali et al., 2017). The pathogen can be transmitted by contact between person
to person, hospital equipment to person such as postoperative wound, infection or by
colonization especially in the immunocompromised or immunodeficient. The P.
aeruginosa can easily adapt and survive thus becoming resistant to wide range of
available antibiotics (Moradali et al., 2017). One particular susceptible group of
concern is the cystic fibrosis patients due to a defective mucosal epithelial caused by
a defective CFTR gene and infections caused for this pathogen alone is the cause of
more than fifty thousand cases of hospital visits every year (Bassetti et al., 2018).
1.19.1 Pseudomonas aeruginosa mechanism of action
The bacteria P. aeruginosa has the ability to escape under the radar of the immune
system and to avoid destruction by antibiotics due to the formation of biofilm, a build-
up of bacteria attached to a surface and encased by a matrix made of
exopolysaccharides, lipids, proteins and nucleic acids (Al-Wrafy et al., 2017) that
together with the LPS, the natural constituent of the bacterial cell membrane, are both
responsible for the high resistance to antibiotics, chemicals, and environmental
factors (Angeletti et al., 2018). And, the LPS alone for the high pathogenicity of P.
aeruginosa, that pathogen has yet other components in its structure such as filament

52
called flagella that is important for motility, the pili for adherence to the host’s cell
membrane, secretion of enzymes to cause tissue disruption, protein secretion for
endurance in the host’s environment conditions (Angeletti et al., 2018) all important
in the establishment of infection (Bassetti et al., 2018). Biofilm formation is another
strategy used by P. aeruginosa to control the production of its virulent factors (de
Almeida Silva et al., 2017).
1.19.2 Pseudomonas aeruginosa treatment options
Through many years P. aeruginosa has been treated with antibiotics such as
aminoglycosides (gentamicin and tobramycin), fluoroquinolones (ciprofloxacin,
levofloxacin), polymyxins (polymyxin B) penicillin (Bassetti et al., 2018) and
cephalosporins (Juan et al., 2017). Antibiotic resistance has becoming very common
to the available treatments for P. aeruginosa (Stefani et al., 2017) factor that brings
the need for new treatments or new combinations to effectively eradicate infections
caused by this pathogen.
1.20 The Future
In situations in which vaccines are not yet available or difficult to deliver, developing
an innate immunological memory against the specific pathogen would be a noble
strategy. For that a clear understanding of how the innate system works to provide
immune memory needs to be understood. The use of innate immunity in the process
of vaccine making depends on a good understanding of the mechanisms underlying
memory generation and how it can be modulated to benefit the host (Levy & Netea,
2014). That type of memory can also be used to obtain adjuvants that will help to
increase the activity of the specific antibody, to enhance non-specific responses from
the host (van der Meer et al., 2015) and also to enhance protection on patients with a
deficient adaptive system.
Trained innate immunity helps to enhance resistance (Kleinnijenhuis et al., 2012). The
Bacille Calmette-Guérin (BCG) is also used against bladder cancer (Mahendran,
2017). The process of immune protection starts with sensing on non-self and
dangerous and then the activation of the appropriated mechanisms to inactivate or
destroy the invading pathogen (Sadd & Schmid-Hempel, 2006). Those active cells
will remain for a certain period of time, during which the host will be protected against

53
that specific pathogen and perhaps other similar pathogens. Although, immunological
memory has a potential to be beneficial to the host it can also have its disadvantages.
For example, when pathogens of different virulence compete for the same host, a
high or prevalent immunological memory would most likely select for the most virulent
species of the infecting pathogen (Kurtz, 2004) and an early-life exposure of the
immune system to trained immunity could increase the risk of developing chronic
inflammatory disorders such as diabetes, stroke and cardiovascular diseases later in
life (Levy & Wynn, 2014).
In light of this fact, it is important to ascertain that while investigating immunological
memory we know when the immune cell responders have returned to baseline status.
1.21 Mouse models of ILC function during P. aeruginosa infection
To avoid problems in obtaining animal samples that can be replicated, Inbred strains
which are obtained through the mating of 20 generations of brothers and sisters and
are genetically identical, especially if from the same source (Sellers, 2017), and
isogenic compared to outbred that are heterogenic, genotypically and phenotypically
different. Using inbred animal increases the reliability of repeated samples by
decreasing the probabilities of obtaining false results and increasing the statistical
significance of the experiment. All mice used in these experiments are of C57BL/6
background, it has been widely used for biomedical research because it can develop
the clinical symptoms observed in humans (Chan et al., 2015). More specifically
C57BL/6N, these mice are easy to maintain, bread, have a long life span and are able
to mount a robust proinflammatory response (Fontaine & Davis, 2016). The
C57BL/6N mice are genetically identical and were obtained from the National Institute
of Health (NIH) (Zurita et al., 2011).
RAG1 Ko and R2G2 mice also of C57BL/6 background in which genetic mutations
were induced, were used to facilitate the study of ILCs memory function during
bacterial infection without interference of cells of the adaptive immune system in the
case of the RAG1 Ko and the R2G2 mice to study protection in the absence of the
adaptive T and B cells as well of the ILCs. Knockout mice of C57BL/6 background are
a choice for animal studies (Genetic polymorphism among C57BL/6 mouse inbred
strains (2011 Jun; 20 (3): 481-9.doi: 10.1007/s11248-010-9403-8. Epub 2010 May
27).
54
Animals were also sex matched to analyse any differences during the immune
response between male and females. Although, male animals recovered faster than
the females, which means that they were probably able to clear the bacterial infection
faster than the females in this study, males were also the gender group with more
mortality rate. The high mortality rate may be a side effect caused by an inability to
control the stronger immune response. Investigate the cellular and molecular basis of
the differences observed during the experiments would be of great interest.
Previous studies have demonstrated that RAG knockout mice and the R2G2 are
reliable to study the involvement of ILCs during an immune response in the absence
of the adaptive system only or in the absence of the adaptive system and ILCs (Bando
& Colonna, 2016). Another study has also used C57BL/6 to study inflammatory
process during P. aeruginosa infection (Thompson et al., 2018) and C57BL/6 was
also reported as the mice of choice to study the gram negative P. aeruginosa infection
for its ability to develop the same inflammatory response as humans (Pletzer et al.,
2017).
1.22 Hypothesis
The hypothesise for this thesis is that immunisation of mice lacking the adaptive
immune system when immunised with heat killed bacteria can generate a memory
response when the immunised animals are challenged with the same pathogen and
that response is brought about by the innate lymphoid cells.
1.23 Aims
The aims of this project are:
To investigate the role of ILCs during bacterial infection
To investigate the possibility of memory response by ILCs during bacterial
infection
To investigate the type of immune response
To investigate the mechanism of the immune response provided by ILCs
To investigate and compare cellular changes during diseased and normal
state

55
CHAPTER 2 - GENERAL MATERIALS AND METHODS

56
2.1 Materials and equipment
Materials Source
70 μm cell strainer
75 x 12 polystyrene tubes
96-well plate
Anti CD90 depletion antibody, purified
Bovine serum albumin
Brefeldin A
BD CompBeads
Biorad, UK
Fisher Scientific, China
Sarstedt, Germany
Thermo Fisher Scientific, UK
Fisher Scientific, USA
eBioscience (thermos)
Becton Dickenson
C57BL/6 mice Queen’s University Belfast, Biological
Service Unit (UK)
Cetrimide agar
Corning Falcon round-bottom polystyrene
Sigma Aldrich, UK
Countess Counter Invitrogen (thermo), UK
Dynabeads® Untouched™
Mouse Anti-CD90 magnetic beads
Ethylenediaminetetraacetic acid (EDTA)
Dynal (thermo)
Invitrogen (thermos), UK
Melford Laboratories Limited, UK
Endotoxin-free PBS (Gibco)
Eppendorf Centrifuge 5810R
EasySep Mouse PE isolation kit
Thermo Fisher Scientific, UK
Fisher Scientific
StemCell Technologies, UK
Ethanol
FACS buffer
Sigma, UK
See appendix
57
FACS Canto II 6 colour system Cytometer
Falcon centrifuge tube
Foetal bovine serum
BD Biosciences, UK
Sarstedt, Germany
Thermo Fisher Scientific, UK
Fc block eBioscience (thermos), UK
Flow cytometry antibodies eBioscience
Foetal calf serum
Glycerol
IgG2b, k Isotype control antibody, purified
eBioscience, UK
Scientific laboratory supplies, UK
Biolegend
IL-17 secretion assay Miltenyi, UK
IL-1β Miltenyi, UK
IL-6, IL-12, IL-17, IL-22, IL-23 ELISA Kit
Inoculating loops
Insulin syringes 500ul
eBioscience, UK
Greiner bio-one
Terumo, USA
Iscove’s Modified Dulbecco’s Medium
Ketamine
Microtubes 1.5 ml
EasySepMouse ILC2 isolation kit
Needles, 26 gauge
Gibco, UK
Ketaset, Fort Dodge Animal Health
Sarstedt, Germany
StemCell Technologies, UK
BD, Ireland
Nutrient agar Sigma Aldrich, UK
Nutrient broth
Permeabilisation buffer
PFA
Sigma Aldrich, UK
eBioscience, UK
See appendix
Penicillin/streptomycin (10,000 Units/ml)
Phosphate buffered saline (PBS)
PAA, UK
Thermos

58
RAG1 KO mice
Queen’s University Belfast, Biological
Service Unit (UK) (Kindly provided by
Mark Watson)
Rag2-IL2rg double knockout mice (R2G2)
Roswell Park Memorial Institute (RPMI)
ENVIGO
Thermo Fisher Scientific, UK
Stimulation cocktail eBioscience (thermo), UK
Transcription factor staining buffer set
Transwell plate
Trizol reagent
eBioscience (thermos), UK
Corning
Thermo Fisher Scientific, UK
Trypan blue
Tween 20
Invitrogen (thermos), UK
Sigma Aldrich, UK
UltraCompeBeads eBioscience, UK
Equipment
Automatic cell counter (EVE, NanoEntek, USA)
Biosafety cabinet
Calibrated single-channel pipettes (Brand, Germany)
Countess cell counting slide (EVE NanoEntek, USA)
Cell sorter (BD Biosciences)
Cell strainer (Thermo Fisher Scientific Gibco TM)
Centrifuge 5810 R (50ml and 15ml conical tubes, 5 and 10ml FACS tubes and 96 well
plates) (Centrifuge 5810R, eppendorth, Davidson & Hardy, UK)
FACSCanto4-laser (405 nm, 488 nm, 532 nm, 633 nm; Becton Dickinson, UK)
Flow cytometer (BD Biosciences, UK).
Humidifier incubator 37°C, 5% CO2 (Davidson & Hardy, UK)
Incubator (37˚C) (Davidson & Hardy, UK)

59
Magnet for beads separation (StemCell, UK)
Microplate spectrophotometer (Biotek, USA)
Multichannel pipette (alphalaboratories, UK)
Orbital incubator S1500 (Stuart, UK)
Tips (10µl, 20µl, 200µl, 1000µl)
Vortex (Davidson & Hardy, UK)
Water bath (Stuart SWB series, UK)
Software
FlowJo (BD Biosciences, UK)
GraphPad Prism software v5.03

60
2.2 Bacterial isolates
The bacteria were taken from a vial of frozen stock maintained at -80°C. A disposable
sterile loop was used to remove a small ice crystal of stock from the surface. This is
plated onto an appropriate agar plate and cultured overnight at 37˚C, 5% CO2. The
OD was measured at OD600 and adjusted to 0.25, equivalent to 106 CFUs, the
concentration of the inoculum was confirmed by plating a serial diluted sample on
cetrimide agar for P. aeruginosa, mannitol salt agar for Staphylococcus aureus (S.
aureus) and nutrient agar for E. coli.
2.2.1 Preparation of heat killed P. aeruginosa
From a fresh culture of P. aeruginosa, a single colony was scraped out and placed
inside a 50 ml falcon tubes containing 10 ml of nutrient broth. The falcon tubes
containing the inoculum were incubated overnight on a shaker. After the overnight
incubation, the tubes were removed from the incubator and centrifuge at 3220g for 10
minutes, the supernatant was discarded, and the pellet washed twice with 2 ml of
sterile PBS at 3220g at room temperature. After the last wash the supernatant was
discard and the pellet resuspended in 500ml of sterile PBS and the OD adjusted to
10. Aliquots of 500 ml of the samples with the desired OD were placed into sterile
microtubes and placed on water bath at 65° overnight to heat kill the bacteria. The
tubes containing the heat killed bacteria were stored in the fridge at -80° and the heat
kill process confirmed by plating.
2.2.2 Preparation of Pseudomonas aeruginosa for infection
The isolate of P. aeruginosa used in this experiment was the Q502a clinical isolate
from the biorepository in the Ingram lab. It was obtained from a patient with chronic
respiratory infection. For growth on the shaker, four 50ml falcon tubes were used,
each containing 10ml of nutrient broth in which one colony of P. aeruginosa was
inoculated, and this was incubated at 37oC, at 100 rpm. After the overnight growth on
nutrient broth, the samples were centrifuged and washed twice in sterile endotoxin
free sterile PBS by spinning at 3,220 g, at room temperature for 10 minutes. The
obtained cell pellet was resuspended in 700µl of sterile PBS and the optical density
adjusted at 600 nm (OD600) to 0.25. The number of bacteria inoculated was confirmed
by plating serial dilutions of the prepared suspension on cetrimide agar.

61
2.2.3 Preparation of Staphylococcus aureus for infection
The S. aureus (Q181) were grown overnight in a 50ml falcon tube containing 10ml of
nutrient broth into which a single colony of S. aureus was inoculated, and the tube
incubated at 37°C and shaking at 100 rpm. After the overnight growth on nutrient
broth, the samples were centrifuged and washed twice in sterile endotoxin free sterile
PBS by spinning at 3,220 g, at room temperature for 10 minutes. The obtained cell
pellet was resuspended in 700µl of sterile PBS and the optical density adjusted at 600
nm (OD600) to 0.25. The number of bacteria inoculated was confirmed by plating serial
dilutions of the prepared suspension on mannitol salt agar.
2.2.4 Preparation of Escherichia Coli for infection
The E. coli (0157:H7) were grown in a 50 ml falcon tube containing 10ml of nutrient
broth in which a single colony had been inoculated, and the tube incubated at 37°C
and shaking at 100 rpm. After the overnight growth on nutrient broth, the samples
were centrifuged and washed twice in sterile endotoxin free sterile PBS by spinning
at 3,220 g, at room temperature for 10 minutes. The obtained cell pellet was
resuspended in 700µl of sterile PBS and the optical density adjusted at 600 nm
(OD600) to 0.25. The number of bacteria inoculated was confirmed by plating serial
dilutions of the prepared suspension on nutrient agar.
2.2.5 Serial dilutions
A ten-fold dilution was prepared as follow: Six 15 ml falcon tubes were prepared with
9 ml of PBS on each. Using a sterile pipette 1ml of the mixed sample was taken from
the that has been taken from the box containing ice and added to the first tube
containing the 9 ml of PBS to make the total volume of 10 ml (dilution 10-1). After
mixing the dilution, a new tip was put on the pipette and 1ml of the mixture from the
10-1 was added to the tube to make the dilution 10-2. The same process was repeated
for all the tubes, by adding 1 ml from the previous and adding it to the next tube given
a final dilution of 10-6. Six agar plates were prepared and with aid of one pipette 0.1
ml was taken from each tube plated and spread on the previous labelled plate
prepared for each dilution to find out how many viable cells are in each dilution. The
plates were incubated at 37°C.

62
2.3 Mice infection
2.3.1 Mice
All the animal experimental work was carried out in accordance with the approved
protocols by the UK Home Office representative in Northern Ireland, the Department
for health Social Services and Public Safety Northern Ireland (DHSSPNI) and in line
with the animals (scientific procedures) act 1986 Home Office license numbers. The
murine infections were carried out in the category II room of the Queen’s University
Belfast (QUB) Biological Service Unit (BSU), inside the safety cabinet provided. Adult
mice used in the experiments were aged between no less than 8 and no more than
24 weeks of age, age and sex matched.
With no exception, all mice used in this study were on a C57BL/6 background and
were all bred at Queen’s University Belfast BSU.
The C57BL/6 wild type mice were bread in house and kept in normal cages whereas
the RAG1 KO and the common gamma chain KO mice were on individually ventilated
cages (IVCs) in the Biological Service Unit at Queen’s University Belfast. The
experiments were submitted for approval by the Home Office and the Belfast
University ethical Review Committee.
2.3.2 Intraperitoneal immunisation
To recreate an inflammatory response mouse were injected intraperitoneally with 100
µl of heat killed Pseudomonas aeruginosa or PBS control. Ten days post
immunisation the mice were infected with 100 µl intraperitoneally of live bacteria and
culled 6 hours post infection by schedule 1 and the peritoneal lavage and spleen were
harvested. The infection procedure was carried out at category 2 lab in IVC cages at
the BSU throughout the experiment.
2.3.3 Intraperitoneal infection
Age and sex matched mice were used. The mice were weighed at start of the
experiment before the intraperitoneal inoculation of 100 µl of 106 CFUs of P.
aeruginosa, Escherichia coli, Staphylococcus aureus or sterile PBS. The mice were
checked every 2 hours after the inoculation. The infected animals that appear to have
reached the humane end point were culled according to the schedule. Mice were

63
culled at determined time point post infection. The spleen and/or peritoneal lavage
were harvested.
2.3.4 Culling and Sample collection
Mice were culled using an approved schedule 1 of the Animals (Scientific Procedures)
Act 1986 method. They were administered an intraperitoneal injection of
Rompun/Ketamine (>340 mg/Kg of mice). The death of the animal was confirmed by
cervical dislocation. The body of the culled mice were sprayed with 70% ethanol
before initiating the dissection and a sterile surgical kit was used to extract the
required organs.
2.3.5 Peritoneal lavage
Peritoneal lavage was collected by injecting 5ml of sterile ice-cold endotoxin free PBS
into the mice abdominal cavity, using a 5 ml syringe and a 21-gauge needle to avoid
disruption. The abdomen was gently massaged. A small incision in the peritoneal was
made to collect the lavage into a 50 ml falcon tube. The samples were conserved on
ice until taken to the lab. The obtained lavage was maintained on ice until processing.
An aliquot of the lavage was removed for quantification of the bacterial burden by
serial dilution and plating on the appropriate agar. The remaining peritoneal lavage
was spun at 300g for 5 minutes at 4oC. The supernatant was removed and frozen at
-80°C until required for cytokine analysis. The pellet was resuspended in PBS and
the cells counted using an automated cell counter. The remaining cells were
centrifuged at 300 g for 5 minutes and resuspend in Flow buffer (PBS, 10% FCS) at
room temperature and processed for flow cytometry analysis.
2.3.6 Spleen
Spleens, which are located in the upper right quadrant were harvested into individual
50ml falcon tube containing 30 ml of endotoxin-free sterile PBS and kept on ice until
it reached the lab, using sterile forceps the organ was transferred to a cell strainer
fixed on top of a 50 ml falcon tube. The samples were conserved on ice until taken to
the lab. Using the plunger from a 5 ml syringe the tissue is macerated and the cells
passed through a 70µm nylon cell strainer (Thermo Fisher Scientific) to generate a

64
single cell suspension of splenocytes. The splenocytes were collected by rinsing the
cell strainer with a total of 5ml of PBS throughout the process. The 50 ml falcon tube
containing the obtained cell suspension was filled with cold PBS and was spun at
300g for 10 min at 22˚C. The remaining cells were centrifuged at 300 g for 5 minutes
and resuspend in Flow buffer(PBS, 10% FCS) and stored at room temperature for
flow cytometry analysis.
2.3.6.1 Aseptic splenocytes isolation
The mice were sacrificed by CO2 and the spleens were aseptically collected from
C57BL/6 mice (sham immunised and heat killed P. aeruginosa immunised) using
sterile instruments and placed in PBS containing penicillin and streptomycin and the
container placed on ice. Inside the tissue culture hood the spleens were mashed using
5m syringe plunger and a 70 µm cell strainer (Thermo Fisher Scientific Gibco TM)
with the plunger from a 5 ml syringe, and the cells collected in a 50 ml falcon tube and
toped up with 20ml of media containing PBS plus Penicillin and streptomycin. The
obtained single cell suspension was spun at 400g for 10 minutes, the pellet was
resuspended in 2ml of red blood cell lysis buffer ACK for 2 minutes to lyse the red
blood cells at the end of 2 minutes the falcon tube was filled with 20 ml of PBS
containing the antibiotics, the falcon tube inverted to mix thoroughly and spun at 300g
for 10 minutes, the supernatant removed and the tube filled again with 10 ml PBS-PS
and spun for 10 minutes at 300g. The cells were resuspended in 1 ml of the same
medium and counted. The cells were adjusted to 3.5x10⁶ cells per ml. Viability of the
isolated cells was evaluated by trypan blue exclusion and was determined as greater
than 80%.
2.3.7 Bone marrow
Mice were euthanized using CO2. The mouse surface was sprayed with 70% ethanol.
An incision was made to the abdomen to remove the skin and expose the abdomen
and the legs muscles. The legs were freed from the muscles using scissors; next the
legs were dislocated from the hip joint. The bones were placed in a sterile petri dish
containing cold RPMI 1640 supplemented with 10% FBS and 1%
penicillin/streptomycin. The remaining muscles from the femur and tibia were
removed using a scalpel, and the bones separated at the knee joint. The completely
muscle free bones were sterilised by immersion inside of a petri dish containing 70%

65
ethanol. The sterilised bones were washed in sterile PBS to wash off the ethanol. The
extremities of the bones were cut off using a scissors and kept in a sterile petri dish.
To flush the bone marrow out of the bone, a 25-gauge needle and a 1 ml syringe filled
with RPMI supplemented with 10% FBS and EDTA were used (3-4 flushes). The
flushed bone marrow were collected in a 50 ml Falcon tube and HBSS++ media was
added up to 30 ml and allowed to settle. The 50 ml falcon tube containing the obtained
cell suspension is filled with cold HBSS and was spun at 300g for 10 min at 22˚ C.
The supernatant was discarded, and the obtained pellet resuspended in to 2ml of red
blood cells lysis buffer (see appendix 1.8) for 2 minutes, spun again and resuspended
in HBSS and 10 µl removed for cell count.
2.3.8 Isolation of bacterial colonies
The metal loop and the rim of the tube were flamed before spreading the inoculum.
Twenty microlitres of the inoculum was pipetted on the previously labelled plate and
with the help of a loop the inoculums were spread over to the first quadrant of the
plate, the plate was placed in the bench, the loop was re-flamed and used to streak
the second quadrant. The loop was crossed over half of the first quadrant and then
moved into the empty second quadrant using the back-and-forth pattern. The
procedure was repeated for the third and fourth quadrant. The plates were incubated
overnight.
2.4 Single cell suspension
A single cell suspension was prepared by placing a 70μm cell strainer on top of a
50ml conical tube and pressing the spleen through a 70μm cell strainer using a
plunger end of a 5 ml syringe to make the cell suspension. The cell strainer was
washed with 5 ml of PBS. The conical tube containing the cell suspension was
centrifuged at room temperature for 10 minutes at 400 g. The supernatant was
discarded, and the cell pellet resuspended in 2ml of ACK lysis buffer (see appendix
1.8).

66
2.4.1 Red blood cell lysis
The red blood cells from the harvest organs such as spleen were lysed using red
blood cells lysis buffer. The pellet obtained from a single cell suspension was
resuspended in to 2ml of red blood cells lysis buffer (see appendix 1.8) which
contains ammonium-chloride-potassium (ACK) which does not cause a lot of harm to
lymphocytes in the single cell suspension, incubated at room temperature for 2-3
minutes. After the incubation time 10ml of 1x PBS was added to stop the lysis. The
cells were pelleted by centrifugation at 400g for 10 minutes, the supernatant was
removed, and the pellet resuspended in endotoxin-free PBS and the cells counted
using an automated cell counter (EVE, NanoEnTek).
2.4.1.1 Cell counting
The cell populations within the single cell suspensions prepared were analysed using
flow cytometry. To count the cells 10 µl of the cell suspension were mixed with 10 µl
of trypan blue. Then 10 µl of the mixture was loaded into a countess cell counting
slide (EVE NanoEntek, USA) and loaded into the cell counter to obtain the number of
live cells/ml for analysis. The image displayed in the screen is adjusted to better
differentiate the live cells from the dead cell, live cells show a bright spot in the middle
which is absent on the dead cells because they uptake the trypan blue staining. With
that countess the cells are automatically counted, and the obtained number of live
cells is calculated taking into account the dilution factor. The counted cells were
plated for staining/cultured according to the experiment being carried out. The
dilutions were considered during the cell count.
2.4.1.2 Single staining controls
Each experiment included an unstained control to assess auto-fluorescence and the
compensation single stained controls using either compensation beads or cells.
Where appropriate, an isotype control antibody of the same immunoglobulin as the
test antibody, but without specificity to the sample to detect non-specific binding was
included. All the controls were treated in the same way as the as the samples to be
analysed. For compensation purposes, single staining controls were made to correct
any spectral overlap that may occur during the analysis. UltraComp eBeads
(eBioscience, UK) were prepared by adding one drop of beads to the wells on the 96

67
well plate and mixing it with 1 µl of antibody for each one of the fluorophores used in
the experiment and 50 µl of flow buffer. The samples were incubated for 10 minutes
at room temperature in the dark, washed with flow buffer to remove any unbound
antibody by centrifugation at 300 g for 10 minutes and resuspended in 100 µl of 2%
paraformaldehyde (PFA) in PBS.
2.4.1.3 Fc receptor blockage
To avoid non-specific binding, 100 µl of Foetal Calf Serum (FCS) were added to the
cells in the 96 well plate. The plate was incubated for 10 minutes at room temperature
to block Fc. At the end of the 10 minutes 100 µl of flow buffer (PBS, 10% FCS) were
added and the plate spun at 300 g for 10 minutes, the cells were washed with 100 µl
of flow buffer to remove any residual FCS and stained for surface markers.
2.4.1.4 Extracellular staining
Cell surface staining for flow cytometric analysis was used to study surface proteins
at a single cell level on a heterogeneous population of cells within a single staining
population was performed plating 100µl of cell from the single stained solution on an
assay plate and spun for 10 min at 400g. The supernatant was removed from the
wells by quick flicking the plate. Using a multichannel pipette 200 µl of flow buffer
was added to each well to wash. The plate was spun as previously, and the
supernatant removed. Unstained control wells were resuspended in flow buffer and
the other samples with the desired panel of antibodies. The plate was incubated in
the dark for 30 min. While cells are incubating, the single-stained compensation
controls were made for each antibody using Ultracomp eBeads. The plate was
centrifuged for 10 min at 300 x g, the supernatant removed, and the wells washed
twice with flow buffer. When biotinylated antibodies were used it was necessary to
add an extra staining step with streptavidin APC-Cy7. The streptavidin binds to the
biotin conjugated antibody allowing the detection of the antibody in question. After
adding the streptavidin, the cells were incubated for 30 minutes, at room temperature
in the dark. After the incubation the cells were washed with 200 µl of flow buffer to
wash any unbound antibody by centrifugation at 300 g for 10 minutes, twice. The cells
were then resuspended in flow buffer containing 2% PFA fixating agent. The fixed
cells were stored at 4°C until run on the flow cytometer (BD Biosciences, UK).

68
2.4.1.5 Intracellular staining
Intracellular staining of lymphocytes for flow cytometric analysis were used for
analysis of intracellular cytokines or transcription factors of a single cell to identify
different subsets changes on proteins levels as well as to identify changes on cytokine
production within the PBS and the heat killed bacteria immunised groups. Single-cell
suspensions were prepared from spleen and after the cell count 100µl of cells was
transferred into each well of the round bottom plate. The plate was spun at 400g for
10 minutes at room temperature, the supernatant was poured off and the pellet
resuspend in 100µl of surface antibody, mixed and incubate for 20 minutes in the
dark, at the end of the 20 minutes 100µl of flow buffer were added, the plate was
spun, the supernatant removed, 100µl of flow buffer added and centrifuged. If
biotinylated antibodies were used 100µl of streptavidin were added to the appropriate
well’s and incubated for 30 minutes, at the end of the 20 minutes 100µl of flow buffer
was added, centrifuged, the supernatant removed, and the cells were resuspended
on 200µl of Fixation/Permeabilization (eBioscience, UK) buffer. Incubated for 2.5
hours at 2° to -8° C in the dark. After the incubation, the cells were resuspended in
200µl of 1X Permeabilization (eBioscience) buffer, the cells were centrifuged at 300
g for 10 minutes at room temperature, the supernatant discarded and the pellet
resuspended in 100µl of Permeabilization buffer, the antibody for intracellular staining
was added diluted in 100 µl of permeabilization buffer to the wells requiring staining
whereas 100 µl of only permeabilization buffer was added to the unstained controls.
The cells were incubated for 1 hour at room temperature in the dark. After the
incubation the cells were centrifuged and washed twice with 200 µl of permeabilization
buffer and spun at 300 g for 10 minutes at room temperature. Cell acquisition was
carried out using FACS Canto II flow cytometer (BD Bioscience, UK) and analysis
were performed with FlowJo software (BD Biosciences, UK).
The cells were stained for surface markers with the following monoclonal antibodies
for flow cytometry: CD90.2 FITC, CD3 PE, B220 PE, GR1 PE, F4/80 PE, CD11c PE,
NK1.1 PE, γδTCR PE or CD3e Biotin, B220 Biotin, GR1 Biotin, CD11b Biotin, CD11c
Biotin, NK1.1 Biotin, γδTCR Biotin, CD90.0 APC, Streptavidin APC-e fluor 780. Cells
were stained intracellularly after permeabilisation and fixation with Foxp3
Permeabilisation/Fixation Concentrate and Diluent (eBioscience) to stabilize the cell
membrane and protein’s crosslink to allow infiltration of antibodies after the

69
permeabilization, with GATA3, T-bet and RORγt. For cytokine staining, the cells were
incubated in supplemented medium with IL-22, IL-17 and IFN-y. A Becton Dickenson
FACS Canto II and after acquisition the FlowJo software program was used for
multiparameter data analysis. The gating strategy of selecting lineage-/CD90+ cells
was used to identify the ILCs. Statistical analyses were performed using Prism
GraphPad software v5.03.
2.5 Flow cytometry
A FACS Canto (Becton Dickenson, UK) and FlowJo software (BD Biosciences, UK)
were used for flow cytometry. The obtained cells were suspended at concentrations
of 106 to 107 per ml and 100 µl of the solution from each sample were plated on a 96
well round/flat bottom plate and analysed by flow cytometry. The staining panel almost
always included a panel for all the lineage markers, another one for the lineage
negative cells and the unstained control made of pooled unstained samples. Antibody
panels were selected to allow distinct identification of the lineage positive cell
population (macrophages, neutrophils, T cells, B cells, monocytes and NK cells) and
lineage negative cell population (ILCs) with appropriate isotype or fluorescence minus
one control. A sample of pooled or separated unstained control cells was also run
with each experiment to allow the parameters of the machine to be optimally set up.
After aliquoting all the samples into a 96 well plate, the plate was centrifuged at 300
g for 10 minutes at room temperature, the supernatant discarded by fast inversion
and the Fc block added and the cells stained as described in section 2.4.1.3.
From each well 100µl were removed and transferred to a 5ml round-bottom FACS
tube, vortexed and loaded on the cytometer for acquisition.
Flow cytometric analysis using directly conjugated anti-cytokine antibodies allows for
the measuring of two or more in situ cytokine production simultaneously on a single
cell level as well as at a population level. The flow cytometric analysis relays on the
fact that fluorescents tags such as fluorescent stained antibodies can be attached to
the cell’s surface or other products of the cell. The fluorescent markers are then
excited by the lasers to emit light at the designated wavelength, the amount and type
of fluorescence is what provides information about the type and size of the cell; that
light can then be detected and analysed. The FSC v SSC and fluorescent detectors
collect the light and convert it into electrical signals that can be analysed by computer.

70
After acquisition, the analysis of the expressed surface markers was carried out using
FlowJo software. A gating strategy of selecting lineage-/CD90+ cells was used to
identify the ILCs.
A flow cytometer consists of fluidics, lasers, optics, and electronics. Once in a flow
cytometer, the sample, a single-cell suspension, which is carried by sheath fluid
positioned within the cytometer, causes light scattering and fluorescence as the cells
pass through the laser beam. This light is gathered and directed through
photomultiplier tubes (PMTs), the optical component and finally expressed
graphically, as digital data, on a computer.
2.6 Gating strategy
Based on forward and side scatter, gates were drawn containing the cell population
of interest. The gates were drawn on the scatter plots to select the population to be
analysed on the experiment to be run, using forward scatter (FSC) and side scatter
(SSC) to be able to exclude dead cells and debris (low forward scatter and high side
scatter) and to identify the live cells for analyses. The data were exported from the
FACs canto, new file was created on FlowJo, and the compensation was applied after
creating the lymphocytes gate
After opening the BD software, a “New experiment” was selected and named, the
area, height and width was selected for the FSC and SSC, and the Log and area for
the colours. The compensation controls were created for each colour on the sample
to run and the gate adjusted for the unstained sample, the voltages were adjusted for
each individual colour on the panel to use so that the positive peak would be at 104.
The adjusted voltages were recorded and once the number of events to record has
been selected the samples to analyse were run, the analyser will detect and count
individual cells.
On the BD FACS CANTO I software, selected New experiment by clicking on the book
and named it, select for Area, Height, Width for FSC and SSC, also selected for Log
and area for each colour used in the experiment. Created the compensation controls
and drawn the gates for the unstained cells and adjusted the voltages for each colour
of the single stained control to position the positive peak at 104. Once the desired
voltage achieved started, the number of events to be recorded were chosen. Each
new specimen was created by clicking on the syringe and named it. For each

71
experiment, a new tube was created for each sample by clicking on the tube and
named it. On the right screen the histograms were drawn, one for each fluorophore
used.
2.6.1 Gating strategy for ILC cells
Figure 2.1 Representative gating strategy for spleen and peritoneal lavage ILCs
characterisation. Representative image of gating strategy from cells collected at 6 h
post infection with live P. aeruginosa. The live cells were gated by forward scatter
versus side scatter (FSC vs SSC). The CD90+ cells were gated as side scatter (SSC)
versus CD90+ from the lymphocyte gate and the CD90 positive cells were analysed
(same gates as contour plot at bottom).

72
2.6.2 Gating strategies for macrophages
Figure 2.2 Representative gating strategy for macrophages. The live bone
morrow-derived population of macrophages were identified by gating on forward
scatter versus side scatter (FSC vs SSC). The macrophages were gated as live cells,
CD45+ and F4/80+ versus CD11b+ from the lymphocyte gate (same gates as contour
plot at bottom).

73
2.6.3 Gating strategy for neutrophils
Figure 2.3 Representative gating strategy for neutrophils. The live spleen
population of neutrophils were identified by gating on forward scatter versus side
scatter (FSC vs SSC). The neutrophils were gated first as live cells, CD45+ and then
as Gr-1+ versus SCC from the CD45+ gate (same gates as contour plot at bottom).

74
2.6.4 Gating strategy for transcription factors
Figure 2.4 Representative gating strategy for transcription factors.
Representative image of cells collected at 10 days post immunisation with heat killed
P. aeruginosa from splenocytes. The live cells were gated by forward scatter versus
side scatter (FSC vs SSC). The CD90+ cells were gated as side scatter (SSC) versus
CD90+ from the lymphocyte gate, the CD90+ gate was further analysed for GATA3,
RORγt and T-bet transcription factors. From each gate drawn from the CD90+ gate a
selection of different transcription factors of interest was drawn.
`
2.6.5 Gating strategy for Cytokines
Figure 2.5 Representative gating strategy for cytokines. Representative image of
cells collected at 10 days post immunisation with heat killed P. aeruginosa from
supernatants. The live cells were gated by forward scatter versus side scatter (FSC
vs SSC). The CD90+ cells were gated as side scatter (SSC) versus CD90+ from the
lymphocyte gate, the CD90+ gate was further analysed for IFN-γ, IL-17A and IL-22
cytokines (same gates as contour plot at bottom). From each gate drawn from the
CD90+ gate a selection of different cytokines of interest were drawn.

75
2.7 Sample acquisition
The antibody-stained cells and the single stained controls were analysed on a FACS
Canto II flow cytometer (BD Biosciences, UK). The unstained controls were used to
set up the voltages for the forward and the side scatter. The unstained controls were
used to set up the negative population. At the end of the acquisition the experiment
was saved and exported to a file for further analysis.
Source: Adapted from Dr Rebecca Ingram protocol
Figure 2.6 Illustration of immunisation and sample processing. A single cell
suspension from a mouse immunised is prepared from day 10 post immunisation and
fluorescently labelled for analysis of ILCs by flow cytometry or prepared post infection
on a mouse previously immunised and plated for either bacterial count or ILCs
subsets and cytokine analysis.
2.7.1 Fluorescence-activated cell sorting (FACS)
This technique was used to quantify the expression of surface cell markers on
individual cell by using labelled antibodies. The labelled cells went through a channel
in a single stream; individual cells were separated in a single droplet and separated
according to their individual charge by an electric field. For FACS the cells were
labelled with fluorescent labelled antibodies and were individually separated based
on surface expression of the selected markers.

76
The cells in a single cell suspension were stained based on the ILCs surface markers
for CD90+ and lineage-. The cells were run through the cell sorter (BD FACS ARIA II)
where the cells with the desired fluorescence marker were tagged with an electrical
charge and are deflected into a separated tube. The cells of interest were individually
labelled with an antibody conjugated with fluorescent dye mouse antibody anti-CD90
conjugate FITC and mouse anti-lineage conjugate PE. The stained cell suspension
was resuspended in 1 ml of flow buffer, the tube containing the cells placed in the
instrument and the cells were sucked through a small nozzle to create the liquid
droplets containing a single cell. The passage of each cell through the laser beam the
light is scattered and the fluorescent dye of the cell were excited and emit
fluorescence. The scattered light was detected by sensitive photomultiplier tubes
which provided information about the size of the cell and the fluorescence emission
information about the cell surface marker.
Inside the cell sorter, the signals were transmitted to the computer and were used to
generate the electric charge, that were passed from the nozzle through the liquid
stream at the same time that the stream breaks up into droplets, each containing only
one single cell; the charged droplets were then deflected from the main stream of
droplets as they were passing between plates of opposite charge, and the positively
charged droplets were attracted to the negatively charged plate, and the negatively
charged droplets were attracted to the positively charged plate. The deflected droplets
containing cells were collected into tubes. This process allows for specific
subpopulations of cells, distinguished by the blinding of the labelled antibody to be
purified and separated from a mixed population of cells. The cells were labelled with
two fluorescent antibodies (PE and FITC), thus the data from the samples that were
labelled with two different fluorescent dyes were displayed in the form of a two-
dimensional scatter diagram or as a contour diagram, where the fluorescence of one
dye-labelled antibody were plotted against the fluorescence of the other antibody, with
the result that a population of cells labelled with one antibody can be further
subdivided by its labelling with the second antibody.
2.7.2 In Vitro Cytokine production
The cytokine production of splenocytes and FACS sorted ILCs was analysed for the
production of IFN-γ, IL-17 and IL-22 cytokines. These cytokines are known to have a
critical role in protecting the host against bacteria. Because ILCs are low expressed
in resting cells, the cells were activated, with PMA, to induce production and the

77
secretion blocked, with brefeldin A (BFA), to allow the accumulation of the proteins.
The cells were re-suspended in IMDM (X1) medium with Glutamine 2mM; containing
10% foetal bovine serum (FBS) and 1% penicillin 100 i.u./ml) and streptomycin
100µg/ml, the secretion inhibitory brefeldin A (10µg/ml) the positive controls Con A
(10ng/ml), PMA (10ng/ml) and HK-Pa 10⁴ dilution, dispensed into 12 wells plate at
2x10⁶ cells/ml. Factors such as of foetal bovine serum (FBS) were added to the growth
medium because of its high growth factor content, Penicillin and Streptomycin were
added to the growth medium to reduce the possibility of microbial infection. Then, 1
ml of the spleen cell suspensions were cultured in flat bottom, polystyrene culture
plates in triplicates with the cell number adjusted to 3.5x10⁵ cells/culture overnight at
37˚C under humidified atmosphere at 5% CO2 and 95% air atmosphere.
After the overnight incubation, the cells were pooled washed and seeded in a 96 wells
plate. The cells were surface stained for CD90 (APC) and Lineage markers (PE) and
for ILCs (CD90) and lineage (PE), followed by 30 minutes of permeabilization and
intracellular cytokine (IFN-γ, IL-17 and IL-22) staining plus fixation.
2.8 Enzyme-linked immunosorbent assay (ELISA)
The capture or sandwich ELISA were used for detection of murine IFN-γ, IL-17A and
IL-22 levels on supernatants, ELISA kits from eBioscience were used. The capture
antibody for the cytokine to be analysed was prepared in 1X Coating buffer were
prepared as in the manufacturer’s protocol and 100µl of the preparation added to each
well on a 96 well Elisa plate. The plate was sealed and left overnight to coat the plates.
After the overnight incubation the capture antibody was aspirated, and the plates
washed with washing buffer (1XPBS with 0.05% Tween-20) five times and blotted in
paper towel in between the washes. To block non-specific binding the wells were
blocked with 200µl/well of reagent diluent (1XPBS with 1% bovine serum albumin
(BSA) for one hour. After repeating the washing for three times with wash buffer and
blotting on paper towel between the washes, triplicates of two-fold dilution series of
standards of known concentrations and samples of unknown concentrations were
plated on a 96 well plate and left overnight incubation for maximum sensitivity. On the
next day, the wells were washed 4 times using 200µl of wash solution and 100µl of
detection antibody diluted in reagent diluents and the plates incubated at room
temperature for 1 hour. After one hour the capture antibody was removed by repeating
the washes as previously (X5, 1 min and 100µl of diluted Avidin HRP was added to
each well and incubated for 30 minutes in the dark). Another 5 washes were done,

78
allowing soaking for 1 minute per wash and 100 µl of TMB Substrate solution (OPD
and H2O2) added to each well and incubated for 20 minutes at room temperature in
the dark. 50µl of 2M sulphuric acid (Stop solution) was added to each well. The
samples turned yellow overtime; the amount of fluorescence formed after the
incubation of the enzyme with the substrate was measured at the end of the 15
minutes.
2.8.1 Plate reading and analysis
The plates were read at absorbance of 450nm and 570 nm using a microplate
spectrophotometer (Biotek, USA). The wells with the higher amount of primary
antibody were able to also capture higher amount of the secondary antibody and thus
also able to produce more fluorescence. The standard curves and sample
concentration of the optical densities were calculated using Microsoft Excel and
GraphPad Prism 5.
2.9 Magnetic cell isolation
The importance of ILCs during pathology has been discussed in various studies (Kim
et al., 2017; Dzopalić et al., 2019), as mediators of inflammation and also as an
important player for tissue repair and homeostasis (Mohammadi et al., 2018; Yazdani
et al., 2015b). Due to their ample involvement in immune diseases, ILCs can be
regarded as a potential target to treat or to prevent the development of some if not
many of the immune diseases. But, before the different subsets of ILCs can be used
it is important that they can be reliable isolated since each subset is known to act
upon a complete different disease (Ebbo et al., 2017b). In this chapter a method to
obtain high number of cells as well high level of purity was explored using techniques
such as negative and positive isolation of the desired population but it was not
possible to obtain a good level of purity and for the next experiments cells were sorted
by FACS.
FACS sorting is a very useful technique to isolate intact cells but it has de
disadvantage of allowing only the isolation of a small number of cells. For the isolation
of many cells magnetic beads isolation using coupled with monoclonal antibodies
against a surface marker to a population of interest was the preferred method. The
process of magnetic cell isolation using magnetic beads is a technique widely used to

79
achieve a pure positive or negative separation of a given homogeneous population
from a heterogeneous cell suspension to have a better knowledge of how one specific
population function on a given circumstance. This technique has been successful
used for isolation of stem cells, HIV infected cells and cancer cells.
The antibody coated beads were incubated with the heterogenous single cell
suspension containing the population of interest for the experiment and at the end of
the incubation the tube containing the mixture of the cells plus the magnetic beads
were placed in the magnet and the magnetic field of the magnet attracted the beads
and they get stuck in the walls of the tube with the rest of the cells suspended in the
media. The cells in the suspension were removed by inversion and the positively
isolated cells were recovered when the tube was removed from the magnet.
The cells are separated based on their surface markers and the percentage of specific
cells are calculated by dividing the number of cells from a population of interest by the
total number of cells separated and the recovery by comparing the number of the
recovered cells is compared to the number of target cells in the original suspension.
2.9.1 Washing the beads
The vial containing the beads to use were vortexed for 30 seconds before using, the
amount of beads needed for the sample were washed in 1 ml of isolation buffer, the
tube containing the beads was placed in the magnet, the supernatant discarded and
the beads resuspended in the same initial volume after removing the tube from the
magnet.
2.9.2 Preparing the samples
The titrated amount of the required antibody was added to the cell suspension, mixed
and incubated for 30 min in the cold room with rotation, at the end of the 30 min the
cells were washed with 2ml of Isolation Buffer and spun at 350g for 8 minutes. The
supernatant was discarded, and the cell pellet resuspended in 1ml of Isolation Buffer.
The tube was placed in the magnet for 1minute and the supernatant discarded, the
tube was removed from the magnet and 2ml of Isolation buffer added, the washing

80
was repeated, the supernatant discarded and 1ml of the washed beads added to the
cell sample, resuspended and incubated for 20 minutes (positive isolation) or 30
minutes (depletion) with rotation. After the incubation, the tube was placed in the
magnet for 2 minutes.
2.9.3 Negative isolation
The negative isolation separates the unwanted cells by from the heterogeneous cell
suspension, yielding an untouched population of the desired cells. The supernatant
was transferred to a new labelled tube and continued as in the manufacture’s protocol.
2.9.4 Positive isolation
The positive isolation separates the target cells from the heterogeneous population.
With the tube in the magnet, the supernatant was removed and discarded. The tube
was removed from the magnet, 1 ml of isolation buffer added, mixed by pipetting and
the tube placed in the magnet for 2 minutes (repeated x2). The cells were
resuspended in flow buffer and run on the flow cytometer straight after.
2.10 Purity analysis using different methods of magnetic isolation
The experiment was carried out to compare different strategies to obtain a much purer
population of CD90+ cells from a single cell suspension of splenocytes by magnetic
isolation.
2.10.1 Magnetic labelling
A single cell suspension was prepared as in section 2.5.1. The isolated splenocytes
were labelled with biotinylated antibody, which recognises the subpopulation of
interest. The cells were washed to remove the excess antibody and centrifuged. The
cell pellet was re-suspended in FACS buffer containing the magnetic PE beads to
bind to the cells and incubated, with biotinylated antibodies were used, the cell
suspensions were incubated with biotinylated antibodies and streptavidin particles
81
were added to the cell suspension to bind to the biotinylated antibody on the cells and
incubated.
2.10.2 Magnetic labelling for negative selection
The buffers were prepared and place on ice: Cell-staining buffer: Phosphate Buffered
Saline and 10% heat activated foetal calf serum. A single-cell suspension was
aseptically prepared from spleen; the clamps were removed passing the suspended
cells through a 70µm nylon cell strainer. The cells were counted using a countess
machine (eBioscience, UK) and resuspend in cell-staining buffer at concentration of
2x10⁷/cells/ml. The biotinylated antibody was added at the appropriated concentration
and incubate on ice for 15 minutes. The labelled cells were washed with an excess
volume of FACS buffer and the supernatant was aspirated.
The BD IMag™ Streptavidin Particles Plus were vortexed and add 50 µl of particles
were used for every 1 x 10⁷ total cells. The solution containing the cells and the
magnetic particles were mixed and refrigerate for 30 minutes at 6°C -12°C. The
labelling volume was brought up to 2 x 10⁷ cells/ml with the FACS buffer. The labelled
cells were transferred to a 12 x 75 mm round-bottom test tube, with the maximum
volume of 1.0 ml. The tube containing the positive fraction was placed on the Cell
Separation Magnet horizontal for 8 minutes. With the tube on the Cell Separation
Magnet and using a glass Pasteur pipette, the supernatant were carefully aspirated
the supernatant that is the depleted fraction and place in a new tube. The cells were
washed and placed on the Cell separation magnet another two times. The tube
containing the positive-fraction was removed from the Cell Separation Magnet, and
add 1X BD IMag™ buffer and 1 ml of FACS buffer was added to resuspend the
positive fraction by pipetting up and down 10 to 15 times and the tube was place back
on the Cell Separation Magnet for 8 minutes. With a new Pasteur pipette, the
supernatant were carefully aspirated and added to the previous obtained depleted
fraction, the tube was placed on the Cell Separation Magnet for another 8 minutes,
the supernatant was aspirated, and the cells stained and analysed by flow cytometry.
The combined depleted fraction which contains cells with no bound antibodies or
magnetic particles is the cells that were used for analysis by flow cytometry if the
depleted cells are the population of interest as negative selection.

82
Figure 2.7 Lineage negative selection only (diagram provided by Dr Rebecca
Ingram)
2.10.3 Magnetic labelling for positive selection
The obtained positive fraction cells remaining in the original tube from section 2.9.4
were resuspended in FACS buffer, the tube was placed on the Cell Separation
Magnet for another 8 minutes, the supernatant was aspirated, and the cells stained
and analysed by flow cytometry.
The BD IMag™ Streptavidin Particles Plus were vortexed and add 50 µl of particles
were used for every 1 x 10⁷ total cells. The solution containing the cells and the
magnetic particles were mixed and refrigerate for 30 minutes at 6°C -12°C. The
labelling volume was brought up to 2 x 10⁷ cells/ml with the FACS buffer. The labelled
cells were transferred to a 12 x 75 mm round-bottom test tube, with the maximum
volume of 1ml. the tube containing the cells was placed onto the Cell Separation
Magnet and incubate for 8 minutes. With the tube on the Cell Separation Magnet, the
supernatant was carefully aspirated. The supernatant is considered the negative
fraction. The tube was removed from the Cell Separation Magnet and 1 ml of FACS
buffer were added to the cell pellet. The cells were gently resuspended by pipetting
up and down, and the tube was returned to the Cell Separation Magnet for another 4
minutes. With the tube on the Cell Separation Magnet, the supernatant was carefully
removed (wash fraction), the cells were washed and placed on the Cell separation
magnet another two times. After the final wash step the tube were removed from the
Cell Separation Magnet and the positive fraction resuspended in FACS buffer, stained
and analysed by flow cytometry. For further negative isolation proceed as in section
2.9.3.
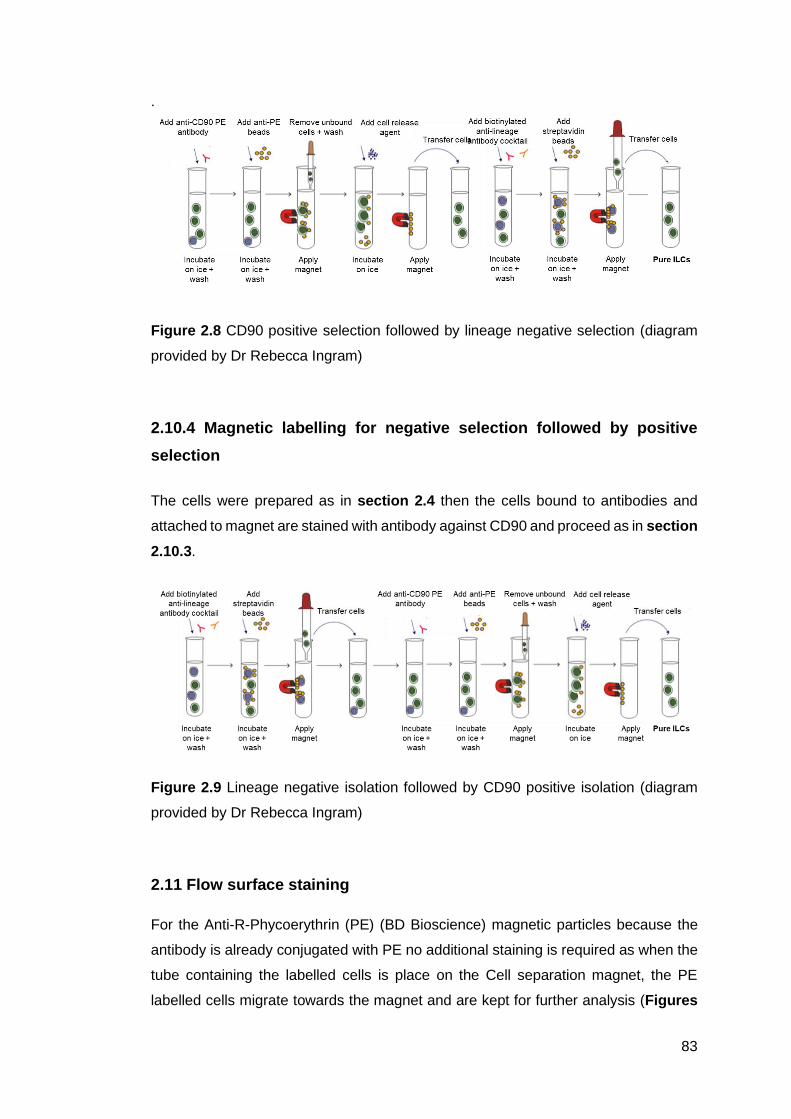
83
.
Figure 2.8 CD90 positive selection followed by lineage negative selection (diagram
provided by Dr Rebecca Ingram)
2.10.4 Magnetic labelling for negative selection followed by positive
selection
The cells were prepared as in section 2.4 then the cells bound to antibodies and
attached to magnet are stained with antibody against CD90 and proceed as in section
2.10.3.
Figure 2.9 Lineage negative isolation followed by CD90 positive isolation (diagram
provided by Dr Rebecca Ingram)
2.11 Flow surface staining
For the Anti-R-Phycoerythrin (PE) (BD Bioscience) magnetic particles because the
antibody is already conjugated with PE no additional staining is required as when the
tube containing the labelled cells is place on the Cell separation magnet, the PE
labelled cells migrate towards the magnet and are kept for further analysis (Figures

84
2.13, 2.14, 2.15). For the biotinylated magnetic particles however, the cell was
incubated for 30 minutes with streptavidin to bind to the biotinylated antibody for flow
cytometry analysis (Figures 2.10, 2.11 and 2.12).
Figure 2.10 Lineage negative magnetic isolation. Splenocytes from C57BL/6N
mice were collected and mashed together into a 70μl cell strainer using a plunger.
The data obtained from an experiment using different cell separation magnet but the
same amount of antibody and magnetic particles, shows that using the Stem cell
magnet yields a higher percentage of Lineage negative (Lin-) cells (n=3).

85
Figure 2.11 Percentage of Biotin positive (Lineage+) cells remaining after the
magnetic separation. Splenocytes from C57BL/6N mice were collected and mashed
together into a 70μl cell strainer using a plunger. The percentages of Lineage+ cells
were still high after the separation using magnetic particles, the highest yields of
CD90+ cells (Figure 5.9.1) also had the highest percentages of Lineage positive cells
(n=3).
Figure 2.12 Magnetic isolation with different amounts of antibody and magnetic
particles. Splenocytes from C57BL/6N mice were collected and mashed together into
a 70μl cell strainer using a plunger, the data was obtained by using the same magnet
(Stem cell magnet) but different amount of antibodies and beads, 10μl of antibody and
100μl of magnetic particles, 10μl of antibody and 200μl of magnetic particles, 20μl of
antibodies and 100μl of magnetic particles and 20μl of 200μl of magnetic particles.
The result from the experiment shows that the highest amount of antibodies with the
highest amount of magnetic particles (n=3).

86
Figure 2.13 Dynal beads and Dynal cell magnetic separator. Magnetic isolation of
splenocytes from C57BL/6N mice were collected and mashed together into a 70μl cell
strainer using a plunger. Data from the magnetic isolation using 20μl of antibody and
200μl of magnetic particles and different isolation method shows that the positive
isolation of CD90+ cells yields higher amount of CD90+ cell compared with the
negative isolation of the same cell population (n=3).
Figure 2.14 Dynal beads and Stem cell magnetic separator. Magnetic isolation of
splenocytes from C57BL/6N mice were collected and mashed into a 70μl cell strainer
using a plunger. Data from the magnetic isolation using 20μl of antibody and 200μl of
magnetic particles and different isolation method shows that the positive isolation of
CD90+ cells yields higher amount of CD90+ cell compare with the negative isolation
of the same cell population (n=3).
CD90 PE Positive Isolation
CD90+ CD90-0
20
40
60
80
100
% o
f C
D90+
Lineage Biotin Positive Isolation
CD90+ CD90-0
20
40
60
80
100
% o
f C
D90+
CD90 Before Lineage
CD90- CD90+0
1
2
3
4
5
50
100
150***
% o
f C
D90+
CD90 After Lineage
CD90- CD90+0
20
40
60
80
% o
f C
D90+

87
Figure 2.15 Lineage biotin beads optimisation. Splenocytes from C57BL/6N mice
were collected and mashed together into a 70μl cell strainer using a plunger. Testing
different types of beads and same amount of antibody using 20µl of antibodies and
200µl of biotin beads for positive isolation of lineage positive cells, amount of lineage
positive cells isolated were much higher for the combination of Stem cells beads for
positive isolation of CD90+ cells followed BD beads for negative isolation of lineage-
cells compared with positive isolation of lineage negative cells followed with positive
isolation of CD90+ cells and same amount of lineage negative cells isolation only with
BD beads (n=3).
2.12 ILC2 isolation
Using anti ILC2 magnetic beads from STEMCELL, EasySep enrichment kit ILC2 cells
were negatively selected yielding an untouched population of ILCs cells (Figure 2.17).
The single cell staining was prepared as in section 2.4. A sample of cell suspension
of 5x10⁷ cells/mL were placed in a polystyrene round-bottom tube, 50µl of the
enrichment cocktail (EasySepTM Mouse ILC2 enrichment cocktail) were added to the
sample, mixed and incubated at room temperature (RT) for 5 minutes, at the end of
the 5 minutes the RapidSpheres (EasySepTM Streptavidin RapidSpheres) were
vortexed for 30 seconds and added at 75µL/mL of sample, incubated at RT for 5
minutes. After the incubation 2.5mL of PBS medium containing 2% FBS and 1mM
EDTA, pipette up and down 3 times and the tube with the suspension placed in the
magnet (EasySep Magnet) for 3 minutes. At the end of the 3 minutes the magnet
containing the tube were inverted and the enriched cell suspension poured into a new
14 mL polystyrene tube. The tube was removed from the magnet, 2.5 mL of medium

88
added to the tube and the suspension pipetted up and down 3 times. The tube was
placed into the magnet for 3 minutes. At the end of the 3 minutes the magnet
containing the tube were inverted and the enriched cell suspension poured were
added to the tube containing the first fraction. The obtained fraction was stained for
ILC2 (Lin- ICOS+ST2+) flow cytometry analysis as in section 2.4.1.5.
ILC2- ILC2+0
1
2
50
100
150
ILC
s
Figure 2.16 ILC2 magnetic isolation by EasySep enrichment kit for ILC2.
Splenocytes from C57BL/6N mice were collected and mashed together into a 70μm
cell strainer using a syringe plunger. The number of ILC2 positive cells isolated using
the ILC2 kit less when compared with the ILC2 negative cells. A much greater
proportion of ILC2 negative cells were found in the ILC2 positive fraction (n=3).
2.13 Sample analysis
The experiment’s data were analysed using the FlowJo software (BD Bioscience,
UK). The exported data was uploaded onto the FlowJo software. Different groups
were created for each group of samples with different treatment. After the live cells
gate was drown, compensation was applied using the single stained controls.

89
2.14 Statistical analysis
Statistical analysis was performed using Prism Software GraphPad version 5. The
paired t test was used for comparison between two groups. Comparisons of more
than two groups within the experiments were performed by One-way ANOVA. The
data were presented as mean ± standard error of mean (SEM) values and significance
assessed by non-parametric Mann-Whitney test or Friedman test with post-hoc
Dunn’s multiple comparison test. The survival analysis curve was plotted using Log
rank (Mantel-Cox) test. P value of 0.05 was considered statistically significant.
2.15 Study approval
All animal experiments were performed according to national and institutional animal
care and ethical guidelines and were approved by the local authorities

90
CHAPTER 3 - CHARACTERISATION OF INNATE
LYMPHOID CELLS MEMORY

91
3.1. Introduction
Different subsets of ILCs have different cytokine profile and vital roles in the
maintenance of tissues, protection and defence when activated. Following activation
ILCs change their phenotypically and transcription factor profile. Thus, the three
subsets have distinct differences that allow them to facilitate a range of immune
responses. One area in which the subsets differ is their expression of their
transcription factor and some cell surface markers (Vivier et al., 2018b) as these
extracellular membrane proteins allow the cells to sensor and respond to different
internal stimuli (Killig et al., 2014).
The ILC1s includes NK cells, the cytotoxic subset which express the activation
receptor NKp46 (Panda & Colonna, 2019). In contrast, non-cytotoxic ILC1s express
CD4 which acts as a co-receptor for MHCII and the homing receptor CCR7
(Mazzurana et al., 2018).
The group ILC2 express surface markers such as ICOS (Vivier et al., 2018b) which is
involved in the activation of intracellular signalling molecules that are able to avert
apoptosis (Maazi et al., 2015), MHCII (Trabanelli et al., 2019), CD25 (Mohammadi et
al., 2018), c-kit (Mohammadi et al., 2018), IL-7R (Trabanelli et al., 2019), SCA1
(Mohammadi et al., 2018) and ST2 (Trabanelli et al., 2019) which is a constituent of
the IL-33 receptor (Elemam et al., 2017a).
In the ILC3 population, the chemokine receptor CCR6 has been reported to be
expressed on IL-17 producing cells (Ardain et al., 2019), whilst IFN-γ producing
express IL-23R (Mohammadi et al., 2018) and NKp46 (Klose & Artis, 2016).
Furthermore, expression of the co-stimulatory CD40 has been declared and promotes
interaction between ILC3 and B cells (Song et al., 2015). Expression of MHCII by ILC3
has also been described and this allows these cells to present antigen to the CD4+
cells during the activation of an immune response (Roan et al., 2016). These cells
also express CD62L, c-kit, CD4 and IL-7R (Yazdani et al., 2015b) and the IFN-γ
producing IL-23R (Mohammadi et al., 2018).
The NK cells are able to detect abnormal changes in the host’s environment, such as
virus infected cells. NK cell killer activation receptors (KAR) are involved in the cell’s
activation to kill abnormal or malignant cells, infectious agents and damaged cells (Di
Vito et al., 2019). Cells which do not miss any of its components are spared from
destruction by NK cells due to the action of killer inhibition receptors (Castriconi et al.,
2004), these cells produce IFN-γ and TNF-α, two proinflammatory cytokines

92
(O’Sullivan et al., 2015). Memory have been reported to express KLRG1, a marker
similar to the effector CD8+ T cells (Sun et al., 2011).
Whilst surface markers are commonly used to examine the development and function
of lymphocyte cells, but they do not accurately identify lymphocyte subset populations
or their function (De Grove et al., 2016). In work conducted in the lab, the existing
protocols for transcription factor staining in T cells do seem effective for ILC cell
activation resulting in cytokine production, expression of cytokine receptors and cell
proliferation. Intracellular staining of transcription factors is used to precisely identify
the different subsets. The permeabilization process allows the movement of staining
antibodies from the exterior to the interior of the cell’s nuclei. Cytokines are important
for immune response as they can be rapidly produced after a cell has been activated
(Mortha& Burrows, 2018). The use of intracellular cytokine staining followed by
detection by flow cytometry is a valuable tool to study the variations in cytokine after
cell activation (Smith et al., 2015). Both cell surface staining and intracellular cytokine
staining can be used for phenotypic analysis. Intracellular staining of transcription
factors is used to provide further information about the cellular subset (Nomura et al.,
2008). The permeabilization process allows the movement of staining antibodies from
the exterior to the interior of the cell’s nuclei (Lyons, 2000). Taken together, all this
information can help to differentiate ILC response at cellular and at molecular level.
Without doubt, the world of advanced individual cell characterisation techniques still
has a lot to discover but new promising technologies such as FlowSOM are now in
use that allows for a large number of cells and cell population to be analysed without
having the concern of spectral overlaps between fluorophores, the need for
compensation and cell damage.
Lymphocyte cells are stimulated and as a result influence the immune system through
the production and release of cytokines (Zook & Kee, 2016). Low doses of exogenous
cytokines (IL-12, IL-15, Il-18 and IL-23) from the common-γ chain family were used to
boost the proliferative responses to bacterial infection for intracellular cytokine assay
(ICC). IL-15 and IL-18 enhance IFN-γ production. These cytokines are important for
T-cell expansion, function and survival (Schluns & Lefrançois, 2003).
It is known that T cells express different phenotypic markers at different stages of the
immune response (Harari et al., 2004). To identify changes during a disease state
analysis of membrane phenotype is used by using fluorescent labelled antibodies to
identify and quantify by flow cytometry. Flow cytometry is a technique that allows for
the analysis of changes that occurs at cellular level (O’Donnell et al., 2013), due to
93
the infective effect of P. aeruginosa, this bacterium were used in this particular
experiment with the objective to identify and link the changes in proteins at the cell’s
surface with its function, and also for the effect of different stimulus or different classes
of bacteria.
ILCs recognise and respond to changes through the interaction of its surface
molecules with the antigen, that can be soluble and fragmented antigens (Nau et al.,
2014). These cell surface molecules are antigen or at the most class specific, a
feature that explains why each one of the different subsets of ILC responds to a
particular type of microorganism or allergen (Van Acker et al., 2017).
3.1.1 Intracellular pathogens
The intracellular pathogenic bacteria that gain access to the host’s cells cannot be
eliminated by the phagocytic cells of the innate immune system and are able to
survive inside the phagosome by modifying the internal environment (Barisch &
Soldati, 2017) thus an intervention by the cytotoxic cells of the innate and or the
adaptive immune system is required.
Group 1 ILCs plays an important role in the elimination of intracellular bacteria, viruses
and parasites as a predominant source of IFN-γ and TNF during intracellular infection
by recruiting inflammatory myeloid cells to control de disease, such control is obtained
by the recruitment of myeloid cells (Yazdani et al., 2015b).
3.1.2 Extracellular parasites
Group 2 ILCs secrets type 2 cytokines IL-13 and IL-15, IL-13 which is very important
to respond to extracellular parasites by inducing muscle contraction, one study has
found that the production of IL-13 facilitates the expulsion of intestinal parasites
(Yazdani et al., 2015b). In the lungsILC2 is also known for increasing mucus
production and promoting tissue repair (Colonna, 2018).

94
3.1.3 Extracellular bacteria and fungi
Bacteria are found in the natural environment such as soil and water (Desmarais et
al., 2002) but they are also found in the host’s extracellular and intracellular
compartments as commensal or pathogenic species (De Kievit & Iglewski, 2000). The
extracellular pathogenic bacteria are usually eliminated by the phagocytic cells but
some are able to survive inside the phagosome (Barisch & Soldati, 2017).
ILC3s are involved in mucosal homeostasis and in its absence there is usually poor
control of bacterial and fungal infections, these responses can be promoted by
dendritic (DC) cells derived IL-23 (Hepworth et al., 2015). DC cells act via lymphotoxin
signalling and are also important for IgA production (Massacand et al., 2008). That
interaction of ILCs with other immune cells can be exploited therapeutically to treat
intestinal inflammatory diseases (Tait Wojno & Artis, 2016). ILC3s respond to
bacterial infection by producing IL-22, which acts on non-hematopoietic cells (Rankin.,
et al., 2016). ILC3s present in oral mucosa produce IL-17 in response to fungal
infection (Hepworth et al., 2015). Both IL-17 and IL-22 can act alone or together to
promote immunity, production of chemokines to recruit neutrophils and tissue
homeostasis and repair a process necessary to prevent reinfection (Rubino et al.,
2012). The acute inflammatory response is a key factor in the formation of an effective
immune response (Kaur & Secord, 2019).
In summary, the inflammatory mediators produced by the activated immune cells can
sometimes also activate cells that are not involved in the current infection as well as
causing the activation of lower-affinity self-reactive lymphocytes leading to the
initiation of an inappropriate immune response since they can cause destruction of
tissues. Activated ILCs are important for protection against cancer cells, fungi,
bacterial and viral pathogens fact that makes ILC family a perfect candidate for new
therapies.
The aim of this chapter was to use flow cytometry and computational analysis for
identification of phenotypical and functional changes occurring through activation and
effector stages to gain a better understanding of ILCs. In this chapter was possible to
identify phenotypical markers associated with different ILCs and markers that are
shared for different subsets through flow cytometry and a better identification of
subsets that co-express some of the markers through the combined use of FlowSOM
and t-SNE analysis.

95
3.2 Aims
Since each response depends on the activation of the appropriate receptor to tailor
the correct response, this chapter aims to examine:
• To examine the expression of surface markers on ILCs following
immunisation
• To establish the cytokine profile of stimulate naïve and memory ILCs
3.3 Method
3.3.1 Mice
Six age and sex matched C57/BL6N mice were originally purchased from Jackson
Laboratories and then bred in house (section 2.3.1).
3.3.1.1 Mice immunisation
To study the dynamics and effects of exposure to antigen on ILCs, age and sex
matched C57BL/6N or RAG1 KO mice were immunised i.p. with either 100 µl of heat
killed P. aeruginosa (section 2.2) or endotoxin free PBS control intraperitoneally.
Mice were monitored daily.
3.3.2 Collection of samples
At a predetermined time point, 10 days unless otherwise stated, the animals were
culled and spleen (section 2.3.6) and peritoneal lavage (section 2.3.5) were
harvested.

96
3.3.3 Isolation of cells
Single cell suspensions were prepared from spleens and peritoneal lavage (section
2.3.6) and analysed by flow cytometry for surface markers (section 4.3.4) and to
measure intracellular IL-17A, IL-22 and IFN-γ (eBioscience, UK).
3.3.4 Extracellular staining
Cell surface staining for flow cytometric analysis was performed as in section 2.4.1.6.
For flow cytometry analyses the following antibodies were used: CD90.2 FITC, CD3
PE, B220 PE, GR1 PE, F4/80 PE, CD11c PE, NK1.1 PE, γδTCR PE (Table 3.1) or
CD3e Biotin, B220 Biotin, GR1 Biotin, CD11b Biotin, CD11c Biotin, NK1.1 Biotin,
γδTCR Biotin, CD90 APC, Streptavidin APC-e fluor 780 (Table 3.2).
Table 3.1 Antibodies used for ILCs surface marker
Cell surface marker
Clone Fluorochrome conjugate
Manufacturer
Anti-mouse CD90 5E10 FITC eBioscience
Anti-mouse Lineage negative
Appendix 1.17 PE eBioscience
Table 3.2 Antibodies used for memory time course
Cell surface marker
Clone Fluorochrome conjugate
Manufacturer
Anti-mouse CD90 5E10 FITC eBioscience
Anti-mouse Lineage negative
Appendix 1.18 Streptavidin APC-Cy7 eBioscience
Anti-mouse CD44 IM7 PE eBioscience
Anti-mouse CD62L MEL-14 APC eBioscience
3.3.5 Intracellular staining of transcription factors
For intracellular staining of lymphocytes for flow cytometric analysis of transcription
factors expression in ILCs following exposure to antigen, single-cell suspensions from
spleens were prepared (section2.4.1) and were surface stained as section 2.4.1.6
and 2.4.1.7. The cell membrane was simultaneously permeabilised and fixed with
Foxp3 Permeabilisation/Fixation solution (eBioscience) for 2 hours. After the
incubation, the fixed cells were resuspended in permeabilization buffer and incubated
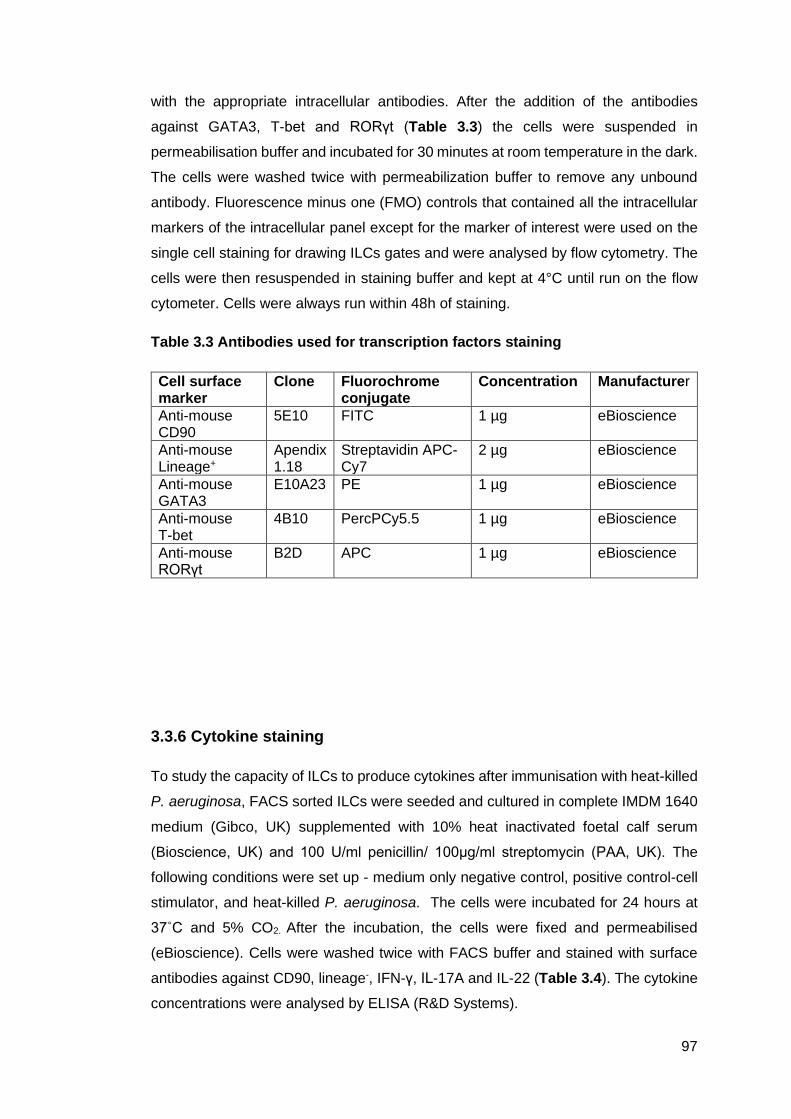
97
with the appropriate intracellular antibodies. After the addition of the antibodies
against GATA3, T-bet and RORγt (Table 3.3) the cells were suspended in
permeabilisation buffer and incubated for 30 minutes at room temperature in the dark.
The cells were washed twice with permeabilization buffer to remove any unbound
antibody. Fluorescence minus one (FMO) controls that contained all the intracellular
markers of the intracellular panel except for the marker of interest were used on the
single cell staining for drawing ILCs gates and were analysed by flow cytometry. The
cells were then resuspended in staining buffer and kept at 4°C until run on the flow
cytometer. Cells were always run within 48h of staining.
Table 3.3 Antibodies used for transcription factors staining
Cell surface marker
Clone Fluorochrome conjugate
Concentration Manufacturer
Anti-mouse CD90
5E10 FITC 1 µg eBioscience
Anti-mouse Lineage+
Apendix 1.18
Streptavidin APC-Cy7
2 µg eBioscience
Anti-mouse GATA3
E10A23 PE 1 µg eBioscience
Anti-mouse T-bet
4B10 PercPCy5.5 1 µg eBioscience
Anti-mouse RORγt
B2D APC 1 µg eBioscience
3.3.6 Cytokine staining
To study the capacity of ILCs to produce cytokines after immunisation with heat-killed
P. aeruginosa, FACS sorted ILCs were seeded and cultured in complete IMDM 1640
medium (Gibco, UK) supplemented with 10% heat inactivated foetal calf serum
(Bioscience, UK) and 100 U/ml penicillin/ 100μg/ml streptomycin (PAA, UK). The
following conditions were set up - medium only negative control, positive control-cell
stimulator, and heat-killed P. aeruginosa. The cells were incubated for 24 hours at
37˚C and 5% CO2. After the incubation, the cells were fixed and permeabilised
(eBioscience). Cells were washed twice with FACS buffer and stained with surface
antibodies against CD90, lineage-, IFN-γ, IL-17A and IL-22 (Table 3.4). The cytokine
concentrations were analysed by ELISA (R&D Systems).

98
Table 3.4 Antibodies used for cytokine measurement
Cell surface marker
Clone Fluorochrome conjugate
Manufacturer
Anti-mouse CD90 5E10 FITC eBioscience
Anti-mouse Lineage positive
See appendix 1.18
Streptavidin APC-Cy7 eBioscience
Anti-mouse IFN-γ XMG1.2 APC eBioscience
Anti-mouse IL-17A TC11-18H10 PercPCy5.5 eBioscience
Anti-mouse IL-22 RMO269-8C61
PE-Cy7 eBioscience
3.4 Flow cytometry
For flow staining the cells were characterised as CD90 positive and CD90 negative
populations. The sorted cells were stained with the following antibodies: CD45 (FITC),
CD90 (Pacific Blue), Gr-1 (PE), CD11b (e660) F4/80 (PECy7) (eBioscience) and
incubated at room temperature for 30 minutes. The stained cells were analysed within
24 hours on flow cytometer (FACS Canto, Becton Dickinson, UK). The acquired
events were analysed with FlowJo software (TriStar, Inc.).
3.5 Computational analysis of flow cytometry obtained ILCs by FlowSOM
and t-SNE mapping
From isolated splenocytes of C57BL/6N mice immunised as in section 2.3.2, FCS
data from two pooled samples were stained with metal-tagged antibodies against
surface markers, following the surface staining the cells were fixated and
permeabilised for intracellular transcription factors staining and analysed by Helios
and clustered using FlowSOM analysis. The cells from the data were surface stained
with following markers (CD25, CD27, CD44, CD45Rβ, CD49b, CD62L, CD69,
CD90.2, CD117, CD127, CD185, CD196, CD335, Sca1 plus the lineage positive
markers (CD3, CD4, CD11b, CD11c, F4/80, CD45R (B220), Gr1 and γδTCR) and 4
intracellular markers (GATA3, Ki67, T-bet and RORγt) (Table 3.5).
The cells were fixed and transported to Belgium where they were acquired on BD
FACS symphony (carried out by D. Small with the assistance of BD).
Gates for the single cells were manually drawn on samples obtained from flow
cytometry FCS files (Figure 3.1). A two-dimensional analysis using scatter plot was
used to exclude dead cells and debris, then truncated to exclude cell populations that

99
were not of interest. The single cells were analysed using 14 surface markers, the
lineage positive markers were left out of the analysis, and 4 intracellular markers.
Using a workflow that group together all the identified ILCs from the FCS files on a
workflow, this is then imported into R as a flowset containing the row data to facilitate
the visualisation of the two samples from different treatment on a single plot. To
analyse the naïve and the memory ILCs FlowSOM were used to cluster the cells in
order to allow automated identification of clusters with phenotypical similarities and
then metaclustered for better interpretation of the results using a program called
ConsensusClusterPlus. Because ILCs are a rare population, for optimal identification
the number of clusters chosen to analyse was 10. The obtained metaclusters were
then mapped onto a t-SNE of the used data and on heatmap.
3.5.1 FlowSOM
For clusters analysis a FlowSOM package was used, using a workflow in R package
to count ILCs and investigate the relationship between samples, the samples were
clustered using FlowSOM and then metaclustered using ConsensusClusterPlus. For
better identification of a rare cell population a grid size of 10x10 was selected, the
number of metaclusters selected was 10 for the lineage negative samples.
3.5.2 t-Distributed Stochastic Neighbour Embedding (t-SNE) algorithm
expression of 19 ILCs surface markers
Analysis for dimensional reduction of the cluster size without changing the original
structure called t-SNE was performed by concatenation of the FCS data in a specific
matrix. The next step was the multiplication by the scaling factor. The metaclusters
obtained by ConsensusClusterPlus were mapped onto the t-SNE.
Samples collected from six immunised mice, three PBS immunised and three
immunised with heat killed P. aeruginosa. Spleens were collected 10 days post
immunisation and stained with antibodies for ILCs (CD90+Lin-) and analysed by Flow
cytometry. On FlowJo cells were gates as CD90+Lin-. The uncompensated samples
were exported in R and analysed by FlowSOM to visualise the key surface and
intracellular markers expressed by the different subsets of ILCs before and after
immunisation within the clusters of cell population (Table 3.7). Using the t-SNE, a
method for dimensional diminution and presents the data as dots which has been

100
shown to be efficient to analyse data acquired by flowcytometry (Kelsey et al., 2012),
ten clusters from each of the six sample conditions was analysed and the number of
events was 20 000 per file. Differences were observed in the expression of surface
and intracellular markers between the two conditions (PBS and Heat killed P.
aeruginosa).
Table 3.5 Antibodies used for ILC Symphony
Surface marker Clone Fluorochromeconjugate
Concentration
Manufacturer
CD25 PC61 (RUO) PE-CF594 0.001ng BD Biosciences
CD27 LG.3A10 (RUO) BUV805 0.001ng BD Biosciences
CD44 IM7 (RUO) APC-CY7 0.001ng BD Biosciences
CD45Rβ 16A (RUO) BB515 0.0025ng BD Biosciences
CD49b HMα2 (RUO) BUV737 0.001ng BD Biosciences
CD62L MEL-14 (RUO) BV786 0.001ng BD Biosciences
CD69 H1.2F3 (RUO) BV750 0.001ng BD Biosciences
CD90 30-H12 (RUO) BUV395 0.001ng BD Biosciences
CD117 (ckit) 2B8 (RUO) BV605 0.001ng BD Biosciences
CD127 (IL-7Ra) SB/199 (RUO) PE-Cy7 0.001ng BD Biosciences
CD185
(CXCR5)
2G8 (RUO) BB700 0.001ng BD Biosciences
CD196 (CCR6) 140706 (RUO) Alexa647 0.001ng BD Biosciences
CD335 (NKp46) 29A1.4 (RUO) BV480 0.001ng BD Biosciences
Sca1 D7 (RUO) BUV563 0.001ng BD Biosciences
GATA3 L50-823 (RUO) BV711 5 µl BD Biosciences
Ki67 B56 (RUO) APC-R700 5 µl BD Biosciences
T-bet O4-46 (RUO) BV650 5 µl BD Biosciences
RORγt Q31-378 (RUO) BV421 0.001ng BD Biosciences
CD3 17A2 (RUO) BUV496 0.001ng BD Biosciences
CD4 GK1.5 (RUO) BUV805 0.001ng BD Biosciences
CD11b M1/70 (RUO) BUV563 0.001ng BD Biosciences
CD11c N418 (RUO) BV480 0.001ng BD Biosicences
F4/80 T45-2342(RUO) BV605 0.001ng BD Biosciences
CD45R (B220) RA3-6B2 (RUO) BUV661 0.001ng BD Biosciences
Gr1/Ly6G 1A8 (RUO) BV750 0.001ng BD Biosciences
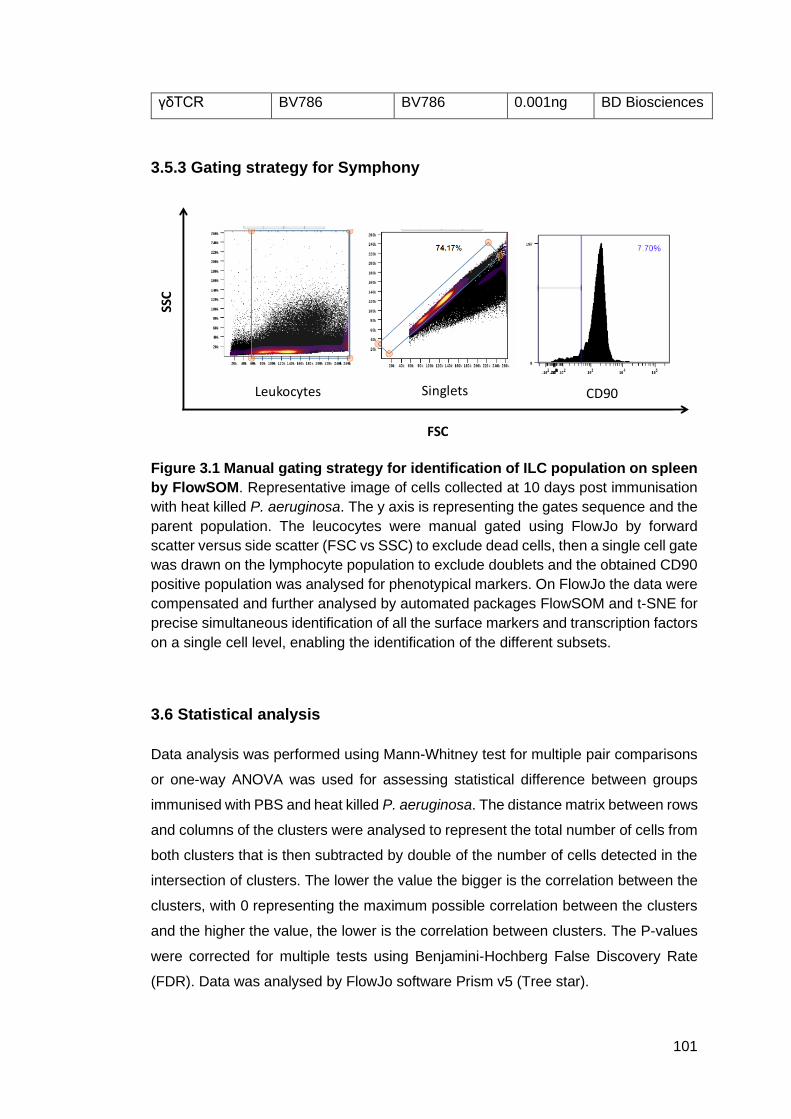
101
γδTCR BV786 BV786 0.001ng BD Biosciences
3.5.3 Gating strategy for Symphony
Figure 3.1 Manual gating strategy for identification of ILC population on spleen
by FlowSOM. Representative image of cells collected at 10 days post immunisation
with heat killed P. aeruginosa. The y axis is representing the gates sequence and the
parent population. The leucocytes were manual gated using FlowJo by forward
scatter versus side scatter (FSC vs SSC) to exclude dead cells, then a single cell gate
was drawn on the lymphocyte population to exclude doublets and the obtained CD90
positive population was analysed for phenotypical markers. On FlowJo the data were
compensated and further analysed by automated packages FlowSOM and t-SNE for
precise simultaneous identification of all the surface markers and transcription factors
on a single cell level, enabling the identification of the different subsets.
3.6 Statistical analysis
Data analysis was performed using Mann-Whitney test for multiple pair comparisons
or one-way ANOVA was used for assessing statistical difference between groups
immunised with PBS and heat killed P. aeruginosa. The distance matrix between rows
and columns of the clusters were analysed to represent the total number of cells from
both clusters that is then subtracted by double of the number of cells detected in the
intersection of clusters. The lower the value the bigger is the correlation between the
clusters, with 0 representing the maximum possible correlation between the clusters
and the higher the value, the lower is the correlation between clusters. The P-values
were corrected for multiple tests using Benjamini-Hochberg False Discovery Rate
(FDR). Data was analysed by FlowJo software Prism v5 (Tree star).
Leukocytes Singlets CD90
FSC
SSC

102
For statistical analysis of the cluster’s frequency from the symphony data the Cytofast,
which an R-based workflow package, was used for visualisation and quantitative
analysis by FlowSOM. Mann-Whitney test was used to analyse the statistical
difference between groups. Metaclusters with FDR <0.05 were considered significant.
3.7 Results
3.7.1 In vitro Characterisation of ILCs surface markers
The innate lymphoid cells do not share markers with the other cells of the innate
immune system (Artis & Spits, 2015) and so they are known as lineage negative cells
but they do share markers between the three subsets (ILC1, ILC2 and ILC3) (Sirui Li
et al., 2017) (Table 3.6). The level of expression of a variety of cell surface markers
known to be useful in the differentiation of ILC subsets were examined in naïve and
stimulated ILCs (Figure 3.2). Some of the markers analysed in this experiment differ
in their expression between humans and mice, these surface markers can be
expressed only by humans, mice or both. There is also difference in expression
among the subsets. Some markers are only expressed in mice such as Sca1also
known as Ly6A (ILC2), c-Kit (ILC1), NKp46 (ILC1), some only expressed by humans
ILCs such as CD161(all subsets), NKp44 (NK cell and ILC3), ICOS (ILC1) and CD4
(ILC1), others are expressed by both humans and mice as in the case of CD25 (ILC1
and ILC3), CD117 (ILC2 and ILC3), CD127 (all subsets), IL-17RB (ILC2), c-Kit (ILC2
and ILC3), IL-23R (ILC3), ST2 (ILC2), NKp46 (ILC3), CCR6 (ILC1,ILC2, ILC3) and
ICOS (ILC2 and ILC3) (Hazenberg & Spits, 2014b).
It was shown that there was a significant elevation in the expression of Sca1, CD49b,
CD69 and CD44 *(p<0.05) in memory ILCs. In contrast PIRA, ST2, TNFR1 and CD25
was shown to be downregulated on ILCs following heat killed P. aeruginosa
immunisation. The statistical significance is indicated as *(p<0.05). No significant
differences in expression were observed in the other markers and the statistical
significance was presented as ns.
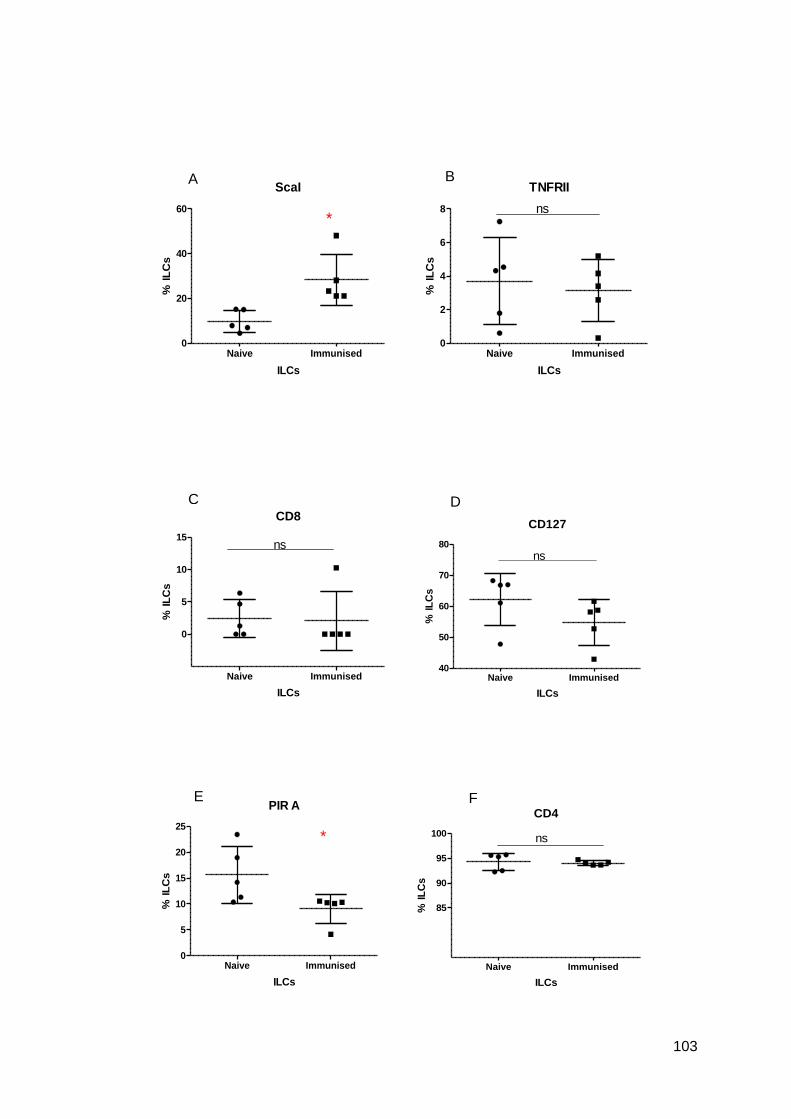
103
Naive Immunised0
20
40
60
ScaI
*
ILCs
% IL
Cs
Naive Immunised0
2
4
6
8
TNFRII
ns
ILCs
% IL
Cs
Naive Immunised
0
5
10
15
CD8
ns
ILCs
% IL
Cs
Naive Immunised40
50
60
70
80
CD127
ns
ILCs
% IL
Cs
Naive Immunised0
5
10
15
20
25
PIR A
*
ILCs
% IL
Cs
Naive Immunised
85
90
95
100
CD4
ns
ILCs
% IL
Cs
A B
C
D
E
F

104
Naive Immunised0
10
20
30
40
50
CD218a
ns
ILCs
% IL
Cs
Naive Immunised0
10
20
30
40
IL-17RB
ns
ILCs
% IL
Cs
Naive Immunised0
10
20
30
40
50
cKit
ns
ILCs
% IL
Cs
Naive Immunised0
20
40
60
80
CCR6
ns
ILCs
% IL
Cs
Naive Immunised0
2
4
6
8
CD49b
*
ILCs
% IL
Cs
Naive Immunised0
2
4
6
8
CD40
ns
ILCs
% IL
Cs
G H
I
J
K
L

105
Naive Immunised-0.2
0.0
0.2
0.4
0.6
0.8
1.0
Erg2
ns
ILCs
% IL
Cs
Naive Immunised0.0
0.1
0.2
0.3
0.4
0.5
CD121a
ns
ILCs
% IL
Cs
Naive Immunised0.0
0.2
0.4
0.6
IL-23R
ns
ILCs
% IL
Cs
Naive Immunised-5
0
5
10
15
ST2
*
ILCs
% IL
Cs
Naive Immunised-10
0
10
20
30
TNFRI
*
ILCs
% IL
Cs
Naive Immunised0
10
20
30
40
NKp46
ns
ILCs
% IL
Cs
M N
O
P
Q
R
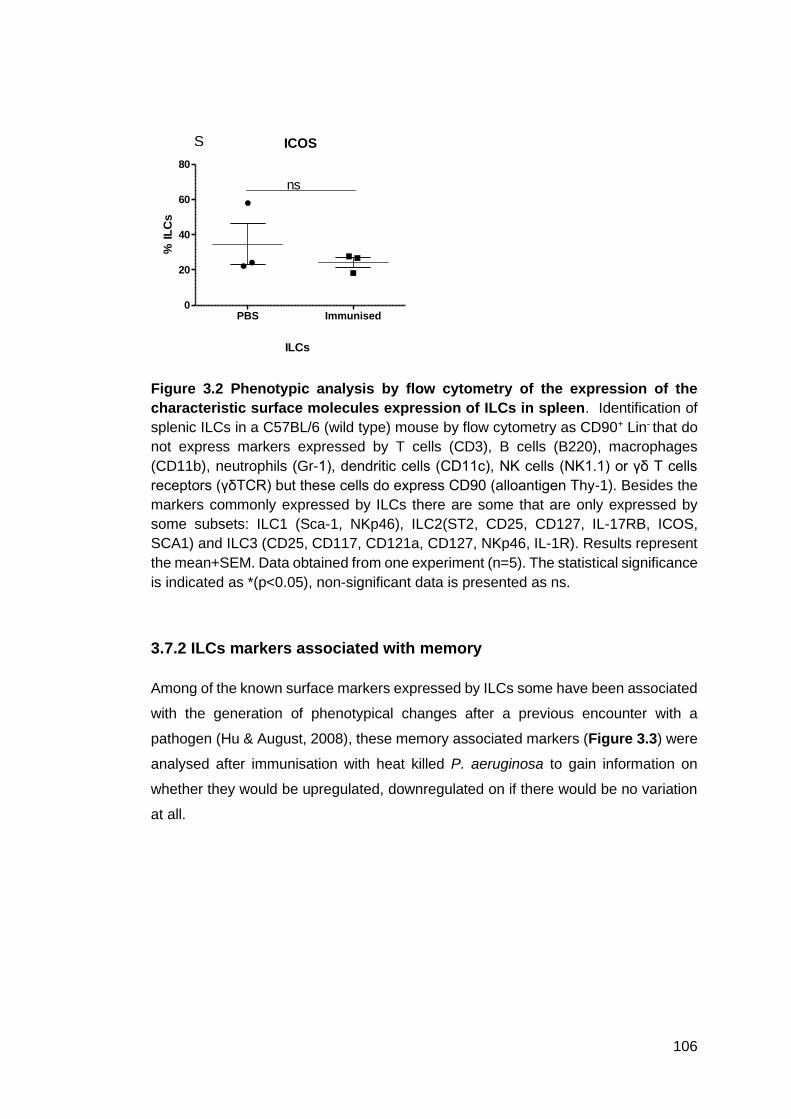
106
ICOS
PBS Immunised0
20
40
60
80
ns
ILCs
% IL
Cs
Figure 3.2 Phenotypic analysis by flow cytometry of the expression of the
characteristic surface molecules expression of ILCs in spleen. Identification of
splenic ILCs in a C57BL/6 (wild type) mouse by flow cytometry as CD90+ Lin- that do
not express markers expressed by T cells (CD3), B cells (B220), macrophages
(CD11b), neutrophils (Gr-1), dendritic cells (CD11c), NK cells (NK1.1) or γδ T cells
receptors (γδTCR) but these cells do express CD90 (alloantigen Thy-1). Besides the
markers commonly expressed by ILCs there are some that are only expressed by
some subsets: ILC1 (Sca-1, NKp46), ILC2(ST2, CD25, CD127, IL-17RB, ICOS,
SCA1) and ILC3 (CD25, CD117, CD121a, CD127, NKp46, IL-1R). Results represent
the mean+SEM. Data obtained from one experiment (n=5). The statistical significance
is indicated as *(p<0.05), non-significant data is presented as ns.
3.7.2 ILCs markers associated with memory
Among of the known surface markers expressed by ILCs some have been associated
with the generation of phenotypical changes after a previous encounter with a
pathogen (Hu & August, 2008), these memory associated markers (Figure 3.3) were
analysed after immunisation with heat killed P. aeruginosa to gain information on
whether they would be upregulated, downregulated on if there would be no variation
at all.
S

107
Naive Immunised0
2
4
6
8
10
CD69
*
ILCs
% IL
Cs
Naive Immunised0
10
20
30
40
CD25
*
ILCs
% IL
Cs
Naive Immunised0
20
40
60
80
100
CD62L
*
ILCs
% IL
Cs
Naive Immunised0
5
10
15
20
25
CD38
ns
ILCs
% IL
Cs
Naive Immunised70
80
90
100
110
CD2
ns
ILCs
% IL
Cs
Naive Immunised0
20
40
60
80
100
CD44
*
ILCs
% IL
Cs
Figure 3.3 Phenotypic analysis by flow cytometry of the expression of ILCs
surface molecules associated with memory in spleen. Identification of immunised
splenic ILCs in a C57BL/6 (wild type) mouse by flow cytometry as CD90+ Lin- and on
the additional surface molecules associated with memory, CD2, CD25, CD38, CD44,
CD62L and CD69. Results represent the mean+SEM. Data obtained from one
A
B
C
D
E
F

108
experiment (n=5). The statistical significance is indicated as *(p<0.05) and the non-
significant as ns.
Table 3.6 Key ILCs Surface markers
ILC1 ILC2 ILC3
CD90 CD90 CD90
CD121a CD25 CD4
SCA1 CD120a CD117
NKp46 CD120b CD120a
CD127 CD120b
SCA1 CD128
ST2 MHCII
IL-17Rβ NKp46
MHCII IL-23R
3.7.3 Flow transcription factors associated with ILCs
The name transcription factors is used to describe proteins of DNA molecules at a
specific location that serves as regulatory area to regulate the transcription of genes
selected for an ongoing immune response (Zhong & Zhu, 2017). Surface markers and
cytokine profile are features used to identify the new discovered family of ILCs
(O’Sullivan & Sun, 2017).
However, ILCs have the same morphological characteristics as lymphocytes of the
adaptive system such as T and B cells and share some features with other innate
lymphoid and non-lymphoid cells what makes their identification among other cells of
the immune system quite difficult (Sirui Li et al., 2017).
One way to obtain a positive identification of the subsets is to have the transcription
factors characterised together with the surface markers (De Grove et al., 2016)
(Figure 3.4). Identification of transcription factors will not only provide information to
help with positive identification of individual subsets of ILCs but will also give
information on how the changes observed at surface level are initiated and how can
they be regulated to treat or control disease processes.

109
Figure 3.4 Intracellular staining of transcription factors in splenic ILCs. A single
cell suspension was prepared from C57BL/6N mice immunised with heat killed P.
aeruginosa or PBS (control), culled on day 10 post immunisation and stained for cell
surface markers CD90+ and Lin-. The transcription factors T-bet, GATA3 and RORγt
were stained for identification of the different subsets of ILC by intracellular flow
cytometry. RORγt was significantly expressed on the Hk Pa treated group, T-bet was
not significantly expressed and GATA3 could not be stained, the stain did not work
(B). (n=3). Statistical significance is indicated as *(p<0.05) and non-significant as ns.
3.7.4 Memory markers time course
The pattern of expression in cellular surface markers its related to the state of the cell,
whether it is naïve or activated (Kim et all., 2015). The surface protein CD44 (H-CAM)
is involved in cell to cell, cell and endothelium contact and can be activated by
proinflammatory cytokines (Chen et al., 2018). Whilst CD62L (L-selectin), which has
been widely studied on T cells, is important for the recruitment of circulating
lymphocytes to inflammatory sites, as well as to the migration of naïve cells to
lymphoid tissues (Bar-Ephraim et al., 2019). It is widely recognised that naïve T cells
have a CD62LhiCD44lo phenotype, whilst memory T cells are CD62LloCD44hi (Moon
et al., 2015). Therefore, the expression of these markers by ILCs and their dynamics
following antigen exposure was examined.
The surface marker CD44 is upregulated on activated ILCs and this upregulation is
maintained up to 28 days (Figure 3.5) whereas CD62L is downregulated on days 7
and 14 then upregulated from day 21 until day 28 (figure 3.5). The role of CD44 on
ILCs is not known yet but it appears to be related to the memory function as it
increases after immunisation as in T cells (Schumannet al., 2015). The CD62L is a
marker that increases during maturation but is downregulated after stimulation (Hu &
August, 2008).
T-bet
Naive Immunised0
10
20
30
40
50 ns
Cells (
%)
RORyt
Naive Immunised0
20
40
60
80
100*
Cells (
%)
A B

110
Figure 3.5 Flow characterisation of CD44 & CD62L expression in splenic ILCs.
Similar surface markers to T cell memory cells, CD44 highCD62Llow profile of cells were
used to track development of ‘memory’ and the persistence of these cells examined
up to 28 days post immunisation CD44 is up-regulated following activation whilst
CD62L is down-regulated (n=3). Activated CD44 cells are upregulated and this
elevation is sustained until day 28 (A). CD62L are expressed in low levels after
activation (n=3) (B). The statistical significance is indicated as *(p<0.05) and non-
significant as ns.
3.7.5 Cytokine production
The three subsets of innate lymphoid cells are characterised by the distinct surface
markers, transcriptional factors characteristic of their function and cytokine profile
(Crome et al., 2017). To exert their function ILCs depend on an array of cytokines for
their activation as well as for them also to produce and release cytokines (Seillet et
al., 2014b; Soriani et al., 2018). Group 1 ILCs express the transcription factor T-bet
and produce the type I inflammatory cytokine IFN-γ. Group 2 ILCs express the
transcription factor GATA-3 and produces the type II cytokines IL-4, IL-5, IL-9 and IL-
13 and the group 3 ILCs express the transcription factor RORγt and produces type III
cytokines IL-17 and IL-22 (Elemam et al., 2017a). Therefore, elucidating the levels of
these cytokines following exposure to P. aeruginosa antigens could provide valuable
information about the subset of cells responsible for ILC memory.
To analyse the production of cytokines by ILCs during infection, supernatants of ILCs
were used. The ELISA method was also used to quantify the production of
inflammatory cytokines following infection. The supernatants from both immunised
and non-immunised cells were used, by coating the antibody for the protein of interest
Day
0
Day
3
Day
7
Day
14
Day
21
Day
28
70
80
90
100
110
ns
*
*C
D44+
ce
lls (
%)
Day
0
Day
3
Day
7
Day
14
Day
21
Day
28
0
20
40
60
ns*
*
ns
ns
CD
62L
+ c
ells (
%)
B A

111
on a 96 well plate, blocking the unbound protein binding sites with blocking solution,
adding the samples containing the antigen of interest to the coated plate and
incubating it for 2 hours or overnight for maximum sensitivity. Several performed
washes after the period of incubation to remove unbinding samples, and the addition
of the secondary antibody for the detection of the antigen. The next step is incubation
and addition of the enzyme horseradish peroxidise (HRP), the addition of the enzyme
substrate which produces the colour that is used for colorimetric reading. The final
step is the addition of the stop solution.
An ongoing Inflammation is due to the action of an active innate immune response.
The influx of blood circulating leukocyte into the affected site constitute is one of the
key components to initiate the inflammatory response (Bar-Ephraim et al., 2019).
Through the PRR signalling tissue resident macrophages, dendritic cells, and mast
cells are activated to release proinflammatory cytokines that will increase permeability
of blood vessels and the influx of the fluids and other substances causing swelling,
these key cytokines also produce these same proinflammatory cytokines TNF-α, IL-
1β, and IL-6 which will induce fever to stop or retard the replication of pathogens and
to induce the induction of the acute phase proteins by the liver that that will serve to
opsonise and will also activate the complement system (Dinarello, 2000).
The ELISA sandwich assay is a sensible method for measurement of cytokine (Cella
et al., 2010), a 96 well plates were coated with diluted anti-cytokine capture antibody
for IFN-γ, IL-17 and IL-22, the plate was sealed and incubated at 4°C. After a few
washes, non-specific binding was blocked, the sample made of supernatants of FACS
sorted ILCs from mice immunise at different time points (Figures 3.6, 3.7 and 3.8)
and the serial dilutions of standards were added in triplicates and soluble proteins
from the samples were capture by the antibody bound to the plate, the plate sealed
and incubated overnight at 4°C. After washing the unbound soluble proteins, the anti-
cytokine detection antibody was added, incubated for 1 hour, the unbound antibody
washed and the enzyme labelled streptavidin added, the plates sealed and incubated
for 30 minutes. After incubation, the substrate was added, incubated for 5-20 minutes
and the colour generated by the addition of the substrate the OD of the samples was
measured at 405 nm on the ELISA plate reader.
This protocol for measurement of cytokine production by T cells was used as an
alternative to measure ILCs cytokine production, and antibodies are used to identify
the transcription factors after the cells have been permeabilized, and analysed by flow
cytometry(Smith et al., 2015). Although samples were collected at different time points

112
for identification of cell’s individual cytokine production an exam that uses
immunofluorescent staining of cytokines would be used, and information on what cells
and at which time point cells are producing cytokines would be available.
INF-γ
0 7 14 21 280
100
200
300
400
Cell Stim
Con A
HK pa
ns
Days post immunisation
I
FN
- (
g/m
l)
0 7 14 280
100
200
300
400 ns
Days post immunisation
IF
N-
(
g/m
l)
Figure 3.6 Heat Killed P. aeruginosa stimulated ILCs produced significant levels
of IFN-ү. HK P. aeruginosa induced ILCs production of significant levels of IFN-γ.
FACS sorted ILCs (CD90+ Lin-) from C57BL/6 splenocytes from mice i.p. immunised
as summarized in methods were culled at 7, 14 and 28 days post immunisation were
cultured for 24h in a flat-bottomed 12 well culture plate in medium supplemented with
FBS, PMA, P/S and in the presence or absence of HK P. aeruginosa. After the
stimulation, the supernatants were collected and the amount of cytokine IFN-γ
produced was quantified by ELISA. Each dot represents a single animal from each
immunization group. For the detection of cytokine production the cells were stained
with monoclonal antibodies The HK P. aeruginosa immunised group ILCs (B)
produced no significant levels of IFN-γ compared to the other groups (C and D) that
0 7 14 280
50
100
150
200
250
Con A
*
Days post immunisation
I
FN
- (
g/m
l)
0 7 14 280
100
200
300
400
500
Cell Stim
*
Days post immunisation
I
FN
- (
g/m
l)
A B
C
D

113
produced significant levels of IFN-γ on the cell stimulation cocktail and ConA groups
(n=3). Delta graphs showing the difference between the two conditions (heat killed P.
aeruginosa and PBS immunised). The data is presented as mean+SEM. The
statistical significance is indicated as *(p<0.05) and non-significance as ns.
IL-17A
0 7 14 21 280
200
400
600
AllCell Stim
Con A
HK pans
Days post immunisation
I
L-1
7A
(
g/m
l)
0 7 14 280
100
200
300
400
500
HK Pa
ns
Days post immunisation
I
L-1
7A
(
g/m
l)
0 7 14 280
100
200
300
400
500
Con A
ns
Days post immunisation
I
L-1
7A
(
g/m
l)
0 7 14 280
200
400
600
800
Cell Stim
ns
Days post immunisation
I
L-1
7A
( g
/ml)
Figure 3.7 Heat Killed P. aeruginosa stimulated ILCs produced significant levels
of IL-17A. HK P. aeruginosa stimulated ILCs produced significant levels of IL-17A.
FACS sorted ILCs (CD90+Lin-) from C57BL/6 splenocytes from mice i.p. immunised
as summarised in methods were culled at 7, 14 and 28 days post immunisation were
cultured for 24h in a flat-bottomed 12 well culture plate in medium supplemented with
FBS, PMA, P/S and in the presence or absence of HK P. aeruginosa. After the
stimulation, the supernatants were collected and the amount of cytokine IL-17A
produced was quantified by ELISA. Each dot represents a single animal from each
immunization group. For the detection of cytokine production, the cells were stained
with monoclonal antibodies The HK P. aeruginosa immunised group ILCs. The
production of cytokine IL-17A was measured. For the detection of cytokine production,
the cells were stained with monoclonal antibodies. There was an increase of pattern
A B
C D

114
in the production of IL-17A in all groups, but no significance was observed between
the different groups (B, C and D) or between the different stimuli (A). Delta graphs
showing the difference between the two conditions (heat killed P. aeruginosa and PBS
immunised). The data is presented as mean+SEM (n=3). The statistical significance
is indicated as ns (non-significant).
IL-22
0 7 14 280
200
400
600
800
Con A
*
Days post immunisation
I
FN
- (
g/m
l)
Figure 3.8 Heat Killed P. aeruginosa stimulated ILCs produced significant levels
of IL-22. FACS sorted ILCs (CD90+/Lin_) from mice immunised culled at 7, 14 and 28
days post immunisation were cultured for 24h in a flat-bottomed 12 well culture plate
in medium supplemented with FBS, PMA, P/S in the presence or absence of HK P.
aeruginosa. After the stimulation, the supernatants were collected, and the amount of
cytokine IL-22 produced was quantified by ELISA. Each dot represents a single
animal from each immunization group. For the detection of cytokine production, the
cells were stained with monoclonal antibodies. The unstimulated ILCs produced very
limited levels of IL-22 compared to the stimulated that produced significant amount of
IL-22 in the 3 different conditions (n=3). The data is presented as mean+SEM. The
statistical significance is indicated as *(p<0.05).
0 7 14 21 280
200
400
600
800
AllCell Stim
Con A
HK pa
*
Days post immunisation
I
FN
- (
g/m
l)
0 7 14 280
200
400
600
800
HK Pa
*
Days post immunisation
I
FN
- (
g/m
l)
0 7 14 280
200
400
600
800
Cell Stim
*
Days post immunisation
I
FN
- (
g/m
l)
A B
C D

115
3.9 Computational analysis of ILC’s data obtained by flow cytometry
using FlowSOM and t-SNE mapping
Little is known about memory generation of the adaptive immune cells and much less
information is available about memory generation within the innate lymphoid cells
following pathogen activation. A good understanding of the mechanism behind such
memory is elemental to comprehend the initiation, progression and resolution of the
activated immune response. Immunisation to induce alterations of the immune
response is a process that is being studied in this chapter using an automated
method. The effect of immunisation with HK P. aeruginosa or PBS on surface markers
and cytokine production using C57BL/6N mice were explored in this chapter to have
a better understanding of the multiple functions of ILCs and its profile during an
immune response. The cell response was analysed using flow cytometry alone or a
combination of flowcytometry and FlowSOM software.
Flow cytometry it’s a technique that measures multiple parameters at a single cell
level at high speed and with an elevated degree of accuracy (Baumgarth & Roederer,
2000). The technique has become an invaluable tool for study of normal and disease
state at a cellular structure. However, due to the advances achieved in the field of flow
analysis more aspects of the cell components and its behaviour has been studied
(Cole et al., 2018). The more knowledge these studies were able to provide the more
data were generated which rendered the existent data analysis method inaccuracy
that could be introduced by spectral overlap or by the fact that manual handling of this
enormous amount of data are not only exhaustive but also prone to human error
(Saeys et al., 2016).
To overcome that problem a new method of analysis called FlowSOM was created,
FlowSOM is an automated method for identification of cell population therefore does
not require manual handling of the data (Laban et al., 2020), the program does it itself
by creating Self-Organizing Maps (SOM), enabling unbiased analysis of all markers
of individual levels compared to the data presented in two dimensions by flow
cytometry, reducing the risk of some markers being lost during analysis and uses
metal isotypes which is an advantage over the fluorescent tags as minimizes the
problem with spectral overlap (Van Gassen et al., 2015). The efficient use of
FlowSOM relies in three sequential steps: First, the cells were organised by their
similarities, then the graphical representation of the clusters that include cells that
express similar markers and lastly, the metaclustering of the codes obtained by SOM
(Robinson et al., 2017; Saeys et al., 2016).

116
The FlowSOM a method for clustering simultaneously analyses all the surface
markers present in the panel at a single cell level and organise the phenotypically
similar cells into small groups called metaclusters (Wu et al., 2019). To analyse the
changes that occur on ILCs during an immune response, 19 markers were observed
using flow cytometry phenotyping in splenocytes from mice immunised with heat-
killed P. aeruginosa or PBS controls. Manual gating technique was used followed by
automatic FlowSOM gating used to reveal the changes in the metaclusters containing
the markers of interest and the technique also avoid bias within the cell population
being analysed.
The High dimensional analysis of ILCs by FlowSOM creates clusters for the
identification of meta-clusters (Weber & Robinson, 2016) that are identified by a
specific colour attributed to each of the different meta-clusters. Clustering were
carried out using a 10x10 grid, followed by metaclustering to give 10 clusters from
each sample, then mapped into a t-SNE of the data for dimensional reduction in which
cells are visualised as single points (Figures 3.10 and 3.11). A total of 15 surface
markers and 4 intracellular markers were used (Table 3.6). The different colours of
the clusters represent the surface marker expression shown in t-SNE dot plot
corresponding to different levels of the different markers (Figure 3.12). Low/neg for
most markers including CD45RB CD27, CD62L (blue colour), positive for CD44 and
CD45RB (green colour), high for CD27, CD127, CD62L (orange colour) (Table 3.9)
(n=3).
t-SNE1
t-SN
E2
t-SNE2
PBS HK PA
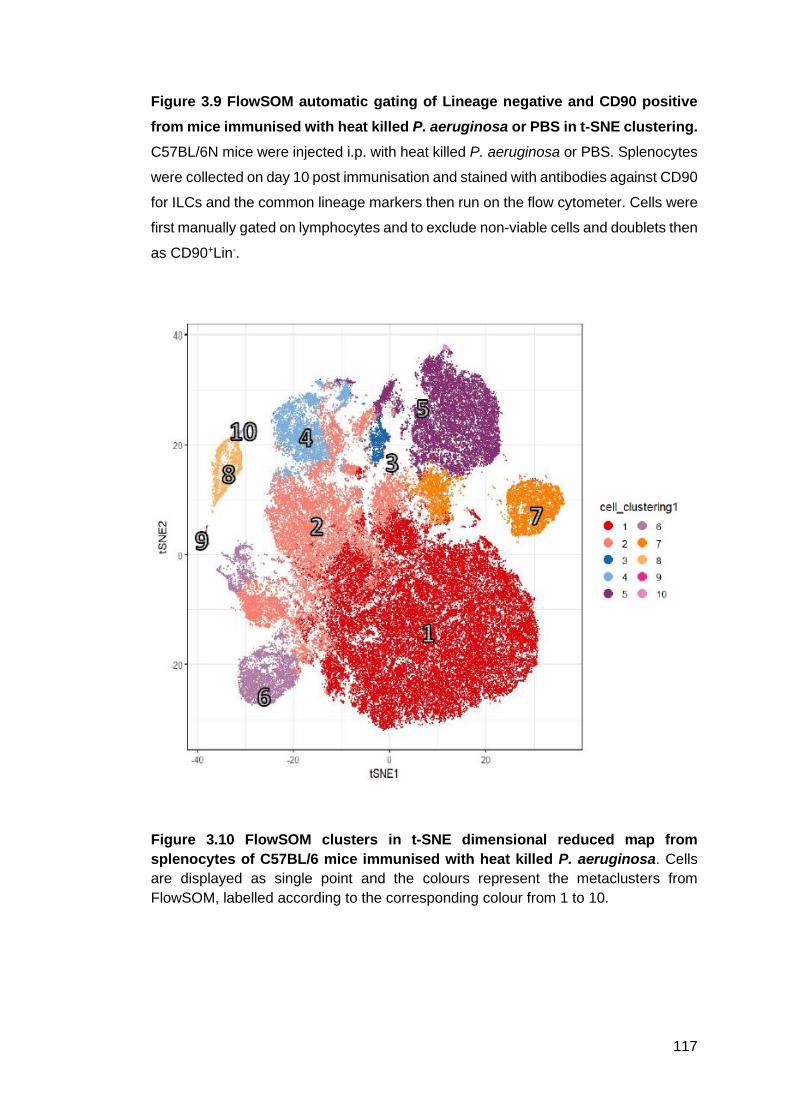
117
Figure 3.9 FlowSOM automatic gating of Lineage negative and CD90 positive
from mice immunised with heat killed P. aeruginosa or PBS in t-SNE clustering.
C57BL/6N mice were injected i.p. with heat killed P. aeruginosa or PBS. Splenocytes
were collected on day 10 post immunisation and stained with antibodies against CD90
for ILCs and the common lineage markers then run on the flow cytometer. Cells were
first manually gated on lymphocytes and to exclude non-viable cells and doublets then
as CD90+Lin-.
Figure 3.10 FlowSOM clusters in t-SNE dimensional reduced map from
splenocytes of C57BL/6 mice immunised with heat killed P. aeruginosa. Cells
are displayed as single point and the colours represent the metaclusters from
FlowSOM, labelled according to the corresponding colour from 1 to 10.

118
Figure 3.11 FlowSOM clusters in t-SNE dimensional reduced map from
splenocytes of C57BL/6N mice immunised with PBS. Cells are displayed as single
point and the colours represent the metaclusters from FlowSOM, labelled according
to the corresponding colour from 1 to 10.

119
Figure 3.12 t-SNE plot based arcsinh-transformed expression of 10 ILCs surface
markers and 3 transcription factors from splenocytes of C57BL/6N mice. From
the each of the 10 samples, cells were randomly selected. Cell’s colour represents
the expression of the cell markers.
3.8.1 Multi-dimensional scaling (MDS) plot
This type of data representation were presented to show the similarities between the
samples that received different immunisations in order to analyse how much similar
or different both samples are from each other using all the markers expressed by all
cells in the sample (Robinson et al., 2017). Two of the samples did cluster well but
one of each group were outliers. The numbers on each label indicates the sample ID,
samples 2 and 3 from condition 1 are at the bottom of the box, samples 5 and 6 from
condition 2 in the middle whereas samples 4 from condition 2 and 1 from condition 2
are at the top. The position of the samples indicates that there are similarities between
samples 2 and 3 from condition 1 and samples 5 an6 from condition 2 (Figure 3.13).

120
Figure 3.13 MDS plot of PBS and P. aeruginosa immunised spleen samples from
C57BL/6N mice. The above plot was made using the median expression of the 15
surface and 4 transcription factors markers. PBS (cond1) and the heat killed P.
aeruginosa (cond2) samples from the 2 different conditions are on different colour.
3.8.2 t-SNE metaclusters associated with surface markers
Flow cytometry FCS files displayed on t-SNE as metaclusters are arranged in a way
that cells are grouped according to their similarities and to keep cells from different
clusters but with similarities close together (Lucchesi et al., 2020). Cells from
metaclusters 4, 5 and 7 express the transcription factor T-bet that correspond to the
t-SNE region positive for ILC1 are in the upper side of the t-SNE. Cells from
metaclusters 8, 9 and 10 expressing the transcription factors T-bet and RORγt were
automatically grouped close together on the upper left side of t-SNE, an indicative of
ILC1 and ILC3 region on t-SNE map (Table 3.7).
3.8.3 Modulation of the ILCs transcription factors expression.
Transcription factors expression on splenocytes from C57BL/6N mice after
immunisation with heat killed P. aeruginosa using automated t-SNE mapping after
metaclustering with ConsensusClusterPlus. Observation of the FlowSOM data
provides information about the structure of the cell population in analysis and about
the number of clusters. The data obtained from flow cytometry FCS files were further
analysed with dimensional reduction method for visualisation of the obtained high
dimensional data in a low dimensional space. The t-SNE data is shown as small
islands made of dots with each parameter expressing a different colour that varies
from dark blue for the lowest expression to red for the highest expression of the
transcription factors (Figure 3.14). The t-SNE mapping allow for the identification of

121
the transcription factors, RORγt were highly expressed in cluster 10 and T-bet on
clusters 4, 7 and 9 (Table 3.7).
Figure 3.14 Mapping of ILCs transcription factors in t-SNE on splenocytes from
C57BL/6N mice. In these map cells are grouped by their similarities in transcription
factors. Expression levels are shown by different colours that range from blue being
the lowest value to red as the highest value. The highest expression is on the upper
left side of the t-SNE map.
3.8.4 Modulation of the ILCs surface marker expression.
The data obtained from flow cytometry FCS files were further analysed with
dimensional reduction method for visualisation of the obtained high dimensional data
in a low dimensional space. The t-SNE data is shown as small islands made of dots
with each parameter expressing a different colour that varies from dark blue for the

122
lowest expression to red for the highest expression of markers. The t-SNE mapping
allow for the identification of the memory markers, CD44 were highly expressed in
cluster 10 whereas CD62L shown low expression, which is perfectly normal as the
CD62L marker tends to decrease whilst CD44 increases after immunisation (Figure
3.15 and 4.5) and also high expression of T-bet and RORүt markers (Figure 3.16)
(Hu & August, 2008). The data below show surface marker expression on splenocytes
from C57BL/6N mice after immunisation with heat killed P. aeruginosa using
automated t-SNE mapping after metaclustering with ConsensusClusterPlus.
Figure 3.15 Mapping of markers associated with memory markers in t-SNE
dimensional reduced frame on splenocytes from C57BL/6N immunised mice. In
these map cells are grouped by their similarities in surface markers. Expression levels
are shown by different colours that range from blue being the lowest value to red as
the highest value. The highest expression is on the upper left side of the t-SNE map.

123

124
Figure 3.16 t-SNE of individual markers expressed by ILCs from splenocytes of
C57BL/6N mice. The above mapping indicates that the transcription factor RORγt
shows high expression which is an indicative of ILC3 the ILC subset involved in
clearance of extracellular bacterial infection.

125
Table 3.7 Clusters associated with surface markers. The clusters represented in
the table below shows T-bet being expressed in most of the ILC subsets and in one
of the clusters T-bet and RORүt are on the same cluster to be merged (Table 3.7).
Clusters to be merged will have one cluster that will include clusters 1,2,3 and 4, one
for clusters 5, 6 and 7 and another for clusters 8, 9 and 10 (Table 3.8).
Clusters Positive Markers
Cluster 1 None
Cluster 2 CD44lo, Ki67+, CD196+
Cluster 3 CD27lo, CD62Llo, CD45RBlo, CD196lo,
Ki67lo
Cluster 4 Sca-1+, CD196+, T-bet+
Cluster 5 CD49b+, CD45RBhi, T-bet+, CD117+,
CD335hi
Cluster 6 CD45RB+, Sca-1hi, CD90lo, CD49b+,
CD117+
Cluster 7 CD49bhi, CD45RBlo, Tbet+
Cluster 8 Negative for all T, B and myeloid cells
Cluster 9 CD90.2lo, CD49b+, CD44hi, CD196hi, T-
bethi
Cluster 10 RORγthi, CD335+, CD49bhi, CD44+,
CD45RBlo
3.8.5 Bar plot of relative abundance of the 6 mice ILC populations from each
sample
The objective of this analysis was to compare the population abundance between the
different treatments received by the two experimental groups, PBS and heat killed P.
aeruginosa immunised mice, thus bar plots were used to visualise the proportion of
cluster expression for each sample (Figure 3.17). Although in this type of analysis it
can be quite difficult to visualise population with low frequency the bar plot method is
still a good way to visualise the rate at which the different populations are expressed
in the two different conditions. The abundance is different for the two immunisations
and similar for the two last samples from each group but somehow different for the
first sample from each group which are showing a pattern like the group treated with
the other immunisation.

126
Figure 3.17 Cluster overview. Bar plot showing the abundance of the splenocytes
from the six C57BL/6N mice from each immunisation. Bar plots representing each of
the 10 clusters with the y axes representing the range of data from each cluster.
Table 3.8 Average number of cells per cluster
Frequencies from metaclusters already identified on t-SNE mapping of splenocytes
from mice immunised with heat killed P. aeruginosa are displayed on the table below
showing individual clusters and its corresponding frequencies. Mice immunised with
heat killed P. aeruginosa showed significant increase in percentage of cells in cluster
1 (Table 3.8).

127
3.8.6 Heatmap representative of metaclusters from t-SNE map of splenocytes
from heat killed P. aeruginosa immunised C57BL/6 mice.
For better visualisation of the data presented on t-SNE, heatmap that is very useful
for analysis of the heterogeneity of samples and phenotype of clusters (Verhagen et
al., 2018) was used, in the heatmap the metaclusters are represented as a row and
the phenotypical surface markers and transcription factors are represented as
columns, with the respective percentages of cells corresponding to each marker
written inside the cluster which makes the interpretation of the clusters much easier
(Figure 3.18). The colour scale values are attributed from 0 to 1 with 0 representing
clusters starting from 0 positive cells and red representing 1% of positive cells. The
colours in between represent median expression of the surface and transcription
factors markers. The black bold lines divide the three clusters that should be merged
according to the dendrogram.

128
Figure 3.18 Heatmap showing cluster overview and abundance. Heatmap of ILCs clusters (CD90+Lin-) showing median expression of 15
ILCs surface markers and 3 transcription factors from FlowSOM clustering analysis and metaclusters expression of markers detected on

129
splenocytes of heat-killed P. aeruginosa immunised C57BL/6 mice with ConsensusClusterPlus. A total of 10 metaclusters obtained from
FlowSOM analysis were analysed on heatmap with each row demonstrating a different metacluster and the markers are represented by column.
showing high expression of each of the surface markers and transcription factors (columns) and individual metaclusters (rows) based on
hierarchical clustering. The scale of value range from 0 to 1 for each of the markers and the percentage of positive cells for each marker is written
on each box representing the metacluster, blue colour for the lower expression 0% cells and red for the higher expression 1% cells. . The row on
the left of the heatmap represents the clusters. The dendrogram on the left indicates the similarities between the 10 clusters based in the frequency
of subsets and the values in brackets on the right indicates the size of the clusters. Different subsets were identified in clusters, RORγt expression
is high on cluster 10 which is an indicative of ILC3, T-bet which is expressed by ILC1 expression is high on cluster 9 and GATA-3 expression
which is an indicative of ILC2 is high on clusters 8, 9 and 10. Cells that are closely related tend to cluster next to each other, this explains why all
three transcription factors are next to each other.

130
3.8.7 Clusters with phenotypic similarities.
The heatmap demonstrate that some of the cells from the ten obtained clusters are
similar in their expression and could be merged together using the similarities that are
shown by the dendrogram to highlight the associations between clusters and markers.
The clusters to be merged are shown in the table by the same colour (Table 3.9).
Table 3.9 Clusters to be merged as per the dendrogram
3.8.8 Boxplot showing abundance of ILCs populations each sample
This analysis was performed to explore the variations within the sample. The diversity
between the PBS and heat killed P. aeruginosa immunised samples were observed.
Boxplots are a more efficient method of showing the differences in frequency of the
clusters with low abundance. Within the y axis the range of each cluster can be
visualised. From the data above it can be seen that samples from two different
conditions tend to be at different position within the cluster (Figure 3.19).

131

132

133
Figure 3.19 Boxplots representation of the clusters defined by FlowSOM.
Boxplots representing the abundance of 10 metaclusters frequency in each sample
from splenocytes of C57BL/6 mice receiving PBS immunisation (Cond1) or heat killed
P. aeruginosa immunisation (Cond2). The values for the two conditions are indicated
by different colours: Purple for PBS immunised and orange for heat killed P.
aeruginosa immunised. Values from each mouse were reported using different
symbols. Data represented as boxplots for statistical comparison for abundance of
surface markers expressed between the PBS immunised (naïve) and the heat killed

134
P. aeruginosa immunised (Lin-CD90+) groups. The difference between each of the ten
clusters from each group (PBS and HK P. aeruginosa) show significance for cluster
2: CD44,CD196,ki67 (p<0.08), cluster 6: SCA1,CD90.2, CD45Rβ, CD117 (p<0.09),
cluster7: CD49b, CD45Rβ, T-bet (p<0.04) and cluster 9: CD90, CD49b, CD44,
CD196, T-bet (p<0.03). Mann-Whitney test was used to analyse the statistical
difference between groups. Metaclusters with FDR < 0.05 were considered
significant.
The FlowSOM analysis has shown increased expression of surface markers within
the immunised group. The beneficial role of ILCs during an immune response has
been described before in mice (Rankin., et al., 2016) and human (Hepworth et al.,
2015). Different analysis of cell population abundancy and markers expression were
carried out using metaclusters from FlowSOM data, a process that started with the
automated clustering of the data obtained by Flow cytometry for identification of the
different ILCs subsets by the expression of different markers and transcription factors
followed by further analysis through different methods of data presentation.
Although ILCs are a new discovered family of innate lymphoid cells, these cells are
known to play important roles in diseases that are known for a long time (Ebbo et al.,
2017b). From the numerous studies that have found the ILCs that are widely known
for their protective role in immunity are implicated in a large number of diseases came
the need to have better techniques and analytical packages to provide more
information of how and why these cells are upregulated or downregulated during
disease progression. Nevertheless, in most tissues ILCs are present on very small
numbers (Nagakumar et al., 2019) and as different subsets are implicated on different
diseases (Gregory et al., 2015), a distinct knowledge is required in order to be able to
distinguish which subsets are not performing the protective role and the FlowSom
analysis with t-SNE mapping can be a valuable tool to study these subsets and
possible sub-subsets.

135
3.8 Discussion
This research presented within this chapter characterise the phenotype and cytokine
production of HK P. aeruginosa versus naïve ILCs. Surface cell markers, cytokine
profile, transcription factors, memory cell markers of ILCs were analysed. Looking at
phenotypic changes of cells immunised with HK Pa or with PBS it was possible to see
that some of the markers are upregulated or downregulated due to the immunisation
(Figures 3.2 and 3.3). Although no significance as observed in most of the
upregulation was seen in some markers associated with ILC3 such as CD25, CD128,
c-kit, CCR6, IL-23R and in markers from other subsets. The transcription factor RORүt
was significantly increased on day post immunisation with HK Pa (Figure 3.4).
Analysis of the surface proteins CD44 and CD62L has given a result that has been
already reported on T cells (Gerberick et al., 1997), the CD44 surface marker was
show an increase in surface expression that corresponds to the increase in days of
time points. The CD44 significantly increased from day 7 up to day 28 whereas the
expression of the CD62L marker decreased as the time points increased (Figure 3.5),
the expression of CD44 and CD62L during normal and inflammatory state by ILCs is
does mirror the behaviour of CD44 and CD62L on T cells under the same conditions.
When looking on how IL-17A, IL-22 and IFN-ү cytokines are produced during an
inflammatory response it was observed that exposure to HK P. aeruginosa induced
and transient but not significant upregulation of IFN-γ production (Figure 3.6) that is
very important to activate macrophages, from ILCs at 7 days post exposure. This was
a non-specific response as it was observed when the cells were stimulated with cell
stim or Con A. It is likely that this heightened response is as a result of in vivo
activation of the cells as this has previously been observed for NK cells (Sun et al.,
2011). This activated state is clearly rapidly resolved as the significant elevation in
response was not observed at day 14.
Production of IL-22 cytokines was significantly increased on the heat killed P.
aeruginosa immunised group (Figure 3.8). Not a lot of information is available about
the phenotypic changes that occur on ILCs during an immune response, in this
chapter the known markers are being analysed to gather information about their
behaviour under normal and after immunisation state.
Both IL-17A and IL-22 cytokines are reported to be secreted by ILC3, during an
inflammatory response the IL-17A production is increased to recruit neutrophils
(Seillet et al., 2014b) whereas IL-22 are involved in the elimination of extracellular

136
pathogen and in tissue repair (Lo et al., 2019). The expression of IL-17A was not
significantly increased (Figure 3.7) and IL-22 was significantly expressed during the
first hours post immunisation; these results suggest involvement of ILCs in the
production of IL-22 mediating the inflammatory process, as these cells are able to
response fast and to produce large amounts of cytokine at the start of the
inflammation (Ardain et al., 2019).
The immune response was mainly characterised by the production of the cytokine IL-
22, suggestive of ILC3 involvement. Previous experiments using mice that lack the
IL-17 receptor (IL17ra) or in which an antibody was used to block IL-17A have shown
that in this situations mice are not able to effectively fight an infectious disease
(Paudel et al., 2019) and IL-22 cytokine is important to contain the infection and for
tissue repair (Sabat et al., 2014). IL-17 is cytokine produced by lymphocytes, has
inflammatory properties and is involved in the provision of an immune response
against bacterial and fungal infection (André Gladiator et al., 2013).
The use of multiparameter analysis such as flow cytometry has made it possible to
identify within a population of cells which cells are producing what type of cytokine at
a given moment. ILC cells control the immune system through the production and
release of cytokines (Dzopalić et al., 2019). Low doses of exogenous cytokines (IL-
12, IL-15, IL-18 and IL-23) from the common-γ chain family were used to boost the
proliferative responses to bacterial infection for intracellular cytokine flow cytometry
(ICC) analysis. To analyse whether the observed increase of cytokines by ILCs also
correlate with proliferation of these cells, an in vitro proliferation assay experiment
was carried out to assess the growth of ILCs subsets under different conditions. Cells
were labelled with Cell trace violet and stimulated under different conditions was
performed but no proliferation was observed within the stimulated ILC cells population
(data not shown).
Due to the morphological similarities of ILCs to their adaptive immune system
counterparts, their small population size and the limited number of channels in the
flow cytometer analysers can be difficult the diverse subsets of ILCs and to elucidate
the contributions of ILCs on pathology and resolution of inflammation. For that reason,
FlowSOM and t-SNE were used to aid in the identification of the different ILC subsets
from spleen of mice immunised with PBS or het killed P. aeruginosa, based on
simultaneously identification expression of their phenotypic surface markers and
transcription factors expressed by the different subsets which allowed comparison

137
between the subsets that were responding to the immunisation with heat killed P.
aeruginosa against those that were only immunised with PBS.
The hypothesis for this chapter was that it would be possible to identify differences on
samples from the PBS and heat killed immunised groups using t-SNE map. The t-
SNE map representation (Figure 3.13) shows clear difference between the two
treated groups (Figure 3.9), except one of the three samples from each treatment
that seems to have been wrongly assigned (Figure 3.17). The samples that are
correctly placed indicate that the immunisations have tailored the immune response
as the samples from each group are located in different sides of the map and away
from each other and the P. aeruginosa samples were higher up on the scale.
ILCs which initially expressed RORγt can downregulate RORγt and start producing
T-bet and be then considered ex-ILC3 and ILC1s (Kotas & Locksley, 2018). These
changes might have been caused by intrinsic factors and looking into gene profile
would shed a light into what happens inside the cell.
Plasticity within innate lymphoid cells subsets has been reported recently (Koh et al.,
2019), most of the cases involving the subsets ILC1 which express the transcription
factor T-bet and ILC3 that express the transcription factor RORγt. The presentation
of the data on t-SNE symphony data show a rare subset as most of the ILCs are
RORγt T-bet double positive (Table 3.9), and ILC1 can under certain environmental
conditions convert to ILC3 and become IL-17 cytokine producer in liver (Y. Liu et al.,
2019). Another study has also reported that T-bet is expressed on ILC3 during
infection with gram negative C. rodentium bacterium where it is important for the
recognition, effector function and migration of ILC3 (Rankin., & Mielke, 2016).
The previous significance observed when analysing the samples was lost when FDR
was taken into account, this was probably because of the small number of samples
used in this analysis (data not shown).
When analysing data with FlowSOM it is better to select a high number of clusters to
maximise the chances of include rare cell populations such as ILCs (Weber &
Robinson, 2016). This experiment was set for identification of ILCs subsets using a
19-colour panel. The clustered samples with dots representing individual samples
with group colours to represent the match between samples were also presented as
heat map for heterogeneity and as boxplots for quantitative analysis.
The workflow for this study was set to begin with the creation of the MDS plot (Figure
3.13) to serve as a quality control stage for observation of the work design and

138
samples outline. Then was the cell clustering for identification of cell populations
followed by further analysis such as cell abundance, marker expression within the
sample and within populations. With the clustering analysis being considered one
most important stage as all other downstream analysis accuracy depend on how well
the clustering is done.
Innovative techniques are been used to analyse several cellular parameters at a
single cell level and at once with the purpose of gaining better understanding of the
status of the immune cells during a pathological process. In this chapter, populations
of interest were isolated using clusters generated by a program known as FlowSOM,
using samples from PBS or heat killed P. aeruginosa immunised mice. It was found
that markers associated with memory were significantly elevated on the P. aeruginosa
immunised mice compared with the PBS group, the same results that we would have
expected using flow cytometry followed by manual gating but with the advantage that
with FlowSOM the entire cell population are analysed instead of just the populations
that are considered of interest, no need for compensation due to spectral overlap and
a lot more cells can be analysed in a short period of time. But downfalls also exist as
the data used for this type of analysis is acquired from different analysers, it starts
with the flow cytometer for posterior analysis using FlowSom and t-SNE mapping and
it may affect the data.

139
CHAPTER 4 - DEMONSTRATION OF NEUTROPHILS
RECRUITMENT BY ILC CELLS DURING AN IMMUNE
RESPONSE.
140
4.1 Introduction
Despite the remarkable success achieved through vaccines, antibiotics and public
health programs, microbial diseases are behind the death of thousands each year
through new and re-emerging diseases (Peterson & Kaur, 2018). Recently,
immunological memory features have been documented within the Innate Lymphoid
Cell (ILC) natural killer (NK), cells a subset of ILCs (Kleinnijenhuis et al., 2014).
The infections caused by P. aeruginosa are a serious problem causing millions of
deaths each year with the most critically cases occurring due to inability of the immune
system to effectively fight the infection. During an infectious or inflammatory process
cells are recruited to the site of infection as part of the immune response (Puga &
Cerutti, 2012) to fight and to leave behind cells that will be ready available to fight the
same pathogen in a much quicker and effective way than in the previous encounter
but the number of cells left is lower compared to the number of cells involved during
the first encounter with the pathogen but they can quickly expand .
The term immunity is used to describe the body’s ability to resist to an infectious agent
or foreign to the body, to everything that is recognised as non-self, and to protect the
body against the recognised threat by a non-specific mechanism of defence through
the action of chemical, physical and cellular components that function to maintain the
homeostasis (Kaur & Secord, 2019). Acquired immunity offers protection against
pathogens through lymphocytic responses that are highly specific against a pathogen
that have already encountered this is known as immunological memory (Akira et al.,
2006b), that are capable of retaining information from a previous encountered
pathogen and use that stored information as the host’s advantage if encountering the
same pathogen (Peng & Tian, 2017; Martinez-Gonzalez et al., 2017).
The WHO have categorised the organisms for which there is a need for new
treatments, due to the rapid emergence of antibiotic resistance. P. aeruginosa is one
of three bacteria in the top category, for which there is an urgent priority for new
treatments (World Health Organization (WHO), 2017).
An initial pilot experiment was conducted in the Ingram laboratory in which outbred
C57BL/6N mice immunised with heat-killed P. aeruginosa or control group PBS
(sham-immunised), ten days later ILCs from the immunised (memory ILCs) or control
(naïve ILCs) were isolated and transferred to unexposed mice which were

141
simultaneously challenged with live bacteria. The group of mice injected with heat-
killed bacteria were able to clear the bacterial infection as well as to resolve the
inflammatory response in a more rapid manner than the control animals (Muir et al.,
2016).
This chapter intends to demonstrate that ILCs, more precisely the group 3 ILC play
an important role in memory response against the gram-negative. ILC3s have been
shown to be the subset of cells involved in the response to extracellular bacterial
pathogens (Forkel & Mjösberg, 2016). At the end of this chapter it was clear that ILCs
played an important role in clearing infection caused by P. aeruginosa through
modulation of IL-17A and IL-22 cytokines which are produced by the ILC3 subset and
that the protective response was specific.
4.2. Aims
The aim of this chapter is to
• Examine whether prior immunisation with P. aeruginosa offers protection
against subsequent infection with the same pathogen using in vivo models of
infection.
• To examine the protective effect of innate and memory ILC to bacterial
infection and the phenotypical changes.
• To establish the range of protection that can be elicited.
• To examine whether intraperitoneal (i.p.) immunisation of different strains of
bacteria followed by i.p. infection with P. aeruginosa will provide a specific or
non-specific immune response.

142
4.3 Methods
4.3.1 Mice
Age and sex matched aged between 8 to 12 weeks old Rag 1 KO mice were originally
purchased from Jackson Laboratories and then bred in house (section 2.3.1), the cγ
DKO (R2G2) were purchased from Taconic. The RAG1 deficient (RAG1 ko) mice
were of a C57BL/6 background in which a mutation was created to stop T and B cell
from differentiating at a very early stage of their development to render them inability
to rearrange their receptors and as a consequence RAG1 KO do not possess T or B
cells within their lymphoid organs.
4.3.1.1 Mice immunisation
To study the dynamics and effects of the administration of immunisation using heat
killed bacteria, age and sex matched C57BL/6 Rag1 Ko mice were used to create the
inflammatory environment cause by P. aeruginosa infection. Mice were administered
i.p. either 100 µl of heat killed P. aeruginosa (section 2.2.1) or endotoxin free PBS
control intraperitoneally (section 2.3.2). Mice were monitored daily.
For the time course experiment mice were immunised at predetermined time point,
the immunised mice were weighed and inoculated with 106 P. aeruginosa
intraperitoneally (section 2.3.2). The mice were carefully monitored and 6h post
infection the animals were culled, and peritoneal lavage (section 2.3.5) and spleen
(section 2.3.6) collected.
4.3.1.2 In vivo infection
Mice previously immunised via i.p. injection as in section 2.3.2 were infected with 100
µl i.p. of live bacteria using a 1ml syringe, 10 days post immunisation and culled 6
hours post infection by schedule 1 (section 2.3.4). Peritoneal lavage and spleen were
harvested (section 2.3.5 and 2.3.6). The mice were carefully weighed and monitored
daily. Ten days post immunisation they were inoculated with a non-lethal dose of
bacteria. The mice were then monitored every 2 to 4 hours any animals reaching the
pre-determined humane end point defined in the Home Office license (PLL2700/2807)
were culled and the time post infection noted. In the survival experiment the difference

143
in survival time between the immunised and control animals was then analysed
(section 4.7.1).
4.3.1.3 Bacterial culture
For the specificity experiment banked clinical isolates, from CF patients, of
Pseudomonas aeruginosa (Q502), staphylococcus aureus (Q181) and E. coli
(0157:H7) were grown overnight on plates containing cetrimide media (Sigma, UK),
for P. aeruginosa and mannitol (Sigma, UK) for S. aureus sand nutrient agar for E.
coli at 37° C. After the overnight incubation a single colony selected from the plate
were inoculated on growth media nutrient broth (Sigma, UK) overnight at 37°C and
200 rpm. Just before the infection the bacteria were washed 3 times with endotoxin
free sterile PBS. The obtained cell pellet was resuspended in 700µl of sterile PBS and
the optical density adjusted at 600 nm (OD600) to 0.25 and kept on ice until inoculated
(section 2.2). The number of bacteria inoculated was confirmed by plating serial
dilutions of the prepared suspension on the appropriate medium.
4.3.1.4 Determination of Bacterial burden following immunisation/infection
The immunised and/or infected mice (section 2.3.2 and 2.3.3) were culled, peritoneal
lavage (section 2.3.5) and spleen (section 2.3.6) collected. The bacterial burden
within the peritoneal lavage fluid and spleen were determined by serial dilution
(section 2.2.5) and plating onto selective media (section 2.2.1).
4.3.2 Flow cytometry
For flow staining (section 2.5) the cells were characterised as CD90 positive and
CD90 negative populations. The cells were stained with antibodies, the following
antibodies of CD45 (FITC), CD90 (Pacific Blue), Gr-1 (PE), CD11b (e660) F4/80
(PECy7) (eBioscience) and incubated at room temperature for 30 minutes. The
stained cells were analysed within 24 hours on flow cytometer (FACS Canto, Becton
Dickinson, UK). The acquired events were analysed with FlowJo software (Tree star,
Inc).

144
Table 4.1 Antibodies used for neutrophil infiltration
Cell surface marker
Clone Isotype Fluorochrome conjugate
Dilution Manufacturer
Anti-mouse CD90
53-2.1 Rat IgG2a
PacificBlue 0.25µg eBioscience
Anti-mouse CD11b
M1/70 Rat IgG2b, k
e660 0.06µg eBioscience
Anti-mouse F4/80
BM8 Rat IgG2a, k
PECy7 0.25µg eBioscience
Anti-mouse Gr-1
RB6-8C5 Rat IgG2b, k
PE 0.06µ eBioscience
Anti-mouse CD45
30-F11 Rat IgG2b, k
FITC 0.5µg eBioscience
4.3.2.1 Gating strategies for flow cytometry analysis
The live cell population from the peritoneal lavage and spleen were identified by gating
on forward scatter (FSC) and side scatter (SSC) for live cells and CD90 for ILCs
(Figure 2.1). On forward scatter (FSC) and side scatter (SSC) for live cells and then
further gated into CD45+ cells then further gate for macrophage population (F4/80+)
(Figure 2.2) and neutrophil population (Gr-1+) (Figure2.3).
4.4 In vivo CD90 Depletion
To investigate the effect of CD90 depletion, C57BL/6 Rag1 ko mice were purchased
from the BSU, bred and maintained at the BSU. Anti CD90 mAb (30H12) was
purchase from BioXCell (UK) this antibody has been proved effective in deplete CD90
cell population on previous studies (Moskalenko et al., 2015; Haeryfar., 2005). Age
and sex matched mice were treated with anti-CD90 mAb, the spleens were harvested,
and the peritoneal lavage collected, a single cell suspension were prepared and
stained with monoclonal antibodies as listed in material and methods.
Depletion of the population of interest was obtained by in vivo mAb administration of
either anti-CD90 antibody or isotype control (BioXcell). C57BL/6 Rag1 Ko mice were
intraperitoneally injected with 100 µl of heat killed P. aeruginosa or with 100 µl of PBS
on day -7, on day -1 the mice were intraperitoneally injected with anti-CD90 (Thy1.2)
mAb 0.6mg (BioXcell), USA) to deplete the CD90+ cell population or with
immunoglobulin G (IgG) isotype control 0.5mg (BioXcell, USA). On day zero mice
were again i.p. injected with anti-CD90 mAb (BioXcell, USA) to deplete the CD90+ cell

145
population or with immunoglobulin G (IgG) isotype control (BioXcell, USA) and
simultaneously injected with 5x10⁵ of live bacteria and sacrificed 20 hours post
infection, and peritoneal lavage collected for CFUs plating. The samples were
prepared as described in materials and methods (section 2.3.2 and 2.3.3).
Source: My own illustration
Figure 4.1 Illustration of CD90 in vivo depletion. Two groups of mice previously
immunised with heat killed P. aeruginosa or PBS, were injected with either anti-CD90
depleting antibody or isotype control seven days post immunisation. On day 0 both
groups were either injected with anti-CD90 or isotype control and both groups were
also infected with live P. aeruginosa and sacrificed 20 hours post infection. Spleen
and peritoneal lavage were collected on a falcon tube that was placed on ice until
taken to the lab. Aliquots of peritoneal lavage and samples mushed spleen were
plated for quantification by serial dilution, some kept for ELISA or stained for flow
analyses.
4.5 NK1.1 Depletion
To study the protection given by ILCs against bacterial infection mice were previously
immunised with 100 µl of heat killed P. aeruginosa, then sacrificed as in section 2.3.4.
On day 7 after immunisations mice were depleted for NK1.1 cells by in vivo
intraperitoneally administration of 200 µg of monoclonal antibodies anti NK1.1
(PK136) (BioXcell) in 100 µl of sterile PBS or 200 µg of isotype control IgG2a in 100
µl of sterile PBS. Spleens were harvested 72 hours post depletion as in section 2.3.4.
Bacteria for infection were cultured overnight in 10 ml of broth growth media at 37˚C
on a shaker and the OD adjusted and the desired OD600 injected in the mice as in
section 2.2. Phenotypic functional analysis of the immune cells from peritoneal
lavage was performed using antibodies against CD90, CD45 and F4/80.
146
4.6 Statistical analysis
The statistical significance was determinate by One-way ANOVA or Mann-Whitney
test used to analyse the statistical difference between groups of mice that have
received immunisation with heat killed P. aeruginosa or PBS. Using FlowJo software
Prism v5 (BD Bioscience, UK). p<0.05 was considered significant.
4.7 Results
4.7.1 RAG1 KO survival
Memory features of adaptive immune system have been reported in the population of
innate immune cells called ILCs and lacking the antigen-specific receptors of the
adaptive immune system. To test this theory, mice were immunised with P.
aeruginosa one of the bacterial species causatives of lethal infections. The mice
lacking B and T cells were first i.p. injected with either PBS (sham) or heat killed P.
aeruginosa. Ten days later, the mice received a nonlethal dose of live bacteria P.
aeruginosa (1x10⁶ CFU/mouse). The mice that were i.p. injected with PBS was used
as control group. The mice were monitored for 48 hours post infection for survival
rate. (Figure 4.2). The mice that were immunised with heat killed bacteria prior to
infection show protection against P. aeruginosa infection as demonstrated by the
increase in survival rate compared with the group of mice that were immunised with
PBS (p< 0.05, log rank (Mantel-Cox) test).

147
Figure 4.2 Immunisation with heat killed P. aeruginosa increases the survival
rate. Survival rate of RAG1 KO mice to a non-lethal injection of live P. aeruginosa
protects mice in a T/B independent manner. Survival rate of Rag1 ko mice immunised
with heat killed P. aeruginosa (red bar) or PBS (blue bar), 10 days prior to infection
with P. aeruginosa. Survival rates are higher in the heat killed immunised group. Data
is presented as mean+SEM. The statistical significance is indicated as *(p<0.05) (n
=6).
4.7.2 RAG1 KO Time course
In order to verify the duration of the protective effect seen on the previous experiment,
mice that were immunised up to 21 days prior to infection with a harmless bacterium
due to its inactivation by heat. Pre immunisation of the mice at 7, 14 and 21 days
prior to infection decreased the bacterial infection compared to the control group
which did not receive any immunisation. Although, the most effective response was
seen in day 7 there was still a good response on days 14 and 21, 6 hours post infection
there was a decrease in bacterial load in both peritoneal lavage and spleen.

148
CFUs Peritoneal Lavage
0 7 14 214.0100
4.5100
5.0100
5.5100
*** ** **
Days post immunisation
CF
U/m
l P
L
CFUs Spleen
0 7 14 213.0100
3.5100
4.0100
4.5100
5.0100
*** * *
Days post immunisation
CF
U/m
l sp
leen
Figure 4.3 Bacterial count of P. aeruginosa on a time course experiment of
immunised and non-immunised RAG1 KO. To study the duration of protection
given by ILCs against bacterial infection when previously immunised with heat killed
P. aeruginosa, immunisations given to different groups at a different time points (Day
0, 7, 14 and 21). Peritoneal cell counts are unchanged with the immunisation and
infection. RAG1 KO mice (Groups -21 to -7) (n=3 to n=5) were immunised at different
time points and infected i.p. on day 0 with P. aeruginosa 1.6x10⁶ (Groups -21 to 0).
Mice were culled 6 hours post infection. Protection was assessed by comparison of
the bacterial load in peritoneal lavage (A) and spleen (B). A significant reduction was
observed in the bacterial burden of all mice previously immunised with heat killer P.
aeruginosa. Data is presented as mean+SEM. The statistical significance is indicated
as *(p<0.05), **(p<0.01), ***(p<0.001) (n=3-6 spleen).
4.7.3 Cytokine measurement analysis
It has been reported in previous studies that IL-17A and IFN-γ have a beneficial role
during pathogen invasion and that they do it by promoting inflammation (Sonnenberg
et al., 2010). To further analyse the magnitude of the inflammatory response and its
relationship with pro-inflammatory cytokines, the levels of pro-inflammatory cytokines
IL-17A and IFN-γ were quantified using commercial ELISA kits (eBioscience, UK).
Phenotypic functional analysis of the immune cells from peritoneal lavage was
performed using antibodies against CD90, CD45, CD11b and F4/80.
A B
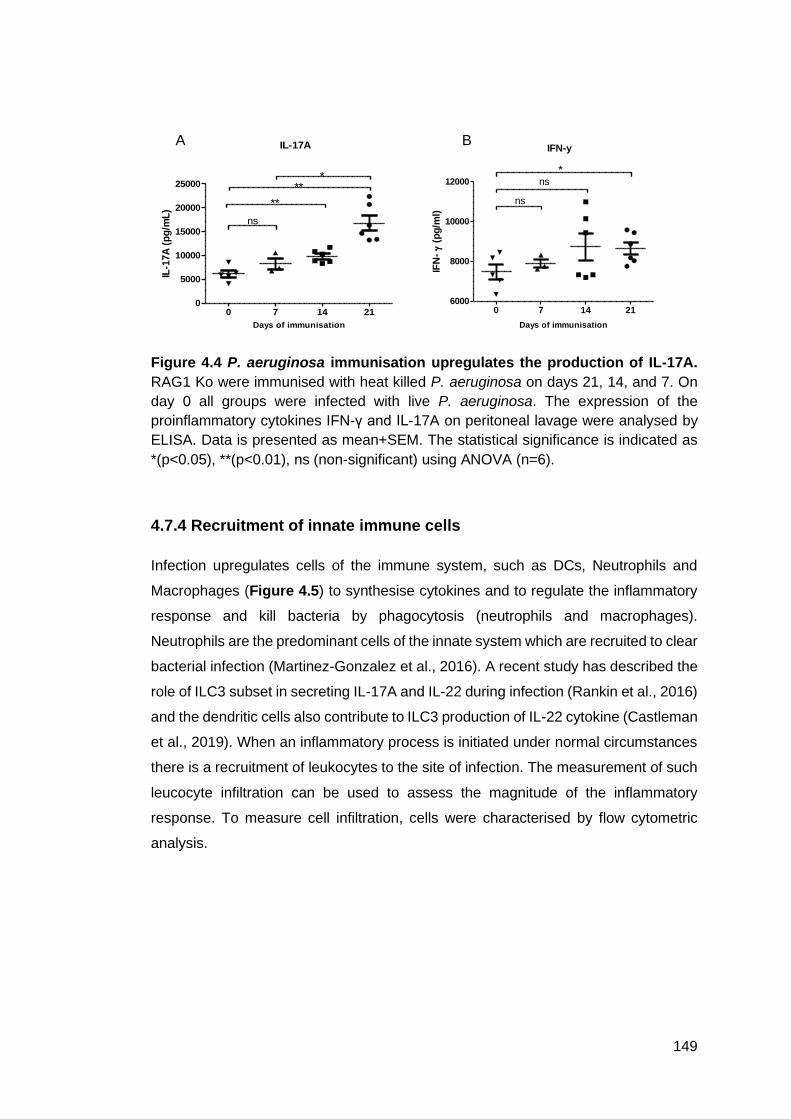
149
IL-17A
0 7 14 210
5000
10000
15000
20000
25000
ns
**
***
Days of immunisation
IL-1
7A
(p
g/m
L)
Figure 4.4 P. aeruginosa immunisation upregulates the production of IL-17A.
RAG1 Ko were immunised with heat killed P. aeruginosa on days 21, 14, and 7. On
day 0 all groups were infected with live P. aeruginosa. The expression of the
proinflammatory cytokines IFN-γ and IL-17A on peritoneal lavage were analysed by
ELISA. Data is presented as mean+SEM. The statistical significance is indicated as
*(p<0.05), **(p<0.01), ns (non-significant) using ANOVA (n=6).
4.7.4 Recruitment of innate immune cells
Infection upregulates cells of the immune system, such as DCs, Neutrophils and
Macrophages (Figure 4.5) to synthesise cytokines and to regulate the inflammatory
response and kill bacteria by phagocytosis (neutrophils and macrophages).
Neutrophils are the predominant cells of the innate system which are recruited to clear
bacterial infection (Martinez-Gonzalez et al., 2016). A recent study has described the
role of ILC3 subset in secreting IL-17A and IL-22 during infection (Rankin et al., 2016)
and the dendritic cells also contribute to ILC3 production of IL-22 cytokine (Castleman
et al., 2019). When an inflammatory process is initiated under normal circumstances
there is a recruitment of leukocytes to the site of infection. The measurement of such
leucocyte infiltration can be used to assess the magnitude of the inflammatory
response. To measure cell infiltration, cells were characterised by flow cytometric
analysis.
IFN-y
0 7 14 216000
8000
10000
12000
ns
ns*
Days of immunisation
IFN
- (
pg
/ml)
A B

150
Day 0 Day 7 Day 14 Day 210
10
20
30
40
50
*
*****
Days of immunisation
ILC
s (
%)
po
sit
ive
ce
lls
Day 0 Day 7 Day 14 Day 210
5
10
15***
***
ns
Days of immunisation
Macro
ph
ag
es (
%)
po
sit
ive
ce
lls
Day 0 Day 7 Day 14 Day 210
20
40
60
80
100 **
**
*
Days of immunisation
Ne
utr
op
hils (
%)
po
sit
ive
ce
lls
Day 0 Day -7 Day -14 Day -210
20
40
60
80
100
**
***
Days of immunisation
DC
s (
%)
po
sit
ive
ce
lls
Figure 4.5 Immune cells were enhanced in peritoneal lavage following
immunisation and infection by P. aeruginosa. Mice were injected with 100μl of
heat killed P. aeruginosa at different time points and infected with live P. aeruginosa
on day 0. Graphs show a prominent ILCs (CD90+ Lin-) (A), (B) Macrophages (F4/80+),
(C) Neutrophils (Gr-1+), (D) Dendritic cells (CD11c+) from day 7 in peritoneal lavage.
Cell count was done on peritoneal lavage and a single cell suspension of peritoneal
lavage was stained for cytometric analysis of ILCs, macrophages, neutrophils and
dendritic cells. Data is presented as mean+SEM. The statistical significance is
indicated as *(p<0.05), **(p<0.01), ***(p<0.001), ns (non-significant) (n=3-6).
4.7.5 RAG1 KO in vivo CD90 depletion
In the previous experiment increased level of macrophages and neutrophils were
observed, as macrophages have also been reported to have immunological memory
through trained immunity. Therefore, to confirm the role of lymphocytes in this
immunological response CD90+ cells depletion was carried out.
C
A B
D

151
Given the fact that total isolation of the effects of ILCs from the other cells of the
adaptive immune system is difficult to achieve, because they are interconnected, to
facilitate study the effect of depleting ILC cells, mice deficient on cells of the adaptive
immune system were used and antibody against CD90+ or control IgG were injected
into Rag ko. The Thy1 antibody depleted CD90+ cells. To verify the role of ILCs in
restraining P. aeruginosa growth in spleen and peritoneal lavage, depleting
monoclonal antibody (mAb) were administered targeting CD90.2 or an isotope-
matched control antibody (Isotype), in vivo, 24 h prior to infection to deplete the mouse
immune system from all CD90+ cell populations.
In this experiment, the CD90 depletion was successful and the immunisations
protected the animals that had been immunised and injected with isotype control
instead of anti-CD90. T cell negative Rag1 ko mice were intraperitoneally injected with
125µg of anti-Thy1.2 specific depleting antibody (30H12) or control IgG (LTF-2) from
BioXcell into RAG1 ko mice, seven days after immunisation and 24 hours prior to
culling (Figure 4.6). One of the downfalls of that technique is the variability in the cell
depletion, and the Thy-1 is not a mark that is only present on lymphocytes but is also
present in many other cell types such as stem cells and neurons.
The requirement of ILCs for the innate immunological memory has been shown
previously, when Rag 1 KO mice (lacking T and B cells) are immunised with heat
killed P. aeruginosa, there is enhanced survival and reduced CFU upon subsequent
challenge. Depletion of the ILCs achieved by treating mice with antibody against the
alloantigen Thy-1 eliminates the protection and is a good approach to study the
function of ILCs, by creating an environment that is free from ILCs and compare the
results with those from ILC positive environment.

152
Figure 4.6 Effect of CD90 depletion in RAG1 KO after P. aeruginosa infection in
ILC depleted mice compared to isotype control. RAG1 KO mice were immunised
with 100 µl heat killed P. aeruginosa or PBS (n=5) on day 0, treated with CD90 (30-
H-12) depleting antibodies (0.6mg) or control isotype (0.5mg) on day 7 and on day 8
before being infected with live P. aeruginosa (OD:0.24), 1.0x10⁶, and culled 6 hours
after infection. A significant increase in CFUs was noted in CD90 depleted mice from
both groups and in the isotype control group from the PBS group. Data is presented
as mean+SEM. The statistical significance is indicated as *(p<0.05) and ns (non-
significant).
4.7.6 NK1.1 in vivo depletion
The CD90+ cells have an important role in immune protection and pathogen
clearance, to analyse whether the absence of this population would compromise the
effectiveness of the immune response by limiting pathogen clearance an experiment
was set up to examine the influence of ILCs in peritoneal lavage. in a previous
experiment an Isotype-matched control antibody (isotype) or depleting monoclonal
antibody (mAb) to CD90.2 were administered in vivo to infected and non-infected
Rag1-/- mice. Neutrophils are also recruited to fight against bacterial infection where
they are vital for defence. In the absence of NK cells and since ILCs do not interact
directly with the invading pathogen it is sensible to believe that neutrophils are the
other innate cell type being recruited to play a role in the clearance and prevention of

153
P. aeruginosa infection and dissemination, and that these phagocytes are being
recruited by ILCs.
As some NK cells can also express CD90.2 after activation, in this experiment mice
were treated with mAb to NK1.1 to allow direct comparison of depletion of ILCs
mediated by anti-CD90.2 versus the depletion of NK1.1 cell, a cell marker expressed
by NK cells (Carlyle et al., 2006).
Previous administration of anti-CD90 antibody successfully depleted the peritoneal
ILC cells (CD90+), treatment with anti-NK1.1 did not ameliorate the protective effect
of vaccination with heat killed P. aeruginosa 10 days prior to infection, as in both the
isotype and the anti-NK1.1 there was a significant reduction in the bacterial burden in
the immunised animals (Figure 4.7). Consequently, it was possible to analyse
whether CD90+ depletion is able to affect bacterial loads in peritoneal lavage
compared with those of the isotype treated group.
Isotype NK1.1 Isotype NK1.10
5.0106
1.0107
1.5107
2.0107
PBS Hk
ns
***
CF
U/m
l
Figure 4.7 Effect of NK 1.1 depletion in RAG1 KO mice after P. aeruginosa
infection compared to isotype control. RAG1 KO mice were immunised with P.
aeruginosa 106 (n=5-7) or PBS (n=3) on day 0, treated with anti-NK1.1 (PK 136)
depleting antibodies or control isotype on day 7 and on day 8, infected with P.
aeruginosa (OD:0.24), 1.0x10⁶ on day 10, and culled 6 hours after infection. A
significant difference in CFUs was observed between both NK 1.1 depleted group and
the isotype control group from P. aeruginosa immunised and PBS immunised groups.
But the difference was non-significant between both groups from the P. aeruginosa
immunised group. The data is presented as mean+SEM. The statistical significance
is indicated as *(p<0.05), **(p<0.01) (One-way ANOVA).

154
4.7.7 RAG1 Ko and cγ DKO infection
In the previous experiment, the depletion of NK population on RAG1 KO mice did not
have a negative impact on the P. aeruginosa immunised group. To test the possibility
of ILCs being involved in the protection observed before mice lacking ILCs (Rag cү
DKO) were immunised with PBS or HK P. aeruginosa. The fact that no significant
difference was observed on the control and P. aeruginosa immunised groups from
ILC negative groups and increased protection was found within the ILC positive
groups as compared to the ILC negative (Figure 4.8), this observation suggests a
protective role of ILCs during bacterial infection when challenged after previous
exposure to the pathogen. This finding implicates ILC as key factor by which bacterial
infection can be disrupted in the absence of the adaptive immune system.
Figure 4.8 Immunisation with heat killed P. aeruginosa promote resistance to
bacterial infection in ILC dependent manner (n=7). Mice immunised with heat
killed P. aeruginosa or PBS prior to infection with live P. aeruginosa, mice were
sacrificed on day 10 after immunisations. On day 10 all groups of mice were infected
with P. aeruginosa and culled 6 hours post infection and the peritoneal lavage
collected for plating. The mice lacking ILCs has no distinct difference between the
immunised and control group whereas ILC positive mice shows a significant
difference between the immunised and the control group. Data is presented as
mean+SEM. The statistical significance is indicated as *(p<0.05), ns (non-significant)
One-way ANOVA.
PBS Hk PBS Hk0
2.0101 0
4.0101 0
6.0101 0
8.0101 0
1.0101 1
1.2101 1
1.4101 1
Rag c DKO Rag 1 KO
ns *
CF
U/m
l
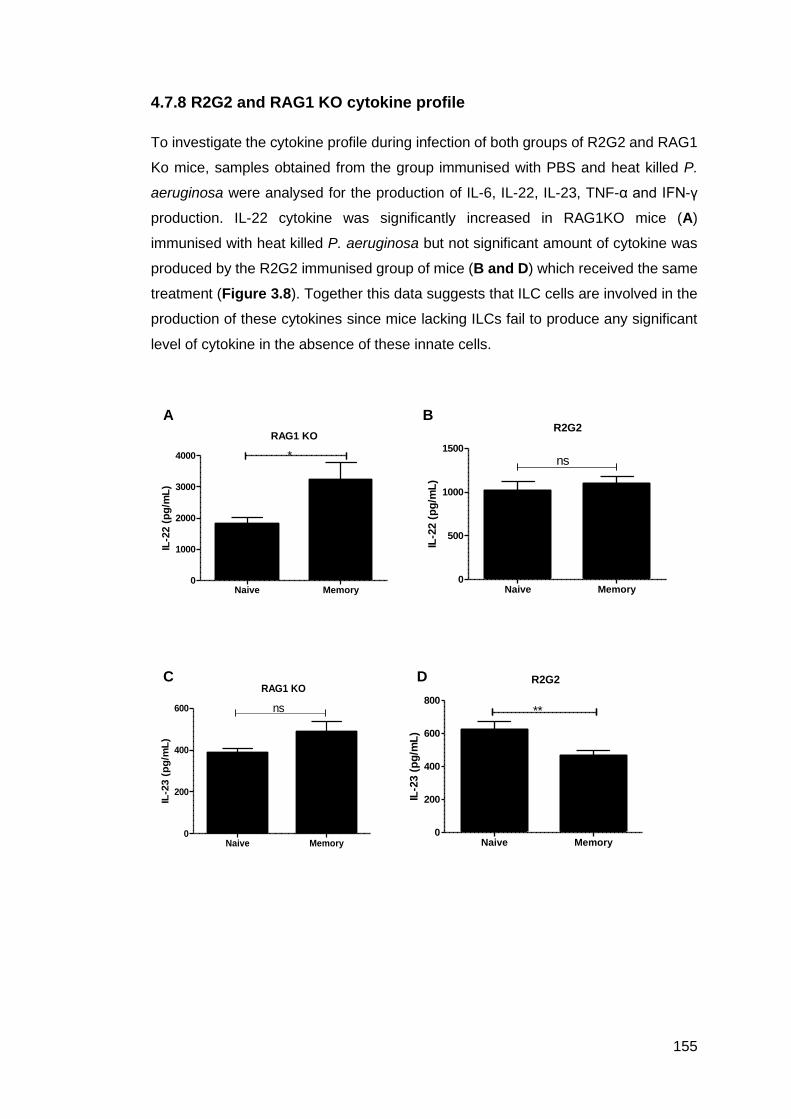
155
4.7.8 R2G2 and RAG1 KO cytokine profile
To investigate the cytokine profile during infection of both groups of R2G2 and RAG1
Ko mice, samples obtained from the group immunised with PBS and heat killed P.
aeruginosa were analysed for the production of IL-6, IL-22, IL-23, TNF-α and IFN-γ
production. IL-22 cytokine was significantly increased in RAG1KO mice (A)
immunised with heat killed P. aeruginosa but not significant amount of cytokine was
produced by the R2G2 immunised group of mice (B and D) which received the same
treatment (Figure 3.8). Together this data suggests that ILC cells are involved in the
production of these cytokines since mice lacking ILCs fail to produce any significant
level of cytokine in the absence of these innate cells.
Naive Memory0
500
1000
1500
R2G2
ns
IL-2
2 (
pg
/mL
)
Naive Memory0
200
400
600
RAG1 KO
ns
IL-2
3 (
pg
/mL
)
Naive Memory0
1000
2000
3000
4000
RAG1 KO
*
IL-2
2 (
pg
/mL
)
Naive Memory0
200
400
600
800
R2G2
**
IL-2
3 (
pg
/mL
)A B
C D

156
Naive Memory0
2000
4000
6000
8000
RAG1 KO
ns
IL-6
(p
g/m
L)
Naive Memory0
2000
4000
6000
8000
R2G2
ns
IL-6
(p
g/m
L)
Figure 4.9 R2G2 mice do not produce significant amount of cytokine. The
peritoneal lavage was obtained from RAG1 KO and the Double knockout R2G2 both
with two different immunisations groups, either with PBS or Heat killed P. aeruginosa.
The R2G2 mice immunised with P. aeruginosa and infected R2G2 (B and D) did not
produce significant amount of IL-22 and IL-23 cytokines compare to the Rag1 KO
group (A and C). The PBS immunised from both TNF-α and IFN-γ from R2G2 had
increased production of the mentioned cytokines (F and H) and the IL-6 production
were non-significant for both groups (I and J) (n=7). Data is presented as mean+SEM.
The statistical significance is indicated as *(p<0.05), **(p<0.01).
Naive Memory0
500
1000
1500
2000
RAG1 KO
ns
TN
F-
(n
g/m
)
Naive Memory0
1000
2000
3000
R2G2
*
TN
F-
(n
g/m
)
Naive Memory0
500
1000
1500
RAG1 KO
ns
IFN
- (
pg
/ml)
Naive Memory0
500
1000
1500
2000
R2G2
*
IFN
- (
pg
/ml)
E F
G H
I J

157
4.7.8 Specificity
Specificity is very important feature in immunological memory. To answer the question
whether the protective effect seen on the RAG1 Ko experiment is specific to P.
aeruginosa or if the same protective response would be observed in different strains
either heat killed P. aeruginosa, E. coli, S. aureus or simply injected with PBS (control
group). Three groups were immunised with different bacteria species and all three
infected with the same bacteria. This observation makes a difference between
immunological memory and trained immunity which is characterised by a more robust
second response but not specific. The result shows that only the group that were
immunised with HK P. aeruginosa and infected with the same bacteria was able to
control the infection (Figure 4.10).
Figure 4.10 CFU of Rag 1 KO infected with S. aureus, E. coli, and P. aeruginosa
10 days after immunisation with heat killed P. aeruginosa. The mice were
intraperitoneally infected with 106 of P. aeruginosa after being intraperitoneally
immunised with heat killed S. aureus, E. coli, and P. aeruginosa. The peritoneal
lavage was collected 6 hours post the P. aeruginosa infection and plated for CFU
count. There was no significant difference between the groups immunised with one
type of bacteria and challenged with a different type, but a significant difference was
observed between the P aeruginosa immunised group and the other groups. The data
is presented as mean+SEM. The statistical significance is indicated as **(p<0.01)
(n=5-6).
PBS S.a E.c P.a0
2.0108
4.0108
6.0108
8.0108
1.0109
2.0109
4.0109
6.0109
8.0109
Rag 1 KO
**
**
**
Immunisation
CF
U/m
l

158
4.8 Discussion
The immunological memory response is provided by cells called memory cells that
have been educated during the primary encounter what makes them able to fight with
a much stronger response and higher number of cells contrary to the non-
immunological memory which will respond with the same magnitude independent of
the number of encounters with the same pathogen.
It has been demonstrated before that mice lacking T and B cell can be protected
through immunisation against infection (Netea & Van Crevel, 2014; Johanneke
Kleinnijenhuis et al., 2014). In the first experiment the protection induced by
immunisation with P. aeruginosa was examined. It was shown (Figure 4.3) that the
mice that were previously immunised with P. aeruginosa were more able to fight the
bacterial infection when challenged. Although an expansion in the number of ILCs
within the immunised mice was observed in previous experiment (Monahan et al,
2015) this does not demonstrate that these cells are responsible for the enhanced
protection, or rule out that the diminution in bacterial burden was a result of ‘trained’
macrophage activity (Yao et al., 2018). Two further experiments were carried out in
order to establish the role of ILCs in this protective effect. In the first, Rag common
gamma chain KO (R2G2) mice were immunised and then infected. The common γ-
chain (γc) IL-2 receptor γ (IL2rg) mediates signalling of IL-2, IL-4, IL-7, IL-9, IL-13 and
IL-15 (Lin & Leonard, 2018). The lack of IL-7 largely affects the adaptive immune
system. This experiment demonstrated that in the absence of ILCs, immunisation
does not offer any protective effect (Figure 4.8).
Whilst the previous experiment clearly demonstrated the requirement for innate
lymphocytes in order to generate a protective memory response following
immunisation, it did not elucidate if this protection was a result of the archetypal innate
lymphocyte cell, NK cell, as is the case for innate memory against viral infection (Peng
& Tian, 2017) or another of the more recently identified subsets (Martinez-Gonzalez
et al., 2016b). To determine this, in vivo depletion experiments were carried out.
When all ILCs were depleted using anti-CD90 there was a loss of protection post
immunisation (Figure 3.6), further substantiating the findings obtained using the
R2G2 mice. In contrast, however, when just NK cells were depleted by treating the
Rag 1 KO mice with anti-NK 1.1 no reduction in protection was observed when
immunised animals were infected (Figure 4.7). These results demonstrate that NK
cells are not responsible for the anti-bacterial innate immunological memory response
described.

159
Involvement of ILCs in different aspects of the immune response has been reported,
such as the production of cytokine, keeping the reproduction of commensal bacteria
at bay, limiting bacterial growth and tissue homeostasis. Thus, an experiment was set
up to measure the levels of pro-inflammatory cytokines during infection of RAG1ko
mice. ILC3 by the action of IL-17 promotes neutrophil accumulation in response to
extracellular bacteria (Muir et al, 2018), ILC1s through the action of IFN-γ act in favour
of antigen processing and presentation on MHC, maintaining tissue resident
macrophages and dendritic cells (Kotas & Locksley, 2018) whereas ILC2s are
involved in tissue repair. In this experiment, after the pick on IFN-γ and IL-17A
cytokine production, there is a decline in the production of these cytokines which is
probably to allow the cessation of the immune response and tissue repair. In further
studies would be interest to see if ILCs also have regulatory function (Figure 4.4).
As expected, the administration of bacteria into the peritoneal cavity resulted in
recruitment of leucocytes to the peritoneal cavity (Figure 4.5). Phenotypic
identification of the recruited population was performed by flow cytometry. The
percentages of infiltrated cells were analysed between the different time points of
immunisation.
The CD90 depletion (Figure 4.6) and the infection experiment using RAG deficient
mice and the double knock outs mice experiment (Figure 4.8) demonstrate that ILCs
play an important role during bacterial infection. As well as memory, the duration and
specificity were also demonstrated in this chapter. Memory response is characterised
by a robust immune response to antigen that has been encountered before by the
immune system. Following immunisation with heat killed bacteria and infection with
live bacteria, the infected mice displayed an enhanced response that were able to
suppress bacterial growth compared to mice that were immunised and infected on the
same day; the displayed innate immunological memory feature persisted for 21 days
(Figure 4.3), the P. aeruginosa immunised mice produced more IL-17A and IFN-γ
cytokines from day 7 post immunisation than the day 0, and the increase in cytokine
production was parallel to the increase of days post immunisation but the factor that
have caused these changes were not identified in this study. The durational limits of
ILC memory have not yet been established. Furthermore, it would be interesting to
explore if there are differences in development and persistence of innate
immunological memory in the presence of the adaptive immune system.
Initial response to bacterial infection is mediated by the innate immune system, which
was known to only act by activating complement, secretion of antimicrobial

160
components and to recruit other cells to directly deal with the invading pathogen. A
considerable amount of data is now available to show us otherwise, implicating cells
of the innate immune system not only in direct elimination of pathogens but also in
limiting damage to the tissue by promoting tissue remodelling and homeostasis.
There are a lot of similarities between ILCs and T cells and a huge need to understand
what functions are ILC’s and which ones are from T cells. There is no other way of
better way gaining that knowledge than the in vivo studies, but this is a difficult task,
and the results can be irrelevant if the T cells can also be playing a role in the
observations. To solve that problem mouse free from adaptive immune system were
used.
Further studies using mice with an intact adaptive immune system is required to better
understand how the ILCs interact with the cells from the adaptive immune system to
bring about the neutralisation and elimination of pathogens since the RAG deficient
mice shows less ability to survive the infection in the complete absence of the adaptive
immune system, one of the ILC functions is also the activation of the adaptive immune
system.
The recruitment of phagocytic innate immune cells such as the neutrophils to the site
of infection or injury is an important process in the development of the immune
response. The immune cells need to be attracted from their site of residency to the
site of infection or inflammation and this is done by the action of the cytokines and
chemokines. Analysis of the cell population that are infiltrating at the time of the
environmental changes as well as the study of type of cytokines being upregulated
during this period can give an indication of the cell population being activated to
respond to the infection, inflammation or injury. In this experiment ILCs, DCs and
neutrophils have been identified as the cell population activated during P. aeruginosa
bacterial infection, both populations were upregulated following the immunisation
(Figure 4.5).
ILCs, more specifically the ILC3 are implicated in the elimination of extracellular
bacteria by producing IL-22 and/or Il-17 for damage control and to recruit neutrophils
to aid fighting against gram-negative bacteria (Sonnenberg & Artis, 2015a). Activated
ILCs are involved in controlling the release of pro-inflammatory cytokines involved in
the early recruitment of phagocytic cells such as neutrophils to the site of inflammation
which will make direct contact with the pathogen and phagocytose it.

161
The ability to offer protection was dependent of the previous immunisation received.
It was lost in animals infected with a species of bacteria different from the
immunisation (Figure 4.10). This demonstrates that there is pathogen specificity in
the innate immunological memory against bacterial infection. A similar phenomenon
has been observed in the memory response of NK cells against viral infection where
NK cells expressing the receptor NKG2C is increased during viral infections caused
by Hepatitis B and HIV, and these NKG2C positive NK cells remain for more than a
year (O’Sullivan et al., 2015).

162
CHAPTER 5 - INTERPLAY BETWEEN NEUTROPHILS
AND INNATE LYMPHOID CELLS

163
5.1 Introduction
In the previous chapter it was demonstrated that ILCs can be induced to produce
protective memory responses against bacterial infection. ILCs are been described as
following into three subsets.
The experiments from this chapter were carried out to help understanding the process
of migration, phagocytosis and infiltration of the phagocyte neutrophil during bacterial
infection to understand the importance of neutrophils in preventing the spread of
bacterial infections. Interactions between cells of the immune system such as of the
adaptive immune system with cells of the innate immune system and of cells from the
same arm of the immune system is important for successful pathogen elimination,
tissue repair and homeostasis. The process of cell migration is important as it is by
this process that cells can reach to the place where they need to exert their function
either by individual or collective movement .
In order to interact with other cells ILCs must leave their site or attract other cells to
the site of infection. Different mechanisms are used by immune cells in other to reach
or to attract the required cells (Willinger, 2019). Chemotaxis is a process in which cells
migrate from their location to the site to which several cells are required to exert an
immunological function (Khalil & Friedl, 2010).
In this chapter the ability of the ability of ILCs to recruit neutrophils was assessed by
the in vitro Transwell assay, this method uses Transwell plates with a porous
membrane (Zhang & An, 2009), of a size that is suitable for the cells being
investigated, to avoid a size that is too small for the cells to migrate to the other side
or too big that would allow unwanted cells to cross to the other side membrane. The
membrane if located between the two compartments that represents a cell membrane
that separates the two compartments with chemoattractant. In the upper side are the
cells to migrate towards the side of the membrane where the chemoattractant or
medium only for control purposes are, with the objective get to know the guided
migratory capacity of neutrophils when stimulated by naïve and heat killed immunised
ILCs using Transwell assay.
Cells migrate towards the gradient with the objective to deal with an abnormal
circumstance by producing cytokines or by phagocytising the foreign microbial
organism or debris (Subramanian et al., 2016). The cytokines produced will influence
in the affected area, in the cells already dealing with the immune response or attract
more cells to the affected area. The cytokines attracting cells to the affected site are

164
called chemokines which are nothing more than cytokines with the ability to recruit
cells (Zhang & An, 2009). This chapter also investigates the in vitro phagocytic
capacity of bone marrow-derived innate immune cells neutrophils to E. coli coated
pHrodo Red bioparticles followed by staining and quantification by flow cytometry
analysis.
The immune response starts as an acute inflammatory response where leucocytes
from the blood stream and other cells penetrate into the affected area (Newton & Dixit,
2012). During the inflammatory process caused by bacterial infection, neutrophils are
recruited to phagocytose the invading bacteria (Leliefeld et al., 2018). The intervening
cells are mainly monocytes from circulating blood and tissue resident macrophages,
dendritic cells and neutrophils (Mortaz et al., 2018).
Their movement is guided by chemotactic factors produced and released at the site
of injury. The first step in neutrophils recruitment is initiated by the action of
chemokines that will recruit neutrophils from circulating blood and afterwards the
process of recruitment guided by substances such as bacterial component, released
at the site of infection or inflammation (Kolaczkowska & Kubes, 2013). ILC3 is an early
source of IL-17A production during infection (Jie et al., 2014) and the cytokine IL-17
has been linked to recruitment of neutrophils (Akbay et al., 2017).
As in many other immune processes the phagocytosis requires involvement of
receptors expressed on the surface of the phagocytes, such as PRR that will
recognise PAMPS expressed on the surface of the microorganism to be engulfed or
(De Oliveira et al., 2016). At the end of the chapter it was seen that ILCs can recruit
neutrophils to fight bacterial infection and the neutrophils capacity to recruit
recruitment is increased in the presence of opsonin and bacterial components.

165
5.2. Aims
The aim of this chapter is to:
• Investigate the infiltration and migratory capacity of phagocytic
leucocyte neutrophils during the inflammatory response
• Quantification of neutrophils phagocytosis in vitro using pHrodo red E.
coli bioparticles
5.3 Methods
5.3.1 Bacterial strains
P. aeruginosa isolates (Q502) from CF patients were used from a strain collection of
Dr Rebecca Ingram laboratory.
5.3.2 Mice strains
C57BL/6N wild type mice 8 to 12 weeks old obtained from the Queen’s University
Biological Service Unit (BSU, UK).
5.3.3 Mice samples
Mice were euthanised using CO2. The mouse surface was sprayed with 70% ethanol.
An incision was made to the abdomen to remove the skin and expose the abdomen
and the legs muscles. The legs were freed from the muscles using scissors; next the
legs were dislocated from the hip joint. The bones were placed in a sterile petri dish
containing cold RPMI 1640 supplemented with 10% FBS and 1%
penicillin/streptomycin. The remaining muscles from the femur and tibia were
removed using a scalpel, and the bones separated at the knee joint. The completely
muscle free bones were sterilised by immersion inside of a petri dish containing 70%
ethanol. The sterilised bones were washed in sterile PBS to wash off the ethanol. The
extremities of the bones were cut off using a scissors and kept in a sterile petri dish.
To flush the bone marrow out of the bone, a 25-gauge needle and a 1 ml syringe filled
with RPMI supplemented with 10% FBS and EDTA were used (3-4 flushes). The

166
flushed bone marrow was collected in a 50 ml Falcon tube and HBSS++ media was
added up to 30 ml and allowed to settle.
5.3.4 Acquisition of bone marrow-derived neutrophils
The murine bone marrow-derived neutrophils were obtained by using a protocol from
Dr Len Stephens Laboratory, Babraham Institute, Cambridge. The supernatants from
the settled bone marrow were collected and transferred to a fresh tube. The new tube
contained 30 ml of supernatant. The remaining clumps were re-suspended using a
1ml pipette and 20 ml of HBSS++ were added and the suspension allowed settling.
The 20 ml of supernatant were collected and transferred to the tube that contains the
30 ml of supernatant. The tube containing the 50 ml of supernatant was centrifuged
at 400 g for 10 minutes. The supernatant was removed, and the pellet re-suspended
in 3 ml of HBSS++. The 3 ml suspension was loaded on top of a two-layer Percoll
gradient (62% and 55%). The suspension made of the cell and the Percoll was
centrifuged at 1500 g for 10 minutes. The cells at the interface between 62 % and 55
% were collected with a sterile Pasteur pipette and added to a Falcon tube containing
around 50 ml HBSS++. The cells were then centrifuged at 400 g for 10 minutes. The
red blood cells from the resulting pellet were lysed by adding 5 ml of hypotonic Gey’s
Balanced Salt Solution. After 5 min, the reaction is stopped by adding 50 ml HBSS++.
PMNs were collected and centrifuged at 400 g for 10 min. The obtained pellet was re-
suspended in RPMI medium containing 20 mM Hepes pH 7.3. The PMNs were
counted.
5.4 Migration assay using the Boyden chamber method
100μl of the neutrophils cell suspension containing 1x10⁶ cells/ml on RPMI medium
1640 supplemented with 10% FBS, was seeded on top of the filter membrane with
pore diameter of 3.0μm in a Transwell (Sigma-Aldrich) and incubated for 10 minutes
at 37° C and 5% CO2 to allow the cells to settle, for the control chambers media was
used. Using a 1000μl pipette 600μl of the desired chemo-attractants were added into
the bottom of the lower chamber in a 96-well plate, 3.0μm pore size and polycarbonate
membrane. The chemo-attractants were added without moving the Transwell insert
and avoid generating bubbles. Care was taken to make sure the chemo-attractant
liquid in the bottom well makes contact with the membrane in the upper well to form
a chemotactic gradient. The plate was incubated at 37° C and 5% CO2 for 3 hours to

167
allow the cells to migrate and to attach to the other side of the membrane. At the end
of the three hours of incubation the Transwell insert was removed from the plate. A
cotton-tipped applicator was used to carefully remove the media and remaining cells
that have not migrated from the top of the membrane with care to not cause any
damage to the membrane. The migrated cells were analysed by flow cytometry.
Results shown as percentages of ILCs, obtained by flow cytometry analysis, in
migrated wells as compare to control as described in section 5.6.
5.5 Phagocytosis assay
The phagocytic tests were done in a Transwell (Corning) with inserts of pore
membrane of 3.0 µm of diameter, 50 µl of conditioned medium was plated in duplicate
for each of the medium (naïve unstimulated, naïve cell stimulator, naïve heat killed,
memory unstimulated, memory cell stimulator and memory heat killed plus the two
that contained medium or cells only) and for the controls. Into each well was added
500 ml of neutrophil and 400 ml of opsonin and 10% medium. Control tubes of
neutrophils and beads without opsonin were also included in the experiment. The
pHrodo red Escherichia coli beads (Invitrogen), which becomes fluorescent inside the
phagolysosome because of the acid pH, was used to assess the phagocytic activity
of neutrophils and 50µl of the diluted beads (1mg/ml) was added to the appropriate
wells.
To analyse the phagocytic capacity of the neutrophils, these cells were co-cultured
with fluorescent labelled pHrodo red E. coli beads (ThermoFisher) at the same time
some wells were incubated without the beads to serve as the unstained control, and
others with particles and placed on ice to be used as control.
The isolated neutrophils were co-cultured with the beads resuspended in RPMI with
1% FBS and PS (10 µl /ml or 20:1 ratio) for 2 hours at 37˚C and 5% CO2 for
phagocytosis. At the end of the 2 hours incubation the cells were centrifuged at 300g
for 10 minutes at room temperature and washed twice with PBS, to remove the excess
beads. The supernatant was removed from the wells by quick flicking the plate onto
a recipient. Using a multichannel pipette 200 ul of flow buffer was added to each well
to wash. Spun as previously remove the supernatant, the unstained control wells were
resuspended in flow buffer and the other samples with the desired panel of antibodies.
The plate was stored on the dark for 30 min. While cells were incubating, the single-
stained compensation controls were made for each antibody using UltracompeBeads.

168
The plate was spun for 10 min at 300 x g, the supernatants removed, and the wells
washed x2 with flow buffer, resuspend in flow buffer containing 2% PFA fixating agent.
The sample acquisition of the fixed cells was performed using FACS Diva software
(BD Biosciences). The data was analysed using FlowJo software (Tree Star Inc.,
USA).
5.5.1 Beads
pHrodoRed E. coli bioparticles conjugate were used according to the manufacturer
protocol (ThermoFisher).
5.6 Flow cytometry
A single cell suspension was incubated with Fc blocker to avoid nonspecific binding.
The surface staining was done after the Fc blocking by incubating the single cell
staining with mouse antibody against Gr-1 (PerCP-Cy5.5) from eBioscience.
5.7 Statistical analysis
Statistical analysis was carried out using GraphPad Prism v5 and using one-way
ANOVA. The data were presented as mean +SEM of n=3 -7. The statistical
significance is indicated as *(p<0.05).
5.8 Results
5.8.1 Neutrophils infiltration
For experimental purposes, murine models are commonly used to study the
inflammatory response in more depth, for this experiment RAG1 Ko and Double Ko
mice received intraperitoneally administration of heat killed P. aeruginosa or PBS as
control group. The extent of the immune response can be studied by quantification of
inflammatory markers or cell recruitment to the site of infection. To study the
involvement of neutrophils in the protection given by ILCs against bacterial infection
when mice previously immunised with heat killed P. aeruginosa, were infected i.p.
with P. aeruginosa on day 10 as in section 2.3.2 and 2.3.3 and sacrificed 6 hours

169
post infection. Results show that neutrophils infiltration were significantly increased in
the group of mice that have ILCs compared with the group of mice lacking ILCs
(Figure 5.1).
Figure 5.1 Cell count of neutrophils in peritoneal lavage of RAG 1 KO and RAG
cү DKO mice infected with P. aeruginosa and PBS control. Mice were
intraperitoneally infected with 106 of P. aeruginosa after being intraperitoneally
immunised with heat killed P. aeruginosa. The peritoneal lavage was collected 6 hours
post the P. aeruginosa infection and 10 days post immunisation and run by flow
cytometry. Flow cytometry graph of neutrophils in peritoneal lavage 6 hours after
infection (n=7). Infection induce infiltration levels to increase on the Rag 1 KO heat
killed P. aeruginosa immunised group but fail to increase neutrophil recruitment on
the heat killed immunised group of mice deficient on ILCs. The data were presented
as mean+SEM. The statistical significance is indicated as *(p<0.05), ns (non-
significant).
5.8.2 Migration assay
Migration of immune cells is part of their normal process. These cells will migrate from
the germinal centre to the maturation centre and then to the site to which they are
recruited for elimination of a pathogen r for tissue repair (Binamé et al., 2010). This
sort of assay provides information about a cell’s ability to sense and to react to a
particular change and is a valuable tool as it is through migration the innate cells can
leave they local environment to play their immune role during bacterial invasion,
trauma, cancer and tissue healing.
Neutrophils
PBS Hk PBS Hk0
20
40
60
80
100
Rag c DKO Rag 1 KO
*
ns
% N
eu
tro
ph
ils

170
The aim of the migration experiment was to investigate the effect of memory ILCs in
neutrophil recruitment.
This data demonstrates that although naïve ILCs are capable to recruit neutrophils
but the memory ILCs are better at attracting neutrophils than the naïve ILCs. The
naïve cells were only able to recruit as many neutrophils as the control, the same
result us seen in the memory unstimulated group. This data suggests that the process
of migration requires an intermediary cell or substance (Figure 5.2).
Contr
ol
Nai
ve u
nst
Nai
ve c
ell s
tim
Nai
ve H
k
Mem
ory u
nst
Mem
ory c
ell s
tim
Mem
ory H
k
0
20
40
60
80
100
120
* **
*
*
ns
ns
ns
ns
Treatment
Gr-
1+
(10
6)
Figure 5.2 Determination of the neutrophil capacity for migration. Neutrophils
from murine bone marrow removed from a femur of male C57BL/6 mice were
incubated with different medium conditions was measured by flow cytometry for 1
hour at room temperature. Data is presented as mean+SEM of n=4. The statistical
analysis was carried out with GraphPad Prism using one-or two-way ANOVA with
Dunnett’s or Sidak’s post hoc multiple comparisons tests. Non -parametrical Kruskal-
Wallis with Dunn’s post hoc multiple comparison test. The statistical significance was
presented as *(p<0.05), ns (non-significant).

171
5.9 Phagocytosis assay
Phagocytosis methods are usually performed to study the body’s mechanism of
defence and tissue regeneration to gain more information on how the obtained data
can be manipulated not only for control of infection purposes but also to accelerate or
slowdown phagocytes in order to prevent or cure diseases where phagocytes are
overreactive and causing tissue damage as in cases where for example there is tissue
overgrowth would be of great use as well as in cases of diseases where skin tissues
grows at a very accelerated rate.
This assay was set up to measure the phagocytic activity of neutrophils under different
media stimulating conditions. To determine the phagocytic effect of neutrophils in
vitro, naïve untreated and treated isolated neutrophils were incubated with pHrodo
red beads (ThermoFisher). The internalised beads were analysed by the fluorescence
emitted by the internalised beads. Results show that neutrophils are better
phagocytes in the presence of memory stimulated samples, especially in those
samples stimulated with heat killed P. aeruginosa than with the other stimulants. The
naïve samples where at about the same hight in the y axis.
Neutrophils phagocytosis
Med
ium
Cel
ls
Cel
ls+
SS
Contr
ol
Nai
ve u
nst
Nai
ve c
ell s
tim
Nai
ve H
k
Mem
ory u
nst
Mem
ory c
ell
stim
Mem
ory H
k
0
10
20
30
**
*
*
*
*
ns
ns
ns
ns
ns
Treatment
pH
rod
o r
ed
Bead
s

172
Figure 5.3 Comparison of phagocytic capacity of neutrophils from P.
aeruginosa immunised and non-immunised or control groups. Neutrophils from
murine bone marrow removed from a femur of male C57BL/6N. To create an
environment closed to the in vivo the isolated neutrophils were incubated with 10µl/ml
of pHrodo red conjugated latex beads E. coli bioparticle for 2 hours at 37˚C and 5%
CO2 and the fluorescence emission was measured by flow. Data is presented as
mean+SEM of n=4. Statistical analysis was carried out with GraphPad Prism using
Non-parametrical Kruskal-Wallis with Dunn’s post hoc multiple comparison test. The
statistical significance was presented as *(p<0.05), ns (non-significant).
5.10 Discussion
This chapter intended to observe the in vitro phagocytic capability of stimulated and
unstimulated neutrophils this study also investigated the neutrophil’s infiltration during
an immune response compared with the absence of an immune process. The
phagocytic effect of PMNs has been studied before (Quie, White, Holmes, & Good,
1967). The results from this study to compare the phagocytic capacity of the PMN
neutrophils during P. aeruginosa immunisation from opsonised and non-opsonised
samples after 2 hours of incubation it was clear that it is necessary to have a certain
number of phagocytic cells available to effectively clear the bacterial infection (Figure
5.3). In some of the wells with opsonin some of the gram-negative bacteria were still
viable after 2 hours of incubation.
Whereas the wells where neutrophils were incubated without opsonin most of the
beads were still free after 2 hours incubation. Results are presented as percentages
of beads opsonised and non-opsonised by PMN. This study shows a substantial
decrease in the bead numbers.
The heat killed memory conditioning treatment showed an increased and significant
in the number of phagocytic beads of heat killed conditioning samples compared to
the naïve conditioning treated samples (Figure 5.3). The conclusion taken from this
study is that the memory samples are more efficient in recruiting neutrophils to help
clearing the bacterial infection than the naïve, it can also be concluded that the
phagocytic effect was due to the neutrophils and not by the conjugated E. coli as the
naïve samples also had E. coli conjugated beads but failed to significantly phagocyte
the beads. The neutrophils have been related to efficiently help to clear bacterial
infections in previous studies through the action of IL-17A cytokine produced by cells
of the innate immune system. The IL-17A a cytokine produced by some immune cells,

173
including the ILCs and play a protective function during bacterial infection (Onishi &
Gaffen, 2010).
The migration assay has shown that immunised innate cells are better at recruiting
neutrophils (Figure 5.2). The disadvantages of the migration assay using a Transwell
plate is that there is no kind of cytokines such as chemokines present, there is no
matrix cellular as the cells are seeded as single cell suspension making it impossible
for the cells to interact with each other something that is need for collective migration.
However, this type of assay is very practical, the instructions very easy to follow,
inexpensive and can be done by only one technician. In future investigation it would
be great to use other methods of analysis besides the flow cytometry as the dark
coloured porous membrane in which there is no need for the non-migrated cells to be
removed with cotton swab as the light is not able to cross the non-migrated cells or
the assay with exclusion zone as it allows cell to cell interaction.
The neutrophil population was significantly increased in the Rag KO mice immunised
with heat killed P. aeruginosa during infection. In contrast, no significant difference
was observed in the Rag cү DKO mice which lack ILCs (Figure 5.1). This suggests
that memory ILCs may function by enhancing the recruitment of neutrophils to help
fight and destroy the bacteria.
The recruitment of neutrophils to the site of infection also contributes to the
recruitment of monocytes and macrophages. The fact that no significant difference
was observed on the control and immunised ILC negative groups and increased
protection was found within the ILC positive groups as compared to the ILC negative,
this observation suggests a protective role of ILCs during bacterial infection when
challenged after previous exposure to the pathogen. This finding implicates ILC as
key factor by which bacterial infection can be disrupted in the absence of the adaptive
immune system
This chapter showed that neutrophils are recruited early during bacterial infection to
prevent bacterial dissemination and that their infiltration rate is increased in the
presence of ILCs (Figure 5.1) Future work using scanning electron microscopy and
live cell imaging to observe how long it would take to initiate phagocytosis after
bacteria and neutrophil contact in an in vitro assay and also a separated assay were
neutrophils and macrophages would be cocultured with beads opsonised with
bacteria to compare the phagocytic activity of both phagocytes in ILCs conditioned
medium, would elucidate the process of phagocytosis and to determine the main
phagocytic cell involved in ILC immune response to bacterial infection.

174
It would also be interesting to investigate how cytokines such as IL-6, TNF-α changes
that bring about the cytokines responsible for leucocytes recruitment to spleen and
peritoneal lavage, by analysing the changes in expression pattern of these cytokines
during the course of the immune response by immunisation and blockage of receptors
specific for these cytokines.

175
CHAPTER 6 - GENERAL DISCUSSION

176
Immune responses are modulated to deal with specific pathogen and type of tissue
of the occurring insult. A good understanding of how these responses are generated,
coordinated, regulated, the cells, cytokines and chemokines involved for each type of
infection and location would greatly help to reduce the morbidity and mortality caused
by infections. The lack of knowledge is leading to the development of chronic
inflammatory diseases, but the understanding of the infection and immune response
process would help to develop treatment and therapies to treat and consequently
reduce the negative impact that such diseases have to health.
Understanding the variances between immune response during normal and diseased
state is to know the mechanisms behind the protecting immune response during
bacterial infection through the administration of immunisations with heat killed
bacteria. This study was carried out to compare protective response by ILCs induced
by heat killed P. aeruginosa in mice. Examination of the memory markers expressed
by cells of the adaptive immune system and how they behave on naive and antigen
experienced ILCs has shown similarities in the behavioural pattern with the adaptive
immune cells as CD44 were upregulated after immunisation and CD62L
downregulated after immunisation (Figure 3.5). On day 0 and day 3 cells were
CD62L+CD44+ as in central memory T cells, on day 7 CD62LLowCD44+, on day
CD62L-CD44+ the equivalent to effector memory T cells, on days 21 and 28
CD62L+CD44High. The upregulation observed on the surface marker CD44 after
activation contradicts a previous study that mentioned that there were no variations
for CD44 on ILCs (Martinez-Gonzalez et al., 2017).
Different subsets of ILCs have been linked to protection against different type of
pathogens (Sonnenberg & Hepworth, 2019). The expression of activation and
differentiation on naïve and memory was compared. The expression of transcription
factors T-bet, GATA3 and RORγt, that regulate the development of ILC1, ILC2 and
ILC3 respectively, were examined GATA 3 could not be detected probably because
although ILC2s can be found in infected and also in non-infected tissues, the most
reasonably explanation is that the stain did not work. T-bet expression levels were not
significant different between naive and memory ILCs. In contrast, RORγt the
transcription factor for ILC3 the subset that respond to infection from intracellular
bacteria and fungi (Mortha & Burrows, 2018) shown significant elevation in HK P.
aeruginosa immunised ILCs (Figure 3.4).
Since their identification just over a decade ago, the role of ILCs during inflammation,
infection, tissue homeostasis and repair has been the intense focus of research

177
(Mohammadi et al., 2018). But still a lot yet to be found about their involvement in the
immune response, how they interact with other cells from the innate immune system
as well as to cell of the adaptive immune system. It has been reported that bacteria
are capable of activate ILCs (Sawa et al., 2011). ILCS are rare population but are
present on a large number of lymphoid and non-lymphoid tissue, this and the fact that
ILCs are extensively linked to quite a large number of diverse immune responses
(Vivier et al., 2018b) makes this population of cells an interesting candidate to be
exploited by its functions for the development of new therapeutic approaches to treat
bacterial infections that are no longer responding to the available drugs in the market
due to resistance. Due to their morphological similarity with lymphocytes, the lack of
lineage markers and RAG receptors and tissue location, ILCs function and activation
are being investigated in the basis of how these cells behave but are these factors
really determinant to how other cells such ILCs will behave? Or are we limiting our
studies?
Another remarkable feature that has been associated with ILCs is the capacity to
generate an immunological memory (Martinez-Gonzalez et al., 2017). The objective
of this thesis was to investigate the ability of ILCs to generate an immunological
memory against bacterial pathogen. The data from the experiments conducted with
RAG1 which lacks T and B cells knockout and Rag il2rg -/- which lacks T, B and ILCs
showed that the Rag-/-il2rg are more susceptible to a serious infection than the RAG1-
/- (Figure 4.8). In further studies it would be interesting to investigate whether the
transfer of T cells to knockout mice with ILCs only, at different time points during the
infection, would help the infected mice to recover and at what point the transfer of T
cells would be more effective. And, what mechanism would be induced by the
transferred T cells, if it wound be by producing more cytokines, since ILCs were
supposedly the primary source of cytokines and measure whether the T cells would
produce a significant higher or lower amount of the required cytokines compared to
ILCs.
Immunological memory is used by the immune system to prevent our body from being
re-infected by the same pathogen and this response has the potential to be faster and
stronger that the previous experience of antigen encounter (Stamatiades & Li, 2019).
Innate immunological memory was present and sustained during the survival
experiment, as it lasted for more than 14 days, following immunisation of RAG1
Knockout mice with heat killed P. aeruginosa and subsequent infection with P.
aeruginosa (Figure 4.2). It was also shown that exposure to heat killed P. aeruginosa
immunised lead to a reduction in bacterial burden when the animals were infected

178
with P. aeruginosa. The protective response observed here is attributed to the innate
immune system since RAG1 KO mice were used; these mice lack an adaptive
immune system. In this experiment survival rates during infection were significantly
improved in animals immunised with heat killed bacteria, compared with the sham
immunised control group. Similar response has already been observed in natural killer
cells in response to viral infection (Peng & Tian, 2017). Using a combination of R2G2
mice and antibody depletion experiments it was demonstrated that ILCs, but not NK
cells, are responsible for this protection (Figure 4.7). When NK cells were depleted,
protection were still observed and it were attributed to ILCs, further analysis of IFN-γ
production would have shown whether there was any decrease in the production of
IFN-γ that would cause less protection and more bacterial dissemination compared
with mice with intact NK cells.
In the time course experiment, six hours post infection were observed an increase of
bacterial load on both spleen and peritoneal lavage and an increase in susceptibility
to death in the mice immunised with heat-killed bacteria when compared to the mice
immunised with PBS (Figure 4.3). The hypothesis for this experiment was that this
protection is offered by ILC3 and to test this hypothesis the IL-22 and IL-17 cytokines
were analysed, then to further clarify the importance of these cytokines during
bacterial infection and experiment in which the production of IL-22 would be blocked
by blocking the signal that leads to the production of these cytokines using an antibody
against IL-22 and IL-17 would be used.
This experiment also found an increase in of neutrophils, macrophages and dendritic
cells during the first days (Figure 4.5) which suggest that they could also be source
of IL-22 during the first stage of the infection. Using mice that lack RORγt, which is
important for ILC3 development, for infection with P. aeruginosa and if the result of
these study were high susceptibility to infection then an adoptive transfer of ILC3
would help to indicate that ILC3 as the primary source of IL-22 and IL-17A cytokines
in mice infected with P. aeruginosa. The observed increase of DCs suggests that
these innate cells mediate the interaction between ILC3 and P. aeruginosa bacteria
in mice infection, which makes perfect sense since ILCs do not express receptors to
directly recognise bacteria and for that reason must rely on other cells of the immune
system to mediate the cross-talk between P. aeruginosa, in this case, and ILC3.
Depletion of the DC population by antibody treatment would be useful to observe how
the infection would develop in the absence of these cells and whether restoration of
DCs would restore the mice ability to fight the infection if susceptibility were observed
in the absence of DCs.

179
The number of ILCs only increase up to day 14 and remained the same on day 21.
By what mechanism ILCs become reduced during dissemination of infection it’s not
yet clear. One study using peripheral blood from patients with septicaemia (Cruz-
Zárate et al., 2018) has described that during sepsis activation of ILCs through TLRs
by bacterial components, when the host fail to contain the infection and dissemination
of the infection occurs ILCs have the same fate as T cells, ILCs become exhausted,
produce less amount of cytokines and die by apoptosis. This study described an
increased expression of HLA-DR by ILC3 compared with the other two subsets by
health patients but were significantly reduced on patients with septicaemia. Apoptosis
was the cause of ILC reduction during the infection as active caspase 3, the apoptotic
enzyme, were increased in all ILC3 subsets.
On mice immunised with heat killed P. aeruginosa were observed to have a significant
degree of protection that lasted up to 21 days, long enough to exclude the possibility
of being attributed to a normal innate immune cell activation (Xu et al., 2012). This
finding is consistent with published data, in which the number of circulating ILCs was
high up to 21days post immunisation (Xu et al., 2012).
The specificity of the ILCs immune response was demonstrated by the capacity to
clear the bacterial infection when the group that were immunised with P. aeruginosa
and then subjected to infection with the same pathogen a reduction in bacterial burden
was observed. However, when the P. aeruginosa immunised mice were challenged
with E. coli or S. aureus no protection was observed (Figure 4.10).
An enhancement of neutrophil recruitment was seen in immunised RAG1 KO mice,
this was not however observed in RAG γc DKO mice, indicating that memory ILCs
function via enhancing neutrophil recruitment and/ or function (Figure 5.1).
Phagocytosis assays are been used to investigate pathogen clearance capacity of
the immune system using different methods such as flow cytometry,
spectrophotometry and microscopy. The E. coli bioparticles that were coated with
conditioned medium significantly increased the phagocytic capacity of neutrophils to
clear E. coli as it has been expected for this experiment and no fluorescence was
detected in the wells were there was only cells or medium only (Figure 5.3). Also
studying the inhibitory capacity of phagocytosis by applying methods that would
interfere with the acidity of the phagosome and of the engulfment would be of great
value as some immune diseases are caused by increased phagocytic activity by the
phagocytes of the immune system. It would be very interesting also to look at the
phagocytosis curve to analyse the time it takes for the neutrophils from the different

180
conditioning medium to reach the peak in an in vitro assay by measuring phagocytosis
at a pre-determined time points. And, also to conduct an experiment using ILCs from
other tissue besides spleen and neutrophils from both bone marrow and circulation
with different bacterial strains. One of the limitations of this experiment is the fact that
both P. aeruginosa and the E. coli were dead pathogens and in an in vivo situation
the pathogens invading the immune system are live and rapidly dividing, proliferating
and interacting with other pathogens from the normal flora or invading with production
of a variety of cytokines and activation of receptors.
A killing assay experiment to analyse the killing of bacteria after ingestion or by direct
killing by ILCs through interactions between the bacteria, the ILCs and neutrophils
and the cytokines produced was planned but due to lack of time it could not be
performed. This experiment would include the infection of ILCs in culture plates with
P. aeruginosa in the presence and absence of neutrophils, by incubating on a 96 well
plate the ILCs and the P. aeruginosa with or without neutrophil for a period of time
and counting the cells with trypan blue solution.
The in vitro migration assay done to analyse the capacity of naïve and heat killed P.
aeruginosa ILCs to recruit neutrophils by inducing neutrophils to migrate towards their
location by using Transwell which consists of two chambers with medium that are
separated by a porous membrane with the size of porous only large enough to allow
the migration of neutrophils from the upper chamber to the lower chamber were the
attractants are (Figure 5.2). This type of assays are usually performed to assess
migration and/or the invasiveness of cancer cells but in this experiment were used to
show that heat killed P. aeruginosa increases the migration of neutrophils when
compared to non-immunisation. The movement of neutrophils is characterised by
extension of filopodia rich in actin and poor interaction of substrate (Kramer et al.,
2013). The assay is very simple to perform and does not require special equipment
besides the Transwell plates that are available for different types of cells and are not
expensive. For further study it would be interesting to observe the cells as they travel,
it could be achieved by performing a capillary chamber migration assay also known
as microfluidic chamber assays.
From finding out that ILCs can generate an immunological memory against bacterial
infection that helps to clear the bacterial burden, came the need to investigate the
longevity of the observed response as has been reported in a study about the BCG
vaccine that tolerance to bacterial pyrogens is increased in children that had received
the vaccine (Netea & Van Crevel, 2014).

181
The identification of ILCs receptors was not an easy task, it seemed to have some
overlaps that later on could only be explained by the discovery that ILCs have plastic
properties (Verrier et al., 2016), ILC3 subset can downregulate RORγt and start
expressing the ILC1 transcription factor T-bet (Lim et al., 2017a). The use of high
parameter flow cytometry provided useful information which could not have been
ascertained otherwise. Most notably an expansion in RORγt and T-bet positive cells
expressing CD44 post immunisation were observed. These dual positive cells have
previously been reported within the gut (Garrido-Mesa et al., 2019). Given that it is
now known that there is significant interaction between ILCs and the gut microbiome
(Lim et al., 2017b), it is feasible to propose that these dual positive cells in the gut are,
in fact, memory ILCs that have been induced by the commensal bacteria. The
frequency of ILCs on spleen from mice immunised with heat killed P. aeruginosa on
the t-SNE were higher than the ILCs from PBS immunised mice.
FlowSOM was used to identify subsets of ILCs and to describe the changes
happening in ILC cells surface markers between the two different treatments, as such,
analysis of the transcription factors was also performed ascertain differences that can
be hidden by the conventional flow cytometry analysis due to the limited number of
immunophenotypic markers that can be analysed simultaneously by this method.
Using FlowSOM in combination with t-SNE, 10 clusters were found with 4 associated
with T-bet and 1 with RORγt and T-bet. The memory marker CD44 were high in
clusters expressing transcription factors suggestive of ILCs (clusters 9 and 10) (Table
3.9).
Next the abundance of cells expressed by each of the 3 mice for each condition was
measure and a similar pattern was found in two out of the three mice from both groups
(Figure 3.17). The boxplots from the ten cluster to compare frequencies in a much
easier way (Figure 3.19) the heatmap revealed significant changes in clusters seven
and nine (Figure 3.18). The data obtained in this experiment form flow cytometry and
applied to computational methods was a valuable tool for multiphenotypical and
multifunctional analysis of a rare population of cells.
Using the combination of the two automated analysis FlowSOM and t-SNE were
possible to identify single positive cells but also double positive subsets that
expressed both T-bet and RORγt in clusters 8 to 10 (Table 3.7), plasticity has been
reported between ILC2 to ILC1, ILC2 to ILC3 and ILC3 to ILC1 (Flores-Borja et al.,
2016), cells expressing memory features such as low CD62L and high CD44 in
clusters 1 to 4 (Table 3.7). In clusters 5 to 7 surface markers were found on subsets

182
ILC1 (CD49b) high in immunise ILCs, CD117, subset ILC2 (Sca1) high on immunised
ILCs and subset ILC3 (CD335) which means that in this cluster provide information
about the transient state of ILCs and also about their activation state. It made it also
possible to identify the different subsets of ILCs using data obtained from heat killed
P. aeruginosa and PBS immunised mice to identify ILCs based on the expression of
CD90 positive marker, the increase in the expression of CD90 marker on the on P.
aeruginosa immunised is accompanied with co-expression of CD44 marker (Table
3.7).
This study has focused on the analysis of ILCs and memory during bacterial infection
using in vitro and in vivo studies and for the first time on ILC memory against P.
aeruginosa. Many questions remain unanswered about a clear subset distinction,
relationships between ILCs and other cells, ILCs plasticity, memory formation and
duration. The results here presented will help further studies about ILCs response
during gram-negative bacterial infection on how long the immune response lasts,
cytokines produced and on other immune cells required for the success of the
response, focusing mainly on the ILC3 subset, the subset involved in extracellular
bacterial infection, and all the newly describe subsets of ILC3 to find out what the role
of these subsets are by looking into differences of cellular receptors and gene
expression between the different ILC3 subsets.
Since ILCs are new discovered cells more studies are required for a better
understanding of their function, the study here presented is expected to provide some
contribution on how ILCs modulate their surface receptors and cytokine profile to deal
with gram-negative bacterial infection, specially the ILC3 subset. But, a further
investigation into the lymphocyte’s origin comparing T cell and ILCs is required to
better understand to what extent the lineage differentiation, commitment and
determination affect subsets’ functioning, and it is also important to obtain mouse
models of infection that will allow the investigation of ILCs during their absence without
affecting the function of other cells involved in the immune response being
investigated.
To analyse cell epigenetics and for transcriptome analysis in order to link changes in
surface markers and transcription factors expression with DNA sequence, a single-
cell RNA-seq for DNA sequence analysis would be performed. A comprehensive
study to dissect gene expression on ILCs on different tissues is required to better
understand how these cells are activated to respond to a stimuli and how they are
inhibited at the end of an immune response.

183
Although, various studies have demonstrated a link between IL-17, IL-22 and IFN-γ
production during bacterial infection, this study has failed to show significant
production of these cytokines during gram-negative P. aeruginosa bacterial infection
maybe this was caused by the fact that isolate ILCs were used and isolation may have
somehow affected the ability to become activate and produce cytokines. Further
studies were these isolated ILCs were adoptively transferred into a mouse would help
to analysed whether it would increase the production of cytokines.
These data further corroborate the idea that a sustained immunological response that
lasts for more than 14 days after immunisation exists within other ILC subsets besides
ILC2 subset that has shown to provide memory response in lung the ILC3 subset is
also capable of memory like response against extracellular gram-negative bacterial
infection (Martinez-Gonzalez et al., 2016b). An increase in IL-22, neutrophils and DCs
were observed in mice immunised with heat-killed P. aeruginosa. The importance of
Immunisation to protect from infection was also here demonstrated in mice, although
the critical role of ILC3, IL-22 and IL-17 cytokines and DCs in mediating the ILC3
immune response is yet to be investigated.
P. aeruginosa is behind many of many infectious hospital admissions with long time
morbidity fact that suggests that the already known cells and components of the
immune system such as the adaptive system, the phagocytes and the complement
system are not being able to successfully deal with that pathogen and being ILCs
located at sites that give then opportunity to deal with invading pathogen at the entry
point and the fact that they can change their phenotype makes ILCs a perfect
candidate to study in search of new therapeutic strategies. When exploring the role of
ILCSs this work has demonstrated that infection was controlled in lymphocyte
deficient Rag1 knockout mice with involvement of neutrophils. We also looked at
cytokines signatures during infection it was observed an increase of IL-17A and more
of IL-22 but not IFN-γ and immunisation has in increase of ILC, neutrophil and DC
populations. Studying changes on innate receptors and of T cell population during the
cause of the infection would be of interest to understand their interaction with ILCs.
The specific innate immune cell memory discussed in the present work differs from
trained immunity in the fact that trained immunity is generated by nonspecific
challenge after immunisation, infection and internal components, and that response
is initiated by recognition through PRR and NOD2 resulting in induction of metabolic,
epigenetic and functional modifications with increased production of cytokines
resulting on much stronger immune response, although non-specific (Mourits et al.,

184
2018) whereas innate immunological memory is specific and always leads to an
improved immune response, as it has already been shown in monocytes and NK cells
(Netea & Joosten, 2018), macrophages (Netea & Joosten, 2018). A study conducted
in monocytes demonstrated an increased production of TNF-α and IL-6 during trained
immunity (Quintin et al., 2013). Both type of immune responses can be applied in the
field of medicine to help dealing with diseases resulting from an under or over reactive
immune system. The disadvantage of the trained immunity is the fact that it will also
strengthen immune responses that may not require any changes, it can be beneficial
as it has been proved in the case of BCG where it has reduced mortality rate in
children but whether or not this has caused other health problems in not known. The
induction of specific innate immunological memory has also its downfalls. Although
the response is being manipulated to a specific target it would require a great level of
control and a good knowledge of all cells and pathways activated by the activation or
suppression as a lot has yet to be known about how the immune system is naturally
activated, regulated or supressed. And whether or not the changes caused by an
induced immune response can be reversed if it becomes detrimental for the patient
has also to be known before these can be safely applied.
A lot of data has been acquired from mouse studies, but it is not yet safe to apply the
acquire knowledge to human as the studies have been performed on
immunocompromised mice that lacked one or more cells of the adaptive immune
system and some phenotypical and lineage differences exist between human and
mouse ILCs. Precaution should be taken when considering data obtained by studies
using immunocompromised mice such as RAG1 which lacks the recombination-
activating gene 1, mice lacking Il2rg when mice are treated with depleting antibodies
against CD90 or other markers as such mice can also be deficient in other cell types
that we already know or even that we do not know yet to be depended on these genes,
receptors or markers. We still don’t know yet if ILCs would be able to control P.
aeruginosa infection in human and if after manipulation of ILCs to respond to
inflammatory diseases if it would affect their life span or if they would be able to revert
the induced immunological memory. Lack of mouse models that lack ILCs with no
impact on T cells or other immune cell population is still a big challenge for ILC studies.
But there is a possibility that ILCs response can be tailored to clear infections caused
by the gram-negative bacterium P. aeruginosa.

185
To conclude, the discovery of trained immunity (Boraschi & Italiani, 2018) and NK cell
memory have already caused many of the dogmas surrounding the innate
immunological memory needs to be reassessed. The work presented in this thesis
demonstrates that we still have considerably more to learn about the memory potential
of the innate immune system. The ability of ILCs to provide an immediate response
to infection open the possibility of future use of rapid vaccines, able to provide
protection more rapidly than current T and B cell driven protection.
For further work, fundamental and clinical research into the role of chemokines and
cytokines during ILCs recognition, activation, presentation to T cells and crosstalk with
other cells of the adaptive and innate immune system to promote and maintain
immunity to acquire knowledge on how the immune response can be modulated the
immune response and benefit the host. ILCs subsets are implicated in defence
against microbial invasion, environmental changes and homeostasis, understanding
the changes occurring in the local environment and ILC cells behaviour during those
changes would be a base for understanding the molecular changes occurring during
diseases. This knowledge would help to increase or decrease ILCs response to a
particular disease through metabolic, immunologic, molecular or epigenetic induced
changes.

186
APPENDICES
Appendix 1.1 Preparation of 1M Hydrochloric acid (HCl):
1. When preparing acid from concentrated acid stocks always measure in a
fume hood
2. Prepare using glassware, no plastics
3. Always add ACID TO WATER
4. Concentrated HCl has a molarity of ~12.1 (Sigma)
5. To make 500 mL of 1M HCl add 41.3 mL of HCl into 458.7 mL dH2O
Appendix 1.2 Aliquoting Foetal bovine / calf serum (FBS/ FCS):
1. FBS needs to be heat inactivated- Place the bottle in a 60°C water bath for 1
hour
2. Aliquot the FBS into 50mL falcon tubes (25mL) in a tissue-culture hood
3. Store the FBS at -20°C until use
Appendix 1.3 Aliquoting Penicillin / streptomycin (Pen/Strep):
1. Pen/strep should be aliquoted into 15mL falcon tubes (5mL aliquots) use
tissue culture hood.
2. The Pen/strep can be stored at -20°C until use.
Appendix 1.4 10X Phosphate Buffer / Tween (PBST-ELISA WASH BUFFER):
1. 80g NaCl
2. 2g KCl
3. 11.5g Na2HPO4
4. 2g KH2PO4
5. Make to 1L and pH to 7.2-7.4

187
Appendix 1.5 1X Phosphate Buffer / Tween (PBST-ELISA WASH BUFFER):
1. To make 1x PBST add 200mL (x10 PBS) and 1mL Tween 20.
2. Make to 2L with ddH2O (Add 1799mL)
3. PBST is made in the 2L Winchester bottle.
4. Dilution buffer
5. ELISA 5X assay dilution buffer (eBioscience) diluted with dH2O to 1:5.
Appendix 1.6 Stop solution
1N sulphuric acid (H2SO4)
Appendix 1.7 Complete IMDM (Media)
1. Iscove’s Modified Dulbecco’s Medium (IMDM) (1X) (Gibco, UK)
2. 10% heat-inactivated foetal calf serum (Bioscience, UK)
3. 1% penicillin/streptomycin (1X) (PAA, UK)
Appendix 1.8 ACK Lysis Buffer
1. 500mL distilled water
2. 4.15g ammonium chloride (NH4Cl) (Sigma, UK)
3. 1.8mg EDTA (Disodium salt) (Melford Laboratories Limited, UK)
4. Mixed well and autoclave
Appendix 1.9 ELISA reagents
10X PBS
1. 800 ml distilled water
2. 80g sodium chloride (NaCl) (Scientific Laboratory Supplies, UK)
3. 2g potassium chloride (KCL) (VWR, UK)
4. 2g potassium dihydrogen phosphate (KH2PO4) (Process Measurement and
Analysis Limited, UK)
5. 11.5g sodium phosphate dibasic (HNa2PO4) (Sigma, UK)
188
6. Stirred to dissolve and PH adjusted to 7.2-7.4
7. Volume made up to 1 L with distilled water
8. 35.8 g sodium hydrogen phosphate dibasic dodecahydrate – Na2HPO4.
12H2O (Sigma Aldrich, UK)
Elisa Wash Buffer
1. 1X PBS
2. 0.05% Tween 20 (Sigma, UK)
ELISA Stop Solution – 1M Sulphuric Acid (H2SO4)
1. 13.5 mL 98% concentrated H2SO4 (Sigma, UK)
2. 175mL cold distilled water (exothermic reaction on addition of H2SO4)
3. Make up 250mL with cold distilled water
ELISA Assay Buffers
1. 5X Assay diluents (eBioscience, UK)
2. 1XPBS, 0,05% Tween 20 and 0.1% bovine serum albumin (Sigma, UK)
3. 1XPBS, 1% BSA (R&D, UK)
Appendix 1.10 Media
Cetrimide agar plates: In an autoclave bottle 23.35g of cetrimide in 500mL of dH2O
and 5mL of glycerol were mixed until complete dissolved, autoclaved and allowed to
cool before being poured into plates.
Nutrient broth: 1:12.5g of nutrient broth dissolved in 500mL of dH2O and autoclaved.
Appendix 1.11 Culture of bacteria
All bacteria were conserved on vials containing glycerol in the -80 freezer. From a vial
of bacteria, a small scratch was taken from the top with a sterile loop, plated on a
189
plate containing the appropriate agar media and incubated overnight at 37C. In the
following day, cultivate one colony from the overnight plate in 10mL of broth in a 50mL
Falcon tube at 37 C.
Appendix 1.12 Preparing the inoculum
Centrifuge the overnight grown bacteria at 5000g for 10 minutes, discard the
supernatant, resuspend in 10 ml of sterile PBS.
Centrifuge the overnight grown bacteria at 5000g for 10 minutes, discard the
supernatant, resuspend in 1 ml of sterile PBS and measure the OD, use sterile PBS
to adjust the desired OD.
Appendix 1.13 Preparation of HBSS++ medium
From two bottles of 1l HBSS medium (-Ca2+, - Mg2+, free of phenol red) (Sigma,
H6648) 25 ml was taken from each bottle and added to 1 bottle (5g) endotoxin-
low/Fatty acid-free BSA (Sigma, A8806-5g). Once the BSA is dissolved the medium
was sterile filter into a 50 ml Falcon tube. Add 25 ml of the sterile BSA solution to each
bottle. Add 15 ml sterile Hepes 1M pH 7.4 to each bottle. Add 64 ml sterile water to
each bottle to obtain an isotonic solution. Store the HBSS medium at 4 degrees and
open the bottle under the hood
Appendix 1.14 Preparation of Percoll
Take the Percoll bottle and leave it out at room temperature for most of the day (the
density of the Percoll is dependent on the temperature).
1) Make up 10x HBSS (with red phenol, no Ca2+ and Mg2+) + 3.5g/l NaHC03.
Take 100 ml HBSS 10 X and add 0.35 g NaHC03.
(dissolve 50 ml of HBSS 10X with 0.35 g NaHC03, sterile filter and complement with
50 ml sterile 10 x HBSS).
This will be the 10 x HBSS used to prepare the Percoll (HBSS-NaHC03)
190
2) Make up 1x HBSS-NaHCO3:
450 ml H20
50 ml HBSS-NaHC03 10X
Make-up Percoll 90%.
Weigh a Flask
Add around 420 ml Percoll
Weigh of the Percoll =Weight of Flask + Percoll – Weight of empty Flask. Here for
example, weigh of Percoll 100 % = 519 g
Calculate volume with the following formula: Weight/Density= volume
For 100% Percoll, Volume = 519 g/1.131 g/ml = 459 ml
For 90% Percoll, Volume = 459/90 x 100% = 509.8 ml
509.8 ml –459 ml = 5 ml. This is the volume of HBSS 10X with NaHCO3to be added
to the 459 ml Percoll (100%) to obtain a 90% Percoll solution.
Make up 62% Percoll:
Mix 137.8 ml of 90% Percoll + 62.2 ml HBSS 1X, or
Mix 68.9 ml of Percoll 90% + 31.1 ml HBSS 1X.
Make up 55% Percoll:
Mix 122.2 ml of 90% Percoll + 77.8 ml HBSS 1X, or,
Mix 61.1 ml of 90% Percoll + 38.9 ml HBSS 1X.

191
Appendix 1.15 Table of Protein secretion inhibitors
Reagent Stock concentration
Intermediate dilution
Final concentration
Brefeldin A 5 mg/ml in DMSO (stored in aliquots at -20 ˚C)
1:10 in PBS 10 μg/ml (1:50) or 5 μg/ml (1:100) with monensin
Monensin 5 mg/ml in ethanol (stored at 4 ˚C)
1:10 in PBS 10 μg/ml (1:50) or 5 μg/ml (1:100) with brefeldin A
Appendix 1.16 Mouse Anaesthetic
Material Concentration Source Volume (ml)
Xylazine 20 mg/ml Rompun, Bayer, Uk
1
Ketamine 100 mg/ml Ketaset, Fort Dodge Animal Health Limited, UK
1
dH2O 4.6
Appendix 1.17 Flow Cytometry Antibodies
Antibody Isotype Clone Fluorophore Source Concentration
CD11b IgG2b k M1/70 PE eBioscience 0.06µg
CD11c A.H. IgG NH18 PE eBioscience 0.06µg
Gr-1 Rat IgG2b, k RB6-8C5 PE eBioscience 0.06µg
F4/80 Rat IgG2a, k BM8 PE eBioscience 0.25µg
CD3 Rat IgG2b, k 145-ZC11 PE Biologend 0.25µg
B220 Rat IgG2a, k RA3-6B2 PE eBioscience 0.25µg
CD45 Rat IgG2b, k 30-F11 PE Biologend 0.25µg
TER-119 Rat IgG2b, k TER 119 PE eBioscience 0.25µg
NK1.1 IgG2a k PK 136 PE eBioscience 0.25µg
γδ TCR A.H. IgG eBio GL3 PE eBioscience 0.06µg
CD90 IgG2b k 30-H12 FITC eBioscience 0.06µg
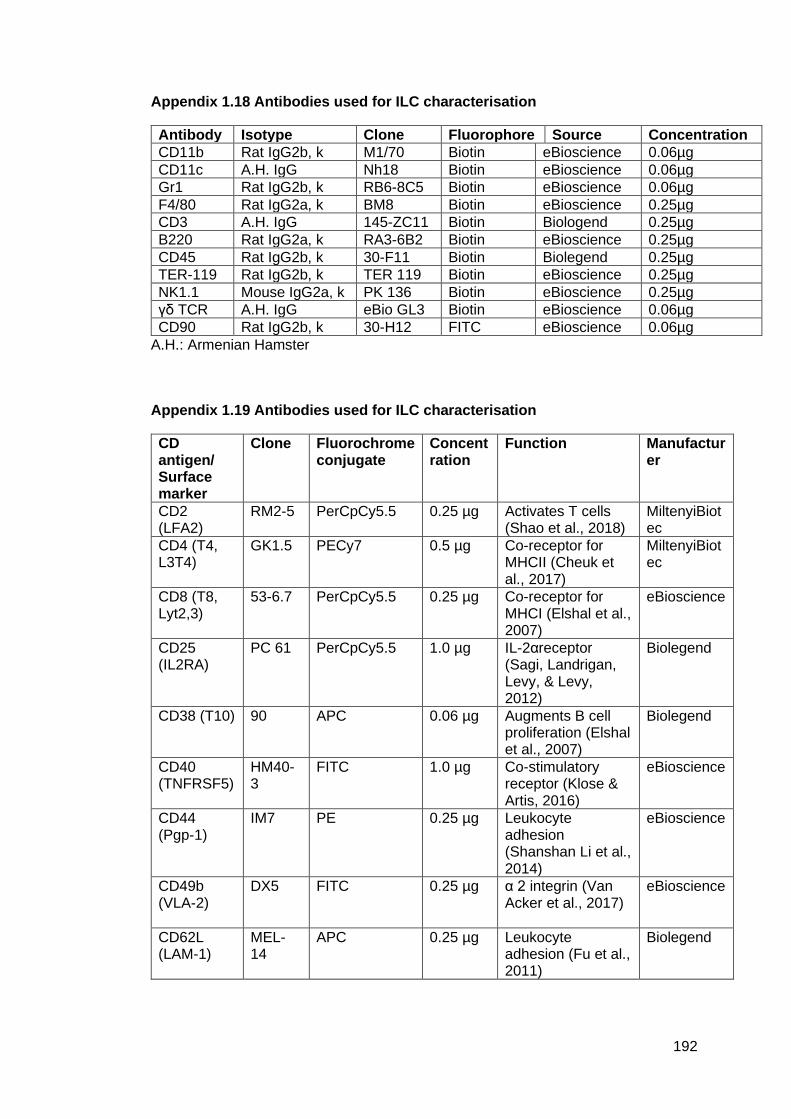
192
Appendix 1.18 Antibodies used for ILC characterisation
Antibody Isotype Clone Fluorophore Source Concentration
CD11b Rat IgG2b, k M1/70 Biotin eBioscience 0.06µg
CD11c A.H. IgG Nh18 Biotin eBioscience 0.06µg
Gr1 Rat IgG2b, k RB6-8C5 Biotin eBioscience 0.06µg
F4/80 Rat IgG2a, k BM8 Biotin eBioscience 0.25µg
CD3 A.H. IgG 145-ZC11 Biotin Biologend 0.25µg
B220 Rat IgG2a, k RA3-6B2 Biotin eBioscience 0.25µg
CD45 Rat IgG2b, k 30-F11 Biotin Biolegend 0.25µg
TER-119 Rat IgG2b, k TER 119 Biotin eBioscience 0.25µg
NK1.1 Mouse IgG2a, k PK 136 Biotin eBioscience 0.25µg
γδ TCR A.H. IgG eBio GL3 Biotin eBioscience 0.06µg
CD90 Rat IgG2b, k 30-H12 FITC eBioscience 0.06µg
A.H.: Armenian Hamster
Appendix 1.19 Antibodies used for ILC characterisation
CD antigen/ Surface marker
Clone Fluorochrome conjugate
Concentration
Function Manufacturer
CD2 (LFA2)
RM2-5 PerCpCy5.5 0.25 µg Activates T cells (Shao et al., 2018)
MiltenyiBiotec
CD4 (T4, L3T4)
GK1.5 PECy7 0.5 µg Co-receptor for MHCII (Cheuk et al., 2017)
MiltenyiBiotec
CD8 (T8, Lyt2,3)
53-6.7 PerCpCy5.5 0.25 µg Co-receptor for MHCI (Elshal et al., 2007)
eBioscience
CD25 (IL2RA)
PC 61 PerCpCy5.5 1.0 µg IL-2αreceptor (Sagi, Landrigan, Levy, & Levy, 2012)
Biolegend
CD38 (T10) 90 APC 0.06 µg Augments B cell proliferation (Elshal et al., 2007)
Biolegend
CD40 (TNFRSF5)
HM40-3
FITC 1.0 µg Co-stimulatory receptor (Klose & Artis, 2016)
eBioscience
CD44 (Pgp-1)
IM7 PE 0.25 µg Leukocyte adhesion (Shanshan Li et al., 2014)
eBioscience
CD49b (VLA-2)
DX5 FITC 0.25 µg α 2 integrin (Van Acker et al., 2017)
eBioscience
CD62L (LAM-1)
MEL- 14
APC 0.25 µg Leukocyte adhesion (Fu et al., 2011)
Biolegend

193
CD69 (AIM) H1.2F3 PacificBlue 0.5 µg Regulate proliferation (Sagi et al., 2012)
eBiolegend
CD121a (IL-RI)
JAMA 147
PE 0.25 µg IL-1α and IL-1β
receptor (Z. Liu et al., 2015)
eBioscience
CD127 (IL-7R)
A7R34 PE-Cy7 1.0 µg
IL-7 receptor (Dai et al., 2010; Van Acker et al., 2017)
Biolegend
CD128a (CXCR1)
8F1-1-4 Alexa647 0.5 µg IL-8 receptor (Elemam et al., 2017a)
eBioscience
CD196 (CCR6)
Sirx6 APC 0.5 µg CCL20 and CCL21 receptor (Elemam et al., 2017c)
MiltenyiBiotec
CD117 (c-Kit)
2B8 APC 0.5 µg Stem cell factor receptor (Van Acker et al., 2017)
eBioscience
Erg2 Erongr2
PE 0.25 µg Early growth response (Jablonski et al., 2015)
MiltenyiBiotec
IL-17Rβ 9B10 Alexa Fluor 647
0.25 µg Promote Th2 cytokines (Yazdani et al., 2015a)
MiltenyiBiotec
IL-23R 12B2B64
PE 0.5 µg IFNγ production (Yazdani et al., 2015b)
MiltenyiBiotec
MHCII M5/114.15.2
APC 0.06 µg Antigen presenting cell (Klose & Artis, 2016)
MiltenyiBiotec
CD335 (NKp46)
29A1.4 PE Cy7 0.25 µg NK cell function (Van Acker et al., 2017)
MiltenyiBiotec
PIR A 6C1 PE-Cy7 0.25 µg Activation of mast cells (Maeda, Kurosaki, & Kurosaki, 1998)
eBioscience
Sca-1 (Ly6A/E)
D7 PE-Cy3 0.06 µg Maintenance of T cell memory (Whitmire, Eam, & Whitton, 2009)(Van Acker et al., 2017)
eBioscience
ST2 (IL-33) RMST2-2
PerCP-eFluor 710
0.25 µg IL-4, IL-5 and IL-13 cytokines (Elemam et al., 2017c)
MiltenyiBiotec
CD120a (TNFRI)
55R-286
APC 0.5 µg TNF receptor 1, initiation of proinflammatory pathway. (S. Yang, Wang, Brand, & Zheng, 2018)
eBioscience
CD120b (TNFRII)
EP.R1653
PE-Cy3 0.5 µg TNF receptor 2, modulates tissue
MiltenyiBiotec

194
regeneration (S. Yang et al., 2018)
CD278 (ICOS)
REA192
FITC 0.25 µg Proliferation of ILC2 (Klose & Artis, 2016)(J. Kim et al., 2017)
MiltenyiBiotec
Appendix 1.20 ACK lysis buffer
Components Quantity Source
NH4Cl 4.15 g Sigma
KHCO3 500 mg VWR
EDTA 1.86 mg Melford
dH2O 500 ml
Appendix 1.21 ELISA reagents dilutions
Analyte Isotype Standard range
Sample dilution Source
IL-6 500-7/1825 pg/ml
Supernatant 1:5 eBioscience
IFN-γ Rat IgG2a, k
2000-31.25 pg/ml
Supernatant 1:5 eBioscience
IL-17A Rat IgG2a, k
500-7,1825 pg/ml
Supernatant: neat
eBioscience
IL-22 Rat IgG1 1000-15.625 pg/ml
Supernatant: neat eBioscience
IL-23 Rat IgG1 1000-15.625 pg/ml
Supernatant: neat eBioscience
Appendix 1.22 Cell culture reagents
Supplemented IMDM culture media
Components Volume Source
IMDM 500 ml Gibco
Heat-inactivated FCS 50 ml eBioscience
Penicillin/streptomycin 5ml PAA

195
Appendix 1.23 Table of Activators
Reagent Stock concentration Intermediate dilution
Final concentration
Phorbol12-myristate 13 acetate (PMA)
1 mg/ml in DMSO (stored in aliquots at -20 ˚C)
1:1,000 in PBS
1 ng/ml
Ionomycin 1 mg/ml in DMSO (stored in aliquots at -20 ˚C)
1:10 in PBS 1 μg/ml
Phytohemagglutinin (PHA)
1 mg/ml in DMSO (stored at 4 ˚C)
1:10 in PBS 1 μg/ml
CellStimulator Cocktail
Manufacturer instructions
2μl/ml
Con A Solution 500X
Manufacturer instructions
4μl/ml
HK bacteria mpQ502
104

196
CHAPTER 7 - REFERENCES

197
Abel, A. M., Yang, C., Thakar, M. S., & Malarkannan, S. (2018). Natural killer cells: Development, maturation, and clinical utilization. Frontiers in Immunology, 9(AUG), 1–23. https://doi.org/10.3389/fimmu.2018.01869
Abena K. R. Kwaa, a Chloe A. G. Talana, a* J. N. B. (2019). Interferon Alpha Enhances NK Cell Function and the Suppressive Capacity of HIV-Specific CD8+ T cells. 93(3), 1–14.
Akbay, E. A., Koyama, S., Liu, Y., Dries, R., Bufe, L. E., Silkes, M., … Wong, K. K. (2017). Interleukin-17A Promotes Lung Tumor Progression through Neutrophil Attraction to Tumor Sites and Mediating Resistance to PD-1 Blockade. Journal of Thoracic Oncology, 12(8), 1268–1279. https://doi.org/10.1016/j.jtho.2017.04.017
Akira, S. (2009). Pathogen recognition by innate immunity and its signaling. Proceedings of the Japan Academy Series B: Physical and Biological Sciences, Vol. 85. https://doi.org/10.2183/pjab.85.143
Akira, S., Uematsu, S., & Takeuchi, O. (2006a). Pathogen recognition and innate immunity. Cell, 124(4), 783–801. https://doi.org/10.1016/j.cell.2006.02.015
Akira, S., Uematsu, S., & Takeuchi, O. (2006b). Pathogen recognition and innate immunity. Cell. https://doi.org/10.1016/j.cell.2006.02.015
Akira, S., Uematsu, S., & Takeuchi, O. (2006c, February 24). Pathogen recognition and innate immunity. Cell, Vol. 124, pp. 783–801. https://doi.org/10.1016/j.cell.2006.02.015
Al-Wrafy, F., Brzozowska, E., Górska, S., & Gamian, A. (2017). Pathogenic factors of Pseudomonas aeruginosa - the role of biofilm in pathogenicity and as a target for phage therapy. Postepy Higieny i Medycyny Doswiadczalnej. https://doi.org/10.5604/01.3001.0010.3792
Allan, D. S. J., Kirkham, C. L., Aguilar, O. A., Qu, L. C., Chen, P., Fine, J. H., … Carlyle, J. R. (2015). An in vitro model of innate lymphoid cell function and differentiation. Mucosal Immunology, 8(2), 340–351. https://doi.org/10.1038/mi.2014.71
Amin, K. (2012). The role of mast cells in allergic inflammation. Respiratory Medicine. https://doi.org/10.1016/j.rmed.2011.09.007
Angeletti, S., Cella, E., Prosperi, M., Spoto, S., Fogolari, M., De Florio, L., … Ciccozzi, M. (2018). Multi-drug resistant Pseudomonas aeruginosa nosocomial strains: Molecular epidemiology and evolution. Microbial Pathogenesis, 123(July), 233–241. https://doi.org/10.1016/j.micpath.2018.07.020
Annunziato, F., Romagnani, C., & Romagnani, S. (2015). The 3 major types of innate and adaptive cell-mediated effector immunity. Journal of Allergy and Clinical Immunology, 135(3), 626–635. https://doi.org/10.1016/j.jaci.2014.11.001
Ardain, A., Domingo-gonzalez, R., Das, S., Kazer, S. W., Ogongo, P., Lu, L., … Garcia-, M. D. L. (2019). Group 3 innate lymphoid cells mediate early protetive immunity against tuberculosis. 570(7762), 528–532. https://doi.org/10.1038/s41586-019-1276-2.Group
Ardain, A., Porterfield, J. Z., Kløverpris, H. N., & Leslie, A. (2019). Type 3 ILCs in lung disease. Frontiers in Immunology, 10(JAN). https://doi.org/10.3389/fimmu.2019.00092
Artis, D., & Spits, H. (2015). The biology of innate lymphoid cells. Nature, 517(7534), 293–301. https://doi.org/10.1038/nature14189
Aujla, S. J., Chan, Y. R., Zheng, M., Fei, M., Askew, D. J., Pociask, D. A., … Kolls, J. K. (2008). IL-22 mediates mucosal host defense against Gram-negative bacterial pneumonia. Nature Medicine, 14(3), 275–281. https://doi.org/10.1038/nm1710
Bal, S. M., Golebski, K., & Spits, H. (2020). Plasticity of innate lymphoid cell subsets. Nature Reviews Immunology. https://doi.org/10.1038/s41577-020-0282-9
Balcewicz-Sablinska, M. K., Keane, J., Kornfeld, H., & Remold, H. G. (1998).

198
Pathogenic Mycobacterium tuberculosis evades apoptosis of host macrophages by release of TNF-R2, resulting in inactivation of TNF-alpha. Journal of Immunology (Baltimore, Md. : 1950).
Bald, T., Wagner, M., Gao, Y., Koyasu, S., & Smyth, M. J. (2019). Hide and seek: Plasticity of innate lymphoid cells in cancer. Seminars in Immunology, 41(November 2018), 101273. https://doi.org/10.1016/j.smim.2019.04.001
Bando, J. K., & Colonna, M. (2016). Innate lymphoid cell function in the context of adaptive immunity. Nature Immunology, 17(7), 783–789. https://doi.org/10.1038/ni.3484
Bar-Ephraim, Y. E., Koning, J. J., Burniol Ruiz, E., Konijn, T., Mourits, V. P., Lakeman, K. A., … Mebius, R. E. (2019). CD62L Is a Functional and Phenotypic Marker for Circulating Innate Lymphoid Cell Precursors. The Journal of Immunology, 202(1), 171–182. https://doi.org/10.4049/jimmunol.1701153
Bar-Ephraïm, Y. E., & Mebius, R. E. (2016). Innate lymphoid cells in secondary lymphoid organs. Immunological Reviews. https://doi.org/10.1111/imr.12407
Barisch, C., & Soldati, T. (2017). Breaking fat! How mycobacteria and other intracellular pathogens manipulate host lipid droplets. Biochimie. https://doi.org/10.1016/j.biochi.2017.06.001
Bassetti, M., Vena, A., Croxatto, A., Righi, E., & Guery, B. (2018). How to manage Pseudomonas aeruginosa infections. Drugs in Context. https://doi.org/10.7573/dic.212527
Baumgarth, N., & Roederer, M. (2000). A practical approach to multicolor flow cytometry for immunophenotyping. Journal of Immunological Methods. https://doi.org/10.1016/S0022-1759(00)00229-5
Berghof, T. V. L., Parmentier, H. K., & Lammers, A. (2013). Transgenerational epigenetic effects on innate immunity in broilers: An underestimated field to be explored? Poultry Science, 92(11), 2904–2913. https://doi.org/10.3382/ps.2013-03177
Bergstrom, K. S., Sham, H. P., Zarepour, M., & Vallance, B. A. (2012). Innate host responses to enteric bacterial pathogens: A balancing act between resistance and tolerance. Cellular Microbiology. https://doi.org/10.1111/j.1462-5822.2012.01750.x
Binamé, F., Pawlak, G., Roux, P., & Hibner, U. (2010). What makes cells move: Requirements and obstacles for spontaneous cell motility. Molecular BioSystems, 6(4), 648–661. https://doi.org/10.1039/b915591k
Biswas, C. (2018). Inflammation in Systemic Immune Diseases: Role of TLR9 Signaling and the Resultant Oxidative Stress in Pathology of Lupus. Immunity and Inflammation in Health and Disease, 223–237. https://doi.org/10.1016/B978-0-12-805417-8.00018-4
Björklund, A. K., Forkel, M., Picelli, S., Konya, V., Theorell, J., Friberg, D., … Mjösberg, J. (2016). The heterogeneity of human CD127+ innate lymphoid cells revealed by single-cell RNA sequencing. Nature Immunology, 17(4). https://doi.org/10.1038/ni.3368
Blum, J. S., Wearsch, P. A., & Cresswell, P. (2013). Pathways of Antigen Processing. Annual Review of Immunology, 31(1), 443–473. https://doi.org/10.1146/annurev-immunol-032712-095910
Boraschi, D., & Italiani, P. (2018). Innate immune memory: Time for adopting a correct terminology. Frontiers in Immunology, 9(APR), 1–4. https://doi.org/10.3389/fimmu.2018.00799
Brisse, M., & Ly, H. (2019). Comparative structure and function analysis of the RIG-I-like receptors: RIG-I and MDA5. Frontiers in Immunology, 10(JULY), 1–27. https://doi.org/10.3389/fimmu.2019.01586
Buchmann, K. (2014). Evolution of innate immunity: Clues from invertebrates via fish to mammals. Frontiers in Immunology, 5(SEP), 1–8. https://doi.org/10.3389/fimmu.2014.00459
199
Carlyle, J. R., Mesci, A., Ljutic, B., Belanger, S., Tai, L.-H., Rousselle, E., … Makrigiannis, A. P. (2006). Molecular and Genetic Basis for Strain-Dependent NK1.1 Alloreactivity of Mouse NK Cells. The Journal of Immunology, 176(12), 7511–7524. https://doi.org/10.4049/jimmunol.176.12.7511
Castleman, M. J., Dillon, S. M., Purba, C., Cogswell, A. C., McCarter, M., Barker, E., & Wilson, C. (2020). Enteric bacteria induce IFNγ and Granzyme B from human colonic Group 1 Innate Lymphoid Cells. Gut Microbes, 12(1). https://doi.org/10.1080/19490976.2019.1667723
Castleman, M. J., Dillon, S. M., Purba, C. M., Cogswell, A. C., Kibbie, J. J., McCarter, M. D., … Wilson, C. C. (2019). Commensal and pathogenic bacteria indirectly induce IL-22 but not IFNγ production from human colonic ILC3s via multiple mechanisms. Frontiers in Immunology, 10(MAR). https://doi.org/10.3389/fimmu.2019.00649
Castriconi, R., Della Chiesa, M., & Moretta, A. (2004). Shaping of adaptive immunity by innate interactions. Comptes Rendus - Biologies, 327(6), 533–537. https://doi.org/10.1016/j.crvi.2003.12.001
Cella, M., Otero, K., & Colonna, M. (2010). Expansion of human NK-22 cells with IL-7, IL-2, and IL-1β reveals intrinsic functional plasticity. Proceedings of the National Academy of Sciences of the United States of America, 107(24), 10961–10966. https://doi.org/10.1073/pnas.1005641107
Cerwenka, A., & Lanier, L. L. (2016). Natural killer cell memory in infection, inflammation and cancer. Nature Reviews Immunology, Vol. 16. https://doi.org/10.1038/nri.2015.9
Chan, B. C. L., Lam, C. W. K., Tam, L. S., & Wong, C. K. (2019). IL33: Roles in allergic inflammation and therapeutic perspectives. Frontiers in Immunology, 10(MAR), 1–11. https://doi.org/10.3389/fimmu.2019.00364
Chan, L. C., Rossetti, M., Miller, L. S., Filler, S. G., Johnson, C. W., Lee, H. K., … Yeaman, M. R. (2018). Protective immunity in recurrent Staphylococcus aureus infection reflects localized immune signatures and macrophage-conferred memory. Proceedings of the National Academy of Sciences of the United States of America, 115(47), E11111–E11119. https://doi.org/10.1073/pnas.1808353115
Chan, Y.-H., Lum, F.-M., & Ng, L. (2015). Limitations of Current in Vivo Mouse Models for the Study of Chikungunya Virus Pathogenesis. Medical Sciences, 3(3). https://doi.org/10.3390/medsci3030064
Chaplin, D. D. (2010). Overview of the immune response. Journal of Allergy and Clinical Immunology, 125(2 SUPPL. 2). https://doi.org/10.1016/j.jaci.2009.12.980
Chen, C. Y., Shih, Y. C., Hung, Y. F., & Hsueh, Y. P. (2019). Beyond defense: Regulation of neuronal morphogenesis and brain functions via Toll-like receptors. Journal of Biomedical Science, 26(1), 1–13. https://doi.org/10.1186/s12929-019-0584-z
Chen, C., Zhao, S., Karnad, A., & Freeman, J. W. (2018). The biology and role of CD44 in cancer progression: Therapeutic implications. Journal of Hematology and Oncology, 11(1), 1–23. https://doi.org/10.1186/s13045-018-0605-5
Cheuk, S., Schlums, H., Gallais Sérézal, I., Martini, E., Chiang, S. C., Marquardt, N., … Eidsmo, L. (2017). CD49a Expression Defines Tissue-Resident CD8+ T Cells Poised for Cytotoxic Function in Human Skin. Immunity, 46(2), 287–300. https://doi.org/10.1016/j.immuni.2017.01.009
Cifaldi, L., Locatelli, F., Marasco, E., Moretta, L., & Pistoia, V. (2017). Boosting Natural Killer Cell-Based Immunotherapy with Anticancer Drugs: a Perspective. Trends in Molecular Medicine, 23(12), 1156–1175. https://doi.org/10.1016/j.molmed.2017.10.002
Cole, J. E., Park, I., Ahern, D. J., Kassiteridi, C., Abeam, D. D., Goddard, M. E., … Monaco, C. (2018). Immune cell census in murine atherosclerosis: Cytometry by

200
time of flight illuminates vascular myeloid cell diversity. Cardiovascular Research. https://doi.org/10.1093/cvr/cvy109
Colonna, M. (2018). Innate Lymphoid Cells: Diversity, Plasticity, and Unique Functions in Immunity. Immunity, Vol. 48. https://doi.org/10.1016/j.immuni.2018.05.013
Cooper, M. A., Elliott, J. M., Keyel, P. A., Yang, L., Carrero, J. A., & Yokoyama, W. M. (2009). Cytokine-induced memory-like natural killer cells. 106(6), 1915–1919.
Cooper, M. A., & Yokoyama, W. M. (2010). Memory-like responses of natural killer cells. Immunological Reviews. https://doi.org/10.1111/j.0105-2896.2010.00891.x
Cooper, P. R., Palmer, L. J., & Chapple, I. L. C. (2013). Neutrophil extracellular traps as a new paradigm in innate immunity: friend or foe? Periodontology 2000, 63(1), 165–197. https://doi.org/10.1111/prd.12025
Cortez, V. S., Robinette, M. L., & Colonna, M. (2015). Innate lymphoid cells: New insights into function and development. Current Opinion in Immunology, 32, 71–77. https://doi.org/10.1016/j.coi.2015.01.004
Crome, S. Q., Nguyen, L. T., Lopez-Verges, S., Yang, S. Y. C., Martin, B., Yam, J. Y., … Ohashi, P. S. (2017). A distinct innate lymphoid cell population regulates tumor-associated T cells. Nature Medicine, 23(3). https://doi.org/10.1038/nm.4278
Croughs, P. D., Klaassen, C. H. W., van Rosmalen, J., Maghdid, D. M., Boers, S. A., Hays, J. P., & Goessens, W. H. F. (2018). Unexpected mechanisms of resistance in Dutch Pseudomonas aeruginosa isolates collected during 14 years of surveillance. International Journal of Antimicrobial Agents, 52(3), 407–410. https://doi.org/10.1016/j.ijantimicag.2018.05.009
Crouse, J., Xu, H. C., Lang, P. A., & Oxenius, A. (2015). NK cells regulating T cell responses: Mechanisms and outcome. Trends in Immunology, 36(1), 49–58. https://doi.org/10.1016/j.it.2014.11.001
Cyster, J. G., & Allen, C. D. C. (2019). B Cell Responses: Cell Interaction Dynamics and Decisions. Cell, 177(3), 524–540. https://doi.org/10.1016/j.cell.2019.03.016
Dadi, S., Chhangawala, S., Whitlock, B. M., Franklin, R. A., Luo, C. T., Oh, S. A., … Li, M. O. (2016). Cancer Immunosurveillance by Tissue-Resident Innate Lymphoid Cells and Innate-like T Cells. Cell, 164(3). https://doi.org/10.1016/j.cell.2016.01.002
Daha, M. R. (2011). Grand challenges in molecular innate immunity. Frontiers in Immunology, 2(MAY), 1–2. https://doi.org/10.3389/fimmu.2011.00016
Dai, H., Wan, N., Zhang, S., Moore, Y., Wan, F., & Dai, Z. (2010). Cutting Edge: Programmed Death-1 Defines CD8 + CD122 + T Cells as Regulatory versus Memory T Cells . The Journal of Immunology, 185(2), 803–807. https://doi.org/10.4049/jimmunol.1000661
Dantzer, R. (2009, May). Cytokine, Sickness Behavior, and Depression. Immunology and Allergy Clinics of North America, Vol. 29, pp. 247–264. https://doi.org/10.1016/j.iac.2009.02.002
de Almeida Silva, K. de C. F., Calomino, M. A., Deutsch, G., de Castilho, S. R., de Paula, G. R., Esper, L. M. R., & Teixeira, L. A. (2017). Molecular characterization of multidrug-resistant (MDR) Pseudomonas aeruginosa isolated in a burn center. Burns, 43(1), 137–143. https://doi.org/10.1016/j.burns.2016.07.002
De Grove, K. C., Provoost, S., Verhamme, F. M., Bracke, K. R., Joos, G. F., Maes, T., & Brusselle, G. G. (2016). Characterization and quantification of innate lymphoid cell subsets in human lung. PLoS ONE, 11(1), 1–12. https://doi.org/10.1371/journal.pone.0145961
De Kievit, T. R., & Iglewski, B. H. (2000). Bacterial quorum sensing in pathogenic relationships. Infection and Immunity. https://doi.org/10.1128/IAI.68.9.4839-4849.2000
De Oliveira, S., Rosowski, E. E., & Huttenlocher, A. (2016). Neutrophil migration in

201
infection and wound repair: Going forward in reverse. Nature Reviews Immunology. https://doi.org/10.1038/nri.2016.49
Dennert, G. (1985). A New Look at the Relationship of the Immune System to Neoplasia. Lymphoproliferative Diseases: Pathogenesis, Diagnosis, Therapy, 45–54. https://doi.org/10.1007/978-94-009-5016-0_5
Desmarais, T. R., Solo-Gabriele, H. M., & Palmer, C. J. (2002). Influence of soil on fecal indicator organisms in a tidally influenced subtropical environment. Applied and Environmental Microbiology, 68(3), 1165–1172. https://doi.org/10.1128/AEM.68.3.1165-1172.2002
Di Vito, C., Mikulak, J., Zaghi, E., Pesce, S., Marcenaro, E., & Mavilio, D. (2019). NK cells to cure cancer. Seminars in Immunology, 41(January), 101272. https://doi.org/10.1016/j.smim.2019.03.004
Diefenbach, A., Colonna, M., & Koyasu, S. (2014). Development, differentiation, and diversity of innate lymphoid cells. Immunity. https://doi.org/10.1016/j.immuni.2014.09.005
Diefenbach, A., Colonna, M., & Romagnani, C. (2017). The ILC World Revisited. Immunity, 46(3), 327–332. https://doi.org/10.1016/j.immuni.2017.03.008
Dillon, S. M., Lee, E. J., Bramante, J. M., Barker, E., & Wilson, C. C. (2014). The natural killer cell interferon-gamma response to bacteria is diminished in untreated HIV-1 infection and defects persist despite viral suppression. Journal of Acquired Immune Deficiency Syndromes, 65(3), 259–267. https://doi.org/10.1097/01.qai.0000435603.50598.2b
Dinarello, C. a. (2000). impact of basic research on tomorrow ’ s Proinflammatory Cytokines. Chest, 118(2), 503–508. https://doi.org/10.1378/chest.118.2.503
Dzopalić, T., Božić-Nedeljković, B., & Jurišić, V. (2019). Function of innate lymphoid cells in the immune-related disorders. Human Cell, 32(3), 231–239. https://doi.org/10.1007/s13577-019-00257-1
Ebbo, M., Crinier, A., Vély, F., & Vivier, E. (2017a). Innate lymphoid cells: Major players in inflammatory diseases. Nature Reviews Immunology. https://doi.org/10.1038/nri.2017.86
Ebbo, M., Crinier, A., Vély, F., & Vivier, E. (2017b). Innate lymphoid cells: Major players in inflammatory diseases. Nature Reviews Immunology, 17(11), 665–678. https://doi.org/10.1038/nri.2017.86
Eberl, G., Colonna, M., Di Santo, J. P., & McKenzie, A. N. J. (2015). Innate lymphoid cells: A new paradigm in immunology. Science, 348(6237), aaa6566–aaa6566. https://doi.org/10.1126/science.aaa6566
Eberl, Gérard, Colonna, M., Santo, J. P. D., & McKenzie, A. N. J. (2015). Innate lymphoid cells: A new paradigm in immunology. Science, 348(6237). https://doi.org/10.1126/science.aaa6566
Eisenbarth, S. C., & Flauell, R. A. (2009). Innate instruction of adaptive immunity revisited: The inflammasome. EMBO Molecular Medicine, 1(2), 92–98. https://doi.org/10.1002/emmm.200900014
Eken, A., & Donmez‐Altuntas, H. (2017). Innate Lymphoid Cells (Non‐NK ILCs). In Lymphocyte Updates - Cancer, Autoimmunity and Infection. https://doi.org/10.5772/intechopen.68893
Elemam, N. M., Hannawi, S., & Maghazachi, A. A. (2017a). Innate lymphoid cells (ILCs) as mediators of inflammation, release of cytokines and lytic molecules. Toxins, 9(12), 1–18. https://doi.org/10.3390/toxins9120398
Elemam, N. M., Hannawi, S., & Maghazachi, A. A. (2017b). Innate lymphoid cells (ILCs) as mediators of inflammation, release of cytokines and lytic molecules. Toxins, 9(12), 1–18. https://doi.org/10.3390/toxins9120398
Elemam, N. M., Hannawi, S., & Maghazachi, A. A. (2017c). Innate lymphoid cells (ILCs) as mediators of inflammation, release of cytokines and lytic molecules. Toxins. https://doi.org/10.3390/toxins9120398
Elshal, M. F., Khan, S. S., Raghavachari, N., Takahashi, Y., Barb, J., Bailey, J. J., …

202
McCoy, J. P. (2007). A unique population of effector memory lymphocytes identified by CD146 having a distinct immunophenotypic and genomic profile. BMC Immunology, 8, 1–15. https://doi.org/10.1186/1471-2172-8-29
Ferro, K., Peuß, R., Yang, W., Rosenstiel, P., Schulenburg, H., & Kurtz, J. (2019). Experimental evolution of immunological specificity. Proceedings of the National Academy of Sciences of the United States of America, 116(41), 20598–20604. https://doi.org/10.1073/pnas.1904828116
Flores-Borja, F., Irshad, S., Gordon, P., Wong, F., Sheriff, I., Tutt, A., & Ng, T. (2016). Crosstalk between Innate Lymphoid Cells and Other Immune Cells in the Tumor Microenvironment. Journal of Immunology Research, Vol. 2016. https://doi.org/10.1155/2016/7803091
Fontaine, D. A., & Davis, D. B. (2016). Attention to background strain is essential for metabolic research: C57BL/6 and the international knockout mouse consortium. Diabetes, 65(1), 25–33. https://doi.org/10.2337/db15-0982
Foster, J. R. (2001). The functions of cytokines and their uses in toxicology. International Journal of Experimental Pathology, 82(3), 171–192. https://doi.org/10.1046/j.1365-2613.2001.00192.x
Friess, M. D., Pluhackova, K., & Böckmann, R. A. (2018). Structural Model of the mIgM B-Cell Receptor Transmembrane Domain From Self-Association Molecular Dynamics Simulations. Frontiers in Immunology, 9(December), 2947. https://doi.org/10.3389/fimmu.2018.02947
Fu, X., Liu, Y., Li, L., Li, Q., Qiao, D., Wang, H., … Wu, C. Y. (2011). Human natural killer cells expressing the memory-associated marker CD45RO from tuberculous pleurisy respond more strongly and rapidly than CD45RO- natural killer cells following stimulation with interleukin-12. Immunology, 134(1), 41–49. https://doi.org/10.1111/j.1365-2567.2011.03464.x
Gardiner, C. M., & Mills, K. H. G. (2016). The cells that mediate innate immune memory and their functional significance in inflammatory and infectious diseases. Seminars in Immunology, Vol. 28. https://doi.org/10.1016/j.smim.2016.03.001
Garrido-Mesa, N., Schroeder, J. H., Stolarczyk, E., Gallagher, A. L., Lo, J. W., Bailey, C., … Lord, G. M. (2019). T-bet controls intestinal mucosa immune responses via repression of type 2 innate lymphoid cell function. Mucosal Immunology, 12(1), 51–63. https://doi.org/10.1038/s41385-018-0092-6
Gasteiger, G., Fan, X., Dikiy, S., Lee, S. Y., & Rudensky, A. Y. (2015). Tissue residency of innate lymphoid cells in lymphoid and nonlymphoid organs. Science, 350(6263). https://doi.org/10.1126/science.aac9593
Gasteiger, G., & Rudensky, A. Y. (2014). Interactions between innate and adaptive lymphocytes. Nature Reviews Immunology, 14(9), 631–639. https://doi.org/10.1038/nri3726
Geissmann, F., Manz, M. G., Jung, S., Sieweke, M. H., Merad, M., & Ley, K. (2010). Development of monocytes, macrophages, and dendritic cells. Science. https://doi.org/10.1126/science.1178331
Gieseck, R. L., Wilson, M. S., & Wynn, T. A. (2018). Type 2 immunity in tissue repair and fibrosis. Nature Reviews Immunology, 18(1), 62–76. https://doi.org/10.1038/nri.2017.90
Giuliana Magri#1, Michio Miyajima#2, Sabrina Bascones1, Arthur Mortha3, Irene Puga1, Linda Cassis1, Carolina M. Barra1, Laura Comerma1, Aleksey Chudnovskiy3, Maurizio Gentile1, David Llige1, Montserrat Cols4, Sergi Serrano5, Juan Ignacio Aróstegui6, Manel, 71Institut. (2017). Innate lymphoid cells integrate stromal and immunological signals to enhance antibody production by splenic marginal zone B cells. Physiology & Behavior, 176(12), 139–148. https://doi.org/10.1038/ni.2830.Innate
Gladiator, A., Wangler, N., Trautwein-Weidner, K., & LeibundGut-Landmann, S. (2013). Cutting Edge: IL-17-Secreting Innate Lymphoid Cells Are Essential for

203
Host Defense against Fungal Infection. The Journal of Immunology, 190(2), 521–525. https://doi.org/10.4049/jimmunol.1202924
Gordon, S. (2004). Pathogen recognition or homeostasis? APC receptor functions in innate immunity. Comptes Rendus - Biologies, 327(6), 603–607. https://doi.org/10.1016/j.crvi.2004.04.005
Gordon, S. (2016). Phagocytosis: An Immunobiologic Process. Immunity, 44(3), 463–475. https://doi.org/10.1016/j.immuni.2016.02.026
Gordon, S., & Martinez, F. O. (2010). Alternative activation of macrophages: Mechanism and functions. Immunity. https://doi.org/10.1016/j.immuni.2010.05.007
Gordon, S., & Plüddemann, A. (2017). Tissue macrophages: Heterogeneity and functions. BMC Biology, 15(1), 1–18. https://doi.org/10.1186/s12915-017-0392-4
Gray, J., Oehrle, K., Worthen, G., Alenghat, T., Whitsett, J., & Deshmukh, H. (2017). Intestinal commensal bacteria mediate lung mucosal immunity and promote\nresistance of newborn mice to infection. Science Translational Medicine, 9(376), 1–14. https://doi.org/10.1126/scitranslmed.aaf9412
Gregory F Sonnenberg & David Artis. (2015, July 9). Innate lymphoid cells in the initiation, regulation and resolution of inflammation. Nature Medicine, Vol. 21, pp. 698–708. https://doi.org/10.1038/nm.3892
Gronke, K., Kofoed-Nielsen, M., & Diefenbach, A. (2016). Innate lymphoid cells, precursors and plasticity. Immunology Letters, 179. https://doi.org/10.1016/j.imlet.2016.07.004
Guo, L., Junttila, I. S., & Paul, W. E. (2012). Cytokine-induced cytokine production by conventional and innate lymphoid cells. Trends in Immunology, 33(12), 598–606. https://doi.org/10.1016/j.it.2012.07.006
Gupta, S., Chan, D. W., Zaal, K. J., & Kaplan, M. J. (2018). A High-Throughput Real-Time Imaging Technique To Quantify NETosis and Distinguish Mechanisms of Cell Death in Human Neutrophils. The Journal of Immunology, 200(2), 869–879. https://doi.org/10.4049/jimmunol.1700905
Haeryfar, S. M. M., Conrad, D. M., Musgrave, B. L., & Hoskin, D. W. (2005). Antibody blockade of Thy-1 (CD90) impairs mouse cytotoxic T lymphocyte induction by anti-CD3 monoclonal antibody. Immunology and Cell Biology. https://doi.org/10.1111/j.1440-1711.2005.01342.x
Halim, T. Y. F., Hwang, Y. Y., Scanlon, S. T., Zaghouani, H., Garbi, N., Fallon, P. G., & Mckenzie, A. N. J. (2016). Group 2 innate lymphoid cells license dendritic cells to potentiate memory TH2 cell responses. Nature Immunology, 17(1). https://doi.org/10.1038/ni.3294
Hamon, M. A., & Quintin, J. (2016). Innate immune memory in mammals. Seminars in Immunology, 28(4), 351–358. https://doi.org/10.1016/J.SMIM.2016.05.003
Harari, A., Vallelian, F., & Pantaleo, G. (2004). Phenotypic heterogeneity of antigen-specific CD4 T cells under different conditions of antigen persistence and antigen load. European Journal of Immunology, 34(12), 3525–3533. https://doi.org/10.1002/eji.200425324
Häusser-Kinzel, S., & Weber, M. S. (2019). The role of B cells and antibodies in multiple sclerosis, neuromyelitis optica, and related disorders. Frontiers in Immunology, 10(FEB). https://doi.org/10.3389/fimmu.2019.00201
Hayden, M. S., West, A. P., & Ghosh, S. (2006, October 30). NF-κB and the immune response. Oncogene, Vol. 25, pp. 6758–6780. https://doi.org/10.1038/sj.onc.1209943
Hazenberg, M. D., & Spits, H. (2014a). Review Article Human innate lymphoid cells. Blood, 124(5), 700–710. https://doi.org/10.1182/blood-2013-11-427781.There
Hazenberg, M. D., & Spits, H. (2014b, July 31). Human innate lymphoid cells. Blood, Vol. 124, pp. 700–709. https://doi.org/10.1182/blood-2013-11-427781
Hepworth, M. R., Fung, T. C., Masur, S. H., Kelsen, J. R., McConnell, F. M., Dubrot,

204
J., … Sonnenberg, G. F. (2015). Group 3 innate lymphoid cells mediate intestinal selection of commensal bacteria-specific CD4+ T cells. Science, 348(6238). https://doi.org/10.1126/science.aaa4812
Herbert, D. R., Douglas, B., & Zullo, K. (2019). Group 2 innate lymphoid cells (ILC2): Type 2 immunity and helminth immunity. International Journal of Molecular Sciences, 20(9). https://doi.org/10.3390/ijms20092276
Hofmann, K., Clauder, A. K., & Manz, R. A. (2018). Targeting B cells and plasma cells in autoimmune diseases. Frontiers in Immunology, 9(APR). https://doi.org/10.3389/fimmu.2018.00835
Hole, C. R., Wager, C. M. L., Castro-Lopez, N., Campuzano, A., Cai, H., Wozniak, K. L., … Wormley, F. L. (2019). Induction of memory-like dendritic cell responses in vivo. Nature Communications, 10(1), 1–13. https://doi.org/10.1038/s41467-019-10486-5
Homann, D., & Kedl, R. M. (2018). Dimensions of immunologic memory. Immunological Reviews, 283(1), 5–6. https://doi.org/10.1111/imr.12658
Hoorweg, K., Peters, C. P., Cornelissen, F., Aparicio-Domingo, P., Papazian, N., Kazemier, G., … Cupedo, T. (2012). Functional differences between human NKp44- and NKp44+ RORC+ innate lymphoid cells. Frontiers in Immunology, 3(APR). https://doi.org/10.3389/fimmu.2012.00072
Hu, J., & August, A. (2008). Naive and Innate Memory Phenotype CD4 + T Cells Have Different Requirements for Active Itk for Their Development . The Journal of Immunology. https://doi.org/10.4049/jimmunol.180.10.6544
Irving, P., Troxler, L., & Hetru, C. (2004). Is innate enough? The innate immune response in Drosophila. Comptes Rendus - Biologies, 327(6), 557–570. https://doi.org/10.1016/j.crvi.2004.03.007
Ivanova, D. L., Denton, S. L., Fettel, K. D., Sondgeroth, K. S., Gutierrez, J. M., Bangoura, B., … Gigley, J. P. (2019). Innate lymphoid cells in protection, pathology, and adaptive immunity during apicomplexan infection. Frontiers in Immunology, 10(FEB), 1–15. https://doi.org/10.3389/fimmu.2019.00196
Iwanowycz, S., Wang, J., Altomare, D., Hui, Y., & Fan, D. (2016). Emodin bidirectionally modulates macrophage polarization and epigenetically regulates macrophage memory. Journal of Biological Chemistry, 291(22), 11491–11503. https://doi.org/10.1074/jbc.M115.702092
Iwasaki, A., & Medzhitov, R. (2015). Control of adaptive immunity by the innate immune system. Nature Immunology. https://doi.org/10.1038/ni.3123
Jablonski, K. A., Amici, S. A., Webb, L. M., Ruiz-Rosado, J. D. D., Popovich, P. G., Partida-Sanchez, S., & Guerau-De-arellano, M. (2015). Novel markers to delineate murine M1 and M2 macrophages. PLoS ONE, 10(12), 5–11. https://doi.org/10.1371/journal.pone.0145342
Jaigirdar, S. A., & MacLeod, M. K. L. (2015). Development and function of protective and pathologic memory CD4 T cells. Frontiers in Immunology, 6(SEP), 1–11. https://doi.org/10.3389/fimmu.2015.00456
Jain, A., & Pasare, C. (2017). Innate Control of Adaptive Immunity: Beyond the Three-Signal Paradigm. The Journal of Immunology, 198(10), 3791–3800. https://doi.org/10.4049/jimmunol.1602000
Jessica Sharrock. (1998). Natural killer cells and their role in immunity. Current Opinion in Immunology, 10(5), 532–538. https://doi.org/10.1016/S0952-7915(98)80219-7
Jie, Z., Liang, Y., Hou, L., Dong, C., Iwakura, Y., Soong, L., … Sun, J. (2014). Intrahepatic Innate Lymphoid Cells Secrete IL-17A and IL-17F That Are Crucial for T Cell Priming in Viral Infection. The Journal of Immunology. https://doi.org/10.4049/jimmunol.1303281
Jin, C., Henao-Mejia, J., & Flavell, R. A. (2013). Innate immune receptors: Key regulators of metabolic disease progression. Cell Metabolism, 17(6), 873–882. https://doi.org/10.1016/j.cmet.2013.05.011

205
Jones, H. R., Robb, C. T., Perretti, M., & Rossi, A. G. (2016). The role of neutrophils in inflammation resolution. Seminars in Immunology, 28(2), 137–145. https://doi.org/10.1016/j.smim.2016.03.007
Juan, C., Peña, C., & Oliver, A. (2017). Host and pathogen biomarkers for severe Pseudomonas aeruginosa infections. Journal of Infectious Diseases. https://doi.org/10.1093/infdis/jiw299
Juelke, K., & Romagnani, C. (2016). Differentiation of human innate lymphoid cells (ILCs). Current Opinion in Immunology, 38(Table 1), 75–85. https://doi.org/10.1016/j.coi.2015.11.005
Kaur, B. P., & Secord, E. (2019, October 1). Innate Immunity. Pediatric Clinics of North America, Vol. 66, pp. 905–911. https://doi.org/10.1016/j.pcl.2019.06.011
Keppel, M. P., Yang, L., & Cooper, M. A. (2013). Murine NK Cell Intrinsic Cytokine-Induced Memory-like Responses Are Maintained following Homeostatic Proliferation. The Journal of Immunology, 190(9), 4754–4762. https://doi.org/10.4049/jimmunol.1201742
Khalil, A. A., & Friedl, P. (2010). Determinants of leader cells in collective cell migration. Integrative Biology, 2(11–12), 568–574. https://doi.org/10.1039/c0ib00052c
Killig, M., Glatzer, T., & Romagnani, C. (2014). Recognition strategies of group 3 innate lymphoid cells. Frontiers in Immunology, 5(APR), 1–8. https://doi.org/10.3389/fimmu.2014.00142
Kim, J., Kim, G., & Min, H. (2017). Pathological and therapeutic roles of innate lymphoid cells in diverse diseases. Archives of Pharmacal Research, 40(11), 1249–1264. https://doi.org/10.1007/s12272-017-0974-2
Kim, M. H., Taparowsky, E. J., & Kim, C. H. (2015). RetinOic Acid Differentially Regulates The Migration Of Innate Lymphoid Cell Subsets To The Gut. Immunity, 43(1), 107–119. https://doi.org/10.1016/j.immuni.2015.06.009
Kleinnijenhuis, J., Quintin, J., Preijers, F., Joosten, L. A. B., Ifrim, D. C., Saeed, S., … Netea, M. G. (2012). Bacille Calmette-Guérin induces NOD2-dependent nonspecific protection from reinfection via epigenetic reprogramming of monocytes. Proceedings of the National Academy of Sciences of the United States of America, 109(43), 17537–17542. https://doi.org/10.1073/pnas.1202870109
Kleinnijenhuis, J., Quintin, J., Preijers, F., Joosten, L. A. B., Jacobs, C., Xavier, R. J., … Netea, M. G. (2014). BCG-induced trained immunity in NK cells: Role for non-specific protection to infection. Clinical Immunology, 155(2), 213–219. https://doi.org/10.1016/j.clim.2014.10.005
Klose, C. S. N., & Artis, D. (2016). Innate lymphoid cells as regulators of immunity, inflammation and tissue homeostasis. Nature Immunology, 17(7), 765–774. https://doi.org/10.1038/ni.3489
Klose, C. S. N., Flach, M., Möhle, L., Rogell, L., Hoyler, T., Ebert, K., … Diefenbach, A. (2014a). Differentiation of type 1 ILCs from a common progenitor to all helper-like innate lymphoid cell lineages. Cell, 157(2), 340–356. https://doi.org/10.1016/j.cell.2014.03.030
Klose, C. S. N., Flach, M., Möhle, L., Rogell, L., Hoyler, T., Ebert, K., … Diefenbach, A. (2014b). Differentiation of type 1 ILCs from a common progenitor to all helper-like innate lymphoid cell lineages. Cell. https://doi.org/10.1016/j.cell.2014.03.030
Koch, U., & Radtke, F. (2011). Mechanisms of T Cell Development and Transformation. Annual Review of Cell and Developmental Biology, 27(1), 539–562. https://doi.org/10.1146/annurev-cellbio-092910-154008
Koh, J., Kim, H. Y., Lee, Y., Park, I. K., Kang, C. H., Kim, Y. T., … Chung, D. H. (2019). IL23-producing human lung cancer cells promote tumor growth via conversion of innate lymphoid cell 1 (ILC1) into ILC3. Clinical Cancer Research, 25(13), 4026–4037. https://doi.org/10.1158/1078-0432.CCR-18-3458
Kolaczkowska, E., & Kubes, P. (2013). Neutrophil recruitment and function in health

206
and inflammation. Nature Reviews Immunology, 13(3), 159–175. https://doi.org/10.1038/nri3399
Kondo, M. (2010). Lymphoid and myeloid lineage commitment in multipotent hematopoietic progenitors. Immunological Reviews, 238(1), 37–46. https://doi.org/10.1111/j.1600-065X.2010.00963.x
Kotas, M. E., & Locksley, R. M. (2018). Why Innate Lymphoid Cells? Immunity. https://doi.org/10.1016/j.immuni.2018.06.002
Kramer, N., Walzl, A., Unger, C., Rosner, M., Krupitza, G., Hengstschläger, M., & Dolznig, H. (2013, January). In vitro cell migration and invasion assays. Mutation Research - Reviews in Mutation Research, Vol. 752, pp. 10–24. https://doi.org/10.1016/j.mrrev.2012.08.001
Kreslavsky, T., Gleimer, M., Garbe, A. I., & von Boehmer, H. (2010). αβ versus γδ fate choice: Counting the T-cell lineages at the branch point. Immunological Reviews, 238(1), 169–181. https://doi.org/10.1111/j.1600-065X.2010.00947.x
Kubes, P. (2018). The enigmatic neutrophil: what we do not know. Cell and Tissue Research, 371(3), 399–406. https://doi.org/10.1007/s00441-018-2790-5
Kumar, H., Kawai, T., & Akira, S. (2011). Pathogen recognition by the innate immune system. International Reviews of Immunology, 30(1), 16–34. https://doi.org/10.3109/08830185.2010.529976
Kumar, B. V., Connors, T. J., & Farber, D. L. (2018, February 20). Human T Cell Development, Localization, and Function throughout Life. Immunity, Vol. 48, pp. 202–213. https://doi.org/10.1016/j.immuni.2018.01.007
Kurtz, J. (2004). Memory in the innate and adaptive immune systems. Microbes and Infection, 6(15), 1410–1417. https://doi.org/10.1016/j.micinf.2004.10.002
Kurtz, J. (2005). Specific memory within innate immune systems. Trends in Immunology, 26(4), 186–192. https://doi.org/10.1016/j.it.2005.02.001
Laban, K. G., Rijken, R., Hiddingh, S., Mertens, J. S., van der Veen, R. L. P., Eenhorst, C. A. E., … Kuiper, J. J. W. (2020). cDC2 and plasmacytoid dendritic cells diminish from tissues of patients with non-Hodgkin orbital lymphoma and idiopathic orbital inflammation. European Journal of Immunology, 50(4), 548–557. https://doi.org/10.1002/eji.201948370
Lambert, L., & Culley, F. J. (2017). Innate immunity to respiratory infection in early life. Frontiers in Immunology, 8(NOV), 1–9. https://doi.org/10.3389/fimmu.2017.01570
Languedoc, D. U., N, R. D. E. C., Lili, Z., La, R. U. E. D. E., & Romaine, C. (2015). CREDIT AGRICOLE Votre Conseiller Vos contacts Zhang Lili RELEVE DE COMPTES N ° 006 Date Date. 125, 826–828. https://doi.org/10.1016/j.jaci.2009.12.980.Overview
Leliefeld, P. H. C., Pillay, J., Vrisekoop, N., Heeres, M., Tak, T., Kox, M., … Koenderman, L. (2018). Differential antibacterial control by neutrophil subsets. Blood Advances, 2(11), 1344–1354. https://doi.org/10.1182/bloodadvances.2017015578
Levy, O., & Netea, M. G. (2014). Innate immune memory: implications for development of pediatric immunomodulatory agents and adjuvanted vaccines. Pediatric Research. https://doi.org/10.1038/pr.2013.214
Levy, O., & Wynn, J. L. (2014). A prime time for trained immunity: Innate immune memory in newborns and infants. Neonatology, 105(2), 136–141. https://doi.org/10.1159/000356035
Li, Shanshan, Xie, Q., Zeng, Y., Zou, C., Liu, X., Wu, S., … Dai, Z. (2014). A naturally occurring CD8 + CD122 + T-cell subset as a memory-like Treg family. Cellular and Molecular Immunology, 11(4), 326–331. https://doi.org/10.1038/cmi.2014.25
Li, Sirui, Yang, D., Peng, T., Wu, Y., Tian, Z., & Ni, B. (2017). Innate lymphoid cell-derived cytokines in autoimmune diseases. Journal of Autoimmunity, 83, 62–72. https://doi.org/10.1016/j.jaut.2017.05.001

207
Liew, P. X., & Kubes, P. (2019). The Neutrophil’s role during health and disease. Physiological Reviews, 99(2), 1223–1248. https://doi.org/10.1152/physrev.00012.2018
Lim, A. I., & Di Santo, J. P. (2019). ILC-poiesis: Ensuring tissue ILC differentiation at the right place and time. European Journal of Immunology, Vol. 49. https://doi.org/10.1002/eji.201747294
Lim, A. I., Li, Y., Lopez-Lastra, S., Stadhouders, R., Paul, F., Casrouge, A., … Di Santo, J. P. (2017). Systemic Human ILC Precursors Provide a Substrate for Tissue ILC Differentiation. Cell, 168(6), 1086-1100.e10. https://doi.org/10.1016/j.cell.2017.02.021
Lim, A. I., Verrier, T., Vosshenrich, C. A., & Di Santo, J. P. (2017a). Developmental options and functional plasticity of innate lymphoid cells. Current Opinion in Immunology. https://doi.org/10.1016/j.coi.2017.03.010
Lim, A. I., Verrier, T., Vosshenrich, C. A., & Di Santo, J. P. (2017b). Developmental options and functional plasticity of innate lymphoid cells. Current Opinion in Immunology, 44, 61–68. https://doi.org/10.1016/j.coi.2017.03.010
Lin, J. X., & Leonard, W. J. (2018). The common cytokine receptor γ chain family of cytokines. Cold Spring Harbor Perspectives in Biology. https://doi.org/10.1101/cshperspect.a028449
Liu, D., Rhebergen, A. M., & Eisenbarth, S. C. (2013). Licensing adaptive immunity by NOD-like receptors. Frontiers in Immunology, 4(DEC), 1–17. https://doi.org/10.3389/fimmu.2013.00486
Liu, Y., Song, Y., Lin, D., Lei, L., Mei, Y., Jin, Z., … Liu, H. (2019). NCR − group 3 innate lymphoid cells orchestrate IL-23/IL-17 axis to promote hepatocellular carcinoma development. EBioMedicine, 41, 333–344. https://doi.org/10.1016/j.ebiom.2019.02.050
Liu, Z., Zhang, M., Wu, J., Zhou, P., Liu, Y., Wu, Y., … Lu, X. (2015). Serum CD121a (interleukin 1 receptor, type I): A potential novel inflammatory marker for coronary heart disease. PLoS ONE, 10(6), 1–11. https://doi.org/10.1371/journal.pone.0131086
Lloyd, C. M., & Snelgrove, R. J. (2018). Type 2 immunity: Expanding our view. Science Immunology, 3(25), 1–12. https://doi.org/10.1126/sciimmunol.aat1604
Lopez-Vergès, S., Milush, J. M., Schwartz, B. S., Pando, M. J., Jarjoura, J., York, V. A., … Lanier, L. L. (2011). Expansion of a unique CD57 +NKG2C hi natural killer cell subset during acute human cytomegalovirus infection. Proceedings of the National Academy of Sciences of the United States of America, 108(36), 14725–14732. https://doi.org/10.1073/pnas.1110900108
Lucchesi, S., Nolfi, E., Pettini, E., Pastore, G., Fiorino, F., Pozzi, G., … Ciabattini, A. (2020). Computational Analysis of Multiparametric Flow Cytometric Data to Dissect B Cell Subsets in Vaccine Studies. Cytometry Part A, 97(3). https://doi.org/10.1002/cyto.a.23922
Luo, J., Dong, B., Wang, K., Cai, S., Liu, T., Cheng, X., … Chen, Y. (2017). Baicalin inhibits biofilm formation, attenuates the quorum sensing-controlled virulence and enhances Pseudomonas aeruginosa clearance in a mouse peritoneal implant infection model. In PLoS ONE (Vol. 12). https://doi.org/10.1371/journal.pone.0176883
Lyons, A. B. (2000). Analysing cell division in vivo and in vitro using flow cytometric measurement of CFSE dye dilution. Journal of Immunological Methods, 243(1–2), 147–154. https://doi.org/10.1016/S0022-1759(00)00231-3
Maazi, H., Patel, N., Sankaranarayanan, I., Suzuki, Y., Rigas, D., Soroosh, P., … Akbari, O. (2015). ICOS: ICOS-Ligand Interaction Is Required for Type 2 Innate Lymphoid Cell Function, Homeostasis, and Induction of Airway Hyperreactivity. Immunity, 42(3), 538–551. https://doi.org/10.1016/j.immuni.2015.02.007
Maeda, A., Kurosaki, M., & Kurosaki, T. (1998). Paired immunoglobulin-like receptor (PIR)-A is involved in activating mast cells through its association with Fc
208
receptor γ chain. Journal of Experimental Medicine, 188(5), 991–995. https://doi.org/10.1084/jem.188.5.991
Mahendran, R. (2017). Bacillus Calmette-Guérin immunotherapy-increasing dose as a means of improving therapy? Translational Cancer Research, 6(2), S168–S173. https://doi.org/10.21037/tcr.2017.01.25
Mahla, R. S., Reddy, M. C., Vijaya Raghava Prasad, D., & Kumar, H. (2013). Sweeten PAMPs: Role of sugar complexed PAMPs in innate immunity and vaccine biology. Frontiers in Immunology. https://doi.org/10.3389/fimmu.2013.00248
Mak, T. W., Saunders, M. E., Mak, T. W., & Saunders, M. E. (2006). T Cell Activation. The Immune Response, 373–401. https://doi.org/10.1016/B978-012088451-3.50016-8
Mantile, F., Capasso, A., De Berardinis, P., & Prisco, A. (2019). Identification of a consolidation phase in immunological memory. Frontiers in Immunology, 10(MAR), 1–8. https://doi.org/10.3389/fimmu.2019.00508
Marshall, J. S., Warrington, R., Watson, W., & Kim, H. L. (2018). An introduction to immunology and immunopathology. Allergy, Asthma and Clinical Immunology, 14(s2), 1–10. https://doi.org/10.1186/s13223-018-0278-1
Martin, M. D., & Badovinac, V. P. (2018, November 20). Defining memory CD8 T cell. Frontiers in Immunology, Vol. 9. https://doi.org/10.3389/fimmu.2018.02692
Martinez-Gonzalez, I., Ghaedi, M., Steer, C. A., Mathä, L., Vivier, E., & Takei, F. (2018). ILC2 memory: Recollection of previous activation. Immunological Reviews. https://doi.org/10.1111/imr.12643
Martinez-Gonzalez, I., Mathä, L., Steer, C. A., Ghaedi, M., Poon, G. F. T., & Takei, F. (2016a). Allergen-Experienced Group 2 Innate Lymphoid Cells Acquire Memory-like Properties and Enhance Allergic Lung Inflammation. Immunity, 45(1), 198–208. https://doi.org/10.1016/j.immuni.2016.06.017
Martinez-Gonzalez, I., Mathä, L., Steer, C. A., Ghaedi, M., Poon, G. F. T., & Takei, F. (2016b). Allergen-Experienced Group 2 Innate Lymphoid Cells Acquire Memory-like Properties and Enhance Allergic Lung Inflammation. Immunity, 45(1), 198–208. https://doi.org/10.1016/j.immuni.2016.06.017
Martinez-Gonzalez, I., Mathä, L., Steer, C. A., & Takei, F. (2017). Immunological Memory of Group 2 Innate Lymphoid Cells. Trends in Immunology, 38(6), 423–431. https://doi.org/10.1016/j.it.2017.03.005
Massacand, J. C., Kaiser, P., Ernst, B., Tardivel, A., Bürki, K., Schneider, P., & Harris, N. L. (2008). Intestinal bacteria condition dendritic cells to promote IgA production. PLoS ONE, 3(7). https://doi.org/10.1371/journal.pone.0002588
Mazzurana, L., Rao, A., Van Acker, A., & Mjösberg, J. (2018, July 1). The roles for innate lymphoid cells in the human immune system. Seminars in Immunopathology, Vol. 40, pp. 407–419. https://doi.org/10.1007/s00281-018-0688-7
McHeyzer-Williams, M., Okitsu, S., Wang, N., & McHeyzer-Williams, L. (2012). Molecular programming of B cell memory. Nature Reviews Immunology. https://doi.org/10.1038/nri3128
McKenzie, A. N. J., Spits, H., & Eberl, G. (2014). Innate lymphoid cells in inflammation and immunity. Immunity. https://doi.org/10.1016/j.immuni.2014.09.006
Meffre, E., Catalan, N., Seltz, F., Fischer, A., Nussenzweig, M. C., & Durandy, A. (2001). Brief Definitive Report Somatic Hypermutation Shapes the Antibody Repertoire of Memory B Cells in Humans. J. Exp. Med, 083750400(3), 375–378. Retrieved from http://www.jem.org/cgi/content/full/194/3/375
Melchers, F. (2015). Checkpoints that control B cell development. Journal of Clinical Investigation, 125(6), 2203–2210. https://doi.org/10.1172/JCI78083
Meredith, M., Zemmour, D., Mathis, D., & Benoist, C. (2015). Aire controls gene expression in the thymic epithelium with ordered stochasticity. Nature Immunology, 16(9), 942–949. https://doi.org/10.1038/ni.3247
Min-oo, G., Kamimura, Y., Hendricks, D. W., & Nabekura, T. (2014). NIH Public

209
Access. 34(6), 251–258. https://doi.org/10.1016/j.it.2013.02.005.NK Mjösberg, J., & Spits, H. (2016). Human innate lymphoid cells. Journal of Allergy and
Clinical Immunology, 138(5), 1265–1276. https://doi.org/10.1016/j.jaci.2016.09.009
Mogensen, T. H. (2009). Pathogen recognition and inflammatory signaling in innate immune defenses. Clinical Microbiology Reviews, 22(2), 240–273. https://doi.org/10.1128/CMR.00046-08
Mohammadi, H., Sharafkandi, N., Hemmatzadeh, M., Azizi, G., Karimi, M., Jadidi-Niaragh, F., … Babaloo, Z. (2018). The role of innate lymphoid cells in health and disease. Journal of Cellular Physiology, 233(6), 4512–4529. https://doi.org/10.1002/jcp.26250
Montalban-Arques, A., Chaparro, M., Gisbert, J. P., & Bernardo, D. (2018). The Innate Immune System in the Gastrointestinal Tract: Role of Intraepithelial Lymphocytes and Lamina Propria Innate Lymphoid Cells in Intestinal Inflammation. Inflammatory Bowel Diseases, 24(9), 1649–1659. https://doi.org/10.1093/ibd/izy177
Moon, H., Park, C., Lee, J.-G., Shin, S. H., Lee, J. H., Kho, I., … Kim, T. J. (2015). Early Development in the Peritoneal Cavity of CD49d high Th1 Memory Phenotype CD4 + T Cells with Enhanced B Cell Helper Activity . The Journal of Immunology, 195(2), 564–575. https://doi.org/10.4049/jimmunol.1401661
Moradali, M. F., Ghods, S., & Rehm, B. H. A. (2017). Pseudomonas aeruginosa lifestyle: A paradigm for adaptation, survival, and persistence. Frontiers in Cellular and Infection Microbiology. https://doi.org/10.3389/fcimb.2017.00039
Morita, H., Moro, K., & Koyasu, S. (2016). Innate lymphoid cells in allergic and nonallergic inflammation. Journal of Allergy and Clinical Immunology, 138(5), 1253–1264. https://doi.org/10.1016/j.jaci.2016.09.011
Moritz Rapp1, 2, & , Gabriela M. Wiedemann2,*, and Joseph C. Sun2,3, +. (2017). Memory responses of innate lymphocytes and parallels with T cell. J Autism Dev Disord, 47(3), 549–562. https://doi.org/10.1097/CCM.0b013e31823da96d.Hydrogen
Mortaz, E., Alipoor, S. D., Adcock, I. M., Mumby, S., & Koenderman, L. (2018). Update on neutrophil function in severe inflammation. Frontiers in Immunology. https://doi.org/10.3389/fimmu.2018.02171
Mortha, A., & Burrows, K. (2018). Cytokine networks between innate lymphoid cells and myeloid cells. Frontiers in Immunology. https://doi.org/10.3389/fimmu.2018.00191
Moskalenko, M., Pan, M., Fu, Y., De Moll, E. H., Hashimoto, D., Mortha, A., … Saenger, Y. (2015). Requirement for innate immunity and CD90 NK1.1 lymphocytes to treat established melanoma with chemo-immunotherapy. Cancer Immunology Research, 3(3), 296–304. https://doi.org/10.1158/2326-6066.CIR-14-0120
Mourits, V. P., Wijkmans, J. C., Joosten, L. A., & Netea, M. G. (2018). Trained immunity as a novel therapeutic strategy. Current Opinion in Pharmacology, 41(Il), 52–58. https://doi.org/10.1016/j.coph.2018.04.007
Muir, R., Osbourn, M., Dubois, A. V., Doran, E., Small, D. M., Monahan, A., … Ingram, R. J. (2016). Innate lymphoid cells are the predominant source of IL-17A during the early pathogenesis of acute respiratory distress syndrome. American Journal of Respiratory and Critical Care Medicine, 193(4), 407–416. https://doi.org/10.1164/rccm.201410-1782OC
Musette, P., & Bouaziz, J. D. (2018). B cell modulation strategies in autoimmune diseases: New concepts. Frontiers in Immunology, 9(APR), 1–5. https://doi.org/10.3389/fimmu.2018.00622
Nagakumar, P., Puttur, F., Gregory, L. G., Denney, L., Fleming, L., Bush, A., … Saglani, S. (2019). Pulmonary type-2 innate lymphoid cells in paediatric severe asthma: phenotype and response to steroids. The European Respiratory

210
Journal, 54(2). https://doi.org/10.1183/13993003.01809-2018 Nagasawa, M., Spits, H., & Ros, X. R. (2018). Innate lymphoid cells (ILCs): Cytokine
hubs regulating immunity and tissue homeostasis. Cold Spring Harbor Perspectives in Biology, 10(12), 1–16. https://doi.org/10.1101/cshperspect.a030304
Nau, D., Altmayer, N., & Mattner, J. (2014). Mechanisms of innate lymphoid cell and natural killer t cell activation during mucosal inflammation. Journal of Immunology Research, 2014(Figure 1). https://doi.org/10.1155/2014/546596
nd Kelsey C. MartinMhatre V. Ho, Ji-Ann Lee, A. (2012). viSNE enables visualization of high dimensional single-cell data and reveals phenotypic heterogeneity of leukemia. Bone, 23(1), 1–7. https://doi.org/10.1038/jid.2014.371
Negi, S., Das, D. K., Pahari, S., Nadeem, S., & Agrewala, J. N. (2019). Potential role of gut microbiota in induction and regulation of innate immune memory. Frontiers in Immunology, 10(OCT). https://doi.org/10.3389/fimmu.2019.02441
Netea, M. G., & Joosten, L. A. B. (2018). Trained Immunity and Local Innate Immune Memory in the Lung. Cell, 175(6), 1463–1465. https://doi.org/10.1016/j.cell.2018.11.007
Netea, M. G., Joosten, L. A. B., Latz, E., Mills, K. H. G., Natoli, G., Stunnenberg, H. G., … Xavier, R. J. (2016, April 22). Trained immunity: A program of innate immune memory in health and disease. Science, Vol. 352, p. 427. https://doi.org/10.1126/science.aaf1098
Netea, M. G., Schlitzer, A., Placek, K., Joosten, L. A. B., & Schultze, J. L. (2019). Innate and Adaptive Immune Memory: an Evolutionary Continuum in the Host’s Response to Pathogens. Cell Host and Microbe, Vol. 25. https://doi.org/10.1016/j.chom.2018.12.006
Netea, M. G., & Van Crevel, R. (2014). BCG-induced protection: Effects on innate immune memory. Seminars in Immunology, 26(6), 512–517. https://doi.org/10.1016/j.smim.2014.09.006
Newton, K., & Dixit, V. M. (2012). Signaling in innate immunity and inflammation. Cold Spring Harbor Perspectives in Biology. https://doi.org/10.1101/cshperspect.a006049
Nicola, A. M., & Casadevall, A. (2012). In vitro measurement of phagocytosis and killing of Cryptococcus neoformans by macrophages. Methods in Molecular Biology. https://doi.org/10.1007/978-1-61779-527-5_14
Nishijima David L; Wisner, David H; Holmes, James F, D. K. S. (2016). Antigen-specific NK cell memory in rhesus macaques. Physiology & Behavior, 176(9), 139–148. https://doi.org/10.1016/j.physbeh.2017.03.040
Nomura, L., Maino, V. C., & Maecker, H. T. (2008). Standardization and optimization of multiparameter intracellular cytokine staining. Cytometry Part A. https://doi.org/10.1002/cyto.a.20602
Nuñez, J. K., Bai, L., Harrington, L. B., Hinder, T. L., & Doudna, J. A. (2016). CRISPR Immunological Memory Requires a Host Factor for Specificity. Molecular Cell, 62(6), 824–833. https://doi.org/10.1016/j.molcel.2016.04.027
Nussbaum, K., Burkhard, S. H., Ohs, I., Mair, F., Klose, C. S. N., Arnold, S. J., … Becher, B. (2017). Tissue microenvironment dictates the fate and tumorsuppressive function of type 3 ILCs. Journal of Experimental Medicine, 214(8), 2331–2347. https://doi.org/10.1084/jem.20162031
O’Donnell, E. A., Ernst, D. N., & Hingorani, R. (2013). Multiparameter Flow Cytometry: Advances in High Resolution Analysis. Immune Network, 13(2), 43. https://doi.org/10.4110/in.2013.13.2.43
O’Sullivan, T. E. (2019). Dazed and Confused: NK Cells. Frontiers in Immunology, 10(September), 1–5. https://doi.org/10.3389/fimmu.2019.02235
O’Sullivan, T. E., & Sun, J. C. (2017). Innate Lymphoid Cell Immunometabolism. Journal of Molecular Biology. https://doi.org/10.1016/j.jmb.2017.08.014
O’Sullivan, T. E., Sun, J. C., & Lanier, L. L. (2015). Natural Killer Cell Memory.

211
Immunity. https://doi.org/10.1016/j.immuni.2015.09.013 Okun, E., Griffioen, K. J., Lathia, J. D., Tang, S. C., Mattson, M. P., & Arumugam, T.
V. (2009, March). Toll-like receptors in neurodegeneration. Brain Research Reviews, Vol. 59, pp. 278–292. https://doi.org/10.1016/j.brainresrev.2008.09.001
Onishi, R. M., & Gaffen, S. L. (2010). Interleukin-17 and its target genes: Mechanisms of interleukin-17 function in disease. Immunology, 129(3), 311–321. https://doi.org/10.1111/j.1365-2567.2009.03240.x
Page, M. J., Bester, J., & Pretorius, E. (2018). The inflammatory effects of TNF-α and complement component 3 on coagulation. Scientific Reports, 8(1). https://doi.org/10.1038/s41598-018-20220-8
Panda, S. K., & Colonna, M. (2019). Innate lymphoid cells: A potential link between microbiota and immune responses against cancer. Seminars in Immunology, 41(January), 101271. https://doi.org/10.1016/j.smim.2019.03.003
Pang, Z., Raudonis, R., Glick, B. R., Lin, T. J., & Cheng, Z. (2019). Antibiotic resistance in Pseudomonas aeruginosa: mechanisms and alternative therapeutic strategies. Biotechnology Advances, 37(1), 177–192. https://doi.org/10.1016/j.biotechadv.2018.11.013
Pappu, R., Ramirez-Carrozzi, V., & Sambandam, A. (2011). The interleukin-17 cytokine family: Critical players in host defence and inflammatory diseases. Immunology, 134(1), 8–16. https://doi.org/10.1111/j.1365-2567.2011.03465.x
Peng, H., Jiang, X., Chen, Y., Sojka, D. K., Wei, H., Gao, X., … Tian, Z. (2013). Liver-resident NK cells confer adaptive immunity in skin-contact inflammation. Journal of Clinical Investigation, 123(4), 1444–1456. https://doi.org/10.1172/JCI66381
Peng, H., & Tian, Z. (2017). Natural killer cell memory: Progress and implications. Frontiers in Immunology, 8(SEP), 1–10. https://doi.org/10.3389/fimmu.2017.01143
Perié, L., Duffy, K. R., Kok, L., De Boer, R. J., & Schumacher, T. N. (2015). The Branching Point in Erythro-Myeloid Differentiation. Cell, 163(7). https://doi.org/10.1016/j.cell.2015.11.059
Peterson, E., & Kaur, P. (2018). Antibiotic resistance mechanisms in bacteria: Relationships between resistance determinants of antibiotic producers, environmental bacteria, and clinical pathogens. Frontiers in Microbiology, 9(NOV), 1–21. https://doi.org/10.3389/fmicb.2018.02928
Pieper, K., Grimbacher, B., & Eibel, H. (2013, April). B-cell biology and development. Journal of Allergy and Clinical Immunology, Vol. 131, pp. 959–971. https://doi.org/10.1016/j.jaci.2013.01.046
Pilli, D., Zou, A., Tea, F., Dale, R. C., & Brilot, F. (2017). Expanding role of T cells in human autoimmune diseases of the central nervous system. Frontiers in Immunology, 8(JUN), 1–17. https://doi.org/10.3389/fimmu.2017.00652
Pletzer, D., Mansour, S. C., Wuerth, K., Rahanjam, N., & Hancock, R. E. W. (2017). New mouse model for chronic infections by gram-negative bacteria enabling the study of anti-infective efficacy and host-microbe interactions. MBio, 8(1). https://doi.org/10.1128/mBio.00140-17
Puga, I., & Cerutti, A. (2012). Emerging roles of granulocytes in B cell responses. 2(1), 25–34.
Qiu, J., Guo, X., Chen, Z. ming E., He, L., Sonnenberg, G. F., Artis, D., … Zhou, L. (2013). Group 3 innate lymphoid cells inhibit T-cell-mediated intestinal inflammation through aryl hydrocarbon receptor signaling and regulation of microflora. Immunity. https://doi.org/10.1016/j.immuni.2013.08.002
Quie, P. G., White, J. G., Holmes, B., & Good, R. A. (1967). In vitro bactericidal capacity of human polymorphonuclear leukocytes: diminished activity in chronic granulomatous disease of childhood. The Journal of Clinical Investigation, 46(4), 668–679. https://doi.org/10.1172/JCI105568
Quintin, J., Cheng, S. C., van der Meer, J. W. M., & Netea, M. G. (2014). Innate

212
immune memory: Towards a better understanding of host defense mechanisms. Current Opinion in Immunology, 29(1), 1–7. https://doi.org/10.1016/j.coi.2014.02.006
Quintin, J., Saeed, S., Martens, J. H. A., Giamarellos-Bourboulis, E. J., Ifrim, D. C., Logie, C., … Netea, M. G. (2012). Candida albicans infection affords protection against reinfection via functional reprogramming of monocytes. Cell Host and Microbe. https://doi.org/10.1016/j.chom.2012.06.006
Quintin, J., Saeed, S., Martens, J. H. a, Giamarellos-, E. J., Ifrim, D. C., Logie, C., … Der, J. W. M. Van. (2013). Candida albicans infection affords protection against reinfection via reprograming of monocytes. 12(2). https://doi.org/10.1016/j.chom.2012.06.006.Candida
Rabb, H. (2002). The T cell as a bridge between innate and adaptive immune systems: Implications for the kidney. Kidney International, 61(6), 1935–1946. https://doi.org/10.1046/j.1523-1755.2002.00378.x
Rada, B. (2017). Neutrophil extracellular trap release driven by bacterial motility: Relevance to cystic fibrosis lung disease. Communicative and Integrative Biology. https://doi.org/10.1080/19420889.2017.1296610
Rankin, L. C., Girard-madoux, M. J. H., Seillet, C., & Mielke, L. A. (2016). Complementarity and redundancy of IL-22-producing innate lymphoid cells. 17(2), 179–186. https://doi.org/10.1038/ni.3332.Complementarity
Rankin, L. C., Girard-Madoux, M. J. H., Seillet, C., Mielke, L. A., Kerdiles, Y., Fenis, A., … Vivier, E. (2016). Complementarity and redundancy of IL-22-producing innate lymphoid cells. Nature Immunology, 17(2). https://doi.org/10.1038/ni.3332
Ray, A. (2016). Cytokines and their Role in Health and Disease: A Brief Overview. MOJ Immunology, 4(2), 1–9. https://doi.org/10.15406/moji.2016.04.00121
Riedel, J. H., Becker, M., Kopp, K., Düster, M., Brix, S. R., Meyer-Schwesinger, C., … Turner, J. E. (2017). IL-33-Mediated expansion of type 2 innate lymphoid cells protects from progressive glomerulosclerosis. Journal of the American Society of Nephrology, 28(7), 2068–2080. https://doi.org/10.1681/ASN.2016080877
Riera Romo, M., Pérez-Martínez, D., & Castillo Ferrer, C. (2016). Innate immunity in vertebrates: An overview. Immunology, 148(2), 125–139. https://doi.org/10.1111/imm.12597
Roan, F., Stoklasek, T. A., Whalen, E., Molitor, J. A., Bluestone, J. A., Buckner, J. H., & Ziegler, S. F. (2016). CD4 + Group 1 Innate Lymphoid Cells (ILC) Form a Functionally Distinct ILC Subset That Is Increased in Systemic Sclerosis . The Journal of Immunology. https://doi.org/10.4049/jimmunol.1501491
Robb, L. (2007). Cytokine receptors and hematopoietic differentiation. Oncogene, 26(47), 6715–6723. https://doi.org/10.1038/sj.onc.1210756
Robinson, M. D., Nowicka, M., Krieg, C., Weber, L. M., Hartmann, F. J., Guglietta, S., … Levesque, M. P. (2017). CyTOF workflow: Differential discovery in high-throughput high-dimensional cytometry datasets. F1000Research, 6. https://doi.org/10.12688/f1000research.11622.2
Rubino, S. J., Geddes, K., & Girardin, S. E. (2012). Innate IL-17 and IL-22 responses to enteric bacterial pathogens. Trends in Immunology. https://doi.org/10.1016/j.it.2012.01.003
Sadd, B. M., & Schmid-Hempel, P. (2006). Insect Immunity Shows Specificity in Protection upon Secondary Pathogen Exposure. Current Biology, 16(12), 1206–1210. https://doi.org/10.1016/j.cub.2006.04.047
Saeys, Y., Van Gassen, S., & Lambrecht, B. N. (2016). Computational flow cytometry: Helping to make sense of high-dimensional immunology data. Nature Reviews Immunology, 16(7), 449–462. https://doi.org/10.1038/nri.2016.56
Sagi, Y., Landrigan, A., Levy, R., & Levy, S. (2012). Complementary costimulation of human T-cell subpopulations by cluster of differentiation 28 (CD28) and CD81. Proceedings of the National Academy of Sciences of the United States of America, 109(5), 1613–1618. https://doi.org/10.1073/pnas.1121307109

213
Sawa, S., Lochner, M., Satoh-Takayama, N., Dulauroy, S., Bérard, M., Kleinschek, M., … Eberl, G. (2011). RORγt+ innate lymphoid cells regulate intestinal homeostasis by integrating negative signals from the symbiotic microbiota. Nature Immunology, 12(4), 320–328. https://doi.org/10.1038/ni.2002
Schlums, H., Cichocki, F., Tesi, B., Theorell, J., Beziat, V., Holmes, T. D., … Bryceson, Y. T. (2016). Cytomegalovirus Infection Drives Adaptive Epigenetic.pdf. Immunometabolism, 42(3), 443–456. https://doi.org/10.1016/j.immuni.2015.02.008.Cytomegalovirus
Schluns, K. S., & Lefrançois, L. (2003). Cytokine control of memory T-cell development and survival. Nature Reviews Immunology, Vol. 3, pp. 269–279. https://doi.org/10.1038/nri1052
Schulz-Kuhnt, A., Wirtz, S., Neurath, M. F., & Atreya, I. (2020). Regulation of Human Innate Lymphoid Cells in the Context of Mucosal Inflammation. Frontiers in Immunology, 11(June). https://doi.org/10.3389/fimmu.2020.01062
Schumann, J., Stanko, K., Schliesser, U., Appelt, C., & Sawitzki, B. (2015). Differences in CD44 surface expression levels and function discriminates IL-17 and IFN-γ producing helper T cells. PLoS ONE, 10(7), 1–18. https://doi.org/10.1371/journal.pone.0132479
Schweighoffer, E., & Tybulewicz, V. L. (2018). Signalling for B cell survival. Current Opinion in Cell Biology, 51, 8–14. https://doi.org/10.1016/j.ceb.2017.10.002
Sciumè, G., Shih, H. Y., Mikami, Y., & O’Shea, J. J. (2017). Epigenomic views of innate lymphoid cells. Frontiers in Immunology. https://doi.org/10.3389/fimmu.2017.01579
Sedda, S., Marafini, I., Figliuzzi, M. M., Pallone, F., & Monteleone, G. (2014). An overview of the role of innate lymphoid cells in gut infections and inflammation. Mediators of Inflammation, 2014. https://doi.org/10.1155/2014/235460
Seillet, C., & Belz, G. T. (2016). Differentiation and diversity of subsets in group 1 innate lymphoid cells. International Immunology, 28(1), 3–11. https://doi.org/10.1093/intimm/dxv051
Seillet, C., Belz, G. T., & Mielke, L. A. (2014a). Complexity of cytokine network regulation of innate lymphoid cells in protective immunity. Cytokine. https://doi.org/10.1016/j.cyto.2014.06.002
Seillet, C., Belz, G. T., & Mielke, L. A. (2014b). Complexity of cytokine network regulation of innate lymphoid cells in protective immunity. Cytokine, 70(1), 1–10. https://doi.org/10.1016/j.cyto.2014.06.002
Sellers, R. S. (2017). Translating Mouse Models: Immune Variation and Efficacy Testing. Toxicologic Pathology, 45(1), 134–145. https://doi.org/10.1177/0192623316675767
Seo, G., Shui, J., Takahashi, D., Song, C., Kim, K., Mikulski, Z., … Colonna, M. (2019). LIGHT-HVEM Signaling in Innate Lymphoid Cell Subsets Protects Against Enteric Bacterial Infection. 24(2), 249–260. https://doi.org/10.1016/j.chom.2018.07.008.LIGHT-HVEM
Shao, T., Shi, W., Zheng, J. Y., Xu, X. X., Lin, A. F., Xiang, L. X., & Shao, J. Z. (2018). Costimulatory function of Cd58/Cd2 interaction in adaptive humoral immunity in a zebrafish model. Frontiers in Immunology, 9(MAY). https://doi.org/10.3389/fimmu.2018.01204
Sharma, A., & Rudra, D. (2018). Emerging functions of regulatory T cells in tissue homeostasis. Frontiers in Immunology, 9(APR), 1–26. https://doi.org/10.3389/fimmu.2018.00883
Shen, Y., Li, J., Wang, S. Q., & Jiang, W. (2018). Ambiguous roles of innate lymphoid cells In chronic development of liver diseases. World Journal of Gastroenterology, 24(18), 1962–1977. https://doi.org/10.3748/wjg.v24.i18.1962
Shevyrev, D., & Tereshchenko, V. (2020). Treg Heterogeneity, Function, and Homeostasis. Frontiers in Immunology, 10(January), 1–13. https://doi.org/10.3389/fimmu.2019.03100

214
Simoni, Y., & Newell, E. W. (2018a). Dissecting human ILC heterogeneity: more than just three subsets. Immunology, 153(3), 297–303. https://doi.org/10.1111/imm.12862
Simoni, Y., & Newell, E. W. (2018b). Dissecting human ILC heterogeneity: more than just three subsets. Immunology, Vol. 153. https://doi.org/10.1111/imm.12862
Smith, S. G., Smits, K., Joosten, S. A., Van Meijgaarden, K. E., Satti, I., Fletcher, H. A., … Sallusto, F. (2015). Intracellular cytokine staining and flow cytometry: Considerations for application in clinical trials of novel tuberculosis vaccines. PLoS ONE. https://doi.org/10.1371/journal.pone.0138042
Song, C., Lee, J. S., Gilfillan, S., Robinette, M. L., Newberry, R. D., Stappenbeck, T. S., … Colonna, M. (2015). Unique and redundant functions of NKp46+ ILC3s in models of intestinal inflammation. Journal of Experimental Medicine, 212(11). https://doi.org/10.1084/jem.20151403
Sonnenberg, G. F., & Artis, D. (2015a). Innate lymphoid cells in the initiation, regulation and resolution of inflammation. Nature Medicine. https://doi.org/10.1038/nm.3892
Sonnenberg, G. F., & Artis, D. (2015b). Innate lymphoid cells in the initiation, regulation and resolution of inflammation. Nature Medicine, 21(7), 698–708. https://doi.org/10.1038/nm.3892
Sonnenberg, G. F., Nair, M. G., Kirn, T. J., Zaph, C., Fouser, L. A., & Artis, D. (2010). Pathological versus protective functions of IL-22 in airway inflammation are regulated by IL-17A. Journal of Experimental Medicine, 207(6), 1293–1305. https://doi.org/10.1084/jem.20092054
Soriani, A., Stabile, H., Gismondi, A., Santoni, A., & Bernardini, G. (2018). Chemokine regulation of innate lymphoid cell tissue distribution and function. Cytokine and Growth Factor Reviews. https://doi.org/10.1016/j.cytogfr.2018.02.003
Sparber, F., De Gregorio, C., Steckholzer, S., Ferreira, F. M., Dolowschiak, T., Ruchti, F., … LeibundGut-Landmann, S. (2019). The Skin Commensal Yeast Malassezia Triggers a Type 17 Response that Coordinates Anti-fungal Immunity and Exacerbates Skin Inflammation. Cell Host and Microbe, 25(3), 389-403.e6. https://doi.org/10.1016/j.chom.2019.02.002
St. John, A. L., & Abraham, S. N. (2013). Innate Immunity and Its Regulation by Mast Cells. The Journal of Immunology, 190(9), 4458–4463. https://doi.org/10.4049/jimmunol.1203420
Stebegg, M., Kumar, S. D., Silva-Cayetano, A., Fonseca, V. R., Linterman, M. A., & Graca, L. (2018). Regulation of the germinal center response. Frontiers in Immunology, 9(OCT), 1–13. https://doi.org/10.3389/fimmu.2018.02469
Stefani, S., Campana, S., Cariani, L., Carnovale, V., Colombo, C., Lleo, M. M., … Taccetti, G. (2017). Relevance of multidrug-resistant Pseudomonas aeruginosa infections in cystic fibrosis. International Journal of Medical Microbiology, 307(6), 353–362. https://doi.org/10.1016/j.ijmm.2017.07.004
Steven D. Scoville, Bethany L. Mundy-Bosse, Michael H. Zhang, ..., William E. Carson III, Michael A. Caligiuri, A. G. F. (2016). A Progenitor Cell Expressing Transcription Factor RORγt Generates All Human Innate Lymphoid Cell Subsets. Immunity, 44(5), 1140–1150. https://doi.org/10.1016/j.immuni.2016.04.007
Subramanian, P., Mitroulis, I., Hajishengallis, G., & Chavakis, T. (2016). Regulation of tissue infiltration by neutrophils: Role of integrin a3b1 and other factors. Current Opinion in Hematology, 23(1), 36–43. https://doi.org/10.1097/MOH.0000000000000198
Sun, J. C., Lopez-Verges, S., Kim, C. C., DeRisi, J. L., & Lanier, L. L. (2011). NK Cells and Immune “Memory.” The Journal of Immunology. https://doi.org/10.4049/jimmunol.1003035
Tai, Y., Wang, Q., Korner, H., Zhang, L., & Wei, W. (2018). Molecular mechanisms of T cells activation by dendritic cells in autoimmune diseases. Frontiers in

215
Pharmacology, 9(JUN), 1–10. https://doi.org/10.3389/fphar.2018.00642 Tait Wojno, E. D., & Artis, D. (2016). Emerging concepts and future challenges in
innate lymphoid cell biology. The Journal of Experimental Medicine. https://doi.org/10.1084/jem.20160525
Takeuchi, A., & Saito, T. (2017). CD4 CTL, a cytotoxic subset of CD4+ T cells, their differentiation and function. Frontiers in Immunology, 8(FEB), 1–7. https://doi.org/10.3389/fimmu.2017.00194
Takeuchi, O., & Akira, S. (2010). Pattern Recognition Receptors and Inflammation. Cell, 140(6), 805–820. https://doi.org/10.1016/j.cell.2010.01.022
Thompson, J. M., Miller, R. J., Ashbaugh, A. G., Dillen, C. A., Pickett, J. E., Wang, Y., … Miller, L. S. (2018). Mouse model of Gram-negative prosthetic joint infection reveals therapeutic targets. JCI Insight, 3(17), 1–14. https://doi.org/10.1172/jci.insight.121737
Tom J. Little, B. O., Nick Colegrave, K. W., & Read, and A. F. (2003). Maternal Transfer of Strain-Specific Immunity in an Invertebrate. Current Biology, 13(Figure 1), 654–658. https://doi.org/10.1016/S
Trabanelli, S., Chevalier, M. F., Derré, L., & Jandus, C. (2019). The pro- and anti-tumor role of ILC2s. Seminars in Immunology, 41(March), 101276. https://doi.org/10.1016/j.smim.2019.04.004
Tugues, S., Ducimetiere, L., Friebel, E., & Becher, B. (2019). Innate lymphoid cells as regulators of the tumor microenvironment. Seminars in Immunology, 41(February), 101270. https://doi.org/10.1016/j.smim.2019.03.002
Tumino, N., Vacca, P., Quatrini, L., Munari, E., Moretta, F., Pelosi, A., … Moretta, L. (2020). Helper Innate Lymphoid Cells in Human Tumors: A Double-Edged Sword? Frontiers in Immunology, 10(January), 1–6. https://doi.org/10.3389/fimmu.2019.03140
Turner, M. D., Nedjai, B., Hurst, T., & Pennington, D. J. (2014). Cytokines and chemokines: At the crossroads of cell signalling and inflammatory disease. Biochimica et Biophysica Acta - Molecular Cell Research, Vol. 1843. https://doi.org/10.1016/j.bbamcr.2014.05.014
Turvey, S. E., & Broide, D. H. (2010). Innate immunity. Journal of Allergy and Clinical Immunology, 125(2), S24–S32. https://doi.org/10.1016/J.JACI.2009.07.016
Van Acker, A., Gronke, K., Biswas, A., Martens, L., Saeys, Y., Filtjens, J., … Leclercq, G. (2017). A Murine Intestinal Intraepithelial NKp46-Negative Innate Lymphoid Cell Population Characterized by Group 1 Properties. Cell Reports. https://doi.org/10.1016/j.celrep.2017.04.068
van de Pavert, S. A., & Vivier, E. (2016). Differentiation and function of group 3 innate lymphoid cells, from embryo to adult. International Immunology, 28(1), 35–42. https://doi.org/10.1093/intimm/dxv052
van der Meer, J. W. M., Joosten, L. A. B., Riksen, N., & Netea, M. G. (2015). Trained immunity: A smart way to enhance innate immune defence. Molecular Immunology, 68(1), 40–44. https://doi.org/10.1016/j.molimm.2015.06.019
Van Gassen, S., Callebaut, B., Van Helden, M. J., Lambrecht, B. N., Demeester, P., Dhaene, T., & Saeys, Y. (2015). FlowSOM: Using self-organizing maps for visualization and interpretation of cytometry data. Cytometry Part A, 87(7), 636–645. https://doi.org/10.1002/cyto.a.22625
Van Maele, L., Carnoy, C., Cayet, D., Ivanov, S., Porte, R., Deruy, E., … Sirard, J. C. (2014). Activation of type 3 innate lymphoid cells and interleukin 22 secretion in the lungs during streptococcus pneumoniae infection. Journal of Infectious Diseases. https://doi.org/10.1093/infdis/jiu106
Vaz, N. M., & Pordeus, V. (2005). Visita à imunologia. Arquivos Brasileiros de Cardiologia, 85(5). https://doi.org/10.1590/s0066-782x2005001800012
Velloso, F. J., Trombetta-Lima, M., Anschau, V., Sogayar, M. C., & Correa, R. G. (2019). NOD-like receptors: Major players (and targets) in the interface between innate immunity and cancer. Bioscience Reports, 29(4), 1–21.

216
https://doi.org/10.1042/BSR20181709 Verhagen, F. H., Hiddingh, S., Rijken, R., Pandit, A., Leijten, E., Olde Nordkamp, M.,
… Kuiper, J. J. W. (2018). High-Dimensional Profiling Reveals Heterogeneity of the Th17 Subset and Its Association With Systemic Immunomodulatory Treatment in Non-infectious Uveitis. Frontiers in Immunology, 9(October), 2519. https://doi.org/10.3389/fimmu.2018.02519
Verrier, T., Satoh-Takayama, N., Serafini, N., Marie, S., Di Santo, J. P., & Vosshenrich, C. A. J. (2016). Phenotypic and Functional Plasticity of Murine Intestinal NKp46 + Group 3 Innate Lymphoid Cells. The Journal of Immunology, 196(11), 4731–4738. https://doi.org/10.4049/jimmunol.1502673
Via, C. S., Shustov, A., Rus, V., Lang, T., Nguyen, P., & Finkelman, F. D. (2001). In vivo neutralization of TNF-alpha promotes humoral autoimmunity by preventing the induction of CTL. J Immunol, 167(12), 6821–6826. https://doi.org/10.4049/jimmunol.167.12.6821
Vivier, E., Artis, D., Colonna, M., Diefenbach, A., Di Santo, J. P., Eberl, G., … Spits, H. (2018a). Innate Lymphoid Cells: 10 Years On. Cell, 174(5), 1054–1066. https://doi.org/10.1016/j.cell.2018.07.017
Vivier, E., Artis, D., Colonna, M., Diefenbach, A., Di Santo, J. P., Eberl, G., … Spits, H. (2018b). Innate Lymphoid Cells: 10 Years On. Cell, Vol. 174. https://doi.org/10.1016/j.cell.2018.07.017
Vono, M., Lin, A., Norrby-Teglund, A., Koup, R. A., Liang, F., & Loré, K. (2017). Neutrophils acquire the capacity for antigen presentation to memory CD4+ T cells in vitro and ex vivo. Blood. https://doi.org/10.1182/blood-2016-10-744441
Wang, C., El-Shetehy, M., Shine, M. B., Yu, K., Navarre, D., Wendehenne, D., … Kachroo, P. (2014). Free Radicals Mediate Systemic Acquired Resistance. Cell Reports, 7(2), 348–355. https://doi.org/10.1016/j.celrep.2014.03.032
Wang, X., Peng, H., Cong, J., Wang, X., Lian, Z., Wei, H., … Tian, Z. (2018). Memory formation and long-term maintenance of IL-7Rα+ ILC1s via a lymph node-liver axis. Nature Communications, 9(1), 1–12. https://doi.org/10.1038/s41467-018-07405-5
Wang, X., Peng, H., & Tian, Z. (2019). Innate lymphoid cell memory. Cellular and Molecular Immunology, 16(5), 423–429. https://doi.org/10.1038/s41423-019-0212-6
Wang, X., Tian, Z., & Peng, H. (2019). Tissue-resident memory-like ILCs: innate counterparts of TRM cells. Protein and Cell, 11(2), 85–96. https://doi.org/10.1007/s13238-019-0647-7
Warner, K., & Ohashi, P. S. (2019). ILC regulation of T cell responses in inflammatory diseases and cancer. Seminars in Immunology, 41(July), 101284. https://doi.org/10.1016/j.smim.2019.101284
Warrington, R., Watson, W., Kim, H. L., & Antonetti, F. (2011). An introduction to immunology and immunopathology. Allergy, Asthma & Clinical Immunology, 7(Suppl 1), S1. https://doi.org/10.1186/1710-1492-7-S1-S1
Weber, L. M., & Robinson, M. D. (2016). Comparison of clustering methods for high-dimensional single-cell flow and mass cytometry data. Cytometry Part A, 89(12), 1084–1096. https://doi.org/10.1002/cyto.a.23030
Weizman, O. El, Adams, N. M., Schuster, I. S., Krishna, C., Pritykin, Y., Lau, C., … O’Sullivan, T. E. (2017). ILC1 Confer Early Host Protection at Initial Sites of Viral Infection. Cell, 171(4), 795-808.e12. https://doi.org/10.1016/j.cell.2017.09.052
West, A. P., Koblansky, A. A., & Ghosh, S. (2006). Recognition and Signaling by Toll-Like Receptors. Annual Review of Cell and Developmental Biology, 22(1), 409–437. https://doi.org/10.1146/annurev.cellbio.21.122303.115827
Whitmire, J. K., Eam, B., & Whitton, J. L. (2009). Mice deficient in stem cell antigen-1 (Sca1, Ly-6A/E) develop normal primary and memory CD4+ and CD8+ T-cell responses to virus infection. European Journal of Immunology, 39(6), 1494–1504. https://doi.org/10.1002/eji.200838959

217
Willinger, T. (2019). Metabolic control of innate lymphoid cell migration. Frontiers in Immunology, Vol. 10. https://doi.org/10.3389/fimmu.2019.02010
Withers, D. R. (2016). Innate lymphoid cell regulation of adaptive immunity. Immunology. https://doi.org/10.1111/imm.12639
World Health Organization (WHO). (2017). WHO publishes list of bacteria for which new antibiotics are urgently needed. Retrieved from https://www.who.int/en/news-room/detail/27-02-2017-who-publishes-list-of-bacteria-for-which-new-antibiotics-are-urgently-needed
Wu, D., Poh Sheng, J. Y., Su-En, G. T., Chevrier, M., Jie Hua, J. L., Kiat Hon, T. L., & Chen, J. (2019). Comparison Between UMAP and t-SNE for Multiplex-Immunofluorescence Derived Single-Cell Data from Tissue Sections. BioRxiv, 549659. https://doi.org/10.1101/549659
Wucherpfennig, K. W., Gagnon, E., Call, M. J., Huseby, E. S., & Call, M. E. (2010). Structural biology of the T-cell receptor: insights into receptor assembly, ligand recognition, and initiation of signaling. Cold Spring Harbor Perspectives in Biology, 2(4), 1–14. https://doi.org/10.1101/cshperspect.a005140
Wynn, T. A., Chawla, A., & Pollard, J. W. (2013). Macrophage biology in development, homeostasis and disease. Nature. https://doi.org/10.1038/nature12034
Xu, H., Wang, X., Liu, D. X., Moroney-Rasmussen, T., Lackner, A. A., & Veazey, R. S. (2012). IL-17-producing innate lymphoid cells are restricted to mucosal tissues and are depleted in SIV-infected macaques. Mucosal Immunology, 5(6), 658–669. https://doi.org/10.1038/mi.2012.39
Yang, Q., Monticelli, L. A., Saenz, S. A., Chi, A. W., Gregory, F., Tang, J., … Artis, D. (2014). T Cell Factor 1 Is Required for Group 2 Innate Lymphoid Cell Generation. 38(4), 694–704. https://doi.org/10.1016/j.immuni.2012.12.003.T
Yang, S., Wang, J., Brand, D. D., & Zheng, S. G. (2018). Role of TNF-TNF receptor 2 signal in regulatory T cells and its therapeutic implications. Frontiers in Immunology, 9(APR). https://doi.org/10.3389/fimmu.2018.00784
Yao, Y., Jeyanathan, M., Haddadi, S., Barra, N. G., Vaseghi-Shanjani, M., Damjanovic, D., … Xing, Z. (2018). Induction of Autonomous Memory Alveolar Macrophages Requires T Cell Help and Is Critical to Trained Immunity. Cell, 175(6), 1634-1650.e17. https://doi.org/10.1016/j.cell.2018.09.042
Yazdani, R., Sharifi, M., Shirvan, A. S., Azizi, G., & Ganjalikhani-Hakemi, M. (2015a). Characteristics of innate lymphoid cells (ILCs) and their role in immunological disorders (an update). Cellular Immunology. https://doi.org/10.1016/j.cellimm.2015.09.006
Yazdani, R., Sharifi, M., Shirvan, A. S., Azizi, G., & Ganjalikhani-Hakemi, M. (2015b). Characteristics of innate lymphoid cells (ILCs) and their role in immunological disorders (an update). Cellular Immunology, 298(1–2), 66–76. https://doi.org/10.1016/j.cellimm.2015.09.006
Zeng, B., Shi, S., Ashworth, G., Dong, C., Liu, J., & Xing, F. (2019). ILC3 function as a double-edged sword in inflammatory bowel diseases. Cell Death and Disease, 10(4). https://doi.org/10.1038/s41419-019-1540-2
Zhang, J.-M., & An, J. (2009). Cytokines, Inflammation and Pain. Int Anesthesiol Clin., 69(2), 482–489. https://doi.org/10.1097/AIA.0b013e318034194e.Cytokines
Zhong, C., & Zhu, J. (2017). Transcriptional regulators dictate innate lymphoid cell fates. Protein and Cell, Vol. 8. https://doi.org/10.1007/s13238-017-0369-7
Zook, E. C., & Kee, B. L. (2016). Development of innate lymphoid cells. Nature Immunology, 17(7). https://doi.org/10.1038/ni.3481
Zurita, E., Chagoyen, M., Cantero, M., Alonso, R., González-Neira, A., López-Jiménez, A., … Montoliu, L. (2011). Genetic polymorphisms among C57BL/6 mouse inbred strains. Transgenic Research, 20(3). https://doi.org/10.1007/s11248-010-9403-8

218