iMOLSDOCK : induced-fit docking using mutually orthogonal ...
Upload
independentCategory
view
1download
0
ORIGINAL ARTICLE
Docking and electron transfer studies between rubredoxinand rubredoxin:oxygen oxidoreductase
Received: 17 July 2002 / Accepted: 9 December 2002 / Published online: 15 February 2003� SBIC 2003
Abstract The interaction and electron transfer (ET) be-tween rubredoxin (Rd) and rubredoxin:oxygen oxido-reductase (ROO) from Desulfovibrio gigas is studied bymolecular modelling techniques. Experimental kineticassays using recombinant proteins show that the Rdreoxidation by ROO displays a bell-shaped dependenceon ionic strength, suggesting a non-trivial electrostaticdependence of the interaction between these two pro-teins. Rigid docking studies reveal a prevalence for Rdto interact, in a very specific way, with the surface of theROO dimer near its FMN cofactors. The optimizationof the lowest energy complexes, using moleculardynamics simulation, shows a very tight interactionbetween the surface of the two proteins, with a highprobability for Rd residues (but not the iron centredirectly) to be in direct contact with the FMN cofactorsof ROO. Both electrostatics and van der Waals inter-actions contribute to the final energy of the complex. Inthese complexes, the major contributions for complexformation are polar interactions between acidic residuesof Rd and basic residues of ROO, plus substantial non-polar interactions between different groups. Importantresidues for this process are identified. ET estimates(using the Pathways model), in the optimized lowest
energy complexes, suggest that these configurations areefficient for transferring electrons. The experimentalbell-shaped dependence of kinetics on ionic strength isanalysed in view of the molecular modelling results, andhypotheses for the molecular basis of this phenomenonare discussed.
Keywords Protein-protein interactions Æ Moleculardynamics refinement Æ Electron transfer Æ Oxygenand NO metabolism Æ Ionic strength dependence
Introduction
Electron transfer (ET) between redox proteins is a bio-logical phenomenon present in multiple pathways suchas photosynthesis, respiration or even biological detox-ification. ET reactions have been extensively studied anddifferent theories about how this process occurs havebeen proposed. In many cases, the formation of an ef-ficient interacting complex is needed for ET to occurbetween two or more proteins. However, it is still underdiscussion whether the ET process is performed by asingle productive complex (as proposed for yeast cyto-chrome c/cytochrome bc1 complex [1]) or rather bymultiple efficient conformations [2, 3, 4, 5, 6, 7]. Inde-pendently of these questions, a good characterization ofthe interacting surface of the complexes is essential forthe understanding of ET processes between redoxproteins.
In the present study, we focus on the interaction be-tween Desulfovibrio gigas (D. gigas) rubredoxin:oxygenoxidoreductase (ROO) [8, 9] and its redox partner ru-bredoxin (Rd) [10, 11]. D. gigas is a sulfate-reducingbacterium, initially described as a strict anaerobe [12](referenced in [13]). However, later studies reported theability for this organism not only to survive in aerobicconditions, but also to reduce oxygen to water with ATPproduction [13, 14, 15]. These observations led to the
J Biol Inorg Chem (2003) 8: 475–488DOI 10.1007/s00775-002-0440-5
Bruno L. Victor Æ Joao B. Vicente Æ Rute Rodrigues
Solange Oliveira Æ Claudina Rodrigues-Pousada
Carlos Frazao Æ Claudio M. Gomes
Miguel Teixeira Æ Claudio M. Soares
B.L. Victor Æ J.B. Vicente Æ R. Rodrigues Æ S. OliveiraC. Rodrigues-Pousada Æ C. Frazao Æ C.M. GomesM. Teixeira Æ C.M. Soares (&)Instituto de Tecnologia Quımica e Biologica,Universidade Nova de Lisboa, Apt 127, Av. Republica,2781-901, Oeiras, PortugalE-mail: [email protected].: +351-21-4469610Fax: +351-21-4411277
S. OliveiraDepartamento de Biologia, Universidade de Evora,7000, Evora, Portugal
C.M. GomesDepartamento de Quımica,Faculdade de Ciencias e Tecnologia,Universidade Nova de Lisboa, 2825-114 Caparica, Portugal

identification [8, 16, 17] of a soluble ET chain(Scheme 1) in D. gigas, where ROO was shown tofunction as a terminal oxidase, reducing oxygen towater.
ROO is a homodimeric protein of 2·43 kDa. Eachprotein monomer is composed of two different domains:one b-lactamase-like and one flavodoxin-like. The for-mer contains a di-iron centre, where the reduction ofoxygen to water was proposed to occur [9]. The lattercontains a FMN cofactor, and is proposed to be theintermediate bridge in the ET from Rd to the ROOdi-iron centre [17]. In each monomer, the FMN and thedi-iron centre are separated by 35 A. However, the head-to-tail arrangement of the homodimer allows a veryclose approach of each di-iron centre to the FMN of theother monomer, granting an efficient ET processbetween them [9].
As depicted in Scheme 1, Rd mediates the ETbetween NADH:rubredoxin oxido-reductase (NRO)[16, 18] and the FMN cofactor of ROO [17]. Rd is asmall 6 kDa protein with a single polypeptide chain, andcontains an iron atom coordinated to the sulfur atomsfrom four cysteine residues.
ROO was initially described [8] as being able to re-duce oxygen to water, regenerating the NAD+ pool, orto serve as a detoxifying system in D. gigas. Recentstudies on E. coli flavorubredoxin (FlRd), a proteinhomologous to ROO [19], showed that this protein is anefficient nitric oxide (NO) reductase [20, 21]. It remainsto be clarified if ROO has also NO reductase activity.
In recent years, great importance has been given tothe study of ET complexes. This type of complex is quitedifficult to study owing to their transient occurrence, andconsequently very hard to crystallize and have theirstructure solved by X-ray crystallography. Alternatively,NMR is a technique capable of providing importantstructural information about protein complexes [5, 22,23, 24], being able to identify residues involved in theinteraction process. However, owing to inherent exper-imental difficulties, there are not many cases of protein-protein complexes where this technique has beenapplied. In the absence of detailed experimental dataabout protein-protein associations, one viable route isthe use of theoretical methodologies to predict them.Several recent published studies have reported advancesin the specific protein features essential in interactionprocesses [25, 26], and in the development of theoreticalmethodologies [27, 28]. One of the methods describingthe interaction of ET partners is the Brownian dynamics(BD) method [2]. This technique is capable of simulatinga series of diffusional dynamic trajectories, mimickingthe association process between two proteins (through
time). Specific electrostatic interactions and importantresidues can be studied using this method [29, 30].However, owing to the nature of BD, a reorganizedcomplex (after the initial encounter between the twoproteins) cannot be modelled, even if the application ofother methods to the encounter complex may alleviatethis problem. The understanding of this reorganizedcomplex may be quite important to elucidate the ETprocess between proteins. Another widely used strategyin the search for protein-protein complexes is based onthe fast Fourier transform (FFT) correlation approachinitially developed by Katchalski-Katzir et al. [31],where shape complementarity is used as a target func-tion. To improve the efficiency of the method, this ap-proach has been extended to incorporate electrostaticinteractions, solvation terms, and other biochemical in-formation [32, 33, 34, 35, 36]. Other approaches searchfor shape complementarity in real space; one example isthe method implemented in BIGGER [37]. In thismethod, an interaction scoring function is used to rankthe complexes of higher complementarity. These theo-retical methods can be supplemented with NMR data toimprove predictions [38, 39, 40].
In the present study, we use AUTODOCK 2.4 [41] inorder to perform rigid-body docking studies. Thismethod searches for interaction solutions in real space,using common force field terms for the interaction en-ergy between the two proteins. Specifically, this programuses a Monte Carlo simulated annealing technique forconfigurational exploration with a rapid energy evalua-tion using molecular affinity grids. A combinationbetween a good space search and a good energy evalu-ation results in a powerful technique for protein-proteindocking simulations that has been used before forunderstanding other systems [42, 43, 44].
The lack of protein flexibility imposed by the rigid-body docking methods may become a problem whenstudying ET processes. Interacting side-chains from in-teracting proteins are usually in unnatural positions forthe complex, preventing a close association and yieldingan apparent lower ET efficiency. One efficient way toovercome this problem is to perform a refinement of thecomplexes obtained by rigid-body docking withmolecular dynamics/mechanics simulations (MD/MM)[42, 43, 44, 45, 46, 47]. Given the approximations used,the application of MD simulation methodologies is, inmost cases, aimed at optimizing protein-protein inter-faces, rather than trying to simulate phenomena that canbe correlated with the time scale of events happening inthe real system. Other approaches have used mean-fieldmethods for optimizing side-chain conformations in thecomplex [48]. All these approaches allow the surfaces ofboth proteins to adapt to each other, a process that maybe important in optimized ET.
In order to understand the ET process between Rdand ROO from D. gigas, we have studied it experi-mentally and performed rigid-body docking simulations,followed by MD optimization. The modelling resultsshowed a clear preference for Rd to interact with the
Scheme 1
476

ROO dimer near the FMN cofactors. These MD refinedcomplexes were analysed together with the experimentalresults, aiming at the characterization of the interactionsbetween these two proteins, suggesting representativeET complexes, and making an evaluation of thestructural factors that influence the ET efficiency in thissystem.
Materials and methods
Protein expression and purification
Recombinant flavorubredoxin reductase (FlRd-red) and recombi-nant D. gigas Rd were expressed and purified as previously de-scribed (respectively [21] and [49]). Recombinant ROO cloning,expression, purification and detailed biochemical properties will bedescribed elsewhere.
Kinetic assays
Kinetic assays were performed in a Shimadzu UV-1603 spectro-photometer thermostatted at 25 �C. D. gigas Rd (16 lM) wasaerobically incubated with 40 lM NADH in Tris-HCl (1 mM,pH 7.0) at the tested ionic strength, and reduced by E. coli FlRd(final concentration, 560 nM), as observed by the completeabsorbance bleaching at 490 nm. Recombinant ROO (finalconcentration 3.8 nM) was added to the reaction mixture andthe Rd reoxidation rate was followed also at 490 nm(�490 nm=6970 M)1 cm)1). Ionic strength was adjusted using a1 M NaCl stock solution.
Molecular interactions between Rd and ROO
The procedure to perform rigid-body docking between the twoproteins was similar to that used previously [42, 43, 44] (see thesereferences for further details). The program AUTODOCK 2.4 [41]was used to study rigid-body molecular interactions between Rdand the ROO dimer. This program uses Monte Carlo methodsassociated with simulated annealing in configurational and posi-tional search, to search the interaction space between the ROOdimer (that remains static) and Rd (that moves). To obtain newconformations, at each simulation step the positional and rota-tional degrees of freedom of Rd are randomly displaced. Eachdifferent configuration is evaluated by its energy, using approxi-mations that calculate it using pre-computed atomic affinity po-tentials (see [50] for the method). These atomic affinity potentials(van der Waals) are calculated on the basis of the large proteinalone (the ROO dimer), and computed on a grid for each atom typepresent in the small protein. Additionally, grids for electrostaticinteractions and hydrogen bonding are also generated. In order tosimulate the solvent electrostatic screening, electrostatic calcula-tions are performed using a distance-dependent dielectric functiondeveloped by Solmajer and Mehler [51, 52].
The definition of grid dimensions is an important step becausewe have to ensure that the small molecule has enough spacearound the ROO dimer to search all possible docking solutions.Owing to the large dimensions of the ROO dimer (note that thelargest distance in the ROO dimer is approximately 109 A and inRd is approximately 30 A), and to limitations regarding thecomputer memory needs for each grid set (i.e. all grids needed tocalculate the interaction energy), the calculation was performed intwo steps, using two grid sets that together guarantee that all thespace around the ROO dimer was searched. In order to avoidlosing interaction solutions at the grid interfaces, it was ensuredthat the overlapping region between the two was large enough to
contain Rd. Each grid set was composed of 140·140·140 pointswith 1 A spacing. Each interaction run consisted of 100 cycles ofprogressively lower temperature, and each cycle had a maximumof 20,000 accepted or rejected Monte Carlo steps. The initialannealing temperature (T) was approximately 5052 K and a re-duction factor of 0.9463 for each cycle was applied. These pa-rameters were specifically optimized for this system using severaltests, trying to achieve a high accepted/rejected ratio in thebeginning of the annealing, a low ratio at the end, and a smoothtransition between these two extremes. The minimum energyconformation obtained at the end of a cycle was used as the initialconformation for the next one. The initial maximum translationalstep was set to 1 A. A reduction factor of 0.9702 was applied toeach cycle, resulting in a maximum translational step of 0.05 A inthe last cycle. The initial maximum quaternion rotation step was30�, and a reduction factor of 0.9770 was used in each cycle toobtain a 3� value at the end. After all interaction simulations wereperformed, solutions from both grid sets were clustered indifferent ranks according to their interaction energy and r.m.s.deviation (using a tolerance of 1 A).
Crystallographic structures of Rd [11] (PDB entry 1RDG) andof the ROO dimer [9] (PDB entry 1E5D) at 1.4 A and 2.5 A res-olution, respectively, were used in this work. All water moleculespresent in both structures were removed, except for the two watersbelonging to each di-iron centre of the ROO dimer (named 501Zand 501Y in the PDB file [9]).
Some residues in both crystallographic structures (mainly in theROO dimer) had alternative conformations. We have chosen theone with the higher occupancy value. All polar and aromatic hy-drogen atoms were added using GROMOS96 [53, 54]. The selec-tion of the protonation state of titratable residues was done byvisual selection, taking into account the neighbouring residues.Histidines were assigned a neutral state. The selection betweentautomers A and B of the neutral state was, whenever possible,made using the hydrogen bond pattern. When no state was evidentfrom the hydrogen bond pattern, tautomer B was chosen. Afterinitial positioning, hydrogen atoms were optimized in vacuum us-ing 5000 steps of steepest descent minimization. With the exceptionof hydrogen atoms, all remaining protein atoms were restrainedto their X-ray conformations with a force constant of 100 kJmol)1 nm)1. The GROMOS96 [53, 54] package was used for thisprocedure.
Our primary objective in this work was to simulate the inter-action of reduced Rd with oxidized ROO, i.e. the moment justbefore the first ET step takes place from Rd to ROO. However, toverify what influence different oxidation states have in the inter-action process, a rigid-body docking simulation of oxidized Rdwith reduced ROO was also performed. Obviously, there are otherstates that could be considered, and some of them are physiologi-cally relevant (for instance the semi-quinone state of the FMNcofactors). We have chosen to simulate these extreme states,because we expect the other ones to have an intermediatebehaviour.
When simulating the ROO dimer in the reduced state, bothFMN cofactors were set to their hydroquinone form as specified inGROMOS96, while for the di-iron centres a total charge of )1 wasassigned. A very simple charge distribution was attributed to theatoms making up these centres. For each di-iron centre, a partialcharge of +2 was assigned to each iron atom, while a charge of )2was attributed to the oxygen atom positioned between them(named in the crystallographic structure as the oxygen atom l-Ofrom residue FEO 404 in PDB entry 1E5D). To the remainingatoms of the protein (including those coordinated to the di-ironcentres [9]), charges from GROMOS96 [53, 54] were used. Whensimulating the oxidized ROO state, both FMN molecules were setto their quinone form, while for the di-iron centres a global chargeof +1 was assigned; all atoms have the same partial charges usedfor the reduced form, except the iron atoms that were assigned apartial charge of +3.
In the case of Rd, a simple charge set for the FeS4 metal clusterwas used. For reduced Rd, the global charge defined for the FeS4centre was )2. In this case a +2 partial charge was attributed to the
477
iron atom. The four cysteine residues connecting the iron hadpartial charges of )0.8 and )0.2 assigned to the sulfur and b-car-bon atoms, respectively. To the remaining atoms of the protein,charges from GROMOS96 [53, 54] were used. To simulate theoxidized state of Rd we changed the iron atom charge to +3,maintaining the remainder as in the reduced state. Therefore, theglobal charge of the FeS4 centre was )1. The exact charge distri-bution assigned to the iron centres of both proteins should not havemuch influence in long-range electrostatic interactions.
The use of the ROO dimer, which is the functional form of thisprotein [8], presents interesting advantages from the point of viewof the modelling methods. The two monomers of ROO are obvi-ously equal, but in the structure, owing to different crystallographiccontacts they present small differences, mostly in side-chain con-formations. Owing to these differences and to the use of rigiddocking methods, the physics of interaction will not be absolutelyequal for the interaction of Rd with each monomer of the ROOdimer. This is advantageous in this case, since it provides ‘‘dupli-cates’’ for the interaction simulations. The consistency betweendocking solutions with monomer A and B of ROO will provideclues about the reliability of the final results.
Complex optimization by MD simulations
MD simulations were performed in order to optimize complexesobtained by rigid-body docking between Rd and the ROO dimer.Simulations were run in vacuum but, in order to simulate solventdielectric screening, the same distance-dependent dielectric func-tion [51, 52] present in AUTODOCK 2.4 [41] was used. Obviouslythis is an approximation, and MD simulations in explicit solventwould be more correct, but given the size of the complex and thenumber of configurations that we wanted to analyse, the use ofthese more sophisticated methodologies is prohibitive. To ac-complish these simulations, a modified version of the programPROMD from the GROMOS 96 package [53, 54] was created.However, despite the dielectric screening, the vacuum boundarycan introduce large deformations in the structure of the proteins.To prevent this undesirable situation, distance restraints with aforce constant of 100 kJ mol)1 nm)1 were applied to all Ca at-oms of the protein, metal clusters and the first atoms bound tothe metals. By this we guaranteed that the geometry of the metalcentres remained as close as possible to the crystallographicstructures. The simulations were run using SHAKE [55] in allbonds, with a geometric tolerance of 0.0001. The integration ofthe equations of motion was performed using a time step of0.002 ps. The twin range method [56] was used in the simulationof electrostatic interactions, with cut-offs of 8 A and 14 A. Thepair-list was updated every 10th step.
Selected Rd-ROO complexes were initially optimized using asteepest descent minimization along 1000 steps. This first minimi-zation was followed by another 1000 steps of minimization usingthe conjugated gradient method. Constant temperature was used inall subsequent MD simulations, by coupling the system to heatbaths [57]. Initially, a first step of gradual heating (performed toavoid structural perturbations that might occur due to a fastheating process) was performed. Complexes were heated from 0 Kto 25 K during 2 ps with a temperature coupling constant of0.01 ps. Subsequent to this first heating, the temperature of thesystem was gradually heated in 25 K steps until a final temperatureof 300 K was achieved. Each heating step consisted of 2 ps with atemperature coupling constant of 0.1 ps. After this heating process,the system was freely run for 200 ps. This productive run wasfollowed by a gradual cooling procedure. Complexes were cooledfrom 300 K to 0 K, in 25 K temperature steps, each one along 2 ps(temperature coupling constant of 0.1 ps). In the end, complexeswere minimized using the steepest descent method for 1000 steps.
The simplified nature of the MD simulation methodologymakes it mostly irrelevant concerning the time scale of events.Things are happening much faster than in situations where explicitwater is used. Therefore, we should only regard this procedure asan optimization method.
ET calculations
The non-adiabatic ET rate can be defined as:
KET ¼2ph
TDA½ �2FC ð1Þ
where h is the Planck constant, TDA the electron tunnelling cou-pling factor between donor and acceptor and FC the Frank-Codonfactor. This last factor contains, among other things, the reorga-nization of the system during the ET process. This term is difficultto evaluate, but it should be constant when the interaction partnersare the same, as in the case treated in this work (see [58] for areview). Therefore, we will disregard it here. Taking into accountEq. 1 and these considerations, it is possible to assume that the ETrate (KET) is directly proportional to the square of the ET coupling(TDA). TDA can be evaluated with the Pathways model developedby Beratan, Onuchic and others [59, 60, 61]. According to thismodel, an electron pathway is defined as a combination of inter-actions, such as space jumps and hydrogen or covalent bonds,connecting a specified donor and acceptor. To each connection, aspecific decay is assigned. The product of all connection decays isan approximation of the total decay of a certain pathway. There-fore, the ET efficiency can be evaluated according to the TDA
obtained for the pathway.GREENPATH v.0.971 [62] was the program used to perform
these studies in Rd-ROO complexes optimized by MD simulations.This program, based on the tunnelling pathways theory, calculatesevery possible pathway between a specified electron donor andacceptor. The one with the higher TDA is selected as representativeof the ET process.
The FeS4 centre from Rd and the FMN from ROO have beendefined as the initial electron donor and acceptor. In the FeS4centre from Rd, the four coordinating iron-sulfur bonds were de-fined as having no decay. The same was performed for the FMNand for the di-iron centres from ROO. In these cases, all bondsconnecting the FMN ring atoms (the aromatic part) and bondsbetween atoms connecting both iron atoms from the di-iron centre(namely NE2 from His79, OE1 from Glu81, OD2 from Asp83,NE2 from His146, OD1 and OD2 from Asp165, NE2 from His226,l-O from FEO, O from water 501Z and O from water 501Y) werealso defined as having no decay. These definitions are importantbecause we want to assume that when electrons arrive at the atomsof the cofactors most likely to contain the orbitals to be oxidized/reduced, they have arrived at their final acceptor orbital.
Results and discussion
Reaction rate ionic strength dependence
The reoxidation rate of Rd by ROO, in the presence ofoxygen, was determined as a function of the ionicstrength in order to investigate the type of interactionbetween the two proteins. For this purpose, a hybrid invitro assay was designed (Scheme 2), in which Rd wasenzymatically reduced by E. coli FlRd-red, a proteinwhich was shown to efficiently reduce D. gigas Rd at theexpense of NADH oxidation [19]. Upon addition ofcatalytic amounts of FlRd-red in the presence ofNADH, Rd is reduced as monitored at 490 nm (Fig. 1A,block arrow 1).
When catalytic amounts of ROO are added to thereaction mixture (Fig. 1A, block arrow 2), Rd reoxida-tion by ROO is triggered, at the expense of oxygen re-duction. The Rd reoxidation rates vary with ionicstrength in a bell-shaped fashion (Fig. 1B), which sug-gests that electrostatic interactions are important for
478

complex formation (further discussed below). Althoughthe rates measured are not the intrinsic rate constantsfor the interaction of Rd and ROO, the conditions usedfor the assays were chosen so that the ionic strengthdependence observed would be due only to the interac-tion between rubredoxin and ROO. As assessed by theflat absorbance line after reduction, Rd is not efficientlyreoxidized by oxygen. Furthermore, under those condi-tions, the rate of reduction of rubredoxin by FlRd-red isindependent of the ionic strength, having a constantvalue of 0.6±0.1 lM rubredoxin s)1, in the range
studied. Owing to the large excess of rubredoxin overROO (4000-fold), and since only the initial rate ofreoxidation was determined, the extent of rubredoxinre-reduction is negligible as only ca. 5% of rubredoxin isoxidized in the time window used to measure the rates;thus the large excess of Rd in relation to ROO ismaintained. Finally, the rate of oxygen reduction byROO should be independent of ionic strength, in thenarrow range studied, namely taking into considerationthat O2 is an apolar molecule.
Rd and ROO structural properties
Figure 2 shows Rd and ROO surfaces coloured ac-cording to their surface potential and ET efficiency. Thischaracterization allows an evaluation of possible im-portant electrostatic interaction regions between differ-ent proteins and to qualitatively estimate the ETefficiency of different regions of the proteins. In Fig. 2fand Fig. 2g the Rd surface is coloured according to itselectrostatic potential in the oxidized and reduced states,respectively. In both figures there is a red colour prev-alence on the surface, corresponding to negative poten-tials, characteristic of acidic residues. Except for theregion near the FeS4 centre, the surface potential of theprotein is very similar in both redox states. When Rd isoxidized the global charge of the centre is )1, whilewhen it is reduced the value is )2. These differences arenot very evident, mainly because the total charge of theFeS4 centre is always negative. Although small, thesesurface potential differences can influence the way in-teractions between the two proteins are made. The re-gion around the FeS4 centre appears also to be veryefficient for ET. As can be seen in Fig. 2h, this is theregion of the protein where a high ET coupling is ob-served (marked by a strong green colour), despite thefact that the whole protein surface shows high ET cou-pling values. This suggests that, independently of theinteracting surface used, there is a high propensity forRd to transfer electrons once it interacts with otherproteins. This observation, explained by the reduceddimensions of the protein, is advantageous for a redoxsystem like Rd.
Besides its much larger dimensions, the ROO dimeris quite different from Rd concerning its surface char-acteristics. In contrast to Rd, ROO has a similar pro-portion of acidic and basic residues. In Fig. 2b andFig. 2c the ROO dimer surface is coloured according toits potential in the oxidized and reduced states, re-spectively. In both states, except for regions near thedi-iron centres and the FMN cofactors, no substantialvariations in the surface potential are observed. WhenROO is totally oxidized, the surface potential nearthese cofactors is more positive than when the proteinis reduced (prevalence of blue colour in the first situ-ation, not observed in the second one). This fact is dueto differences in the global charge of the di-iron centres(positioned near both FMN cofactors) that, when
Fig. 1A, B D. gigas Rd/ROO interaction studies followed byUV/visible spectroscopy. A Representative assay performed at50 mM ionic strength, as described in Materials and methods (seetext for details). B Ionic strength dependence of the ROO-mediatedRd reoxidation rates
Scheme 2
479

ROO is totally oxidized, display a positive (+1) totalcharge, in opposition to the negative ()1) total chargein the reduced state. In contrast to Rd, where almostall of the protein has a similar probability to transferelectrons, in ROO the regions near the di-iron centres
and the FMN cofactors appear to be those with higherpropensity to perform this task, as evidenced byFig. 2d where a strong green colour is observed nearthese centres.
Simulation of the interaction between Rd and ROO
Two different docking simulations with Rd and ROOwere performed. In the first, the Rd reduced form wasdocked against the ROO oxidized form, while in thesecond the oxidized Rd was docked against the fullyreduced ROO. This was done in order to test the influ-ence of the redox state on the interaction process. Re-duced Rd and oxidized ROO were docked 600 times,while for the docking of oxidized Rd with fully reducedROO, 400 simulations were done. A high number ofdocking simulations yielded a representative number ofinteracting complexes and not just some sporadic solu-tions. The obtained complexes were clustered andranked according to their energies and r.m.s. deviationwith respect to the initial structure (see Fig. 3c and 3d).Those with lower energy (more stable ones) appeared, ingeneral, a higher number of times (hits), evidencing theconvergency of the docking process. For example, thefirst rank contains approximately 15–17% of all inter-action solutions in both simulations.
Fig. 2a–h ROO dimer and Rd molecule surface properties. Thesecondary structure of the ROO dimer (with a pseudo-twofoldrotation axis perpendicular to the plane of the paper, located by thecentre of the dimer) and Rd are represented in a and e, respectively,showing their cofactors in ball-and-stick representations. In b and cthe ROO molecular surface is coloured according to the electro-static potential, when the protein is in the oxidized and reducedforms, respectively. The same is done for Rd in f and g,respectively. Red coloured regions represent negative potentials,while blue coloured regions represent positive potentials (asdescribed in the bar above the electrostatic potential molecularsurfaces from ROO). The potential varies between )10 and 10KT/e. In d and h, the ROO and Rd molecular surfaces,respectively, are coloured according to the ET coupling factorsobserved in each protein atom. In both cases, the cofactors (FMNand di-iron centres for ROO and FeS4 centre for Rd) were definedas the initial electron donors, while all atoms from each proteinwere defined as the electron acceptors. Surface regions colouredwith a stronger green represent those where high ET couplingfactors are observed. As described in the bar below the Rd ETmolecular surface, the values vary between )20 and 0 (these valueswere defined by log(TDA)
2 and calculated with program GREEN-PATH v.0.971 [62]). All figures were prepared with programsGRASP [76], Molscript [77] and Raster3D [78]. Note that the ROOdimer and Rd are represented using different scales
480

Figure 3a and Fig. 3b present all clustered interac-tion solutions obtained in the docking of reduced Rdwith oxidized ROO and of oxidized Rd with reducedROO, respectively. For clarity reasons, only the centresof mass of Rd are represented relative to the main foldof ROO. In both situations, many different complexeswere obtained, but in the lower energy ones, Rd tends todock on ROO near both FMN cofactors. According toGomes et al. [17], the ROO’s FMN reduction potentialsare 0±15 mV and )130±15 mV, while the Rd reduc-tion potential is 0±5 mV [63]. Therefore, it is likely thata direct ET process from Rd towards the FMN cofac-tors from ROO occurs. As described previously, the
region of the ROO surface presenting higher ET cou-pling factors is the one near the di-iron centres and theFMN cofactors. In contrast, Rd presents similar ETcoupling factors all over its surface. If we combine thesesurface characteristics with the lower energy complexsolutions obtained in the docking of Rd with ROO (bothsimulations), we verify that the physics of the interactionfavours the ET efficiency, with Rd interacting preferen-tially on ROO near the FMN cofactors, as previouslyshown experimentally [17]. These regions of ROO arealso the ones presenting positive potentials, and there-fore the ones with more propensity to interact with theoverall negative Rd, as observed in the rigid dockingresults.
Figure 3 shows that, for both docking simulations,the complexes with lowest interaction energy (rank 1)are very similar (notice the positioning of the greenspheres). However, the interaction energies correspond-ing to these two complexes are different. The first rankobtained in the docking of reduced Rd with oxidizedROO presented an interaction energy of )65.8 kcal/mol,while in the first rank obtained in the docking of oxi-dized Rd with reduced ROO, an interaction energy of)60.9 kcal/mol was obtained. These results suggest thatthe complex obtained from the docking of reduced Rdwith oxidized ROO is more stable. This difference is inagreement with the distinct electrostatic potentials at theROO interaction surface (see previous section). When
Fig. 3a–d Results from the rigid-body docking simulations ob-tained in two different conditions. Docking of reduced Rd withoxidized ROO is shown in a and c, and the docking of oxidized Rdwith reduced ROO in b and d. Parts a and b display a stereorepresentation of the main fold of ROO (as a smoothed line) andprotein cofactors (represented using ball-and-sticks), surrounded bysmall spheres that correspond to the centre of mass of Rd indifferent interacting solutions (or ranks). The first rank isrepresented by the bigger green sphere, the second rank by asmaller yellow sphere and the third rank by an even smaller redsphere. The following seven ranks are represented by small bluespheres, while those coloured in grey represent the remaininginteraction solutions. The figures were prepared with programsMolscript [77] and Raster3D [78]. Parts c and d present the numberof hits found for each rank (docking solution), represented as bars,and the respective minimum interaction energy of this rank,represented as lines
481

ROO is oxidized, these interaction regions show a morepositive potential than when the protein is reduced.Because Rd always presents, irrespective of its redoxstate, a negative potential character on its surface, it willform more stable complexes with the oxidized form ofROO, which presents more positive potentials in theinteraction surface. Whatever the exact molecular rea-son for these facts, it is noteworthy that they happen inthis way. The energetics favours the functional directionof electron flow, i.e. the ET from Rd to ROO, and notthe opposite, being the most productive interaction,precisely the one with the higher affinity (reduced Rdand oxidized ROO). After electrons are transferred andROO becomes reduced and Rd oxidized, it is advanta-geous that the affinity of the complex becomes dimin-ished, since this frees Rd to capture more electrons fromNRO and continue the cycle.
In many cases, owing to crystallographic contactsand to side chains showing alternating configurations,the crystallographic structures are not the most suitedmodels for docking studies. To check the influence ofthis problem in our simulations, we decided to run MDsimulations of the two isolated proteins (reduced Rd andoxidized ROO), using explicit solvent and periodicboundary conditions (results not shown), in order tofind other unbiased side-chain configurations (all a-car-bons, metal centres and cofactors were kept restrained totheir X-ray conformations). With these structures, takenfrom MD simulations of reduced Rd and oxidized ROO(at 150, 250 and 400 ps of the production part of theMD simulation), new docking simulations were per-formed (results not shown) using the nine possiblecombinations and the same conditions. The dockingresults were very similar to the ones obtained with theX-ray structures, with Rd interacting preferentially withthe FMN cofactors of ROO, confirming that the initialdocking simulations were not biased by the exactconformation found in the X-ray structure.
Complex optimization by MD simulations
Owing to the lack of flexibility inherent with rigid-bodydocking methods, we are only able to obtain an initialevaluation of the close contact between protein inter-acting surfaces. Because these close interactions can beessential for the efficiency of the ET process, we re-introduced flexibility, by performing MD simulationson the four lower energy complexes obtained in thedocking of reduced Rd and oxidized ROO. Figure 4shows the result of this procedure for rank 1 (Fig. 4b)and compares it with the rigid docking configuration(Fig. 4a). It is noteworthy that in this docking solution(and in fact in all four docking solutions analysedhere), the iron centre of Rd is not in direct contact withthe surface of ROO. In the case of rank 1, it is actuallyin the opposite direction. This is somewhat surprising,but does not prevent an efficient ET to occur (seebelow).
The MD optimization of the complex presented inFig. 4 did not change the overall binding mode betweenthe two proteins, but allowed both proteins to approach,resulting in the formation of a more realistic ET com-plex. The same happened for the other three complexesrefined by MD simulations (results not shown). Thesefacts were also observed in other systems studied withsimilar methodologies [42, 43, 44, 45]. Note, however,that the approximations used in the MD methodology,namely the absence of explicit water, do not allow us tomodel some factors. One example is the neglect of in-terfacial water molecules, which may influence theformed complexes. Nevertheless, the complexes opti-mized in this way may give us a crude idea of theeffective importance of different residues at the interface,even if all the details are not explicitly modelled.
For each optimized complex, the contribution of vander Waals and electrostatic interactions to the interact-ing energy between the two proteins are presented inTable 1. The same relative contributions for the non-optimized configurations are also presented. After MDoptimization, the relative contribution of van der Waalsinteractions increases, at the expense of the electrostaticrelative contribution (in all situations), even if both typesof energy increase. This results from the properties ofvan der Waals interactions: the energy due to thiscomponent only becomes important when atoms are inclose contact, a situation that is not very favoured inrigid docking simulations. The situation changes dra-matically when the systems are allowed to approach andadapt to each other, leading to a drastic increase of thevan der Waals component. The electrostatic componentis also affected by distance, but to a much lower degree.
The relative decrease of electrostatic versus van derWaals interactions, observed in the final complexes,should not be interpreted as if electrostatics is not
Fig. 4 Representation of the lowest energy complex obtained in thedocking of reduced Rd with oxidized ROO, before (a) and after (b)MD simulations. See the legend to Fig. 3 for details. The figureswere prepared with programs Molscript [77] and Raster3D [78]
482
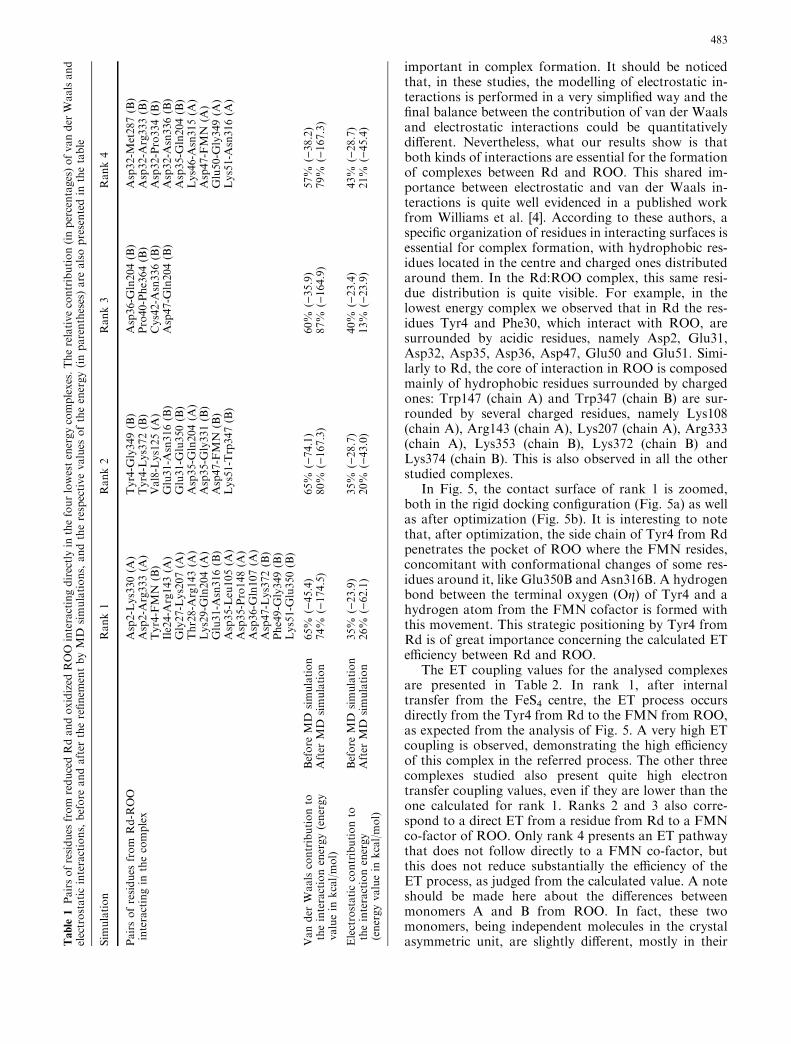
important in complex formation. It should be noticedthat, in these studies, the modelling of electrostatic in-teractions is performed in a very simplified way and thefinal balance between the contribution of van der Waalsand electrostatic interactions could be quantitativelydifferent. Nevertheless, what our results show is thatboth kinds of interactions are essential for the formationof complexes between Rd and ROO. This shared im-portance between electrostatic and van der Waals in-teractions is quite well evidenced in a published workfrom Williams et al. [4]. According to these authors, aspecific organization of residues in interacting surfaces isessential for complex formation, with hydrophobic res-idues located in the centre and charged ones distributedaround them. In the Rd:ROO complex, this same resi-due distribution is quite visible. For example, in thelowest energy complex we observed that in Rd the res-idues Tyr4 and Phe30, which interact with ROO, aresurrounded by acidic residues, namely Asp2, Glu31,Asp32, Asp35, Asp36, Asp47, Glu50 and Glu51. Simi-larly to Rd, the core of interaction in ROO is composedmainly of hydrophobic residues surrounded by chargedones: Trp147 (chain A) and Trp347 (chain B) are sur-rounded by several charged residues, namely Lys108(chain A), Arg143 (chain A), Lys207 (chain A), Arg333(chain A), Lys353 (chain B), Lys372 (chain B) andLys374 (chain B). This is also observed in all the otherstudied complexes.
In Fig. 5, the contact surface of rank 1 is zoomed,both in the rigid docking configuration (Fig. 5a) as wellas after optimization (Fig. 5b). It is interesting to notethat, after optimization, the side chain of Tyr4 from Rdpenetrates the pocket of ROO where the FMN resides,concomitant with conformational changes of some res-idues around it, like Glu350B and Asn316B. A hydrogenbond between the terminal oxygen (Og) of Tyr4 and ahydrogen atom from the FMN cofactor is formed withthis movement. This strategic positioning by Tyr4 fromRd is of great importance concerning the calculated ETefficiency between Rd and ROO.
The ET coupling values for the analysed complexesare presented in Table 2. In rank 1, after internaltransfer from the FeS4 centre, the ET process occursdirectly from the Tyr4 from Rd to the FMN from ROO,as expected from the analysis of Fig. 5. A very high ETcoupling is observed, demonstrating the high efficiencyof this complex in the referred process. The other threecomplexes studied also present quite high electrontransfer coupling values, even if they are lower than theone calculated for rank 1. Ranks 2 and 3 also corre-spond to a direct ET from a residue from Rd to a FMNco-factor of ROO. Only rank 4 presents an ET pathwaythat does not follow directly to a FMN co-factor, butthis does not reduce substantially the efficiency of theET process, as judged from the calculated value. A noteshould be made here about the differences betweenmonomers A and B from ROO. In fact, these twomonomers, being independent molecules in the crystalasymmetric unit, are slightly different, mostly in theirT
able
1Pairsofresidues
from
reducedRdandoxidized
ROO
interactingdirectlyin
thefourlowestenergycomplexes.Therelativecontribution(inpercentages)ofvander
Waalsand
electrostaticinteractions,before
andafter
therefinem
entbyMD
simulations,andtherespectivevalues
oftheenergy(inparentheses)are
alsopresentedin
thetable
Sim
ulation
Rank1
Rank2
Rank3
Rank4
Pairsofresidues
from
Rd-R
OO
interactingin
thecomplex
Asp2-Lys330(A
)Asp2-A
rg333(A
)Tyr4-FMN
(B)
Ile24-A
rg143(A
)Gly27-Lys207(A
)Thr28-A
rg143(A
)Lys29-G
ln204(A
)Glu31-A
sn316(B)
Asp35-Leu105(A
)Asp35-Pro148(A
)Asp36-G
ln107(A
)Asp47-Lys372(B)
Phe49-G
ly349(B)
Lys51-G
lu350(B)
Tyr4-G
ly349(B)
Tyr4-Lys372(B)
Val8-Lys125(A
)Glu31-A
sn316(B)
Glu31-G
lu350(B)
Asp35-G
ln204(A
)Asp35-G
ly331(B)
Asp47-FMN
(B)
Lys51-Trp347(B)
Asp36-G
ln204(B)
Pro40-Phe364(B)
Cys42-A
sn336(B)
Asp47-G
ln204(B)
Asp32-M
et287(B)
Asp32-A
rg333(B)
Asp32-Pro334(B)
Asp32-A
sn336(B)
Asp35-G
ln204(B)
Lys46-A
sn315(A
)Asp47-FMN
(A)
Glu50-G
ly349(A
)Lys51-A
sn316(A
)
Vander
Waalscontributionto
theinteractionenergy(energy
valuein
kcal/mol)
Before
MD
simulation
65%
()45.4)
65%
()74.1)
60%
()35.9)
57%
()38.2)
After
MD
simulation
74%
()174.5)
80%
()167.3)
87%
()164.9)
79%
()167.3)
Electrostaticcontributionto
theinteractionenergy
(energyvaluein
kcal/mol)
Before
MD
simulation
35%
()23.9)
35%
()28.7)
40%
()23.4)
43%
()28.7)
After
MD
simulation
26%
()62.1)
20%
()43.0)
13%
()23.9)
21%
()45.4)
483

side-chain conformations, as described before. In prac-tice, owing to the use of rigid docking methods, thisresults in different interaction energies and slightlydifferent conformations for associations that shouldformally be equal. This is the case for ranks 3 and 4,where Rd docks on the ROO surface near the FMNfrom chain A, while in the two other preceding ranks thedocking was on the ROO surface near the FMN fromchain B. Despite the determinism of the ET analysis usedin this work, one should note that actual ET might notnecessarily depend on the referred residues and theirexact nature. The topological differences between thecomplexes do not lead to exaggerated differences in ETefficiency, as calculated by the method, showing that
different ET solutions may be similarly efficient andalternative routes always exist.
As suggested before for other cases [2, 7, 42, 45, 64,65, 66, 67, 68], the ET process between Rd and ROOmay not be dependent on a single specific complex. Theexistence of different, similarly efficient, interactingconformations allows proteins to increase the probabil-ity for productive configurations to occur.
Fig. 5 Stereo representation of the contact surface observed in thelowest energy complex obtained by rigid-body docking before (a)and after (b) the refinement by MD simulation. A zoom of theinteraction complex is presented. Rd and ROO are coloured usingdifferent colour schemes to distinguish them: Rd carbon atoms arecoloured yellow and ROO carbon atoms are coloured grey. Thebonds connecting the atoms from Tyr4 from Rd and the bondsconnecting the FMN atoms from ROO are shown with thickerlines. Labels are displayed for selected residues. The figures wereprepared with the programs Molscript [77] and Raster3D [78]
Table 2 Calculation of ET coupling factors for the fourlowestenergy complexes (after MD optimization), obtained from thedocking ofreduced Rd with oxidized ROO. The calculation reflectsthe final TDA considering the FeS4 centre from Rd as the initialelectron donor and the FMN from ROO closest to the interactionsurface as the final electron acceptor. In thistable, for each complexthe pair of residues from Rd and ROO responsible forthe finaljump is presented
Interactionstudy
ET coupling(TDA)
Pairs ofresidues (Rd-ROO)
Rank 1 1.0·10)5 Tyr4-FMN (chain B)Rank 2 7.4·10)6 Lys46-FMN (chain B)Rank 3 7.7·10)7 Pro35-FMN (chain A)Rank 4 9.3·10)6 Thr7-Ser348 (chain A)
484

FlRd and clues for the ET process between Rdand ROO
Gomes et al. [19] recently described a novel ET chain inE. coli involving a terminal enzyme named FlRd. Thisprotein is composed of three different domains: oneb-lactamase-like, one flavodoxin-like and one rubre-doxin-like. As described earlier for D. gigas, eachmonomer from ROO is also composed of one b-lac-tamase domain and one flavodoxin domain, so FlRdseems to be a fusion between ROO and Rd. In thesecircumstances, we expected that our docking solutionscould be fitted in a plausible FlRd topology. In order toinvestigate this possibility, we decided to align the ROOand Rd sequence with the FlRd sequence (Fig. 6). Thewhole of the ROO sequence aligns with the FlRdsequence. The important ligands connecting the di-ironcentre are strictly conserved. The b-lactamase-likedomains from these two proteins present an identity of37%, while the flavodoxin-like domains have an identity
of 30%. Overall, the identity observed between the pri-mary sequences from FlRd and ROO is 33%. After agap of 20 residues in FlRd (where no alignment betweenthis protein and ROO or Rd was observed), Rd alignswith the former protein until the end of their C-termini.The cysteine residues of Rd, connecting the iron atom,are conserved. In this alignment, an identity of 40% isobserved. These results confirm considerable similari-ties between these systems. They also point to a seg-ment of 20 residues that connects the flavodoxindomain and the rubredoxin domain. Is this numberof residues compatible with the distance between theC- and N-termini from ROO and Rd, respectively, inour docking solutions? The answer for this is providedin Fig. 7, which shows the topology of rank 1. In thiscase, the distance between the C-terminus from ROOand the N-terminus from Rd is 29.1 A. If 20 residues(corresponding to the gap) are arranged as an a-helix(the most compact way to dispose residues), they wouldcover approximately 30 A. This value is very similar (at
Fig. 6 Sequence alignmentbetween ROO (one monomer)and Rd with the sequence fromFlRd. The domains comprisingROO and Rd are marked belowthe alignment. The asterisk andcolon symbols correspond toresidue identity and similarity,respectively. The alignmentswere made with the programCLUSTALW [79]
485

least it is sufficient) to the one needed to connect theflavodoxin-like domain of ROO with Rd. In conclu-sion, the possible topology of FlRd is compatible withour lowest energy docking solution, further supportingour modelling studies.
Molecular hypotheses to interpret the ionic strengthdependence of ET
The analysis of the ionic strength dependence of ET cangive us clues about the molecular events that lead toprotein association and ET. These experiments show theinfluence of electrostatics in this process, since differentionic strength values generate different electrostaticshielding effects. Higher ionic strengths provide highershielding of electrostatic forces.
The experimental results for this system clearly show abell-shaped dependence of ROO reduction on ionicstrength, with a maximum at values around 60–70 mM(see Fig. 1). This shows a marked electrostatic depen-dence on the interaction process between the two pro-teins, but this dependency is non-trivial. Our theoreticalresults show a substantial electrostatic component for theinteraction energy of the complexes formed. In the sim-plified electrostatic treatment used here, electrostaticswas not the most important component on the finaloptimized structure, but its influence before optimization
was considerably higher. Nevertheless, one should keepin mind that these electrostatic treatments are a simpli-fication and, with respect to the ionic strength, this factoris not included at all. However, as we will discuss, theyallow us to make some qualitative simulations that canprovide indications on the ionic strength dependence.
This kind of bell-shaped behaviour, presented by Rdand ROO, has been observed for some other ET part-ners [69, 70, 71, 72, 73], and several explanations for ithave been suggested (see [74]). In this case, we will dis-cuss two possible hypotheses to explain these observa-tions that, nevertheless, will require further experimentaland theoretical studies to be confirmed.
One interpretation for this complex behaviour canemerge if we take into account that ROO presentsequally efficient catalytic centres. This provides thepossibility for the formation of 2:1 complexes, i.e. twoRd molecules docking on one ROO, near both FMNcofactors. Considering the high number of negativelycharged residues comprising Rd, it is possible to foreseethat in the double interaction of two Rd molecules withROO, repulsive electrostatic effects between the two Rdmolecules will occur, influencing the formation of anefficient 2:1 ET complex. At low ionic strengths theshielding of these repulsive electrostatic interactionsbetween both Rd proteins would be very low (increasingrepulsion), leading to inefficient ET (as observed in thebell-shaped curve). However, when the ionic strength isincreased, its shielding effects will decrease, allowing theformation of stable and efficient ET complexes (the peakaround 60–70 mM of the ET rates in the bell-shapedcurve). By further increasing the ionic strength, theoverall electrostatic contribution for complex formationwill be reduced, leading to the destabilization of anycomplexes and consequent inefficiency of ET, as ob-served experimentally. In order to check the feasibility ofthis hypothesis, we decided to repeat the rigid dockingsimulations between reduced Rd and oxidized ROO, butin this case we occupied one of the FMN binding sitesfound previously with a Rd molecule (results notshown). This was done using the interaction solutionobtained in rank 3 from the original docking experi-ments. The two lowest energy solutions obtained in thiscase match the first two lowest energy solutions obtainedin the original simulation, where one Rd was not in-cluded. However, interaction energies of the complexesin this second experiment were higher, showing theirlower stability, when compared with the original simu-lation. For the first rank, an interaction energy of)59.5 kcal/mol was obtained, while the correspondingcomplex in the original docking experiment had an in-teraction energy of )65.8 kcal/mol. Similarly, for thesecond rank the interaction energy was )55.1 kcal/mol,while the energy of the original solution was )61.7 kcal/mol. These results are a confirmation of the assumptionmade above, that two Rd molecules, bound to a singleROO molecule, display a clear repulsion between them,being a destabilizing factor in the formation of 2:1complexes.
Fig. 7 The interaction region of the lowest energy complex betweenreduced Rd and oxidized ROO is presented. The distance betweenthe N-terminus from Rd (A) and the C-terminus from ROO (B) isshown by a dashed line. This figure was prepared with the programMolscript [77] and Raster3D [78]
486

A second hypothesis for the bell-shaped dependencemay also be suggested. Intense electrostatic interactionsmay rigidify the complex formed between the twoproteins, leading to a lower degree of reorganizationand surface complementarity, necessary for achievinghigh ET rates [69, 75]. A way to increase electrostaticinteractions and indirectly simulate the low shieldingconditions observed at low ionic strength is to use asimple Coulomb law, without the distance-dependentdielectric constant used before [51, 52]. When we ap-plied this in rigid docking experiments (results notshown), the complexes obtained are different from theoriginal ones, and their ET efficiency is lower. For in-stance, for the first rank obtained (after MD optimi-zation) the ET coupling value was 5.0·10)6, while forthe first rank of the original simulation the corre-sponding value was 1.0·10)5. ET efficiency becomeslower when the electrostatics is increased, as observedexperimentally.
Concluding remarks
The modelling methodologies allowed us to characterizethe interaction between Rd and ROO, showing thegroups from both proteins that are more important forcomplex formation. Acidic residues from Rd and basicones from ROO play an important role, but other non-polar interactions are also important. The modellingresults point very strongly for an interaction between Rdand the surface region near the FMN cofactors of ROO,corroborating previous experimental data that showedthat Rd donates electrons to the ROO FMN cofactors[17]. Our calculations suggest an efficient ET process forthese interaction configurations. The experimental bell-shaped dependence of the kinetics on ionic strength isnot a simple phenomenon to interpret, and we put for-ward two possible explanations for it. In one case, thebinding of one Rd molecule would make the binding ofanother Rd molecule considerably more difficult, byelectrostatic repulsion (as shown by our modelling re-sults). This repulsion would be higher for lower ionicstrengths but, with increasing concentration of salt, thisrepulsion would be diminished, allowing a more stable2:1 complex formation. A second hypothesis considerselectrostatic locking of unproductive complexes thatbecome unstable with increasing ionic strength, allowingthe two proteins to interact with each other in moreproductive configurations. Both hypotheses are amena-ble to experimental testing, and work is in progress toclarify this issue.
Acknowledgements We thank Prof. Helena Santos (ITQB) forproviding the plasmid for over-expression of recombinant D. gigasRd in E. coli. This work was supported by grants POCTI-32789/99/FCT (to C.M.S.) and POCTI-36558/FCT (to M.T.) and fellowships038/BIC/2001 (to B.L.V.), 044/BIC/2001 (to J.B.V.) and SFRH/BD/5219/2001 (to R.R.).
References
1. Lange C, Hunte C (2002) Proc Natl Acad Sci USA 99:2800–2805
2. Northrup S, Boles J, Reynolds J (1988) Science 241:67–703. Jeng M, Englander SW, Pardue K, Rogalskyj JS, MacLendon
G (1994) Nat Struct Biol 1:234–2384. Williams P, Fulop V, Leung Y, Chan C, Moir J, Howlett G,
Ferguson S, Radford S, Hadju J (1995) Nat Struct Biol 2:975–982
5. Ubbink M, Bendall DS (1997) Biochemistry 36:6326–63356. Ubbink M, Ejdeback M, Karlsson BG, Bendall DS (1998)
Structure 6:323–3357. Chohan KK, Jones M, Grossman JG, Frerman FE, Scrutton
NS, Sutcliffe MJ (2001) J Biol Chem 276:34142–341478. Chen L, Liu MY, LeGall J, Fareleira P, Santos H, Xavier AV
(1993) Biochem Biophys Res Commun 193:100–1059. Frazao C, Silva G, Gomes CM, Matias P, Coelho R, Sieker L,
Macedo S, Liu MY, Oliveira S, Teixeira M, Xavier AV,Rodrigues-Pousada C, Carrondo MA, LeGall J (2000) NatStruct Biol 7:1041–1045
10. Bruschi M, Bovier-Lapierre G, Couchoud P (1976) BiochemBiophys Res Commun 70:615–621
11. Frey M, Sieker L, Payan F, Haser R, Bruschi M, Pepe G,LeGall J (1987) J Mol Biol 197:525–541
12. Beijerink WM (1895) Centralbl Backt II Abt 1 1–9, 49–59,104–114
13. DillingW,CypionkaH (1990) FEMSMicrobiol Lett 71:123–12814. Santos H, Fareleira P, Xavier A, Chen L, Liu MY, LeGall J
(1993) Biochem Biophys Res Commun 195:551–55715. Cypionka H (2000) Annu Rev Microbiol 54:827–84816. Chen L, Liu MY, LeGall J, Fareleira P, Santos H, Xavier AV
(1993) Eur J Biochem 216:443–44817. Gomes CM, Silva G, Oliveira S, LeGall J, Liu MY, Xavier AV,
Rodrigues-Pousada C, Teixeira M (1997) J Biol Chem272:22502–22508
18. LeGall J (1968) Ann Inst Pasteur 114:109–11519. Gomes CM, Vicente JB, Wasserfallen A, Teixeira M (2000)
Biochemistry 39:16230–1623720. Gardner A, Helmick R, Gardner P (2002) J Biol Chem 277:
8172–817721. Gomes CM, Giuffre A, Forte E, Vicente JB, Saraiva LM,
Brunori M, Teixeira M (2002) J Biol Chem 277:25273–2527622. Crowley PB, Otting G, Schlarb-Ridley BG, Canters GW,
Ubbink M (2001) J Am Chem Soc 123:10444–1045323. Ferrat G, Renisio JG, Morelli X, Slootstra J, Meloen R,
Cambillau C, Darbon H (2002) Biochem J 366:415–42224. Giragossian C, Mierke DF (2002) Biochemistry 9:4560–456625. DeLano W (2002) Curr Opin Struct Biol 12:14–2026. Lichtarge O, Sowa M (2002) Curr Opin Struct Biol 12:21–2727. Smith GR, Sternberg M (2002) Curr Opin Struct Biol 12:
28–3528. Camacho CJ, Vajda S (2002) Curr Opin Struct Biol 12:36–4029. Castro G, Boswell CA, Northrup SH (1998) J Biomol Struct
Dyn 16:413–42430. Pearson CPJ, Gross EL (1998) Biophys J 75:2698–271131. Katchalski-Katzir E, Shariv I, Eisenstein M, Friesem A, Aflalo
C, Vakser I (1992) Proc Natl Acad Sci USA 89:2195–219932. Ten Eyck LF, Mandell J, Roberts VA, Pique ME (1995) In:
Hayes A, Simmons ME (eds) Proceedings of the 1995 ACM/IEEE supercomputing conference. ACM Press, New York
33. Vakser IA (1995) Protein Eng 8:371–37734. Gabb HA, Jackson RM, Sternberg JE (1997) J Mol Biol
272:106–12035. Ritchie DW, Kemp GJL (2000) Proteins 39:178–19436. Chen R, Weng Z (2002) Proteins 47:281–29437. Palma PN, Krippahl L, Wampler JE, Moura JJ (2000) Proteins
39:372–38438. Morelli X, Czjzek M, Hatchikian CE, Bornet O, Fontecilla-
Camps JC, Palma NP, Moura JJG, Guerlesquin F (2000) J BiolChem 275:23204–23210
487

39. Morelli X, Dolla A, Czjzek M, Palma NP, Blasco F, KrippahlL, Moura JJG, Guerlesquin F (2000) Biochemistry 39:2530–2537
40. Morelli XJ, Palma NP, Guerlesquin F, Rigby AC (2001)Protein Sci 10:2131–2137
41. Morris G, Goodsell DS, Huey R, Olson AJ (1996) J ComputAided Mol Des 10:293–304
42. Cunha CA, Romao MJ, Sadeghi S, Valetti F, Gilardi G, SoaresCM (1999) J Biol Inorg Chem 4:360–347
43. Matias PM, Saraiva M, Soares CM, Coelho A, LeGall J,Carrondo MA (1999) J Biol Inorg Chem 4:478–494
44. Matias PM, Soares CM, Saraiva LM, Coelho R, Morais J,LeGall J, Carrondo MA (2001) J Biol Inorg Chem 6:63–81
45. Wendoloski JJ, Matthew JB, Weber PC, Salemme FR (1987)Science 238:794–797
46. Guillemette JG, Barker PD, Eltis LD, Lo TP, Smith M, BrayerGD, Mauk AG (1994) Biochimie 76:592–604
47. Ullmann GM, Hauswald M, Jensen A, Kostic NM, Knapp EW(1997) Biochemistry 36:16187–16196
48. Jackson RM, Gabb HA, Sternberg JE (1998) J Mol Biol276:265–285
49. Lamosa P, Burke A, Peist R, Huber R, Liu MY, Silva G,Rodrigues-Pousada C, LeGall J, Maycock C, Santos H (2000)Appl Environ Microbiol 66:1974–1979
50. Goodsell DS, Olson AJ (1990) Proteins 8:195–20251. Solmajer T, Mehler EL (1991) Protein Eng 4:911–91752. Mehler EL, Solmajer T (1991) Protein Eng 4:903–91053. van Gunsteren WF, Billeter SR, Eising AA, Hunenberger PH,
Kruger P, Mark AE, Scott WRP, Tironi IG (1996) Biomolec-ular simulation: the GROMOS96 manual and user guide.BIOMOS, Zurich/Groningen
54. Scott WR, Hunenberger PH, Tironi IG, Marck AE, BilleterSR, Fennen J, Torda AE, Huber T, Kruger P, van GunsterenWF (1999) J Phys Chem A 103:3596–3607
55. Ryckaert JP, Ciccotti G, Berendsen HJC (1977) J Comput Phys23:327–341
56. van Gunsteren WF, Berendsen HJC (1990) Angew Chem IntEd Engl 29:992–1023
57. Berendsen HJC, Postma JPM, van Gunsteren WF, DiNola A,Haak JR (1984) J Chem Phys 81:3684–3690
58. Beratan DN, Onuchic JN (1996) In: Bendall DS (ed) Proteinelectron transfer. Bios, Oxford, pp 23–42
59. Onuchic J (1989) J Chem Phys 92:722–73360. Beratan DN, Skourtis SS (1998) Curr Opin Chem Biol 2:235–
24361. Winkler JR (2000) Curr Opin Chem Biol 4:192–19862. Regan JJ (1994) Greenpath software, v. 0.971. Regan, San
Diego63. Moura I, Moura JJG, Santos MH, Xavier AV, LeGall J (1979)
FEBS Lett 107:419–42164. Storch E, Daggett V (1995) Biochemistry 34:9682–969365. Daizadeh I, Medvedev ES, Stuchebrukhov AA (1997) Proc
Natl Acad Sci USA 94:3703–370866. Illerhaus J, Altschmied L, Reichert J, Zak E, Herrmann RG,
Haehnel W (2000) J Biol Chem 275:17590–1759567. Kimura S, Brower R, Vajda S, Camacho J (2001) Biophys J
80:635–64268. Flock D, Helms V (2002) Proteins 47:75–8569. Meyer TE, Zhao ZG, Cusanovich MA, Tollin G (1993) Bio-
chemistry 32:4552–455970. Wagner MJ, Packer JCL, Howe CJ, Bendall DS (1996) Bio-
chim Biophys Acta 1276:246–25271. Zhen Y, Hoganson CW, Babcock GT, Ferguson-Miller S
(1999) J Biol Chem 274:38032–3804172. Wang K, Zhen Y, Sadoski R, Grinnell S, Geren L, Ferguson-
Miller S, Durham B, Millett F (1999) J Biol Chem 274:38042–38050
73. Sadeghi S, Valetti F, Cunha CA, Romao MJ, Soares CM,Gilardi G (2000) J Biol Inorg Chem 5:730–737
74. Bendall DS (1996), In: Bendall DS (ed) Protein electrontransfer. Bios, Oxford, pp 43–68
75. Hazzard JT, McLendon G, Cusanovich MA, Tollin G (1988)Biochem Biophys Res Commun 151:429–434
76. Nicholls A, Sharp KA, Honig B (1991) Proteins 11:281–29677. Kraulis PJ (1991) J Appl Crystallogr 24:946–95078. Merritt EA, Bacon DJ (1997) Methods Enzymol 277:505–52479. Thomson JD, Higgins DG, Gibson TJ (1994) Nucleic Acids
Res 22:4673–4680
488
Copyright © 2022 FDOKUMEN