Do Religious Beliefs Explain Preferences for Income Redistribution? Experimental Evidence
30
Do Religious Beliefs Explain Preferences for Income Redistribution? Experimental Evidence Ilja Neustadt London Metropolitan Business School, London Metropolitan University, 84 Moorgate, London EC2M 6SQ, United Kingdom, E-mail: [email protected] Abstract Due to the mixed empirical evidence bearing on the economic determinants, beliefs have been at the centre of attention of research into preferences for income redistribution. We elicit preferences for income redistribution through a Discrete Choice Experiment performed in 2008 in Switzerland and relate them to several behavioural determinants, in particular to religious beliefs. Estimated marginal willingness to pay (WTP) is positive among those who do not belong to a religious denomination, and negative otherwise. However, the marginal WTP is shown to increase with a higher degree of religiosity. Moreover, those who state that luck or connections play a crucial role in determining economic success exhibit significantly higher WTP values than those who deem effort to be decisive. (JEL codes: C35, C93, D63, H29) Keywords: Income redistribution, beliefs, religiosity, welfare state, preferences, willingness to pay, discrete choice experiments 1 Introduction Citizens’ preferences with regard to income redistribution are of crucial importance for the political debate as to the future of the welfare state. While the typical right-wing stance is to decry it as excessive, the left points to pockets of poverty even in rich societies that need to be eradicated through more redistribution. This article contributes to this debate by measuring citizens’ willingness to pay (WTP) for income redistribution through a discrete choice experiment (DCE) and relating it to a set of behavioural determinants. The data come from a DCE performed in the autumn of 2008 and involving 979 Swiss citizens. Recently, there has been a great deal of research into the demand for redistribution and its determinants, which will be discussed in Section 2 below. One line of thought relates the measured amount of redistribution to economic, institutional, and behavioural factors. Examples are Alesina and Giuliano (2011) and Akkoyunlu et al. (2009). However, the observed amount of redistribution is the outcome of an interaction between demand and supply, with supply governed by a country’s political institutions and processes. This classical identification problem would have to be addressed in order to make inferences about citizens’ preferences for redis- tribution. A second direction of research, exemplified by Alesina and ß The Author 2011. Published by Oxford University Press on behalf of Ifo Institute for Economic Research, Munich. All rights reserved. For permissions, please email: [email protected] 1 CESifo Economic Studies, 2011, doi:10.1093/cesifo/ifr002 CESifo Economic Studies Advance Access published April 1, 2011 by guest on April 13, 2011 cesifo.oxfordjournals.org Downloaded from
Transcript of Do Religious Beliefs Explain Preferences for Income Redistribution? Experimental Evidence

Do Religious Beliefs Explain Preferences for Income
Redistribution? Experimental Evidence
Ilja Neustadt
London Metropolitan Business School, London Metropolitan University,84 Moorgate, London EC2M 6SQ, United Kingdom,
E-mail: [email protected]
Abstract
Due to the mixed empirical evidence bearing on the economic determinants, beliefs
have been at the centre of attention of research into preferences for income redistribution.
We elicit preferences for income redistribution through a Discrete Choice Experiment
performed in 2008 in Switzerland and relate them to several behavioural determinants,
in particular to religious beliefs. Estimated marginal willingness to pay (WTP) is positive
among those who do not belong to a religious denomination, and negative otherwise.
However, the marginal WTP is shown to increase with a higher degree of religiosity.
Moreover, those who state that luck or connections play a crucial role in determining
economic success exhibit significantly higher WTP values than those who deem effort
to be decisive. (JEL codes: C35, C93, D63, H29)
Keywords: Income redistribution, beliefs, religiosity, welfare state, preferences,
willingness to pay, discrete choice experiments
1 Introduction
Citizens’ preferences with regard to income redistribution are of crucialimportance for the political debate as to the future of the welfare state.While the typical right-wing stance is to decry it as excessive, the left pointsto pockets of poverty even in rich societies that need to be eradicatedthrough more redistribution. This article contributes to this debate bymeasuring citizens’ willingness to pay (WTP) for income redistributionthrough a discrete choice experiment (DCE) and relating it to a set ofbehavioural determinants. The data come from a DCE performed in theautumn of 2008 and involving 979 Swiss citizens.Recently, there has been a great deal of research into the demand for
redistribution and its determinants, which will be discussed in Section 2below. One line of thought relates the measured amount of redistributionto economic, institutional, and behavioural factors. Examples are Alesinaand Giuliano (2011) and Akkoyunlu et al. (2009). However, the observedamount of redistribution is the outcome of an interaction between demandand supply, with supply governed by a country’s political institutionsand processes. This classical identification problem would have to beaddressed in order to make inferences about citizens’ preferences for redis-tribution. A second direction of research, exemplified by Alesina and
� The Author 2011. Published by Oxford University Presson behalf of Ifo Institute for Economic Research, Munich. All rights reserved.For permissions, please email: [email protected] 1
CESifo Economic Studies, 2011, doi:10.1093/cesifo/ifr002
CESifo Economic Studies Advance Access published April 1, 2011 by guest on A
pril 13, 2011cesifo.oxfordjournals.org
Dow
nloaded from

La Ferrara (2005) and Guillaud (2008), relies on surveys designed to meas-ure attitudes toward redistribution. The problem with this approach is itsfailure to impose a budget constraint. It, therefore, cannot predict actualdecision making (e.g. voting at the polls), where citizens take the conse-quences in terms of their own income and wealth into account. A thirdapproach seeks to solve this problem through contingent valuation (CV)experiments [see e.g. Boeri et al. (2001, 2002)].1 The weakness of the CVapproach is that it holds all the attributes of the good in question constant,varying its price only. One would want to vary other attributes of redis-tribution besides its tax price viz., its uses (for health, old age, etc.) and thetype of beneficiary (foreigner, national).In contrast, a DCE allows measurement of preferences uncontaminated
by supply influences, it imposes the budget constraint through the priceattribute, and it does so in a realistic way by making respondents choosebetween alternatives where all attributes are allowed to vary.The remainder of this article is structured as follows. Section 2 contains
a literature review from which hypotheses to be tested are derived. Itsfirst part concerns general determinants of the demand for redistributionand the second, its behavioural determinants, in particular, religiousdenomination, religiosity, and beliefs about the role of luck in achievingeconomic success. Section 3 presents a general description of the methodof DCEs as well as the design of the present experiment. The descriptivestatistics of the experiment follow in Section 4, and hypothesis tests, inSection 5. Section 6 summarises the results and concludes with suggestionsfor future research.
2 Literature review and statement of hypotheses
This section first presents research that defines the general background ofthis article and then moves on to contributions that led to a set of specifichypotheses to be tested.
2.1 General determinants of the demand for income redistribution
In their reviews, Alesina and Giuliano (2011) and Akkoyunlu et al. (2009)identify a wide set of factors that can be categorised as economic, political,and behavioural determinants of the demand for income redistribution.
1 Boeri et al. (2001) study international attitudes toward redistribution with a focus onpension and unemployment schemes in France, Germany, Italy, and Spain by performingCV experiments that impose an explicit trade-off between income and social insurancecoverage on respondents. They find that people oppose an extension of the welfare state,with conflicts between young and old, rich and poor, and insiders and outsiders creatingsignificant hurdles to welfare reform.
page 2 of 30 CESifo Economic Studies, 2011
I. Neustadt
by guest on April 13, 2011
cesifo.oxfordjournals.orgD
ownloaded from

The simplest framework for the analysis of purely economic determin-ants is provided by a model focusing on the current economic well-being,originally proposed by Romer (1975) and Roberts (1977) and extendedby Meltzer and Richard (1981) [RRMR model]. This model assumesnon-altruistic utility-maximizing individuals differentiated by theirincome levels only. The government pays a lump-sum transfer to allcitizens, financed by a linear uniform income tax. Individuals with anincome below the mean favour taxation and transfers while those withan income above the mean oppose it. In a political equilibrium, the major-ity of voters supports a positive tax rate corresponding to the value desiredby the median voter. The model’s prediction is that the larger the gapbetween the mean and the median income, the higher the level of taxationand redistribution.The empirical evidence is quite mixed. On the one hand, Alesina and
Rodrik (1994), Persson and Tabellini (1994), and Milanovic (2000) findsome supporting evidence. Furthermore, Guillaud (2008), conducting across-section analysis of survey data from four European Union (EU)countries, shows that poorer and less educated individuals are more infavour of redistribution. On the other hand, Alesina and Glaeser (2004),Perotti (1996), and Rodriguez (1999) fail to find supporting evidence forthis model. Moreover, Neustadt and Zweifel (2009) relate WTP forincome redistribution elicited from a DCE (see Section 3.1 for details)to measures of economic well-being. WTP values are negatively relatedto income and education, contradicting the RRMR model.Another economic explanation is the ‘Prospect of Upward Mobility’
(POUM) hypothesis, suggested by Hirschman and Rothschild (1973)as the ‘tunnel effect’ and more recently reformulated by Benabou andOk (2001). It extends the RRMR model by introducing individuals’expectations, based on their observations regarding the income mobilityof others in a society. Expected upward mobility may dampen a poor butforward-looking voter’s enthusiasm for income redistribution.Empirical support of the POUM hypothesis is provided by Alesina and
La Ferrara (2005) who, using an actual mobility matrix for the UnitedStates, show that people who can expect high future income oppose redis-tribution. Rainer and Siedler (2008) use probabilistic expectations data toshow that individuals with a sufficiently large chance of occupationalupward mobility exhibit a lower demand for redistribution; conversely,those with a sufficiently large risk of occupational downward mobility optfor more redistribution. Checchi and Filippin (2004), testing the POUMhypothesis by means of a within-subjects experiment, find corroboratingevidence under several alternative specifications. According to Guillaud(2008), however, individuals who subjectively experienced upwardmobility over 10 years tend to be more (rather than less) supportive of
CESifo Economic Studies, 2011 page 3 of 30
Religious Beliefs and Preferences for Redistribution
by guest on April 13, 2011
cesifo.oxfordjournals.orgD
ownloaded from

redistributive policies. Moreover, upward intergenerational mobility inoccupational prestige goes along with more positive rather than negativeattitude toward redistribution. Alesina and Giuliano (2011) examine theempirical evidence for USA and briefly across countries, concluding thatsocial mobility (if measured as the change in the occupational prestige)does decrease demand for redistribution once sociodemographic (age,gender, race) and socioeconomic characteristics (income, education) arecontrolled for. In their DCE-based study, Neustadt and Zweifel (2009)relate preferences for redistribution to mobility. They find partial empir-ical support for the POUM hypothesis.Another economic explanation, suggested by the social contract litera-
ture, is that preferences for redistribution can at least in part be interpretedas a demand for insurance by risk-averse individuals. In a hypotheticalsituation, where individuals do not yet know their endowment as well astheir future position in society [‘veil of ignorance’, cf. Rawls (1999)], theyare predicted to exhibit positive WTP for an income transfer from morefavourable future states to less favorable ones. Redistributive policies canthus be interpreted as reflecting this hypothetical demand for insurance.Beck (1994) investigates individual behaviour under the ‘veil of ignorance’in an experiment. By placing participants in a hypothetical society withrandom differences in income, represented by lotteries, he is able to derivethe desired amount of income redistribution. Individuals indeed displayrisk aversion, albeit not of the extreme kind implied by the Rawlsianmaximin rule that uses the maximum improvement of the individualwith minimum initial wealth as the sole criterion. Furthermore, theyshow no preference for income redistribution in excess of what can beexplained by risk aversion.As to the political determinants of the demand for income redistribution,
literature on political economy (Persson and Tabellini 2000, 2003; Lizzeriand Persico 2001; Milesi-Ferretti et al. 2002) predicts that proportionalrepresentation tends toward universal programs benefitting variousgroups (old-age pensioners, working poor, minorities, etc.), while majorityrule results in targeted ‘pork barrel’ programs. Persson and Tabellini (2003)find supporting empirical evidence in that countries with proportional rep-resentation have gross domestic product (GDP) shares of governmentexpenditure that ceteris paribus are 5 percentage points higher than coun-tries with majority rule. Moreover, Akkoyunlu et al. (2009) present weakevidence of a positive correlation between the degree of proportional rep-resentation and the transfer share in GDP in Organisation for EconomicCo-operation and Development (OECD) member countries. Additionalpolitical determinants of redistribution include two-party versus multipartysystem, presidential versus parliamentary democracy, and direct versus rep-resentative democracy, with two-party systems, presidential, and direct
page 4 of 30 CESifo Economic Studies, 2011
I. Neustadt
by guest on April 13, 2011
cesifo.oxfordjournals.orgD
ownloaded from

democracies all predicted to induce less public redistribution. In order tosketch the institutional background of the DCE described in Section 3.2,Switzerland can be described as follows. It has a high degree of proportionalrepresentation and a parliamentary democracy. Its distinguishing feature,however, is its extensive direct democratic control in the guise of popularinitiatives and referenda. This might serve to limit public welfare spendingwhile enforcing efficiency in redistribution (cf. Feld et al. 2007).The mixed empirical evidence bearing on the economic determinants
of preferences for redistribution calls for a detailed analysis of theirbehavioural determinants. In particular, beliefs have been at the center ofattention. The theoretical base is laid by Alesina and Angeletos (2005), whodevelop amodelwhere society’s belief as towhether effort or luckdetermineseconomic success gives rise to multiple self-fulfilling equilibria. Benabouand Tirole (2006) propose a model for the emergence and persistence ofsuch collective beliefs. Moreover, beliefs can be seen as a source of altruisticpreferences and inequality aversion. On the empirical side, Fong (2001)presents evidence in line with Alesina and La Ferrara (2005), suggestingthat beliefs about the role of luck in determining economic success are animportant determinant of the demand for redistribution. She also considersthe effects of incentives. If effort determines income, then an increasedincome tax rate causes an output loss due to its effect on incentives. Thisconsideration is hypothesised to qualify the link between beliefs and thedemand for redistribution.However, the data fail to support this hypothesis.While the POUM hypothesis suggests less redistribution than predicted
by the RRMR model, the assumption of altruistic preferences can lead tothe opposite prediction. In fact, if individuals care also about the utilityof others, one might expect more redistribution than predicted by theconventional RRMR model. Fehr and Schmidt (2006) provide a reviewof several models of social preferences, in particular, altruism, envy,inequality aversion, fairness, and reciprocity. In a simple model of inequal-ity aversion, it is assumed that individuals feel envy if their incomes arebelow than that of others but they feel altruistic when their income exceedsit. Consequently, the decisive median voter demands more redistributionthan in the conventional RRMR model.Based on the assumption of inequality aversion, Neustadt and Zweifel
(2010) formulate two hypotheses to be tested. The first predicts that thecitizens with higher inequality aversion exhibit a positive WTP for redis-tribution while those with lower inequality aversion, a negative one. Thesecond hypothesis is based on the consideration that voters exhibitinginequality aversion tend to support the view that the government shouldreduce the income gap between rich and poor. Consequently, respondents,who state that the reduction of the income gap is a task of the government,are expected to exhibit a positive WTP for redistribution.
CESifo Economic Studies, 2011 page 5 of 30
Religious Beliefs and Preferences for Redistribution
by guest on April 13, 2011
cesifo.oxfordjournals.orgD
ownloaded from
2.2 Religious beliefs and demand for income redistribution
There exists a great deal of theoretical literature dealing with religiousbeliefs as a determinant of demand for income redistribution, all ofthem predicting a negative relationship between the degree of religiosityand demand for income redistribution.In particular, Benabou and Tirole (2006) develop a theory of collective
beliefs, based on endogenous complementarities between individual cog-nitive choices that arise naturally from the interaction of psychologicalmotives and economic rationality. In a simple model, they analyse animportant class of religious beliefs that are linked to the ‘Protestantwork ethic’, namely to a belief that there is a world to come, in whichrewards and punishments depend on the effort and industriousness of aperson during his lifetime.2 Alternative beliefs can be of two kinds: (i) abelief that there is no afterlife (atheism or agnosticism); (ii) a belief thatthere is afterlife but its rewards are not related to efforts in the currentworld but might be subject to observance of commandments, good deedstowards other people, etc. Thus, the more religious (in the sense of the‘Protestant work ethic’) a citizen is, the more effort he exerts. Thus, a morereligious individual prefers lower tax rates in order to avoid income redis-tribution in favor of the less religious citizens who do not work as hard.If a low tax rate decided upon by a majority of religious citizens is antici-pated by the population, individuals become more religious since the beliefthat hard work leads to rewards in afterlife generates higher utility givenlow income redistribution. Conversely, if a majority of citizens whohappen to be less religious vote for a high level of redistribution, it canbecome profitable to invest in the non-religious beliefs and thus to exertless effort. In sum, two equilibria are possible:
(i) An equilibrium with a high level of religiosity in the sense of the‘Protestant work ethic’, implying a high level of work effort and alow level of income redistribution.
(ii) An equilibrium with a low level of religiosity or a predominance ofnon-Protestant beliefs, implying a low level of work effort and a highlevel of income redistribution.
Moreover, Scheve and Stasavage (2006a,b) propose a model of religiousparticipation as a substitute for insurance against adverse events.Therefore, risk-averse religious individuals desire less demand for redistri-bution as a collective insurance device, resulting again in a negativepredicted relationship between religiosity and redistribution.
2 cf. Weber (1920).
page 6 of 30 CESifo Economic Studies, 2011
I. Neustadt
by guest on April 13, 2011
cesifo.oxfordjournals.orgD
ownloaded from

A further strand of literature, based on preferences rather than
beliefs, argues that public redistribution crowds out religious partici-
pation and charitable activities, giving one more rise to a negative
correlation. Hungerman (2005) and Gruber and Hungerman (2007)
find evidence that public insurance spending indeed crowds out reli-
gious charitable spending. Akkoyunlu et al. (2009) empirically relate
the amount of public social expenditure to the strength of religious
orientation for the OECD countries. They show that the partial cor-
relation between religiosity and the share of transfers in GDP is
clearly negative, supporting the theories expounded above. Moreover,
Switzerland shares the somewhat guarded attitudes prevailing in the
EU rather than the highly religious attitudes of the US population.
Being located close to the regression line, Switzerland provides add-
itional evidence supporting the theoretical arguments relating religion
to redistribution.Based on the theoretical arguments of Benabou and Tirole (2006) and
Scheve and Stasavage (2006a,b), we formulate two hypotheses to be tested
in Section 5.2. The first predicts that members of Protestant churches
exhibit a negative WTP for redistribution while members of other denom-
inations (who do not share the Protestant work ethic but still strongly
participate in and profit from private charity), exhibit a higher but still
a negative one. In contrast, citizens with no affiliation at all who presum-
ably share atheistic or agnostic beliefs are predicted to exhibit a strictly
positive WTP for redistribution. The second hypothesis predicts the WTP
for redistribution to fall with a higher level of religiosity of the individual,
alternatively measured as
(i) strength of the belief in God or(ii) frequency of attending religious services.
Hypothesis 1: Willingness to pay for redistribution is expected to be
(A) negative if the individual belongs to a Protestant church,(B) negative but less so than in (A) if the individual belongs to a religious
denomination other than Protestant,(C) positive if the individual is unaffiliated.
Hypothesis 2: Willingness to pay for redistribution is expected to decrease
with
(a) a stronger belief in God,(b) more frequent attendance of religious services.
CESifo Economic Studies, 2011 page 7 of 30
Religious Beliefs and Preferences for Redistribution
by guest on April 13, 2011
cesifo.oxfordjournals.orgD
ownloaded from

2.3 Beliefs about the role of luck and effort and demand for
income redistribution
The Benabou-Tirole model (see Section 2.2) suggests that beliefs about the
role of effort in determining economic success or intertemporal utility are
an important determinant of the preferences for redistribution. The con-
viction that high income and wealth are the result of work effort (belief
in a just world) goes along with a low level of income redistribution.
Conversely, a society that believes that luck, connections, social capital
inherited from one’s parents, and corruption (realistic pessimism) deter-
mine income and wealth is expected to choose a high degree of redistri-
bution, financed by high taxes, see also Alesina and Glaeser (2004) and
Alesina and Angeletos (2005). In their model of collective beliefs, Benabou
and Tirole (2006) derive two possible equilibria with respect to the belief
in a just world:
(i) An equilibrium with optimistic beliefs in a just world and a laissez-
faire society arises in a population where the majority of citizens tries
to ignore discouraging news about the efficacy of the individual
effort. In turn, the majority chooses a relatively low tax rate with
little redistribution and thus has strong incentives to believe that
the world is indeed just.(ii) An equilibrium with pessimistic beliefs and a welfare state arises in a
population where the majority takes seriously all discouraging news
about the efficacy of the individual effort. Thus, the majority chooses
a high tax rate with a high level of redistribution.
Empirical evidence suggests that beliefs sharply differ between USA and
EU. Most Americans believe that anyone can get out of poverty by hard
work and that the poor remains poor only because they refuse to make the
effort. In contrast, Europeans generally think that poverty is due to bad
luck and not the individual’s responsibility. Fong and Oberholzer-Gee
(2011) measure the WTP for justice in USA using dictator games.
Dictators were given $10 to split between themselves and recipients. The
authors find that one-third of the dictators are willing to pay 1 out of 10
dollars for obtaining the information whether poverty was due to disabil-
ity or substance abuse. Finally, Alesina and Giuliano (2011) show that a
history of misfortune in the recent past such as unemployment and
personal trauma makes people more risk averse and less optimistic
about upward mobility. These changes in beliefs are found to have a
positive and significant effect on redistribution.Therefore, the Benabou-Tirole model suggests that equilibrium (i) with
a laissez-faire society is likely to persist in USA while equilibrium (ii) with
page 8 of 30 CESifo Economic Studies, 2011
I. Neustadt
by guest on April 13, 2011
cesifo.oxfordjournals.orgD
ownloaded from

a full-fledged welfare state is sustainable in Europe. Akkoyunlu et al.(2009) relate the amount of public social spending to a score that ranges
from 1 (hard work always brings a better life) to 10 (hard work doesnot bring any success) using data from OECD countries. The US scoreis closest to 1 but lies below the regression line, while Germany and
Denmark mark the other extreme. Again, as in the case of religiosity,this regression is one of two best-fitting bivariate regressions designed to
explain the share of transfers in GDP. Here again, Switzerland as a testcase lies right near the regression line, lending additional support to thehypothesis.Based on the presented literature review, we state Hypothesis 3 to be
tested in Section 5.2 as follows.
Hypothesis 3: Willingness to pay for redistribution is expected to increasewith a stronger individual belief that luck rather than effort determine
economic success.
3 Discrete choice experiments
3.1 Theoretical foundations
DCEs provide a tool for measuring individuals’ preferences for character-istics of commodities, the so-called attributes. In contradistinction to clas-
sical Revealed Preference Theory, originating with Samuelson (1938),DCEs allow individuals to express their preferences for non-marketed as
well as hypothetical products. During a DCE, respondents are repeatedlyasked to compare the status quo with several hypothetical alternativesdefined by their attributes including a price. By varying the levels of
attributes, different product alternatives are generated. A rational individ-ual will always choose the alternative with the highest utility. From theobserved choices, the researcher can infer the utility associated with the
attributes. The proposed method, derived from the New Demand Theoryof Lancaster (1971), is also known as Conjoint Analysis (Louviere et al.2000).The most prominent alternative to a DCE is CV. A certain situation
or product is described in detail, and respondents are asked to indicatetheir maximum WTP for this fixed product. Only its price attribute isvaried, while in Conjoint Analysis all relevant attributes are varied simul-
taneously, making it a multiattribute valuation method (Merino-Castello2003). While a DCE describes the product in less detail than a typical CVstudy, it allows for analysing many product varieties by varying the levels
of relevant attributes (Louviere et al. 2000, p. 344). Trade-offs amongattributes can be explicitly taken into account and WTP values of
CESifo Economic Studies, 2011 page 9 of 30
Religious Beliefs and Preferences for Redistribution
by guest on April 13, 2011
cesifo.oxfordjournals.orgD
ownloaded from
attributes are estimated separately (see below). Furthermore, strategicbehaviour of respondents is less likely than in CV with its exclusiveemphasis on price, which facilitates strategic behaviour. Finally, biasesthat easily occur when individuals are directly asked about their WTPare less frequently observed in a DCE (Ryan 2004).A particular advantage of a DCE in the present context is that it permits
to explicitly impose the budget constraint through a price attribute in theguise of the tax share of income used to finance the transfers considered.Respondents can be made to simultaneously choose this share, and hencethe ‘size of the pie’ and the ‘slices of the pie’ devoted to different typesof recipients and uses (health, old age, etc.; see Exhibits No. 1–3 inAppendix A). Thus, trade-offs among different attributes of the redistri-bution plan can be calculated to assess the relative importance of therespective redistributive goals.The econometric method used is based on the Random Utility Theory
(see Luce 1959; Manski and Lerman 1977; and McFadden 1974, 1981,2001). Individual i values alternative j according to the utility Vij attained,which is given by
Vij ¼ viðaj; pj; yi; si; "ijÞ: ð1Þ
Here, vi (�) denotes i ’s indirect utility function, aj, the amount of attributesassociated with alternative j, and pj, price. The individual’s income andsociodemographic characteristics are symbolised by yi and si, respectively.Finally, "ij denotes the error term, which is due to the fact that the experi-menter will never observe all the arguments entering vi, imparting a sto-chastic element to observed choices. As usual, the utility function isadditively split into a systematic component w(�) and a stochastic one,
Vij ¼ wiðaj; pj; yi; siÞ þ "ij:
A utility-maximising individual i will prefer alternative j to alternative l ifand only if
wiðal; pl; yi; siÞ þ "il � wiðaj; pj; yi; siÞ þ "ij: ð2Þ
Due to the presence of the stochastic term, only the probability Pij ofindividual i choosing alternative j rather than alternative l can be esti-mated, with
Pij ¼ Prob wiðal; pl; yi; siÞ þ "il � wiðaj; pj; yi; siÞ þ "ij� �
ð3Þ
¼ Prob "il � "ij � wiðaj; pj; yi; siÞ � wiðal; pl; yi; siÞ� �
: ð4Þ
Thus, the probability of choosing j amounts to the probability of thesystematic utility difference wi [ j ]�wi [ l ] dominating the ‘noise’, "il� "ij.
page 10 of 30 CESifo Economic Studies, 2011
I. Neustadt
by guest on April 13, 2011
cesifo.oxfordjournals.orgD
ownloaded from

The error terms {"il, "ij} can be assumed to be normally distributed withmean zero and variances �2l and �2j as well as covariance �lj. Under theseassumptions, ’ij9 "il� "ij is also normally distributed with mean zero andvariance �2 :¼ Var½’ij� ¼ �
2l þ �
2j � 2�lj. Thus, Equation (4) can be repre-
sented as
Pij ¼ �wiðaj; pj; yi; siÞ � wiðal; pl; yi; siÞ
�
� �; ð5Þ
where �(�) denotes the cdf of a standard normal distribution. This modelis known as the binary probit model [cf. Ben-Akiva and Lerman (1985)].Hensher et al. (1999) provide empirical evidence that a linear specificationof the function w(�) leads to good predictions in its middle ranges.Therefore, in the case of the simple model that relates utilities andchoice probabilities to the attributes only (see Section 5.1), one posits
wiðaj; pj; yi; siÞ ¼ ci þXKk¼1
�kakj þ "ij; ð6Þ
where ci represents an individual-specific constant; ak, k¼ 1, . . . ,K, are theattributes of the alternative; and �k, k¼ 1, . . . ,K, are the parameters to beestimated. These parameters can be interpreted as the constant marginalutilities of the corresponding attributes. One obtains the following expres-sion representing the difference in utility of individual i between alterna-tive j and status quo,
�Vij ¼ ci þXKk¼1
�k�akj þ �p�pj þ ’ij; ð7Þ
where �akj¼ akj� alj, �pj¼ pj� pl, ci¼ cil� cij, and ’ij¼ "il� "ij for eachj 6¼ l. The marginal rate of substitution between two attributes m and nis given by
MRSm;n ¼ �@v=@am@v=@an
: ð8Þ
where v(�) denotes the indirect utility function. Therefore, the marginalWTP for attribute am can be calculated by dividing the marginal utility ofthis attribute by the marginal utility of the price attribute (in the presentcontext, the income tax rate, see e.g. Telser 2002, p. 56):
MWTPðamÞ ¼@v=@am@v=@pj
: ð9Þ
For econometric inference, it is important to recall that the sameindividual makes several choices. The two-way random-effect specification
CESifo Economic Studies, 2011 page 11 of 30
Religious Beliefs and Preferences for Redistribution
by guest on April 13, 2011
cesifo.oxfordjournals.orgD
ownloaded from

takes this into account with ’ij¼�iþ �ij, where �i denotes the component
that varies only across individuals but not across the choice alternatives.
The terms �i and �ij are assumed uncorrelated with the product
attributes (ai1, . . . , aiK) and between themselves. By a standard assump-
tion in a probit model, ��¼ 1. Hence, Var½’ij� ¼ �2� þ �
2� ¼ 1þ �2� and
Corr½’ij; ’il� ¼�2�
1þ�2�¼: �. The parameter � indicates how strongly the
various responses of an individual are correlated with each other, or,
equivalently, the share of the total variance that can be explained by
individual-specific error term. The random-effects specification is justified
if � is high and significant.The simple model can be extended by including various socioeconomic
variables (e.g. income group, level of education, social mobility).
These variables need to be interacted with the product attributes as
well as with the constant, giving rise to the extended model specification
which allows to check for preference heterogeneity and thus to test
Hypotheses 1–3 in Section 5.2. By means of a t–test, we can investigate
whether the differences in marginal WTP values between different
socioeconomic groups are statistically significant. The computation of
the variance of the marginal WTP values is performed by the delta
method, cf. Hole (2007).
3.2 Experimental design
The experiment was conducted with a representative sample of 979 adult
Swiss respondents in the autumn of 2008. Initially, the respondents were
provided with full decision sets including graphical representations of the
status quo and alternatives and were asked to submit their binary choices
during a telephone survey. In order to make sure that decisions were based
on a homogeneous information set and made in a consistent way, the
respondents additionally received a detailed description of the attributes
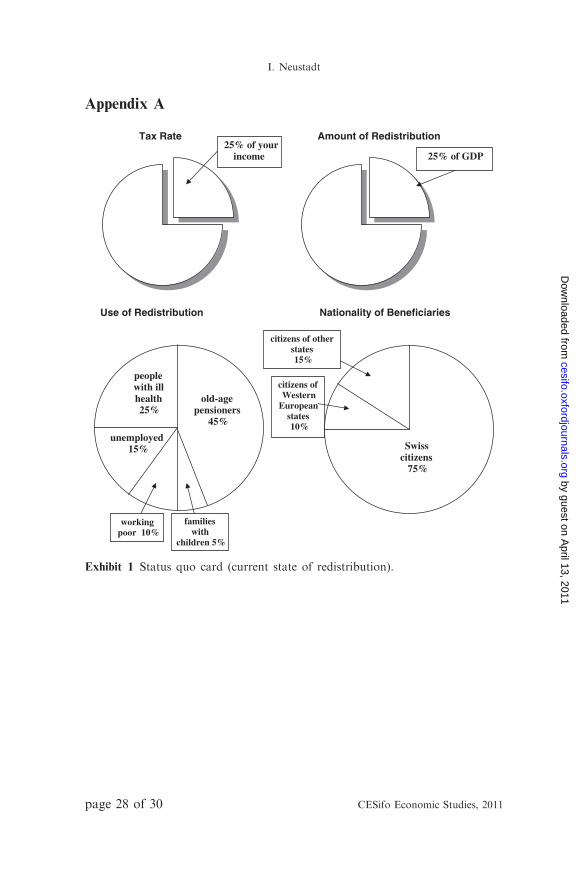
and their possible realizations. The Appendix A shows the graphical
representation of the status quo (Exhibit 1) and two selected alternatives
(Exhibits 2 and 3). The data collection followed in a telephone survey
some days later and additionally included a questionnaire covering a
wide range of socioeconomic and behavioural characteristics of the
respondents.Prior to the experiment, the attributes and their levels used to define
‘income redistribution’ had been checked in two pretests for their rele-
vance. Attributes form four groups (Table 1).
(1) Shares of the total redistribution budget to be spent on five types of
recipients (viz., the working poor, the unemployed, old age pensioners,
families with children, and people with ill health);
page 12 of 30 CESifo Economic Studies, 2011
I. Neustadt
by guest on April 13, 2011
cesifo.oxfordjournals.orgD
ownloaded from

(2) shares of the total redistribution budget to be spent on threegroups (viz., Swiss citizens, western European foreigners, and otherforeigners);
(3) total amount of redistribution, defined as a share of GDP; and(4) personal income tax rate to be paid by the respondent (the price
attribute).
Clearly, these attributes and their levels combine to form a total numberof possible scenarios that cannot be realised in an experiment. The scen-arios define the n rows of the observation matrix X, with associated covari-ance matrix �¼ �2(X0X)�1 of parameters � to be estimated. So-calledD-efficient design calls for the minimization of the geometric mean ofthe eigenvalues of �,
D efficiency ¼ �j j1K
� ��1
where K denotes the number of parameters to be estimated (cf. Carlssonand Martinsson 2003). Using this optimization procedure and incorporat-ing several restrictions, the number of alternatives was reduced to 35 andrandomly split into five groups. One alternative was included twice in eachdecision set for a consistency test, resulting in eight binary choices perrespondent.
Table 1 Attributes and their levels
Attribute Label Status quo
level (%)
Alternative
levels (%)
Shares of benefits going to
Working poor W_POOR 10 5, 15Unemployed UNEMP 15 5, 25Old-age pensioners PENS 45 35, 55Families with children FAM 5 10
People with ill health ILL 25 20, 30Shares of benefits going toSwiss citizens SWISS 75 60, 85
Western Europeanforeigners
WEU_FOR 10 5, 20
Other foreigners OTH_FOR 15 10, 20
Total amount ofredistribution
REDIST 25 (of GDP) 10, 20, 30, 40, 50
Income tax TAX 25 (of personal
income)
10, 15, 40
CESifo Economic Studies, 2011 page 13 of 30
Religious Beliefs and Preferences for Redistribution
by guest on April 13, 2011
cesifo.oxfordjournals.orgD
ownloaded from

In order to make sure that decisions were based on a homoge-
neous information set and made in a consistent way, respondents
were provided with a detailed description of the attributes and their
possible realizations. The Appendix shows the graphical representation
of the status quo (Exhibit 1) and two selected alternatives (Exhibits 2
and 3).
4 Descriptive statistics
4.1 Socioeconomic characteristics
The sample consists of 979 respondents, 70% of them residing in the
German-speaking part and 30% in the French-speaking part of
Switzerland. Some 94% respondents were born in the country, 50% are
men, 20% having a monthly income below Swiss francs (CHF) 2000 and
23%, above CHF 6,000, reflecting the structure of the Swiss population.
However, only 1.5% of the respondents are unemployed.Thirty-nine percent of the respondents are members of the Roman
Catholic Church while 51% belong to the Reformed Church.3 An add-
itional 2% are members of other religious denominations while 8% are
not affiliated (Table 2). As to the strength of religious beliefs, 39% indi-
cated no or weak belief in God as well as moderate belief while 22%
of respondents claimed to have a strong or a very strong belief in God
(Table 3). Moreover, 27% of respondents attended a religious service at
least once in the last month. Individuals’ shares whose last service attend-
ance was 1–2 months ago and 3–6 months ago made up 27 and 22%,
respectively (Table 4). Finally, 24% stated not having attended a service
within the last 6 months. However, the number of missing answers with
109 is unusually high, probably due to the fact that many individuals who
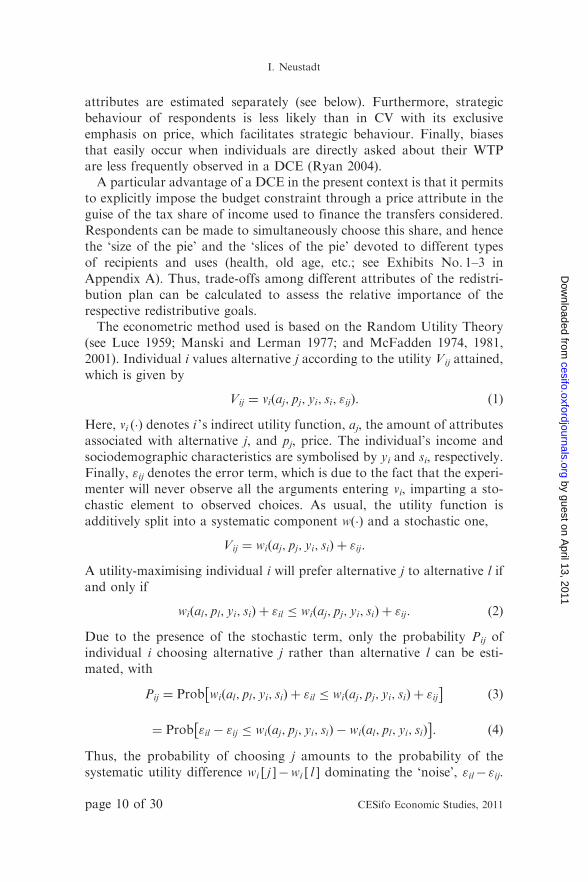
never attended a religious service preferred to refuse their answers.Table 5 shows the distribution of answers to the question, ‘Is work effort
or luck and connections more important for economic success?’, with step
1 indicating the belief that work effort alone determines success, and step
10, the opposite belief that work effort does not matter at all. The majority
of respondents seem to believe in the role of effort. In fact, 25% of
respondents placed themselves on steps 1 or 2, 23%, on step 3, and
16%, on step 4. As much as 24% chose step 5 while only 12% placed
themselves on steps 6–10.
3 Largest Protestant denomination in Switzerland.
page 14 of 30 CESifo Economic Studies, 2011
I. Neustadt
by guest on April 13, 2011
cesifo.oxfordjournals.orgD
ownloaded from

Table 2 Religious denomination of the respondents
No. % of valid answers
Religious denominationRoman Catholic Church 383 39
Reformed Church 494 51Unaffiliated 80 8Other 19 2
Total valid answers 976 100
Missing 3Sample 979
Table 3 Level of respondents’ religiosity measured as strength of their beliefin God
No. % of valid answers
Strength of the belief
No or weak belief 382 39Moderate belief 384 39Strong or very strong belief 209 22
Total valid answers 975 100Missing 4Sample 979
Table 4 Level of respondents’ religiosity measured by time of their last attendanceof a religious service
No. % of valid answers
Last attendance
<1 month ago 236 271–2 months ago 193 223–6 months ago 236 27
>6 months ago 205 24Total valid answers 870 100Missing 109Sample 979
CESifo Economic Studies, 2011 page 15 of 30
Religious Beliefs and Preferences for Redistribution
by guest on April 13, 2011
cesifo.oxfordjournals.orgD
ownloaded from
4.2 Respondents’ choice behaviour
There is a total of 979�8¼ 7 832 decisions, of which not quite 20% weremade in favour of an alternative over the status quo (Table 6). There are atleast three explanations for this low percentage. First, in spite of checkingin the pretests, the levels of the attributes in the experiment may not havebeen sufficiently spaced apart to make respondents switch. Secondly, someattributes (e.g. benefits going to the unemployed; Table 8) may not havebeen important enough to cause a switch. Finally, there may be errors indecision making because the consistency test revealed 14% of choices to beinconsistent. However, there may simply be marked status quo bias in theface of highly complex decision-making situations, as suggested by thelarge negative constant in Table 8. Nonetheless, only 21% of respondentsnever opted for an alternative (Table 7). Conversely, almost 80% departedfrom the status quo at least once.
5 Estimation results
5.1 Simple model: preferences of an average respondent
Estimation of Equation (7) includes REDIST2 to allow for a possiblenon-linearity of the indirect utility function with regard to the GDP
Table 5 Belief whether effort or luck determine economic success on a scale
from 1 to 10
No. % of valid answers
Steps 1 to 2 247 25Step 3 226 23
Steps 4 to 5 389 40Steps 6 to 10 112 12Total valid answers 974 100
Missing 5Sample 979
Step 1 indicates the belief that only effort determines success, step 10 indicates the belief
that only luck determines success
Table 6 Total number of choices
Choices No. Percentage
For alternative 1562 19.94For status quo 6088 77.73No decision 182 2.32
Total 7832 100
page 16 of 30 CESifo Economic Studies, 2011
I. Neustadt
by guest on April 13, 2011
cesifo.oxfordjournals.orgD
ownloaded from

share of redistribution REDIST. Moreover, the fact that uses and types ofbeneficiaries add up to 100% needs to be taken into account (Table 1).In order to avoid perfect multicollinearity, PENS (Pensioners) andOTH_FOR (other foreigners) were dropped to obtain
�V ¼ c0 þ �1W POORþ �2UNEMPþ �3ILLþ �4FAM
þ �1SWISSþ �2WEU FOR
þ �1REDISTþ �2REDIST2 þ �TAXþ ’
ð10Þ
Table 7 Distribution of the number of chosen alternatives per respondent
No. of choices for alternative No. Percentage
0 209 21.351 309 31.56
2 226 23.083 131 13.384 57 5.825 16 1.63
6 10 1.027 0 0.008 5 0.51
Total valid answers 965 98.57Missing 14 1.43Sample 979 100
Table 8 Random effects probit estimates for the simple model
Variable Coeff. Std. err. z P>|z| Marg. eff.
Recipients’ social groupW_POOR 0.02784 0.00714 3.90 0.000 0.00697UNEMP 0.01134 0.00452 2.51 0.012 0.00284
ILL 0.01600 0.00463 3.46 0.001 0.00400FAM 0.06378 0.00942 6.77 0.000 0.01596
Recipient’s nationalitySWISS 0.03656 0.00552 6.63 0.000 0.00915
WEU_FOR 0.02925 0.00869 3.37 0.001 0.00732REDIST �0.00523 0.00176 �2.97 0.003 �0.00131REDIST2
�0.06619 0.01174 �5.64 0.000 �0.01656
TAX �0.02053 0.00183 �11.21 0.000 �0.00514CONSTANT �1.29878 0.06132 �21.18 0.000 n.a.
# observations¼ 7,650; Log likelihood, �3,566.76; 2(0)¼ 108.87; Prob>2, 0.000;
�u¼ 0.41610; �¼ 0.14759.
CESifo Economic Studies, 2011 page 17 of 30
Religious Beliefs and Preferences for Redistribution
by guest on April 13, 2011
cesifo.oxfordjournals.orgD
ownloaded from

Estimation of a few of the 5 � 3¼ 15 specifications with alternative exclu-sions produced results similar to those displayed in Table 8. Specifically,they agree that alternatives with additional redistribution are chosen witha lower probability [for details with regard to ‘slices’ of the pie, seeNeustadt and Zweifel (2011)]. Also, note the sizeable and highly signifi-cant coefficient of the price attribute TAX, which is important for theestimation of marginal willingness-to-pay (MWTP) values [see Equation(9)]. For redistribution, the MWTP value is given by
MWTPREDIST ¼@�V=@REDIST
@�V=@TAX¼ �
�1 þ 2�2REDIST
�ð11Þ
This amounts to �0.25 percentage points of income share per additionalpercentage point of GDP devoted to redistribution in excess of the statusquo. Evaluated at the mean personal income of the sample, this equalsCHF �11.78 per month. However, this figure is dwarfed by the compen-sation one would have to pay respondents to depart from the status quo,amounting to an estimated 63% of their monthly income, or 5.27% oftheir annual income [see the large negative constant in Table 8].Neustadt and Zweifel (2010) construct the (quadratic) WTP function
and show that it attains a maximum at 21.05% of GDP, definitelybelow the current value of 25%. Therefore, they argue that Swiss welfarestate is too big in the light of average citizens’ preferences.
5.2 Extended model: preference heterogeneity
5.2.1 Religious denomination and preferences for redistribution
The simple model is now extended by including dummies for the religiousdenomination (Table 2). The four levels of this variable are represented bythree dummy variables, REF, CATH, and OTH_DEN. For instance, theformer is defined as
CATH ¼1 if the respondent belongs to the Catholic Church,0 otherwise:
�
The reference category is UNAFF (unaffiliated), indicating that therespondent does not belong to a religious denomination. Since an attri-bute’s marginal utility may vary with religious denomination, Equation(10) is modified to also contain interaction terms involving the denomin-ation variables, resulting in
�V 0 ¼ c00 þ � � � þ 01CATHþ � � � þ 02REDISTþþ03REDIST
2 þ � � �
þ �02REDIST � CATHþ �03REDIST2 � CATHþ � � �
þ �04REDIST � REFþ �05REDIST2 � REF
þ �06REDIST � OTH DENþ �07REDIST2 � OTH DENþ � � � þ ’0:
page 18 of 30 CESifo Economic Studies, 2011
I. Neustadt
by guest on April 13, 2011
cesifo.oxfordjournals.orgD
ownloaded from

Hypothesis 1(A) states that the demand for redistribution is expectedto be negative for the respondents belonging to the Reformed Church. Itis confirmed, with the MWTP for 1 percentage point increase of the totalamount of redistribution being a negative CHF �15.44 (Table 9).Hypothesis 1(B), stating that Catholics exhibit a negative demand forredistribution that is, however, higher than that of the Protestants is con-firmed, too. However, a t-test shows that the difference in MWTP valuesbetween these two religious groups is statistically not significant. Further,Hypothesis 1(C), predicting the demand for redistribution of unaffiliatedcitizens to be positive finds strong empirical support with the correspond-ing MWTP of CHF 37.77 for 1 percentage point increase of the totalamount of redistribution. Moreover, t-tests confirm that MWTP valuesof the unaffiliated individuals on the one side and Catholics or Reformedon the other side are significantly different (with t-values of 4.35 and 3.97,respectively).
5.2.2 Religiosity and preferences for redistribution
In this section, the simple model is extended by one of the two measuresof religious participation by including the corresponding dummies(Tables 3 and 4). For instance, in the case of the strength of religiousbeliefs, the three levels of this variable are represented by two dummyvariables, namely WEAK (no or weak belief in God) and STRONG(strong or very strong belief), with the former being defined as
WEAK ¼1 if the respondent has no or weak belief in God,0 otherwise:
�
Here, the reference category is MODER, indicating that the respond-ent stated having beliefs of moderate strength. Since an attribute’s mar-ginal utility may vary with religious denomination, Equation (10) ismodified to also contain interaction terms involving the denomination
Table 9 Marginal WTP values for redistribution (in percent of monthly personal
income and CHF) derived from the extended model with religious denominations
exp. sign MWTP, %of income
MWTP,CHF
std. err.,CHF
Catholics – �0.32857 �15.44 7.34 ***Reformed – �0.47866 �21.33 11.24 ***Unaffiliated þ 0.71988 37.77 9.77 ***Others �1.15630 �49.30 86.45
***Statistical significance of MWTP in percent of income at the 1% level.
CESifo Economic Studies, 2011 page 19 of 30
Religious Beliefs and Preferences for Redistribution
by guest on April 13, 2011
cesifo.oxfordjournals.orgD
ownloaded from

variables, resulting in
�V00 ¼ c000 þ � � � þ 001WEAKþ � � � þ 002REDIST
þ 003REDIST2 þ � � � þ �002REDIST � WEAK
þ �003REDIST2 � WEAKþ � � �
þ �004REDIST � STRONG
þ �005REDIST2 � STRONGþ � � � þ ’00
Hypothesis 2(a) with its focus on the degree of religiosity as a determin-
ant of WTP for redistribution states that the demand for redistribution
is expected to decrease with a stronger belief in God. The estimated WTP
values suggest to reject this hypothesis, however. In fact, the WTP
increases with the strength of religious beliefs (Table 10). The t-test for
preference heterogeneity confirms that the WTP of individuals with strong
beliefs significantly differs from the WTP of the other two groups.
However, the difference between respondents with weak and moderate
beliefs, respectively, cannot be shown to be statistically significant.Hypothesis 2(b) states that WTP values are predicted to decrease with a
higher frequency of attendance of religious services. In fact, the estimated
WTP values (Table 11) seem to confirm this hypothesis. However,
as indicated by the test for heterogeneity, the confidence intervals of the
estimated WTP values overlap, with the notable exception of groups 3 and
4 exhibiting a weakly significant difference.
5.2.3 Beliefs about the role of luck and effort and preferencesfor redistribution
Next, the simple model is extended by including the dummy variables
describing the respondents’ beliefs about the role of effort versus luck
Table 10 Marginal WTP values for redistribution (in percent of monthly
personal income and CHF) derived from the extended model with strength ofreligious beliefs
MWTP, %of income
MWTP,CHF
std. err.,CHF
No or weak belief �0.47477 �20.67 12.75 **Moderate belief �0.42066 �19.33 7.93 ***Strong belief 0.24983 12.83 8.56 *
*** (**,*) Statistical significance of MWTP in percent of income at the 1 (5, 10) percent
level.
page 20 of 30 CESifo Economic Studies, 2011
I. Neustadt
by guest on April 13, 2011
cesifo.oxfordjournals.orgD
ownloaded from
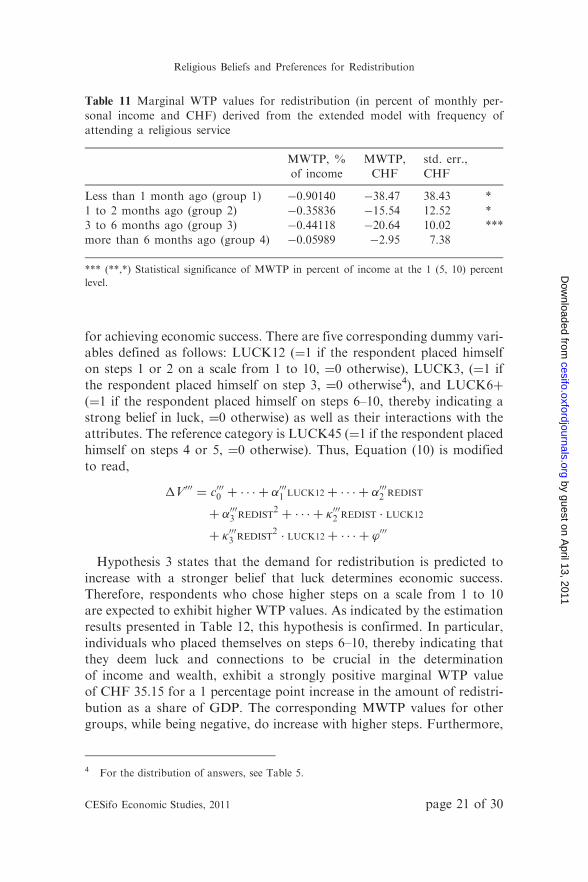
for achieving economic success. There are five corresponding dummy vari-
ables defined as follows: LUCK12 (¼1 if the respondent placed himself
on steps 1 or 2 on a scale from 1 to 10, ¼0 otherwise), LUCK3, (¼1 if
the respondent placed himself on step 3, ¼0 otherwise4), and LUCK6þ
(¼1 if the respondent placed himself on steps 6–10, thereby indicating a
strong belief in luck, ¼0 otherwise) as well as their interactions with the
attributes. The reference category is LUCK45 (¼1 if the respondent placed
himself on steps 4 or 5, ¼0 otherwise). Thus, Equation (10) is modified
to read,
�V000 ¼ c0000 þ � � � þ 0001 LUCK12þ � � � þ 0002 REDIST
þ 0003 REDIST2 þ � � � þ �0002 REDIST � LUCK12
þ �0003 REDIST2 � LUCK12þ � � � þ ’000
Hypothesis 3 states that the demand for redistribution is predicted to
increase with a stronger belief that luck determines economic success.
Therefore, respondents who chose higher steps on a scale from 1 to 10
are expected to exhibit higher WTP values. As indicated by the estimation
results presented in Table 12, this hypothesis is confirmed. In particular,
individuals who placed themselves on steps 6–10, thereby indicating that
they deem luck and connections to be crucial in the determination
of income and wealth, exhibit a strongly positive marginal WTP value
of CHF 35.15 for a 1 percentage point increase in the amount of redistri-
bution as a share of GDP. The corresponding MWTP values for other
groups, while being negative, do increase with higher steps. Furthermore,
Table 11 Marginal WTP values for redistribution (in percent of monthly per-
sonal income and CHF) derived from the extended model with frequency ofattending a religious service
MWTP, %of income
MWTP,CHF
std. err.,CHF
Less than 1 month ago (group 1) �0.90140 �38.47 38.43 *1 to 2 months ago (group 2) �0.35836 �15.54 12.52 *3 to 6 months ago (group 3) �0.44118 �20.64 10.02 ***
more than 6 months ago (group 4) �0.05989 �2.95 7.38
*** (**,*) Statistical significance of MWTP in percent of income at the 1 (5, 10) percent
level.
4 For the distribution of answers, see Table 5.
CESifo Economic Studies, 2011 page 21 of 30
Religious Beliefs and Preferences for Redistribution
by guest on April 13, 2011
cesifo.oxfordjournals.orgD
ownloaded from

the t-test results confirm that all differences between the MWTP values ofthe four groups are significant, the only exception being the differencebetween group I (steps 1 or 2) and group II (step 3), both believing ina just world.
6 Conclusion and discussion
In this article we elicited citizens’ WTP for redistribution through a DCEperformed in 2008. Based on a simple model that relates choices to theattributes of redistribution only, the average Swiss citizen would have tobe paid a compensation of CHF 11.78 (some US$ 9.40) per month (0.25%of monthly income) for an additional percentage point of GDP devoted topublic redistribution. In addition, a very marked status quo bias wouldhave to be overcome by payment of another 63% of monthly income.Furthermore, we tested several hypotheses concerning the behavioural
determinants of the demand for redistribution without any confoundingsupply-side influences. In particular, Hypothesis 1 states that it is negativeamong church members and positive among those without religious affili-ation. An extended model that includes the pertinent variable indicatingreligious denomination as a regressor yields confirming evidence for thisstatement; however, the additional prediction that Protestants exhibit alower WTP than Catholics finds only partial support with the respectivedifference between the WTP values being statistically not significant.Hypothesis 2 predicts that more religious citizens who are more likely toengage in private charity and frequently consider religion as a means ofinsurance (crowding-out effect) demand a lower level of public redistribu-tion. Here, the extended version of the model (in both alternative versions)
Table 12 Marginal WTP values for redistribution (in percent of monthly per-
sonal income and CHF) derived from the extended model with beliefs as towhether effort or luck determine economic success
MWTP, %of income
MWTP,CHF
std. err.,CHF
Steps 1 or 2 (group I) �0.74183 �32.92 13.25 ***Step 3 (group II) �0.59576 �27.23 13.63 ***Steps 4 or 5 (group III) �0.06592 �3.08 8.12
Steps 6–10 (group IV) 0.71922 35.15 11.83 ***
A higher step indicates a weaker belief in a just world and a stronger belief in luck
*** (**,*) Statistical significance of MWTP in percent of income at the 1 (5, 10) percent
level.
page 22 of 30 CESifo Economic Studies, 2011
I. Neustadt
by guest on April 13, 2011
cesifo.oxfordjournals.orgD
ownloaded from

does not support the hypothesis. Finally, Hypothesis 3 predicts that citi-
zens with a strong belief that luck rather than effort determine economicsuccess exhibit a higher WTP. The corresponding extended model that
includes the stated belief about the role of luck as a determinant of
income and wealth confirms this hypothesis. In fact, Hypothesis 3 is the
most successful one in predicting the citizens’ demand for redistribution,providing corroborating evidence for the theoretical model of collective
beliefs developed by Benabou and Tirole (2006).The analysis presented in this article is subject to several limitations.
First, only some behavioural explanations of the demand for redistribu-tion were tested while others (risk aversion, inequality aversion) were not
controlled for. Furthermore, as suggested by recent contributions to lit-
erature in the field of public choice, citizens’ preferences can be import-antly influenced by political institutions, in particular by party programs
[see e.g. Schlapfer et al. (2007)]. Thus, future work should be devoted to a
detailed analysis of individuals’ political preferences in order to find outwhether these factors also influence stated WTP for redistribution. This
analysis would, however, require addressing the identification problem
once again, since the supply of public redistribution is governed by polit-
ical institutions. Secondly, the status quo bias found in this article calls formore detailed analysis. To the extent that it reflects risk aversion, it should
induce demand for redistribution — contrary to the results presented here.
One possible explanation why the status quo bias is so high can be the factthat there are some preferences that are not fully formed [see e.g. Stutzer et
al. (2007)]. Another possible explanation might be the redistribution illu-
sion, namely the fact that some respondents are not aware of the actualstatus quo. Finally, our evidence only relates to a point of time in one
country and thus may be subject to transitory shocks and country-specific
influences. Still, by appealing to citizens’ stated preferences, the present
contribution sheds some light on the question whether religious and cul-tural beliefs can explain preferences for income redistribution.
Acknowledgements
The author gratefully acknowledges financial support from the University
of Zurich and Swiss National Science Foundation (SNF) (Project no.
100012-116398). He received helpful comments from Martin Beckmann,Douglas Bernheim, Joan Costa-i-Font, Mireia Jofre-Bonet, Reinhard
Madlener, Rachael Neustadt, Erik Schokkaert, and Peter Zweifel as well
as from participants in the Workshop on Behavioural Welfare Economics(Venice Summer Institute, Venice, Italy, 21–22 July 2010), organised by
Joan Costa-i-Font and Frank Cowell.
CESifo Economic Studies, 2011 page 23 of 30
Religious Beliefs and Preferences for Redistribution
by guest on April 13, 2011
cesifo.oxfordjournals.orgD
ownloaded from

References
Akkoyunlu, S., I. Neustadt and P. Zweifel (2009), ‘‘Why Does the
Amount of Income Redistribution Differ Between United States and
Europe? The Janus Face of Switzerland’’, SOI Working Paper No.
0810, University of Zurich, Socioeconomic Institute, http://www.soi.
uzh.ch/research/wp/2008/wp0810.pdf.
Alesina, A. and G.-M. Angeletos (2005), ‘‘Fairness and Redistribution’’,
The American Economic Review 95, 960–980.
Alesina, A. and P. Giuliano (2010), ‘‘Preferences for Redistribution’’,
in J. Benhabib, A. Bisin and M. Jackson, eds. Handbook of Social
Economics, vol. 1A, Elsevier Science, North-Holland.
Alesina, A. and E. Glaeser (2004), Fighting Poverty in the US and Europe:
A World of Difference, Oxford University Press, Oxford.
Alesina, A. and E. La Ferrara (2005), ‘‘Preferences for Redistribution in
the Land of Opportunities’’, Journal of Public Economics 89, 897–931.
Alesina, A. and D. Rodrik (1994), ‘‘Distributive Politics and Economic
Growth’’, Quarterly Journal of Economics 109, 465–490.
Beck, J. H. (1994), ‘‘An Experimental Test of Preferences for the
Distribution of Income and Individual Risk Aversion’’, Eastern
Economic Journal 20, 131–145.
Ben-Akiva, M. E. and S. R. Lerman (1985), Discrete Choice Analysis, MIT
Press.
Benabou, R. and E. Ok (2001), ‘‘Social Mobility and the Demand for
Redistribution: the POUM Hypothesis’’, Quarterly Journal of
Economics 116, 447–487.
Benabou, R. and J. Tirole (2006), ‘‘Belief in a Just World and
Redistributive Politics’’, Quarterly Journal of Economics 121, 699–746.
Boeri, T., A. Boersch-Supan and G. Tabellini (2002), ‘‘Pension Reforms
and the Opinions of European Citizens’’, The American Economic
Review 92, 396–401.
Boeri, T., A. Boersch-Supan, G. Tabellini, K. O. Moene and B. Lockwood
(2001), ‘‘Would You Like to Shrink the Welfare State? A Survey of
European Citizens’’, Economic Policy 16, 7–50.
Carlsson, F. and P. Martinsson (2003), ‘‘Design Techniques for Stated
Preference Methods in Health Economics’’, Health Economics 12,
281–294.
Checchi, D. and A. Filippin (2004), ‘‘An Experimental Study of the
POUM Hypothesis’’, Research on Economic Inequality 11, 115–136.
page 24 of 30 CESifo Economic Studies, 2011
I. Neustadt
by guest on April 13, 2011
cesifo.oxfordjournals.orgD
ownloaded from

Fehr, E. and K. Schmidt (2006), ‘‘The Economics of Fairness, Reciprocity
and Altruism: Experimental Evidence’’, in S.-C. Kolm, ed.,Handbook on
the Economics of Giving, Altruism and Reciprocity, vol. 1, Chapter 8,
Elsevier Science, North-Holland.
Feld, L. P., J. A. Fischer and G. Kirchgaessner (2007), ‘‘The Effect of
Direct Democratic Institutions on Income Redistribution: Evidence for
Switzerland’’, Working Paper Series in Economics and Finance 689,
Stockholm School of Economics.
Fong, C. (2001), ‘‘Social Preferences, Self-Interest, and the Demand for
Redistribution’’, Journal of Public Economics 82, 225–246.
Fong, C. and F. Oberholzer-Gee (2011), ‘‘Truth in Giving: Experimental
Evidence on the Welfare Effects of Informed Giving to the Poor’’,
Journal of Public Economics, forthcoming.
Gruber, J. and D. M. Hungerman (2007), ‘‘Faith-Based Charity and
Crowd Out During the Great Depression’’, Journal of Public
Economics 91, 1043–1069.
Guillaud, E. (2008), ‘‘Preferences for Redistribution: a European
Comparative Analysis’’, Working Paper no. 2008-41, Paris School of
Economics, http://www.pse.ens.fr/document/wp200841.pdf.
Hensher, D. A., J. J. Louviere and J. D. Swait (1999), ‘‘Combining
Sources of Preference Data’’, Journal of Econometrics 89, 197–221.
Hirschman, A. and M. Rothschild (1973), ‘‘The Changing Tolerance of
Income Inequality in the Course of Economic Development’’, Quarterly
Journal of Economics 87, 544–566.
Hole, A. R. (2007), ‘‘A Comparison of Approaches to Estimating Con-
fidence Intervals for Willingness to Pay Measures’’, Health Economics
16, 827–840.
Hungerman, D. M. (2005), ‘‘Are Church and State Substitutes? Evidence
from the 1996 Welfare Reform’’, Journal of Public Economics 89,
2245–2267.
Lancaster, K. (1971), Consumer Demand: A New Approach, Columbia
University Press, New York.
Lizzeri, A. and N. Persico (2001), ‘‘The Provision of Public Goods under
Alternative Electoral Incentives’’, The American Economic Review 91,
225–239.
Louviere, J. J., D. A. Hensher and J. D. Swait (2000), Stated Choice
Methods - Analysis and Application, Cambridge University Press,
Cambridge, UK.
Luce, D. (1959), Individual Choice Behavior, Wiley and Sons, New York.
CESifo Economic Studies, 2011 page 25 of 30
Religious Beliefs and Preferences for Redistribution
by guest on April 13, 2011
cesifo.oxfordjournals.orgD
ownloaded from

Manski, C. F. and S. F. Lerman (1977), ‘‘The Estimation ofChoice Probabilities from Choice Based Samples’’, Econometrica 45,1977–1988.
McFadden, D. (1974), ‘‘Conditional Logit Analysis of QuantitativeChoice Behavior’’, in P. Zarembka, ed., Frontiers of Economics,Academic Press, New York, pp. 105–142.
McFadden, D. (1981), ‘‘Econometric Models of Probabilistic Choice’’,in Ch. Manski and D. McFadden, eds. Structural Analysis of DiscreteData with Econometric Applications, MIT Press, pp. 198–272.
McFadden, D. (2001), ‘‘Economic Choices’’, The American EconomicReview 91, 351–378.
Meltzer, A. H. and S. F. Richard (1981), ‘‘A Rational Theory of the Sizeof Government’’, Journal of Political Economy 89, 914–927.
Merino-Castello, A. (2003), ‘‘Eliciting Consumers’ Preferences UsingStated Preference Discrete-Choice Models: Contingent Ranking VersusChoice Experiment’’, University Pompeu Fabra Economics andBusiness, Working Paper No. 705. http://www.econ.upf.edu/docs/papers/downloads/705.pdf.
Milanovic, B. (2000), ‘‘The Median-Voter Hypothesis, IncomeInequality, and Income Redistribution: An Empirical Test withthe Required Data’’, European Journal of Political Economy 16,367–410.
Milesi-Ferretti, G. M., R. Perotti and M. Rostagno (2002), ‘‘ElectoralSystems and Public Spending’’, Quarterly Journal of Economics 117,609–657.
Neustadt, I. and P. Zweifel (2009), ‘‘Economic Well-Being, SocialMobility, and Preferences for Income Redistribution: Evidence from aDiscrete Choice Experiment’’, University of Zurich, SocioeconomicInstitute, SOI Working Paper 0909.
Neustadt, I. and P. Zweifel (2010), ‘‘Is the Welfare State Sustainable?Experimental Evidence’’, University of Zurich, SocioeconomicInstitute, CESifo Working Paper no. 3418. Availabe online:http://www.ifo.de/portal/pls/portal/docs/1/1185304.pdf.
Neustadt, I. and P. Zweifel (2011), ‘‘Income Redistribution: How Shouldthe Pie be Divided?’’, University of Zurich, Socioeconomic Institute,forthcoming, SOI Working Paper.
Perotti, R. (1996), ‘‘Growth, Income Distribution and Democracy:What the Data Say’’, Journal of Economic Growth 1, 149–188.
Persson, T. and G. Tabellini (1994), ‘‘Is Inequality Harmful for Growth?’’,The American Economic Review 84, 600–621.
page 26 of 30 CESifo Economic Studies, 2011
I. Neustadt
by guest on April 13, 2011
cesifo.oxfordjournals.orgD
ownloaded from

Persson, T. and G. Tabellini (2000), Political Economics: ExplainingEconomic Policy, MIT Press, Cambridge, MA.
Persson, T. and G. Tabellini (2003), The Economic Effects of Constitutions,Munich Lectures in Economics, MIT Press.
Rainer, H. and T. Siedler (2008), ‘‘Subjective Income and EmploymentExpectations and Preferences for Redistribution’’, Economics Letters 99,449–453.
Rawls, J. (1999), A Theory of Justice, Belknap Press of Harvard UniversityPress.
Roberts, K. W. S. (1977), ‘‘Voting over Income Tax Schedules’’, Journal ofPublic Economics 8, 329–340.
Rodriguez, F. C. (1999), ‘‘Does Distributional Skewness Lead toRedistribution? Evidence from the United States’’, Economics andPolitics 11, 171–199.
Romer, T. (1975), ‘‘Individual Welfare, Majory Voting and the Propertiesof a Linear Income Tax’’, Journal of Public Economics 4, 163–185.
Ryan, M. (2004), ‘‘A Comparison on Stated Preference Methods forEstimating Monetary Values’’, Health Economics 13, 291–296.
Samuelson, P. A. (1938), ‘‘A Note on the Pure Theory of Consumer’sBehaviour’’, Economics 5, 61–71.
Scheve, K. and D. Stasavage (2006a), ‘‘Religion and Preferences for SocialInsurance’’, Quarterly Journal of Political Science 1, 255–286.
Scheve, K. and D. Stasavage (2006b), ‘‘The Political Economy of Religionand Social Insurance in the United States, 1910–1939’’, Studies inAmerican Political Development 20, 132–159.
Schlapfer, F., M. Schmitt and A. Roschewitz (2007), ‘‘CompetitivePolitics, Simplified Heuristics and Preferences for Public Goods’’,University of Zurich, Socioeconomic Institute, SOI Working PaperNo. 0712.
Stutzer, A., L. Goette and M. Zehnder (2007), ‘‘Active Decisions andPro-Social Behavior’’, Federal Reserve Bank of Boston, WorkingPaper No. 07-13.
Telser, H. (2002), Nutzenmessung im Gesundheitswesen, Kovac, Hamburg.
Weber, M. (1920), Die protestantische Ethik und der Geist desKapitalismus, Tubingen.
CESifo Economic Studies, 2011 page 27 of 30
Religious Beliefs and Preferences for Redistribution
by guest on April 13, 2011
cesifo.oxfordjournals.orgD
ownloaded from
Appendix A
Tax Rate Amount of Redistribution25% of your
income 25% of GDP
seiraicifeneBfoytilanoitaNnoitubirtsideRfoesU
citizens of Western
Europeanstates10%
citizens of other states15%
Swisscitizens
75%
old-agepensioners
45%
families with
children 5%
peoplewith ill health25%
unemployed15%
workingpoor 10%
Exhibit 1 Status quo card (current state of redistribution).
page 28 of 30 CESifo Economic Studies, 2011
I. Neustadt
by guest on April 13, 2011
cesifo.oxfordjournals.orgD
ownloaded from

noitubirtsideRfotnuomAetaRxaT
Uses of Redistribution Nationality of Beneficiaries
Swiss citizens
60%
citizens of Western European
states20%
citizens of other states
20%
old-agepensioners 55%
workingpoor 15% families
withchildren
5%
people with ill health
20%
25% of your income 20% of GDP
unemployed 5%
Exhibit 2 Card for alternative no. 1.
CESifo Economic Studies, 2011 page 29 of 30
Religious Beliefs and Preferences for Redistribution
by guest on April 13, 2011
cesifo.oxfordjournals.orgD
ownloaded from

noitubirtsideRfotnuomAetaRxaT15% of your
income 10% of GDP
Uses of Redistribution Nationality of Beneficiaries
Swiss citizens 75%
citizens of Western
European states 10%
citizens of other states
15%
old-agepensioners
45%
peoplewith ill health30%
unemployed 15%
workingpoor5%
families with children 5%
Exhibit 3 Card for alternative no. 2.
page 30 of 30 CESifo Economic Studies, 2011
I. Neustadt
by guest on April 13, 2011
cesifo.oxfordjournals.orgD
ownloaded from