Do Institutional Investors Really Monitor Executive Compensation?
49
1 Do Institutional Investors Really Monitor Executive Compensation? David R. Gallagher † Gavin Smith †a Peter Swan † Current Draft: 12 October 2005 † School of Banking and Finance, University of New South Wales, Sydney, N.S.W. 2052 Abstract: A recent study by Hartzell and Starks (2003) finds institutional influence is positively related to executive performance pay and negatively related to levels of compensation. We re-examine the issue by using an extended sample and, moreover, incorporate comprehensive measures of executive incentives and institutional influence. Our analysis indicates that increased institutional influence lowers total pay-for-performance sensitivity and increases the level of compensation. Institutions also exhibit investor preferences for firms with lower pay-for-performance sensitivity and higher compensation. Contrary to the recent evidence provided by Hartzell and Starks, we conclude that institutions are not effective monitors of executive compensation. JEL classification: G23, G32, J33 Keywords: Executive compensation, Monitoring, Institutional investment behavior a Corresponding author. The authors are grateful to the Australian Research Council (DP0346064) for research funding. We wish to thank Peter Pham and David Yermack for useful comments. Mail: School of Banking and Finance, University of New South Wales, UNSW Sydney 2052, Australia. E-mail: [email protected]
-
Upload
independent -
Category
Documents
-
view
0 -
download
0
Transcript of Do Institutional Investors Really Monitor Executive Compensation?

1
Do Institutional Investors Really Monitor Executive Compensation?
David R. Gallagher †
Gavin Smith †a
Peter Swan †
Current Draft: 12 October 2005
† School of Banking and Finance, University of New South Wales, Sydney, N.S.W.
2052
Abstract: A recent study by Hartzell and Starks (2003) finds institutional influence is positively related to executive performance pay and negatively related to levels of compensation. We re-examine the issue by using an extended sample and, moreover, incorporate comprehensive measures of executive incentives and institutional influence. Our analysis indicates that increased institutional influence lowers total pay-for-performance sensitivity and increases the level of compensation. Institutions also exhibit investor preferences for firms with lower pay-for-performance sensitivity and higher compensation. Contrary to the recent evidence provided by Hartzell and Starks, we conclude that institutions are not effective monitors of executive compensation.
JEL classification: G23, G32, J33
Keywords: Executive compensation, Monitoring, Institutional investment behavior
aCorresponding author. The authors are grateful to the Australian Research Council (DP0346064) for research funding. We wish to thank Peter Pham and David Yermack for useful comments. Mail: School of Banking and Finance, University of New South Wales, UNSW Sydney 2052, Australia.
E-mail: [email protected]

2
Large shareholders, such as institutional investors, are posited by theory to play
an important role in controlling the errant behavior of executives, and reduce agency
problems within a firm (e.g., Shleifer and Vishny, 1986). If institutional investors
were to fulfill this role they could exert pressure on many aspects of a firms corporate
governance structure, of which executive compensation is part. Such institutional
influence on executive compensation should be designed to increase the sensitivity of
pay to firm performance. If institutional influence were effective, agency problems
would be alleviated by financially rewarding executives for maximizing shareholder
value. Consequently, actions by institutional investors that facilitate changes in
compensation policy which better align the interests of executives with shareholders
are desirable.
A recent study by Hartzell and Starks (2003), hereafter HS, suggests that
institutional investors are active in influencing executive compensation structures. HS
examine the relationship between institutional influence, as measured by ownership
concentration, and various measures of the level of executive compensation and the
sensitivity of compensation to firm performance. They find that their measures of
institutional influence are positively related to pay-for-performance measures and
negatively related to the level of compensation. HS conclude that “these results
suggest that the institutions serve a monitoring role in mitigating the agency problem
between shareholders and managers” (p. 2372). We argue that three modifications to
the HS methodology need to be implemented before it is possible to make claims of
monitoring, or lack thereof.
To determine whether institutional investors do play an effective role in
monitoring executive compensation, three issues in the HS study need to be

3
addressed. First, for shareholder oriented institutions, the objective of monitoring of
compensation should be to increase the pay-for-performance sensitivity of executives.
Hall and Liebman (1998) argue that executives should care about changes in their
wealth from all sources, not just direct compensation. Consequently, they show that
the majority of executive pay-for-performance sensitivity comes from executive
holdings of stock and options. They find a strong relationship between executive
compensation and firm performance which is almost entirely driven by changes in the
value of executive holdings of stock and options. We question whether focusing on
option grant pay-for-performance sensitivity, rather than the pay-for-performance
sensitivity of stock and option holdings, provides a complete picture of institutional
influence on executive incentives and the effectiveness of institutional monitoring.1, 2
A second issue that needs to be addressed is what is an appropriate measure of
institutional influence? When examining whether institutions monitor executive
compensation it is important that the indicators of institutional influence satisfy the
traditional psychometric properties of reliability and validity. The primary indicator of
institutional influence used by HS is institutional concentration. This is defined as the
holdings of the top five institutions as a percentage of institutional holdings. While
this measure is meant to capture only the influence of institutions, it is problematic.
For two firms with vastly different levels of institutional ownership it is possible that
these firms can have the same level of institutional concentration. We argue that this
1 HS justify their focus on option grant pay-for-performance sensitivity, as opposed to holdings, since executives are able to reduce the risk of their undiversified holdings by entering into zero-cost collars, equity swaps and forward sales agreements (e.g. Bettis, Bizjak and Lemmon, 2001). However, Hall and Murphy (2002) state that “existing evidence suggests that such transactions are observed but are not widespread”. Moreover, while Bettis, Bizjak and Lemmon (2001) find that such arrangements may cover 36% of their equity holdings, the effective ownership position is reduced by only 25%. 2 Our descriptive statistics in Table IV show that option grant pay-for-performance sensitivity is equivalent to approximately only one-twelfth of total pay-for-performance sensitivity.

4
is not a valid measure of institutional influence since it does not accurately reflect the
ownership structure of the firm.3
Last, an alternative choice of institutional influence is desirable because the
institutional concentration measure is highly negatively correlated with firm size.4
This is a potential problem since executive compensation measures, both pay-for-
performance and level of compensation, are functions of firm size. HS do account for
this issue by including firm market capitalization as a size control in their analysis.
However, because they use the level of firm market capitalization rather than the
natural logarithm, this control may not reliably capture size effects. Consequently, any
relation between executive compensation measures and institutional concentration
may be a reflection of firm size rather than institutional influence.
Due to our concerns over these methodological issues, we re-examine the HS
claims that institutions influence executive compensation. We make three
modifications to the HS methodology. First, we construct measures of institutional
influence that are designed to better reflect institutional monitoring. One measure
changes the denominator of the HS measure to total shares outstanding. Another
approach follows Bushee (1998) and models institutional ownership based on two
traditional dimensions of their potential to monitor the firms in which they invest.
These are the propensity to be large shareholders and also the likelihood that they are
a long term investor. Our institutional ownership measures are consistent with
monitoring theory and importantly, have a much weaker association with firm size.
The second aspect of the HS methodology that we focus on is the measures of
3 For example, if in firm X, institutions own 60 percent of shares outstanding in the firm and the largest five institutions own 30 percent of shares outstanding in the firm, then firm X would have an institutional concentration measure of 0.5. If in firm Z, institutions own 20 percent of shares outstanding in the firm and the largest five institutions own 10 percent of shares outstanding in the firm, then firm Z’s institutional would be 0.5, the same as firm X. 4 Our analysis reveals a negative 63 percent correlation between the natural logarithm of firm market capitalization and institutional concentration.

5
executive incentives. Our analysis provides a broader perspective on the relationship
between institutional influence and executive incentives. Thus, in addition to the pay-
for-performance sensitivity of option grants measure of incentives, we include the
pay-for-performance sensitivity of option holdings, restricted stock holdings, private
share holdings, i.e., shares in the company held voluntarily by executives, and also a
total pay-for-performance sensitivity measure. We then examine the relation between
these measures of executive incentives and firm performance to understand which
measures of incentives institutions should be concentrating on. The third issue we
address is the measurement of market capitalization. We examine the effect of using
both the level of market capitalization and the natural logarithm of market
capitalization. Following HS we also examine whether executive incentives shape the
investment decision of institutions to determine whether institutional holdings are
higher for firms with executives who have higher levels of incentives. By examining
these comprehensive measures of institutional monitoring and executive
compensation, the study consolidates existing research on institutional monitoring and
provides a more detailed and accurate picture of institutional investors propensity to
monitor executive compensation.
Our results indicate that institutional monitoring is not as effective as that
documented by HS. First, replicating the HS methodology we are able to confirm
their findings. However, we note that these findings are sensitive to the transformation
of the firm size control variable. HS use the level of firm market capitalization to
control for firm size. When the natural logarithm of firm market capitalization is
employed, the relationship between institutional concentration and option grant pay-
for-performance sensitivity becomes insignificant and the relation with the level of
compensation becomes positive and significant. When we broaden our analysis to

6
additional measures of institutional influence and measures of holding pay-for-
performance sensitivity, a different picture of institutional monitoring emerges. Our
new measures of institutional influence suggest institutions are exerting upward
pressure on option grant, option holding and restricted stock holding pay-for-
performance sensitivity. However, by focusing on complete measures on pay-for-
performance sensitivity, we find that institutional influence has a negative effect on
private share holdings. This decline may be a result of institutions fearing
entrenchment effects or executives offsetting increases in other form of incentives.
The end result is a total reduction in the pay-for-performance sensitivity of the
remuneration of the executive. This means that the combined effect of increased
levels of institutional influence is to lower pay-for-performance sensitivity. In
addition, our two new measures of institutional influence also show a positive effect
on the level of executive’s salary and total compensation. Our results of direct
institutional influence suggest higher levels of institutional influence leads to lower
total pay-for-performance sensitivity and higher levels of compensation. Indirect
influence from institutions does not support claims of effective or consistent
monitoring either. The results show that institutions have a preference for firms with
higher levels of total compensation and lower levels of pay-for-performance
sensitivity. Overall, the results suggest that institutions do not coordinate their
monitoring efforts in a manner that is in the best interests of shareholders. Our
analysis does not permit us to conclude that institutions serve an effective monitoring
role to mitigate the agency problem between shareholders and executives.
The next section describes the data. Section II examines the relation between
measures of executive compensation and firm performance. Section III analyses the
relation between institutional influence and measures of option and stock pay-for-
7
performance sensitivity. Section IV documents the relation between institutional
influence and the level of executive compensation and in Section V we determine
whether any clientele effects exist. In Section VI we check the robustness of our
findings, and Section VII concludes.
I. Data
The data used comes from a number of sources. Institutional holdings are from
the Thomson Financial CDA/Spectrum database.5 Executive compensation variables
are from Standard & Poor’s (S&P) ExecuComp database. Firm level accounting and
stock price data are from S&P’s Compustat and the Centre for Research in Stock
Prices (CRSP) respectively. Data is collected for the firm fiscal years corresponding
to 1992-2002.6 Our executive compensation data is based on firms included in the
S&P 1500. This index is a combination of the S&P500, S&P Midcap 400 and S&P
Smallcap 600. This represents a total of 2559 firms. Each firm in the ExecuComp
database reports the compensation package of the top five executives. Our matched
sample yields a maximum of 97,467 executive years.
A. Institutional Influence Measures:
The HS measure of institutional influence is defined as the holdings of top five
institutions as a percent of institutional holdings, and is referred to as Institutional
Concentration. Due to its strong correlation with firm size and the possibility that it
does not capture the ownership structure of the firm accurately, our study develops 5 This database consists of quarterly 13-F filings of money managers to the U.S Securities and Exchange Commission (SEC). Institutions with more than $100 million of securities under management are required to report to the SEC. All positions that are greater than 10,000 shares or $200,000 must be disclosed (Gompers and Metrick, 2001). 6 While the results presented in the paper are for the time period 1992-2002, similar results are obtained using the time period employed by HS, 1992-1997.
8
two additional measures of institutional influence. One measure changes the
denominator of the HS measure to total shares outstanding in the firm. This measure
gives the proportion of shares held by the five largest institutional holders. This
variable is named Top 5 Ownership. The second measure draws on agency theory
which suggests that for monitoring to be effective it needs to be performed by
investors with large holdings and a long term investment horizon. We classify
institutions based on these two attributes that are purported to increase the likelihood
of monitoring- these being large and long term investments. To accomplish this
classification of institutions, we compute ten portfolio or institutional characteristics
that capture these two monitoring dimensions. The characteristics and methodology
employed to analyze institutions closely follows that of Bushee (1998).
<<INSERT TABLE I>>
Five of the ten institutional characteristics computed capture large portfolio
holdings. These are average percentage institutional concentration (APIC), average
percentage holding (APH), Herfindahl measure of concentration (HERF), portfolio
concentration (CONC) and percent held in large blocks (BLOCK). APIC measures
the average size of the institutions holding in a firm as a percentage of total
institutional ownership in a firm. CONC measures the average percentage of an
institution’s total equity holdings invested in each portfolio firm. APH measures the
average size of the institutions ownership position in its portfolio firms. BLOCK
measures the percentage of the institutions portfolio that is invested in firms where it
has an ownership stake of greater than 5 percent of the firms’ outstanding shares.
HERF is the squared percentage ownership in each portfolio firm.

9
We include three measures of portfolio turnover. These are portfolio turnover
(PT), stability of holdings (STAB) and average portfolio liquidity (APL). PT
measures the average absolute change in the institution’s positions over the quarter.
STAB measures the percent of the portfolio held for two years. APL measures the
average stock turnover of the portfolio.
We include two additional institutional characteristics that we expect to help
explain monitoring, but their effect on large or long term holdings is unknown.
Following Brickley, Lease and Smith (1988), we include a dummy variable that
indicates whether the institution is insensitive to pressure from the management of the
firms in which they invest. Pressure insensitive institutions are defined as investment
companies or independent advisers (Almazan, Hartzell and Starks, 2004). We also
include a measure of active beta, which is the divergence of the portfolio’s beta from
the market, or one. There is an expectation that index funds, those with a small active
beta, may be less inclined to become actively involved in the firms they invest in.
The characteristics are calculated at the end of each quarter for every
institution of the 13F database. The quarterly values are averaged over four quarters.
These average values are used in the subsequent analysis. Because the portfolio
characteristics are highly correlated Bushee (1998) resorts to using factor analysis to
reduce the number of variables to be used. Factor analysis with an oblique rotation is
used to assist in the interpretation of the factors.7 The results of the factor analysis are
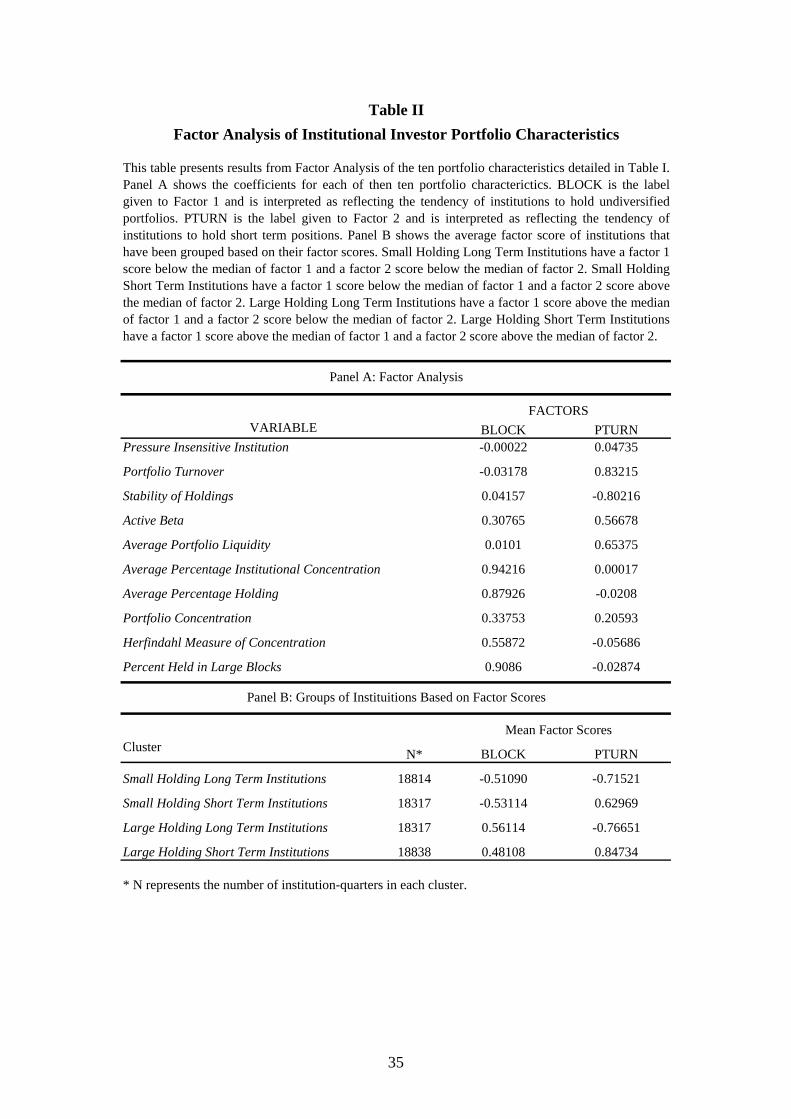
presented in Panel A of Table II.
<<INSERT TABLE II>>
7 Because the two factors used have very weak correlation, a varimax rotation leads to almost identical results.
10
Our results are strikingly similar to Bushee (1998). Consequently, we have a
similar interpretation of the first and second factors. The first factor is interpreted as
capturing the lack of portfolio diversification or large holdings in portfolio firms. The
second factor captures investor transience. Institutions are then grouped based on their
factors scores. We partition institutions into two groups depending on whether they
are above or below the median of factor score 1. The same process is repeated for
factor score 2. Each institution then has two classifications. The classification based
on factor 1 indicates whether the institution has a diversified portfolio with small
ownership stakes or a diversified portfolio with large ownership stakes. The
classification based on factor score 2 indicates whether the institutions are long term
investors or transient investors. Using these classifications we form four groups of
institutions- 1) Small Holding Long Term Institutions; 2) Small Holding Short Term
Institutions; 3) Large Holding Long Term Institutions; and 4) Large Holding Short
Term Institutions. Panel B of Table II shows the average factor scores of each group
of institutions. The two groups of institutions that are used in this study are shown in
Panel C and D. These two groups of institutions have large holdings in their portfolio
firms, hence, we expect them to be most likely to monitor. To convert the
classifications of institutions from the factor analysis into a measure of institutional
influence, we compute the percentage of outstanding shares in a firm held by each
group of institution.
<<INSERT TABLE III>>
In Table III we present descriptive statistics of institutional portfolios based on
the classifications from the factor analysis. We focus on institutions with large

11
holdings that have either long or short term investment horizons. There is
considerable amount of variation in the transience of our two groups of large holder
institutions. Our transient group of large holder institutions holds only 27.1 percent of
their portfolio for two years compared to 74.8 percent for their longer term
counterparts. Portfolio turnover of transient investors is twice as great as that of
longer term investors.8
For our study we are only interested in measures of institutional influence that
correspond to the fiscal year end of the firm. If holdings are not reported for the
quarter for which the fiscal year ends, we take the reported holding that is closest to
this date. Moreover, if a stock has a fiscal year that does not correspond exactly to a
quarter-end, we make an adjustment to a firm’s fiscal year. The fiscal year is rounded
up to the nearest calendar quarter end.
B. Compensation Measures:
The ExecuComp database reports several raw measures of executive
compensation. That is, it reports total amounts of salary, bonus, long term incentives,
restricted stock grants and also option grants. All compensation measures are adjusted
for inflation to 30 June 2002 prices.
The first compensation measure that we are interested in is total compensation.
This is the sum of salary, bonus, long term incentive plan payouts and stock and
option grants. Options are valued using the Black and Scholes (1973) formula for
8 An interesting finding from the descriptive statistics is that pressure insensitive institutions account for 26 percent of institutions that we classify as long term investors with large holdings. On the other hand, 43 percent of institutions in the transient investor with large holdings group are pressure insensitive. This is interesting given the Almazan, Hartzell and Starks (2004) finding that pressure insensitive institutions exert upward influence on executive pay-for-performance sensitivity, yet our initial results suggest that this class of investors are more transient.

12
European call options, adjusted by Merton (1973) to incorporate dividends. Salary is
also employed when we examined the level of compensation.
Five forms of performance pay are examined. One is replicated from the HS
study. This is the pay-for-performance sensitivity of option grants. Four new
measures examined are the pay-for-performance sensitivity of option holdings,
restricted stock holdings and private share holdings. We also examined a total pay-
for-performance sensitivity measure.
We employ the Yermack (1995) approach to measure option and stock pay-
for-performance sensitivity. For options, this involves calculating the delta,
PC ∂∂ / (where C is the option price and P is the stock price), using the Black-Scholes
formula adjusted for dividends. The pay-for-performance sensitivity of restricted
stock and other shares held can also be computed within this framework. Shares can
be viewed as an option to purchase stock at an exercise price of zero, which generates
a delta of one. For option pay-for-performance sensitivity the delta is multiplied by
the ratio of the number of shares represented by the award divided by the number of
shares outstanding at the beginning of the year. The number of shares outstanding at
the beginning of the year is adjusted for dilution effects of stock and option grants.
When there is more then one grant during the year, a weighted average delta is used.
Applying this process for option grants is relatively straight forward. To
compute the pay-for-performance for our holding measures a modeling process is
required to determine the level of holdings. The number of shares or options initially
held is computed by adding options exercised or restricted stocks sold during the year
and subtracting the new grants to the first reported level of option or restricted stock
held. Using a similar identity as above, each year the total holdings of options or
restricted stock is computed as beginning year holdings plus new grants minus options

13
exercised or restricted stock sold. This rule was adjusted where necessary so that the
condition held.9 The delta is then multiplied by the number of options or stock held
divided by the number of shares outstanding at the beginning of the year. This
measure shows the change in value of the executive option or stock holdings for every
dollar change in the value of the firm. This modeling process yields three measures of
holdings pay-for-performance sensitivity. These are option holding, restricted stock
holding and private share holding pay-for-performance sensitivity. An aggregate
measure is computed as total pay for performance sensitivity which is the sum of
option holdings sensitivity, restricted stock sensitivity and the sensitivity due to shares
held privately.
C. Control Measures:
Because several other factors can influence the level and structure of executive
compensation we include numerous controls. We follow HS in the choice of measures
so that the analysis is comparable. These controls are Tobin’s Q, firm market
capitalization and the change in shareholder wealth. Data on stock prices and
accounting firm level data is sourced from CRSP and Compustat respectively.
D. Descriptive Statistics:
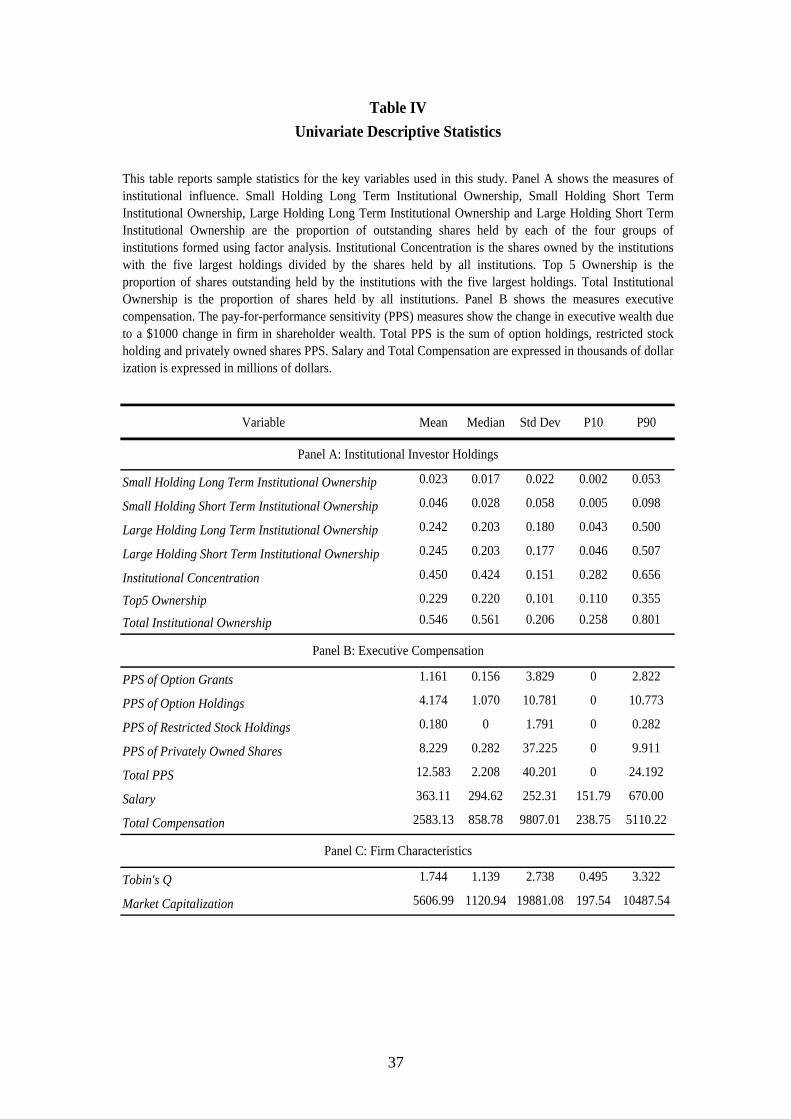
Table IV presents descriptive statistics of key variables employed in the study.
Panel A presents statistics institutional investor measures of influence. Panel B
presents executive compensation statistics and Panel C presents statistics on firm
characteristics. Table IV shows that institutions own on average 54.6 percent of the
firms in which they invest. The institutions with the five largest holdings account 45
9 For a more detailed discussion of the modelling process (e.g. vesting rules) involved in calculating option and stock holdings see Garvey and Swan (2002).

14
percent of institutional ownership. For our measures of institutional ownership, on
average, long term institutions with large holdings own 24.2 percent of the firm
compared to 24.5 percent for transient institutions with large holdings. The
institutions with the five largest holdings own on average 22.9 percent of shares
outstanding in a firm. With respect to pay-for-performance sensitivities, private share
ownership dominates, accounting for approximately two-thirds of total pay-for-
performance sensitivity. Restricted stock pay-for-performance sensitivity has the
smallest contribution to total pay-for-performance sensitivity. Average total
compensation for executives is $2.583 million.
<<INSERT TABLES IV AND V>>
In Table V, correlations between the key variables employed in the study are
examined. Of concern is the large negative correlation between the HS measure of
institutional concentration and the natural logarithm of firm market capitalization. Our
measures of institutional ownership have a much lower association with firm market
capitalization. For our two measures of institutions from factor analysis, there is a
negative 34.3 percent correlation, suggesting the institutions in these groups tend to be
substitutes rather then complements.
II. Executive Compensation and Firm Performance
Monitoring is a costly exercise in terms of time and resources expended to
achieve the desired outcome. To justify these costs, institutions will want to focus on
those aspects of executive compensation that have a positive effect on firm
performance. The question we ask here is which incentives should institutions focus

15
on if they are to monitor? We address this question by examining the relation between
measures of firm performance and our pay-for-performance sensitivity measures. We
consider two performance measures which are Return on Assets (ROA) and Tobin’s
Q. To determine the effect of executive pay-for-performance sensitivity on firm
performance we regress lagged measures of pay-for-performance sensitivity on firm
performance. Controls for firm size, industry and year effects are also included.
<<INSERT TABLE VI>>
The pay-for-performance measures have contrasting effects on ROA. Higher
levels of option grant and option holding pay-for-performance sensitivity results in
lower ROA. While higher restricted stock and private stock holding pay-for-
performance sensitivity produces higher ROA. When performance is measured using
Tobin’s Q we find that option grant, option holding and private share holding pay-for-
performance sensitivity all have a positive and significant effect. The level of
compensation has a negative effect on Tobin’s Q. The importance of holding
measures of pay-for-performance sensitivity on firm performance justifies their
inclusion in the analysis of institutional monitoring.
III. Institutional Investor Influence and Pay-for-Performance Sensitivity of
Options and Stock
This section examines the influence of institutional investors on the pay-for-
performance sensitivity of executive pay. The section examines the influence of
institutions on the pay-for-performance sensitivity of option grants, option holdings,
restricted stock holdings, private share holdings and also total pay-for-performance

16
sensitivity. The analysis uses a Tobit model specification due to the fact that for some
firms in some years their executives may not have been granted any options or they
may not have any holdings of stock, restricted stock or privately owned stock. The
basic model to be estimated is:
older in shareh $ldings perrant or hovalue of g 1000(∆
∑∑
++
+
+
+
+
+
∆+
∆+=
−
−
−
−
itity
itj
it
it
it
it
it
itit
Year Dummy
ummyIndustry D
CEO Dummy
nitalizatioMarket Cap
s QTobin
InfluencenalInstitutio
r WealthShareholde
r WealthShareholdewealth
εβ
β
β
β
β
β
β
ββ
)(
)(
)(
)(
)'(
) (
)(
)()
6
15
14
13
2
110
(1)
The dependent variable is the respective measure of pay-for-performance
expressed in terms of a $1,000 change in firm value. The lagged and contemporary
measure of change in shareholder wealth is the difference in market capitalization of
the firm in the respective periods. The measures of institutional influence used are
Institutional Concentration, Top 5 Ownership and the measures from factor analysis-
Large Holding Long Term Institutional Ownership and Large Holding Short Term
Institutional Ownership. Each measure of institutional influence is used in a separate
model. To replicate the HS methodology, models using Institutional Concentration
have an additional control of total institutional holdings. Tobin’s Q is the ratio of
market value of equity plus debt divided by total assets. Market capitalization of the
firm is measured as the number of shares outstanding multiplied by the share price.

17
Models are estimated with the level of market capitalization to follow the HS
methodology and then with the natural logarithm of market capitalization. A dummy
variable is included to identify whether the executive is CEO. Dummy variables are
also included to control for industry effects. This variable takes a value of one for the
two digit SIC in which the firm operates. A year dummy variable is included, where
the variable is equal to one if the observation was from the given year.
A. Option Grant Pay-for-Performance Sensitivity
<<INSERT TABLE VII>>
Model 1 replicates the methodology used by HS. A similar result is obtained-
increased institutional concentration has a positive effect on option grant pay-for-
performance sensitivity. The same relation is observed for Model 2 which uses Top 5
Ownership as a measure of institutional influence. In model 3 the measures from
factor analysis yield contrasting results. Institutions with a tendency to have large
long term holdings have a negative effect on option grant pay-for-performance
sensitivity, while ownership by institutions with large short term holdings has a
positive effect. This is opposite to what we would expect. It would be expected that
institutions with a longer investment horizon would be the better monitors.
In models 4, 5 and 6 the natural logarithm of firm market capitalization is used
rather then the level of firm market capitalization. This change has a dramatic effect
on the HS measure of institutional influence. In model 4, institutional concentration
has an insignificant effect on option grant pay-for-performance sensitivity. This is not
a surprising result given the strong correlation between firm size and institutional

18
concentration. In model 1, the significant result on institutional influence is likely to
be reflecting a size effect which the level of market capitalization cannot capture. In
model 4, the natural logarithm of firm market capitalization is a better measure of
firm size and so it captures size effects.10 Using the natural logarithm of firm market
capitalization also affects model 6. Institutions with large long term holdings now has
an insignificant relation with option grant pay-for-performance sensitivity. This
analysis reveals how sensitive the claims of institutional monitoring are to the
measures of institutional influence and the measurement of control variables.
Our results also reveal that firms with high growth prospects or higher levels
of intangible assets, as captured by Tobin’s Q have higher levels of option grant pay-
for-performance sensitivities. Smaller firms and CEOs also have higher option grant
pay-for-performance sensitivities. Interestingly, changes in shareholder wealth, when
significant, have a negative effect on option grant pay-for-performance sensitivities.
B. Option Holding Pay-for-Performance Sensitivity
The relationship of institutional influence with option holding pay-for-
performance sensitivity is more consistent than with option grant pay-for-performance
sensitivity.11
<<INSERT TABLE VIII>>
Our results for models 1, 2, and 3 are similar to the corresponding models for
option grant pay-for-performance sensitivity. All signs are positive and significant,
10 We also examine other measures of firm size, such as sales or assets, for all models with negligible effect on results. 11 The results presented on option holdings are based on valuations at fiscal year end. Similar results are obtained when we using different option valuation assumptions, such as uniform volatility.

19
with the exception of the sign for large long term institutional ownership in model 3.
The results in 4, 5 and 6 are less affected by the use of the natural logarithm of firm
market capitalization. All measures of institutional influence remain positively
significant and the coefficient for large long term ownership in model 6 is now
positive and significant. The stability of the results for the analysis of option holding
pay-for-performance sensitivity suggests that institutions are exerting positive
influence. The strong relation between measures of institutional influence and option
holding pay-for-performance sensitivity may reflect the realization by institutions of
the evidence presented by Hall and Liebman (1998) - the majority of pay-for-
performance sensitivity comes from holdings.
Our results suggest that institutions do appear to be able to exert a degree of
influence of option holdings. A valid question is then how are institutions meant to
influence the option holdings of executives? One explanation is through the design of
the contracts. Kole (1997) finds that for option awards, typical vesting periods is 12
months. After this time, one quarter of the award is available for exercise with the rest
of the award available for exercise over the next three years. The average wait to
exercise is 30 months. Institutions may be able to encourage executives to retain
options for longer by increasing the vesting period. Alternatively, Bettis, Coles and
Lemmon (2000) analyze a sample of 626 firms and find that 92 percent of them have
some trading restrictions in place. An estimated 78 percent of firms have blackout
periods during which the CEOs or other insiders cannot trade their firm’s stock and 74
percent of firms require all insider trades to be cleared by an individual or office of
the firm before execution. Both measures would make it harder for executives to
reduce their option holdings.
20
C. Restricted Stock Holding Pay-for-Performance Sensitivity:
Our results for restricted stock pay-for-performance sensitivity vary depending
on the measure of institutional influence used. The HS institutional concentration
measure has a negative relation with restricted stock holding pay-for-performance
sensitivity. In contrast, top 5 ownership and the measures of institutional influence
designed using factor analysis both have a positive effect on restricted stock holding
pay-for-performance sensitivity. The results remain largely unchanged when the
natural logarithm of firm market capitalization is employed. The negative sign on
institutional influence can be explained by the effect that firm size has on restricted
stock holding pay-for-performance sensitivity. We have noted previously that
institutional concentration is highly negatively correlated with firm size. The results
show that firm size has a positive effect on restricted stock holding pay-for-
performance sensitivity. It is not surprising then that institutional concentration has a
negative effect on restricted stock holding pay-for-performance sensitivity. With such
a strong correlation between institutional concentration and firm size, the size control
may still not be able to capture all the size effect. Consequently, we are inclined to
favor our results using top 5 ownership, large long-term institutional ownership and
large short-term institutional ownership. These findings suggest institutions are
having a positive effect on restricted stock holding pay-for-performance sensitivity.
Institutions may attempt to increase restricted stock pay-for-performance
sensitivity in a similar way they would option holdings pay-for-performance
sensitivity. By definition, restricted stock awards provide executives with a fixed
quantity of shares of the firm’s equity with restrictions on resale or transfer and a
forfeiture clause that invalidates the award if the executive quits or is fired before the
restriction period lapses. Institutions could increase the restrictions on resale or

21
transfer in an attempt to increase pay-for-performance sensitivity. Kole (1997) finds a
minimum period of employment is required before restrictions for some fraction of an
award lapse. Moreover, Kole finds that the average restriction period for low R&D
firms is 34 months and for high R&D firms the restriction period is 74 months.
<<INSERT TABLE IX >>
D. Private Share Holding Pay-for-Performance Sensitivity:
A large portion of the incentive motivating executive comes from the shares
they hold privately. Similar to the findings for restricted stock holding pay-for-
performance sensitivity, the results for privately owned share pay-for-performance
sensitivity is dependent on the measure of institutional influence. Institutional
concentration has a positive effect on privately owned share pay-for-performance
sensitivity while top 5 ownership, large long-term institutional ownership and large
short-term institutional ownership have a negative effect. A similar reason for the
difference in findings for restricted stock holding pay-for-performance sensitivity also
applies here. Moreover, given that we expect our new measures of institutional
influence to better capture institutional monitoring, we conclude that increased
institutional influence lowers the pay-for-performance sensitivity of privately owned
shares. This is concerning given we find that private share holding pay-for-
performance sensitivity has a positive and significant effect in firm performance as
measured by ROA and Tobin’s Q.
We offer several explanations for the negative relation between institutional
influence and private share holding pay-for-performance sensitivity. First, this may be
evidence of concerns over entrenchment effects among executives who own

22
substantial amounts of shares in their firms. This entrenchment effect would concern
institutions because it may allow the executive enough power or influence to ensure
their employment with the firm at an attractive salary.
<<INSERT TABLE X>>
Second, Ofek and Yermack (2000) find that when executives receive
increased incentives, high ownership managers negate much of its impact by selling
previously owned shares. Our analysis so far does suggest that institutions increase
the pay-for-performance sensitivity of executive option and restricted stock holdings.
Executives will essentially hedge away the effect of these increased incentives by
selling their privately held shares. When institutions have more influence they will
attempt to increase the holdings that have a board-determined component to them-
primarily option and restricted stock holdings. Because executives will be faced with
a portfolio that is increasingly undiversified, they will attempt to regain some balance
by reducing their privately owned shares.
A third explanation is that institutions may be increasing option and restricted
stock sensitivity in response to low stock ownership. The premise behind agency
theory is that linking executive wealth to firm performance will align executive
interests with those of shareholders. When executives own more of the firm such
alignment of interests should occur. However, executives may be reluctant to
voluntarily own a large stake in their own firm. Institutions may respond by
increasing the sensitivity of wealth to board influenced holdings of options and
restricted stock. Core and Larcker (2002) examine situations in which there has been a
mandatory increase in executive share ownership. They note that when ownership

23
levels are not met by executives, in 27 percent of their sample firms a penalty applies.
Penalties that can apply include a fraction of their annual cash pay is paid as restricted
stock or the vesting of their outstanding stock and options is delayed. Hence, the
increase in higher levels of institutional influence may occur to penalize executives
for failing to meet ownership stakes. This could also explain the higher option holding
and restricted stock pay-for-performance sensitivity.
E. Total Pay-for-Performance Sensitivity:
In Table XI we examine the effect of institutional influence on total pay-for-
performance sensitivity. Total pay-for-performance sensitivity is the sum of pay-for-
performance sensitivity of option holding, restricted stock holding and private share
holdings.
<<INSERT TABLE XI>>
Again, results are sensitive to the measure of institutional influence. If we
were to focus on the HS institutional concentration measure, we would conclude that
higher levels of institutional influence result in higher total pay-for-performance
sensitivity. Due to the many problems with the institutional concentration measure
highlighted throughout the paper, we do not believe this is the appropriate conclusion.
Rather the opposite - higher levels of institutional influence result in overall lower
levels of pay-for-performance sensitivity. This is because the pay-for-performance
sensitivity of private share holdings dominates total pay-for-performance sensitivity.12
So despite their best efforts to increase executive incentives by exerting upward
12 The descriptive statistics in table IV show that the pay-for-performance sensitivity of private share holdings accounts for approximately two-thirds of total pay-for-performance sensitivity.

24
pressure on option holding and restricted stock pay-for-performance, total pay-for-
performance sensitivity declines due to privately owned shares over which the
executive has complete discretion. Institutions appear to monitor executive incentives
but their increased influence is unable to ensure that executives have higher
incentives.
IV. Institutional Investor Influence and the Level of Executive Compensation
If executives are willing to accept their pay being more sensitive to firm
performance, they will demand an additional premium for bearing greater risk. We
would expect higher compensation to be associated with increased pay-for-
performance sensitivity. HS find that while institutional influence leads to high pay-
for-performance sensitivities it also leads to lower levels of compensation, as
measured by salary and total compensation.
<<INSERT TABLES XII AND XIII >>
Replicating the HS methodology we are able to show that institutional
concentration is negatively related to both salary and total compensation.13 However,
when the natural logarithm of firm market capitalization is used instead of the level,
the results are changed dramatically. Institutional concentration has a significant
positive relation with both the salary and total compensation. Top 5 ownership, large
long term institutional ownership and large short term institutional ownership all have
a significant positive relation with salary and total compensation, regardless of the
13 We use the natural logarithm of both salary and total compensation. Using the level of salary and total compensation does not change the conclusions from the analysis.

25
size control used. The results suggest institutions are not effective at reducing levels
of compensation.
This finding can be explained by viewing an executive as being risk averse
(Garen, 1994; Haubrich, 1994). The compensation contract represents a trade off
between incentives and risk-sharing (Fama and Jensen, 1983). For increases in pay-
for-performance sensitivity (i.e., board determined pay-for-performance sensitivity –
options and restricted stock) executives will need to be rewarded for taking on
increased personal risk through higher salaries. Our results support this view. With
respect to total compensation, the positive relation with institutional influence can be
explained by the higher salaries but also the massive growth in the use stock and
options. While shareholders may want the link between pay and performance to be
higher, the result has been higher total compensation as a result of increased use of
stock and option pay.
A study by Johnson, Porter and Shackell (1997) has also offered an
explanation for the effect institutions may have on the level of executive
compensation. They examine the effect that targeting by CalPERS has on executive
compensation. They find that CEOs at firms targeted by CalPERS experience a
reduction in the firm’s total compensation and a reduction in the sensitivity of the
firm’s cash compensation to firm performance. CEOs at target firms are compensated
for a decrease in pay by a reduction in the riskiness of their remaining pay. Johnson,
Porter and Shackell state that pension funds like CalPERS appear to be more attuned
to what is typically viewed as “political concerns” about compensation levels than
what is typically viewed as “shareholder concerns” about pay-for-performance
sensitivities. Our study, which is based on a large sample of institutional investors,
suggests that controlling the level of pay may not have been the primary focus of

26
institutions. Rather they have been focusing on option and restricted stock holdings
pay-for-performance sensitivity to ensure pay and performance is aligned. According
to our results, institutions appear to be more attuned to what is typically viewed as
“shareholder concerns”.
V. Institutional Investor Investment Preferences and Executive Compensation
Institutions can exert influence on the firms in which they invest through
numerous means. HS suggest indirect influence through investment preferences can
also produce desired changes in compensation. We examine whether measures of
executive incentives and total compensation can predict total ownership of
institutions. We regress total institutional ownership on lagged measures of executive
pay-for-performance and total compensation. We control for size, industry and year
effects.
We estimate seven models. We estimate a model where each pay-for-
performance measure is the sole incentive measure. We also estimate models where
all pay-for-performance measures are present. The results show that institutions do
not exert desirable indirect influence on either executive pay-for-performance
sensitivities or total compensation. Institutions are holding more of firms where their
executives have lower pay-for-performance sensitivities and higher total
compensation.
<<INSERT TABLE XIV>>
This result is confusing in many ways. Badrinath, Gay and Kale (1989) show
that institutions have a preference for stocks deemed prudent, while Del Guercio
27
(1996) shows that it is primarily banks that exhibit this behavior. In these studies
prudence was defined in terms of S&P rating, firm size and liquidity to name a few of
the key factors. According to agency theory, executive compensation remains one of
the most effective tools for aligning executive interests with those of shareholders, to
ensure that they pursue projects that maximize shareholder wealth. Consequently a
firm with lower agency problems may also be viewed as being a more prudent
investment. Extending the implications of Badrinath, Gay and Kale (1989) and Del
Guercio (1996) it might have been expected that institutions would prefer firms with
higher levels of pay-for-performance sensitivities.
VI. Robustness of Institutional Monitoring
In this section two issues are addressed- endogeneity and unobserved firm
heterogeneity. With respect to endogeneity, institutions may self select into firms with
certain executive compensation characteristics. An instrumental variables approach is
employed to address the issue of endogeneity. A problem is in identifying an
appropriate instrument for institutional influence. HS employ stock turnover as an
instrument for total institutional ownership. Garvey and Swan (2002) show that stock
liquidity as measured by turnover, is a determinant of market based pay that is
awarded to executives. This suggests that stock turnover may be an inappropriate
instrument for institutional ownership. Qiu (2004) develops a method to construct an
instrument for institutional influence. In the context of executive compensation, this
would involve computing firm level compensation measures.14 Using these firm level
compensation measures, an average exposure of each institution to the compensation
measures are computed. Then, for the relevant measure of institutional influence, the
14 We average the seven measures of compensation employed in the study across the top 5 executives in the firm.

28
average exposure of the institutions that comprise that measure is computed. The
noise term from a regression of the measure of institutional influence on the average
measure of compensation is used as an instrument for institutional influence. The
instrument is orthogonal to ownership factors associated with the executive
compensation of a firm. Having identified an appropriate instrument, a two stage
procedure is used. In the first stage, an OLS regression is estimated where top 5
ownership is a function of the instrument for institutional influence, the natural
logarithm firm market capitalization and controls for year effects. The fitted value
from this regression is used in the second stage. In the second stage, models of pay-
for-performance sensitivity and the level of compensation are estimated as functions
of the fitted value of institutional influence, lagged and contemporaneous change in
shareholder wealth, Tobin’s Q, natural logarithm of firm market capitalization and
dummy controls for CEO, year and industry effects. For models analyzing pay-for-
performance sensitivity, a Tobit specification is used, whereas OLS is used for salary
and total compensation.
<<INSERT TABLE XV>>
The results employing an instrumental variables approach are consistent with
the findings in previous sections- institutions exert positive influence on option grant,
option holding and restricted stock pay for-performance sensitivity and negative
pressure on private stock holding and total pay-for-performance sensitivity. Also,
institutions exert upward influence on salary and total compensation.
An additional check is made to determine whether firm-level unobserved
heterogeneity is influencing the results. For the pay-for-performance sensitivities a

29
random effects Tobit specification is employed, whereas a fixed effects regression is
used for salary and total compensation.15
<<INSERT TABLE XVI>>
The results show that after accounting for firm level heterogeneity,
institutional influence on option grant pay-for-performance sensitivity, salary and
total compensation becomes insignificant. However, institutions still appear to be
exerting positive influence on option holding and restricted stock holding pay-for-
performance sensitivity while exerting negative pressure on private share holding pay-
for-performance sensitivity.
VII. Conclusion
A recent study by Hartzell and Starks (2003) suggests that institutional investors
do exert influence on executive compensation. Specifically, HS find that their
measures of institutional influence are positively related to pay-for-performance
measures and negatively related to the level of compensation. However, the HS study
does not provide a complete picture of institutional monitoring of executive
compensation. First, while HS focus primarily on the pay-for-performance sensitivity
of option grants, Hall and Liebman (1998) show incentives from stock and option
holdings provide the bulk of executive incentives. Consequently, we question whether
focusing on option grant pay-for-performance sensitivity, rather than the pay-for-
performance sensitivity of stock and option holdings, provides a true picture of
15 We use the random effects Tobit procedure as opposed to fixed effects because there does not exist a sufficient statistic allowing the fixed effects to be conditioned out of the likelihood. We do note that Honore has developed a semi-parametric estimator for fixed-effect Tobit models. However, unconditional fixed-effects estimates are biased (Stata Manual).

30
institutional influence on executive incentives and the effectiveness of institutional
monitoring. Another concern with HS lies in the measure of institutional influence.
The primary measure of institutional influence does not accurately capture the
ownership structure of the firm and is highly correlated with firm size.
In our study we provide a broader perspective on the relationship between
institutional influence and executive incentives to determine whether institutions
really do monitor executive compensation. Thus, in addition to the pay-for-
performance sensitivity of option grants measure of incentives, we include the pay-
for-performance sensitivity of option holdings, restricted stock holdings and also a
total pay-for-performance sensitivity measure. We also introduce two new measures
of institutional influence. The first changes the denominator of the HS measure of
institutional influence to shares outstanding, while the second models institutional
influence using two dimensions of ownership (i.e., size of holdings and holding
period) that theory suggests are associated with effective monitoring. Another
improvement our study makes is in examining the effect of changing the measurement
of the control for firm size from the level of market capitalization to the natural
logarithm.
Our results show that claims of institutional monitoring are sensitive to the
measure of institutional influence and also the transformation of firm size. We are
able to replicate the results of HS- that being that institutional concentration is
positively related to option grant pay-for-performance sensitivity and negatively
related to the level of compensation. However, we note that changing the firm size
control to the natural logarithm of firm market capitalization changes the conclusions
completely. Institutional concentration has an insignificant relation with option grant

31
pay-for-performance sensitivity and a positive relation with the level of
compensation.
Focusing on additional measures of pay-for-performance sensitivity and
institutional influence, the results suggest that institutions do exert upward pressure on
the pay-for-performance sensitivity of option holdings and restricted stock holdings.
We interpret this as evidence that institutions recognize the importance of incentives
executives derive from holdings. However, by focusing on complete measures on
pay-for-performance sensitivity, we find that institutional influence has a negative
effect on private share holdings. This decline may be a result of institutions fearing
entrenchment effects or executives offsetting increases in other form of incentives.
The end result is a total reduction in the executive pay-for-performance sensitivities.
This means that the combined effect of increased levels of institutional influence is to
lower pay-for-performance sensitivity. In their attempt to increase the pay-for-
performance sensitivity of option and restricted stock holdings, institutions have
accepted that they need to pay executives a higher salary to take on this increased risk.
Also, due to the emphasis on market based pay, the result has been an increase in the
overall level of executive compensation. Indirect influence from institutions does not
support the claims of effective or consistent monitoring either. Our analysis reveals
that institutions have a preference for firms with higher levels of total compensations
and lower levels of pay-for-performance sensitivity. Overall, the results suggest that
institutions do not coordinate their monitoring efforts in a manner that is in the best
interests of shareholders. These results suggest that institutions have been ineffective
at monitoring the executive compensation policies of the firms in which they invest.

32
References
Almazan, A., J. Hartzell and L. Starks, 2004, Active Institutional Shareholders and
Managerial Compensation, Working Paper, University of Texas.
Badrinath, S., G. Gay and J. Kale, 1989, Patterns of Institutional Investment, Prudence and
the Managerial ‘Safety Net’ Hypothesis, Journal of Risk and Insurance 56, 605-629.
Bettis, C., J. Coles and M. Lemmon, 2000, Corporate Policies Restricting Trading by Insiders,
Journal of Financial Economics 57, 191-220.
Bettis, J., J. Bizjak and M. Lemmon, 2001, Insider Trading in Derivative Securities: An
Empirical Examination of the use of Zero-Cost Collars and Equity Swaps by Corporate
Insiders, Journal of Financial and Quantitative Analysis 36, 345-370.
Black, F., and M. Scholes, 1973, The Pricing of Options and Corporate Liabilities, Journal of
Political Economy 81, 637-54.
Brickley, J., R. Lease and C. Smith, 1988, Ownership Structure and Voting on Antitakeover
Amendments, Journal of Financial Economics 20, 267-92.
Bushee, B., 1998, The Influence of Institutional Investors on Myopic R&D Investment
Behavior, The Accounting Review 73, 305-333.
Core, J. and D. Larcker, 2002, Performance Consequences of Mandatory Increases in
Executive Stock Ownership, Journal of Financial Economics 64, 317-340.
Del Guercio, D. 1996, The Distorting Effects of the Prudent-Man Laws on Institutional
Equity Investments, Journal of Financial Economics 40, 31-62.
Fama, E. and M. Jensen, 1983, Separation of Ownership and Control, Journal of Law and
Economics 26, 301-326.
Garen, J., 1994, Executive Compensation and Principal-Agent Theory, Journal of Political
Economy 102, 1175-1199.
Garvey, G. and P. Swan, 2002, What Can Market Microstructure Contribute to Explaining
Incentive Pay?: Liquidity and the Use of Stock-Based Compensation, Working Paper,
Claremont Graduate University and University of New South Wales.
Gompers, P. and A. Metrick, 2001, Institutional Investors and Equity Prices, Quarterly
Journal of Economic 116, 229-259.
Grossman, S. and O. Hart, 1980, Takeover Bids, the Freerider Problem, and the Theory of the
Corporation, Bell Journal of Economics 11, 42-64.
Hall, B. and J. Liebman, 1998, Are CEOs Really Paid Like Bureaucrats? Quarterly Journal of
Economic 113, 653-691.
Hall, B. and K. Murphy, 2002, Stock Options for Undiversified Executives, Journal of
Accounting and Economics 33, 3-42.

33
Hartzell, J., and L. Starks, 2003, Institutional Investors and Executive Compensation, Journal
of Finance 58, 2351-2374.
Haubrich, J. 1994, Risk Aversion, Performance Pay, and the Principal-Agent Problem,
Journal of Political Economy 102, 258-276.
Jensen, M. and K. Murphy, 1990, Performance Pay and Top Management Incentives, Journal
of Political Economy 98, 225-264.
Johnson, M., S. Porter and M. Shackell, 1997, Stakeholder Pressure and the Structure of
Executive Compensation, Working Paper, University of Michigan Business School,
University of Texas at Austin.
Kole, S., 1997, The Complexity of Compensation Contracts, Journal of Financial Economics
43, 79-104.
Merton, R., 1973, Theory of Rational Option Pricing, Bell Journal of Economics and
Management Science 4, 141-183.
Ofek, E. and D. Yermack, 2000, Taking Stock: Equity Based Compensation and the
Evolution of Managerial Ownership, Journal of Finance 55, 1367-1384.
Qiu. L., 2004, Which Institutional Investors Monitor? Evidence from Acquisition Activity,
Working Paper Brown University.
Shleifer, A. and R. Vishny, 1986, Large Shareholders and Corporate Control, Journal of
Political Economy 94, 461-488.
Yermack, D. 1995, Do Corporations Award CEO Stock Options Effectively?, Journal of
Financial Economics 39, 237-69.

34
Table I
Institutional Investor Monitoring Characteristics This table presents ten portfolio characteristics that are used to model institutional monitoring. The variables are designed to capture two dimensions of the propensity of institutional investors to monitor- large holdings and a long holding period. The variable construction closely follows the methodology of Bushee (1998).
Variable Definition
Average Percentage Holding (APH) ( ) ∑∑ tktktk wPHw ,,, / Average Percentage Institutional Concentration (APIC)
( ) ∑∑ tktktk wPHICw ,,, /
Herfindahl Measure of Concentration (HERF) ( )∑ 2,ln tkPH
Portfolio Concentration (CONC) ∑ ttk NSTKw /,
Percent Held in Large Blocks (LBPH) ( ) ∑∑ tktktk wLBw ,,, /
Portfolio Turnover (PT) ( )∑ ∑∑ −+∆ 1,,, / tktktk www
Stability of Holdings (percent held for two years) (STAB)
( ) ∑∑ tktktk wLTw ,,, /
Average Portfolio Liquidity (APL) ( ) ∑∑ tktktk wLIQw ,,, /
Pressure Insensitive Institution (PII) tPII
Active Beta (AB) ( ) 1/ ,,, −∑∑ tktktk ww β
tNSTK = number of stocks owned by institution at end of quarter t.
tkw , = portfolio weight (shares held times stock price) in firm k at end of quarter t.
tkw ,∆ = tkw , - 1, −tkw
tkPH , = percentage of total shares in firm k held by institution at end of quarter t.
tkPHIC , = percentage of shares held by institutions in firm k held by institution at end of quarter t.
tkLB , = 1 if tkPH , > 0.05, 0 otherwise.
tkLT , = 1 if institution held firm k continuously for prior eight quarters, 0 otherwise.
tPII = 1 if the institution is classified as an investment company or independent adviser, and 0 if classified as bank trust departments, insurance companies or other. The other category is a mix of endowment funds, self managed corporate pension funds and a few public pension funds.
tkLIQ , = the 24 month average of month end volume divided my shares outstanding. It is hypothesised that more transient investors with demand more liquid stocks that facilitate them entering and exiting the firm.
tk ,β = the CAPM beta from regressions using 24 to 60 months of data. This captures the extent of indexing my institutions. A smaller active beta is indicative of greater indexing.
35
BLOCK PTURN-0.00022 0.04735
-0.03178 0.83215
0.04157 -0.80216
0.30765 0.56678
0.0101 0.65375
0.94216 0.00017
0.87926 -0.0208
0.33753 0.20593
0.55872 -0.05686
0.9086 -0.02874
Cluster N* BLOCK PTURN
Small Holding Long Term Institutions 18814 -0.51090 -0.71521
Small Holding Short Term Institutions 18317 -0.53114 0.62969
Large Holding Long Term Institutions 18317 0.56114 -0.76651
Large Holding Short Term Institutions 18838 0.48108 0.84734
* N represents the number of institution-quarters in each cluster.
Percent Held in Large Blocks
Mean Factor Scores
Panel B: Groups of Instituitions Based on Factor Scores
Herfindahl Measure of Concentration
Portfolio Turnover
Stability of Holdings
Active Beta
Average Portfolio Liquidity
Average Percentage Institutional Concentration
Average Percentage Holding
Table IIFactor Analysis of Institutional Investor Portfolio Characteristics
Pressure Insensitive Institution
Portfolio Concentration
Panel A: Factor Analysis
VARIABLEFACTORS
This table presents results from Factor Analysis of the ten portfolio characteristics detailed in Table I.Panel A shows the coefficients for each of then ten portfolio characterictics. BLOCK is the labelgiven to Factor 1 and is interpreted as reflecting the tendency of institutions to hold undiversifiedportfolios. PTURN is the label given to Factor 2 and is interpreted as reflecting the tendency ofinstitutions to hold short term positions. Panel B shows the average factor score of institutions thathave been grouped based on their factor scores. Small Holding Long Term Institutions have a factor 1score below the median of factor 1 and a factor 2 score below the median of factor 2. Small HoldingShort Term Institutions have a factor 1 score below the median of factor 1 and a factor 2 score abovethe median of factor 2. Large Holding Long Term Institutions have a factor 1 score above the medianof factor 1 and a factor 2 score below the median of factor 2. Large Holding Short Term Institutionshave a factor 1 score above the median of factor 1 and a factor 2 score above the median of factor 2.

36
Variable Mean Median Std Dev P10 P90
Pressure Insensitive Institution 0.2926 0 0.4550 0 1Portfolio Turnover 0.0994 0.0938 0.0363 0.0571 0.1492Stability of Holdings 0.7357 0.7580 0.1476 0.5386 0.9045Active Beta 0.1350 0.1029 0.1078 0.0276 0.2961Average Portfolio Liquidity 0.9277 0.8704 0.3683 0.5194 1.3826Average Percentage Institutional Concentration 0.0036 0.0019 0.0042 0.0004 0.0090Average Percentage Holding 0.0015 0.0009 0.0017 0.0002 0.0040Portfolio Concentration 0.0129 0.0102 0.0169 0.0026 0.0240Herfindahl Measure of Concentration -8.3777 -8.1018 2.4189 -11.4638 -5.4891Percent Held in Large Blocks 0.0008 0 0.0040 0 0
Pressure Insensitive Institution 0.4572 0 0.4982 0 1Portfolio Turnover 0.2183 0.1963 0.1021 0.1060 0.3747Stability of Holdings 0.2025 0.1474 0.2103 0 0.5119Active Beta 0.2057 0.1689 0.1579 0.0537 0.3986Average Portfolio Liquidity 1.4637 1.1626 1.2688 0.6491 2.4354Average Percentage Institutional Concentration 0.0053 0.0035 0.0057 0.0005 0.0127Average Percentage Holding 0.0023 0.0015 0.0022 0.0002 0.0055Portfolio Concentration 0.0210 0.0132 0.0380 0.0037 0.0364Herfindahl Measure of Concentration -8.0904 -7.7069 2.5402 -11.4305 -5.2095Percent Held in Large Blocks 0.0012 0 0.0052 0 0.0022
Pressure Insensitive Institution 0.2609 0 0.4391 0 1Portfolio Turnover 0.1073 0.1043 0.0407 0.0593 0.1613Stability of Holdings 0.7488 0.7702 0.1496 0.5508 0.9215Active Beta 0.1747 0.1341 0.1476 0.0351 0.3649Average Portfolio Liquidity 0.9497 0.8653 0.4159 0.5012 1.4981Average Percentage Institutional Concentration 0.0614 0.0314 0.0938 0.0086 0.1359Average Percentage Holding 0.0345 0.0148 0.0765 0.0041 0.0653Portfolio Concentration 0.0218 0.0057 0.0918 0.0008 0.0275Herfindahl Measure of Concentration -2.9393 -3.0872 2.0338 -5.4136 -0.2702Percent Held in Large Blocks 0.1580 0.0691 0.2194 0.0001 0.4451
Pressure Insensitive Institution 0.4328 0 0.4955 0 1Portfolio Turnover 0.2286 0.2123 0.0977 0.1224 0.3670Stability of Holdings 0.2711 0.2471 0.2371 0.0000 0.5990Active Beta 0.4367 0.3255 0.4317 0.0969 0.8613Average Portfolio Liquidity 1.8391 1.5102 1.5020 0.7679 3.0819Average Percentage Institutional Concentration 0.0600 0.0332 0.0836 0.0112 0.1324Average Percentage Holding 0.0292 0.0156 0.0538 0.0054 0.0568Portfolio Concentration 0.0544 0.0135 0.1492 0.0025 0.0899Herfindahl Measure of Concentration -3.7597 -3.5990 2.2293 -6.0242 -1.3883Percent Held in Large Blocks 0.1352 0.0544 0.2009 0 0.3908
Panel C: Large Holding Long Term Institutions
Panel D: Large Holding Short Term Institutions
Table IIIDescriptive Statistics of Institutional Portfolio Characterictics
Panel A: Small Holding Long Term Institutions
Panel B: Small Holding Short Term Institutions
This tables presents descriptive statistics of portfolio characteristics for the four groups of institutions formedfrom the results of factor analysis in Table II. Panel A presents descriptive statistics for institutions withsmall and long term holdings in their portfolio firms; Panel B for institutions with small and short termholdings in their portfolio firms; Panel C for institutions with large and long term holdings in their portfoliofirms; and Panel D for institutions with large and short term holdings in their portfolio firms.
37
Variable Mean Median Std Dev P10 P90
Small Holding Long Term Institutional Ownership 0.023 0.017 0.022 0.002 0.053
Small Holding Short Term Institutional Ownership 0.046 0.028 0.058 0.005 0.098
Large Holding Long Term Institutional Ownership 0.242 0.203 0.180 0.043 0.500
Large Holding Short Term Institutional Ownership 0.245 0.203 0.177 0.046 0.507
Institutional Concentration 0.450 0.424 0.151 0.282 0.656
Top5 Ownership 0.229 0.220 0.101 0.110 0.355
Total Institutional Ownership 0.546 0.561 0.206 0.258 0.801
PPS of Option Grants 1.161 0.156 3.829 0 2.822
PPS of Option Holdings 4.174 1.070 10.781 0 10.773
PPS of Restricted Stock Holdings 0.180 0 1.791 0 0.282
PPS of Privately Owned Shares 8.229 0.282 37.225 0 9.911
Total PPS 12.583 2.208 40.201 0 24.192
Salary 363.11 294.62 252.31 151.79 670.00
Total Compensation 2583.13 858.78 9807.01 238.75 5110.22
Tobin's Q 1.744 1.139 2.738 0.495 3.322
Market Capitalization 5606.99 1120.94 19881.08 197.54 10487.54
Table IVUnivariate Descriptive Statistics
Panel C: Firm Characteristics
Panel B: Executive Compensation
Panel A: Institutional Investor Holdings
This table reports sample statistics for the key variables used in this study. Panel A shows the measures ofinstitutional influence. Small Holding Long Term Institutional Ownership, Small Holding Short TermInstitutional Ownership, Large Holding Long Term Institutional Ownership and Large Holding Short TermInstitutional Ownership are the proportion of outstanding shares held by each of the four groups ofinstitutions formed using factor analysis. Institutional Concentration is the shares owned by the institutionswith the five largest holdings divided by the shares held by all institutions. Top 5 Ownership is theproportion of shares outstanding held by the institutions with the five largest holdings. Total InstitutionalOwnership is the proportion of shares held by all institutions. Panel B shows the measures executivecompensation. The pay-for-performance sensitivity (PPS) measures show the change in executive wealth dueto a $1000 change in firm in shareholder wealth. Total PPS is the sum of option holdings, restricted stockholding and privately owned shares PPS. Salary and Total Compensation are expressed in thousands of dollarsization is expressed in millions of dollars.

38
This table presents the correlations between the key variables. Small Holding Long Term (SHLT) Institutional Ownership, Small Holding Short Term (SHST) InstitutionalOwnership, Large Holding Long Term (LHLT) Institutional Ownership and Large Holding Short Term (LHST) Institutional Ownership are the proportion of outstanding shares heldby each of the four groups of institutions formed using factor analysis. Institutional Concentration is the shares owned by the institutions with the five largest holdings divided by theshares held by all institutions. Top 5 Ownership is the proportion of shares outstanding held by the institutions with the five largest holdings. Total Institutional Ownership is theproportion of shares held by all institutions. The pay-for-performance sensitivity (PPS) measures are the change in executive wealth due to a $1000 change in firm in shareholderwealth. Total pay-for-performance sensitivity is the sum of option holdings, restricted stock holding and privately share holding pay-for-performance sensitivity. The naturallogarithm of firm market capitalization is used.
Table VPairwise Correlations
SHLT
Insti
tutio
nal O
wner
ship
SHST
Insti
tutio
nal O
wner
ship
LHLT
Insti
tutio
nal O
wner
ship
LHLT
Insti
tutio
nal O
wner
ship
Insti
tutio
nal C
once
ntra
tion
Top 5
Own
ersh
ipTo
tal O
wner
ship
PPS
of O
ptio
n Hol
ding
sPP
S of
Opt
ion G
rant
sPP
S Re
strict
ed St
ock H
oldi
ngs
PPS
of P
rivat
ely O
wned
Shar
es
Tota
l PPS
Sala
ry
Tota
l Com
pens
atio
nM
arke
t Cap
italiz
atio
nTo
bin's
Q
SHLT Institutional Ownership 1SHST Institutional Ownership -0.036 1LHLT Institutional Ownership 0.380 -0.247 1LHST Institutional Ownership -0.184 0.215 -0.343 1Institutional Concentration -0.376 -0.220 -0.184 -0.132 1Top 5 Ownership -0.103 0.076 0.240 0.449 0.268 1Total Ownership 0.176 0.253 0.381 0.564 -0.415 0.706 1PPS of Option Holdings -0.098 -0.018 -0.107 0.080 0.151 0.064 -0.019 1PPS of Option Grants -0.081 -0.013 -0.083 0.055 0.122 0.042 -0.024 0.560 1PPS of Restricted Stock Holdings -0.006 -0.002 0.010 0.002 0.011 0.014 0.006 0.054 0.045 1PPS of Privately Owned Shares -0.074 -0.049 -0.062 -0.057 0.093 -0.040 -0.108 0.129 0.071 0.043 1Total PPS -0.093 -0.050 -0.084 -0.034 0.124 -0.021 -0.105 0.390 0.218 0.099 0.962 1Salary 0.142 0.107 0.099 0.051 -0.270 -0.012 0.171 0.109 0.038 0.053 0.070 0.096 1Total Compensation 0.123 0.172 -0.034 0.186 -0.303 -0.003 0.217 0.229 0.306 0.069 0.013 0.076 0.641 1Market Capitalization 0.282 0.200 0.113 0.092 -0.630 -0.157 0.261 -0.179 -0.156 -0.014 -0.090 -0.133 0.420 0.501 1Tobin's Q -0.073 -0.007 -0.044 0.018 -0.008 -0.034 0.002 0.016 0.015 -0.011 0.044 0.045 -0.083 0.023 0.066 1
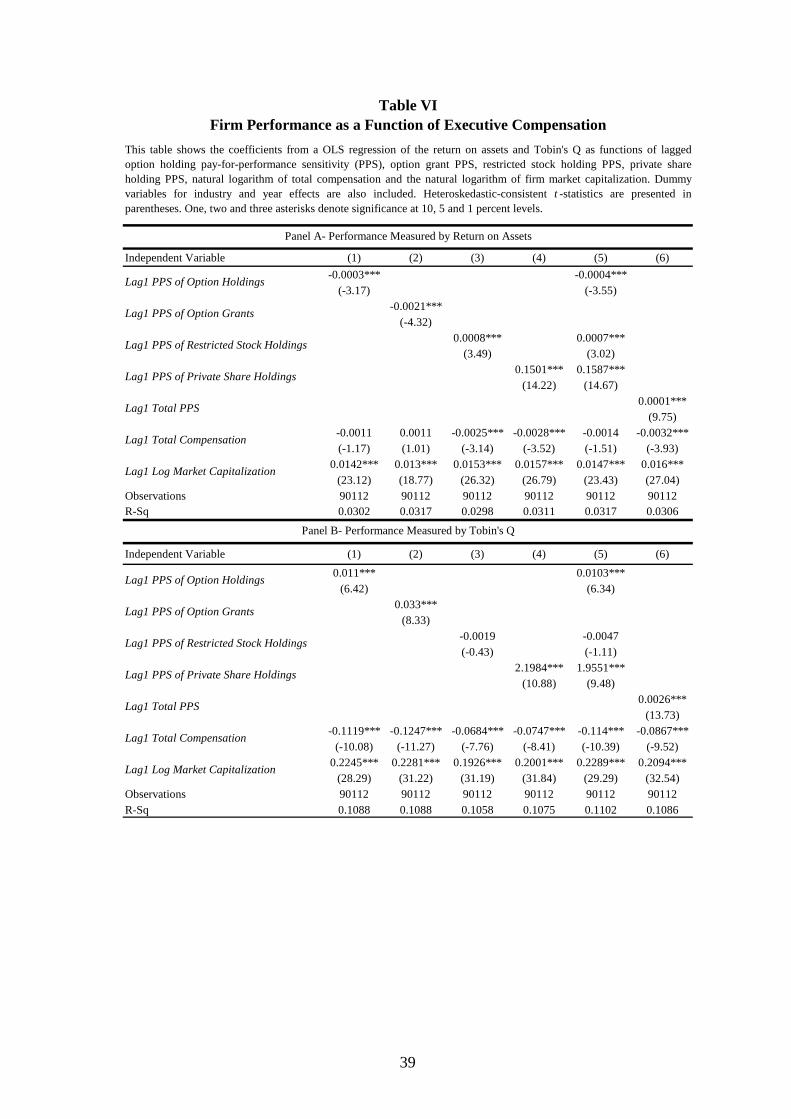
39
Independent Variable (1) (2) (3) (4) (5) (6)-0.0003*** -0.0004***
(-3.17) (-3.55)-0.0021***
(-4.32)0.0008*** 0.0007***
(3.49) (3.02)0.1501*** 0.1587***
(14.22) (14.67)0.0001***
(9.75)-0.0011 0.0011 -0.0025*** -0.0028*** -0.0014 -0.0032***(-1.17) (1.01) (-3.14) (-3.52) (-1.51) (-3.93)
0.0142*** 0.013*** 0.0153*** 0.0157*** 0.0147*** 0.016***(23.12) (18.77) (26.32) (26.79) (23.43) (27.04)
Observations 90112 90112 90112 90112 90112 90112R-Sq 0.0302 0.0317 0.0298 0.0311 0.0317 0.0306
Independent Variable (1) (2) (3) (4) (5) (6)
0.011*** 0.0103***(6.42) (6.34)
0.033***(8.33)
-0.0019 -0.0047(-0.43) (-1.11)
2.1984*** 1.9551***(10.88) (9.48)
0.0026***(13.73)
-0.1119*** -0.1247*** -0.0684*** -0.0747*** -0.114*** -0.0867***(-10.08) (-11.27) (-7.76) (-8.41) (-10.39) (-9.52)
0.2245*** 0.2281*** 0.1926*** 0.2001*** 0.2289*** 0.2094***(28.29) (31.22) (31.19) (31.84) (29.29) (32.54)
Observations 90112 90112 90112 90112 90112 90112R-Sq 0.1088 0.1088 0.1058 0.1075 0.1102 0.1086
Lag1 Log Market Capitalization
Lag1 PPS of Restricted Stock Holdings
Lag1 PPS of Private Share Holdings
Lag1 Total PPS
Lag1 Total Compensation
Lag1 Total Compensation
Lag1 Log Market Capitalization
Lag1 PPS of Option Holdings
Lag1 PPS of Option Grants
Panel B- Performance Measured by Tobin's Q
This table shows the coefficients from a OLS regression of the return on assets and Tobin's Q as functions of laggedoption holding pay-for-performance sensitivity (PPS), option grant PPS, restricted stock holding PPS, private shareholding PPS, natural logarithm of total compensation and the natural logarithm of firm market capitalization. Dummyvariables for industry and year effects are also included. Heteroskedastic-consistent t -statistics are presented inparentheses. One, two and three asterisks denote significance at 10, 5 and 1 percent levels.
Table VIFirm Performance as a Function of Executive Compensation
Panel A- Performance Measured by Return on Assets
Lag1 Total PPS
Lag1 PPS of Option Holdings
Lag1 PPS of Option Grants
Lag1 PPS of Restricted Stock Holdings
Lag1 PPS of Private Share Holdings

40
Table VII
Analysis of Pay-for-Performance Sensitivity of Option Grants as a Function of Institutional Influence This table shows the coefficients from a Tobit regression of option grant pay-for-performance sensitivity per $1000 change in shareholder wealth against the lagged change and contemporary change in shareholder wealth, measures of institutional influence, Tobin's Q, firm market capitalization and dummy controls for CEO, industry and year effects. Model (1) and (4) use Institutional Concentration as a measure of institutional influence, and is defined as the shares owned by the institutions with the five largest holdings divided by the shares held by all institutions. These models control for total institutional ownership. Model (2) and (5) use Top 5 Ownership as a measure of institutional influence, and this is defined as the proportion of shares outstanding held by the institutions with the five largest holdings. Model (3) and (6) use Large Holding Long Term (LHLT) Institutional Ownership and Large Holding Short Term (LHST) Institutional Ownership as measures of institutional influence, and are defined as the proportion of outstanding shares held by each of the respective groups of institutions formed using factor analysis. Coefficients for year and industry controls are not presented. Heteroskedastic-consistent t-statistics are presented in parentheses below each coefficient. One, two and three asterisks denote significance at 10, 5 and 1 percent levels. Independent Variable (1) (2) (3) (4) (5) (6)
-4.46E-06*** -6.63E-06*** -7.13E-06*** -2.28E-06* -2.12E-06* -3.38E-06*** Change Shareholder Wealth (-3.2) (-4.53) (-4.72) (-1.76) (-1.65) (-2.64)
-2.48E-06 -1.30E-06 7.04E-07 -4.04E-07 -6.25E-07 -1.87E-07 Lag1 Change Shareholder Wealth (-1.21) (-0.61) (0.44) (-0.22) (-0.34) (-0.14)
2.6285*** 0.3043 Lag1 Institutional Concentration (13.96) (1.53)
0.7299*** 0.9531*** Lag1 Total Ownership (6.83) (9.13)
1.2247*** 0.637*** Lag1 Top5 Ownership (5.38) (2.81) -0.7949*** 0.209 Lag1 LHLT Institutional Ownership (-4.69) (1.26) 0.8458*** 1.3603*** Lag1 LHST Institutional Ownership (5.51) (9.12)
0.0481*** 0.0491*** 0.0395*** 0.0712*** 0.0679*** 0.0672*** Lag1 Tobin's Q (4.87) (4.92) (3.9) (7.2) (6.87) (6.66)
-7.43E-06*** -1.14E-05*** -1.18E-05*** Lag1 Market Capitalization (-9.64) (-14.89) (-16.68)
-0.4117*** -0.3891*** -0.398*** Lag1 Log Market Capitalization (-30.01) (-28.34) (-30.88)
2.8301*** 2.8263*** 2.6902*** 2.8229*** 2.8243*** 2.6864*** CEO Dummy (33.9) (33.8) (29.7) (33.98) (34.02) (29.87)
Observations 97467 97467 79434 97467 97467 79434

41
Table VIII Analysis of Pay-for-Performance Sensitivity of Option Holdings as a Function of Institutional Influence
This table shows the coefficients from a Tobit regression of option holding pay-for-performance sensitivity per $1000 change in shareholder wealth against the lagged change and contemporary change in shareholder wealth, measures of institutional influence, Tobin's Q, firm market capitalization and dummy controls for CEO, industry and year effects. Model (1) and (4) use Institutional Concentration as a measure of institutional influence, and is defined as the shares owned by the institutions with the five largest holdings divided by the shares held by all institutions. These models control for total institutional ownership. Model (2) and (5) use Top 5 Ownership as a measure of institutional influence, and this is defined as the proportion of shares outstanding held by the institutions with the five largest holdings. Model (3) and (6) use Large Holding Long Term (LHLT) Institutional Ownership and Large Holding Short Term (LHST) Institutional Ownership as measures of institutional influence, and are defined as the proportion of outstanding shares held by each of the respective groups of institutions formed using factor analysis. Coefficients for year and industry controls are not presented. Heteroskedastic-consistent t-statistics are presented in parentheses below each coefficient. One, two and three asterisks denote significance at 10, 5 and 1 percent levels. Independent Variable (1) (2) (3) (4) (5) (6)
-1.24E-05*** -2.07E-05*** -1.98E-05*** -3.64E-06* -3.82E-06* -5.71E-06** Change Shareholder Wealth (-5) (-7.04) (-6.18) (-1.68) (-1.76) (-2.49)
1.36E-05*** 1.73E-05*** 2.25E-05*** 1.51E-05*** 1.54E-05*** 1.54E-05*** Lag1 Change Shareholder Wealth (3.9) (4.29) (5.5) (5) (5.11) (5.45)
10.1776*** 2.4828*** Lag1 Institutional Concentration (28.63) (6.61)
1.6889*** 2.5188*** Lag1 Total Ownership (8.15) (12.6)
4.5685*** 2.5468*** Lag1 Top5 Ownership (10.31) (5.75) -3.0561*** 0.8037** Lag1 LHLT Institutional Ownership (-9.06) (2.52) 1.2599*** 3.2349*** Lag1 LHST Institutional Ownership (3.89) (10.54)
0.1869*** 0.1924*** 0.1283*** 0.2608*** 0.2599*** 0.2317*** Lag1 Tobin's Q (8.95) (9.09) (6.15) (12.08) (11.96) (10.66)
-3.07E-05*** -4.60E-05*** -4.74E-05*** Lag1 Market Capitalization (-20.22) (-25.2) (-25.09)
-1.3979*** -1.4324*** -1.4953*** Lag1 Log Market Capitalization (-46.97) (-47) (-49.44)
10.8537*** 10.8365*** 10.7715*** 10.8258*** 10.8247*** 10.7537*** CEO Dummy (64.73) (64.14) (59.76) (65.52) (65.5) (61.12)
Observations 97467 97467 79434 97467 97467 79434

42
Table IX Analysis of Pay-for-Performance Sensitivity of Restricted Stock Holdings as a Function of Institutional Influence
This table shows the coefficients from a Tobit regression of restricted stock holding pay-for-performance sensitivity per $1000 change in shareholder wealth against the lagged change and contemporary change in shareholder wealth, measures of institutional influence, Tobin's Q, firm market capitalization and dummy controls for CEO, industry and year effects. Model (1) and (4) use Institutional Concentration as a measure of institutional influence, and is defined as the shares owned by the institutions with the five largest holdings divided by the shares held by all institutions. These models control for total institutional ownership. Model (2) and (5) use Top 5 Ownership as a measure of institutional influence, and this is defined as the proportion of shares outstanding held by the institutions with the five largest holdings. Model (3) and (6) use Large Holding Long Term (LHLT) Institutional Ownership and Large Holding Short Term (LHST) Institutional Ownership as measures of institutional influence, and are defined as the proportion of outstanding shares held by each of the respective groups of institutions formed using factor analysis. Coefficients for year and industry controls are not presented. Heteroskedastic-consistent t-statistics are presented in parentheses below each coefficient. One, two and three asterisks denote significance at 10, 5 and 1 percent levels. Independent Variable (1) (2) (3) (4) (5) (6)
1.32E-05*** 1.59E-05*** 1.13E-05*** 1.04E-05*** 1.09E-05*** 8.44E-06*** Change Shareholder Wealth (5.6) (5.8) (5.1) (5.05) (5.23) (4.84)
-5.08E-06*** -5.07E-06*** -5.35E-06*** -2.90E-06* -3.45E-06** -3.14E-06** Lag1 Change Shareholder Wealth (-2.75) (-2.67) (-2.76) (-1.71) (-2.04) (-2)
-2.7937*** -0.4756** Lag1 Institutional Concentration (-5.24) (-2)
2.0543*** 1.77*** Lag1 Total Ownership (7.55) (7.58)
1.3557*** 2.3881*** Lag1 Top5 Ownership (6.33) (7.22) 2.7552*** 1.8668*** Lag1 LHLT Institutional Ownership (4.61) (4.2) 0.9885*** 0.6085*** Lag1 LHST Institutional Ownership (5.8) (4.57)
-0.3389*** -0.3232*** -0.2543*** -0.3767*** -0.381*** -0.3125*** Lag1 Tobin's Q (-7.25) (-7.36) (-5.9) (-7.19) (-7.19) (-5.81)
1.14E-05*** 1.60E-05*** 1.15E-05*** Lag1 Market Capitalization (6.5) (6.48) (5.04)
0.4348*** 0.5403*** 0.3876*** Lag1 Log Market Capitalization (6.36) (6.39) (5.33)
1.2061*** 1.2055*** 0.9331*** 1.2188*** 1.222*** 0.946*** CEO Dummy (9.44) (9.41) (10.2) (9.42) (9.4) (10.17)
Observations 97467 97467 79434 97467 97467 79434

43
Table X Analysis of Pay-for-Performance Sensitivity of Private Shares Holdings as a Function of Institutional Influence
This table shows the coefficients from a Tobit regression of private share holding pay-for-performance sensitivity per $1000 change in shareholder wealth against the lagged change and contemporary change in shareholder wealth, measures of institutional influence, Tobin's Q, firm market capitalization and dummy controls for CEO, industry and year effects. Model (1) and (4) use Institutional Concentration as a measure of institutional influence, and is defined as the shares owned by the institutions with the five largest holdings divided by the shares held by all institutions. These models control for total institutional ownership. Model (2) and (5) use Top 5 Ownership as a measure of institutional influence, and this is defined as the proportion of shares outstanding held by the institutions with the five largest holdings. Model (3) and (6) use Large Holding Long Term (LHLT) Institutional Ownership and Large Holding Short Term (LHST) Institutional Ownership as measures of institutional influence, and are defined as the proportion of outstanding shares held by each of the respective groups of institutions formed using factor analysis. Coefficients for year and industry controls are not presented. Heteroskedastic-consistent t-statistics are presented in parentheses below each coefficient. One, two and three asterisks denote significance at 10, 5 and 1 percent levels. Independent Variable (1) (2) (3) (4) (5) (6)
-2.81E-05** -4.93E-05*** -3.46E-05** -1.16E-05 -1.71E-05 -1.14E-05 Change Shareholder Wealth (-2) (-3.31) (-2.1) (-0.87) (-1.27) (-0.74)
3.85E-05** 3.43E-05** 3.85E-05** 8.34E-06 1.64E-05 9.79E-06 Lag1 Change Shareholder Wealth (2.38) (2.01) (2.07) (0.58) (1.11) (0.6)
7.4408*** 2.1347 Lag1 Institutional Concentration (6.37) (1.51)
-22.072*** -20.9628*** Lag1 Total Ownership (-25.26) (-24.43)
-24.9612*** -27.7553*** Lag1 Top5 Ownership (-16.3) (-17.91) -29.1058*** -24.7678*** Lag1 LHLT Institutional Ownership (-21.37) (-18.29) -24.2346*** -21.8494*** Lag1 LHST Institutional Ownership (-21.44) (-19.66)
0.3819*** 0.377*** 0.278*** 0.4155*** 0.4772*** 0.3716*** Lag1 Tobin's Q (5.33) (5.31) (3.87) (5.78) (6.67) (5.13)
-5.70E-05*** -8.87E-05*** -7.25E-05*** Lag1 Market Capitalization (-8.26) (-12.12) (-9.77)
-1.1616*** -2.3282*** -1.6663*** Lag1 Log Market Capitalization (-10.38) (-25.13) (-17.21)
35.7931*** 35.7961*** 37.6206*** 35.7859*** 35.7722*** 37.6074*** CEO Dummy (53.33) (52.83) (49.75) (53.32) (53.04) (49.83)
Observations 97467 97467 79434 97467 97467 79434
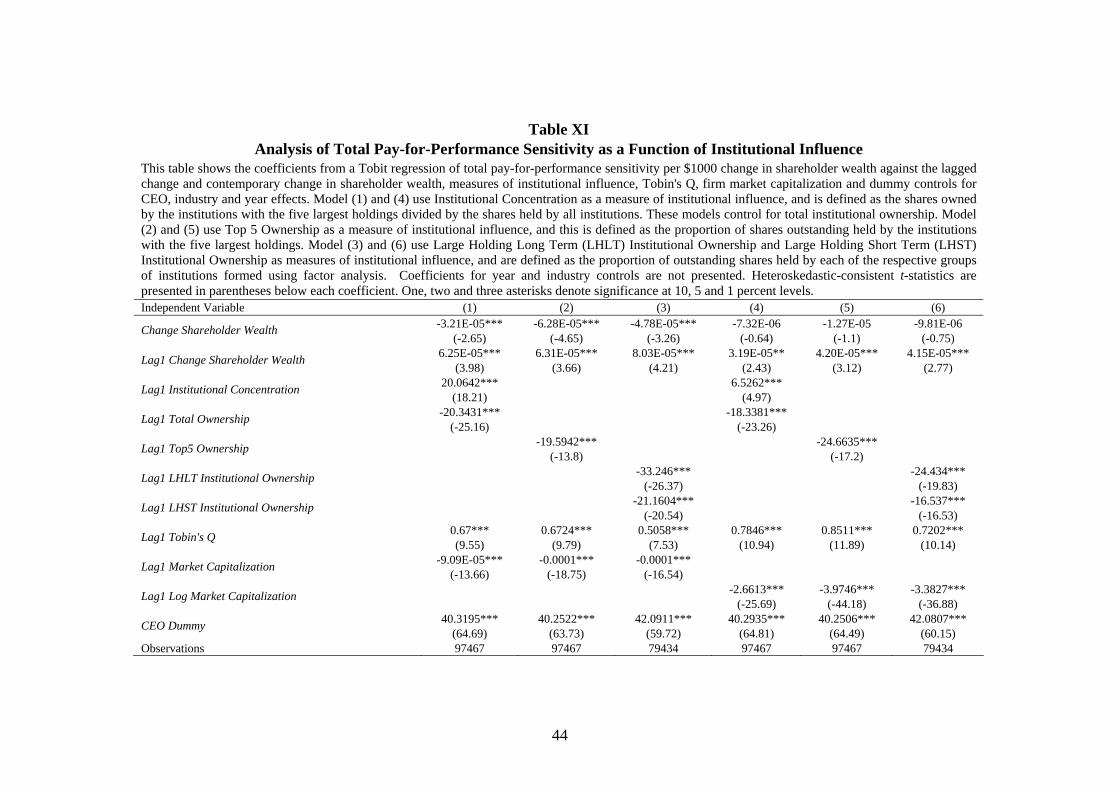
44
Table XI Analysis of Total Pay-for-Performance Sensitivity as a Function of Institutional Influence
This table shows the coefficients from a Tobit regression of total pay-for-performance sensitivity per $1000 change in shareholder wealth against the lagged change and contemporary change in shareholder wealth, measures of institutional influence, Tobin's Q, firm market capitalization and dummy controls for CEO, industry and year effects. Model (1) and (4) use Institutional Concentration as a measure of institutional influence, and is defined as the shares owned by the institutions with the five largest holdings divided by the shares held by all institutions. These models control for total institutional ownership. Model (2) and (5) use Top 5 Ownership as a measure of institutional influence, and this is defined as the proportion of shares outstanding held by the institutions with the five largest holdings. Model (3) and (6) use Large Holding Long Term (LHLT) Institutional Ownership and Large Holding Short Term (LHST) Institutional Ownership as measures of institutional influence, and are defined as the proportion of outstanding shares held by each of the respective groups of institutions formed using factor analysis. Coefficients for year and industry controls are not presented. Heteroskedastic-consistent t-statistics are presented in parentheses below each coefficient. One, two and three asterisks denote significance at 10, 5 and 1 percent levels. Independent Variable (1) (2) (3) (4) (5) (6)
-3.21E-05*** -6.28E-05*** -4.78E-05*** -7.32E-06 -1.27E-05 -9.81E-06 Change Shareholder Wealth (-2.65) (-4.65) (-3.26) (-0.64) (-1.1) (-0.75)
6.25E-05*** 6.31E-05*** 8.03E-05*** 3.19E-05** 4.20E-05*** 4.15E-05*** Lag1 Change Shareholder Wealth (3.98) (3.66) (4.21) (2.43) (3.12) (2.77)
20.0642*** 6.5262*** Lag1 Institutional Concentration (18.21) (4.97)
-20.3431*** -18.3381*** Lag1 Total Ownership (-25.16) (-23.26)
-19.5942*** -24.6635*** Lag1 Top5 Ownership (-13.8) (-17.2) -33.246*** -24.434*** Lag1 LHLT Institutional Ownership (-26.37) (-19.83) -21.1604*** -16.537*** Lag1 LHST Institutional Ownership (-20.54) (-16.53)
0.67*** 0.6724*** 0.5058*** 0.7846*** 0.8511*** 0.7202*** Lag1 Tobin's Q (9.55) (9.79) (7.53) (10.94) (11.89) (10.14)
-9.09E-05*** -0.0001*** -0.0001*** Lag1 Market Capitalization (-13.66) (-18.75) (-16.54)
-2.6613*** -3.9746*** -3.3827*** Lag1 Log Market Capitalization (-25.69) (-44.18) (-36.88)
40.3195*** 40.2522*** 42.0911*** 40.2935*** 40.2506*** 42.0807*** CEO Dummy (64.69) (63.73) (59.72) (64.81) (64.49) (60.15)
Observations 97467 97467 79434 97467 97467 79434

45
Table XII Salary as a Function of Institutional Influence
This table shows the coefficients from a OLS regression of the natural logarithm of salary against the lagged change and contemporary change in shareholder wealth, measures of institutional influence, Tobin's Q, firm market capitalization and dummy controls for CEO, industry and year effects. Model (1) and (4) use Institutional Concentration as a measure of institutional influence, and is defined as the shares owned by the institutions with the five largest holdings divided by the shares held by all institutions. These models control for total institutional ownership. Model (2) and (5) use Top 5 Ownership as a measure of institutional influence, and this is defined as the proportion of shares outstanding held by the institutions with the five largest holdings. Model (3) and (6) use Large Holding Long Term (LHLT) Institutional Ownership and Large Holding Short Term (LHST) Institutional Ownership as measures of institutional influence, and are defined as the proportion of outstanding shares held by each of the respective groups of institutions formed using factor analysis. Coefficients for year and industry controls are not presented. Heteroskedastic-consistent t-statistics are presented in parentheses below each coefficient. One, two and three asterisks denote significance at 10, 5 and 1 percent levels. Independent Variable (1) (2) (3) (4) (5) (6)
4.95E-06*** 5.86E-06*** 5.11E-06*** 3.22E-06*** 3.22E-06*** 2.91E-06*** Change Shareholder Wealth (12.59) (12.49) (10.57) (11.97) (11.91) (9.8)
-1.78E-06 -1.93E-06 -2.46E-06* 4.10E-07 4.17E-07 2.90E-07 Lag1 Change Shareholder Wealth (-1.52) (-1.6) (-1.74) (0.48) (0.49) (0.29)
-0.8327*** 0.1242*** Lag1 Institutional Concentration (-52.96) (7.41)
0.3095*** 0.1681*** Lag1 Total Ownership (27.37) (15.8)
0.0704*** 0.2735*** Lag1 Top5 Ownership (3.28) (14.03) 0.6185*** 0.1392*** Lag1 LHLT Institutional Ownership (31.78) (7.6) 0.3584*** 0.1057*** Lag1 LHST Institutional Ownership (24.79) (7.85)
-0.0323*** -0.0327*** -0.0289*** -0.0405*** -0.0404*** -0.0402*** Lag1 Tobin's Q (-23.07) (-23.7) (-20.42) (-25.72) (-25.8) (-23.12)
6.45E-06*** 7.99E-06*** 7.50E-06*** Lag1 Market Capitalization (20.45) (23.48) (20.38)
0.1881*** 0.1893*** 0.1842*** Lag1 Log Market Capitalization (90.64) (110.16) (92.19)
0.7085*** 0.7117*** 0.7041*** 0.7103*** 0.7104*** 0.7038*** CEO Dummy (105.23) (102.98) (91.9) (108.72) (108.82) (96.22)
Observations 97122 97122 79167 97122 97122 79167 R-Sq 0.2671 0.2187 0.2303 0.3413 0.3409 0.3415

46
Table XIII Total Compensation as a Function of Institutional Influence
This table shows the coefficients from a OLS regression of the natural logarithm of total compensation valued at grant date against the lagged change and contemporary change in shareholder wealth, measures of institutional influence, Tobin's Q, firm market capitalization and dummy controls for CEO, industry and year effects. Model (1) and (4) use Institutional Concentration as a measure of institutional influence, and is defined as the shares owned by the institutions with the five largest holdings divided by the shares held by all institutions. These models control for total institutional ownership. Model (2) and (5) use Top 5 Ownership as a measure of institutional influence, and this is defined as the proportion of shares outstanding held by the institutions with the five largest holdings. Model (3) and (6) use Large Holding Long Term (LHLT) Institutional Ownership and Large Holding Short Term (LHST) Institutional Ownership as measures of institutional influence, and are defined as the proportion of outstanding shares held by each of the respective groups of institutions formed using factor analysis. Coefficients for year and industry controls are not presented. Heteroskedastic-consistent t-statistics are presented in parentheses below each coefficient. One, two and three asterisks denote significance at 10, 5 and 1 percent levels. Independent Variable (1) (2) (3) (4) (5) (6)
7.84E-06*** 9.79E-06*** 7.19E-06*** 3.90E-06*** 3.92E-06*** 2.21E-06*** Change Shareholder Wealth (8.54) (9.18) (6.73) (5.76) (5.77) (3.08)
-5.74E-06*** -5.90E-06*** -7.84E-06*** -7.44E-09 -4.40E-08 -1.02E-06 Lag1 Change Shareholder Wealth (-5.77) (-5.16) (-6.3) (-0.01) (-0.06) (-1.42)
-1.6944*** 0.302*** Lag1 Institutional Concentration (-59.67) (9.86)
0.8208*** 0.5051*** Lag1 Total Ownership (40.49) (26.42)
0.2402*** 0.6452*** Lag1 Top5 Ownership (6.02) (17.85) 1.2093*** 0.1791*** Lag1 LHLT Institutional Ownership (36.45) (5.78) 1.1511*** 0.6023*** Lag1 LHST Institutional Ownership (39.49) (22.58)
0.0286*** 0.0274*** 0.0352*** 0.0121*** 0.0117*** 0.0121*** Lag1 Tobin's Q (9.78) (9) (10.54) (4.4) (4.25) (4.02)
1.47E-05*** 1.79E-05*** 1.70E-05*** Lag1 Market Capitalization (29.39) (30.73) (28.56)
0.4*** 0.4063*** 0.3955*** Lag1 Log Market Capitalization (134.36) (178.41) (156.05)
1.0972*** 1.1042*** 1.0976*** 1.1003*** 1.1006*** 1.0964*** CEO Dummy (111.58) (105.44) (97.54) (120.98) (120.58) (110.21)
Observations 97122 97122 79167 97122 97122 79167 R-Sq 0.3074 0.2368 0.2571 0.4025 0.3999 0.4053

47
Independent Variable (1) (2) (3) (4) (5) (6) (7)
-8.94E-05 8.87E-05(-1.44) (1.36)
-0.0015*** -0.0014***(-6.81) (-6.3)
-0.0006** -0.0003 -0.0002(-2.35) (-1.22) (-1.01)
-0.5175*** -0.5193*** -0.5146***(-35.43) (-35.27) (-35.3)
-0.0005***(-33.21)
0.0149*** 0.0171*** 0.0146*** 0.016*** 0.0157*** 0.0183*** 0.0177***(22.95) (24.59) (24.03) (26.33) (23.98) (26.26) (28.83)
0.0219*** 0.0205*** 0.0221*** 0.0204*** 0.0206*** 0.0189*** 0.0192***(40.4) (36.82) (42.83) (39.42) (37.88) (33.86) (36.64)
Observations 90112 90112 90112 90112 90112 90112 90112R-Sq 0.1652 0.1659 0.1652 0.1754 0.1752 0.1759 0.1745
Lag1 PPS of Private Share Holdings
Lag1 Total PPS
Lag1 Total Compensation
Lag1 Log Market Capitalization
Table XIVInstitutional Holdings as a Function of Executive Compensation
This table shows the coefficients from a OLS regression of total institutional ownership as a function of lagged measures of option grant pay-for-performance sensitivity(PPS), option holding PPS, restricted stock holding PPS, private share holding PPS, total PPS, the natural logarithm of total compensation and market capitalization.Dummy variables for industry and year effects are also included but not presented. Heteroskedastic-consistent t -statistics are presented in parentheses below eachcoefficient. One, two and three asterisks denote significance at 10, 5 and 1 percent levels.
Lag1 PPS of Option Holdings
Lag1 PPS of Option Grants
Lag1 PPS of Restricted Stock Holdings
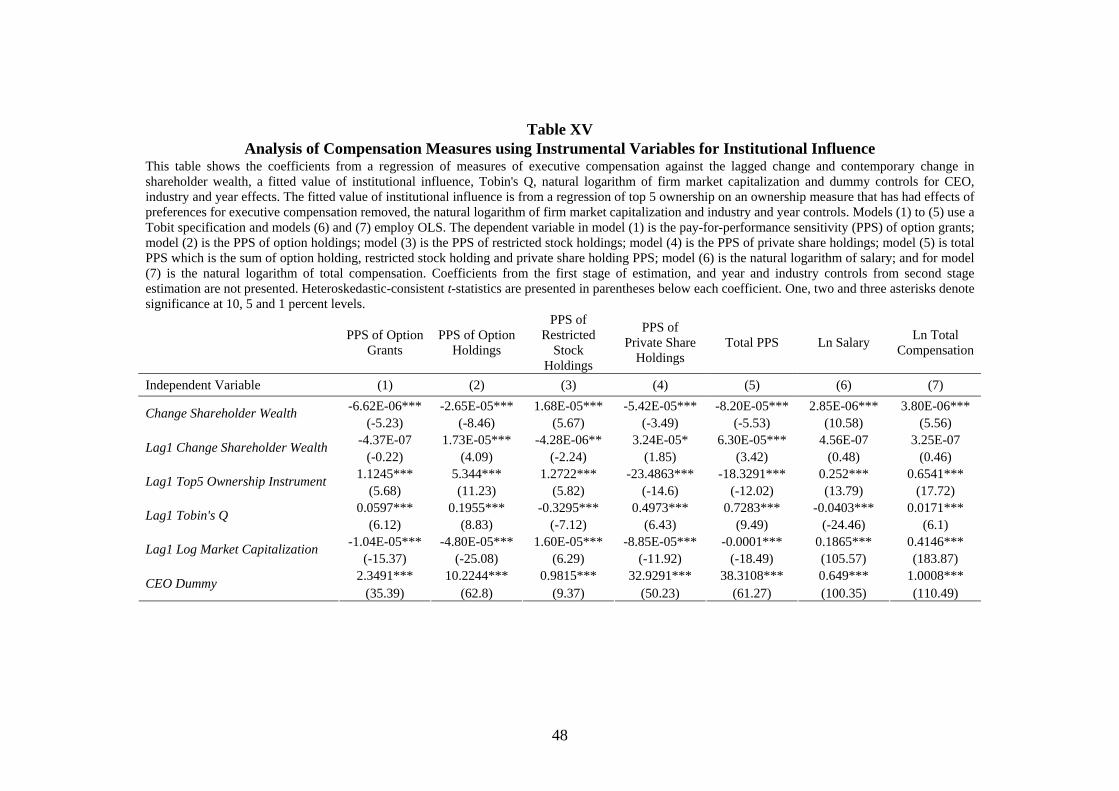
48
Table XV Analysis of Compensation Measures using Instrumental Variables for Institutional Influence
This table shows the coefficients from a regression of measures of executive compensation against the lagged change and contemporary change in shareholder wealth, a fitted value of institutional influence, Tobin's Q, natural logarithm of firm market capitalization and dummy controls for CEO, industry and year effects. The fitted value of institutional influence is from a regression of top 5 ownership on an ownership measure that has had effects of preferences for executive compensation removed, the natural logarithm of firm market capitalization and industry and year controls. Models (1) to (5) use a Tobit specification and models (6) and (7) employ OLS. The dependent variable in model (1) is the pay-for-performance sensitivity (PPS) of option grants; model (2) is the PPS of option holdings; model (3) is the PPS of restricted stock holdings; model (4) is the PPS of private share holdings; model (5) is total PPS which is the sum of option holding, restricted stock holding and private share holding PPS; model (6) is the natural logarithm of salary; and for model (7) is the natural logarithm of total compensation. Coefficients from the first stage of estimation, and year and industry controls from second stage estimation are not presented. Heteroskedastic-consistent t-statistics are presented in parentheses below each coefficient. One, two and three asterisks denote significance at 10, 5 and 1 percent levels.
PPS of Option Grants
PPS of Option Holdings
PPS of Restricted
Stock Holdings
PPS of Private Share
Holdings Total PPS Ln Salary Ln Total
Compensation
Independent Variable (1) (2) (3) (4) (5) (6) (7) -6.62E-06*** -2.65E-05*** 1.68E-05*** -5.42E-05*** -8.20E-05*** 2.85E-06*** 3.80E-06*** Change Shareholder Wealth
(-5.23) (-8.46) (5.67) (-3.49) (-5.53) (10.58) (5.56) -4.37E-07 1.73E-05*** -4.28E-06** 3.24E-05* 6.30E-05*** 4.56E-07 3.25E-07 Lag1 Change Shareholder Wealth
(-0.22) (4.09) (-2.24) (1.85) (3.42) (0.48) (0.46) 1.1245*** 5.344*** 1.2722*** -23.4863*** -18.3291*** 0.252*** 0.6541*** Lag1 Top5 Ownership Instrument
(5.68) (11.23) (5.82) (-14.6) (-12.02) (13.79) (17.72) 0.0597*** 0.1955*** -0.3295*** 0.4973*** 0.7283*** -0.0403*** 0.0171*** Lag1 Tobin's Q
(6.12) (8.83) (-7.12) (6.43) (9.49) (-24.46) (6.1) -1.04E-05*** -4.80E-05*** 1.60E-05*** -8.85E-05*** -0.0001*** 0.1865*** 0.4146*** Lag1 Log Market Capitalization
(-15.37) (-25.08) (6.29) (-11.92) (-18.49) (105.57) (183.87) 2.3491*** 10.2244*** 0.9815*** 32.9291*** 38.3108*** 0.649*** 1.0008*** CEO Dummy
(35.39) (62.8) (9.37) (50.23) (61.27) (100.35) (110.49)

49
Table XVI Analysis of Compensation using Fixed and Random Effects
This table shows the coefficients from a regression of measures of executive compensation against the lagged change and contemporary change in shareholder wealth, top 5 institutional ownership, Tobin’s Q, natural logarithm of firm market capitalization and dummy controls for CEO, industry and year effects. Models (1) to (5) employ a random effects Tobit specification. Models (6) and (7) employ a firm fixed effects OLS specification. The dependent variable in model (1) is the pay-for-performance sensitivity (PPS) of option grants; model (2) is the PPS of option holdings; model (3) is the PPS of restricted stock holdings; model (4) is the PPS of private share holdings; model (5) is total PPS which is the sum of option holding, restricted stock holding and private share holding PPS; model (6) is the natural logarithm of salary; and for model (7) is the natural logarithm of total compensation. Heteroskedastic-consistent t-statistics are presented in parentheses below each coefficient. One, two and three asterisks denote significance at 10, 5 and 1 percent levels.
PPS of Option Grants
PPS of Option Holdings
PPS of Restricted
Stock Holdings
PPS of Private Share Holdings Total PPS Ln Salary Ln Total
Compensation
Independent Variable (1) (2) (3) (4) (5) (6) (7)
-1.42E-06 -2.53E-06 1.62E-06* -1.45E-05 -5.94E-06 1.08E-06*** 1.90E-06*** Change Shareholder Wealth (-0.82) (-0.81) (1.9) (-1) (-0.47) (5.46) (5.47)
-1.82E-06 6.90E-06** -5.10E-07 -1.67E-06 1.69E-05 1.33E-06*** 8.30E-07** Lag1 Change Shareholder Wealth (-0.98) (2.03) (-0.55) (-0.11) (1.24) (6.15) (2.18) 0.2024 1.0878*** 0.5763*** -7.7525*** -7.6797*** 0.0127 0.0188 Lag1 Top5 Ownership (0.92) (2.72) (4.3) (-4.36) (-4.82) (0.44) (0.37) 0.0099 0.0539*** -0.0334* 0.3036*** 0.4505*** -0.0048*** 0.031*** Lag1 Tobin’s Q (1.02) (2.8) (-1.8) (3.47) (6.23) (-3.82) (13.86)
-0.3732*** -1.1662*** 0.0197** -1.2065*** -2.4608*** 0.0511*** 0.2405*** Lag1 Log Market Capitalization (-18.18) (-34.03) (2.52) (-8.67) (-19.17) (16.81) (44.81)
2.6136*** 9.926*** 0.8301*** 33.2721*** 36.4359*** 0.7072*** 1.0964*** CEO Dummy (69.31) (145.16) (47.1) (104.18) (129.5) (161.06) (141.43)