thesis state injustice: trapping black women as “sex offenders ...
Upload
independentCategory
view
1download
0
J. Avian Biol. 41: 434�444, 2010
doi: 10.1111/j.1600-048X.2010.04891.x# 2010 The Authors. J. Compilation # 2010 J. Avian Biol.
Received 23 April 2009, accepted 7 February 2010
Do bird captures reflect migration intensity? � Trapping numberson an Alpine pass compared with radar counts
Susanna Komenda-Zehnder, Lukas Jenni and Felix Liechti
S. Komenda-Zehnder ([email protected]), L. Jenni and F. Liechti, Swiss Ornithological Institute, CH�6204 Sempach,Switzerland.
A limitation of standardized mist netting for monitoring migration is caused by the lack of knowledge about therelationship between trapped birds and birds flying aloft. Earlier studies related nocturnal radar counts with trapping dataof the following day. In this study, we compared for the first time data gathered simultaneously by radar and mist netting,separately for diurnal and nocturnal migration. Trapping numbers were strongly correlated with migratory intensitiesmeasured by radar (r�0.6). A multiple regression analysis, including wind speed and wind direction explained 61% ofvariation in the number of captures. During the night, and particularly with favourable winds, birds flew at higheraltitudes and hence escaped the nets to a higher proportion. The number of nocturnal migrants trapped during daytimewas well correlated with migratory intensities observed by radar in the preceding night. The diurnal time patterns,however, revealed fundamental differences between trapping counts and radar observations. This was mainly due toincreasing and decreasing flight altitudes in the course of the night, and by the limitations of the radar technique thatunderestimates migratory intensities during the day when birds aggregate in flocks. In relation to the migratory intensityrecorded by radar, diurnal migrants are trapped in a much higher proportion than nocturnal migrants. Finally, our resultsconfirm that trapping data from a site hardly used for stopover are well suited to represent the ongoing migration duringthe day and night.
Standardized capture of birds during the migratory seasonhas been used to indicate the intensity of migration (by dayor by year) and the seasonal phenology (Jenni 1984, Karlssonet al. 2002, Korner-Nievergelt et al. 2007). Numbers trap-ped are often used to monitor population size and demo-graphic parameters (Baillie et al. 1999, Spina 1999, Peachet al. 1999, Dunn and Ralph 2004). Changes in numbersand phenology over the years were assessed often with theaim to examine an effect of climate change on bird migration(Huppop and Huppop 2003, Jenni and Kery 2003, Vickeryet al. 2007, Husek and Adamik 2008). However, in spite ofstandardized schemes trapping counts have limitations dueto biases in sampling.
Especially when assessing daily migration intensity withthe numbers caught it is generally assumed that thenumbers of birds trapped are a quantitatively representativesample of birds on migration. A tight relationship betweenthe daily numbers caught and numbers passing throughmay be more likely at sites where birds are caught out ofactive migration with virtually no stopover duration, suchas on mountain passes. The same might be true at siteswhere birds land to stay for only a few hours, or one day,e.g. coasts and islands that do not offer suitable stopoverconditions. However, a less tight relationship might befound on stopover sites where birds stay in appropriatehabitats to refuel for several days.
In all cases, a first step is to exclude from the capturenumbers all birds not on migration, i.e. non-migratoryspecies and individuals of migratory species not yet onmigration or on post-breeding dispersal. However, it is stillan open question whether the numbers of migrants caughtreflect the numbers passing through. Birds typically fly ataltitudes exceeding the height of the nets by far. Trappingprobability differs considerably with weather and betweenspecies (Jenni et al. 1996, Karlsson et al. 2002, Dunnand Ralph 2004). Only very few studies have investigatedwhether or not capture numbers are quantitatively repre-sentative of migration intensity (reviewed by Peckford andTaylor 2008). For autumn migration at Falsterbo (southernSweden) Zehnder and Karlsson (2001) found a good corre-lation between daily numbers trapped and nocturnalmigratory intensity of the preceding night measured witha passive infrared device at the same place. However, thefew peak trapping events, which made up an importantproportion of the capture totals were not related tonocturnal migration intensity, but caused by adverseweather conditions. On a larger geographical scale, Simonset al. (2004) found a correlation of migratory peaksobserved by weather surveillance radar, mist netting andmorning censuses at the north coast of the Gulf of Mexico,USA. Recently, Peckford and Taylor (2008) reported apositive correlation between ground counts and numbers
434
of birds trapped with radar data gathered the night beforeat a costal site in Nova Scotia, Canada.
To our knowledge, all studies comparing capture datawith observations of birds aloft were performed underthe particular conditions of coastal sites. Furthermore, thecomparisons were restricted to nocturnal counts of freeflying birds and diurnal capture or ground counts.
In this study, we compared the numbers trapped on theAlpine pass Col de Bretolet with the migration intensitydetermined simultaneously by radar. On Col de Bretolet,birds have been caught systematically since 1958. Thus,knowledge of whether trapping numbers correlate withmigration intensity is crucial for the analysis and inter-pretation of this important data set. In contrast to earlierstudies, we could select birds caught on active migration,while birds not yet on migration could be largely elimina-ted due to previous work (Jenni 1984). Birds in thepre-migratory stage tend to move in the vegetation andthus escape detection by radar. Moreover, at this Alpinepass, actively migrating birds are caught during day andnight. We were thus able to compare capture numbers ofactively migrating birds by day and by night with numberssimultaneously aloft. We were also able to compare thenumber of nocturnal migrants caught during the day afterlanding with the birds aloft the previous night, as in otherstudies. Finally, a radar technique was used that provideddata on the spatial and temporal distribution of diurnaland nocturnal intensities of bird migration. We investiga-ted to what extent the number of birds caught predictedthe number of birds aloft for both day and night, andwhether local or general weather factors explained furthervariability. Moreover, this study gives further insight intothe flight behaviour of diurnal and nocturnal migrationover an Alpine area.
Material and methods
Trapping data
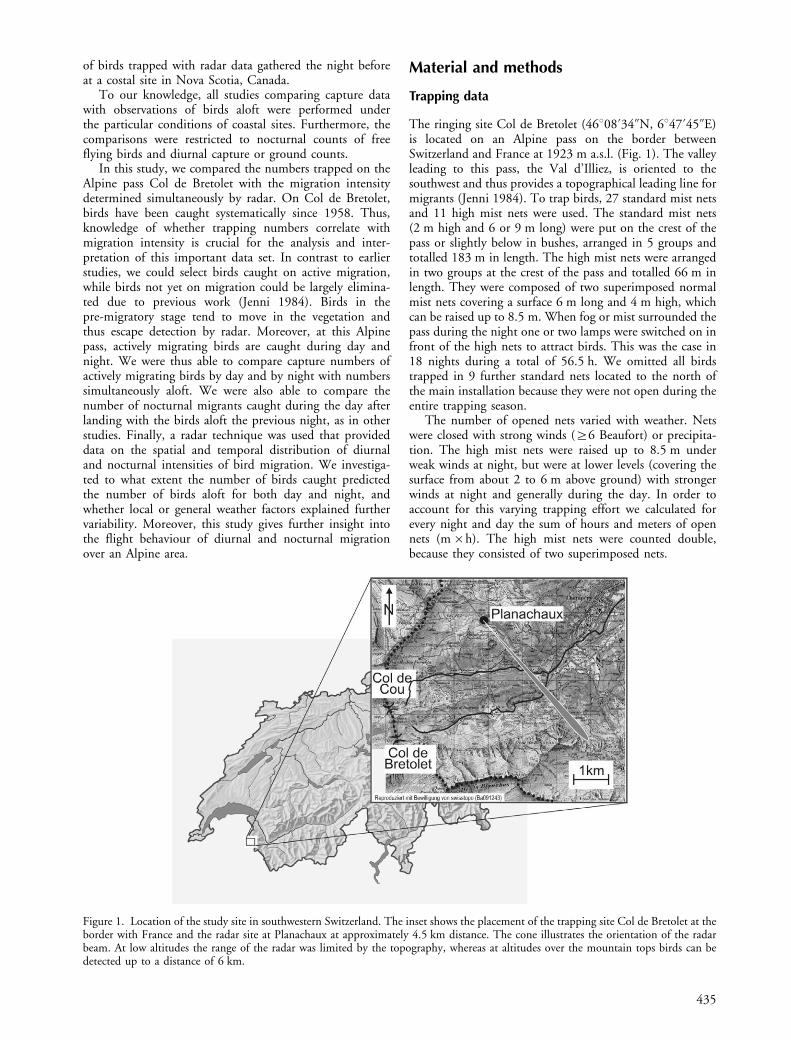
The ringing site Col de Bretolet (46808?34ƒN, 6847?45ƒE)is located on an Alpine pass on the border betweenSwitzerland and France at 1923 m a.s.l. (Fig. 1). The valleyleading to this pass, the Val d’Illiez, is oriented to thesouthwest and thus provides a topographical leading line formigrants (Jenni 1984). To trap birds, 27 standard mist netsand 11 high mist nets were used. The standard mist nets(2 m high and 6 or 9 m long) were put on the crest of thepass or slightly below in bushes, arranged in 5 groups andtotalled 183 m in length. The high mist nets were arrangedin two groups at the crest of the pass and totalled 66 m inlength. They were composed of two superimposed normalmist nets covering a surface 6 m long and 4 m high, whichcan be raised up to 8.5 m. When fog or mist surrounded thepass during the night one or two lamps were switched on infront of the high nets to attract birds. This was the case in18 nights during a total of 56.5 h. We omitted all birdstrapped in 9 further standard nets located to the north ofthe main installation because they were not open during theentire trapping season.
The number of opened nets varied with weather. Netswere closed with strong winds (]6 Beaufort) or precipita-tion. The high mist nets were raised up to 8.5 m underweak winds at night, but were at lower levels (covering thesurface from about 2 to 6 m above ground) with strongerwinds at night and generally during the day. In order toaccount for this varying trapping effort we calculated forevery night and day the sum of hours and meters of opennets (m�h). The high mist nets were counted double,because they consisted of two superimposed nets.
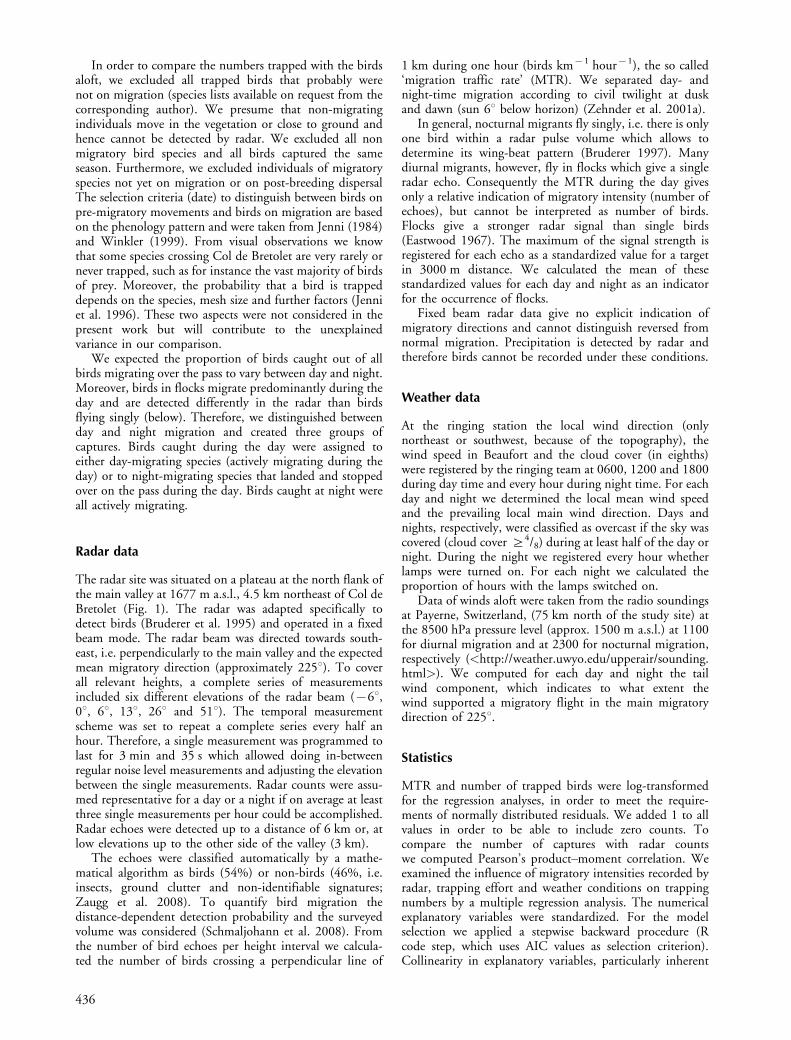
Figure 1. Location of the study site in southwestern Switzerland. The inset shows the placement of the trapping site Col de Bretolet at theborder with France and the radar site at Planachaux at approximately 4.5 km distance. The cone illustrates the orientation of the radarbeam. At low altitudes the range of the radar was limited by the topography, whereas at altitudes over the mountain tops birds can bedetected up to a distance of 6 km.
435
In order to compare the numbers trapped with the birdsaloft, we excluded all trapped birds that probably werenot on migration (species lists available on request from thecorresponding author). We presume that non-migratingindividuals move in the vegetation or close to ground andhence cannot be detected by radar. We excluded all nonmigratory bird species and all birds captured the sameseason. Furthermore, we excluded individuals of migratoryspecies not yet on migration or on post-breeding dispersalThe selection criteria (date) to distinguish between birds onpre-migratory movements and birds on migration are basedon the phenology pattern and were taken from Jenni (1984)and Winkler (1999). From visual observations we knowthat some species crossing Col de Bretolet are very rarely ornever trapped, such as for instance the vast majority of birdsof prey. Moreover, the probability that a bird is trappeddepends on the species, mesh size and further factors (Jenniet al. 1996). These two aspects were not considered in thepresent work but will contribute to the unexplainedvariance in our comparison.
We expected the proportion of birds caught out of allbirds migrating over the pass to vary between day and night.Moreover, birds in flocks migrate predominantly during theday and are detected differently in the radar than birdsflying singly (below). Therefore, we distinguished betweenday and night migration and created three groups ofcaptures. Birds caught during the day were assigned toeither day-migrating species (actively migrating during theday) or to night-migrating species that landed and stoppedover on the pass during the day. Birds caught at night wereall actively migrating.
Radar data
The radar site was situated on a plateau at the north flank ofthe main valley at 1677 m a.s.l., 4.5 km northeast of Col deBretolet (Fig. 1). The radar was adapted specifically todetect birds (Bruderer et al. 1995) and operated in a fixedbeam mode. The radar beam was directed towards south-east, i.e. perpendicularly to the main valley and the expectedmean migratory direction (approximately 2258). To coverall relevant heights, a complete series of measurementsincluded six different elevations of the radar beam (�68,08, 68, 138, 268 and 518). The temporal measurementscheme was set to repeat a complete series every half anhour. Therefore, a single measurement was programmed tolast for 3 min and 35 s which allowed doing in-betweenregular noise level measurements and adjusting the elevationbetween the single measurements. Radar counts were assu-med representative for a day or a night if on average at leastthree single measurements per hour could be accomplished.Radar echoes were detected up to a distance of 6 km or, atlow elevations up to the other side of the valley (3 km).
The echoes were classified automatically by a mathe-matical algorithm as birds (54%) or non-birds (46%, i.e.insects, ground clutter and non-identifiable signatures;Zaugg et al. 2008). To quantify bird migration thedistance-dependent detection probability and the surveyedvolume was considered (Schmaljohann et al. 2008). Fromthe number of bird echoes per height interval we calcula-ted the number of birds crossing a perpendicular line of
1 km during one hour (birds km�1 hour�1), the so called‘migration traffic rate’ (MTR). We separated day- andnight-time migration according to civil twilight at duskand dawn (sun 68 below horizon) (Zehnder et al. 2001a).
In general, nocturnal migrants fly singly, i.e. there is onlyone bird within a radar pulse volume which allows todetermine its wing-beat pattern (Bruderer 1997). Manydiurnal migrants, however, fly in flocks which give a singleradar echo. Consequently the MTR during the day givesonly a relative indication of migratory intensity (number ofechoes), but cannot be interpreted as number of birds.Flocks give a stronger radar signal than single birds(Eastwood 1967). The maximum of the signal strength isregistered for each echo as a standardized value for a targetin 3000 m distance. We calculated the mean of thesestandardized values for each day and night as an indicatorfor the occurrence of flocks.
Fixed beam radar data give no explicit indication ofmigratory directions and cannot distinguish reversed fromnormal migration. Precipitation is detected by radar andtherefore birds cannot be recorded under these conditions.
Weather data
At the ringing station the local wind direction (onlynortheast or southwest, because of the topography), thewind speed in Beaufort and the cloud cover (in eighths)were registered by the ringing team at 0600, 1200 and 1800during day time and every hour during night time. For eachday and night we determined the local mean wind speedand the prevailing local main wind direction. Days andnights, respectively, were classified as overcast if the sky wascovered (cloud cover ]4/8) during at least half of the day ornight. During the night we registered every hour whetherlamps were turned on. For each night we calculated theproportion of hours with the lamps switched on.
Data of winds aloft were taken from the radio soundingsat Payerne, Switzerland, (75 km north of the study site) atthe 8500 hPa pressure level (approx. 1500 m a.s.l.) at 1100for diurnal migration and at 2300 for nocturnal migration,respectively (<http://weather.uwyo.edu/upperair/sounding.html>). We computed for each day and night the tailwind component, which indicates to what extent thewind supported a migratory flight in the main migratorydirection of 2258.
Statistics
MTR and number of trapped birds were log-transformedfor the regression analyses, in order to meet the require-ments of normally distributed residuals. We added 1 to allvalues in order to be able to include zero counts. Tocompare the number of captures with radar countswe computed Pearson’s product�moment correlation. Weexamined the influence of migratory intensities recorded byradar, trapping effort and weather conditions on trappingnumbers by a multiple regression analysis. The numericalexplanatory variables were standardized. For the modelselection we applied a stepwise backward procedure (Rcode step, which uses AIC values as selection criterion).Collinearity in explanatory variables, particularly inherent
436
in weather factors, has to be handled carefully (Graham2003). Therefore, we present a correlation matrix andthe corresponding significance levels in order to giveinsight into these relationships (Appendix 1). All calcula-tions were accomplished with the statistical program R(R Development Core Team 2006).
Data set
The ringing site and the radar were operated simultaneouslyfrom 10 August until 29 October 2007. The two datasets coincide for 73 days and 61 nights (Fig. 2). In theremaining cases trapping and/or radar data were missingbecause of unfavourable weather conditions (i.e. rain, snow,freezing nets, or strong winds) for 7 days and 15 nights.Radar data were missing for 1 day and 5 nights because oftechnical problems with the radar system. The radar dataincluded 10 380 measurements with 15 371 echoes classi-fied as birds during day-time and 7293 measurements with82 876 bird echoes during night-time. The trapping dataincluded a total of 13 410 birds captured during the dayand 2282 nocturnal captures.
Results
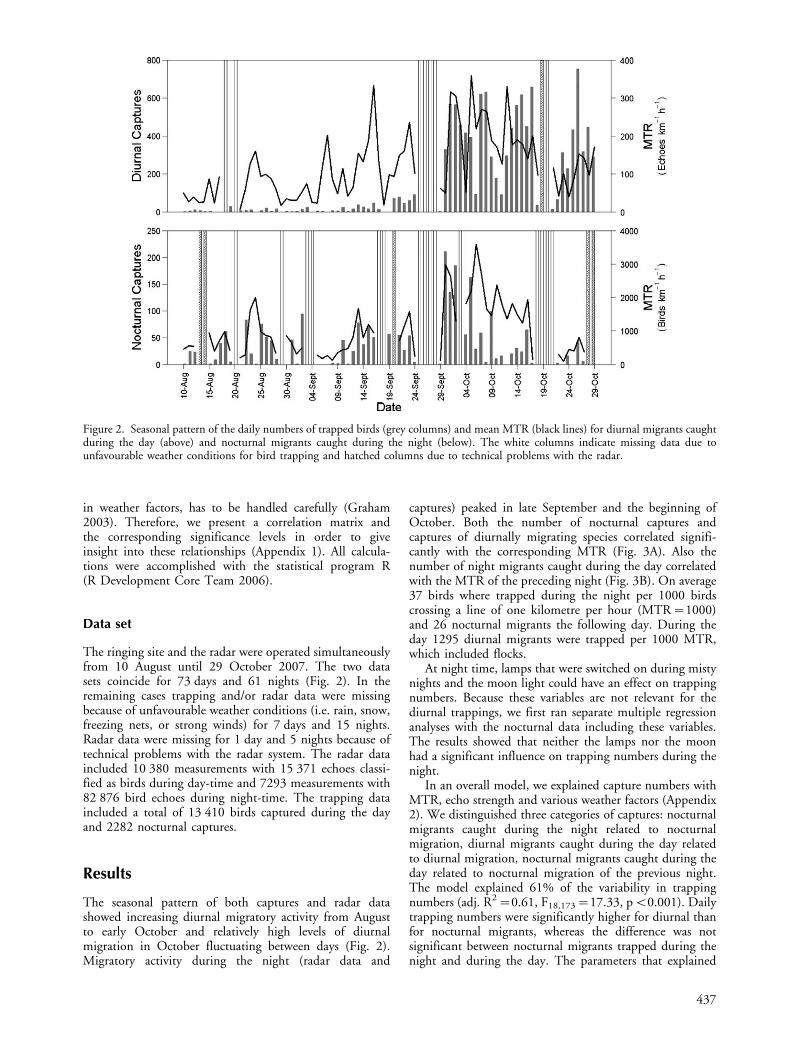
The seasonal pattern of both captures and radar datashowed increasing diurnal migratory activity from Augustto early October and relatively high levels of diurnalmigration in October fluctuating between days (Fig. 2).Migratory activity during the night (radar data and
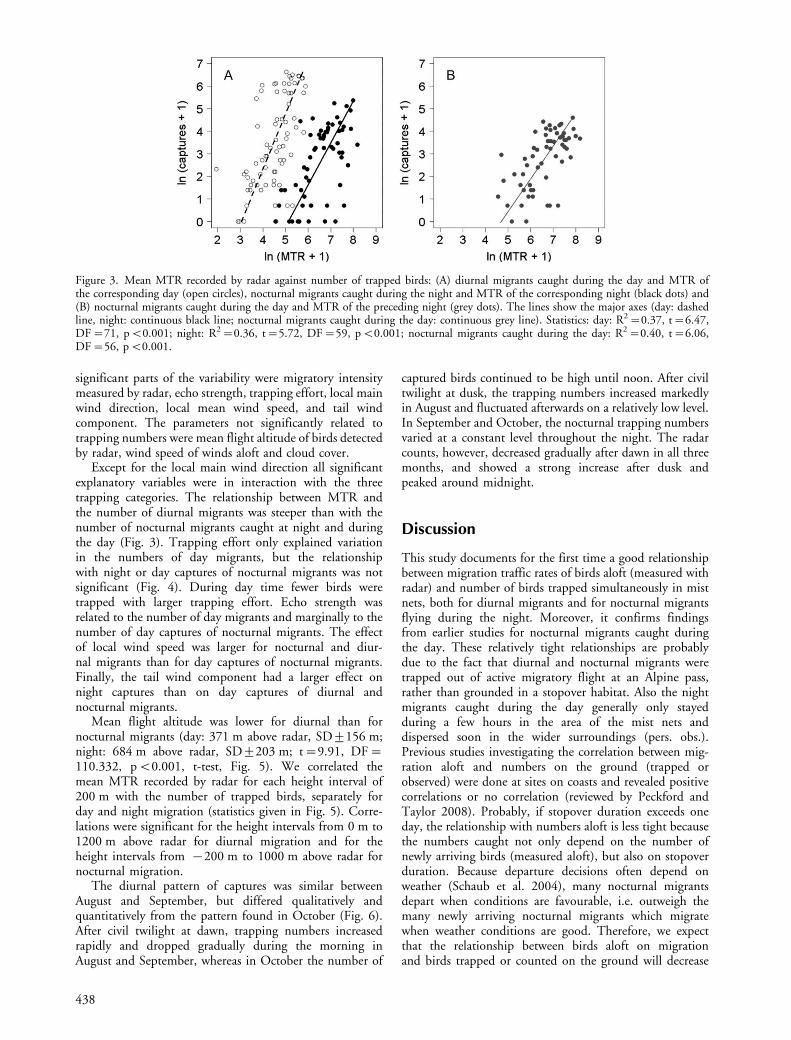
captures) peaked in late September and the beginning ofOctober. Both the number of nocturnal captures andcaptures of diurnally migrating species correlated signifi-cantly with the corresponding MTR (Fig. 3A). Also thenumber of night migrants caught during the day correlatedwith the MTR of the preceding night (Fig. 3B). On average37 birds where trapped during the night per 1000 birdscrossing a line of one kilometre per hour (MTR�1000)and 26 nocturnal migrants the following day. During theday 1295 diurnal migrants were trapped per 1000 MTR,which included flocks.
At night time, lamps that were switched on during mistynights and the moon light could have an effect on trappingnumbers. Because these variables are not relevant for thediurnal trappings, we first ran separate multiple regressionanalyses with the nocturnal data including these variables.The results showed that neither the lamps nor the moonhad a significant influence on trapping numbers during thenight.
In an overall model, we explained capture numbers withMTR, echo strength and various weather factors (Appendix2). We distinguished three categories of captures: nocturnalmigrants caught during the night related to nocturnalmigration, diurnal migrants caught during the day relatedto diurnal migration, nocturnal migrants caught during theday related to nocturnal migration of the previous night.The model explained 61% of the variability in trappingnumbers (adj. R2�0.61, F18,173�17.33, pB0.001). Dailytrapping numbers were significantly higher for diurnal thanfor nocturnal migrants, whereas the difference was notsignificant between nocturnal migrants trapped during thenight and during the day. The parameters that explained
Figure 2. Seasonal pattern of the daily numbers of trapped birds (grey columns) and mean MTR (black lines) for diurnal migrants caughtduring the day (above) and nocturnal migrants caught during the night (below). The white columns indicate missing data due tounfavourable weather conditions for bird trapping and hatched columns due to technical problems with the radar.
437
significant parts of the variability were migratory intensitymeasured by radar, echo strength, trapping effort, local mainwind direction, local mean wind speed, and tail windcomponent. The parameters not significantly related totrapping numbers were mean flight altitude of birds detectedby radar, wind speed of winds aloft and cloud cover.
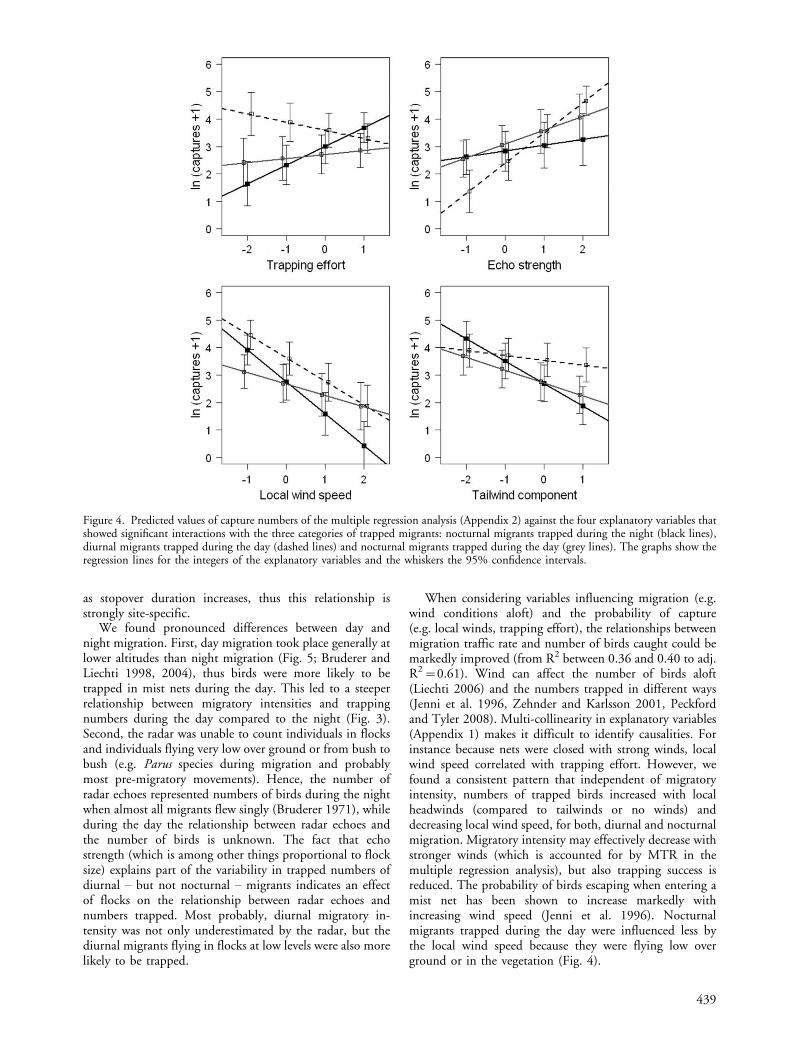
Except for the local main wind direction all significantexplanatory variables were in interaction with the threetrapping categories. The relationship between MTR andthe number of diurnal migrants was steeper than with thenumber of nocturnal migrants caught at night and duringthe day (Fig. 3). Trapping effort only explained variationin the numbers of day migrants, but the relationshipwith night or day captures of nocturnal migrants was notsignificant (Fig. 4). During day time fewer birds weretrapped with larger trapping effort. Echo strength wasrelated to the number of day migrants and marginally to thenumber of day captures of nocturnal migrants. The effectof local wind speed was larger for nocturnal and diur-nal migrants than for day captures of nocturnal migrants.Finally, the tail wind component had a larger effect onnight captures than on day captures of diurnal andnocturnal migrants.
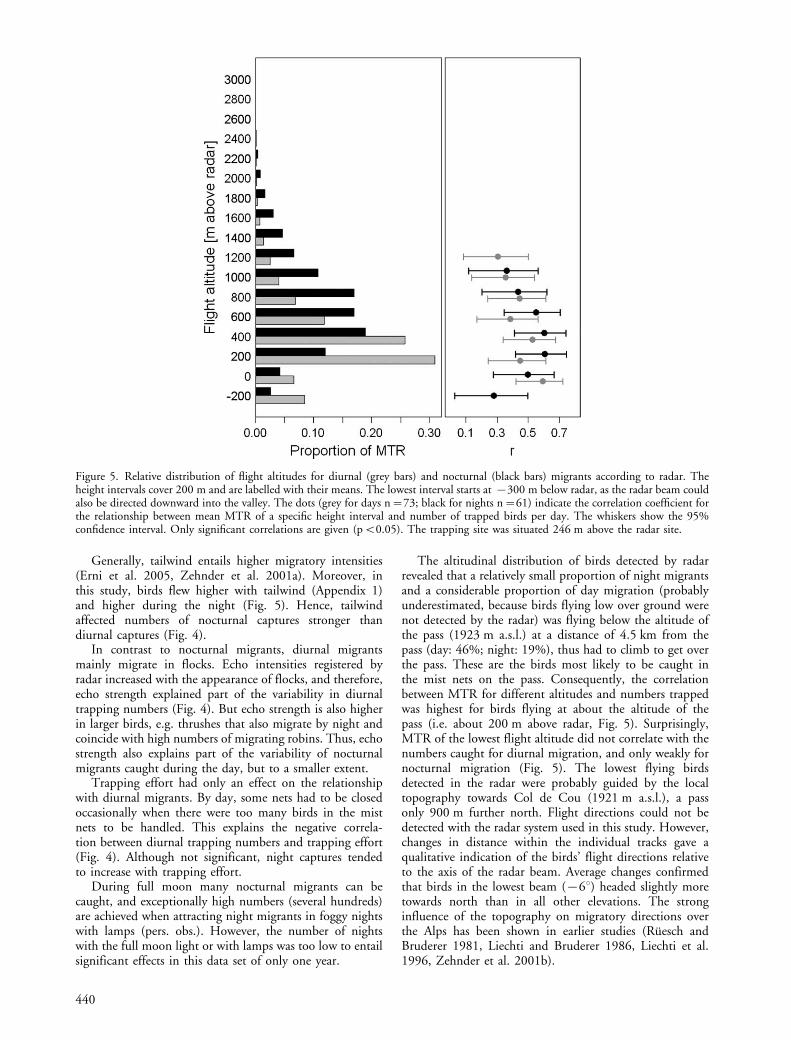
Mean flight altitude was lower for diurnal than fornocturnal migrants (day: 371 m above radar, SD9156 m;night: 684 m above radar, SD9203 m; t�9.91, DF�110.332, pB0.001, t-test, Fig. 5). We correlated themean MTR recorded by radar for each height interval of200 m with the number of trapped birds, separately forday and night migration (statistics given in Fig. 5). Corre-lations were significant for the height intervals from 0 m to1200 m above radar for diurnal migration and for theheight intervals from �200 m to 1000 m above radar fornocturnal migration.
The diurnal pattern of captures was similar betweenAugust and September, but differed qualitatively andquantitatively from the pattern found in October (Fig. 6).After civil twilight at dawn, trapping numbers increasedrapidly and dropped gradually during the morning inAugust and September, whereas in October the number of
captured birds continued to be high until noon. After civiltwilight at dusk, the trapping numbers increased markedlyin August and fluctuated afterwards on a relatively low level.In September and October, the nocturnal trapping numbersvaried at a constant level throughout the night. The radarcounts, however, decreased gradually after dawn in all threemonths, and showed a strong increase after dusk andpeaked around midnight.
Discussion
This study documents for the first time a good relationshipbetween migration traffic rates of birds aloft (measured withradar) and number of birds trapped simultaneously in mistnets, both for diurnal migrants and for nocturnal migrantsflying during the night. Moreover, it confirms findingsfrom earlier studies for nocturnal migrants caught duringthe day. These relatively tight relationships are probablydue to the fact that diurnal and nocturnal migrants weretrapped out of active migratory flight at an Alpine pass,rather than grounded in a stopover habitat. Also the nightmigrants caught during the day generally only stayedduring a few hours in the area of the mist nets anddispersed soon in the wider surroundings (pers. obs.).Previous studies investigating the correlation between mig-ration aloft and numbers on the ground (trapped orobserved) were done at sites on coasts and revealed positivecorrelations or no correlation (reviewed by Peckford andTaylor 2008). Probably, if stopover duration exceeds oneday, the relationship with numbers aloft is less tight becausethe numbers caught not only depend on the number ofnewly arriving birds (measured aloft), but also on stopoverduration. Because departure decisions often depend onweather (Schaub et al. 2004), many nocturnal migrantsdepart when conditions are favourable, i.e. outweigh themany newly arriving nocturnal migrants which migratewhen weather conditions are good. Therefore, we expectthat the relationship between birds aloft on migrationand birds trapped or counted on the ground will decrease
Figure 3. Mean MTR recorded by radar against number of trapped birds: (A) diurnal migrants caught during the day and MTR ofthe corresponding day (open circles), nocturnal migrants caught during the night and MTR of the corresponding night (black dots) and(B) nocturnal migrants caught during the day and MTR of the preceding night (grey dots). The lines show the major axes (day: dashedline, night: continuous black line; nocturnal migrants caught during the day: continuous grey line). Statistics: day: R2�0.37, t�6.47,DF�71, pB0.001; night: R2�0.36, t�5.72, DF�59, pB0.001; nocturnal migrants caught during the day: R2�0.40, t�6.06,DF�56, pB0.001.
438
as stopover duration increases, thus this relationship isstrongly site-specific.
We found pronounced differences between day andnight migration. First, day migration took place generally atlower altitudes than night migration (Fig. 5; Bruderer andLiechti 1998, 2004), thus birds were more likely to betrapped in mist nets during the day. This led to a steeperrelationship between migratory intensities and trappingnumbers during the day compared to the night (Fig. 3).Second, the radar was unable to count individuals in flocksand individuals flying very low over ground or from bush tobush (e.g. Parus species during migration and probablymost pre-migratory movements). Hence, the number ofradar echoes represented numbers of birds during the nightwhen almost all migrants flew singly (Bruderer 1971), whileduring the day the relationship between radar echoes andthe number of birds is unknown. The fact that echostrength (which is among other things proportional to flocksize) explains part of the variability in trapped numbers ofdiurnal � but not nocturnal � migrants indicates an effectof flocks on the relationship between radar echoes andnumbers trapped. Most probably, diurnal migratory in-tensity was not only underestimated by the radar, but thediurnal migrants flying in flocks at low levels were also morelikely to be trapped.
When considering variables influencing migration (e.g.wind conditions aloft) and the probability of capture(e.g. local winds, trapping effort), the relationships betweenmigration traffic rate and number of birds caught could bemarkedly improved (from R2 between 0.36 and 0.40 to adj.R2�0.61). Wind can affect the number of birds aloft(Liechti 2006) and the numbers trapped in different ways(Jenni et al. 1996, Zehnder and Karlsson 2001, Peckfordand Tyler 2008). Multi-collinearity in explanatory variables(Appendix 1) makes it difficult to identify causalities. Forinstance because nets were closed with strong winds, localwind speed correlated with trapping effort. However, wefound a consistent pattern that independent of migratoryintensity, numbers of trapped birds increased with localheadwinds (compared to tailwinds or no winds) anddecreasing local wind speed, for both, diurnal and nocturnalmigration. Migratory intensity may effectively decrease withstronger winds (which is accounted for by MTR in themultiple regression analysis), but also trapping success isreduced. The probability of birds escaping when entering amist net has been shown to increase markedly withincreasing wind speed (Jenni et al. 1996). Nocturnalmigrants trapped during the day were influenced less bythe local wind speed because they were flying low overground or in the vegetation (Fig. 4).
Figure 4. Predicted values of capture numbers of the multiple regression analysis (Appendix 2) against the four explanatory variables thatshowed significant interactions with the three categories of trapped migrants: nocturnal migrants trapped during the night (black lines),diurnal migrants trapped during the day (dashed lines) and nocturnal migrants trapped during the day (grey lines). The graphs show theregression lines for the integers of the explanatory variables and the whiskers the 95% confidence intervals.
439
Generally, tailwind entails higher migratory intensities(Erni et al. 2005, Zehnder et al. 2001a). Moreover, inthis study, birds flew higher with tailwind (Appendix 1)and higher during the night (Fig. 5). Hence, tailwindaffected numbers of nocturnal captures stronger thandiurnal captures (Fig. 4).
In contrast to nocturnal migrants, diurnal migrantsmainly migrate in flocks. Echo intensities registered byradar increased with the appearance of flocks, and therefore,echo strength explained part of the variability in diurnaltrapping numbers (Fig. 4). But echo strength is also higherin larger birds, e.g. thrushes that also migrate by night andcoincide with high numbers of migrating robins. Thus, echostrength also explains part of the variability of nocturnalmigrants caught during the day, but to a smaller extent.
Trapping effort had only an effect on the relationshipwith diurnal migrants. By day, some nets had to be closedoccasionally when there were too many birds in the mistnets to be handled. This explains the negative correla-tion between diurnal trapping numbers and trapping effort(Fig. 4). Although not significant, night captures tendedto increase with trapping effort.
During full moon many nocturnal migrants can becaught, and exceptionally high numbers (several hundreds)are achieved when attracting night migrants in foggy nightswith lamps (pers. obs.). However, the number of nightswith the full moon light or with lamps was too low to entailsignificant effects in this data set of only one year.
The altitudinal distribution of birds detected by radarrevealed that a relatively small proportion of night migrantsand a considerable proportion of day migration (probablyunderestimated, because birds flying low over ground werenot detected by the radar) was flying below the altitude ofthe pass (1923 m a.s.l.) at a distance of 4.5 km from thepass (day: 46%; night: 19%), thus had to climb to get overthe pass. These are the birds most likely to be caught inthe mist nets on the pass. Consequently, the correlationbetween MTR for different altitudes and numbers trappedwas highest for birds flying at about the altitude of thepass (i.e. about 200 m above radar, Fig. 5). Surprisingly,MTR of the lowest flight altitude did not correlate with thenumbers caught for diurnal migration, and only weakly fornocturnal migration (Fig. 5). The lowest flying birdsdetected in the radar were probably guided by the localtopography towards Col de Cou (1921 m a.s.l.), a passonly 900 m further north. Flight directions could not bedetected with the radar system used in this study. However,changes in distance within the individual tracks gave aqualitative indication of the birds’ flight directions relativeto the axis of the radar beam. Average changes confirmedthat birds in the lowest beam (�68) headed slightly moretowards north than in all other elevations. The stronginfluence of the topography on migratory directions overthe Alps has been shown in earlier studies (Ruesch andBruderer 1981, Liechti and Bruderer 1986, Liechti et al.1996, Zehnder et al. 2001b).
Figure 5. Relative distribution of flight altitudes for diurnal (grey bars) and nocturnal (black bars) migrants according to radar. Theheight intervals cover 200 m and are labelled with their means. The lowest interval starts at �300 m below radar, as the radar beam couldalso be directed downward into the valley. The dots (grey for days n�73; black for nights n�61) indicate the correlation coefficient forthe relationship between mean MTR of a specific height interval and number of trapped birds per day. The whiskers show the 95%confidence interval. Only significant correlations are given (pB0.05). The trapping site was situated 246 m above the radar site.
440
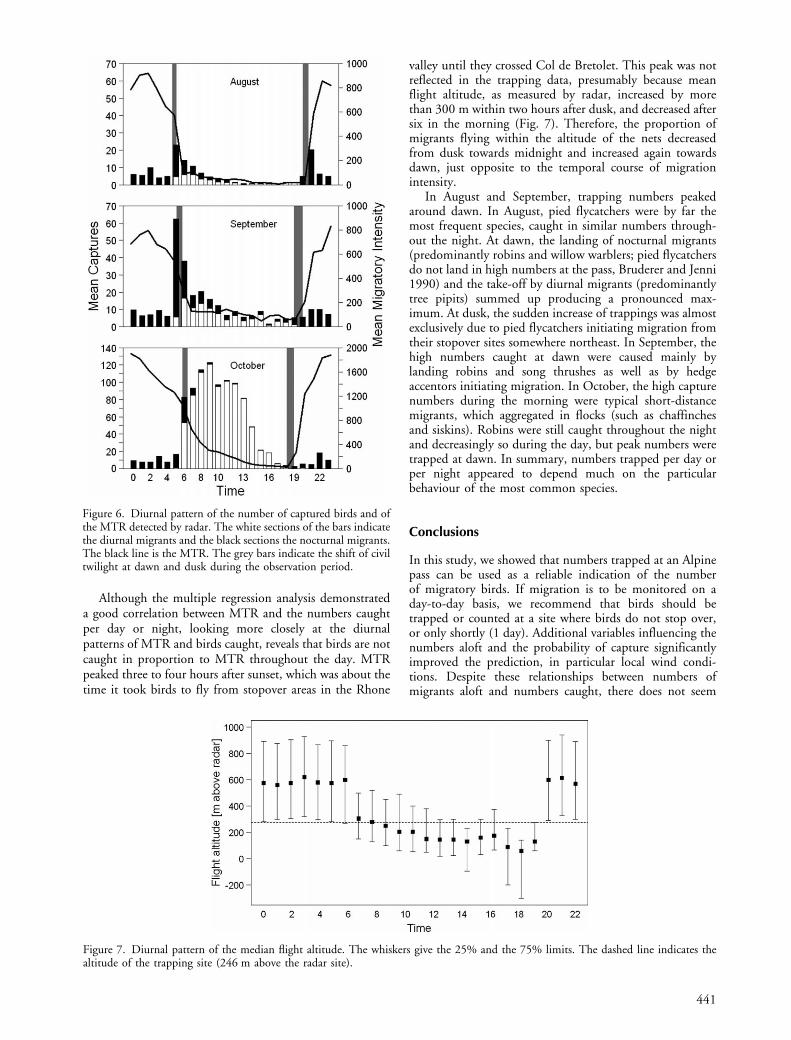
Although the multiple regression analysis demonstrateda good correlation between MTR and the numbers caughtper day or night, looking more closely at the diurnalpatterns of MTR and birds caught, reveals that birds are notcaught in proportion to MTR throughout the day. MTRpeaked three to four hours after sunset, which was about thetime it took birds to fly from stopover areas in the Rhone
valley until they crossed Col de Bretolet. This peak was notreflected in the trapping data, presumably because meanflight altitude, as measured by radar, increased by morethan 300 m within two hours after dusk, and decreased aftersix in the morning (Fig. 7). Therefore, the proportion ofmigrants flying within the altitude of the nets decreasedfrom dusk towards midnight and increased again towardsdawn, just opposite to the temporal course of migrationintensity.
In August and September, trapping numbers peakedaround dawn. In August, pied flycatchers were by far themost frequent species, caught in similar numbers through-out the night. At dawn, the landing of nocturnal migrants(predominantly robins and willow warblers; pied flycatchersdo not land in high numbers at the pass, Bruderer and Jenni1990) and the take-off by diurnal migrants (predominantlytree pipits) summed up producing a pronounced max-imum. At dusk, the sudden increase of trappings was almostexclusively due to pied flycatchers initiating migration fromtheir stopover sites somewhere northeast. In September, thehigh numbers caught at dawn were caused mainly bylanding robins and song thrushes as well as by hedgeaccentors initiating migration. In October, the high capturenumbers during the morning were typical short-distancemigrants, which aggregated in flocks (such as chaffinchesand siskins). Robins were still caught throughout the nightand decreasingly so during the day, but peak numbers weretrapped at dawn. In summary, numbers trapped per day orper night appeared to depend much on the particularbehaviour of the most common species.
Conclusions
In this study, we showed that numbers trapped at an Alpinepass can be used as a reliable indication of the numberof migratory birds. If migration is to be monitored on aday-to-day basis, we recommend that birds should betrapped or counted at a site where birds do not stop over,or only shortly (1 day). Additional variables influencing thenumbers aloft and the probability of capture significantlyimproved the prediction, in particular local wind condi-tions. Despite these relationships between numbers ofmigrants aloft and numbers caught, there does not seem
Figure 7. Diurnal pattern of the median flight altitude. The whiskers give the 25% and the 75% limits. The dashed line indicates thealtitude of the trapping site (246 m above the radar site).
Figure 6. Diurnal pattern of the number of captured birds and ofthe MTR detected by radar. The white sections of the bars indicatethe diurnal migrants and the black sections the nocturnal migrants.The black line is the MTR. The grey bars indicate the shift of civiltwilight at dawn and dusk during the observation period.
441
to be a simple proportionality. The proportion of birdscaught (of those just passing by) varied between day andnight migration, flight altitude and associated effects oftopography � and most importantly � with the behaviourof the most common species, resulting in this proportionvarying during the course of the day. It is well known thatnocturnal migrants carefully select the habitat where theyland (Degen and Jenni 1990, Jenni 1996). Therefore, somenocturnal migrant species regularly land at dawn at Col deBretolet in high numbers while others do not, depending ontheir habitat preferences (Bruderer and Jenni 1990). Hence,the species composition of birds caught differs from that ofmigrants aloft. A detailed analysis of wing beat frequenciesof radar observations could give more insight, althoughspecies of similar body size, such as pied flycatcher androbin, are hardly distinguishable. Of course this studycannot answer the question whether the birds caught atthe Alpine pass are representative in terms of individualcharacteristics (morphology, energy stores and age compo-sition) for migrants passing through the area. There areindications from Col de Bretolet that this is not the case(Bruderer and Jenni 1990).
Acknowledgements � We thank the team that worked in autumn2007 at Col de Bretolet, lead by Albert Bassin, Jacques Laesser andPaul Mosimann, and Nicolas Guillod and Michael Murer at theradar site. We thank the radar specialists Thomas Steuri and ErichBachler for the implementation of the radar at Planachaux andDieter Peter for processing the radar data.
References
Baillie, S. R., Boobyer, G., Perrins, C. M., Brenchley, A., Bryant,D. M., Ormerod, S. J., Rehfisch, M. M., Tasker, M. L. andWilson, J. D. 1999. The conservation uses of ringing data.Conclusions of the JNCC/BTO workshop 4�5 Nov 1995,Norwich. � Ring. Migr. 19: 119�127.
Bruderer, B. 1971. Radarbeobachtungen uber den Fruhlingszugim Schweizerischen Mittelland. Ein Beitrag zum Problem derWitterungsabhangigkeit des Vogelzugs. � Ornithol. Beob. 68:89�158.
Bruderer, B. 1997. The study of bird migration by radar. Part 1:the technical basis. � Naturwissenschaften 84: 1�8.
Bruderer, B. and Jenni, L. 1990. Migration across the Alps.� In: Gwinner, E. (ed.), Bird migration: physiology andecophysiology. Springer, pp. 60�77.
Bruderer, B. and Liechti, F. 1998. Intensitat, Hohe und Richtungvon Tag- und Nachtzug im Herbst uber Sudwestdeutschland.� Ornithol. Beob. 95: 113�128.
Bruderer, B. and Liechti, F. 2004. Welcher Anteil ziehender Vogelfliegt im Hohenbereich von Windturbinen. � Ornithol. Beob.101: 327�335.
Bruderer, B., Steuri, T. and Baumgartner, M. 1995. Short-rangehigh-precision surveillance of nocturnal migration and track-ing of single targets. � Israel J. Zool. 41: 207�220.
Degen, T. and Jenni, L. 1990. Biotopnutzung von Kleinvogeln ineinem Naturschutzgebiet und im umliegenden Kulturlandwahrend der Herbstzugzeit. � Ornithol. Beob. 87: 295�325.
Dunn, E. and Ralph, C. J. 2004. Use of mist nets as a tool for birdpopulation monitoring. � Stud. Avian Biol. 29: 1�6.
Eastwood, E. 1967. Radar ornithology. � Methuen.Erni, B., Liechti, F. and Bruderer, B. 2005. The role of wind
in passerine autumn migration between Europe and Africa.� Behav. Ecol. 16: 732�740.
Graham, M. H. 2003. Confronting multicollinearity in ecologicalmultiple regressions. � Ecology 84: 2809�2815.
Huppop, O. and Huppop, K. 2003. North Atlantic Oscilla-tion and timing of spring migration in birds. � Proc. R. Soc.Lond. B 270: 233�240.
Husek, J. and Adamik, P. 2008. Long-term trends in the timingof breeding and brood size in the red-back shrike Laniuscollurio in the Czech Republic 1964�2004. � J. Ornithol. 149:97�103.
Jenni, L. 1984. Herbstzugmuster von Vogeln auf dem Col deBretolet unter besonderer Berucksichtigung nachbrutzeitlicherBewegungen. � Ornithol. Beob. 81: 183�213.
Jenni, L. 1996. Habitatwahl nachtziehender Kleinvogel beiBodennebel. � J. Ornithol. 137: 425�434.
Jenni, L. and Kery, M. 2003. Timing of autumn bird migrationunder climate change: advances in long-distance migrants,delays in short-distance migrants. � Proc. R. Soc. Lond. B 270:1467�1471.
Jenni, L., Leuenberger, M. and Rampazzi, F. 1996. Captureefficiency of mist nets with comments on their role in theassessment of passerine habitat use. � J. Field Ornithol. 67:263�274.
Karlsson, L., Ehnbom, S., Persson, K. and Walinder, G. 2002.Changes in numbers of migrating birds at Falsterbo, southSweden, during 1980�1999 as reflected by ringing totals.� Ornis Svec. 12: 113�138.
Korner-Nievergelt, F., Korner-Nievergelt, P., Baader, E., Fischer.,L., Schaffner, W. and Kestenholz, M. 2007. HerbstlicherTagzug auf der Beringungsstation Ulmethochi im Jura:Veranderungen in den Fangzahlen uber 40 Jahre (1966�2005). � Ornithol. Beob. 104: 3�32.
Liechti, F. 2006. Birds: blowin’ in the wind? � J. Ornithol. 147:202�211.
Liechti, F. and Bruderer, B. 1986. Einfluss der lokalen Topo-graphie auf nachtlich ziehende Vogel nach Radarstudien amAlpenrand. � Ornithol. Beob. 83: 35�66.
Liechti, F., Peter, D., Lardelli, R. and Bruderer, B. 1996.Herbstlicher Vogelzug im Alpenraum nach Mondbeobachtun-gen � Topographie und Wind beeinflussen den Zugverlauf.� Ornithol. Beob. 93: 131�152.
Peach, W. J., Furness, R. W. and Brenchley, A. 1999. The use ofringing to monitor changes in the numbers and demographyof birds. � Ring. Migr. 19: 57�66.
Peckford, M. L. and Taylor, P. D. 2008. Within night correlationsbetween radar and ground counts of migrating songbirds.� J. Field Ornithol. 79: 207�214.
Ruesch, E. and Bruderer, B. 1981. Einfluss der Topographie aufnachtlich ziehende Vogel. � Revue Suisse Zool. 88: 865�874.
Schaub, M., Liechti, F. and Jenni, L. 2004. Departure ofmigrating European robins, Erithacus rubecula, from astopover site in relation to wind and rain. � Anim. Behav.67: 229�237.
Schmaljohann, H., Liechti, F., Bachler, E., Steuri, T. andBruderer, B. 2008. Quantification of bird migration by radar �a detection probability problem. � Ibis 150: 342�355.
Simons, T. R., Moore, F. R. and Gauthreaux, S. A. 2004. Mistnetting trans-gulf migrants at coastal stopover sites: theinfluence of spatial and temporal variability on capture data.The use of mist nets to monitor bird populations. � Stud.Avian Biol. 29: 135�143.
Spina, F. 1999. Value of ringing information for bird conservationin Europe. � Ring. Migr. 19: 29�40.
Vickery, J., Wernham, C., Clark, J. and Siriwardena, G. 2007.From Britain to Africa � new insight from bird ringing.� Ostrich 78: 373.
Winkler, R. 1999. Avifauna der Schweiz. � Ornithol. Beob. Beih.10.
442

Zaugg, S., Saporta, G., van Loon, E., Schmaljohann, H. andLiechti, F. 2008. Automatic identification of bird targetswith radar via patterns produced by wing flapping. � J. R. Soc.Interface 5: 1041�1053.
Zehnder, S. and Karlsson, L. 2001. Do ringing numbers reflecttrue migratory activity of nocturnal migrants? � J. Ornithol.142: 173�183.
Zehnder, S., Akesson, S., Liechti, F. and Bruderer, B. 2001a.Nocturnal autumn bird migration at Falsterbo, south Sweden.� J. Avian Biol. 32: 239�248.
Zehnder, S., Liechti, F., Trosch, B. and Bruderer, B. 2001b.Gibt es topographie-unabhangigen Nachtzug uber den Alpen?� Ornithol. Beob. 98: 215�222.
443
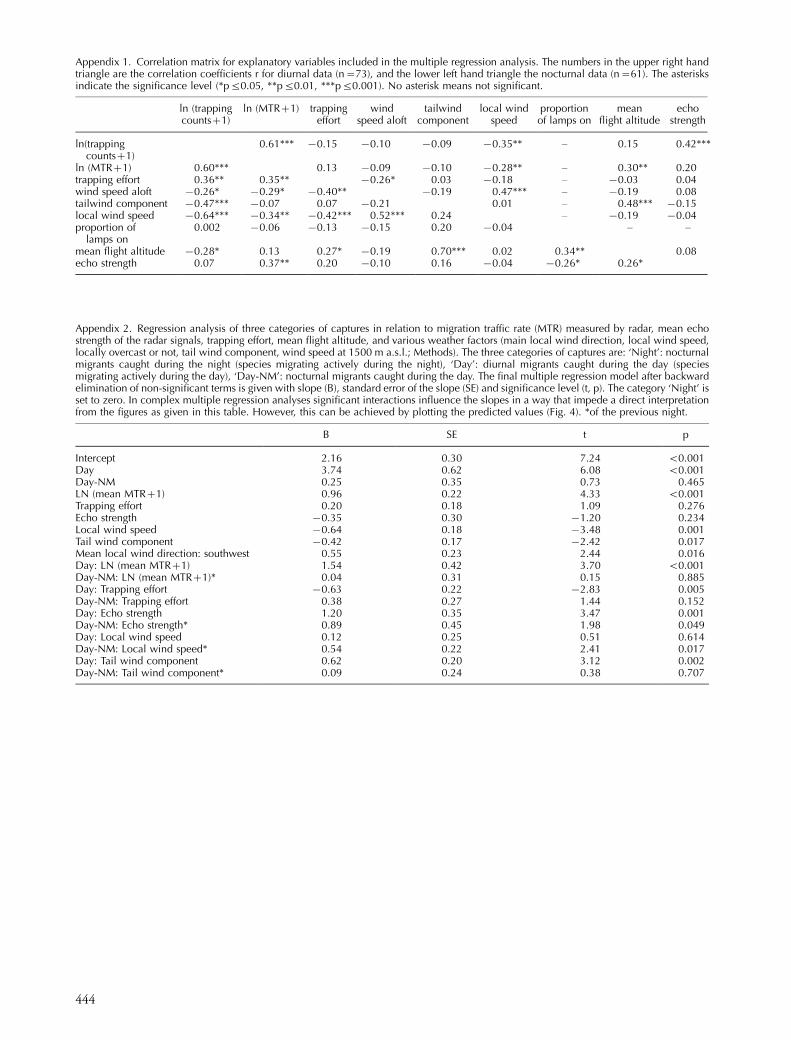
Appendix 2. Regression analysis of three categories of captures in relation to migration traffic rate (MTR) measured by radar, mean echostrength of the radar signals, trapping effort, mean flight altitude, and various weather factors (main local wind direction, local wind speed,locally overcast or not, tail wind component, wind speed at 1500 m a.s.l.; Methods). The three categories of captures are: ‘Night’: nocturnalmigrants caught during the night (species migrating actively during the night), ‘Day’: diurnal migrants caught during the day (speciesmigrating actively during the day), ‘Day-NM’: nocturnal migrants caught during the day. The final multiple regression model after backwardelimination of non-significant terms is given with slope (B), standard error of the slope (SE) and significance level (t, p). The category ‘Night’ isset to zero. In complex multiple regression analyses significant interactions influence the slopes in a way that impede a direct interpretationfrom the figures as given in this table. However, this can be achieved by plotting the predicted values (Fig. 4). *of the previous night.
B SE t p
Intercept 2.16 0.30 7.24 B0.001Day 3.74 0.62 6.08 B0.001Day-NM 0.25 0.35 0.73 0.465LN (mean MTR�1) 0.96 0.22 4.33 B0.001Trapping effort 0.20 0.18 1.09 0.276Echo strength �0.35 0.30 �1.20 0.234Local wind speed �0.64 0.18 �3.48 0.001Tail wind component �0.42 0.17 �2.42 0.017Mean local wind direction: southwest 0.55 0.23 2.44 0.016Day: LN (mean MTR�1) 1.54 0.42 3.70 B0.001Day-NM: LN (mean MTR�1)* 0.04 0.31 0.15 0.885Day: Trapping effort �0.63 0.22 �2.83 0.005Day-NM: Trapping effort 0.38 0.27 1.44 0.152Day: Echo strength 1.20 0.35 3.47 0.001Day-NM: Echo strength* 0.89 0.45 1.98 0.049Day: Local wind speed 0.12 0.25 0.51 0.614Day-NM: Local wind speed* 0.54 0.22 2.41 0.017Day: Tail wind component 0.62 0.20 3.12 0.002Day-NM: Tail wind component* 0.09 0.24 0.38 0.707
Appendix 1. Correlation matrix for explanatory variables included in the multiple regression analysis. The numbers in the upper right handtriangle are the correlation coefficients r for diurnal data (n�73), and the lower left hand triangle the nocturnal data (n�61). The asterisksindicate the significance level (*p50.05, **p50.01, ***p50.001). No asterisk means not significant.
ln (trappingcounts�1)
ln (MTR�1) trappingeffort
windspeed aloft
tailwindcomponent
local windspeed
proportionof lamps on
meanflight altitude
echostrength
ln(trappingcounts�1)
0.61*** �0.15 �0.10 �0.09 �0.35** � 0.15 0.42***
ln (MTR�1) 0.60*** 0.13 �0.09 �0.10 �0.28** � 0.30** 0.20trapping effort 0.36** 0.35** �0.26* 0.03 �0.18 � �0.03 0.04wind speed aloft �0.26* �0.29* �0.40** �0.19 0.47*** � �0.19 0.08tailwind component �0.47*** �0.07 0.07 �0.21 0.01 � 0.48*** �0.15local wind speed �0.64*** �0.34** �0.42*** 0.52*** 0.24 � �0.19 �0.04proportion of
lamps on0.002 �0.06 �0.13 �0.15 0.20 �0.04 � �
mean flight altitude �0.28* 0.13 0.27* �0.19 0.70*** 0.02 0.34** 0.08echo strength 0.07 0.37** 0.20 �0.10 0.16 �0.04 �0.26* 0.26*
444
Copyright © 2022 FDOKUMEN