northern pelagic and blue whiting fisheries working group - ICES

ORIGINAL ARTICLE
Distribution and spatial structure of pelagic fish schools inrelation to the nature of the seabed in the Sicily Straits(Central Mediterranean)Marta D’Elia1, Bernardo Patti 1, Attilio Sulli2, Giorgio Tranchida1, Angelo Bonanno1, Gualtiero Basilone1,Giovanni Giacalone1, Ignazio Fontana1, Simona Genovese1, Castor Guisande3 & Salvatore Mazzola1
1 Istituto per l’Ambiente Marino Costiero, Consiglio Nazionale delle Ricerche, Sede di Mazara del Vallo, Mazara del Vallo (TP), Italy
2 Dipartimento di Geologia e Geodesia di Palermo, Palermo, Italy
3 Facultad de Ciencias, Campus Universitario Lagoas-Marcosende, Universidad de Vigo, Vigo, Spain
Problem
Small pelagic fishes are a significant component of the
Mediterranean fisheries and they are also important to the
ecosystem as they constitute the main prey of a large num-
ber of fish such as tuna, cod and mackerel. In the Mediter-
ranean Sea there are eight main small pelagic species. Only
four of them – anchovy (Engraulis encrasicolus), sardine
(Sardina pilchardus), round sardinella (Sardinella aurita)
and sprat (Sprattus sprattus) – are considered to be fully
Keywords
acoustic surveys; bottom and fish
backscattering; echo-sounder; fish school;
seabed; Sicily Channel.
Correspondence
Bernardo Patti, Istituto per l’Ambiente Marino
Costiero, Consiglio Nazionale delle Ricerche,
Sede di Mazara del Vallo, via L. Vaccara 61,
91026 Mazara del Vallo (TP), Italy.
E-mail: [email protected]
Conflicts of interest
The authors declare no conflicts of interest.
doi:10.1111/j.1439-0485.2009.00328.x
Abstract
Hydroacoustic data collected during two echosurveys carried out in the Sicily
Channel in 1998 and 2002 were analysed to investigate the distribution and
spatial structure of small pelagic fish species in relation to the sedimentological
nature of the sea bottom. The study was carried out on two contiguous areas
(labelled ZONE 1 and ZONE 2) of the continental shelf off the southern coast
of Sicily, characterised by different dominant texture, ‘sand’ for ZONE 1 and
‘clayey-silt’ for ZONE 2. Simultaneous information on small pelagic fish
schools and the seabed was obtained using a quantitative echo-sounder (SIM-
RAD EK500) that measures echoes due to the scattering from both fish schools
and the bottom surface. Acoustically determined fish school and seabed data
were integrated, respectively, with information on species composition obtained
by experimental fishing hauls, and with granulometric information obtained
from the analysis of in situ sediment samples. The results indicate a general
preference of small pelagic fish schools for seabeds of finer granulometry. First,
the occurrence of fish schools was higher over the acoustically classified ‘soft’
seabeds of ZONE 2. Secondly, although ZONE 2 represents <30% of the total
length of daytime acoustic tracks analysed in this study, in both surveys the
bulk of fish biomass (>60%) was concentrated over ‘soft’ seabed substrates of
ZONE 2. Different species composition and ⁄ or behaviour of fish schools in the
two areas investigated were postulated in relation to seabed conditions. Specifi-
cally, over the hard and soft bottoms of ZONE 2, fish schools were found at
lower depths and at shallower bottom depths compared to ZONE 1. Further-
more, over the softer bottoms of ZONE 2, fish schools exhibiting a more ‘pela-
gic’ behaviour (i.e. detected at a greater distance from the bottom) showed a
preference for softer (and finer) seabed substrate conditions. Conversely, fish
schools exhibiting a more ‘demersal’ behaviour (i.e. at a smaller distance from
the bottom) were mostly found on relatively harder substrates.
Marine Ecology. ISSN 0173-9565
Marine Ecology 30 (Suppl. 1) (2009) 151–160 ª 2009 Blackwell Verlag GmbH 151

pelagic, whereas Atlantic mackerel (Scomber scomber),
chub mackerel (Scomber japonicas colias), bogue (Boops bo-
ops) and Atlantic horse mackerel (Trachurus trachurus)
have more or less prolonged biological stages with pelagic
behaviour (Alvares et al. 2003). Two of these species, the
European anchovy and the European sardine, are impor-
tant fishery resources in the Sicilian Channel, and histori-
cally have been exploited by fishermen from the north-
western and southern coasts of Sicily.
The pelagic species are social animals that live in
mono- or plurispecific schools with a highly patchy distri-
bution (Freon & Misund 1999). The distribution and the
spatial structure of pelagic schools is a complex phenome-
non that is controlled by a number of interactive mecha-
nisms and factors (Maravelias 1999; Bahri & Freon 2000;
Soria et al. 2003).
Some authors also considered the nature of the seabed to
be a possible factor affecting fish spatial distribution (Genin
& Boehlert 1985; Dower et al. 1992; Maravelias 1999; Mar-
avelias et al. 2000; Manik et al. 2006a). Specifically, the nat-
ure of the seabed was found to modulate the presence and
relative abundance of Atlantic herring (Clupea harengus)
within the northern North Sea, with species clustering in
habitats with a depth between approximately 100 and
150 m and a gravel ⁄ sand type of seabed, which also carried
the highest abundance of zooplankton (Maravelias 1999;
Maravelias et al. 2000). Manik et al. (2006a), on the other
hand, using hydroacoustic data collected during an echo-
survey carried out during December 2003 in the Indian
Ocean, on the southern coast of Jawa Island (Indonesia),
generally observed a higher occurrence of fish schools (64
schools of the total of 66 detected) over sandy bottoms. Fur-
thermore, the presence of seamounts may affect the aggre-
gation and movement of small pelagic fishes (Allain et al.
2008). The presence of these topographic features on the
ocean floor determines the uplifting of isotherms, isopyc-
nals (Genin & Boehlert 1985) and nutrient isolines (Com-
eau et al. 1995). This upward deflection of deeper, more
nutrient-rich waters can lead to an increase in primary pro-
duction if its effects reach up into the euphotic zone, where
there is enough light for photosynthesis (Furuya et al. 1995;
Odate & Furuya 1998). The same effect could be produced
by different geological structures such as benches, plat-
forms, relieves or marine terraces (Allain et al. 2008).
Some topographic features, such as the degree of land
enclosure and size of habitat, were also found to affect
the spatial structure of anchovy and sardine schools in
the Eastern Mediterranean, suggesting that environmental
spatial heterogeneity, attributable to coastal topography,
is able to affect the way fish schools become organised
into aggregations (Giannulaki et al. 2006).
Another important feature of habitat selection related
to the seabed is the frequent association of pelagic species
with sudden breaks in the bottom depth due to submar-
ine canyons, escarpment areas or deep water basins
located close to the shore, as reported by Mais (1977) for
the northern anchovies (Engraulis mordax) in the Califor-
nia current system.
Habitat selection related to the seabed could also be
linked to the daily vertical migration of these species
along the water column. For instance, Dias et al. (1989)
and Zwolinski et al. (2007) reported that sardine and
pelagic fish schools off Portugal are often observed on the
bottom during the night, with schools descending
towards the seabed during their expansion at dusk, and
remain in close contact with the seabed throughout the
night. Although the descent may be linked to the spawn-
ing behaviour of the species, with reproduction occurring
at dusk close to the seabed (Zwolinski et al. 2007), similar
patterns have been observed off Portugal outside the
spawning season (Dias et al. 1989). This pattern of diel
vertical migration contrasts with that reported for sardine
in the Eastern Mediterranean (Giannoulaki et al. 1999)
and for the round sardine (S. aurita) in Senegal. Nieland
(1982) found a large proportion of mud and sediments
that had a non-negligible energetic value in the stomach
of these sardines (S. aurita off Senegal).
For pelagic fish, light above a certain threshold is
needed for visual predation (Blaxter & Hunter 1982). For
such species, upward migration at dusk has been identi-
fied as a strategy for increasing feeding opportunities at
twilight (Blaxter & Holliday 1963; Cardinale et al. 2003).
In contrast, filter-feeding clupeids can feed on abundant
or small prey even in darkness (Batty et al. 1986). The
presence of schools close to the bottom may be due to
the presence of sufficient food or to processes unrelated
to feeding, such as the use of the shelf for orientation
during migration (Kim et al. 1993).
In the present study the geographical distribution and
the spatial structure of pelagic fish schools off the south-
ern coast of Sicily (Central Mediterranean) detected by
image analysis algorithms applied to hydroacoustic data
were examined to investigate their association with the
nature of the seabed. This study is of primary interest for
stock assessment and management aims because it could
allow identification of favourable environmental condi-
tions or micro-habitats at small time scales for the pelagic
species in the Sicilian Channel.
Material and Methods
Study site description
This study is mainly based on acoustic information gath-
ered in the Sicilian Channel over the two sectors labelled
in Fig. 1 as ‘ZONE 1’ (north-western sector, over the
Fish schools in relation to the seabed D’Elia, Patti, Sulli, Tranchida, Bonanno, Giacalone, Fontana, Genovese, Guisande & Mazzola
152 Marine Ecology 30 (Suppl. 1) (2009) 151–160 ª 2009 Blackwell Verlag GmbH
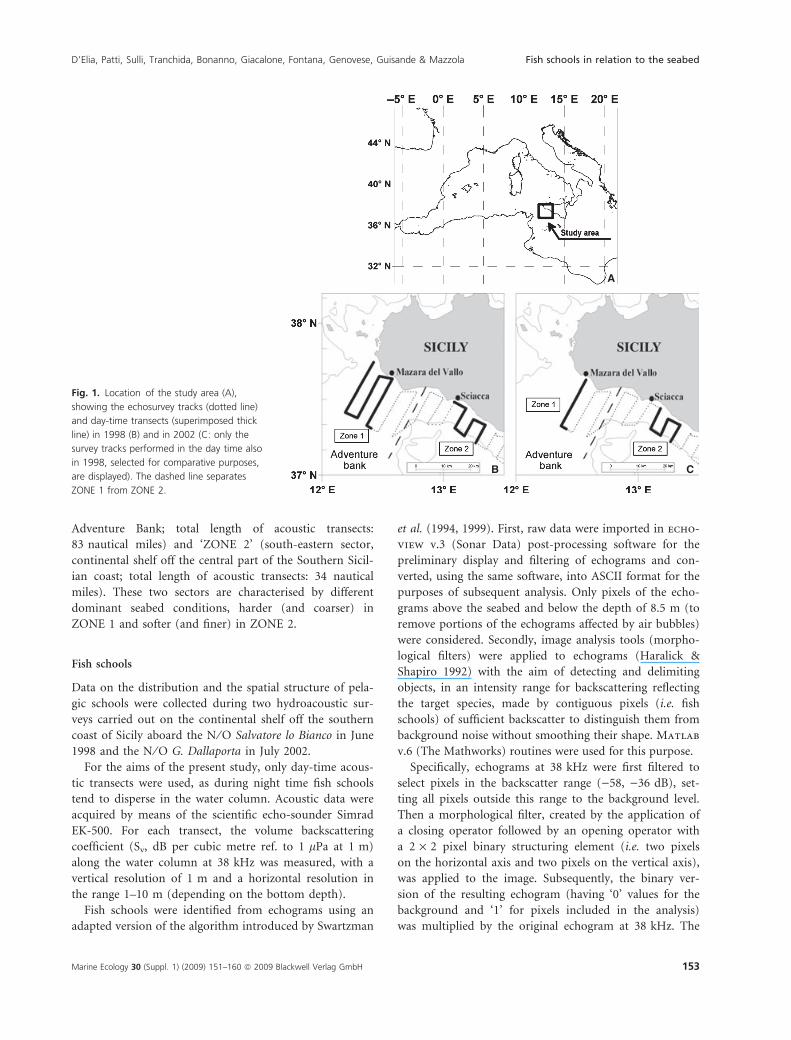
Adventure Bank; total length of acoustic transects:
83 nautical miles) and ‘ZONE 2’ (south-eastern sector,
continental shelf off the central part of the Southern Sicil-
ian coast; total length of acoustic transects: 34 nautical
miles). These two sectors are characterised by different
dominant seabed conditions, harder (and coarser) in
ZONE 1 and softer (and finer) in ZONE 2.
Fish schools
Data on the distribution and the spatial structure of pela-
gic schools were collected during two hydroacoustic sur-
veys carried out on the continental shelf off the southern
coast of Sicily aboard the N ⁄ O Salvatore lo Bianco in June
1998 and the N ⁄ O G. Dallaporta in July 2002.
For the aims of the present study, only day-time acous-
tic transects were used, as during night time fish schools
tend to disperse in the water column. Acoustic data were
acquired by means of the scientific echo-sounder Simrad
EK-500. For each transect, the volume backscattering
coefficient (Sv, dB per cubic metre ref. to 1 lPa at 1 m)
along the water column at 38 kHz was measured, with a
vertical resolution of 1 m and a horizontal resolution in
the range 1–10 m (depending on the bottom depth).
Fish schools were identified from echograms using an
adapted version of the algorithm introduced by Swartzman
et al. (1994, 1999). First, raw data were imported in echo-
view v.3 (Sonar Data) post-processing software for the
preliminary display and filtering of echograms and con-
verted, using the same software, into ASCII format for the
purposes of subsequent analysis. Only pixels of the echo-
grams above the seabed and below the depth of 8.5 m (to
remove portions of the echograms affected by air bubbles)
were considered. Secondly, image analysis tools (morpho-
logical filters) were applied to echograms (Haralick &
Shapiro 1992) with the aim of detecting and delimiting
objects, in an intensity range for backscattering reflecting
the target species, made by contiguous pixels (i.e. fish
schools) of sufficient backscatter to distinguish them from
background noise without smoothing their shape. Matlab
v.6 (The Mathworks) routines were used for this purpose.
Specifically, echograms at 38 kHz were first filtered to
select pixels in the backscatter range ()58, )36 dB), set-
ting all pixels outside this range to the background level.
Then a morphological filter, created by the application of
a closing operator followed by an opening operator with
a 2 · 2 pixel binary structuring element (i.e. two pixels
on the horizontal axis and two pixels on the vertical axis),
was applied to the image. Subsequently, the binary ver-
sion of the resulting echogram (having ‘0’ values for the
background and ‘1’ for pixels included in the analysis)
was multiplied by the original echogram at 38 kHz. The
A
CB
Fig. 1. Location of the study area (A),
showing the echosurvey tracks (dotted line)
and day-time transects (superimposed thick
line) in 1998 (B) and in 2002 (C: only the
survey tracks performed in the day time also
in 1998, selected for comparative purposes,
are displayed). The dashed line separates
ZONE 1 from ZONE 2.
D’Elia, Patti, Sulli, Tranchida, Bonanno, Giacalone, Fontana, Genovese, Guisande & Mazzola Fish schools in relation to the seabed
Marine Ecology 30 (Suppl. 1) (2009) 151–160 ª 2009 Blackwell Verlag GmbH 153
final echogram was therefore characterised by the back-
scattering levels of the original echogram for all identified
fish schools and the background level ()100 dB) for all
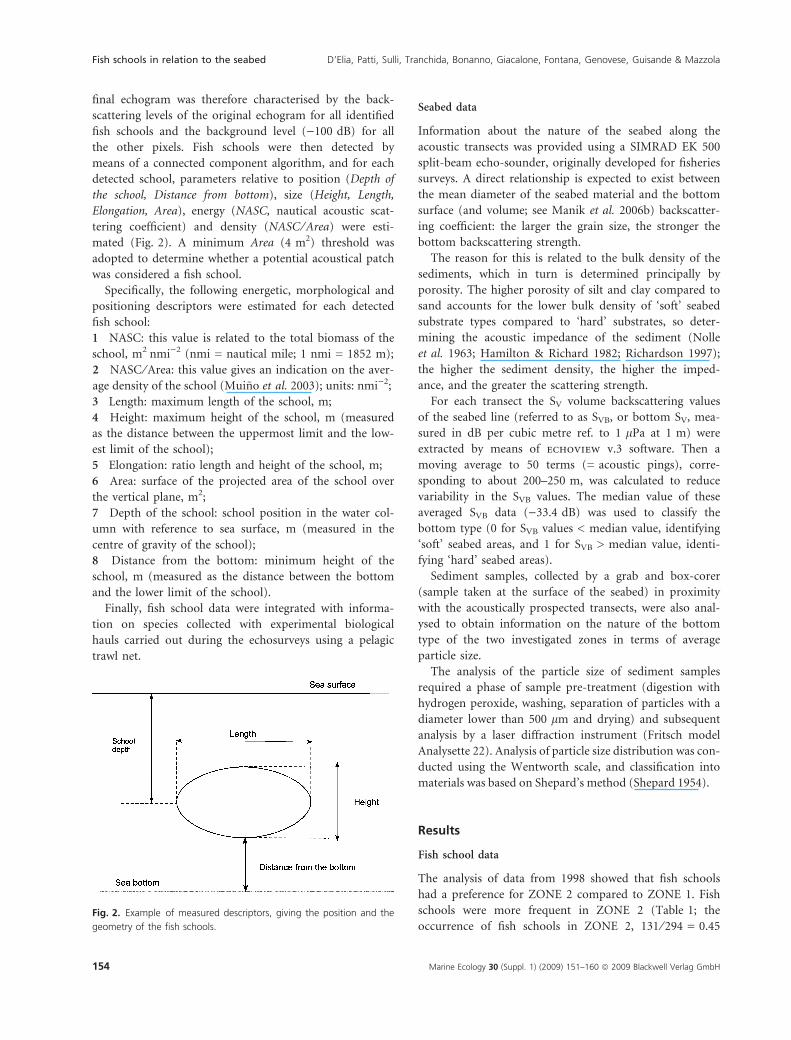
the other pixels. Fish schools were then detected by
means of a connected component algorithm, and for each
detected school, parameters relative to position (Depth of
the school, Distance from bottom), size (Height, Length,
Elongation, Area), energy (NASC, nautical acoustic scat-
tering coefficient) and density (NASC ⁄ Area) were esti-
mated (Fig. 2). A minimum Area (4 m2) threshold was
adopted to determine whether a potential acoustical patch
was considered a fish school.
Specifically, the following energetic, morphological and
positioning descriptors were estimated for each detected
fish school:
1 NASC: this value is related to the total biomass of the
school, m2Ænmi)2 (nmi = nautical mile; 1 nmi = 1852 m);
2 NASC ⁄ Area: this value gives an indication on the aver-
age density of the school (Muino et al. 2003); units: nmi)2;
3 Length: maximum length of the school, m;
4 Height: maximum height of the school, m (measured
as the distance between the uppermost limit and the low-
est limit of the school);
5 Elongation: ratio length and height of the school, m;
6 Area: surface of the projected area of the school over
the vertical plane, m2;
7 Depth of the school: school position in the water col-
umn with reference to sea surface, m (measured in the
centre of gravity of the school);
8 Distance from the bottom: minimum height of the
school, m (measured as the distance between the bottom
and the lower limit of the school).
Finally, fish school data were integrated with informa-
tion on species collected with experimental biological
hauls carried out during the echosurveys using a pelagic
trawl net.
Seabed data
Information about the nature of the seabed along the
acoustic transects was provided using a SIMRAD EK 500
split-beam echo-sounder, originally developed for fisheries
surveys. A direct relationship is expected to exist between
the mean diameter of the seabed material and the bottom
surface (and volume; see Manik et al. 2006b) backscatter-
ing coefficient: the larger the grain size, the stronger the
bottom backscattering strength.
The reason for this is related to the bulk density of the
sediments, which in turn is determined principally by
porosity. The higher porosity of silt and clay compared to
sand accounts for the lower bulk density of ‘soft’ seabed
substrate types compared to ‘hard’ substrates, so deter-
mining the acoustic impedance of the sediment (Nolle
et al. 1963; Hamilton & Richard 1982; Richardson 1997);
the higher the sediment density, the higher the imped-
ance, and the greater the scattering strength.
For each transect the SV volume backscattering values
of the seabed line (referred to as SVB, or bottom SV, mea-
sured in dB per cubic metre ref. to 1 lPa at 1 m) were
extracted by means of echoview v.3 software. Then a
moving average to 50 terms (= acoustic pings), corre-
sponding to about 200–250 m, was calculated to reduce
variability in the SVB values. The median value of these
averaged SVB data ()33.4 dB) was used to classify the
bottom type (0 for SVB values < median value, identifying
‘soft’ seabed areas, and 1 for SVB > median value, identi-
fying ‘hard’ seabed areas).
Sediment samples, collected by a grab and box-corer
(sample taken at the surface of the seabed) in proximity
with the acoustically prospected transects, were also anal-
ysed to obtain information on the nature of the bottom
type of the two investigated zones in terms of average
particle size.
The analysis of the particle size of sediment samples
required a phase of sample pre-treatment (digestion with
hydrogen peroxide, washing, separation of particles with a
diameter lower than 500 lm and drying) and subsequent
analysis by a laser diffraction instrument (Fritsch model
Analysette 22). Analysis of particle size distribution was con-
ducted using the Wentworth scale, and classification into
materials was based on Shepard’s method (Shepard 1954).
Results
Fish school data
The analysis of data from 1998 showed that fish schools
had a preference for ZONE 2 compared to ZONE 1. Fish
schools were more frequent in ZONE 2 (Table 1; the
occurrence of fish schools in ZONE 2, 131 ⁄ 294 = 0.45Fig. 2. Example of measured descriptors, giving the position and the
geometry of the fish schools.
Fish schools in relation to the seabed D’Elia, Patti, Sulli, Tranchida, Bonanno, Giacalone, Fontana, Genovese, Guisande & Mazzola
154 Marine Ecology 30 (Suppl. 1) (2009) 151–160 ª 2009 Blackwell Verlag GmbH
was significantly higher than the proportion of survey
tracks in ZONE 2, 34 ⁄ 117 = 0.29; normal test, Z = 5.9,
P < 0.001) compared to ZONE 1, and despite the shorter
transect length (34 versus 83 nmi), their biomass repre-
sented up to 57.2% of the total. On average, morphologi-
cal descriptors of the analysed fish schools (with bottom
depth <200 m) did not show significant differences
between the two zones (ANOVA; P > 0.37). Conversely,
significant differences were found in positioning (ANO-
VA; P < 0.01) and energetic (NASC, ANOVA,
F1,292 = 5.7; P = 0.02) descriptors. Specifically, fish
schools detected in ZONE 2 had a greater energy and
were found at a greater average distance from the sea bot-
tom than schools in ZONE 1, whereas the greater average
school depth in ZONE 1 appears to reflect its higher
average bottom depth (Table 1). In fact, all school de-
scriptors, with the exceptions of Area and Height, were
significantly (and positively) correlated with bottom
depth (ANCOVA; P < 0.001).
A similar pattern was found when analysing schools
with a centre of mass in the lower half of the water col-
umn (schools with ratio between fish school depth and
bottom depth >50%). This selection accounted for most
of the total fish biomass, including 247 of the total 294
detected fish schools, but removing shallower and less
dense aggregations, mostly related to schools in formation
or dispersion, which greatly affected the average distance
from the bottom of detected schools in the two zones
(see Table 2). Hydroacoustic data collected during the
2002 survey were analysed and compared to the 1998 data
only in relation to bottom substrate conditions (see
below).
Seabed data
The results of the acoustic-based bottom type classifica-
tion are displayed in Fig. 3, together with information
obtained from the analysis of sediment samples collected
over the study area. The acoustic classification demon-
strates the differences in terms of bottom types between
the two zones along the investigated transects. Although
the average bottom depth of the prospected transects is
higher in ZONE 1, this area (in particular the western
sector over the Adventure Bank) is dominated by sub-
strates with greater scattering strength, indicating rela-
tively ‘harder’ (and coarser) bottom types. In contrast, in
ZONE 2 the ‘hard’ substrate is confined to the shallower
inter-transect regions, with the bulk of the seabed deeper
than 50 m classified as ‘soft’ bottom.
The granulometric analysis of sediment samples is con-
sistent with the results of the acoustic classification of the
seabed. Although the sediment sample sites were available
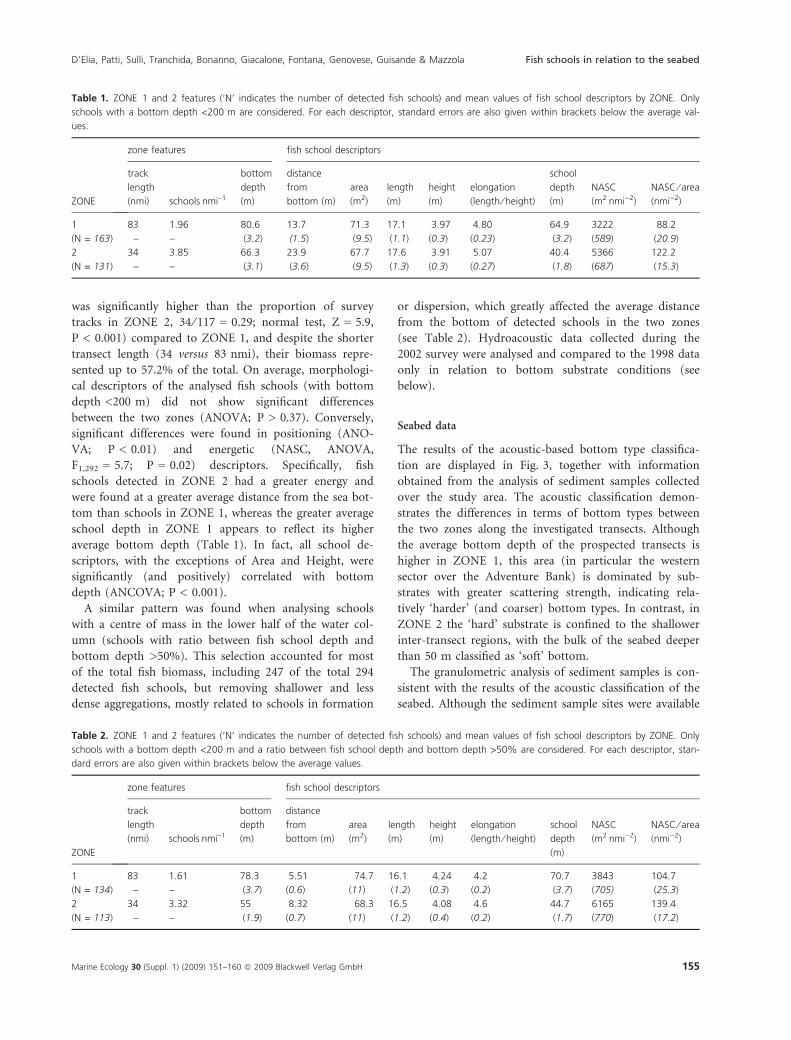
Table 1. ZONE 1 and 2 features (‘N’ indicates the number of detected fish schools) and mean values of fish school descriptors by ZONE. Only
schools with a bottom depth <200 m are considered. For each descriptor, standard errors are also given within brackets below the average val-
ues.
ZONE
zone features fish school descriptors
track
length
(nmi) schoolsÆnmi–1
bottom
depth
(m)
distance
from
bottom (m)
area
(m2)
length
(m)
height
(m)
elongation
(length ⁄ height)
school
depth
(m)
NASC
(m2Ænmi)2)
NASC ⁄ area
(nmi)2)
1 83 1.96 80.6 13.7 71.3 17.1 3.97 4.80 64.9 3222 88.2
(N = 163) – – (3.2) (1.5) (9.5) (1.1) (0.3) (0.23) (3.2) (589) (20.9)
2 34 3.85 66.3 23.9 67.7 17.6 3.91 5.07 40.4 5366 122.2
(N = 131) – – (3.1) (3.6) (9.5) (1.3) (0.3) (0.27) (1.8) (687) (15.3)
Table 2. ZONE 1 and 2 features (‘N’ indicates the number of detected fish schools) and mean values of fish school descriptors by ZONE. Only
schools with a bottom depth <200 m and a ratio between fish school depth and bottom depth >50% are considered. For each descriptor, stan-
dard errors are also given within brackets below the average values.
ZONE
zone features fish school descriptors
track
length
(nmi) schoolsÆnmi–1
bottom
depth
(m)
distance
from
bottom (m)
area
(m2)
length
(m)
height
(m)
elongation
(length ⁄ height)
school
depth
(m)
NASC
(m2Ænmi)2)
NASC ⁄ area
(nmi)2)
1 83 1.61 78.3 5.51 74.7 16.1 4.24 4.2 70.7 3843 104.7
(N = 134) – – (3.7) (0.6) (11) (1.2) (0.3) (0.2) (3.7) (705) (25.3)
2 34 3.32 55 8.32 68.3 16.5 4.08 4.6 44.7 6165 139.4
(N = 113) – – (1.9) (0.7) (11) (1.2) (0.4) (0.2) (1.7) (770) (17.2)
D’Elia, Patti, Sulli, Tranchida, Bonanno, Giacalone, Fontana, Genovese, Guisande & Mazzola Fish schools in relation to the seabed
Marine Ecology 30 (Suppl. 1) (2009) 151–160 ª 2009 Blackwell Verlag GmbH 155

only in proximity to the acoustically prospected transects
(within a distance of mostly <1 nmi), it is worth noting
that the use of a threshold value of 8 lm for the median
particle size of the analysed sediment samples permitted
us to separate finer (and softer) substrate locations (clas-
sified as clayey-silt and silt-clay), corresponding at the
nearest position along the acoustic transect to SVB values
lower than the global median value, from coarser (and
harder) sediment sites (facies: silty-sand, sandy-silt, sand
and gravelly sediment) matching with higher SVB values.
Combination of fish school and seabed data
The spatial structure and distribution of fish schools
detected over the continental shelf (bottom
depth <200 m) and the centre of mass in the lower half
of the water column were linked to the type of seabed.
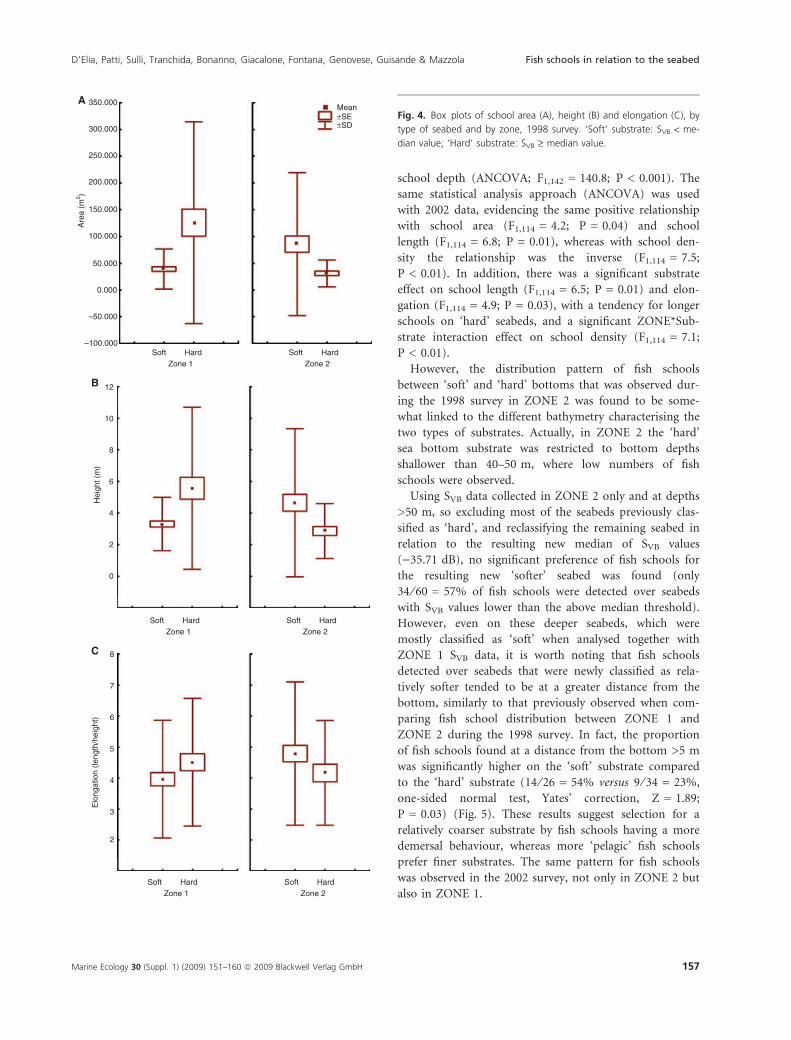
In terms of morphological school descriptors, in ZONE
1 the average elongation, height and area of fish schools
observed during the 1998 survey tended to be positively
associated with higher sea bottom SVB values, which were
directly proportional to the mean granulometric dimen-
sion of the seabed sediment (i.e. harder bottom), but this
association reverted in ZONE 2 (Fig. 4). However, no sig-
nificant zone or substrate type effect was found (ANCO-
VA; P > 0.05). School area, length, height (P < 0.05), and
depth (F1,239 = 321.3; P < 0.001) were positively corre-
lated with bottom depth. Similar patterns, though less
pronounced, were also observed during the 2002 survey.
The occurrence of fish schools over the whole study
area during the 1998 survey was significantly higher on
relatively ‘softer’ grounds (167 ⁄ 247 = 0.68; normal test,
Z = 5.5; P < 0.001). The preference of fish schools for
seabeds with finer granulometry was also observed when
considering the two investigated areas separately, as the
proportion of schools detected over acoustically ‘softer’
grounds in both ZONE 1 and ZONE 2 (respectively,
89 ⁄ 134 = 0.66 and 78 ⁄ 113 = 0.69) was significantly
higher (normal tests, Z = 4.0 and Z = 3.4; P < 0.001)
than the fraction detected over acoustically classified ‘soft’
seabed in the corresponding zones (respectively, 49% and
53%).
Comparison of the distribution patterns of detected
fish schools on ‘hard’ and ‘soft’ seabed substrates between
the two echosurveys considered in the present study, car-
ried out using only data from day-time transects
(Fig. 1B), demonstrated a certain stability over time. In
fact, even though fish abundance was considerably lower
in the 2002 survey compared to 1998, in both years the
occurrence of fish schools over ‘soft’ and ‘hard’ seabeds
of ZONE 1 was not significantly different. Conversely, in
ZONE 2, representing just 29% of the total length of the
analysed day-time acoustic tracks (about 53 nmi) but
accounting for 57% of seabeds classified as ‘soft’, fish
schools were significantly more frequent (76% in 1998
and 88% in 2002) over bottoms with finer granulometry
(year 1998: normal test, Z = 3.8, P < 0.001; year 2002:
normal test, Z = 4.4; P < 0.001) and accounted for the
bulk (>60%) of total estimated fish biomass. The analysis
of school descriptors for the 1998 survey did not show
any significant ZONE or substrate effect (ANCOVA;
P > 0.05). Again, bottom depth was found to affect
Fig. 3. Acoustic classification of the seabed
(1998 day time data), based on bottom SVB
values recorded during the day time transects
in 1998, binned and averaged every 0.1 nmi.
‘Hard’ seabeds are displayed in light grey
(SVB ‡ median value), and ‘Soft’ seabeds are
displayed in dark grey (SVB < median value).
The sediment sample sites are also shown,
with white squares representing samples with
a median particle size ‡8 lm and black
squares those with a median particle size
<8 lm. Shepard’s sediment classification
labels are also given under the symbols.
Fish schools in relation to the seabed D’Elia, Patti, Sulli, Tranchida, Bonanno, Giacalone, Fontana, Genovese, Guisande & Mazzola
156 Marine Ecology 30 (Suppl. 1) (2009) 151–160 ª 2009 Blackwell Verlag GmbH
school depth (ANCOVA; F1,142 = 140.8; P < 0.001). The
same statistical analysis approach (ANCOVA) was used
with 2002 data, evidencing the same positive relationship
with school area (F1,114 = 4.2; P = 0.04) and school
length (F1,114 = 6.8; P = 0.01), whereas with school den-
sity the relationship was the inverse (F1,114 = 7.5;
P < 0.01). In addition, there was a significant substrate
effect on school length (F1,114 = 6.5; P = 0.01) and elon-
gation (F1,114 = 4.9; P = 0.03), with a tendency for longer
schools on ‘hard’ seabeds, and a significant ZONE*Sub-
strate interaction effect on school density (F1,114 = 7.1;
P < 0.01).
However, the distribution pattern of fish schools
between ‘soft’ and ‘hard’ bottoms that was observed dur-
ing the 1998 survey in ZONE 2 was found to be some-
what linked to the different bathymetry characterising the
two types of substrates. Actually, in ZONE 2 the ‘hard’
sea bottom substrate was restricted to bottom depths
shallower than 40–50 m, where low numbers of fish
schools were observed.
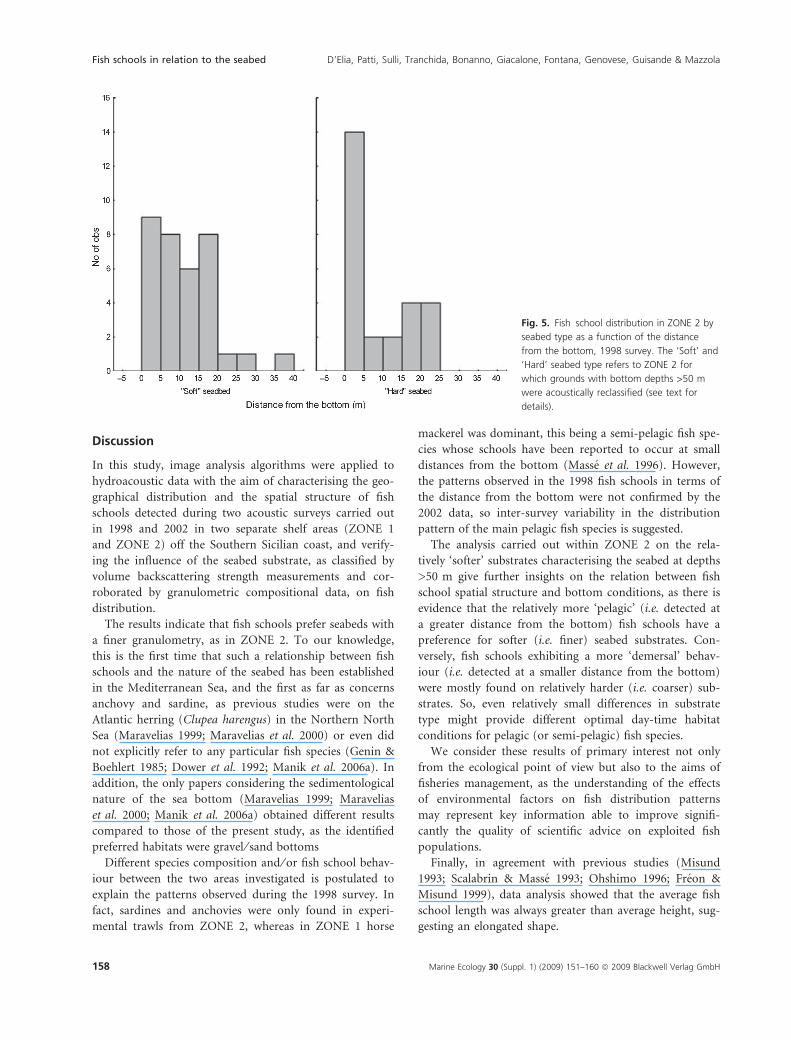
Using SVB data collected in ZONE 2 only and at depths
>50 m, so excluding most of the seabeds previously clas-
sified as ‘hard’, and reclassifying the remaining seabed in
relation to the resulting new median of SVB values
()35.71 dB), no significant preference of fish schools for
the resulting new ‘softer’ seabed was found (only
34 ⁄ 60 = 57% of fish schools were detected over seabeds
with SVB values lower than the above median threshold).
However, even on these deeper seabeds, which were
mostly classified as ‘soft’ when analysed together with
ZONE 1 SVB data, it is worth noting that fish schools
detected over seabeds that were newly classified as rela-
tively softer tended to be at a greater distance from the
bottom, similarly to that previously observed when com-
paring fish school distribution between ZONE 1 and
ZONE 2 during the 1998 survey. In fact, the proportion
of fish schools found at a distance from the bottom >5 m
was significantly higher on the ‘soft’ substrate compared
to the ‘hard’ substrate (14 ⁄ 26 = 54% versus 9 ⁄ 34 = 23%,
one-sided normal test, Yates’ correction, Z = 1.89;
P = 0.03) (Fig. 5). These results suggest selection for a
relatively coarser substrate by fish schools having a more
demersal behaviour, whereas more ‘pelagic’ fish schools
prefer finer substrates. The same pattern for fish schools
was observed in the 2002 survey, not only in ZONE 2 but
also in ZONE 1.
350.000
Are
a (m
2 )
Hei
ght (
m)
300.000
250.000
200.000
150.000
100.000
50.000
0.000
–50.000
–100.000
12
10
8
6
4
2
0
Elo
ngat
ion
(leng
th/h
eigh
t)
8
7
6
5
4
3
2
Soft HardZone 1
Soft Hard
±SE±SD
Mean
Zone 2
Soft HardZone 1
Soft HardZone 2
Soft HardZone 1
Soft HardZone 2
A
B
C
Fig. 4. Box plots of school area (A), height (B) and elongation (C), by
type of seabed and by zone, 1998 survey. ‘Soft’ substrate: SVB < me-
dian value; ‘Hard’ substrate: SVB ‡ median value.
D’Elia, Patti, Sulli, Tranchida, Bonanno, Giacalone, Fontana, Genovese, Guisande & Mazzola Fish schools in relation to the seabed
Marine Ecology 30 (Suppl. 1) (2009) 151–160 ª 2009 Blackwell Verlag GmbH 157
Discussion
In this study, image analysis algorithms were applied to
hydroacoustic data with the aim of characterising the geo-
graphical distribution and the spatial structure of fish
schools detected during two acoustic surveys carried out
in 1998 and 2002 in two separate shelf areas (ZONE 1
and ZONE 2) off the Southern Sicilian coast, and verify-
ing the influence of the seabed substrate, as classified by
volume backscattering strength measurements and cor-
roborated by granulometric compositional data, on fish
distribution.
The results indicate that fish schools prefer seabeds with
a finer granulometry, as in ZONE 2. To our knowledge,
this is the first time that such a relationship between fish
schools and the nature of the seabed has been established
in the Mediterranean Sea, and the first as far as concerns
anchovy and sardine, as previous studies were on the
Atlantic herring (Clupea harengus) in the Northern North
Sea (Maravelias 1999; Maravelias et al. 2000) or even did
not explicitly refer to any particular fish species (Genin &
Boehlert 1985; Dower et al. 1992; Manik et al. 2006a). In
addition, the only papers considering the sedimentological
nature of the sea bottom (Maravelias 1999; Maravelias
et al. 2000; Manik et al. 2006a) obtained different results
compared to those of the present study, as the identified
preferred habitats were gravel ⁄ sand bottoms
Different species composition and ⁄ or fish school behav-
iour between the two areas investigated is postulated to
explain the patterns observed during the 1998 survey. In
fact, sardines and anchovies were only found in experi-
mental trawls from ZONE 2, whereas in ZONE 1 horse
mackerel was dominant, this being a semi-pelagic fish spe-
cies whose schools have been reported to occur at small
distances from the bottom (Masse et al. 1996). However,
the patterns observed in the 1998 fish schools in terms of
the distance from the bottom were not confirmed by the
2002 data, so inter-survey variability in the distribution
pattern of the main pelagic fish species is suggested.
The analysis carried out within ZONE 2 on the rela-
tively ‘softer’ substrates characterising the seabed at depths
>50 m give further insights on the relation between fish
school spatial structure and bottom conditions, as there is
evidence that the relatively more ‘pelagic’ (i.e. detected at
a greater distance from the bottom) fish schools have a
preference for softer (i.e. finer) seabed substrates. Con-
versely, fish schools exhibiting a more ‘demersal’ behav-
iour (i.e. detected at a smaller distance from the bottom)
were mostly found on relatively harder (i.e. coarser) sub-
strates. So, even relatively small differences in substrate
type might provide different optimal day-time habitat
conditions for pelagic (or semi-pelagic) fish species.
We consider these results of primary interest not only
from the ecological point of view but also to the aims of
fisheries management, as the understanding of the effects
of environmental factors on fish distribution patterns
may represent key information able to improve signifi-
cantly the quality of scientific advice on exploited fish
populations.
Finally, in agreement with previous studies (Misund
1993; Scalabrin & Masse 1993; Ohshimo 1996; Freon &
Misund 1999), data analysis showed that the average fish
school length was always greater than average height, sug-
gesting an elongated shape.
Fig. 5. Fish school distribution in ZONE 2 by
seabed type as a function of the distance
from the bottom, 1998 survey. The ‘Soft’ and
‘Hard’ seabed type refers to ZONE 2 for
which grounds with bottom depths >50 m
were acoustically reclassified (see text for
details).
Fish schools in relation to the seabed D’Elia, Patti, Sulli, Tranchida, Bonanno, Giacalone, Fontana, Genovese, Guisande & Mazzola
158 Marine Ecology 30 (Suppl. 1) (2009) 151–160 ª 2009 Blackwell Verlag GmbH
Acknowledgements
Hydroacoustic data and sediment samples were collected
during oceanographic cruises carried out in the context
of the MAGO project (MED98-070), financed by the
Commission of the European Communities, Directorate
General for Fisheries (DG XIV), and of the ASTAMAR
project, financed by the Ministry of Scientific and Tech-
nological Research (Italy). The authors would especially
like to thank all the people who sailed on the R ⁄ V Ura-
nia, R ⁄ V Salvatore Lo Bianco and R ⁄ V Dallaporta for their
valuable contribution during the cruises.
References
Allain V., Kerandel J.-A., Andrefouet S., Magron F., Clark M.,
Kirby D.S., Muller-Karger F.E. (2008) Enhanced seamount
location database for the western and central Pacific Ocean:
Screening and cross-checking of 20 existing datasets. Deep Sea
Research. Part I, Oceanographic Research Papers, 55, 1035–1047.
Alvares F., Cingolani N., Kallianiotis A. (2003) Piccoli pelagici:
gestione futura delle risorse condivise in Mediterraneo. Il
Pesce, 5, 57–65.
Bahri T., Freon P. (2000) Spatial structure of coastal pelagic
schools descriptors in the Mediterranean Sea. Fisheries
Research, 48, 157–166.
Batty R., Blaxter J., Libby D. (1986) Herring (Clupea harengus)
filter-feeding in the dark. Marine Biology, 91, 371–375.
Blaxter J., Holliday F. (1963) The behaviour and physiology of
herring and other clupeids. Advances in Marine Biology, 1,
261–393.
Blaxter J., Hunter J. (1982) The biology of the clupeoid fishes.
Advances in Marine Biology, 20, 1–223.
Cardinale M., Casini M., Arrhenius F., Hakkansson N. (2003)
Diel spatial distribution and feeding activity of herring Clu-
pea harengus and sprat Sprattus sprattus in the Baltic Sea.
Aquatic Living Resources, 16, 283–292.
Comeau L.A., Vezina A.F., Bourgeois M., Juniper S.K. (1995)
Relationship between phytoplankton production and the
physical structure of the water column near Cobb Se-
amount, northeast Pacific. Deep Sea Research. Part I, Ocean-
ographic Research Papers, 42, 993–1005.
Dias C., Soares E., Marques V. (1989) Acoustic abundance
estimations of sardine (Sardina pilchardus, Walb.) off the
Portuguese coast. ICES Document CM 1989 ⁄ H: 52. 24 pp.
Dower J., Freeland H., Juniper K. (1992) A strong biological
response to oceanic flow past Cobb seamount. Deep Sea
Research. Part I, Oceanographic Research Papers, 39, 1139–1145.
Freon P., Misund O.A. (1999) Dynamics of Pelagic Fish Distri-
bution and Behaviour: Effect on Fisheries and Stock Assess-
ment. Fishing New Books, Blackwell Science Ltd, Oxford:
348 pp.
Furuya K., Odate T., Taguchi K. (1995) Effect of a seamount
on phytoplankton production in the western Pacific Ocean.
In: Sakai H., Nozaki Y. (Eds), Biogeochemical Processes and
Ocean Flux in the Western Pacific. Terra Scientific Publishing
Company (TERRAPUB), Tokyo: 255–273.
Genin A., Boehlert G.W. (1985) Dynamics of temperature and
chlorophyll structures above a seamount: An oceanic experi-
ment. Journal of Marine Research, 43, 907–924.
Giannoulaki M., Machias A., Tsimenides N. (1999) Ambient
luminance and vertical migration of the sardine Sardina pil-
chardus. Marine Ecology Progress Series, 178, 29–38.
Giannulaki M., Machias A., Koutsikopoulos C., Somarakis S.
(2006) The effect of coastal topography on the spatial struc-
ture of anchovy and sardine. ICES Journal of Marine Science,
63, 650–662.
Hamilton E.L., Richard T.B. (1982) Sound velocity and related
properties of marine sediments. Journal of the Acoustical
Society of America, 72, 1891–1904.
Haralick R., Shapiro L. (1992) Computer and Robot Vision.
Vol. 1. Addison-Wesley, New York.
Kim M.K., Arimoto T., Matsushita Y., Inoue Y. (1993) Migra-
tion behaviour of fish schools in set-net fishing grounds. Bul-
letin of the Japanese Society of Scientific Fisheries, 59, 473–479.
Mais K.F. (1977) Acoustic surveys of northern anchovies in
the California current system, 1966–1972. Rapports et Pro-
ces-verbaux des Reunions. Conseil international pour l’explora-
tion scientifique de la mer Mediterranee, 170, 287–295.
Manik H.M., Furusawa M., Amakasu K. (2006a) Quantifying
sea bottom surface backscattering strength and identifying
bottom fish habitat by quantitative echo sounder. Japanese
Journal of Applied Physics, Part 1: Regular Papers & Short
Notes, 45, 4865–4867.
Manik H.M., Furusawa M., Amakasu K. (2006b) Measurement
of the sea bottom surface backscattering strength by quanti-
tative echo sounder. Fisheries Science, 72, 503–512.
Maravelias C.D. (1999) Habitat selection and clustering of a
pelagic fish: effect of topography and bathymetry on species
dynamics. Canadian Journal of Fisheries and Aquatic Sciences,
56, 437–450.
Maravelias C.D., Reid D.G., Swartzman G. (2000) Seabed sub-
strate, water depth and zooplankton as determinants of the
prespawning spatial aggregation of North Atlantic herring.
Marine Ecology Progress Series, 195, 249–259.
Masse J., Koutsikopolous C., Patty W. (1996) The structure
and spatial distribution of pelagic fish schools in multispe-
cies clusters: an acoustic study. ICES Journal of Marine Sci-
ence, 53, 155–160.
Misund O. (1993) Dynamics of moving masses: variability in
packing density, shape, and size among herring, sprat, and sai-
the schools. ICES Journal of Marine Science, 50, 145–160.
Muino R., Carrera P., Iglesias M. (2003) The characterization
of sardine (Sardina pilchardus Walbaum) schools off the
Spanish-Atlantic coast. ICES Journal of Marine Science, 60,
1361–1372.
Nieland H. (1982) The food of Sardinella aurita (Val.) and
Sardinella eba (Val.) off of the coast of Senegal. Rapports et
Proces-verbaux des Reunions. Conseil international pour
l’exploration scientifique de la mer Mediterranee, 180, 369–373.
D’Elia, Patti, Sulli, Tranchida, Bonanno, Giacalone, Fontana, Genovese, Guisande & Mazzola Fish schools in relation to the seabed
Marine Ecology 30 (Suppl. 1) (2009) 151–160 ª 2009 Blackwell Verlag GmbH 159
Nolle A.W., Hoyer W.A., Mifsud J.F., Runyan W.R., Ward
M.B. (1963) Acoustical properties of water filled sands. Jour-
nal of the Acoustical Society of America, 35, 1394–1408.
Odate T., Furuya K. (1998) Well-developed subsurface chloro-
phyll maximum near Komahashi No. 2 Seamount in the
summer of 1991. Deep Sea Research. Part I, Oceanographic
Research Papers, 45, 1595–1607.
Ohshimo S. (1996) Acoustics estimation of biomass and school
character of anchovy Engraulis japonicus in the East China
Sea and the Yellow Sea. Fisheries Science, 62, 344–349.
Richardson M.D. (1997) In-situ, shallow water sediment geoa-
coustic properties. Proceedings International Conference on
Shallow-Water Acoustics, Beijing, China, 21–25 April. China
Ocean Press, Beijing: 163–170.
Scalabrin C., Masse J. (1993) Acoustic detection of the spatial
and temporal distribution of fish shoals in the Bay of Biscay.
Aquatic Living Resources, 6, 269–283.
Shepard F.P. (1954) Nomenclature based on sand-silt-clay
ratios. Journal of Sedimentary Petrology, 24, 151–158.
Soria M., Bahri T., Gerlotto F. (2003) Effect of external factors
(environment and survey vessel) on fish school charac-
teristics observed by echosounder and multibeam sonar
in the Mediterranean Sea. Aquatic Living Resources, 16,
145–157.
Swartzman G.L., Stuetzle W., Kulman K., Wen N. (1994)
Modeling the distribution of fish schools in the Bering Sea:
Morphological school identification. Natural Resource Mod-
eling, 8, 177–194.
Swartzman G.L., Brodeur R., Napp J., Walsh D., Hewitt R.,
Demer D., Hunt D., Logerwell E. (1999) Relating fish and
plankton acoustically sampled at different frequencies: Data
viewing, image analysis and spatial proximity. Canadian
Journal of Fisheries and Aquatic Sciences, 56, 188–198.
Zwolinski J., Morais A., Marques V., Stratoudakis Y.,
Fernandes P.G. (2007) Diel variation in the vertical
distribution and schooling behaviour of sardine (Sardina
pilchardus) off Portugal. ICES Journal of Marine Science,
64, 963–972.
Fish schools in relation to the seabed D’Elia, Patti, Sulli, Tranchida, Bonanno, Giacalone, Fontana, Genovese, Guisande & Mazzola
160 Marine Ecology 30 (Suppl. 1) (2009) 151–160 ª 2009 Blackwell Verlag GmbH
Copyright © 2022 FDOKUMEN