Best practice in seabed image analysis for determining taxa ...
65
Best practice in seabed image analysis for determining taxa, habitat, or substrata distributions New Zealand Aquatic Environment and Biodiversity Report No. 239 D.A. Bowden, A.A. Rowden, C.C. Chin, S. Hempel, B. Wood, A. Hart, M.R. Clark ISSN 1179-6480 (online) ISBN 978-1-99-001774-2 (online) April 2020
-
Upload
khangminh22 -
Category
Documents
-
view
0 -
download
0
Transcript of Best practice in seabed image analysis for determining taxa ...

Best practice in seabed image analysis for determining taxa, habitat, or substrata distributions New Zealand Aquatic Environment and Biodiversity Report No. 239 D.A. Bowden,
A.A. Rowden, C.C. Chin,
S. Hempel, B. Wood, A. Hart, M.R. Clark
ISSN 1179-6480 (online) ISBN 978-1-99-001774-2 (online) April 2020

Requests for further copies should be directed to: Publications Logistics Officer Ministry for Primary Industries PO Box 2526 WELLINGTON 6140 Email: [email protected] Telephone: 0800 00 83 33 Facsimile: 04-894 0300 This publication is also available on the Ministry for Primary Industries websites at: http://www.mpi.govt.nz/news-and-resources/publications http://fs.fish.govt.nz go to Document library/Research reports © Crown Copyright – Fisheries New Zealand

Table of Contents
EXECUTIVE SUMMARY 1
1. INTRODUCTION 2
2. IMAGE ACQUISITION 4
2.1 Properties of seabed imagery 4
2.2 Video and still imagery 8
2.3 Photogrammetry 9
2.4 Camera platforms 11
2.5 Spatial scale and survey design 13
3. DATA EXTRACTION 16
3.1 Overview of image annotation 16
3.2 Image components to analyse 17
3.3 Annotation label schemes 18
3.4 Reference image libraries 25
3.5 Annotation tools 28
3.6 Machine learning and automated annotation 33
4. DATA MANAGEMENT 39
5. SUMMARY & CONCLUSIONS 41
6. MANAGEMENT IMPLICATIONS 45
7. ACKNOWLEDGEMENTS 45
8. REFERENCES 46
APPENDIX 1: Marine Imaging Workshop 2019 53
APPENDIX 2: Feature comparison table for three web-based image annotation tools 61


Fisheries New Zealand Best practice in seabed image analysis • 1
EXECUTIVE SUMMARY Bowden, D.A.; Rowden, A.A.; Chin, C.; Hempel, S.; Wood, B.; Hart, A.; Clark, M.R. (2020). Best practice in seabed image analysis for determining taxa, habitat, or substrata distributions. New Zealand Aquatic Environment and Biodiversity Report No. 239. 61 p. Photographic surveying of the seabed is the only non-destructive sampling method available to us that generates quantitative data on fauna, habitats, and substrata at spatial scales relevant to exploration and management of New Zealand’s Exclusive Economic Zone. These characteristics become increasingly valuable as greater emphasis is placed on spatial management of benthic impacts and seabed resources in the New Zealand region. The past decade has seen increasing use of seabed imaging surveys and it is now an accepted method for characterising and mapping distributions of fauna and habitats, particularly in the deep sea beyond coastal waters. However, image acquisition methods in New Zealand remain limited and applications of image-derived data at wider spatial and temporal scales can be confounded by project-specific variations in analysis methods and data management. Here, the current state of seabed imaging survey methods in New Zealand is reviewed, focussing on their use in the deep sea and in relation to practices currently in use or in development elsewhere in the world, with the aim of identifying best-practice across the three stages of the imaging survey process: image acquisition, data extraction from imagery, and data management. Several areas are identified in which present practice hampers wider use of image-derived seabed data, and changes are proposed to improve the quality, quantity, consistency, and accessibility of these data. Key changes suggested include: expanding the range of underwater platforms available in New Zealand for high quality seabed image acquisition; developing capability to make accurate 3-dimensional measurements from imagery routinely; establishing a coherent, stable library of annotation labels and reference images for fauna and substrata, with direct linkage to globally-accepted classification hierarchies; adoption of web-based annotation tools that enable multi-analyst input, consistent data management, and robust auditing; collaboration with existing initiatives to develop machine learning tools and suitable image libraries on which to train them; and development of long-term data management structures for seabed image data. The present inability to exploit the full potential of seabed imagery results from lack of a strategic approach to investment in the necessary technological and data management frameworks. This issue is a consequence of the relatively recent development of broad-scale image surveying in the region, and the absence of accepted standards for image acquisition, types, and formats of data to be extracted, and structures in which these data are to be stored. Some of these issues are being addressed at present at the research institute-level, with adoption of more efficient annotation tools and development of dedicated databases for image-derived data. However, if seabed imaging is to be used to its full potential to inform environmental management at the scale of the Exclusive Economic Zone, there needs to be national strategic investment in the development of imaging systems and commitment by government agencies that use seabed image data to support integrated best practice in data management. These issues are strategic because long-term support for maintenance of databases is imperative and the costs of remotely-operated and autonomous imaging platforms that will be key to achieving more nuanced understanding of seabed resources and impacts might need to be viewed as national-level investments.

2 • Best practice in seabed image analysis Fisheries New Zealand
1. INTRODUCTION Seabed imagery has been collected in the deep sea (deeper than 200 m) by researchers in New Zealand since the 1950s, at least, initially using silver-halide film technology with still-image drop cameras (e.g., Bullivant 1959). With the advent of digital imaging and the systems to support its use as a standard tool in deep-sea research from 2000 (Clark 2002, Hill 2009), the volume of imagery and associated observational data has expanded massively. This expansion is set to continue at an increasing rate as deep-sea research benefits from on-going developments in imaging and deployment technologies (Clark et al. 2016b). The proliferation of imagery and associated data has huge potential value for informing broad-scale environmental management but, to date, applications at larger spatial and temporal scales have often been limited by variations in methods for image acquisition and analysis, and data management (Williams et al. 2010a, Bowden et al. 2019a, Clark et al. 2019). At present, seabed imagery in the New Zealand region, as elsewhere, is collected, analysed, and managed using a range of disparate tools and methods that are often dictated either by the availability of imaging systems, the historical legacy of institutional image acquisition and analysis methods, and by the specific requirements of individual projects. These projects span a broad range of purposes including research, stock assessment, risk assessment for environmental management, and commercial exploration for seabed resources. In the deep sea, the range of imaging platforms available is reduced, simply because there are fewer systems capable of working in these depths. Even across studies in which the same system is used to collect imagery, however, project-specific changes in platform set-up, and differences in the type and detail of information extracted from imagery, can make the resulting data unsuitable for direct comparisons among surveys. A considerable volume of deep-sea seabed imagery has been collected in the New Zealand region, making significant contributions to our understanding of the diversity and distribution of benthic habitats and fauna (e.g., Baco et al. 2010, De Leo et al. 2010, Bowden 2011, Compton et al. 2013, Henschke et al. 2013, Bowden et al. 2016, Clark et al. 2019). However, the full potential of this resource is not yet being realised. Reasons for this include: issues that arise when combining data from surveys that use different imaging methods or analysis protocols, often to address different research aims; variation in image resolution with time as new technologies are introduced; and the time and expense required to extract consistently accurate quantitative data from imagery. These issues are not new, and are not restricted to New Zealand, but with new technologies there is great potential now to develop guidelines for image capture, analysis, and data storage that will reduce analysis times, enhance data compatibility between surveys, and thus enable greater use to be made of image-derived information in broad-scale assessments of benthic habitats and fauna in the New Zealand region. In 2007, the Census of Marine Life on Seamounts (CenSeam) undertook a review of seabed photographic survey and analysis methods in use for seamount research in the deep sea, with the aim of identifying best-practice procedures (D. Bowden, unpublished document). A modified version of this review, dealing specifically with towed camera procedures, was subsequently published by Bowden & Jones (2016). The 2007 review was structured around the following headings: properties and uses of remote visual sampling; image acquisition; survey design; management of images and data; data extraction and analysis; and methods reporting. Over a decade on from this review, it is timely to reassess the issues associated with image-based sampling in the deep sea and how methods and technologies have developed with the rapid increase in the volume of seabed imagery being collected world-wide, and to consider these findings in the context of the subsequent years of seabed image acquisition in the New Zealand region and the pressing need to manage broad-scale impacts on benthic habitats. This report builds on the CenSeam and Bowden & Jones (2016) reviews, focusing on areas in which subsequent advances in processes, technologies, software, and classification schemes for fauna and substrata might afford opportunities to improve the quality, consistency, and volume of data available to inform seabed classification in the New Zealand region. The emphasis is on seabed surveys in the

Fisheries New Zealand Best practice in seabed image analysis • 3
deep sea (beyond coastal waters), primarily using the Deep-Towed Imaging System (DTIS, Hill 2009, Bowden & Jones 2016) developed by the National Institute of Water and Atmospheric Research (NIWA), which remains the only camera platform in routine use for broad-scale seabed surveys in the region. A focus on the Exclusive Economic Zone (EEZ) beyond the coastal zone is appropriate here because it is in middle and deepwater depths that most image-based research directly involved with fisheries management has taken place. This work also focuses on aspects of seabed image-based research in which there have been significant developments that afford potential for material change in the way imagery is collected and analysed. For areas in which there has been little or no change (e.g., the fundamental properties of photographic images and conventional camera platforms), text directly from the CenSeam review is included. The Overall Research Objective of this project (BEN2018-03) is: To optimise image collection and analysis of underwater video survey footage to determine how to maximise taxa, habitat, or substrate classification. The single Specific Research Objective is: To complete a desktop analysis to determine how high-quality data on taxonomic, habitat, or substrate occurrence can best be collected or extracted from deep-sea video imagery. Fisheries New Zealand has also clarified that both video and still photography are to be included, despite the use of “video” in the initial formulation of these objectives. To address these objectives, the report is structured into three sections that correspond to the work-flow sequence necessary to make data available for interpretation: (i) acquisition of seabed imagery and its associated metadata; (ii) extraction of data from seabed imagery; and (iii) management of data extracted from seabed imagery. The quality of data available to inform environmental management is dependent on decisions made at each stage of the process, from choices that affect the optical acuity of the camera system itself, those that affect the levels of taxonomic and substrate detail extracted from imagery, to those that contribute to making the resulting data accessible for use and interpretation. The main focus of the study is on the first two stages above, with recommendations developed for the third, data management, only where they have direct bearing on the high-level goal of making reliable, high quality, image-derived data on seabed distributions available to inform management decision-making. The first section, image acquisition, covers the fundamental characteristics of seabed imagery, identifying the core requirements for characterising benthic fauna and habitats, and suggesting aspects in which guidelines for best-practice in terms of image quality, repeatability within and between surveys, and affordability might be practicable. As part of this exercise, existing studies and re-analyses of existing survey data are used to demonstrate trade-offs in effort at different stages of the process. This section also includes a review deep-sea imaging platforms, in relation to how their characteristics influence the volume, quality, and spatial extent of imagery available for analysis. The second section, data extraction, covers aspects of data extraction and metadata acquisition from imagery, including decisions about the level of taxonomic and habitat structure detail to be recorded, and the kinds of data that can be extracted at different stages of the path from acquisition to final data; from real-time observations at sea, to specialist analyses of taxa and substrata in the laboratory ashore. This section constitutes the major part of the review because: (a) data extraction from imagery is, arguably, the stage during which there is greatest divergence among studies, whether through differences in target habitats and fauna, differences in the classification systems used, or differences among individual analysts; and (b) there has been considerable research effort world-wide into improved methods for data extraction from seabed imagery, including automated and semi-automated approaches, that have potential to reduce analysis costs and improve the reliability and consistency of data. Many of the key points discussed in the third section, data management, are covered in the preceding sections because efficient management of data demands appropriate working methods at all stages of image acquisition and analysis. The emphasis in this section, therefore, is on review of the key aspects

4 • Best practice in seabed image analysis Fisheries New Zealand
of procedures for managing data streams derived from seabed imagery as practised in New Zealand, including database structure and tools, and accessibility via web applications. The final section summarises key areas in which improvements in data quality and efficiencies of processing might best be made, with emphasis on improving work-flows and data integrity with existing systems and historical data, and on the potential of emerging technologies and methods to enhance the volume and detail of data that can be extracted from seabed imagery, as well as the speed with which these data can be made available. Results and conclusions of the review are then considered in the context of data requirements for practical management of the environmental impacts of seabed trawling and other human activities in New Zealand’s EEZ and Extended Continental Shelf (ECS).
2. IMAGE ACQUISITION 2.1 Properties of seabed imagery In most applications, seabed images can only be used to generate reliable data on the mega- and larger macro-epibiota (typically approximately 3–5 cm with many current deep-sea systems, but millimetre-scale is increasingly achievable), and only for those that are emergent and are visible in the ‘upper-storey’ of the assemblage. Thus, much of the benthic macrofaunal diversity associated with, for instance, stands of live coral may not be detected in camera images. Similarly, abiotic substrata in photographic images can only be discriminated between on the basis of their surface appearance: bedrock overlain with a thin layer of fine sediments may be indistinguishable from fine sediment many metres deep. Photographic surveys in themselves, therefore, can yield only a partial estimate of biological or habitat diversity. These limitations are inherent properties of all photographic images. With remote visual imaging of the seabed, however, there can also be considerable variability in the quality and spatial scale of images, both within and between studies, which arises from differences in technical specification, modes of use, and operational conditions. Such variability is difficult to control and affects the precision and accuracy of data derived from the imagery (e.g., Mortensen & Buhl-Mortensen 2005, Clark et al. 2019). These limitations notwithstanding, photographic sampling has long been recognised as the most effective method available for quantitative studies of mega-epifauna in the deep sea (Rice et al. 1994) and sensitive habitats at all depths. Despite advances in the interpretation of acoustic data, visual sampling is also the only remote method that can reliably and accurately indicate transitions between seabed areas with different biological assemblages (e.g., Hewitt et al. 2004, Fossa et al. 2005). In spatial scale, seabed photographic surveys are intermediate between broad-scale acoustic surveys that operate typically at scales of 10s–100s kilometres with a resolution of typically 625 m2 (25-m grid) in the deep sea, and physical point-sampling gears such as corers that sample less than 1 m2. A typical seabed photographic transect, whether collected by towed camera, remotely operated vehicle (ROV), or autonomous underwater vehicle (AUV), covers 100s of metres to kilometres, but has within-transect resolution at centimetre-scale. A fundamental advantage of visual sampling methods by contrast with physical gears is that they are non-destructive. Thus, photographic transects, particularly video, enable qualitative and quantitative assessment of the seabed and its associated biota with all structural and distributional relationships intact, without altering the system under study. Furthermore, the power of human observation is such that a large amount of useful information is processed, if not always recorded, simply by watching the image in real-time (Grassle et al. 1975, Hessler et al. 1985). Thus, without performing any formal analysis, researchers are generally able to describe the main features of the transect and note where any significant regions of interest occurred simply through having viewed the video footage. This intuitive ability to interpret imagery is countered by the relatively long time required to generate objective quantitative data from the imagery. Although analysis times for video transects are
Fisheries New Zealand Best practice in seabed image analysis • 5
comparable with those for macro-infauna samples from sediment cores (NIWA currently budgets on approximately 10–15 hours of analysis time per seabed video transect and 15–20 hours per sediment core) and yield similar types of data (counts and identities of fauna per unit area of seabed), the immediacy of imagery leads to a perception that processing is slow. However, in contrast to physical specimens, imagery is now a digital resource, which means that there is potential for application of modern image processing and data-mining algorithms to streamline analyses. In common with digital media in other fields, the volume of seabed imagery collected for scientific research is also increasing rapidly as sophisticated imaging technology and associated deployment platforms become more accessible and easier to use. This increase is highly relevant to the present review because as the volume of imagery increases there comes a point where its analysis by conventional methods becomes a major bottleneck (Durden et al. 2016, Gomes-Pereira et al. 2016, Schoening et al. 2016). To address this bottleneck, new tools for automated analysis of image characteristics are being developed, driven by the global explosion of digital imagery and the need to manage, interpret, and extract marketable data from image content on internet media platforms. Photographic images generally contain more information than can be extracted within the constraints of the project for which they were originally captured. Thus, usually only a limited sub-set of the potential data is extracted at first-pass but the images remain as an archive of information that can be mined for more detailed, or entirely different, data in the future. This archival, historical value of images has long been appreciated in terrestrial applications from aerial surveillance to social documentary, but to date has been less well appreciated in marine benthic studies. It is also relevant in this context that although silver halide film has been almost entirely superseded by digital imaging, a substantial archive of gelatine-silver images of the deep-sea seabed exists in institutions around the world. These images are a resource that remains largely untapped in terms of extraction of ecological data (e.g., Chiba et al. 2018), particularly where the original surveys were for geological research. For example, NIWA, GNS Science, and their respective predecessor organisations collected many tens of hundreds of seabed images using conventional film cameras before the digital era but there is no organised catalogue of these and their whereabouts are mostly obscure. However, the common properties of visual images, and the simplicity with which prints and negatives can now be digitised, are such that there is little reason why data from such images should not be incorporated in analyses with data from recent digital images to expand knowledge of seabed environments. The principal parameters of an imaging system include: optical resolution (dependent on all components of the system but primarily lens, sensor, and saved file format); lens focal length; depth of field (lens aperture); lighting (evenness and intensity of illumination); and orientation of the optical axis (orthogonal to the seabed, parallel to the seabed, or at an angle between the two). Differences in any of these parameters, whether between separate systems or between different configurations of the same system, can confound analyses.
Optical resolution Image resolution is a property of the whole camera system and is affected by the focal length, aperture, and optical quality of the lens, and by external factors including the altitude of the camera vehicle above the substratum, the evenness and intensity of illumination, and by the clarity of the water. However, if external factors are equal, and given that most camera lenses in use today are of relatively high optical quality, the primary factors determining the resolution of the imaging system are the sensor and the way the overall system has been set up. Sensor resolution is usually measured in terms of numbers of pixels (e.g., a 4000 x 6000 pixel array would be a 24-megapixel (MP) sensor) and the resolution of readily-available sensors has increased dramatically since the first use of digital cameras for underwater research in the late 1990s (Shortis et al. 2009); from 2.7 MP in 1999 (Nikon D1 - the first professional digital single-lens reflex camera) to 10 MP by 2005, 24 MP by 2012, and more than 50 MP at the time of publication of this report. Increases in image resolution have fundamental effects on quantitative data extracted from seabed imagery because higher resolution allows smaller objects and finer detail to be resolved. This results in more taxa being identified and more individuals of smaller taxa being detected, which may lead to greater insights into the ecology of seabed habitats but also creates problems for

6 • Best practice in seabed image analysis Fisheries New Zealand
merging or comparison of data between surveys. For any quantitative comparison between sets of image-derived data, therefore, it is necessary to have a reliable estimate of the minimum size of object that can be detected in each study. This is a measure that is rarely reported but is particularly important for comparisons of biological diversity between studies because it affects both the size spectrum of organisms that can be detected and the taxonomic precision with which they can be identified (Bowden 2005, Clark et al. 2019). Issues associated with changes in image resolution are particularly problematic with time-series studies. Clark et al. (2019) surveyed seamounts in the Graveyard complex on Chatham Rise in 2001, using a towed camera system to record benthic substrata and fauna, then resurveyed the same sites during subsequent surveys in 2006, 2009, and 2015, again using towed camera transects, to assess changes in the status of benthic communities in relation to trawling history. They found that trends of increasing image resolution and consistency of deployment through the time-series of surveys resulted in parallel increases in the numbers of individual organisms and numbers of taxa detected. These increases were caused in part by increased image-system resolution with newer sensors and in part by other technological improvements that enabled more precise and consistent positioning of the camera vehicle above the seabed and thus smaller average imaged area of seabed (Figure 1), all of which contributed to trends of increasing image quality with time. The Clark et al. (2019) example also illustrates how the underwater environment reduces the range of options in other aspects of the imaging system. Lens focal length determines the spatial field of view of the imaging system and the aperture determines the depth-of-field (the range of distances within which the image is perceived to be in focus), smaller apertures yielding greater depth-of-field but requiring greater lighting intensity. Ideally, it would be possible to operate seabed imaging systems higher above the seabed because this would increase the imaged area per unit deployment time and reduce the potential for damage through contact with the seabed. However, because visible light is absorbed strongly by seawater and system power available for lighting is generally limited, greater altitudes and longer focal lengths are not practicable in most seabed applications. At more than 5–10 m above the seabed, it is difficult to provide enough light for adequate exposures, resulting in most imaging systems in current seabed survey use working at distances of 1–5 m above the seabed (Clark et al. 2016b).
Figure 1: Decreasing trends in the numbers of individual benthic organisms (N) and taxa (S) detected in
seabed imagery as the framed area of the image increases. Similar trends would be apparent if the x-axis showed decreasing image resolution (e.g., as pixel density) instead of imaged seabed area. Dotted lines indicate imaged seabed areas of 2 m2 and 8 m2; the range of image areas used by Clark et al. (2019) in their analyses. Adapted from Clark et al. (2019) with permission.

Fisheries New Zealand Best practice in seabed image analysis • 7
Lighting Matching the field of illumination to the field of view of the imaging system is critical to maximising the amount of information that can be extracted from imagery. Decisions about lens focal length and aperture should, therefore, be made in parallel with consideration of design parameters for the light field. Despite this ideal, much available seabed imagery is characterised by strong gradients of lighting, with pronounced fall-off from the foreground to the distance and from the centre of the frame to the edges. In part, this is an inevitable consequence of commonly-used forward-looking camera angles but often, particularly with edge fall-off, it results from inadequate lighting. The common occurrence of lighting gradients in imagery has led to development of retrospective digital image enhancement routines that recover detail from poorly-exposed areas (e.g., Bryson et al. 2016 and Appendix 1, Marques et al., MIW2019). Such tools are widely available in photo-editing software and are made possible by the wider exposure latitude of digital sensors by comparison with silver-halide emulsions of the film era. However, better image quality is obtained, and less processing time required, if the light field can be matched to the image field of view during initial design of the system (Bowden & Jones 2016).
Camera orientation Camera orientation is a fundamental variable in seabed imaging platform design; the important distinction being that the optical axis can be either vertical or oblique. Each orientation has its advantages and disadvantages, but the methods required for extracting quantitative data from images produced by each may vary considerably, leading to problems with cross-study comparison if methods are not clearly stated. Oblique orientation has several advantages, particularly for video and in studies of highly motile or sparsely-distributed taxa:
• The image frame encompasses a greater area of the seabed than with vertical orientation, which increases the probability of detecting patchy habitats and larger or rarer taxa.
• The forward-looking view is more natural from a human perspective and aids taxon identification for upright or laterally compressed body forms.
• Longer transit times of regions of interest through the image frame can aid identification. • The forward-looking field of view reduces the risk of collision with seabed obstacles.
The main disadvantages of oblique images are that they (1) introduce light-field gradients, which causes matching gradients of detection probability within the image frame (it is harder to see things when there is less light), and (2) are more problematic to extract quantitative data from because lens-to-subject distance varies throughout the image frame and thus measurement scales are non-linear. Vertical orientation produces images that cover a smaller seabed area, can be less easy to make identifications from (particularly for fish), and increases the risk of collision if used as the only means of monitoring the status of the camera vehicle during deployments. However, in a well-designed system, images from vertically orientated cameras have the advantages of:
• negligible gradients of lens-to-subject distance. • negligible gradients of illumination intensity across the frame.
These properties make vertically orientated images optimal for quantitative analyses of benthic substrata and sessile or sedentary biota. Combining oblique and vertical cameras on a single platform makes full use of both the descriptive potential of forward-looking video and the potential for accurate quantitative analyses from vertical images that are effectively higher-resolution quadrats within the overall swept area of the transect (e.g., Stone 2006, Bowden & Jones 2016). Technological advances in telemetry, imaging systems, and data storage now facilitate deployment of multiple cameras on a single platform, and the development of ultra-low light sensors and 360° cameras present opportunities for new perspectives. Given this,

8 • Best practice in seabed image analysis Fisheries New Zealand
combining oblique and vertical cameras as a matter of routine could be viewed as a minimum requirement for seabed survey work.
Key points • The additional fine-scale information afforded by use of the highest-resolution imaging systems
available provides valuable insights into the diversity and function of seabed habitats. Despite the problems associated with comparing data collected with different image resolutions, this added information outweighs any benefit that might come from adhering to older lower-resolution systems purely to maintain comparability.
• Matching of light field to camera field-of-view during the design and operation of seabed camera systems is fundamental to overall image quality and thus to the quality of data that can be extracted. It is more efficient and cost-effective to address lighting during the design phase than retrospectively during post-processing.
• Vertical and oblique camera angles provide different perspectives on seabed environments and fauna, and these perspectives have applications in different areas of ecological research. Thus, collecting imagery using both orientations simultaneously has obvious advantages.
• With reductions in the cost of both imaging systems and digital storage, there are strong arguments for deploying multiple cameras on seabed imaging platforms whenever practicable.
2.2 Video and still imagery The continuous coverage of the seabed afforded by video has major advantages with respect to detection of infrequent taxa, behaviours, and delineation of habitat transitions. A commonly used procedure to derive quantitative data from video transects, however, is to take a series of ‘frame grabs’ from the continuous footage. With standard (SD) or high definition (HD1080) definition video this approach results in relatively low-resolution images but as the new ultra-high definition standards come in, distinctions between video and stills become less clear. The principal disadvantage of video for quantitative work is that it is more difficult to make detailed counts and identifications from a moving image. For studies of mobile taxa, the continuous lighting required for video imagery can also cause behavioural changes that might be avoided with the intermittent strobe lighting of still imagery (Ryer et al. 2009). The availability of inexpensive, high-resolution stills cameras capable of taking images in rapid succession (with frequency limited primarily by strobe recycling times) allows a more accurate way of working. If still images are taken at regular intervals simultaneously with video, considerable advantages are gained because each still image is effectively a high-resolution fixed quadrat embedded within the continuous video strip transect. Thus, the still images can be used to confirm identifications of targets recorded in the lower resolution video record. A more immediate advantage is that the set of still images generated during a camera transect can be viewed as a page of thumbnail files (equivalent to a traditional contact sheet) giving an immediate overview of the transect and showing very clearly where habitat transitions or other points of interest occur. The development of ultra-high definition (UHD, as 4K at 8.29 MP or 8K at 33.18 MP) video opens the possibility of taking frame grabs from video that are comparable in resolution to images from dedicated stills cameras (Lutz et al. 2002). Cameras with 4K video capability are now widely available and are fitted to many deep-sea camera platforms (Bowden & Jones 2016, Clark et al. 2016b). High frame rate still imagery is also an increasingly useful and practical alternative, blurring the boundary between conventional video and still imagery. Using strobe units operating at 1 Hz or higher, very high resolution still images can be captured from relatively fast-moving (2–3 ms-1) AUVs and towed camera vehicles in such a way that individual image frames overlap, yielding continuous coverage of the seabed without motion-blur that would result with video footage at these vehicle speeds (Rosenkranz et al. 2008). In combination with software developments that enable seamless 3-D mosaicing of imagery (joining multiple orthogonal digital image frames into a single, landscape-scale, image file), such solutions

Fisheries New Zealand Best practice in seabed image analysis • 9
enable remarkably detailed reconstructions of seabed habitats (Escartin et al. 2008, Marsh et al. 2013, Morris et al. 2014, Wood et al. 2016). Key points
• The greater seabed area covered in continuous video imagery by comparison with intermittent still imagery makes this method the primary choice for analyses of biodiversity and faunal population densities in the deep sea and other environments where population densities are low.
• Image resolution of still imagery remains higher than that of video, enabling detection, identification, and quantification of smaller taxa.
• Boundaries between video and still imagery are becoming blurred, with continuous seabed coverage achievable through both ultra-high resolution video standards and high frame rate, high resolution, still imagery.
2.3 Photogrammetry Accurate scaling of the image field is essential if quantitative data are to be extracted, whether as counts of individual organisms per unit seabed area, areal coverage, or body measurements of individual organisms. Image scaling can be achieved in a number of ways including parallel laser arrays (Hill 2009), stereo camera systems (Shortis et al. 2008, Shortis et al. 2009), calibration with an object of known dimensions within the image frame (Auster et al. 1995), use of a trigger weight to ensure fixed camera-to-subject distance (Teixido et al. 2002), calculation from acoustic altimeter data (Hessler et al. 1985), and estimation from known size ranges of fauna in the image (Pratt 1967). The most commonly used methods in use at present are parallel lasers and stereo camera systems. In deep-sea systems, however, lasers are more commonly used, primarily because of the expense of duplicating pressure housings and associated equipment for stereo imagery. In New Zealand at present, scaling of seabed imagery is achieved mostly through paired parallel lasers. Stereo systems are in use in some fisheries research applications, including static baited underwater video systems (BUV, e.g., Zintzen et al. 2012) and NIWA’s trawl-mounted Acoustic Optical System (AOS), but not yet for seabed work. Although adequate for generating population density estimates for benthic invertebrate fauna and habitat coverage, parallel lasers are not accurate for calculation of individual size, especially for fish and other highly mobile fauna in the water column, because they provide accurate scale in only a very limited part of the image frame. As part of the present project, NIWA analysed video and still imagery from the Ross Sea collected with the DTIS system, with the aim of assessing the potential for generating body-size data on macrourid fishes (rattails). Rattails are the main prey species of the commercially exploited Antarctic toothfish (Dissostichus mawsoni), and the main bycatch taxon in the commercial fishery for toothfish, and thus are of central interest to ecosystem-based management of the region. In total, 1058 individual rattails were recorded from 34 video transects representing approximately 100 000 m2 of seabed. Of this total, only 48 individuals (4.5%) were aligned in relation to the camera system in a way that enabled accurate measurement of body length from the lasers. A parallel analysis of the still images from the same DTIS transects detected only 315 individual rattails, but because of the orthogonal orientation of the stills camera all of these could be measured with acceptable accuracy. This exercise highlights both the potential extra detail that could be derived from seabed imagery with more effective, whole-frame, 3-dimensional scaling methods and the limitations of current practice, in which lasers are used as a pragmatic means of achieving basic image scaling but are adequate only for orthogonal imagery. Food-web modelling (e.g., Pinkerton et al. 2010) is another research field that could be informed by seabed photographic survey data if not for the current limitations associated with generating accurate body-size information for seabed fauna from imagery. Food-web models estimate flows of energy among trophic levels of ecosystems and the base data required are quantitative biomass estimates for populations of organisms. Models developed for New Zealand fisheries areas, including Chatham Rise and the Ross Sea, currently depend on bycatch data from trawl and longline datasets and sparse

10 • Best practice in seabed image analysis Fisheries New Zealand
scientific specimen records to inform their benthic invertebrate compartments. These data can be used because the catch from these gears is weighed routinely, yielding empirical body mass-to-size relationships for commonly caught taxa. Extensive and detailed benthic datasets derived from high-resolution seabed imaging surveys exist for both Chatham Rise (Bowden et al. 2019a) and the Ross Sea (Bowden et al. 2011, Basher et al. 2014, Clark & Bowden 2015), but attempts to derive reliable biomass estimates from these data are reliant on applying coarse generic size-mass values from published sources (Bowden 2011) or values derived from a limited number of collected specimens (Rowden et al. 2010). More realistic and accurate biomass estimates for benthic invertebrate communities could be developed if imagery was collected in a way that enabled whole-image photogrammetry.
Lasers By projecting two or more parallel lasers onto the seabed within the framed image area, the known distance between the lasers can be used to scale the image. Clearly, a single pair of lasers can only be used to scale the entire image where the camera orientation is orthogonal to the seabed, the image field is effectively planar, and lens distortion is negligible. For obliquely orientated cameras, a square array of four parallel lasers enables approximate scaling of the entire image frame (Pilgrim et al. 2001). On sloping or topographically complex terrain it is unlikely that any combination of lasers will adequately scale the entire image plane, but with orthogonal imagery on level substrata a single pair can be adequate, depending on the level of scaling accuracy required.
Stereo imaging Stereo camera systems, when correctly aligned, synchronised, and calibrated, enable accurate measurements from any region within the image frame, whether in vertical or orthogonal orientation (Shortis et al. 2009). The principle of stereo photogrammetry emulates human binocular vision by recording imagery simultaneously on two cameras aligned in parallel. The technique has been in use since the earliest days of photography, with strong development for analysis of aerial reconnaissance imagery during the two world wars and, with the advent of digital imaging, software has been developed to automate image scaling and object measurement (e.g., IMAGINE Photogrammetry, hexagongeospatial.com and EventMeasure (Stereo), seagis.com.au). Stereo imaging is commonly used in shallow-water applications, notably on baited underwater video systems as developed and popularised by Euan Harvey and colleagues in Australia (Harvey & Shortis 1995, Shortis et al. 2008), and increasingly in deep-water studies (Zintzen et al. 2017), with the Commonwealth Scientific and Industrial Research Organisation’s (CSIRO) deep-sea towed cameras routinely configured in stereo-mode (Shortis et al. 2008, Rooper et al. 2010, Williams et al. 2010b). The equipment costs are greater for stereo and, when combined with the additional time required for calibration, a doubling of server space required for file storage, and high licence fees for existing software, it is an appreciably more expensive approach to scaling than is the use of lasers. However, the capability for accurate three-dimensional measurement from all parts of the image frame with stereo imaging greatly expands the potential of seabed imagery for use in quantitative research. With the relatively low cost and increasing miniaturisation of high-resolution digital cameras, and recent availability of open-source calibration and analysis solutions (StereoMorph, Olsen & Westneat 2015), there are strong arguments for adopting stereo imaging set-ups wherever accurate measurements are required or might be useful in the future.
Scaling from single-camera video or overlapping still imagery Developments in image mosaicing have been rapid (Pizarro & Singh 2003, Marsh et al. 2013, Morris et al. 2014), driven in part by the rise of virtual reality simulations. If a reference scale is included in the imagery, then the entire mosaic can potentially become a dimensionally accurate representation of the seabed, from which measurements can be taken. Spatially referenced orthogonal mosaics can also be ‘draped’ across 3-dimensional bathymetric maps of the seabed generated by multibeam acoustic surveys, yielding intuitive visualisations of habitat changes in relation to seabed topography (Fosså et al. 2005). Although marine seabed mosaicing is usually based on matching of common features among

Fisheries New Zealand Best practice in seabed image analysis • 11
overlapping images in 2-dimensions, allowing only planar measurements, information obtained from multiple views of a given feature at different viewing angles (e.g., sequential video frames of a coral thicket from a camera passing over it) can, in theory at least, be used to calculate its geometry in three dimensions, using methods developed for aerial surveillance photogrammetry (Abdo et al. 2006, Drap 2012).
Plenoptic cameras Plenoptic cameras allow 3-dimensional imagery to be generated from a single-lens camera by incorporating an array of micro-lenses between the objective lens and the sensor. Also known as light-field cameras, the principle is that by capturing information about the direction of travel of light rays in the subject, as well as light intensity and hue, a 3-dimensional representation of the subject field can be generated. Conventional cameras record only light intensity and hue. Use of plenoptic cameras to study oceanic particle fluxes is being explored by the Monterey Bay Aquarium Research Institute (MBARI) and at least one plenoptic camera system is commercially available (Appendix 1, Roberts et al. MIW2019) but the method appears to be in early stages of development, to yield lower resolution imagery than equivalent conventional systems, and to be better suited to small-scale, near-field imaging applications than to the spatial scales at which benthic fauna and habitat surveys are conducted.
Key points • Valuable additional measurement data can be extracted from seabed video surveys if imaging
systems incorporate either stereo camera set-ups or spatial referencing and software processing necessary to make accurate measurements from imagery in three dimensions.
• In New Zealand, primary areas of research in which measurement data from stereo imagery would be valuable include quantification of epibenthic biomass to inform the benthic compartments of food-web models (e.g., Pinkerton et al. 2010, e.g., Murphy et al. 2012) and size-class characterisation of benthic and demersal fish populations in marine protected areas (e.g., Mormede et al. 2014).
2.4 Camera platforms This section is a concise outline of the principal gears from which visual samples are acquired, with emphasis on the image attributes associated with each and the implications these have for subsequent analyses. Detailed reviews of camera platform types and their respective capabilities have been conducted during the Mapping European Seabed Habitats programme (MESH, Mitchell & Coggan 2007), the Census of Marine Life on Seamounts (CenSeam), and by Clark et al. (2016b). The basic qualities of each platform type have changed little since these reviews and, therefore, this section summarises material available from these sources.
Static cameras on benthic landers, moorings, and observatories These stand on the seabed, or attach to a mooring, and are deployed at a single site for periods ranging from hours to months or years. They are used primarily for time-lapse observations and measurement of processes at small scale, or to study motile fauna attracted to bait (e.g., Collins et al. 1999, Zintzen et al. 2017). Because they image only a single patch of substratum, they are of limited use for comparisons of faunal distributions in relation to physical habitat gradients.
Drop and towed platforms These are unpiloted platforms deployed on wire cables from a surface vessel. The platform moves across the seabed either by being towed at slow speed or by passive drifting of the ship. Thus, these platforms have very low manoeuvrability, tend to follow simple line transect trajectories, and are strongly affected by wave motion, which results in constant variation in the altitude of the platform above the substratum. Camera orientation and lens focal length are generally fixed. For deep-sea operation, towed cameras generally have some facility to enable real-time image transmission to the

12 • Best practice in seabed image analysis Fisheries New Zealand
surface, enabling control of camera vehicle altitude and real-time logging of observations. If deployed on a cable with sufficient data bandwidth, the real-time feed can be at full camera resolution but on others only low-resolution, low frame rate imagery is possible. A key technology enabling high bandwidth data transmission is fibre-optic cable. This is now standard on most deep-sea research vessels world-wide and enables multiple real-time video feeds in full high-definition format, full control interfaces for instrumentation deployed to depth, and thus the capability to deploy more sophisticated imaging platforms, including ROVs (see below) (Clark et al. 2016b). In New Zealand, inshore and coastal camera systems are now operating via fibre-optic cable, but the only deep-sea camera system in routine use, NIWA’s DTIS, is deployed from RV Tangaroa which still operates (as of 2019) on a low bandwidth single-conductor cable, making the system dependent on a modem-based telemetry system to feed low-resolution low frame rate video imagery to the surface in real time (Hill 2009).
Remotely operated vehicles (ROVs) and human-operated vehicles (HOVs or submersibles) These are self-propelled piloted platforms, the former operated from the surface, the latter with a pilot and observers inside the vehicle. Although ROVs are connected to the surface via an umbilical and submersibles are independent, the modes of operation are essentially the same with respect to image sampling. The chief characteristics distinguishing these from towed platforms are their high manoeuvrability, their ability to be manoeuvred to investigate, and remain stationary at, areas of interest discovered during the dive, and the facility to continuously vary camera orientations and focal lengths. Both types of platform generally carry multiple cameras that may be of differing resolutions, set at different angles, and be panned and zoomed during deployments. To be practical for deep-sea work, ROVs need to be powerful enough to move against, and maintain station in, currents and large enough to enable collection of specimens and samples. They are technically more complex than towed cameras, depend on fibre-optic communications, and require more deck space and more specialised shipboard support teams. Because of these factors, ROVs are much more expensive than towed systems and typically have more restricted operating conditions, with fewer, longer deployments. These restrictions result in reductions in the spatial coverage of surveys by comparison with the simpler towed camera platforms. The capacity for directed motion also leads to a different mode of operation at the seabed by comparison with other platform types, in that deployments can combine linear transects with local small-scale search phases. When combined with the capacity for operator-controlled variation in camera angle (pan and tilt) and focal length (zoom), these characteristics can complicate subsequent quantitative analyses of the imagery.
Autonomous underwater vehicles (AUVs) These are self-propelled and operate without any direct link to the surface but are not piloted. Rather, they can be programmed to follow a specific survey pattern or to modify their survey in response to water-column or seabed characteristics (e.g., topography, salinity, methane concentrations). Because camera orientation and lens focal length are usually fixed, often with orthogonal camera orientation, and both altitude and velocity are usually constant, imagery captured using AUVs is more comparable with that from towed platforms than from piloted vehicles but with much more consistent altitude because the vehicle is independent from the surface vessel and thus not affected by wave-induced motion. When combined with camera-strobe setups for high frame rate overlapping still imagery, larger AUVs can record continuous high-resolution imagery at relative high speeds and thus have great potential as tools for running standardised seabed surveys. Furthermore, because AUVs are not tethered to the surface vessel, multiple units can be deployed simultaneously, increasing the area of seabed surveyed in a given time. Drawbacks to AUVs include their high cost, technical complexity, unsuitability for operation over steep or rugged topography (because of their limited obstacle-avoidance capability), and limited options for retrieval if problems occur during deployments. NIWA has deployed both an AUV and a ROV from RV Tangaroa (commercial work in Australian waters). The AUV became trapped at the seabed and the

Fisheries New Zealand Best practice in seabed image analysis • 13
ROV had to be deployed to retrieve it, suggesting that it would be unwise to plan on routine use of AUVs without first ensuring that a ROV capable of rescuing it was available.
Key points • Fibre-optic cable technology is fundamental to contemporary seabed photographic imaging
because it provides the data bandwidth needed to transmit high-resolution imagery to the surface. In New Zealand, fibre-optic is used routinely for shallow water (less than 200 m) ROV and towed camera work, but across most of the EEZ the technology is currently limited by low bandwidth, single-conductor cables on both of NIWA’s deep-sea research vessels: RV Tangaroa and RV Kaharoa. Investment in fibre-optic technology will enable simultaneous use of multiple cameras to record different aspects of seabed environments (e.g., low-light, forward-looking cameras for fish detection and quantification) and yield an immediate jump in the image resolution and frame rate of real-time video (to HD and potentially UHD). The availability of full-resolution imagery would allow more detailed and accurate summaries of the occurrence of seabed fauna and habitats to be communicated to environmental managers and other stakeholders with minimal time delays.
• ROVs enable detailed examination of the seabed over the same spatial scales as individual towed camera transects, with additional capabilities for directed movement, including remaining stationary, and precise, minimally invasive collection of specimens, they are technically more complex and operations tend to be more restricted by sea state, resulting in fewer deployments in a given time and thus less seabed area surveyed.
• AUVs offer great potential for efficient seabed image surveying at scales from approximately 10 m2 to 1 km2 on relatively level topographies. They are more complex, more expensive, and more prone to loss through collision and entanglement than towed camera vehicles. However, as their costs reduce with technological innovation and availability, and assuming adequate provision for emergency retrieval from the seabed can be made, AUVs could become ideal platforms for much of the broad-scale seabed diversity survey work currently undertaken in New Zealand by MPI.
• Because of their relative simplicity and operational cost, towed camera vehicles are likely to remain a practical and cost-effective tool for gathering information about the distributions of benthic fauna and habitats at the scale of New Zealand’s EEZ for the near future.
2.5 Spatial scale and survey design This review is conducted in the context of bottom-contacting trawl fisheries at the scale of the New Zealand EEZ. These fisheries operate at scales from square kilometres (individual trawl events) to hundreds of square kilometres (cumulative trawl footprint) and the ecological impacts of bottom trawling have been demonstrated at a variety of spatial scales, up to and including ecosystem level impacts (Cryer et al. 2002, Thrush & Dayton 2002, Gray et al. 2006, Puig et al. 2012, Clark et al. 2016a, Hiddink et al. 2017). Direct physical impacts from trawling occur at scales from square centimetres (e.g., crushing of sediment tubes and other macro-scale structures) to square kilometres (e.g., damage to and removal of three-dimensional structure-forming corals and sponges that form biogenic habitat) (Jennings & Kaiser 1998, Collie et al. 2000, Clark et al. 2016a, Amoroso et al. 2018), necessitating photographic survey methods capable of quantifying faunal and habitat detail across this range of scales. This need to image a range of scales poses trade-offs between (a) the size of individual sampling events (transects) in relation to the size of the survey area (i.e., is it better to have more shorter transects or fewer longer ones?), and (b) the relative amount of effort put into quantification of fine-scale detail versus larger-scale pattern (i.e., is it better to extract accurate fine-scale data from a subset of image frames taken from the whole transect or to extract coarser-scale data from the entire transect?). A further practical level of trade-off influences the first of these questions; it takes time to deploy instruments in the deep sea, so any time savings made from reducing transect length, and thus time at the seabed, might be relatively trivial in comparison with the time required to get the gear to and from the seabed.

14 • Best practice in seabed image analysis Fisheries New Zealand
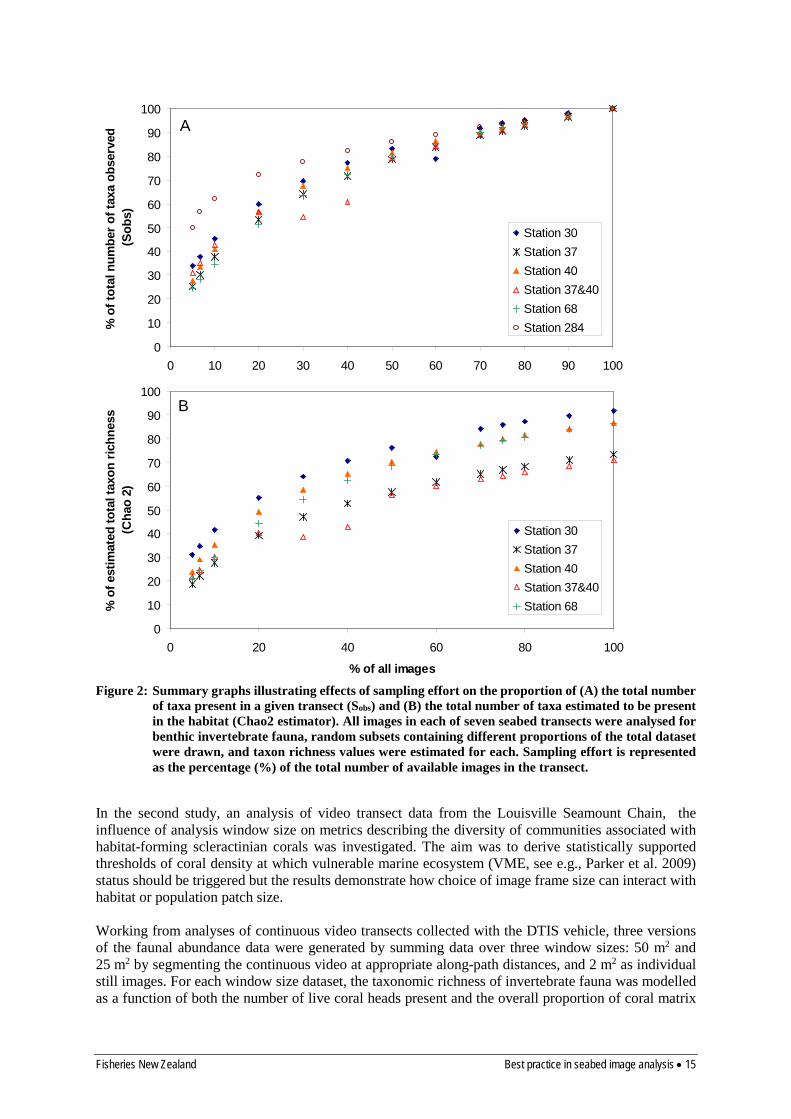
Video transects using existing towed cameras and ROVs operate at approximately 0.25 to 0.50 ms-1, covering 1 km seabed distance in about one hour (Clark et al. 2016b). For towed camera operations aboard RV Tangaroa, using DTIS, a single 1-km seabed transect in 1000 m depth requires approximately 3 hours of ship time. Thus, reducing the length of individual transects by half, for example to 0.5 km, might yield a 15% saving in ship time per transect, potentially allowing either for more sites to be surveyed in a given time or reduction in the overall length of a voyage. Given the cost of preparing, staffing, and maintaining a survey ship at sea, however, any reductions in at-sea time must be weighed against the additional sample data that could be collected. An alternative strategy might be to continue to collect full-length transects at sea but then sub-sample during analysis by analysing only, for example, 50 % of the recorded transect. This approach would reduce overall work flow times from acquisition to final data by savings of up to 40% during analysis while retaining the option to expand analyses later should the need arise. Two NIWA studies using seabed image data are reviewed here to illustrate some of these trade-offs: one looking at the effect of subsampling existing transect data, the other exploring the influence of different analysis window sizes (‘sampling unit size’) in analyses of video transect data. In the first study, NIWA investigated the effect of sub-sampling on measures of benthic community structure (number of individuals, number of taxa, and diversity) by analysing all images along DTIS seabed transects and then making random selections from the full data. Seven transects from the 2007 Chatham Rise Ocean Survey 20/20 voyage (TAN0705) were selected to represent common seabed habitats in the region, and all images from each transect were analysed for the identities and counts of all benthic fauna. This yielded a dataset with more than 3500 observations of benthic invertebrate fauna from 1140 individual images. Twelve subsets of the full data for each transect were then generated by random selection of images, to represent proportions of the full transect ranging from 5% to 90%. For each subset and the full dataset, two metrics were calculated: the proportion of the total number of taxa recorded in the full transect (Sobs), and the proportion of the total number of taxa predicted to be in the habitat (Chao2 estimator, Chao et al. 2009). The results of this analysis illustrate two general conclusions. First, reducing sampling effort by half (whether by analysing only half of the available imagery or by reducing recording time at sea) is likely to result in a decrease of approximately 20% in the number of taxa observed by comparison with the full transect (Figure 2). Second, a ‘conventional’ one-hour transect, as employed in DTIS seabed biodiversity surveys, is likely to represent between 65% and 95% of the total number of taxa present in a habitat, as predicted using the Chao 2 estimator (Figure 2B). Generalising from such results is subject to caveats about differences in the heterogeneity and patch sizes of different seabed habitats but the second conclusion, in particular, gives some reassurance that methods currently in use in New Zealand for broad-scale biodiversity surveys capture a representative proportion of the existing megafaunal diversity.
Fisheries New Zealand Best practice in seabed image analysis • 15
Figure 2: Summary graphs illustrating effects of sampling effort on the proportion of (A) the total number
of taxa present in a given transect (Sobs) and (B) the total number of taxa estimated to be present in the habitat (Chao2 estimator). All images in each of seven seabed transects were analysed for benthic invertebrate fauna, random subsets containing different proportions of the total dataset were drawn, and taxon richness values were estimated for each. Sampling effort is represented as the percentage (%) of the total number of available images in the transect.
In the second study, an analysis of video transect data from the Louisville Seamount Chain, the influence of analysis window size on metrics describing the diversity of communities associated with habitat-forming scleractinian corals was investigated. The aim was to derive statistically supported thresholds of coral density at which vulnerable marine ecosystem (VME, see e.g., Parker et al. 2009) status should be triggered but the results demonstrate how choice of image frame size can interact with habitat or population patch size. Working from analyses of continuous video transects collected with the DTIS vehicle, three versions of the faunal abundance data were generated by summing data over three window sizes: 50 m2 and 25 m2 by segmenting the continuous video at appropriate along-path distances, and 2 m2 as individual still images. For each window size dataset, the taxonomic richness of invertebrate fauna was modelled as a function of both the number of live coral heads present and the overall proportion of coral matrix
0
10
20
30
40
50
60
70
80
90
100
0 10 20 30 40 50 60 70 80 90 100
% o
f tot
al n
umbe
r of t
axa
obse
rved
(S
obs)
Station 30Station 37Station 40Station 37&40Station 68Station 284
0
10
20
30
40
50
60
70
80
90
100
0 20 40 60 80 100
% of all images
% o
f est
imat
ed to
tal t
axon
rich
ness
(C
hao
2)
Station 30Station 37Station 40Station 37&40Station 68
A
B

16 • Best practice in seabed image analysis Fisheries New Zealand
habitat present, with the aim to identify thresholds of coral habitat at which the highest diversity of associated communities are attained (Rowden et al. 2020). Threshold biodiversity values were consistent across scales for the proportion of coral matrix. However, for the number of live coral heads, the results showed consistent thresholds for the two larger window sizes (0.10 and 0.14 heads m-2 for the 50 m2 and 25 m2 windows, respectively) but a significantly higher threshold for the smallest window (0.85 heads m-2). The results for number of coral heads were interpreted as being a consequence of either the different viewpoints (oblique versus orthogonal for video and stills respectively) and resolutions (higher for still images) of the two cameras, or a scale-dependent effect of image window size in relation to coral habitat patch size. Whichever of these two explanations is correct, the study demonstrates that the characteristics of the imaging systems used in seabed surveys, and how the resulting imagery is analysed, can affect subsequent interpretation of the functional characteristics of ecosystems, which, in turn, may influence how management strategies are defined and applied. The main considerations involved in planning seabed imaging surveys are the same as for any other seabed sampling gear, including research trawls, in that survey designs need to be matched to the requirements of any formal statistical tests that are to be applied. There is an extensive literature on experimental and survey design (e.g., Quinn & Keough 2002), with recent additions that deal specifically with seabed image surveys (Foster et al. 2014, Perkins et al. 2019). Most relevant to the present report is a recent initiative by colleagues working in Australia that explicitly includes the concept of camera transect sampling in a formal statistical design framework for deep-sea surveys (Foster et al. 2020). This approach provides tools (R-package MBHdesign) to generate spatially balanced random transect placements while incorporating user-defined inclusion probabilities based on prior knowledge of the system (e.g., stony corals are more likely to occur on seamounts and other topographic features than on level sediments).
Key points • Considering the overall costs of deep-sea research voyages, there is a strong argument for
collecting as much imagery as is practicable, using both video and still image cameras. • There are trade-offs between the number of sites sampled, the distances between sites, and the
amount of seabed imaged at each site. Key considerations include knowledge of the likely patch structure of habitats to be sampled and the resources available in relation to the research questions to be answered. Given that patch structure and distributions are usually unknown during planning, the first point above becomes more important.
• Considerations involved in the design and planning of seabed image surveys are the same as for any other ecological sampling method. For quantitative survey results to be interpretable, it is imperative that surveys are designed with the statistical rigour required to address a priori research questions. Tools such as MBHdesign are available to aid such planning.
3. DATA EXTRACTION
3.1 Overview of image annotation Seabed images can be analysed using any of three broad approaches: assign a single habitat or ‘biotope’ category to the whole image or transect; identify individual taxa according to conventional taxonomic hierarchies; or group taxa on the basis of visible morphological or functional characters (Althaus et al. 2015, Durden et al. 2016, Schoening et al. 2016). For any approach in which qualitative and quantitative data about taxa or substrata are required from imagery, features of interest within the image samples must first be detected, then identified using appropriate labels ('semantic labels', Schoening et al. 2016). Taxa and substrata can then be quantified. To extract such information in a coherent, repeatable, and auditable manner requires considered and consistent approaches to:

Fisheries New Zealand Best practice in seabed image analysis • 17
a) the components of the available imagery to be analysed (e.g., still frames versus continuous video),
b) the set of annotation labels and the conceptual hierarchies they relate to, c) compilation of reference image libraries against which analysts will match image observations
and thus assign identifications, d) the software tools to be used for interaction with the imagery, and e) the data structures used to store the resulting information.
3.2 Image components to analyse A fundamental, early-stage decision in analysis is whether to work from the moving image (video) or still image frames; the latter being either independent images taken by a dedicated stills camera or as individual frames extracted from a continuous video file. Most published studies based on analysis of seabed imagery have worked from still image frames and most annotation software tools have been designed to work with still imagery or extracted video frames (Gomes-Pereira et al. 2016). The pros and cons of video and still image analysis are largely covered in the preceding sections and centre on trade-offs between maximising the seabed area covered and enabling accurate quantification of smaller fauna and habitat features. Because video transects cover greater seabed area, video analyses are likely to generate more useful data about habitat extents, patch structure, and more precise estimates of population densities for larger and rarer taxa. Still imagery, by contrast, is more likely to provide precise density estimates for smaller taxa within habitat patches. The usual practice of extracting quantitative data from still imagery, rather than video, is largely driven by the fact that it is simpler to identify regions of interest and measure seabed area in a still image, and thus to calculate population density estimates, than it is with moving video imagery. It is also conceptually simpler in terms of analysis protocols because with still imagery there is no question about what speed to replay at, or whether to freeze motion in areas of high complexity. Still image analysis has its own set of decisions, including the level of magnification to use during analyses, which can influence the number of smaller organisms detected, but precise identification and quantification is generally simpler than with the moving image. Notable exceptions to the trend to analyse still imagery rather than video are deep-sea research programmes at MBARI and NIWA, both of which work primarily from video files. This approach is in part a logical response to low faunal densities in deep-sea environments, in part related to research interests in behavioural characteristics and feeding modes (MBARI), and in part a consequence of technology and perception. Real-time video is necessary for obstacle avoidance when deploying a remote camera vehicle and, in consequence, the entire survey transect is both seen and recorded, even if video imagery is not the primary scientific sampling medium. Thus, observers have prior knowledge of all observed fauna present in the transect before any analysis is undertaken. This is important because if only a sub-sample of the transect is subsequently selected through some pre-determined randomisation process for analysis, the researchers know if a sparsely-distributed taxon (or a rare event or behaviour) that might be of key interest has been missed in the sub-sampling process. By first analysing the video file rather than a set of still frames, all fauna and events visible at the resolution of the moving image will be represented in the final data and appropriate sub-sampling or nesting of analyses can be planned on the basis of these data. Thus, it is good practice to review all available material in the first instance, assess habitat or population patch structure, and then design appropriate sub-sampling procedures. Examples of seabed image surveys of highly patchy habitat distribution in the New Zealand region include the study of variations in biodiversity associated with deep-sea coral described above (Rowden et al. 2020) and studies of cold-seep chemosynthetic habitats on the Hikurangi margin (Baco et al. 2010, Bowden et al. 2013).

18 • Best practice in seabed image analysis Fisheries New Zealand
3.3 Annotation label schemes For image-derived data to have any meaning beyond the research project in which are they developed, the set of annotation labels used must be a subset of some coherent and stable hierarchical library of such labels or be unambiguously mappable to such a library. This is the only way that the data can be related to results from prior or subsequent projects. For instance, if one study records a distinctive orange fish as “orange roughy’, and another uses its Linnaean species name “Hoplostethus atlanticus”, the labels are directly mappable via the conventional taxonomic hierarchy. If one of the studies uses a working label (or operational taxonomic unit, OTU) such as “orangefish_1” for the same taxon, however, it is meaningless outside the project in which it was recorded unless the working label is placed explicitly within an established hierarchy. Although the logic of this may seem obvious, the situation is often less straightforward in practice because making consistent identifications from seabed imagery can be challenging and some categories of observation, notably lebensspuren (‘living traces’ – characteristic marks left in marine sediments by benthic fauna), have no established naming protocols. When physical fauna samples are collected using trawls or sediment cores, each specimen can be examined in the laboratory, enabling precise determinations to consistent taxonomic levels (species, genus, family, etc.). Fauna in seabed imagery, by contrast, may present at a variety of angles, distances, and light intensities, or be partially obscured. This characteristic of image-derived identifications often results in variations in the certainty of identifications within a study and consequent variability in the taxonomic resolution of the labels applied. Thus, within a single image transect, individuals of a single species of sea cucumber, for instance, might be recorded at species (e.g., Stichopus mollis), Order (Synallactida), or Class (Holothuroidea) level depending on how clearly they present in the imagery. There are two broad approaches to defining annotation label sets for seabed fauna analyses from imagery: use of names defined in the conventional Linnaean taxonomic hierarchy and use of labels developed specifically for seabed image analysis that describe aspects of the gross morphology or functional type of organisms as observed in seabed imagery. In practice there is crossover between approaches, but for initial description it serves to separate the two. The taxonomic approach uses the same philosophy that underpins traditional taxonomy, in that specimens in images are matched to existing taxon labels in the established taxonomic hierarchy, working to whichever is the most appropriate hierarchical level for the analysis. Although traditional taxonomy is based on identification of anatomical characters, the practical issue with this when working with imagery is that key taxonomic characters are often not visible in imagery. Sponges and some cnidarian groups in particular can be difficult to discriminate even to the coarse levels of Order, Class, or Phylum. To address these issues, several schemes have been developed based on morphological features; the most recent was developed in Australia under the Collaborative and Automated Tools for Analysis of Marine Imagery project (CATAMI, https://catami.github.io/). The CATAMI annotation scheme is intended to provide a ‘standardised vocabulary for identifying benthic biota and substrata from underwater imagery’ that bridges the gap between coarse-level habitat/biotope characterisation and fine-level taxonomic labels (Althaus et al. 2015). The merits of the two approaches are compared below, with some practical examples of using the CATAMI system.
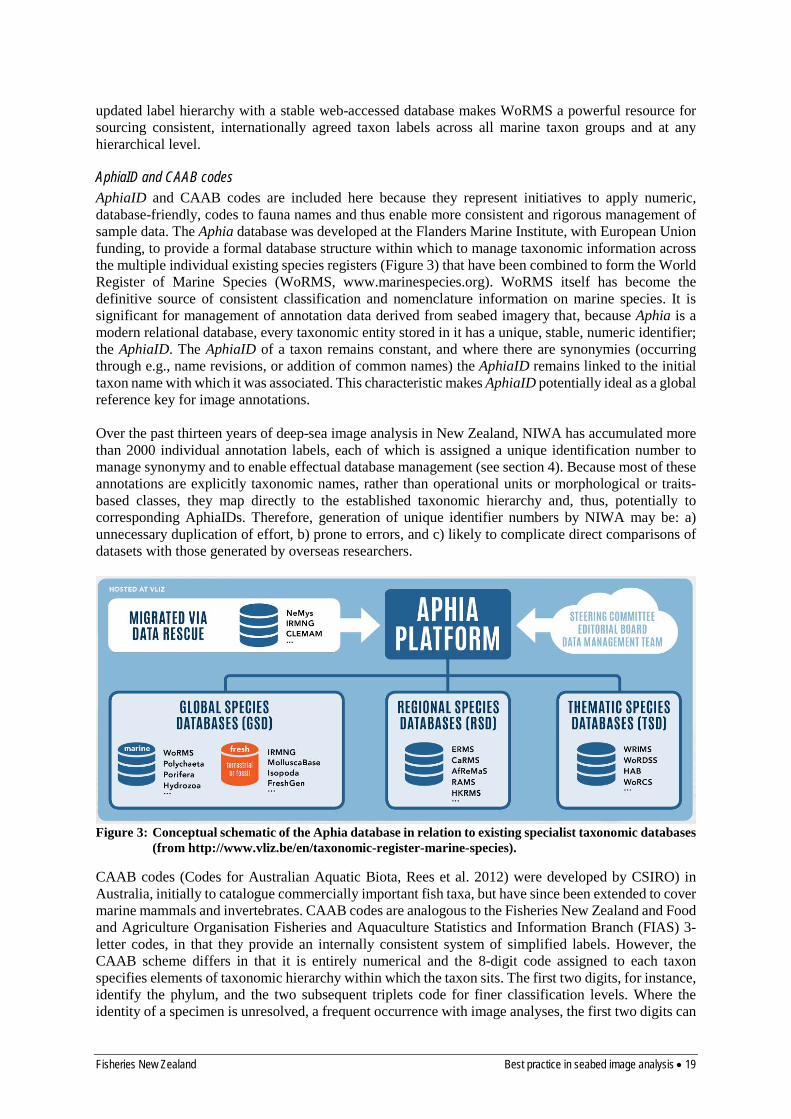
Taxonomic label schemes and databases Modern taxonomy, as a method for rationalising the names applied to biological entities, has been in continuous development since the publication of Carl Linnaeus’ Systema Naturae in 1735. After more than two-and-a-half centuries of development, with a global community of specialist taxonomists contributing to a continuous process of revision and updates, the modern taxonomic hierarchy is the most complete, stable, and internally consistent naming scheme available for assigning identities to marine organisms. In the past, repositories for taxonomic data were separated by higher taxonomic groupings but recent global database initiatives now allow data for all marine groups to be accessed online using the World Register of Marine Species (WoRMS, Horton et al. 2019) via its underlying database Aphia (Vandepitte et al. 2015). The combination of a highly developed and continually
Fisheries New Zealand Best practice in seabed image analysis • 19
updated label hierarchy with a stable web-accessed database makes WoRMS a powerful resource for sourcing consistent, internationally agreed taxon labels across all marine taxon groups and at any hierarchical level.
AphiaID and CAAB codes AphiaID and CAAB codes are included here because they represent initiatives to apply numeric, database-friendly, codes to fauna names and thus enable more consistent and rigorous management of sample data. The Aphia database was developed at the Flanders Marine Institute, with European Union funding, to provide a formal database structure within which to manage taxonomic information across the multiple individual existing species registers (Figure 3) that have been combined to form the World Register of Marine Species (WoRMS, www.marinespecies.org). WoRMS itself has become the definitive source of consistent classification and nomenclature information on marine species. It is significant for management of annotation data derived from seabed imagery that, because Aphia is a modern relational database, every taxonomic entity stored in it has a unique, stable, numeric identifier; the AphiaID. The AphiaID of a taxon remains constant, and where there are synonymies (occurring through e.g., name revisions, or addition of common names) the AphiaID remains linked to the initial taxon name with which it was associated. This characteristic makes AphiaID potentially ideal as a global reference key for image annotations. Over the past thirteen years of deep-sea image analysis in New Zealand, NIWA has accumulated more than 2000 individual annotation labels, each of which is assigned a unique identification number to manage synonymy and to enable effectual database management (see section 4). Because most of these annotations are explicitly taxonomic names, rather than operational units or morphological or traits-based classes, they map directly to the established taxonomic hierarchy and, thus, potentially to corresponding AphiaIDs. Therefore, generation of unique identifier numbers by NIWA may be: a) unnecessary duplication of effort, b) prone to errors, and c) likely to complicate direct comparisons of datasets with those generated by overseas researchers.
Figure 3: Conceptual schematic of the Aphia database in relation to existing specialist taxonomic databases
(from http://www.vliz.be/en/taxonomic-register-marine-species).
CAAB codes (Codes for Australian Aquatic Biota, Rees et al. 2012) were developed by CSIRO) in Australia, initially to catalogue commercially important fish taxa, but have since been extended to cover marine mammals and invertebrates. CAAB codes are analogous to the Fisheries New Zealand and Food and Agriculture Organisation Fisheries and Aquaculture Statistics and Information Branch (FIAS) 3-letter codes, in that they provide an internally consistent system of simplified labels. However, the CAAB scheme differs in that it is entirely numerical and the 8-digit code assigned to each taxon specifies elements of taxonomic hierarchy within which the taxon sits. The first two digits, for instance, identify the phylum, and the two subsequent triplets code for finer classification levels. Where the identity of a specimen is unresolved, a frequent occurrence with image analyses, the first two digits can

20 • Best practice in seabed image analysis Fisheries New Zealand
be recorded as ‘99’ with an appropriate unique code added subsequently. The CAAB code database is searchable via an online interface (www.cmar.csiro.au/caab/), allowing CAAB codes to be verified by searching on scientific or common names, or parts thereof (e.g., searching by the family level Echinothuriidae yields codes for that family and all registered taxa within it (Figure 4). The scheme is maintained by researchers at CSIRO and is strongly-focused on Australian fauna. Although the aims of CAAB are unquestionably aligned with requirements for effective management of image-derived data, tracing the history of the scheme via the versions accessible on the web portal indicates that it suffers from many of the same issues that NIWA’s existing annotation library and other non-taxonomic label schemes have, including: limited geographic scope (Australia only), problems with ‘child’ and ‘parent’ code categories for labels as hierarchies develop and become more complex (e.g., with synonyms and revisions of nomenclature), and lack of resourcing to keep the database up to date.
Figure 4: Example search results from the CAAB code website. The eight-digit CAAB codes (at left) are
unique to a given taxon name.
CATAMI The CATAMI scheme (http://www.catami.org/classification) differs from existing taxonomic hierarchies primarily in that it incorporates divisions based on the morphological form of organisms as they appear in imagery alongside conventional taxonomic characters. It is, thus, a hybrid scheme in which the main branches of the annotation hierarchy mostly begin with conventional taxonomic divisions (Phylum), can be extended through either morphological or taxonomic splits, and can terminate in either descriptive or species-level entities (Figure 5). The flexibility to record distinctions that are visible in imagery but cannot be placed precisely in a taxonomic hierarchy is important in image annotation and is incorporated to some extent in all approaches to seabed image analysis. For example, two types of sea cucumber that are morphologically indistinguishable from the imagery but are of

Fisheries New Zealand Best practice in seabed image analysis • 21
different colours might be differentiated as ‘Elasipoda_black’ and ‘Elasipoda_purple’, thus retaining maximum detail while maintaining explicit linkage to the taxonomic hierarchy. The primary motivation and advantage of schemes such as CATAMI is that they provide labels developed from seabed images themselves (i.e., the labels describe the way things look in images; ‘bushy’, ‘tabular’, ‘quill-like’, etc.), rather than from preserved taxonomic specimens, and thus do not demand specialist taxonomic knowledge on the part of the analysts. This makes some sense, because image annotation is largely an exercise in pattern recognition. In practice, CATAMI is a formalisation of the way most image analysts work: using established nomenclature where possible but with flexibility to allow uncertainties in identifications to be recorded in a consistent way (Howell et al. 2019). Thus, the morphological category labels in the CATAMI scheme (e.g., Bryozoa/Hard/Encrusting) serve as placeholders for use with fauna observations that are taxonomically indeterminate in imagery. This is valuable for taxonomic groups in which even coarse-level taxonomic identification from imagery is unreliable or impossible, such as sponges and bryozoans. For these groups, identification even to Class level can require examination of features at microscopic scale, and without the flexibility in annotation schemes to include operational labels they are generally condensed down to the coarse levels of phylum (Porifera and Bryozoa, respectively), thus losing potentially important diversity information.
Figure 5: Overview of the CATAMI Classification Scheme showing the basis for physical (A) and biological
(B) annotations from imagery, with details of classification branches for the phyla Bryozoa (C) and Echinodermata (‘Echinoderms’). At its coarsest level, the biological classification combines grouping at the level of phyla with others based on appearance in imagery (e.g., ‘Jellies’, ‘Worms’), with finer-level splits similarly based on either taxonomic (e.g., ‘Ophiuroids’ versus ‘Sea urchins’) or morphological (e.g., ‘Hard’ versus ‘Soft’) cues. Note also that CAAB codes are referenced at all levels of the annotation hierarchy. [Reproduced from Althaus et al. 2015].
For this project the potential of the CATAMI scheme was explored by attempting to incorporate NIWA’s current taxonomic labels into the CATAMI scheme. NIWA currently has a database (nisos, see section 4) of more than 2000 taxon and substrate labels that have been used in seabed image analyses. Most of the taxon labels in nisos are conventional Linnaean names but others combine taxonomic and morphological cues (e.g., Bryozoa – bushy form) or are simple operational identifiers (e.g., Anemone_1). Using the existing CATAMI hierarchy, most of the NIWA labels could not be matched directly to an equivalent in CATAMI, other than at a coarse level, resulting in considerable

22 • Best practice in seabed image analysis Fisheries New Zealand
loss of detail in NIWA’s data. This lack of direct matching was particularly noticeable for taxa or species that are key indicators for specific analyses, including VME indicator taxa (e.g., the stony coral Goniocorella dumosa). There were also several instances in which assigning a taxon to the best-matching CATAMI label grouped it with a set of taxonomically unrelated taxa. For instance, the squat, fleshy sea pen Kophobelemnon sp. could be assigned to one of two CATAMI labels; either ‘Cnidaria: Fleshy/Mushroom’, which grouped it with several soft coral taxa, rather than with other sea pens, or ‘Cnidaria: Corals/Black & Octocorals/Quill(seapen)’, which correctly placed it as a sea pen but imposed the ‘quill’ morphology that does not match Kophobelemnon (Figure 6).
Figure 6: Example comparison between CATAMI and taxonomic approaches to annotation labelling, as
applied in the BIIGLE annotation interface. The sea pen Kophobelemnon stelliferum is distinctive but does not have the usual quill-like form of other sea pens. In CATAMI the only relevant annotation label is at very coarse level and not in an intuitive location within the hierarchy, whereas in a taxonomic system, the genus-level label is logically positioned under the Order Pennatulacea and Class Anthozoa.
This example also illustrates a practical issue with the CATAMI system in the way labels are generated. Whereas conventional taxonomic labels are unique and implicitly hierarchical, and thus do not require extensions to define their full context, the descriptive coding used in CATAMI requires that the full branch string is included in the label. For instance, using the taxonomic system, an observation of a hermit crab as ‘Paguridae’ places it unambiguously at the family level, with its full higher level context up through order, and class, to phylum levels being implicit because its label exists only once in the hierarchy. In the CATAMI scheme, by contrast, the corresponding observation label would be ‘Crustacea: Hermit crabs: With shell or stone home’. Such label strings are less practical to use in a graphical user interface because they are more difficult to scan and select rapidly than a single name,

Fisheries New Zealand Best practice in seabed image analysis • 23
and because variable string lengths make them awkward to fit in standard-sized windows. As with CAAB codes, the current CATAMI scheme is also focused on Australian fauna and would require additional work to incorporate fauna recorded routinely from New Zealand waters.
Level of taxonomic detail A further consideration that stems from the discussion above is the question of what level of taxonomic detail identifications need to be at to answer research or management questions. In any image annotation exercise, whether at sea or in the laboratory, there is a choice between identifying taxa to the finest achievable level or to some coarser level of the hierarchy; the key point being that it is simpler and quicker to work at coarser levels, because little expert knowledge is required, and there are consequent savings in analysis time and expense. Analyses of shallow and intertidal macrofauna have shown that patterns of community variability can be still be detected reliably when species-level data are aggregated to family or sometimes even phylum (e.g., Somerfield & Clarke 1995) and experience from deep-sea surveys around New Zealand suggests that coarse-level analyses can be useful for some environmental management requirements. The utility of coarse-level analyses can be illustrated by results from a recent seabed biodiversity survey of Chatham Rise using the DTIS camera system (Bowden et al. 2017). During the survey, observations of substrata and occurrences of all visible seabed fauna were recorded in real time by analysts and, because the real-time feed from DTIS is at low resolution, fauna identifications in these logs were also at coarse taxonomic resolution. A reporting requirement for the Environmental Protection Agency (EPA) was that any occurrence of seabed Sensitive Environments, as defined by Schedule 6 of the Exclusive Economic Zone and Continental Shelf (Environmental Effects – Permitted Activities) Regulations 2013, should be notified daily. As these Sensitive Environments are defined at coarse taxonomic levels (see MacDiarmid et al. 2013 for details), the real-time DTIS logs, with population densities confirmed by reference to high-resolution still images where necessary, were sufficient for the notifications. This analysis allowed immediate broad-scale mapping of seabed habitats at a level that was informative for environmental management (Figure 7, top panel). Subsequent detailed annotation of the survey imagery, with identifications to the finest achievable taxonomic resolution and spatially standardised densities, enabled more nuanced analyses of benthic diversity across the study area (Figure 7, mid and lower panels) capable of informing finer levels of environmental decision-making (Bowden et al. 2019b). Potential efficiencies to be made through planned use of coarse-level annotations recorded in real time at sea become more compelling with the introduction of fibre-optic cable. Greatly increased optical resolution and frame rate of live video feeds over fibre-optic, by comparison with single-conductor cables, enable more accurate and consistent observations to be recorded routinely in real-time, which in turn allows more reliable data on seabed habitats and communities to be generated and communicated on much shorter time-scales. As the example above shows, this would be part of a tiered analysis approach, in which provision of rapid data summaries at relatively coarse taxonomic resolution would be followed by finer-level analyses conducted post-voyage and perhaps focussed on areas or specific interest identified from the initial data.

24 • Best practice in seabed image analysis Fisheries New Zealand
Figure 7: Example of how seabed imagery can be used at different levels of detail depending on the amount
of analysis effort invested. Top, data from real-time observation logs used to notify locations of Sensitive Environment; Middle, standardised density estimates for individual taxa (species, genus, etc.) developed from detailed post-voyage analyses; and Bottom; community-level classification developed from Gradient Forest beta-diversity analyses that combine all taxon-level density estimates. Data and plots from MPI project ZBD2016-11: Quantifying Benthic Biodiversity.
Key points • Annotation label schemes for seabed fauna that are directly mappable to the established
taxonomic hierarchy, as accessed via WoRMS/Aphia, ensure that data extracted from seabed imagery are transferable and interpretable beyond the projects in which they are developed.
• Morphology-based annotation schemes, notably CATAMI, have some advantages for consistent identifications of fauna from imagery but current implementations are incomplete, do not have established programmes for management and updates, and can yield data that are not directly mappable to the classical taxonomic hierarchy.
• Mapping existing NIWA taxon identifications to their corresponding AphiaID numbers may be useful for both managing NIWA’s seabed image annotation data and enabling combined analyses across projects and in overseas collaborations.
Fisheries New Zealand Best practice in seabed image analysis • 25
• The taxonomic level at which seabed fauna are to be identified is an important criterion when planning analyses. Considerable savings in analysis time can be made by constraining annotations to coarser taxonomic levels where this level of detail is sufficient to answer the specific research or management questions of the project.
3.4 Reference image libraries A comprehensive image library with up-to-date identifications matched to the analysis annotation label scheme is an essential prerequisite to maintain the accuracy and consistency of identifications made from imagery. Because analysis of imagery is largely an exercise in pattern matching, rather than taxonomy per se, the reference library is most useful if it consists primarily of representative images cropped directly from the imagery to be analysed. Fundamental characteristics required include that individual images should be unambiguous (i.e., with only the target taxon represented where possible), include a spatial scale reference, and be adjusted to correct for underexposure and colour casts. Given that the raw material consists of digital image files, the image library should be designed to make best use of the searchability of digital assets. Most image file standards (JPEG, TIFF, etc.) incorporate metadata fields into which the annotation labels associated with the imaged taxon can be written, making the files searchable by content, rather than just filename, and these metadata fields can also include spatial coordinates, taxonomic authority, and notes on diagnostic features. Digital imagery is ubiquitous in modern life and in consequence, there are many highly developed image management applications available, both stand-alone and web-based, that can be used as effective tools for interacting with seabed image libraries. Such off-the-shelf solutions, however, reference only within the image library itself, using folder structures, filenames, and embedded metadata. More flexible and useful for scientific research are digital asset databases that can link directly to other databases that store, for instance: quantitative faunal data from analyses of seabed image surveys, navigational data from surveys, or taxonomic data about physical specimens collected by other sampling methods. A reference image library for seabed analysis is most useful if designed in a way that facilitates the visual pattern matching that is key to this form of image analysis. The library should prioritise presentation of the images, rather than their filenames or associated metadata; enable rapid browsing and magnification, and incorporate efficient search tools that interrogate all embedded and associated data fields. The ideal is to be able to make quick comparisons among images without having to navigate sub-menus to search for a given species or morphotype. This kind of capability is now common in commercial photo management software (e.g., Adobe Lightroom, ACDSee, Capture One). Like any other database, a reference image library also requires management and routine maintenance if it is to remain useful beyond the project it was developed in. Several well-designed and well-maintained marine taxon image libraries have been developed and are available online but most are not focused on seabed imagery. The Biodiversity of Singapore reference library (https://singapore.biodiversity.online/species) is an example of a well-developed image library, with a highly functional layout providing clear thumbnail images for review of taxon imagery, a filtering/search panel to narrow down the taxonomic hierarchy, and the ability to drill down to full-resolution images and their metadata (Figure 8).

26 • Best practice in seabed image analysis Fisheries New Zealand
Figure 8: Identification image library example – The Biodiversity of Singapore
(https://singapore.biodiversity.online). Panel at right enables filtering by taxonomic groups and clicking on thumbnail images allows access to full resolution imagery and associated taxonomic, ecologic, and location data.
Most institutions involved in seabed imaging surveys develop their own in-house image libraries, some of which are available online. JAMSTEC’s E-Library of Deep-sea Images (J-EDI, www.godac.jamstec.go.jp/jedi/e), for instance, is extensive and functional and has a detailed, if idiosyncratic, search filter that allows the user to narrow down images by hierarchical classification, geology/environment, dive observations, and geographical coordinates. MBARI also has a comprehensive and well-managed library of annotated identification images (the Video Annotation and Reference System (VARS) Knowledgebase) but this is not publicly available. Also of note is the Deep-Sea ID app (www.marinespecies.org/deepsea) developed by Adrian Glover at the Natural History Museum in the United Kingdom (UK). This app is designed for use on mobile devices and does not enable simultaneous viewing of multiple images but is a useful reference tool for image taxon identification. Although the examples above demonstrate how practical image libraries can be structured, of more relevance to this review are current initiatives to build online databases and access tools that combine image catalogues for seabed image analyses across multiple institutions. The Catalogue of Atlantic Deep Sea Fauna (http://www.deepseacatalogue.fr/) is an initiative by the University of Plymouth (UK), Ifremer (France), and National Oceanic and Atmospheric Administration (NOAA, USA) to build a combined reference library of seabed megafauna identification images for the North Atlantic (Figure 9). This library has been conceived around the concept of the operational taxonomic unit, with all taxa assigned a unique OTU number that is matched across images from all participating institutions. The library has relatively few images at present ― perhaps reflecting the difficulties involved in ensuring that arbitrary OTU labels used in each of the participating institutions are matched reliably and consistently ― but the initiative is significant because it marks a move towards standardisation of image libraries and their underlying data structures. In the proposal for a Standardised Marine Taxon Reference Image Database (SMarTaR-ID), Howell et al. (2020) set out a common database table structure for seabed morphospecies identification image catalogues. The data field names are designed to map directly to the principal global taxonomic and biodiversity databases in use today (primarily Aphia, see section 3.4) and the overall concept is intended to promote cross-institution adoption of common standards and thus make seabed image analysis data more consistent and comparable among studies (Figure 10).

Fisheries New Zealand Best practice in seabed image analysis • 27
At NIWA, reference image libraries for seabed image analyses have been developed on a project-by-project basis, with images cropped, scaled, and colour-corrected from the original video or still image files and taxon names written into the image files (using IPTC metadata fields, https://iptc.org/). However, these libraries are generally accessed via either proprietary stand-alone photo management tools or by being downloaded and pasted into printable documents. This approach is not ideal because the images and their associated identifications become spread across multiple server locations, and thus are easily overlooked when beginning a new analysis project and are not managed in a way that ensures consistency of naming or updating names to match current taxonomic practice. In line with best practice outlined above, NIWA is currently working to database its seabed identification images and create links between these and databases that store both the recorded annotation and navigation data from surveys (see section 4), and taxonomic data and images of physical specimens curated in the NIWA Invertebrate Collection. These initiatives will improve the accuracy, consistency, and speed of seabed image analyses by facilitating access to well-managed and reliably labelled reference images across all surveys.
Figure 9: Example screen from the Catalogue of Atlantic Deep Sea Fauna.

28 • Best practice in seabed image analysis Fisheries New Zealand
Figure 10: Conceptual diagram of the Standardised Marine Taxon Reference Image Database (SMarTaR-
ID) proposed by Howell et al. (2020). This figure reproduced with permission from Howell et al. (2020).
Key points • Representative and complete identification image libraries are essential for accurate and
consistent annotation of seabed imagery. • Reference images are most useful if taken under the same conditions as the imagery to be
analysed. • If managed in suitable database structures, as digital assets rather than static pictures,
identification images can be linked to taxonomic hierarchies and analysis data, thus improving accuracy and consistency of identification and nomenclature.
• The proposal by Howell et al. (2020) for a standardised data structure for managing seabed identification images provides a useful basis on which to develop an image catalogue for the New Zealand region, with potential for sharing of imagery across a global network of such catalogues.
3.5 Annotation tools Deciding on a coherent, stable set of annotation categories and labels is fundamental to extracting meaningful data from imagery but the software tools used by analysts to apply these labels also have an important influence on the consistency of the resulting data. An annotation tool, in the current context, is software with a graphical user interface that enables analysts to assign identity labels to points or regions of interest in imagery (Schoening et al. 2016). The key attributes of such tools are that

Fisheries New Zealand Best practice in seabed image analysis • 29
they should: 1) enable intuitive user access to a constrained set of annotation labels, 2) make unambiguous links between individual annotations and the portions of the imagery they refer to, and 3) save the annotation data and their associated metadata in coherent data structures. As with other areas of software development, combining an intuitive user interface with rigorous data management can be challenging and the balance can err to one side or other of the equation: an annotation tool designed by a database manager is unlikely to be useful in practice if analysts find it clumsy to operate, whereas an intuitive interface that does not save data in logical, repeatable, and appropriately structured ways will cause ongoing problems for subsequent analyses. A recent review detailed 23 image annotation tools (Gomes-Pereira et al. 2016). These tools divide broadly into two categories: tools for still images and tools for video, with some having capabilities for both types of imagery. Despite most of the tools within each category fulfilling essentially the same base functions, their proliferation is a consequence of individual research groups having differing approaches to seabed image analyses, influenced by the aims of their current research and by the legacy of methods used for their previous analyses. New tools are also developed in response to availability of improved software standards and the need to update or replace existing tools written in obsolete programming languages. The distinction between video and still image annotation is also something of a grey area because most implementations of video analysis involve making quantitative measurements by pausing the video stream or extracting individual frames or discrete segments from it, and thus treating the imagery essentially as a succession of still images. The only video annotation tools NIWA is aware of that enable capture of annotations during full-motion replay, and are in common use, are Ocean Floor Observation Protocol (OFOP, Huetten & Greinert 2008), VARS (Connor 2005, Schlining et al. 2006), and ADELIE (Aide au DEpouiLlement Interactif des données des Engins sous-marins, wwz.ifremer.fr/) but BIIGLE (Bio-image Indexing and Graphical Labelling Environment, Langenkämper et al. 2017) is currently developing interesting capability in this respect. An increasingly important distinction in annotation tools is that between stand-alone (software loaded to a local computer) and recently developed web-based applications. Stand-alone annotation software tools have the advantages of relative simplicity and practicality when working away from established networks. The primary limitations of existing stand-alone tools, however, can include not having effective ways to enforce a standard vocabulary of labels, not enabling multiple analysts to work on a common dataset, and not saving data to a common database structure. Some stand-alone tools, notably VARS (developed by MBARI and currently in use by CSIRO), have been designed as front-end user interfaces to databases that enforce data compatibility whether operating ashore or at sea. Web-based platforms for image annotation are a relatively recent development, in which image files are accessed via web-servers, all operations are performed via a web-interface, and annotations are stored to a central database with standardised outputs available to download on request. This web-based model has several advantages. First, no software is installed on local computers, which simplifies set-up, removes reliance on specific workstations, allows any operating system (and any browser) to be used, and removes the need for version upgrades or resetting of database links. More significantly for the efficiency and accuracy of analyses, web tools also enable multiple analysts, working anywhere in the world with reliable internet access, to work on the same image files while using annotation labels drawn from an agreed, a priori, hierarchy and having their data stored to a common central database. In combination, these factors promote greatly improved data management, with more robust auditing of annotations among analysts, and facilitate access to wider, potentially global, pools of identification expertise. As far as NIWA is aware, all current and past seabed image analysis work in New Zealand has employed stand-alone annotation tools (OFOP, ImageJ, FishRock, and others – see Gomez-Peireira et al. 2016 for details of all tools). At NIWA, OFOP has been used for at-sea and post-voyage annotation of deep-sea seabed video since 2006, after initial exploration of several other tools, including VARS and ADELIE. For still image annotation, NIWA has used ImageJ for basic analysis work and developed the NIWA Image Capture and Management System (NICAMS) annotation interface and database as a front- and

30 • Best practice in seabed image analysis Fisheries New Zealand
back-end to ImageJ that streamlined annotation operations, enforced a common label hierarchy, permitted multiple analysts to work on a common dataset, and recorded all annotations with explicit within-image spatial locations to a central database. Thus, in NICAMS, NIWA attempted to address shortcomings identified in most annotation tools available at the time. NICAMS is in routine use today as the standard tool for analysis of scampi (Metanephrops challengeri) survey imagery, but it was never fully developed for more complex analysis applications. For other seabed imagery analysis work, it is now being succeeded by new web-based tools that incorporate the same essential core capabilities while benefitting from the latest software developments, including automated annotation via deep learning algorithms (see section 3.6) and international input to design and support. These new tools have immense potential for reducing analysis time and improving the accuracy, consistency, and transparency of seabed image analyses.
Web-based annotation platforms A requirement of the new web-based annotation platforms is that the imagery to be analysed is accessed via web-servers. This requirement brings major benefits in that multiple analysts can work on imagery simultaneously in a common workspace, with all annotations linked to the same source set of images and recorded to a central database. As with any other data type, web access also introduces potential security and intellectual property issues that may necessitate more rigorous server security protocols than would be required for locally stored files. There are well-established approaches to securing data online, however, and the enhanced scientific value of the imagery when made accessible and discoverable is likely to outweigh any potential risks. For this project NIWA assessed three of the most recent web-based image annotation tools, or environments, currently available: BIIGLE, Squidle+ (http://squidle.org/), and CoralNet (Williams et al. 2019) (Appendix 2). A fourth candidate, VIAME (Video and Image Analytics for a Marine Environment, www.viametoolkit.org/) developed in the USA with support from NOAA, is a full image analysis environment encompassing a wide range of image-related tools, including sophisticated machine learning methods for automated detection of objects in video and still imagery, and appears to have great potential. It is in development, however, and NIWA did not pursue it further after finding it difficult to set up, with basic user interfaces and numerous bugs in some tools. BIIGLE is developed and maintained by the Biodata Mining Group at Bielefeld University in Germany and has recently been released as open source software. Originally conceived as a means to generate large volumes of appropriately annotated imagery with which to develop and train machine learning algorithms (Ontrup et al. 2009), it has since been developed as a tool for collaborative web-based image annotation, fulfilling the need for ‘new generation’ underwater image analysis software (Gomes-Pereira et al. 2016) that results from dramatic increases in the volume of high-resolution digital seabed imagery (Schoening et al. 2016). The key requirements for BIIGLE, as defined by its authors, are that it should (1) improve annotation quality in terms of its accuracy and reproducibility, (2) enable scientific collaboration, and (3) enable data fusion and integration across projects. It is currently the most fully developed of the new online annotation environments and is in use by several research groups in Europe. Similarities with the base capabilities and functions of NIWA’s earlier stand-alone NICAMS application are not coincidental; NICAMS was discussed by the lead author of this report (DAB), Tim Schoening, and others at international workshops during BIIGLE’s development. In use, BIIGLE had the most intuitive and considered interface of the three annotation environments tested, together with the best support. Users can be assigned differing levels of access, which allows, for instance, individual analysts to be restricted to seeing their own annotations, while an administrator can view those from all analysts for review and audit. There are two review tools: ‘volume label review’ (Volare) and ‘label review grid overview’ (Largo). Volare enables the reviewer to cycle through all annotations in a set of images, image-by-image, with full spatial context within the image, and including annotations either by all analysts or selected individuals only, enabling direct comparison of label assignment between analysts. Largo, by contrast, generates a uniform grid consisting of cropped images of all objects that have been labelled with a given annotation label, thus enabling rapid detection of

Fisheries New Zealand Best practice in seabed image analysis • 31
anomalous annotations. Having the flexibility to cross-check annotations in different review modes enables rapid verification of annotations, comparisons among analysts, and correction of incorrect labels. BIIGLE also incorporates the Machine-Learning Assisted Image Annotation tool (MAIA, Zurowietz et al. 2018). MAIA exploits the capacity of artificial neural nets (in this case Mask R-CNN, see section 3.6) for unsupervised and weakly supervised learning to learn from existing annotations in the image set, detect similar regions of interest in new images and propose appropriate annotation labels that the human user can then either accept or reject. In published tests using real-world seabed imagery, MAIA has reduced analysis times by more than 50% while maintaining annotation accuracy at more than 80% (Zurowietz et al. 2018). In less rigorous tests conducted for the present project, analysts using unmodified imagery from the DTIS camera system found the MAIA tool to be well-documented, straightforward to run, and remarkably adept at detecting regions of interest in the imagery, with consequent savings in the time taken to annotate a volume of images. Thus, in the MAIA workflow, most of the time-consuming task of scanning through images to detect objects of interest is undertaken by neural net while the analyst concentrates on classifying those objects according to the chosen annotation label scheme. Notably, there are also progressive efficiencies with time as the neural net learns to refine its detections based on feedback from the analysts’ expert determinations. MAIA works only with still imagery at present but there is potential for it to be adapted to work with video. Neither of the other two web-based annotation environments, Squidle+ and CoralNet was as fully-developed, simple to set up, as useable in practice, or as well supported as BIIGLE for deep-sea image analysis. Squidle+ is an Australian initiative developed by Ariell Friedman of Greybits Engineering (https://greybits.com.au/) and, according to its documentation, should have much the same core capability as BIIGLE, including machine learning capability. In practice, however, NIWA found several aspects to be incomplete and with initial set-up and loading of images problematic and did not pursue it further. CoralNet, as its name suggests, was developed specifically to enable efficient analysis of shallow coral reef survey imagery and promote consistent methods across research programmes. It differs from the other web-based environments considered here in that it is also intended as a repository for coral reef imagery, with funded server space available free of charge. The rationale behind this approach is that the developers of CoralNet aspire to automate coral reef image analysis by development of artificial neural nets, and that training these nets depends on amassing a very large library of expertly-annotated imagery (see section 3.6 for discussion of deep-leaning). CoralNet is well-developed and apparently fully functional, particularly in the sophistication of its automated and semi-automated routines. However, NIWA found that its emphasis on shallow water corals, particularly with its annotation labels, was limiting for general deep-sea imagery, and that its user interface was less intuitive and flexible than that of BIIGLE.
Key points • Web-based annotation platforms developed over the past few years offer significant advantages
over conventional, locally installed applications. Most importantly, they: (1) enable multiple analysts to work remotely on the same image files; (2) record all annotations to a common database; (3) enforce use of a common hierarchy of labels; (4) record all annotations as spatially referenced areas within the imagery; and (5) enable robust, objective, audit of annotations because project administrators can view and compare all annotations from all analysts superimposed on the original imagery.
• BIIGLE appears to be the most fully-developed, user-friendly, and well-supported web platform at present.
• Machine learning tools incorporated into web-based annotation platforms are already at a stage where they can improve the efficiency of annotation workflows.

32 • Best practice in seabed image analysis Fisheries New Zealand
Video annotation tools Most analyses of seabed imagery in the New Zealand region beyond the coastal zone have been from video, rather than still imagery, and mostly using OFOP software to record spatially referenced annotations. OFOP has proved to be a versatile stand-alone tool for rapid capture of time referenced observations from video with simultaneous capture of navigational metadata. It has many additional functions that are particularly valuable at sea for planning, monitoring, and replotting camera transects, but its core capability is to enable consistent recording of annotations (Huetten & Greinert 2008). OFOP shares the main drawbacks of stand-alone annotation tools noted above, particularly the issues of label consistency enforcement and lack of underlying database structure (outputs are in the form of simple text files). It is also proprietary compiled software written in a now, outdated coding framework (VisualBasic) which makes it something of a ‘black box’, with any bug-fix or refinement dependent entirely on the original developer. For these reasons, NIWA is planning to migrate its seabed video analyses from OFOP to a new system. After evaluating available tools, NIWA elected to develop its own, in-house replacement for OFOP. The new tool is called the NIWA Seabed Observation System (NiSOS) and is currently in initial trials to refine its user-interface. It is built using JavaScript and open source components and is designed to replicate the core capabilities of OFOP, but with the key improvement that all operations are structured around a purpose-built spatial database (nisos), which can be replicated in portable form to enable direct upload of at-sea observations to the main server-based database ashore. In arriving at the decision to build NiSOS from first principles rather than adapting an existing annotation tool, NIWA re-evaluated the VARS tool from MBARI. VARS is, arguably, the benchmark in video annotation tools, because of its robust, well-designed data management structures and track record in use by MBARI and CSIRO. VARS was the primary alternative to OFOP when NIWA started deep-sea analysis work with the DTIS system in 2006, but NIWA chose OFOP because of its practicality at sea and because NIWA was able to work with its developer (Prof. Jens Greinert, GEOMAR, Germany) to refine its user interface to enable more rapid, precise annotation than was possible with VARS. At the same time, colleagues at CSIRO in Hobart selected VARS, and the experiences of the two institutions over the intervening years, including collaboration on voyages and research projects (Williams et al. 2010a), provided a useful comparison between the two tools. In essence, NIWA found that while the two research groups have similar workflows there are key differences in emphasis: whereas NIWA routinely records as much detailed information as possible in real time at sea and works with a large number of primarily taxonomic annotation labels, CSIRO do not annotate in real time and use the more constrained, higher-level CATAMI annotation scheme (section 3.3). The main negative factor in NIWA’s evaluation was the VARS user interface, which remains unsuited to working with large numbers of labels and thus does not facilitate rapid designation of annotations either in real time or post voyage. Also highly relevant to this discussion is the recently developed video annotation capability in the BIIGLE platform. A key difference between this tool and either OFOP, VARS, or NiSOS is that it enables annotations to be localised within the video image frame, even during full-motion video playback. This BIIGLE capability only became operational in the latter stages of the current review and thus was not tested, but the ability to make localised, within frame, annotations in real time could be of key importance to enabling automated analysis of moving video. Automated detection and identification of regions of interest in images using machine learning tools requires training data in which annotation labels are linked to specific regions (clusters of pixels) within images; this is the primary motivation for development of this capability in BIIGLE. Machine learning developments are discussed in detail in the following section.
Key points • Despite the advantages of analysing video (as opposed to discrete still images), in terms of
greater seabed area covered, detection of sparsely distributed taxa, and quantification of habitat patch structure, there are few annotation tools designed for working with video files.

Fisheries New Zealand Best practice in seabed image analysis • 33
• NIWA is developing a replacement for OFOP, the annotation tool it has used for video analyses since 2006. The new application (NiSOS) will have similar core capabilities to OFOP for video annotation work both at sea and ashore, but will interface directly with a dedicated database for more efficient and robust data management and storage.
• Video annotation capability currently being developed in BIIGLE is of interest because it enables explicit localisation of annotations within the image frame. This functionality may be of key importance for development of automated annotation and identification methods.
3.6 Machine learning and automated annotation The rate of increase in the volume of high-resolution digital imagery generated for marine scientific research programmes is rapidly out-pacing traditional, human analysis methods (Schoening et al. 2016, Zurowietz et al. 2018). As noted in the preceding section, automated annotation, or computer-assisted annotation tools are now being incorporated into widely available annotation platforms but these are the very beginning of what promises to be a major change in the way image analyses are undertaken. Recent developments in artificial neural networks and the phenomenal speed with which all forms of artificial intelligence research are expanding, including major improvements in real-time image interpretation, offer great potential for application in seabed research. In New Zealand, to date, these new methods are being explored in applications including analysis of whale vocalisations from passive acoustic mooring data (Alexandre Schimel, NIWA, personal communication) and mapping coastal macroalgae (Casey Peat and Roberta D’Archino, NIWA, personal communication), but these are relatively simple analyses by comparison with the diversity of habitat and faunal forms in seabed imagery. Machine learning algorithms find patterns in multi-dimensional data, then use models that match those patterns to knowledge about object identities that they have gained from human annotated image libraries. By being able to detect, then assign identities to, regions of interest in imagery, such algorithms can make predictions about the content of new data (Figure 11). Since 2016 there has been a dramatic increase in the accessibility of sophisticated machine learning tools. This advance has been driven largely by the release of powerful free-to-use and open source software libraries by major IT companies including Google Brain (TensorFlow, Abadi et al. 2016), Microsoft (Microsoft Cognitive Toolkit, https://docs.microsoft.com/en-us/cognitive-toolkit), and Intel (Data Analytics Acceleration Library, https://software.intel.com/en-us/daal). These tools have been developed over many years and with immense financial, intellectual, and image data resources, with the aim to automate detection of pattern in large, complex, multivariate datasets. Key examples of these applications are human face identification, speech and text recognition, real-time interpretation of the surrounding environment as a core capability required for driverless vehicles, and automated analysis of histological samples for diagnosis of medical conditions (Ponzio et al. 2019). The availability of these tools has sparked an explosion of interest across a wide range of image data applications and, in the context of this report, makes possible the goal of automated analysis of scientific seabed imagery.

34 • Best practice in seabed image analysis Fisheries New Zealand
Figure 11:Schematic of deep-learning algorithm training (top) and use (bottom), with indication of the
pattern-recognition layers of the convolutional neural net (CNN, left) and the interpretive model components (right) that link observed patterns with learned object identities.
Machine learning, as applied to the detection and identification of regions of interest in imagery, relies on convolutional neural networks (CNN, Krizhevsky et al. 2012), which are essentially highly sophisticated pattern recognition algorithms. The term ‘deep learning’ (Krizhevsky et al. 2012, LeCun et al. 2015) denotes a more recent class of machine learning algorithms that use multiple ‘hidden’ layers in the CNN to extract and pool progressively higher-level patterns from raw data input. For instance, lower layers in the CNN might detect clusters of image pixels that denote edges or textures at small scale within the image, while higher levels might discriminate spatial relationships between edge regions or polygons with differing textures. Importantly, deep learning algorithms are also ‘representation learning’ methods, meaning that they can ‘learn’ how to detect and classify pattern from raw data without explicit supervision or training on a prescribed dataset. For applications in seabed image analysis this attribute is of critical importance because most seabed imagery globally has not been labelled in a format that is useable for direct training of machine learning algorithms. Until recently, machine learning algorithms for use in image analysis were trained to recognise specific objects and object classes by presenting them with libraries of pre-annotated images. Because of the myriad different aspects that a given object can present in photographic imagery, whether it be a face, a dog, a tree, or a fish, such training libraries need to contain very large numbers of examples of each object class. The best known database of annotated images developed specifically for training machine learning algorithms is ImageNet (www.imagenet.org) (Deng et al. 2009), which references more than 14 million hand annotated images, with each object class (e.g., ‘dog’, ‘lamp post’, or ‘tree’) being represented by many hundreds of images, and is made possible by the dramatic proliferation of imagery shared on the internet since its inception and by the global audience available via the internet willing to annotate them. For subject areas that do not have mass representation in mainstream channels, however, it has not been practical to compile sufficiently large volumes of expertly annotated imagery to train deep learning neural nets. This impracticality is evident even in the relatively well-resourced field of medical imaging (Ponzio et al. 2019). In the field of seabed image data, researchers have been annotating imagery for decades, but for most applications at most research institutes (including NIWA, MBARI, CSIRO, JAMSTEC, and others) annotations are linked to imagery either by a time reference,

Fisheries New Zealand Best practice in seabed image analysis • 35
in the case of video, or by a whole image identifier in case of still images. Thus, in a given video frame or still image, several distinct regions of interest (animals, substrate types, etc.) might be present, but are not differentiated in terms of localised sets of image pixels because all are referenced in the database to a specific time or frame number. This lack of within image localisation is a problem because machine learning algorithms work at the level of pixel patterns within images; so for annotations to be useful for supervised training of such algorithms, they would need to be in the form of labelled bounding boxes or polygons that specify clusters of pixels within images or video frames. A practical solution to the lack of appropriately annotated image training sets stems from the inherent representation learning characteristics of deep learning CNNs and is termed ‘transfer learning’ (Weiss et al. 2016). In transfer learning, the CNN learns from existing information that is available in sufficient volume and is related to but not the same as the target data to be worked on. A human example might be that a person who has learned to play the piano would be able to use the understanding of musical structures gained from that experience to learn to play, for example, the violin in a relatively shorter time than someone with no experience. For seabed imagery, the core analytical skills required in a CNN, to first detect, then identify, regions of interest are no different to those needed to perform the same tasks for everyday imagery containing for example, human faces, cars, or puppies: both tasks rely on detection and classification of pattern across spatial scales within the image. Thus, the ‘heavy lifting’ components of existing, highly developed CNN tools can be adapted to new applications, searching independently through target raw imagery in unsupervised mode to detect and catalogue distinctive regions of interest (Razavian et al. 2014). The beauty of this method is that the first labour intensive phase of generating a dedicated image library for deep-sea fauna might be achieved with minimal human input; expert knowledge only necessary with subsequent decisions about coherence (do all regions of interest in this putative grouping represent the same thing?), relevance (is this region of interest useful or not in terms of detecting marine fauna?), and labelling (what should the set of regions of interest that look like this be called?). The promise is, therefore, that the daunting amount of work that would be required to generate the volume of human annotated images for building a dedicated deep learning tool from first principles can be ‘sub-contracted out’ to existing deep learning tools. Such techniques are now becoming available in practical tools, such as the MAIA routine in BIIGLE, with applications across a range of applications in marine ecology and fisheries research (see recent review by Malde et al. 2019 and references therein) including: fish species classification (Salman et al. 2016, Siddiqui et al. 2018); assigning fisheries acoustic records to fish species (Allken et al. 2019); identification of marine fouling community taxa (Chin et al. 2017); detection and identification of marine megafauna (Gray et al. 2019a, Gray et al. 2019b); and analysis of on-deck fisheries surveillance video (French et al. 2019). In relation to real-world seabed imagery of the type that is routinely collected in the deep sea around New Zealand, however, the most advanced and well-resourced initiative to apply deep learning approaches NIWA is aware of is FathomNet, an MBARI initiative led by Principal Engineer Kakani Katija. The goal of FathomNet is to exploit deep learning principles outlined above to generate an annotated image database for deep-sea fauna that is comparable in scope to ImageNet and will function as a reference training set for development of dedicated deep learning algorithms for automated detection of seabed fauna and substrata. To achieve this goal, MBARI needed a way to bridge the divide between their extensive library of seabed video imagery and the detailed but unlocalised expert annotation data they have generated from this imagery over the past thirty years, without spending several more years manually assigning localised labels. They have developed an approach that consists of three broad phases. First, they have adapted existing deep learning tools and extensions, notably Grad-CAM++ (Chattopadhay et al. 2018) to develop robust and rapid procedures for detection and localisation of regions of interest in their video imagery (Figure 12). In unsupervised mode, the CNN in this phase proposes regions of interest and records their locations as bounding boxes within image frames, but does not know what identities to assign to them (Figure 13). Second, in what the researchers call ‘weakly supervised’ mode, the deep learning relates the occurrence of regions of interest from phase one to the occurrence of annotation labels in the existing expert annotation database, assigning putative

36 • Best practice in seabed image analysis Fisheries New Zealand
identifications on the basis of the time and frequency of occurrence of regions of interest. For instance, if a given video sequence contains many individuals of a species of sea pen and one or two individuals of a crab species, these two taxa will have been discriminated in the unsupervised detection phase on the basis of their physical forms, and it is then a relatively simple problem for the deep learning algorithm to learn the correct label assignment on the basis of their relative frequency of occurrence in the database (Figure 14). In the third phase, the annotated regions of interest generated through phases one and two are assessed by human experts, corrected where necessary, and the deep learning retrained in a reinforcement learning process. From example video sequences shared at the Marine Imaging Workshop 2019 (Appendix 1 Schlining et al., second presentation), these techniques are remarkably effective at segmenting unmodified seabed video imagery in real time. At the time of this report, the second phase, above, is in progress, with deep learning tools being used in unsupervised mode to mine MBARI’s extensive video archive and generate seed image catalogues for all taxa discriminated by the unsupervised algorithm. After this phase, work is due to begin in 2020 to build the server and database infrastructure needed to make the FathomNet image catalogue publicly accessible via the internet. Once this public portal has been set up, the intention is for FathomNet to serve as a marine image analogue of ImageNet; an extensive, expertly annotated dataset that can be used as a resource to train neural nets targeted specifically at automated annotation of seabed imagery.
Figure 12: Video frame grab illustrating output from Mask R-CNN with Grad-CAM++ as used for automated detection and localisation of seabed fauna in the FathomNet project at MBARI.
There are several aspects of the FathomNet project that make it of interest in the context of improving the efficiency of seabed image analyses in New Zealand. First, MBARI has the largest consistently curated and fully annotated archive of seabed video imagery in the world, with all data managed in a stable relational database (VARS). Thus, MBARI’s archive is an ideal resource with which to start the process of developing a globally relevant machine learning tool for the deep sea. Second, although MBARI operate in a different biogeographic region, the north-east Pacific, the body forms of seabed fauna are largely invariant worldwide in terms of visible morphology and at taxonomic levels coarser than species or genus, particularly in the deep sea. Therefore, a CNN tool trained by reference to the marine fauna of Monterey Canyon is likely to be effective at detecting similar fauna in imagery from

Fisheries New Zealand Best practice in seabed image analysis • 37
New Zealand. For example, in Figure 13 the sea pen Funiculina sp., recorded here in Monterey Canyon, would be indistinguishable from the same genus seen in New Zealand at the resolution of the imagery. Third, New Zealand (primarily NIWA) has its own expertly annotated seabed imagery that is qualitatively similar to that used to develop FathomNet, albeit on smaller scale, and there is great potential for future collaboration with MBARI to incorporate imagery from the south-west Pacific into FathomNet, using the tools and procedures currently in development at MBARI.
Figure 13: FathomNet. Example of localised regions of interest generated by unsupervised machine learning algorithm. In this example, regions of interest are colour coded by morphological type (note incorrect grouping of organism in box 1 with crabs in boxes 0, 2, and 7). [MBARI, with permission.]

38 • Best practice in seabed image analysis Fisheries New Zealand
Figure 14: Annotations identifying occurrences of benthic fauna in a video frame: A, the current situation in which annotations in a database (shown at right) are linked to the image only by a time code (i.e., individual annotations are not differentiated within the image frame), and B, the same annotations localised within the image, as required if annotations are to be useful for training machine learning algorithms. [Images modified from Schlining et al. presentation at MIW2019 (see Appendix 1) and reproduced with permission.]
Key points: • Machine learning methods, in the form of deep learning neural nets, have advanced
dramatically over the past decade and powerful tools are now available for unsupervised detection, isolation, and quantification of pattern in seabed imagery.
• Practical implementations of deep learning tools are now available in new, web-based image annotation tools developed specifically for seabed image analysis. These work in unsupervised or weakly supervised mode and thus can detect regions of interest but not assign identities to them.
• To achieve automated detection combined with reliable identification of fauna and substrata, an extensive library of appropriately annotated seabed images is needed, on which deep learning nets can be trained.
• The FathomNet project at MBARI is an initiative to develop such a library. MBARI have the largest archive of annotated seabed imagery of any institute in the world and the longest history of efficient management of imagery and associated annotation data and thus has the resources needed to attempt such a library.
• There is potential for collaboration in the FathomNet initiative that could enable automated detection and identification of fauna in deep-sea video imagery from the New Zealand region.
• Even with the unsupervised deep learning methods currently available for still imagery (MAIA in BIIGLE), there are immediate efficiencies in analysis workflows for still image analysis.

Fisheries New Zealand Best practice in seabed image analysis • 39
4. DATA MANAGEMENT The fundamental basis for efficient management of seabed image data is that data should be managed from initial project inception through to final analyses in the context of well-designed database structures. Only by managing data in such frameworks can their integrity, accuracy, and traceability be maintained. To date in New Zealand this has rarely been the case, with most seabed image data being saved within separate projects to stand-alone media such as desktop spreadsheets or text files. In consequence, merging data collected under individual projects can be fraught with problems associated with matching annotation labels, standardising counts and measures, and quantifying differences among analysts (Bowden et al. 2019a, Clark et al. 2019). This project-based approach for image data contrasts with the way that data from research trawl surveys have been managed, with planned data formats, efficient database architecture, quality control at all stages of data acquisition and storage, and long-term commitment to ensuring comparability and accessibility of data (O'Driscoll et al. 2011).
FAIR principles Also highly relevant to the management of seabed imagery, and the data derived from it, is the current movement in the earth sciences community towards data sharing and adoption of FAIR principles (Findable, Accessible, Interoperable, and Reusable, Stall et al. 2019) for scientific data. Under FAIR principles, data should be: findable by anyone using common search tools; accessible such that they can be interrogated and checked; interoperable such that they can be integrated in analyses with similar data collected elsewhere using common formats and methods; and reusable through having clear metadata that define their provenance and provide explicit usage licences. Immediate implications of this trend include high ranking journals not accepting papers unless the source data used are made accessible via accepted repositories, and reluctance to include data supplements with publications. For seabed imagery and data operations in New Zealand, lack of coherent data management and the rise of FAIR principles in scientific reporting signal a need to review and improve the ways in which seabed photographic sampling programmes are conducted. At a time when destructive sampling using extractive methods including trawling are increasingly inappropriate for assessing marine ecosystem status, particularly in protected or sensitive areas, photographic data should be collected and managed with the same standards of consistency and accountability as the research trawl survey data are. Photographic sampling remains the only non-destructive sampling method currently available that enables quantification of seabed habitats and fauna at scales relevant to present and projected future impacts, and thus all image data have potential value for evaluating the status of seabed environments and how they change over time.
Management of seabed imagery and data in New Zealand Seabed images and data files are digital assets, no different in essence to the product catalogue and specification data managed by commercial enterprises, or the specimen provenance, location, and taxonomic status data managed by museums. Thus, efficient data management tools to look after such data on an institutional basis are readily available and seabed image data per se present few unique challenges. The legacy of piecemeal project management of seabed data in New Zealand since digital imaging surveys at the scale of the EEZ began in 2006–07, however, has resulted in a situation where most imagery and data are not yet managed using such tools: the tools, the imagery, and the data exist but the work involved in collating and grooming the image files and metadata to enable loading to a common digital asset database is considerable. This situation is not unique to New Zealand (e.g., Appendix 1, Williams et al. MIW2019), but the history of seabed image and data management at NIWA illustrates many of the issues involved. For many years NIWA has used the commercially available Atlas multimedia database (https://www.atlasmd.com/) to manage a range of digital image types, including still imagery from the initial Ocean Survey 20/20 voyages and other projects for which data need to be publicly available. However, limitations imposed in NIWA's original implementation of the Atlas platform because of disk space constraints and lack of resources for cross-project data management at the time have resulted in
40 • Best practice in seabed image analysis Fisheries New Zealand
it not being used for routine management of seabed imagery and data. In consequence, hundreds of hours of video and hundreds of thousands of still images are currently archived on secure servers that do not facilitate discovery and have no explicit linkage to associated metadata or annotation data from analyses. Prompted in part by the present review process and in part by recent Fisheries New Zealand and NIWA initiatives that require compilation of data across multiple seabed imaging surveys (Bowden et al. 2019a, 2019b, Clark et al. 2019), NIWA is currently working to address these issues. When NIWA first selected Atlas as its digital asset management tool, researchers worked with its developer to introduce new capabilities that would meet the needs of an effective scientific image management tool. In addition to the generic image management capabilities Atlas already provided, these innovations included:
• Deployment on a spatial database platform (PostGIS), enabling imagery and data to be linked explicitly to location data and allowing map searches for imagery.
• Enabling Open Geospatial Consortium (OGC, www.opengeospatial.org) web service support to show standard map layers (e.g., bathymetry backgrounds from NIWA Geographic Information System servers).
• Enabling metadata fields for individual projects to be modified, so that the stored information can be customised for each project.
• Implementing a bulk upload tool to enable datasets of 20 000 or more images to be uploaded complete with metadata as a single operation.
• Providing a web Application Programming Interface (API) so that Atlas can be used to serve images to websites and other applications.
• Providing a web API for inserting images, so images can be loaded into Atlas as part of processes loading data and image metadata into other databases.
• Enabling a facility for public read-only access to specified datasets of images where appropriate.
These enhancements have enabled images stored in Atlas to be embedded in websites and database publishing applications, accessed ‘on the fly’ and served by Atlas, much as a traditional database can be queried to provide data. Although this made Atlas an important part of NIWA's information delivery capability in some areas (primarily Communications), it has remained under-utilised for seabed imagery because of server space limitations, the resources needed to compile metadata and upload large image sets, and lack of integration with analysis data derived from the imagery under the projects for which they were collected. Two major tasks are currently in progress to address these impediments. First, Atlas has been updated and redeployed on a new server with enough storage volume to make all existing archived DTIS seabed imagery available from a single source. For raw imagery, this will make possible two of the FAIR principles: findability and accessibility. Second, a new spatial database for dedicated storage of annotation data from seabed image analysis logs has been developed: the NIWA Seabed Observation System database (nisos). This database is designed to store all annotation data extracted from NIWA seabed video imagery (as OFOP logs), both at sea and in post-voyage analyses, bringing together annotation and navigation data from all DTIS surveys conducted since 2006. Because both Atlas and nisos are spatial databases and there are common keys (voyage code, station code, and time of capture), items in one database can be directly linked to relevant items in the other. Furthermore, because NIWA’s seabed fauna image identification library will also be hosted on Atlas, direct linkage of observations in nisos to their corresponding specimen identification images will also be possible. However, although all database structures are complete, populating them with all voyage imagery, metadata, and observation annotations from the past 13 years is a major undertaking involving more than 250 000 still images, more than 1000 hours of video, and more than 1.5 million annotations. Although the bulk of imagery and data presents some issues, the major task is ensuring compatibility of annotation data in the nisos database across all surveys from all years.

Fisheries New Zealand Best practice in seabed image analysis • 41
Key points • Well-designed and consistent data structures are essential for management of seabed image data
if data are to have meaning beyond the projects in which they were first collected. • The manner in which seabed imagery and data has been collected in New Zealand has resulted
in a legacy of disparate datasets that hinders their wider use in generating insights into seafloor ecosystems.
• FAIR principles for data accessibility and accountability are rapidly becoming the norm for publishing in scientific journals. Robust data management structures and procedures are central to achieving the required standards for FAIR data.
• For deep-sea imagery in New Zealand, NIWA is re-evaluating its data management procedures, with investment in a coordinated set of initiatives including: a new video annotation tool (NiSOS) that integrates directly with a new spatial database for seabed video annotations (nisos); upgrades of the Atlas digital asset management database and server to enable migration of all seabed digital imagery from archive to accessible storage; and further Atlas modifications that enable direct integration with BIIGLE, which NIWA has adopted as its primary image annotation platform.
5. SUMMARY & CONCLUSIONS Best practice in seabed imaging involves consideration of optimal choices at all stages of the workflow, including the design of imaging systems and platforms, survey design and deployment methods, metadata collection, choice of annotation methods, tools, label structures, and data auditing and management procedures. Although it is tempting to make definitive statements as to what current best practice is at each stage, such judgments are likely to be rapidly outmoded if framed too tightly. In this respect, image surveying of the deep seabed is more analogous to astronomy, satellite remote sensing, or remote acoustic surveying than to other seabed sampling methods such as trawls or corers, in that the technology on which it depends is in constant development, with frequent increases in the spatial acuity of sensors. Thus, whereas essentially the same design of trawl or corer might be used routinely over many decades to ensure temporal compatibility of data, if the same approach were to be applied to remote sensing methods, including imaging, single-beam depth sounders, single-frequency midwater acoustics, and film cameras would still be in use. Just as no one would argue for telescopes to be restricted to some historical standard, or satellite sensors to be downgraded to match those of the first earth observation instruments, stipulating standard specifications for equipment or methods in marine imaging would not be feasible or constructive. For characterisation of seabed habitats and biodiversity, however, there are essential features of the image acquisition, data extraction, and data management processes for which guidelines for best practice are both appropriate and necessary if the resulting data are to be useful for research and management purposes. The key points from the body of this review are summarised below, concentrating on those aspects in which best practice can usefully be defined without constraining future developments, and highlighting areas in which new developments or working practices have potential to enhance the volume, detail, accuracy, or accessibility of data. Where NIWA believes guidelines or firm recommendations are appropriate and useful, the relevant summary text is italicised
Image acquisition The fundamentals of photographic imaging are constrained by the properties of light in water and air, and by the optical acuity of imaging systems. Thus, a first prerequisite of best practice is to ensure that the imagery collected is of the best achievable quality with respect to exposure, depth-of-field, evenness of illumination, and sharpness. These parameters are optimised by careful design, maintenance, and calibration of the imaging system, combined with meticulous attention to operating parameters, including speed and altitude of the imaging platform, during deployment. The ongoing increase in the resolution of digital sensors is remarkable and results in progressive increases in seabed image acuity.

42 • Best practice in seabed image analysis Fisheries New Zealand
This poses issues for analyses of time-series data, but this is not a reason to impose artificial limits on sensor resolution. Increased image resolution yields greater insights into the diversity, structure, and function of seabed environments, which may in turn better inform management decisions. Because video imagery captures animal behaviours and other movement, such as gas release from the seabed, that can inform ecologic or geologic research questions, there is a strong argument for recording video routinely on all platforms, even if continuous coverage of the seafloor is already achieved by high-frequency overlapping still imagery. Similarly, simultaneous use of cameras with different orientations, ideally with one orthogonal to the seabed for quantifying benthic habitats, maximises the amount of useful data that can be generated from the imagery. As demonstrated by the example from Rowden et al. (2020) in section 2.5, when the spatial distribution and habitat patch characteristics of a survey area are not known a priori, as is common in deep-sea research, recording with multiple cameras with different orientations and framed areas permits more thorough statistical exploration of the effects of using different perspectives and spatial scales in analyses. The importance of accounting for spatial scale effects also affects decisions made at the scale of whole surveys. The same level of statistical rigour used in design of research trawl surveys and formal scientific experiments should be applied to seabed image surveys, taking into account all prior knowledge of the system to be studied, the research questions to be addressed, the statistical analysis methods to be used, and the imaging resources available. Although some form of spatial reference is generally included in all seabed imagery so that data can be quantified as standardised population densities or areal coverage, the intrinsic value of imagery for quantitative analyses would be greatly extended if stereo camera systems ― or other means of enabling 3-dimensional whole-image measurement ― were to be deployed as standard. The technical and computational requirements for 3-dimensional imaging are well-established and readily available and the potential benefits to ecological research of being able to extract accurate measurements from imagery are wide-ranging. The range of platforms available for dedicated camera deployment has changed little since earlier reviews, with towed cameras, ROVs, AUVs, and HOVs still the primary types. Although use of ROVs and AUVs is becoming standard in deep-sea research and commercial surveying in many regions, they remain technically complex and expensive by comparison with towed camera platforms, with higher maintenance and staffing costs and more restrictive deployment conditions. For broad-scale survey of seabed habitats and fauna in the New Zealand region, towed camera systems are still a pragmatic and effective tool, yielding imagery and data adequate for purpose. However, at present, New Zealand image-based seabed research in the deep sea is designed within the limitations of the available systems. Although these restrictions have led to development of a pragmatic and effective mode of operation for mapping biodiversity across areas of open seabed (Bowden 2011, Compton et al. 2013, Bowden et al. 2016, Bowden et al. 2019a), with some remarkable successes in studies for which towed camera systems are less than ideal (e.g., Bowden et al. 2013, Clark et al. 2019), they restrict the range of what is possible. Research or management questions that demand finer-scale surveys, more accurate measurement of seabed features, or repeat examination of fauna or processes at a single site (e.g., time series of recolonisation or before-and-after disturbance studies) cannot currently be undertaken with any degree of confidence. Such studies would require use of either a ROV or AUV, or both, with AUVs in particular being well-suited to generating high-resolution patch mosaics for characterisation of seabed faunal communities, geological features, or resources across much of the EEZ. Given the importance of the seabed and its associated biological and mineral resources to New Zealand, there is a strong argument that investment in remotely operated and autonomous vehicle capability is essential to discover, map, understand, and manage New Zealand’s marine estate. A critical step towards increasing the versatility of seabed imaging systems in New Zealand will be the change to fibre-optic cable for the deep-sea research vessel RV Tangaroa.

Fisheries New Zealand Best practice in seabed image analysis • 43
Data extraction Data on seabed fauna and substrata distributions can be generated from both video and still imagery. Although it is most common, globally, to work with still imagery, the continuous nature and greater seabed swept area of video make it better suited to studies of larger megafauna and quantification of habitat patch size. In practice, the greater resolution of still images enables quantification of fine-scale detail but analysis at this scale is generally more time-consuming and the detail may not be relevant to the purpose of the study. It is important at the outset of a study to make informed decisions about which components of the system and which spatial scales are most likely to be useful for addressing the overall aims. A practical approach for general seabed biodiversity surveys in the deep sea is to use video to map patterns of distribution at larger scales and thus identify habitat patches of specific interest, within which fine-scale analyses of still imagery can be focused. One of the major issues affecting the quality of data from seabed image surveys is lack of consistency in the way organisms are labelled and quantified. This issue hinders comparisons between studies, reduces confidence in the data, and prevents assembly of regional datasets. To overcome issues caused by inconsistent labelling of fauna or substrata, annotation label schemes for use in seabed image analyses should be unambiguously mappable to existing globally accepted hierarchies. For marine fauna, NIWA suggests that the taxonomic hierarchy as managed in the Aphia database and accessed via WoRMS is the most appropriate and consistent hierarchy. Practical application of annotation labels during image analyses is an exercise in pattern matching. Therefore, development of well-managed libraries of reference identification images is essential to ensure consistent identifications. To be useful beyond the projects in which they were first developed, such libraries are best designed as digital asset databases and require appropriate investment in maintenance and management. By incorporating explicit database links to taxonomic entities in the Aphia database, identification image libraries could be used to maintain direct mapping of operational taxon names to the global taxonomic hierarchy and thus facilitate sharing and comparison of data among projects and regions. The methods used to record image annotations can have a strong influence on the subsequent usability of image data. Earlier practices of recording annotations and counts to paper or spreadsheets have been superseded by purpose designed software tools that facilitate enforcement of consistent annotation schemes and storage to stable database structures. New web-based annotation initiatives are being developed in parallel with the growth of machine learning and at their best are now elegant, practical, and powerful tools for image annotation. The adoption of web-based annotation environment for seabed image analyses will: enable multiple analysts and taxonomists to work on the same set of images simultaneously and from anywhere in the world; enforce consistent management of annotation label hierarchies; store all annotations as spatially explicit points or polygons within the image frame; save all data to a managed database; and enable rigorous audit of annotation accuracy and consistency among analysts. Of the web-based annotation platforms assessed here, BIIGLE appears to be the most fully-developed, versatile, and well-supported. Working with the developers of BIIGLE in Germany, NIWA is in the process of migrating all its deep-sea seabed image analysis to this platform, a process that involves development of the Atlas digital asset management tool to enable closer integration with BIIGLE via its API. Arguably the most significant recent development in seabed image acquisition is the increase in the volume of imagery that can be collected. It is now possible to deploy high-resolution digital cameras on any seabed sampling gear and with high bandwidth telemetry links and autonomous vehicles, multiple cameras can be used simultaneously, yielding huge volumes of imagery. This increase presents major problems for extraction of ecological data from imagery because annotation methods currently in use depend on painstaking visual examination of imagery for detection, identification, and enumeration of regions of interest. Even with the imaging systems currently in use in New Zealand, there is a substantial delay between first acquisition of imagery and availability of data extracted from it, which can hamper timely decision-making for environmental management. A partial solution to this
44 • Best practice in seabed image analysis Fisheries New Zealand
could be a two-speed data reporting framework, in which initial data about faunal identities and densities are generated at coarse taxonomic resolution during the survey, followed, if needed, by shore-based analyses at finest practicable resolution. Initial data would be sufficient for identification of sensitive environments and some protected species (notably, scleractinian corals), providing immediate information relevant to spatial management of seabed activities. This approach to recording seabed image data is used at present in surveys using DTIS, but data provision would be enhanced if the workflow were formalised, with additional time budgeted for at-sea quality control of taxonomic identifications and metadata. The most important factor currently limiting the detail and quality of real-time data from deep-sea seabed image surveys in New Zealand is the lack of fibre-optic cable on RV Tangaroa. Investment in fibre-optic cable or other high bandwidth data link would enable full-resolution video imagery at the surface in real time and thus allow for substantial increases in the quality and consistency of initial observational data, providing more immediate and accurate input to environmental management processes. A more far-reaching solution to the increasing volumes of imagery now available comes with the dramatic increases in the ability of machine learning algorithms to detect objects of interest in imagery without supervision. Automated detection and identification of targets in seabed imagery is now a realistic goal, with recent developments in neural nets offering potential for fundamental change in the way data are extracted from seabed imagery. New Zealand could benefit greatly from these developments, but to take full advantage of their potential, collaborative work with other initiatives worldwide will be necessary. Full automation is still some way off, primarily because of the lack of suitable training image libraries for seabed fauna, but practical machine learning tools that help reduce data extraction tasks by detecting and grouping objects of interest are already available. Such unsupervised detection of objects of interest is now highly developed and requires no prior training of the net. The ability to assign identities to the objects detected (i.e., naming taxa), however, demands training on large libraries of annotated imagery; existing nets optimised to identify mainstream objects (faces, eyes, cats, cars, etc.) having been trained on many millions of images. Generating a library of expertly annotated seabed fauna images on the scale needed to train dedicated neural nets for deep-sea research is a major undertaking that will be best addressed by working cooperatively with research programmes beyond New Zealand. The FathomNet initiative at MBARI aims to lay the groundwork such a library, building from MBARI’s extensive archive of annotated seabed imagery initially, before opening up the project to include annotated imagery from other institutions and regions, globally. Working with MBARI and other institutions to develop the FathomNet project has potential to transform the speed and accuracy with which data are derived from seabed imagery in New Zealand.
Data management As the volume of seabed imagery continues to increase, it is imperative that image files, metadata, and all derived data are managed in coherent, purpose-designed database structures. Without investment in the resources required to build, maintain, and manage such structures, issues with data loss, comparability between studies, and consistency of identifications and counts are inevitable, effectively negating much of the potential of the imagery to inform research and management questions. A further incentive to manage seabed image data effectively is emerging with the increasing requirement by international journals and funding agencies for data to adhere to FAIR principles; data should be findable, accessible, interpretable, and reproducible. In New Zealand to date, for deep-sea imagery at least, imagery and data do not conform to FAIR, and data have been managed on a project basis, reflecting in large part the predominant funding model for seabed ecological research outside fisheries stock assessment. Steps are being taken to improve this situation, with the development of a new purpose designed database for seabed observations and data recorded from DTIS video, designed on similar principles to existing Fisheries New Zealand fisheries databases, and upgrade of the Atlas digital asset management tool to accommodate and make accessible all existing imagery. There is a compelling need for investment in seabed image data management in New Zealand, with commitment to long-term support similar to that afforded to recognised nationally significant databases

Fisheries New Zealand Best practice in seabed image analysis • 45
such as trawl and the NIWA Invertebrate Collection database. Only with such support will it be possible to ensure that seabed imagery and data conform to FAIR principles and, thus, enable exploitation of their full potential for mapping seabed fauna, habitats, and resources; monitoring change; and informing environmental management at the scale of New Zealand’s EEZ.
6. MANAGEMENT IMPLICATIONS Photographic surveying is the only non-destructive sampling method available that generates quantitative data on seabed fauna, habitats, and substrata at spatial scales relevant to exploration and management of the EEZ. These characteristics become increasingly valuable as greater emphasis is placed on spatial management of benthic impacts and resource extraction in the New Zealand region. However, seabed photographic surveying has considerably more potential to inform environmental management decisions than is being made use of at present. This failure to exploit the full potential of seabed imagery results partly from the lack of a strategic approach to ensuring that image-derived data are useful beyond the individual projects for which they were first generated, and in part from lack of investment in the necessary technological and data management frameworks. These factors, in turn, are consequences of the relatively recent development of broad-scale image surveying in the region, and of the absence of accepted standards for image acquisition, types and formats of data to be extracted, and structures in which these data are to be stored. At present, NIWA is the only New Zealand agency investing in development and maintenance of seabed imaging capacity for the deep sea, funded mostly through strategic investment, and generating data under disparate individual projects commissioned by government or commercial clients. If seabed imaging is to be used to its full potential to inform environmental management at the scale of the EEZ, there needs to be strategic investment in the development of imaging systems (including moving beyond towed cameras) and commitment by NIWA, Fisheries New Zealand, the Department of Conservation, and other agencies that use seabed image data to require and support best practice in data management, including support for a database of national importance. More sophisticated imaging platforms, such as ROVs and AUVs that are key to achieving more nuanced understanding of seabed resources and impacts, are expensive to purchase and maintain and there are strong arguments for these to be considered as national investments, in much the same way as the research vessels are.
7. ACKNOWLEDGEMENTS This work was funded under Fisheries New Zealand project BEN2018-03, with project governance by Karen Tunley at Fisheries New Zealand. We are grateful to Jenny Beaumont at NIWA for constructive review of an earlier draft, and to many colleagues for wide-ranging discussions that helped inform the review, particularly: Alan Williams, Franzis Athaus, Scott Foster, and Nick Mortimer at CSIRO, Australia; Brian Schlining and Kakani Katija at MBARI, USA; Tim Schoening and Jens Greinert at GEOMAR, Germany; and Daniel Lagenkamper and Martin Zurowietz in the Biodata Mining Group at Bielefeld University, Germany. Special thanks to Brian Schlining and Kakani Katija for use of FathomNet and Grad-CAM++ presentation material. Thanks also to Ian Tuck for reviewing the final draft document.

46 • Best practice in seabed image analysis Fisheries New Zealand
8. REFERENCES Abadi, M.; Barham, P.; Chen, J.; Chen, Z.; Davis, A.; Dean, J.; et al. (2016). Tensorflow: a system for
large-scale machine learning. Proceedings of the 12th USENIX Symposium on Operating Systems Design and Implementation (OSDI 16), Savannah, GA, USA 16: 265–283.
Abdo, D.A.; Seager, J.W.; Harvey, E.S.; McDonald, J.I.; Kendrick, G.A.; Shortis, M.R. (2006). Efficiently measuring complex sessile epibenthic organisms using a novel photogrammetric technique. Journal of Experimental Marine Biology and Ecology 339(1): 120–133.
Allken, V.; Handegard, N.O.; Rosen, S.; Schreyeck, T.; Mahiout, T.; Malde, K. (2019). Fish species identification using a convolutional neural network trained on synthetic data. Ices Journal of Marine Science 76(1): 342–349. doi.org/10.1093/icesjms/fsy147.
Althaus, F.; Hill, N.; Ferrari, R.; Edwards, L.; Przeslawski, R.; Schönberg, C.H.L., . . . Gowlett-Holmes, K. (2015). A Standardised Vocabulary for Identifying Benthic Biota and Substrata from Underwater Imagery: The CATAMI Classification Scheme. PLoS ONE 10(10): e0141039. -.doi.org/10.1371/journal.pone.0141039.
Amoroso, R.O.; Pitcher, C.R.; Rijnsdorp, A.D.; McConnaughey, R.A.; Parma, A.M.; Suuronen, P.; . . . Jennings, S. (2018). Bottom trawl fishing footprints on the world's continental shelves. Proceedings of the National Academy of Sciences of the United States of America 115(43): E10275-E10282. doi.org/10.1073/pnas.1802379115.
Auster, P.J.; Malatesta, R.J.; Larosa, S.C. (1995). Patterns of microhabitat utilization by mobile megafauna on the southern New England (USA) continental-shelf and slope. Marine Ecology Progress Series 127: 77–85.
Baco, A.R.; Rowden, A.A.; Levin, L.A.; Smith, C.R.; Bowden, D.A. (2010). Initial characterization of cold seep faunal communities on the New Zealand Hikurangi margin. Marine Geology 272(1–4): 251–259.
Basher, Z.; Bowden, D.A.; Costello, M.J. (2014). Diversity and Distribution of Deep-Sea Shrimps in the Ross Sea Region of Antarctica. PLoS ONE 9(7): e103195. doi.org/10.1371/journal.pone.0103195.
Bowden, D.A. (2005). Quantitative characterisation of shallow marine benthic assemblages at Ryder Bay, Adelaide Island, Antarctica. Marine Biology 146(6): 1235–1249.
Bowden, D.A. (2011). Benthic invertebrate samples and data from the Ocean Survey 20/20 voyages to Chatham Rise and Challenger Plateau, 2007. New Zealand Aquatic Environment and Biodiversity Report No. 65. 46 p.
Bowden, D.A.; Anderson, O.; Escobar-Flores, P.; Rowden, A.; Clark, M. (2019b). Quantifying benthic biodiversity: using seafloor image data to build single-taxon and community distribution models for Chatham Rise. New Zealand Aquatic Environment and Biodiversity Report No. 235. 67 p.
Bowden, D.A.; Davey, N.; Fenwick, M.; George, S.; Macpherson, D.; Ray, C.; . . . Gibson, K. (2017). Quantifying Benthic Biodiversity: A factual voyage report from RV Tangaroa voyage TAN1701 to Chatham Rise, 4 January - 2 February 2017. New Zealand Aquatic Environment and Biodiversity Report No. 185. 194 p.
Bowden, D.A.; Jones, D.O.B. (2016). Towed Cameras. In: Clark, M.R.; Rowden, A.A.; Consalvey, M. (eds). Biological Sampling in The Deep Sea, pp. 260–284. Wiley & Sons.
Bowden, D.A.; Rowden, A.A.; Anderson, O.F.; Clark, M.R.; Hart, A.; Davey, N.; Carter, M.;. Chin, C. (2019a). Quantifying Benthic Biodiversity: developing a dataset of benthic invertebrate faunal distributions from seabed photographic surveys of Chatham Rise. New Zealand Aquatic Environment and Biodiversity Report No. 221. 35 p.
Bowden, D.A.; Rowden, A.A.; Leduc, D.; Beaumont, J.; Clark, M.R. (2016). Deep-sea seabed habitats: Do they support distinct mega-epifaunal communities that have different vulnerabilities to anthropogenic disturbance? Deep-Sea Research Part I-Oceanographic Research Papers 107: 31–47. doi.org/10.1016/j.dsr.2015.10.011.

Fisheries New Zealand Best practice in seabed image analysis • 47
Bowden, D.A.; Rowden, A.A.; Thurber, A.R.; Baco, A.R.; Levin, L.A.; Smith, C.R. (2013). Cold Seep Epifaunal Communities on the Hikurangi Margin, New Zealand: Composition, Succession, and Vulnerability to Human Activities. PLoS ONE 8(10): e76869. doi.org/10.1371/journal.pone.0076869.
Bowden, D.A.; Schiaparelli, S.; Clark, M.R.; Rickard, G.J. (2011). A lost world? Archaic crinoid-dominated assemblages on an Antarctic seamount. Deep Sea Research Part II: Topical Studies in Oceanography 58(1–2): 119–127. doi.org/doi:10.1016/j.dsr2.2010.09.006.
Bryson, M.; Johnson-Roberson, M.; Pizarro, O.; Williams, S.B. (2016). True Color Correction of Autonomous Underwater Vehicle Imagery. Journal of Field Robotics 33(6): 853–874. doi.org/10.1002/rob.21638.
Bullivant, J.S. (1959). An oceanographic survey of the Ross Sea. Nature 184(4684): 422–423. Chao, A.; Colwell, R.K.; Lin, C.W.; Gotelli, N.J. (2009). Sufficient sampling for asymptotic minimum
species richness estimators. Ecology 90(4): 1125–1133. Chattopadhay, A.; Sarkar, A.; Howlader, P.; Balasubramanian, V.N. (2018). Grad-CAM++: Generalized
Gradient-Based Visual Explanations for Deep Convolutional Networks. 2018 IEEE Winter Conference on Applications of Computer Vision (WACV) Lake Tahoe,12–15 March 2018, pp. 839-847. doi: 10.1109/WACV.2018.00097
Chiba, S.; Saito, H.; Fletcher, R.; Yogi, T.; Kayo, M.; Miyagi, S., . . . Fujikura, K. (2018). Human footprint in the abyss: 30 year records of deep-sea plastic debris. Marine Policy 96: 204–212. -doi.org/10.1016/j.marpol.2018.03.022.
Chin, C.S.; Si, J.T.; Clare, A.S.; Ma, M.D. (2017). Intelligent Image Recognition System for Marine Fouling Using Softmax Transfer Learning and Deep Convolutional Neural Networks. Complexity 2017: Article ID 5730419 doi.org/10.1155/2017/5730419.
Clark, M.R. (2002). Voyage report of a survey of seamounts off the northeast coast of the North Island (KAH0224). [Unpublished NIWA Voyage Report held by NIWA library.]
Clark, M.R.; Althaus, F.; Schlacher, T.A.; Williams, A.; Bowden, D.A.; Rowden, A.A. (2016a). The impacts of deep-sea fisheries on benthic communities: a review. Ices Journal of Marine Science 73: 51–69. doi.org/10.1093/icesjms/fsv123.
Clark, M.R.; Bowden, D.A. (2015). Seamount biodiversity: high variability both within and between seamounts in the Ross Sea region of Antarctica. Hydrobiologia 761(1): 161–180. doi.org/10.1007/s10750-015-2327-9.
Clark, M.R.; Bowden, D.A.; Rowden, A.A.; Stewart, R. (2019). Little Evidence of Benthic Community Resilience to Bottom Trawling on Seamounts After 15 Years. Frontiers in Marine Science 6:63. doi.org/10.3389/fmars.2019.00063.
Clark, M.R.; Consalvey, M.; Rowden, A. (Eds.) (2016b). Biological Sampling in The Deep Sea. Wiley & Sons. 481 p.
Collie, J.S.; Hall, S.J.; Kaiser, M.J.; Poiner, I.R. (2000). A quantitative analysis of fishing impacts on shelf-sea benthos. Journal of Animal Ecology 69(5): 785-–-798.
Collins, M.A.; Priede, I.G.; Bagley, P.M. (1999). In situ comparisons of activity in two deep-sea scavenging fishes occupying different depth zones. Proceedings of the Royal Society of London Series B-Biological Sciences 266: 2011–2016.
Compton, T.J.; Bowden, D.A.; Pitcher, R.C.; Hewitt, J.E.; Ellis, N. (2013). Biophysical patterns in benthic assemblage composition across contrasting continental margins off New Zealand. Journal of Biogeography 40(1): 75–89. doi.org/10.1111/j.1365-2699.2012.02761.x.
Connor, J. (2005). Archiving, annotating and accessing video as data. In: Markham, J.W.; Duda, A.L. (eds). Voyages of Discovery: Parting the Seas of Information Technology, pp. 173–178. International Association of Aquatic and Marine Science, Libraries and Information Conference Series.
Cryer, M.; Hartill, B.; O'Shea, S. (2002). Modification of marine benthos by trawling: Toward a generalization for the deep ocean? Ecological Applications 12(6): 1824–1839.
48 • Best practice in seabed image analysis Fisheries New Zealand
De Leo, F.C.; Smith, C.R.; Rowden, A.A.; Bowden, D.A.; Clark, M.R. (2010). Submarine canyons: hotspots of benthic biomass and productivity in the deep sea. Proceedings of the Royal Society B-Biological Sciences 277(1695): 2783–2792. doi.org/10.1098/rspb.2010.0462.
Deng, J.; Dong, W.; Socher, R.; Li, L.J.; Li, K.; Li, F.F.; IEEE. (2009). ImageNet: A Large-Scale Hierarchical Image Database. In: Cvpr: 2009 IEEE Conference on Computer Vision and Pattern Recognition, Vols 1–4, pp. 248–255.
Drap, P. (2012). Underwater Photogrammetry for Archaeology. In: Da Silva (Ed.), Special Applications for Photogrammetry, Chapter 6, pp. 111–136. https://www.intechopen.com/books/special-applications-of-photogrammetry/underwater-photogrammetry-for-archaeology.
Durden, J.M.; Bett, B.J.; Schoening, T.; Morris, K.J.; Nattkemper, T.W.; Ruhl, H.A. (2016). Comparison of image annotation data generated by multiple investigators for benthic ecology. Marine Ecology Progress Series 552: 61–70. doi.org/10.3354/meps11775.
Escartin, J.; Garcia, R.; Delaunoy, O.; Ferrer, J.; Gracias, N.; Elibol, A., . . . Renard, J. (2008). Globally aligned photomosaic of the Lucky Strike hydrothermal vent field (Mid-Atlantic Ridge, 37 degrees 18.50 ' N): Release of georeferenced data, mosaic construction, and viewing software. Geochemistry Geophysics Geosystems 9. doi.org/10.1029/2008gc002204.
Fosså, J.H.; Lindberg, B.; Christensen, O.; Lundälv, T.; Svellingen, I.; Mortensen, P.B.; Alvsvåg, J. (2005). Mapping of Lophelia reefs in Norway: experiences and survey methods. In: Freiwald, A.; Roberts, J.M. (eds). Cold-Water Corals and Ecosystems, pp. 359–391. Erlangen Earth Conference Series. Springer Berlin Heidelberg, Berlin.
Foster, S.D.; Hosack, G.R.; Hill, N.A.; Barrett, N.S.; Lucieer, V.L. (2014). Choosing between strategies for designing surveys: autonomous underwater vehicles. Methods in Ecology and Evolution 5(3): 287–297. doi.org/10.1111/2041-210x.12156.
Foster, S.D.; Hosack, G.R.; Monk, J.; Lawrence, E.; Barrett, N.S.; Williams, A.; Przeslawski, R. (2020). Spatially balanced designs for transect-based surveys. Methods in Ecology and Evolution. dx.doi.org/10.1111/2041-210x.13321
French, G.; Mackiewicz, M.; Fisher, M.; Holah, H.; Kilburn, R.; Campbell, N.; Needle, C. (2019). Deep neural networks for analysis of fisheries surveillance video and automated monitoring of fish discards. Ices Journal of Marine Science, fsz149, doi.org/10.1093/icesjms/fsz149.
Gomes-Pereira, J.N.; Auger, V.; Beisiegel, K.; Benjamin, R.; Bergmann, M.; Bowden, D., . . . Santos, R.S. (2016). Current and future trends in marine image annotation software. Progress in Oceanography 149: 106–120. doi.org/10.1016/j.pocean.2016.07.005.
Grassle, J.F.; Sanders, H.L.; Hessler, R.R.; Rowe, G.T.; McLellan, T. (1975). Pattern and zonation: a study of the bathyal megafauna using the research submersible Alvin. Deep Sea Research 22: 475–481.
Gray, J.S.; Dayton, P.; Thrush, S.; Kaiser, M.J. (2006). On effects of trawling, benthos and sampling design. Marine Pollution Bulletin 52(8): 840–843.
Gray, P.C.; Bierlich, K.C.; Mantell, S.A.; Friedlaender, A.S.; Goldboge, J.A.; Johnston, D.W. (2019a). Drones and convolutional neural networks facilitate automated and accurate cetacean species identification and photogrammetry. Methods in Ecology and Evolution 10(9): 1490–1500. doi.org/10.1111/2041-210x.13246.
Gray, P.C.; Fleishman, A.B.; Klein, D.J.; McKown, M.W.; Bezy, V.S.; Lohmann, K.J.; Johnston, D.W. (2019b). A convolutional neural network for detecting sea turtles in drone imagery. Methods in Ecology and Evolution 10(3): 345–355. doi.org/10.1111/2041-210x.13132.
Harvey, E.; Shortis, M. (1995). A system for stereo-video measurement of sub-tidal organisms. Marine Technology Society Journal 29(4): 10–22.
Henschke, N.; Bowden, D.A.; Everett, J.D.; Holmes, S.P.; Kloser, R.J.; Lee, R.W.; Suthers, I.M. (2013). Salp-falls in the Tasman Sea: a major food input to deep-sea benthos. Marine Ecology Progress Series 491: 165–175.

Fisheries New Zealand Best practice in seabed image analysis • 49
Hessler, R.R.; Smithey, W.M.; Keller, C.H. (1985). Spatial and temporal variation of giant clams, tube worms and mussels at deep-sea hydrothermal vents. Biological Society of Washington Bulletin 6: 411–428.
Hewitt, J.E.; Thrush, S.E.; Legendre, P.; Funnell, G.A.; Ellis, J.; Morrison, M. (2004). Mapping of marine soft-sediment communities: Integrated sampling for ecological interpretation. Ecological Applications 14(4): 1203–1216.
Hiddink, J.G.; Jennings, S.; Sciberras, M.; Szostek, C.L.; Hughes, K.M.; Ellis, N.; . . . Kaiser, M.J. (2017). Global analysis of depletion and recovery of seabed biota after bottom trawling disturbance. Proceedings of the National Academy of Sciences of the United States of America 114(31): 8301–8306. doi.org/10.1073/pnas.1618858114.
Hill, P. (2009). Designing a deep-towed camera vehicle using single conductor cable. Sea Technology 50(12): 49–51.
Horton, T.; Kroh, A.; Ahyong, S.; Bailly, N.; Boyko, C.B.; Brandão, S.N.; . . . Zhao, Z. (2019). World Register of Marine Species (WoRMS). WoRMS Editorial Board.
Howell, K.L.; Davies, J.S.; Allcock, A.L.; Braga-Henriques, A.; Buhl-Mortensen, P.; Carreiro-Silva, M.; . . . Wagner, D. (2020). A framework for the development of a global standardised marine taxon reference image database (SMarTaR-ID) to support image-based analyses. PLoS ONE 14(12): e0218904. dx.doi.org/10.1371/journal.pone.0218904
Huetten, E.; Greinert, J. (2008). Software controlled guidance, recording and post-processing of seafloor observations by ROV and other towed devices: the software package OFOP. Geophysical Research Abstracts 10: EGU2008-A-03088.
Jennings, S.; Kaiser, M.J. (1998). The effects of fishing on marine ecosystems. In: Blaxter, J.H.S.; Southward, A.J.; Tyler, P.A. (eds). Advances in Marine Biology, Vol 34, pp. 201–352. Advances in Marine Biology. Academic Press, London.
Krizhevsky, A.; Sutskever, I.; Hinton, G.E. (2012). ImageNet Classification with Deep Convolutional Neural Networks. Proceedings of the 25th International Conference on Neural Information Processing Systems: 1097–1105.
Langenkämper, D.; Zurowietz, M.; Schoening, T.; Nattkemper, T.W. (2017). BIIGLE 2.0 - Browsing and Annotating Large Marine Image Collections. Frontiers in Marine Science 4(83). doi.org/10.3389/fmars.2017.00083.
LeCun, Y.; Bengio, Y.; Hinton, G. (2015). Deep learning. Nature 521(7553): 436–444. doi.org/10.1038/nature14539.
Lutz, R.; Shank, T.; Rona, P.; Reed, A.; Allen, C.; Lange, W.; . . . Kristof, E. (2002). Recent advances in imaging deep-sea hydrothermal vents. Cahiers De Biologie Marine 43(3–4): 267–269.
MacDiarmid, A.; Bowden, D.; Cummings, V.; Morrison, M.; Jones, E.; Kelly, M., . . . Rowden, A. (2013). Sensitive Marine Benthic Habitats Defined. NIWA Client Report No. WLG2013-18 (report prepared for the New Zealand Ministry for the Environment). 72 p. https://www.mfe.govt.nz/sites/default/files/sensitive-marine-benthic-habitats-defined.pdf
Malde, K.; Handegard, N.O.; Eikvil, L.; Salberg, A.-B. (2019). Machine intelligence and the data-driven future of marine science. Ices Journal of Marine Science, fsz057, https://doi.org/10.1093/icesjms/fsz057.
Marsh, L.; Copley, J.T.; Huvenne, V.A.I.; Tyler, P.A.; the Isis ROV Facility. (2013). Getting the bigger picture: Using precision Remotely Operated Vehicle (ROV) videography to acquire high-definition mosaic images of newly discovered hydrothermal vents in the Southern Ocean. Deep Sea Research Part II: Topical Studies in Oceanography 92: 124–135. https://doi.org/10.1016/j.dsr2.2013.02.007.
Mitchell, A.; Coggan, R. (2007). Remote video techniques. In: Review of standards and protocols for seabed habitat mapping, pp. 179–203. Mapping European Seabed Habitats (MESH), https://www.emodnet-seabedhabitats.eu/media/1663/mesh_standards__protocols_2nd-edition_26-2-07.pdf

50 • Best practice in seabed image analysis Fisheries New Zealand
Mormede, S.; Dunn, A.; Hanchet, S.; Parker, S. (2014). Spatially explicit population dynamics models for Antarctic toothfish in the Ross Sea region. CCAMLR Science 21: 19–37.
Morris, K.J.; Bett, B.J.; Durden, J.M.; Huvenne, V.A.I.; Milligan, R.; Jones, D.O.B.; . . . Ruhl, H.A. (2014). A new method for ecological surveying of the abyss using autonomous underwater vehicle photography. Limnology and Oceanography: Methods 12: 795–809. http://dx.doi.org/10.4319/lom.2014.12.795.
Mortensen, P.B.; Buhl-Mortensen, L. (2005). Deep-water corals and their habitats in The Gully, a submarine canyon off Atlantic Canada. In: Freiwald, A.; Roberts, J.M. (eds). Cold-water Corals and Ecosystems, pp. 247–277. Springer-Verlag, Berlin Heidelberg.
Murphy, E.J.; Cavanagh, R.D.; Hofmann, E.E.; Hill, S.L.; Constable, A.J.; Costa, D.P.; . . . Doney, S.C. (2012). Developing integrated models of Southern Ocean food webs: Including ecological complexity, accounting for uncertainty and the importance of scale. Progress in Oceanography 102: 74–92. http://dx.doi.org/10.1016/j.pocean.2012.03.006.
O'Driscoll, R.L.; MacGibbon, D.; Fu, D.; Lyon, W.; Stevens, D. (2011). A review of hoki and middle-depths trawl surveys of the Chatham Rise, January 1992–2010. New Zealand Fisheries Assessment Report 2011/47. 72 p.
Olsen, A.M.; Westneat, M.W. (2015). StereoMorph: an R package for the collection of 3D landmarks and curves using a stereo camera set-up. Methods in Ecology and Evolution 6(3): 351–356. http://dx.doi.org/10.1111/2041-210x.12326.
Ontrup, J.; Ehnert, N.; Bergmann, M.; Nattkemper, T.W.; Ieee. (2009). Biigle - Web 2.0 enabled labelling and exploring of images from the Arctic deep-sea observatory HAUSGARTEN. In: Oceans 2009 – Europe Conference, Vols 1 and 2, p. 1197. Oceans-Ieee. IEEE.
Parker, S.J.; Penney, A.J.; Clark, M.R. (2009). Detection criteria for managing trawl impacts on vulnerable marine ecosystems in high seas fisheries of the South Pacific Ocean. Marine Ecology Progress Series 397: 309–317. http://dx.doi.org/10.3354/meps08115.
Perkins, N.R.; Hosack, G.R.; Foster, S.D.; Hill, N.A.; Barrett, N.S. (2019). Spatial properties of sessile benthic organisms and the design of repeat visual survey transects. Aquatic Conservation-Marine and Freshwater Ecosystems 29(1): 59–71. http://dx.doi.org/10.1002/aqc.2960.
Pilgrim, D.A.; Parry, D.M.; Jones, M.B.; Kendall, M.A. (2001). ROV image scaling with laser spot patterns. Journal of the Society for Underwater Technology 24(3): 93–103.
Pinkerton, M.H.; Bradford-Grieve, J.M.; Hanchet, S.M. (2010). A balanced model of the food web of the Ross Sea, Antarctica. CCAMLR Science 17: 1–31.
Pizarro, O.; Singh, H. (2003). Toward large-area mosaicing for underwater scientific applications. IEEE Journal of Oceanic Engineering 28(4): 651–672.
Ponzio, F.; Urgese, G.; Ficarra, E.; Di Cataldo, S. (2019). Dealing with Lack of Training Data for Convolutional Neural Networks: The Case of Digital Pathology. Electronics 8(3): 256.
Pratt, R.M. (1967). Photography of seamounts. In: Hersey, J.B. (ed.). Deep Sea Photography, pp. 145–158. The Johns Hopkins Oceanography Studies. Johns Hopkins Press, Baltimore.
Puig, P.; Canals, M.; Company, J.B.; Martin, J.; Amblas, D.; Lastras, G.; . . . Calafat, A.M. (2012). Ploughing the deep sea floor. Nature 489(7415): 286-290. dx.doi.org/10.1038/nature11410
Quinn, G.P.; Keough, M.J. (2002). Experimental design and data analysis for biologists. Cambridge, Cambridge University Press. 537 p.
Razavian, A.S.; Azizpour, H.; Sullivan, J.; Carlsson, S. (2014). "CNN Features Off-the-Shelf: An Astounding Baseline for Recognition." Pp. 512–519. Presented at the 2014 IEEE Conference on Computer Vision and Pattern Recognition Workshops, 23–28 June 2014. doi: 10.1109/CVPRW.2014.131.
Rees, A.J.J.; Yearsley, G.K.; Gowlett-Holmes, K.; Pogonoski, J. (2012). Codes for Australian Aquatic Biota (online version). CSIRO Marine and Atmospheric Research, World Wide Web electronic publication. http://www.cmar.csiro.au/caab.

Fisheries New Zealand Best practice in seabed image analysis • 51
Rice, A.L.; Angel, M.V.; Grassle, J.F.; Hargrave, B.; Hessler, R.R.; Horikoshi, M.; . . . Vinogradova, N. (1994). Suggested criteria for describing deep-sea benthic communities; the final report of SCOR Working Group 76. Progress in Oceanography 34(2–3): 81–100.
Rooper, C.N.; Hoff, G.R.; De Robertis, A. (2010). Assessing habitat utilization and rockfish (Sebastes spp.) biomass on an isolated rocky ridge using acoustics and stereo image analysis. Canadian Journal of Fisheries and Aquatic Sciences 67(10): 1658–1670. <http://dx.doi.org/10.1139/f10-088.
Rosenkranz, G.E.; Gallager, S.M.; Shepard, R.W.; Blakeslee, M. (2008). Development of a high-speed, megapixel benthic imaging system for coastal fisheries research in Alaska. Fisheries Research 92(2–3): 340–344. http://dx.doi.org/10.1016/j.fishres.2008.03.014.
Rowden, A.A.; Pearman, T.R.R.; Bowden, D.A.; Anderson, O.F.; Clark, M.R. (2020). Determining Coral Density Thresholds for Identifying Structurally Complex Vulnerable Marine Ecosystems in the Deep Sea. Frontiers in Marine Science 7(95). https://doi.org/10.3389/fmars.2020.00095.
Rowden, A.A.; Schlacher, T.A.; Williams, A.; Clark, M.R.; Stewart, R.; Althaus, F.; . . . Dowdney, J. (2010). A test of the seamount oasis hypothesis: seamounts support higher epibenthic megafaunal biomass than adjacent slopes. Marine Ecology 31: 95–106. http://dx.doi.org/10.1111/j.1439-0485.2010.00369.x.
Ryer, C.H.; Stoner, A.W.; Iseri, P.J.; Spencer, M.L. (2009). Effects of simulated underwater vehicle lighting on fish behavior. Marine Ecology Progress Series 391: 97–106. http://dx.doi.org/10.3354/meps08168.
Salman, A.; Jalal, A.; Shafait, F.; Mian, A.; Shortis, M.; Seager, J.; Harvey, E. (2016). Fish species classification in unconstrained underwater environments based on deep learning. Limnology and Oceanography - Methods 14(9): 570–585. http://dx.doi.org/10.1002/lom3.10113.
Schlining, B.M.; Stout, N.J. (2006). MBARI's video annotation and reference system. Oceans 2006 Vol 1–4: 1146–1150.
Schoening, T.; Osterloff, J.; Nattkemper, T.W. (2016). RecoMIA-Recommendations for Marine Image Annotation: Lessons Learned and Future Directions. Frontiers in Marine Science 3. http://dx.doi.org/10.3389/fmars.2016.00059.
Shortis, M.; Harvey, E.; Abdo, D. (2009). A review of underwater stereo-image measurement for marine biology and ecology applications. In: Gibson, R.N.; Atkinson, R.J.A.; Gordon, J.D.M. (eds). Oceanography and Marine Biology: An Annual Review, Vol 47, pp. 257–292.
Shortis, M.R.; Seager, J.W.; Williams, A.; Barker, B.A.; Sherlock, M. (2008). Using Stereo-Video for Deep Water Benthic Habitat Surveys. Marine Technology Society Journal 42(4): 28–37.
Siddiqui, S.A.; Salman, A.; Malik, M.I.; Shafait, F.; Mian, A.; Shortis, M.R.; Harvey, E.S. (2018). Automatic fish species classification in underwater videos: exploiting pre-trained deep neural network models to compensate for limited labelled data. Ices Journal of Marine Science 75(1): 374–389. http://dx.doi.org/10.1093/icesjms/fsx109.
Somerfield, P.J.; Clarke, K.R. (1995). Taxonomic levels in marine community studies revisited. Marine Ecology Progress Series 127(1–3): 113–119. http://dx.doi.org/10.3354/meps127113.
Stall, S.; Yarmey, L.; Cutcher-Gershenfeld, J.; Hanson, B.; Lehnert, K.; Nosek, B.; . . . Wyborn, L. (2019). Make all scientific data FAIR. Nature 570(7759): 27–29. http://dx.doi.org/10.1038/d41586-019-01720-7.
Stone, R.P. (2006). Coral habitat in the Aleutian Islands of Alaska: depth distribution, fine-scale species associations, and fisheries interactions. Coral Reefs 25(2): 229–238.
Teixido, N.; Garrabou, J.; Arntz, W.E. (2002). Spatial pattern quantification of Antarctic benthic communities using landscape indices. Marine Ecology Progress Series 242: 1–14.
Thrush, S.F.; Dayton, P.K. (2002). Disturbance to marine benthic habitats by trawling and dredging: Implications for marine biodiversity. Annual Review of Ecology and Systematics 33: 449–473.

52 • Best practice in seabed image analysis Fisheries New Zealand
Vandepitte, L.; Vanhoorne, B.; Decock, W.; Dekeyzer, S.; Verbeeck, A.; Bovit, L.; . . . Mees, J. (2015). How Aphia—The Platform behind Several Online and Taxonomically Oriented Databases—Can Serve Both the Taxonomic Community and the Field of Biodiversity Informatics. Journal of Marine Science and Engineering 3: 1448–1473. http://dx.doi.org/10.3390/jmse3041448.
Weiss, K.; Khoshgoftaar, T.M.; Wang, D. (2016). A survey of transfer learning. Journal of Big Data 3(1): 9. http://dx.doi.org/10.1186/s40537-016-0043-6.
Williams, A.; Schlacher, T.A.; Rowden, A.A.; Althaus, F.; Clark, M.R.; Bowden, D.A.; . . . Kloser, R.J. (2010a). Seamount megabenthic assemblages fail to recover from trawling impacts. Marine Ecology 31: 183–199. http://dx.doi.org/10.1111/j.1439-0485.2010.00385.x.
Williams, I.D.; Couch, C.S.; Beijbom, O.; Oliver, T.A.; Vargas-Angel, B.; Schumacher, B.D.; Brainard, R.E. (2019). Leveraging Automated Image Analysis Tools to Transform Our Capacity to Assess Status and Trends of Coral Reefs. Frontiers in Marine Science 6(222). http://dx.doi.org/10.3389/fmars.2019.00222.
Williams, K.; Rooper, C.N.; Towler, R. (2010b). Use of stereo camera systems for assessment of rockfish abundance in untrawlable areas and for recording pollock behavior during midwater trawls. Fishery Bulletin 108(3): 352–362.
Wood, G.; Lynch, T.P.; Devine, C.; Keller, K.; Figueira, W. (2016). High-resolution photo-mosaic time-series imagery for monitoring human use of an artificial reef. Ecology and Evolution 6(19): 6963–6968. http://dx.doi.org/10.1002/ece3.2342.
Zintzen, V.; Anderson, M.J.; Roberts, C.D.; Harvey, E.S.; Stewart, A.L. (2017). Effects of latitude and depth on the beta diversity of New Zealand fish communities. Scientific Reports 7. http://dx.doi.org/10.1038/s41598-017-08427-7.
Zintzen, V.; Anderson, M.J.; Roberts, C.D.; Harvey, E.S.; Stewart, A.L.; Struthers, C.D. (2012). Diversity and Composition of Demersal Fishes along a Depth Gradient Assessed by Baited Remote Underwater Stereo-Video. PLoS ONE 7(10). http://dx.doi.org/10.1371/journal.pone.0048522.
Zurowietz, M.; Langenkämper, D.; Hosking, B.; Ruhl, H.A.; Nattkemper, T.W. (2018). MAIA—A machine learning assisted image annotation method for environmental monitoring and exploration. PLoS ONE 13(11): e0207498. http://dx.doi.org/10.1371/journal.pone.0207498.

Fisheries New Zealand Best practice in seabed image analysis • 53
APPENDIX 1: MARINE IMAGING WORKSHOP 2019
Titles, Abstracts, and notes for selected talks at the Marine Imaging Workshop (MIW) 2019; chosen for their relevance to the New Zealand situation. MBARI's Experiences Collecting and Managing Digital Video Brian Schlining, Nancy Jacobsen Stout, Lonny Lundsten, Kyra Schlining, Linda Kuhnz, Susan von Thun Abstract: The Monterey Bay Aquarium Research Institute (MBARI) has been recording and archiving underwater video from remotely operated vehicles since 1985. In 2017, MBARI switched from recording video onto video tape to recording digital files onto hard drives. To date, MBARI has over 45,000 individual video assets, of which more than 14,000 are digital video files. This video has been managed and annotated using MBARI’s Video Annotation and Reference System (VARS). The tenants of VARS--using a controlled vocabulary and a centralized archive of annotations--have proven extremely effective for generating quantitative and qualitative information from images and video. Over 400 peer-reviewed publications have been written using data from VARS. During our transition to digital video files, we learned a series of lessons and best practices for recording, archiving, managing and disseminating digital video. This presentation will focus on how we’ve implemented these best practices and the tools MBARI has developed for managing digital video. In addition, we will present challenges and opportunities due to the emergence of machine learning and 4K video.
• Notes: MBARI are, arguably, the most experienced and well-organised institution in the world in terms of acquisition of seabed imagery and subsequent extraction and management of data.

54 • Best practice in seabed image analysis Fisheries New Zealand
A framework for the enhancement of low-lighting underwater images Tunai Porto Marques1, Alexandra Branzan Albu1, Maia Hoeberechts2 1 Department of Electrical & Computer Engineering, University of Victoria, Victoria, BC V8P3E6, Canada
2 Ocean Networks Canada and Department of Computer Science, University of Victoria, Victoria, BC V8N1V8, Canada
Abstract: Underwater images often suffer from suboptimal illumination because of a lack of natural lighting, shadow regions, turbidity, and other inherent characteristics of the underwater environment. In the deep ocean, artificial lighting sources that provide non-uniform illumination and are prone to failure are frequently used in these scenes. Low-lighting images acquired under such conditions are difficult to analyze (both by human experts and by automatic approaches) since they suffer from variable contrast and might exhibit a low signal-to-noise ratio. We propose an automated framework for enhancing the lighting levels of underwater images by increasing the number of visible, meaningful features. Our method is inspired from a single-image dehazing approach that was initially proposed for aerial images. We consider local contrast information and offer a solution that addresses three common dehazing artifacts: oversaturation of colours, lack of scale-invariance and creation of halos around strong gradients. Given that dark regions in underwater images present the same visual properties as haze in their inverted versions, the proposed framework relies on inverting the input image, removing its haze using a contrast-guided approach, and applying a second inversion. A novel low-lighting underwater image dataset, OceanDark, was created using data from Ocean Networks Canada to evaluate the proposed method with underwater images captured using artificial lighting sources. Experimental results show that our contrast-guided approach can significantly improve the quality of low-lighting underwater images without creating undesired dehazing artifacts.
• Notes: In part, this work is developing tools to fix things that should/could be avoided at the imaging system design phase by matching light fields to fields of view.
Fisheries New Zealand Best practice in seabed image analysis • 55
Current and future value from towed camera image data Alan Williams1, Pamela Brodie1, Scott Foster1, Franzis Althaus1, Rachel Przeslawski2, Thomas Schlacher3, Nic Bax1
1 Commonwealth Scientific and Industrial Research Institute, Australia 2 Geoscience Australia
3 University of the Sunshine Coast, Australia
Abstract: We recently made a collection of deep-sea (500-2000 m depths) towed-camera image data that has high current value: it comprises HD video and calibrated stereo still images along 140 transects with a combined length of ~250 km; camera tows successfully navigated the most extreme seamount topography and rugged continental slope; resultant data have statistically robust properties because of rigorous survey design, and collection along straight lines at constant speed and height off the bottom; and analysis products will address a number of research objectives relevant to understanding deep-sea biodiversity distributions, anthropogenic impacts, community recovery, and management for fishery and conservation goals. However, a challenge with such datasets is to ensure they have future value – by making them discoverable, accessible and useable by other researchers and managers. A recent Australian (Marine Biodiversity Hub) workshop provided an opportunity for researchers to summarise national-scale patterns and progress in discoverability and accessibility of image data. Substantial progress was revealed in many respects, but there were also major challenges related to digital imagery platforms for data storage, annotation, and visualisation. The workshop also identified towed camera-derived data as having the least mature workflows, little discoverability and poor accessibility compared to data from several other photographic platforms – despite the relatively high ease-of-use and cost-effectiveness of towed cameras, particularly in deep-sea environments. We outline our plans to make towed camera data meet the FAIR (findable, accessible, interoperable, reusable) principles, with examples on how this will be achieved (technically), against national and international imperatives (need), and by identifying future opportunities (e.g. Oceans Best Practices portal). This workshop is an opportunity to develop an initiative to promote archiving, use and re-use of towed camera imagery globally.
• Notes: Important points about accessibility of imagery and metadata. In New Zealand the same issues are present and it is important that there is investment in the data-management infrastructure to make the seabed imagery more discoverable and useable.

56 • Best practice in seabed image analysis Fisheries New Zealand
Image annotation at sea using VARS: management processes to ensure high data quality Chris Jackett, Nick Mortimer, Brian Schlining, Franzis Althaus, Pamela Brodie, Alan Williams Abstract: During a recent voyage to survey the deep-sea coral communities of the southern Tasmanian seamounts, large volumes of still image and video data were collected using a towed stereo-camera system. To enable video annotations to be made at sea, we designed and developed data management procedures to integrate the data after appropriate processing stages were applied. Initial on-board data analysis steps provided immediate insight into the captured data and could inform the data acquisition strategy. The Video Annotation and Referencing System (VARS) software platform was used for its powerful video annotation capabilities, and a range of custom procedures were developed to facilitate the workflow of image data into VARS. This included mechanisms to query the recorded data for a range of metadata and file attributes, interacting with the VARS web services using its standardised RESTful application programming interface, and cross-referencing with the VARS video asset catalog to maintain media synchronisation. The combination of these techniques resulted in a streamlined process, providing researchers with an operational system to record biological and geological observations in near real-time. This presentation will focus on the data management procedures used to achieve at-sea annotations for acquired imagery. It will also outline a number of best-practices to mitigate risks in data collection and maintain high data quality.
• Notes: Fine words but in practice, workflow on RV Investigator appears to be somewhat less efficient than that aboard RV Tangaroa.
Fisheries New Zealand Best practice in seabed image analysis • 57
Analysing a large international collection of seafloor imagery for mapping Antarctic marine biodiversity: Challenges, ideas and opportunities Jan Jansen, Nicole Hill, Craig Johnson Abstract: The Antarctic seafloor contains unique and highly diverse species communities. While the conservation value of seafloor communities around Antarctica is well recognised, the distribution of this biodiversity is largely unknown because observations are so sparse. We’ve recently gathered a unique collection of seafloor images from all around Antarctica and will use these data to map the distribution of seafloor biodiversity on the entire Antarctic continental shelf for the first time. During the next 18 months, we aim to annotate 10000+ images containing ~100 or more types of animals as accurate, consistent and fast as possible. For each individual image we will score which broad types of animals it contains based on the CATAMI classification, how many individuals of each animal-type there are and how much area they cover (in % of the image). In my talk, I will present an outline of our main research project, the challenges we face in our analysis and how we will address them, and what ideas and opportunities arise from our project. Challenges include the sheer number of images that originate from different platforms, different voyages and different research programs, with images taken at different distances and angles to the seafloor. I will show how we select an optimal subset of images that contains the largest amount of information for the smallest amount of work. Further, we aim to make our dataset as useful as possible beyond our own project, meaning we will annotate all our images in a way so they can be used to train deep-learning algorithms for the automated classification of seafloor fauna. We’re actively seeking collaborations with other research groups to increase the size of this training database, a critical step for future automation of image annotation.
• Notes: This project is highly relevant here because it demonstrates the potential for using seabed imagery from disparate research programmes to inform continental-scale analyses, while drawing attention to some of the impediments to doing such analyses that currently exist, including issues with: differing imaging system configurations and resolutions; accessibility of imagery; incompatibility of annotation schemes.

58 • Best practice in seabed image analysis Fisheries New Zealand
How many jelly beans in the jar? Optimisation of observer-based image annotation methods Henk van Rein, Hayley Hinchen, Karen Webb Joint Nature Conservation Committee
Abstract: Numerous observation-based methods of image-annotation are available to extract benthic community data from still imagery acquired by towed camera systems. However, no clear guidance exists on which methods are better suited for different purposes, including the monitoring of temperate rocky reef assemblages. To explore the efficacy of six different image-annotation methods, an experienced analyst extracted data from 100 still images, collected from a temperate rocky reef in the UK, using each image-annotation method in random order. The methods applied were ‘abundance counts’, ‘percentage cover’, ‘point intercept’, ‘frequency of occurrence’ grids (5x5 and 10x10 cell grids) and a qualitative abundance scale: the ‘SACFOR scale’. Various data analysis metrics were used to compare the data extracted by the different methods: efficiency (time), precision, statistical power, community impression, taxonomic richness and taxonomic accumulation. An additional secondary study had six different analysts, three senior and three junior-level, annotate a subset of 20 still images to investigate observer consistency. Results show that there were large differences in the consistency of taxonomic identification between the observers. In general terms, SACFOR and 5x5 frequency of occurrence grids were the most efficient methods at sampling a whole community. Power analysis estimates these methods also require the least number of samples to detect a 20% change in the majority of taxa with a power of 0.8. Conversely, SACFOR data are the most variable between the six observers of all the methods, while the 10x10 frequency of occurrence grids are the least variable (most consistent). Further analysis of the image-annotation method data is likely to show that not one method outperforms the others but perhaps a blend or optimised approach may be recommended going forward for the monitoring of temperate rocky reef assemblages using human analysts. Email: [email protected]
• Notes: A useful study but it appears to be incomplete or inconclusive, with the clearest finding being that there were large differences among analysts.

Fisheries New Zealand Best practice in seabed image analysis • 59
Being random and efficient: designing a flexible spatially-balanced imagery survey Scott Foster1, Alan Williams1, Thomas Schlacher2, Malcolm Clark3, Jan Jansen4, Franzis Althaus1, Nic Bax1
1 Commonwealth Scientific and Industrial Research Institute, Australia
2 University of the Sunshine Coast, Australia
3 National Institute of Water and Atmospheric Research, New Zealand 4 University of Tasmania
Abstract: The pivotal importance of reliable data is common for all scientific disciplines - ecology is no exception. In ecology, surveys provide our data and so the manner that surveys are performed determines the quality of the data and research. Often considered the minimal standard, randomised surveys satisfy statistical rigour as randomisation provides the critical link between the sample and the population that it was sampled from. Naive randomisation can, however, be both inefficient and impractical as too many sites that provide little information to the survey’s objectives tend to be sampled. We recently undertook a large towed-camera survey (~4 weeks with ~40 scientists) of the composition and distribution of megabenthos communities associated with habitats formed by the stony coral Solenosmilia variabilis, primarily on seamounts. Based on a pre-existing knowledge of general patterns in faunal distribution, and with detailed maps of seabed topography, we designed an efficient spatially-balanced randomised survey that targeted areas where environmental conditions were likely to be ‘marginal’ or ‘good’ for coral communities. This enabled us to sample areas that are more informative to the survey’s objectives with higher probability. Arriving at ‘sensible’ criteria to define sampling (‘inclusion’) probabilities, is challenging; we addressed this by using expert knowledge to define desirable seafloor features (depth ranges and seabed roughness). The design process we undertook was iterative and involved repeated adjustment of the relationship between the environmental covariates and the inclusion probabilities. Whilst at sea, weather conditions, and steaming time can constrain ‘ideal’ spatial solutions, calling for a degree of flexibility – we solved this by having pre-planned ‘contingency strategies’ built into the design that can be applied on-the-fly. These strategies should maintain the important aspects of the design. Experience of this design strategy demonstrates its fundamental value (in a real-life application) resulting in spatially-explicit models of coral habitat selection. Email: [email protected]
• Notes: This talk covers many aspects of survey design that NIWA already considers when planning photographic surveys. Scott has taken this further, however, with advocacy of ‘spatially-balanced’ transect placement and development of an R package for survey design (MBHdesign).

60 • Best practice in seabed image analysis Fisheries New Zealand
Time, technology, and perception: case studies combining seabed photographic survey data across surveys and years to address science and management questions in New Zealand David Bowden1, Malcolm Clark1, Ashley Rowden1+2, Owen Anderson1, Rob Stewart1, Alan Hart1, Caroline Chin1, Niki Davey1
1 National Institute of Water & Atmospheric Research, New Zealand
2 Victoria University of Wellington, New Zealand
Abstract: An important characteristic of photographic survey methods in seabed ecological research is that they are non-destructive. This affords the potential for combining data from multiple surveys to build time-series to assess temporal change, or to increase the spatial density of data across large study areas. In practice, however, compilation of such data-sets is complicated by several issues, including: changes in the optical acuity of imaging systems with time as new technologies are adopted; changes in the taxonomic resolution of identifications as knowledge of the ecosystem improves; differences among analysts in the way identifications are applied, and changes in the navigational accuracy with which image locations are recorded. Here, we discuss two case studies from Chatham Rise, New Zealand, in which data from multiple seabed photographic surveys have been combined to address research questions prompted by the requirements for ecosystem-based management of trawl fisheries. The aim of the first study was to assess recovery of benthic fauna following partial closure of a trawl fishery on a group of small seamounts by combining data from towed camera still image transects collected over four surveys spanning 15 years. The aim of the second study was to improve confidence in broad-scale species-distribution models of Chatham Rise by combining data from towed camera video transects collected over five surveys spanning ten years. Our experience with these studies highlights both the value of approaches that combine data across surveys for addressing research and management questions, and the practical and interpretive issues associated with them. Email: [email protected]

Fisheries New Zealand Best practice in seabed image analysis • 61
APPENDIX 2: FEATURE COMPARISON TABLE FOR THREE WEB-BASED IMAGE ANNOTATION TOOLS Table 2.1: Feature comparison table for three web-based image annotation tools evaluated as part of project BEN2018-03.
Acronym Name Pros Cons BIIGLE Bio-Image
Indexing, Graphical Labelling and Exploration
• Ability to share annotations between analysts for review
• Database storage • Free (requires sign-up) • Has additional
features/tools to groom annotation data (e.g. Volume label review, label review grid overview, lawnmower mode, etc.)
• Machine learning capabilities
• Video analysis tool currently in development
• Good support • Web-based
• Instructions are thorough but not easy to follow at times
• Images must be accessed via web-server (i.e., locally-stored images cannot be used)
CoralNet CORALNET: A web solution for coral reef analysis
• Can upload images onto site
• Dataset storage • Free (requires sign-up) • Machine learning
capabilities • Thorough instructions with
video tutorials • Web-based
• Strongly geared towards shallow water coral reef studies
• Annotation labels are abbreviated (e.g. Bleached Montipora Tabulate = BlMontTbl)
• Not intuitive to use; the user needs to go through the tutorials to use the tool
• Takes a long time to prepare image set up before analysis
Squidle+ SQUIDLE: a
centralised web-based framework for management, exploration and annotation of marine imagery
• Ability to share annotations between analysts for review
• Database storage • Free (requires sign-up) • Machine learning
capabilities • Web-based
• CATAMI-oriented labels • Lack of instructions • Minimal support • Unable to easily upload images
(needs remote access to an image repository)