Discriminating risk and resilience endophenotypes from lifetime illness effects in familial major...
13
Copyright 2013 American Medical Association. All rights reserved. Discriminating Risk and Resilience Endophenotypes From Lifetime Illness Effects in Familial Major Depressive Disorder Bradley S. Peterson, MD; Zhishun Wang, PhD; Guillermo Horga, MD; Virginia Warner, DrPH; Bret Rutherford, MD; Kristin W. Klahr, MS; Barbara Graniello, MS; Priya Wickramaratne, PhD; Felix Garcia, MS; Shan Yu, PhD; Xuejun Hao, PhD; Phillip B. Adams, PhD; Ming Qian, MS; Jun Liu, PhD; Andrew Gerber, MD, PhD; Myrna M. Weissman, PhD IMPORTANCE The neural systems that confer risk or vulnerability for developing familial depression, and those that protect against or confer resilience to becoming ill, can be disentangled from the effects of prior illness by comparing brain imaging measures in previously ill and never ill persons who have either a high or low familial risk for depression. OBJECTIVE To distinguish risk and resilience endophenotypes for major depression from the effects of prior lifetime illness. DESIGN, SETTING, AND PARTICIPANTS We used functional magnetic resonance imaging to measure and compare brain function during performance of an attentional, self-regulatory task across a large sample of multigenerational families ascertained specifically to be at either high or low risk for developing major depression. Study procedures were performed in a university setting. A total of 143 community participants were followed up prospectively for more than 20 years in a university setting. The sample was enriched with persons who were at higher or lower familial risk for developing depression based on being biological offspring of either a clinical sample of persons with major depression or a community control sample of persons with no discernible lifetime illness. MAIN OUTCOMES AND MEASURES Task-related change in blood oxygen level–dependent functional magnetic resonance imaging signal. RESULTS A risk endophenotype included greater activation of cortical attention circuits. A resilience endophenotype included greater activation of the dorsal anterior cingulate cortex. The effects of prior lifetime illness were common to both risk groups and included greater deactivation of default-mode circuits. CONCLUSIONS AND RELEVANCE These findings identify neural systems that increase risk for depression, those that protect from illness, and those that endure following illness onset, and they suggest circuits to target for developing novel preventive and therapeutic interventions. JAMA Psychiatry. doi:10.1001/jamapsychiatry.2013.4048 Published online December 25, 2013. Related article Supplemental content at jamapsychiatry.com Author Affiliations: Columbia College of Physicians and Surgeons, and New York State Psychiatric Institute, New York. Corresponding Author: Bradley S. Peterson, MD, Columbia College of Physicians and Surgeons, and New York State Psychiatric Institute, 1051 Riverside Dr, Unit 74, New York, NY 10032 ([email protected]). Research Original Investigation E1 Copyright 2013 American Medical Association. All rights reserved. Downloaded From: http://archpsyc.jamanetwork.com/ by a Columbia University User on 12/31/2013
-
Upload
independent -
Category
Documents
-
view
0 -
download
0
Transcript of Discriminating risk and resilience endophenotypes from lifetime illness effects in familial major...

Copyright 2013 American Medical Association. All rights reserved.
Discriminating Risk and Resilience EndophenotypesFrom Lifetime Illness Effectsin Familial Major Depressive DisorderBradley S. Peterson, MD; Zhishun Wang, PhD; Guillermo Horga, MD; Virginia Warner, DrPH; Bret Rutherford, MD;Kristin W. Klahr, MS; Barbara Graniello, MS; Priya Wickramaratne, PhD; Felix Garcia, MS; Shan Yu, PhD;Xuejun Hao, PhD; Phillip B. Adams, PhD; Ming Qian, MS; Jun Liu, PhD; Andrew Gerber, MD, PhD;Myrna M. Weissman, PhD
IMPORTANCE The neural systems that confer risk or vulnerability for developing familialdepression, and those that protect against or confer resilience to becoming ill, can bedisentangled from the effects of prior illness by comparing brain imaging measures inpreviously ill and never ill persons who have either a high or low familial risk for depression.
OBJECTIVE To distinguish risk and resilience endophenotypes for major depression from theeffects of prior lifetime illness.
DESIGN, SETTING, AND PARTICIPANTS We used functional magnetic resonance imaging tomeasure and compare brain function during performance of an attentional, self-regulatorytask across a large sample of multigenerational families ascertained specifically to be at eitherhigh or low risk for developing major depression. Study procedures were performed in auniversity setting. A total of 143 community participants were followed up prospectively formore than 20 years in a university setting. The sample was enriched with persons who wereat higher or lower familial risk for developing depression based on being biological offspringof either a clinical sample of persons with major depression or a community control sample ofpersons with no discernible lifetime illness.
MAIN OUTCOMES AND MEASURES Task-related change in blood oxygen level–dependentfunctional magnetic resonance imaging signal.
RESULTS A risk endophenotype included greater activation of cortical attention circuits. Aresilience endophenotype included greater activation of the dorsal anterior cingulate cortex.The effects of prior lifetime illness were common to both risk groups and included greaterdeactivation of default-mode circuits.
CONCLUSIONS AND RELEVANCE These findings identify neural systems that increase risk fordepression, those that protect from illness, and those that endure following illness onset, andthey suggest circuits to target for developing novel preventive and therapeutic interventions.
JAMA Psychiatry. doi:10.1001/jamapsychiatry.2013.4048Published online December 25, 2013.
Related article
Supplemental content atjamapsychiatry.com
Author Affiliations: ColumbiaCollege of Physicians and Surgeons,and New York State PsychiatricInstitute, New York.
Corresponding Author: Bradley S.Peterson, MD, Columbia College ofPhysicians and Surgeons, and NewYork State Psychiatric Institute,1051 Riverside Dr, Unit 74,New York, NY 10032([email protected]).
Research
Original Investigation
E1
Copyright 2013 American Medical Association. All rights reserved.
Downloaded From: http://archpsyc.jamanetwork.com/ by a Columbia University User on 12/31/2013

Copyright 2013 American Medical Association. All rights reserved.
M ajor depressive disorder (MDD), one of the most preva-lent and debilitating illnesses in the world,1-3 is fre-quently transmitted across family generations.4-6 Off-
spring of persons with MDD have a 3- to 5-fold increased lifetimeriskfordevelopingMDD,yieldingheritabilityestimatesthatrangefrom 40% to 70%.7,8 Familial MDD is more severe, more recur-rent, and more resistant to treatment than nonfamilial MDD,9-13
and it tends to have an earlier age at onset that usually beginsbetween 15 and 25 years. On average, it presents earlier in fe-male than male family members, and it is often heralded by ananxiety disorder in childhood.14-16
An endophenotype is a measurable entity, unseen by thenaked eye, lying along the causal chain that leads from vulner-ability genes and epigenetic determinants to their overt physi-cal and behavioral manifestations. Brain-based endopheno-types that confer risk of developing MDD or that protect againstit are important to identify because they would help in devel-oping new and more individualized treatment and preven-tion programs for MDD.17 One set of operational criteria previ-ously proposed to identify risk endophenotypes have includedshowing that the putative endophenotype is (1) associated withan illness in the general population, (2) familial, (3) state-independent, and (4) found in unaffected family members ofill persons at a higher rate than in the general population.18
These criteria require that endophenotypes be sought and dem-onstrated in multigeneration populations at high or low famil-ial risk for illness, including individuals who have a lifetime his-tory of illness and those who have never been ill.
In a large, multigenerational family study of persons as-certained specifically to be either at high risk (HR) or low risk(LR) for developing MDD, we have adapted these same gen-eral criteria to identify functional brain endophenotypes thatconferred either risk or resilience for MDD and that were dis-tinct from the state effects of illness. (1) Risk endophenotypeshave been defined as brain activations present significantlymore in the HR group, in both those who did and those whodid not have a lifetime history of illness (with illness includ-ing either prior MDD or anxiety disorder), compared with theLR group. (2) Resilience endophenotypes conceptually shouldbe present significantly more often in HR individuals who haveescaped illness19 and should be distinguishable from simplehealth competence that characterizes LR individuals who havenever been ill.20 We therefore have defined resilience endo-phenotypes to be brain activations that are more prominentin HR individuals who have never been ill than in LR individu-als who have never been ill and that do not contain portionsof the risk endophenotype of the HR group. (3) Effects of life-time illness have been defined as brain activations manifest-ing significantly more in persons with a lifetime history of MDDor anxiety than in persons without a lifetime history of ill-ness, regardless of familial risk status.
We previously identified, in 131 participants from our cur-rent sample, a morphological risk endophenotype for MDD thatcomprised thinning of the cortex of the lateral aspect of theright hemisphere and the mesial wall of the left hemisphere.21
Its endophenotype status was supported by its presence in HRparticipants regardless of whether they had ever been ill withMDD or anxiety disorder. Individuals who had the endophe-
notype, but who had never been ill, experienced inattentionin proportion to the magnitude of cortical thinning, and fur-ther analyses suggested that inattention mediated the rela-tionship of the endophenotype with the risk for developingMDD. Accordingly, in the present study, we used a functionalmagnetic resonance imaging (fMRI) task that activatednetworks subserving attention in particular22 and self-regulatory capacities more generally (eAppendix 1 in theSupplement),23 given the importance that impaired regula-tory control of emotion and cognition is thought to have in thegenesis of MDD,24-26 and given evidence that shared neural re-sources likely regulate both cognition and emotion.23
We hypothesized that greater activation in the dorsal andpregenual anterior cingulate cortex during the resolution of cog-nitive interference and deployment of self-regulatorycapacities27,28 would confer resilience to developing MDD in HRpersons, whereas reduced activation of these regions would pro-duce more illness in those at risk29 and would be identified as alifetime illness effect. Because the cortical thinning endophe-notype has been shown to reduce cortical attentional reserve,21
we also hypothesized that the functional MRI risk endopheno-type for MDD would include greater activation of frontal, pari-etal, and temporal cortices to compensate for attentional prob-lems and would maintain normal behavioral performance on thisattentional task. We also assessed the risk, resilience, and ill-ness effects in error-related activity. This activity, which is usu-ally greater in the anterior cingulate cortex when responding in-correctly than when responding correctly to stimuli that generatecognitive interference, supports heightened performance moni-toring and stronger biasing of lower-order processing followingerrors, thereby improving subsequent task performance.30,31 Wehypothesized that error-related activity would be associated withrisk, resilience, and prior illness in ways similar to interference-related activity.
MethodsFurther details on the ascertainment and characterization ofthe sample of participants, the theoretical underpinnings ofthe fMRI task, the pulse sequences, the image processing tech-niques, and statistical the analyses are provided in eAppen-dix 1 in the Supplement.
All study procedures were approved by the institutionalreview boards of Yale University in New Haven, Connecticut,and the New York State Psychiatric Institute in New York. Par-ticipants provided written, informed consent to participate;for minors, parents provided informed consent, and partici-pants provided written assent to participate.
ParticipantsWe obtained usable fMRI scans from 143 individuals 7 to 54years age who belonged to the second or third generation of a3-generation cohort followed through 5 waves of clinical as-sessments over more than 20 years, thereby ensuring an ex-cellent, prospectively acquired knowledge of the psychiatrichistory of all participants (Table 1).4 The first generation (“G1”)comprised 2 groups of adults: one group of adults who were
Research Original Investigation Familial Major Depressive Disorder
E2 JAMA Psychiatry Published online December 25, 2013 jamapsychiatry.com
Copyright 2013 American Medical Association. All rights reserved.
Downloaded From: http://archpsyc.jamanetwork.com/ by a Columbia University User on 12/31/2013

Copyright 2013 American Medical Association. All rights reserved.
clinically ascertained during treatment of moderate to se-vere, recurrent, and functionally debilitating MDD and an-other group of matched control adults from the same commu-nity who had no discernible lifetime history of depression orother psychiatric illness. The second generation (“G2”) com-prised the biological offspring of G1, and the third generation(“G3”) comprised the offspring of G2. The HR group, definedas those in G2 or G3 who were biological descendants of thepatient group in G1, contained 83 individuals (14 children, de-fined as younger than 18 years of age, and 69 adults). The LRgroup, defined as those in G2 or G3 who were biological de-scendants of the control sample in G1, contained 60 individu-als (26 children and 34 adults). None of the participants had alifetime history of bipolar disorder.
DiagnosesThe diagnostic interviews across all waves4 were conductedusing a semistructured diagnostic instrument (the Schedulefor Affective Disorders and Schizophrenia–Lifetime Version foradults, and the child version of the instrument that was modi-fied for DSM-IV for participants 6-17 years of age). In waves 4and 5, the Schedule for Affective Disorders and Schizophrenia–Present and Lifetime Version for Children was used initially andupdated for revisions of diagnostic classification.
fMRI TaskVisual stimuli were presented through MRI-compatible goggles(Resonance Technologies, Inc). Participants who were near-sighted were fitted with corrective lenses so that they could view
Table 1. Demographic and Clinical Characteristics
Characteristic
All LRPartici-pants
(n = 60)
All HRPartici-pants
(n = 83) StatisticP
Value
No MDD or AnxietyDisorder
StatisticP
Value
Lifetime MDD or AnxietyDisorder
StatisticP
Value
LRPartici-pants
(n = 37)
HRPartici-pants
(n = 22)
LRPartici-pants
(n = 23)
HRPartici-pants
(n = 61)Age, mean(SD), y
25.7(13.2)
33.1(12.7)
t141 = 3.4 .001 23.5(13.2)
26.9(15.7)
t57 = 0.88 .38 29.3(12.6)
35.4(10.7)
t82 = 2.22 .03
z Score,amean (SD)
Depressionseverity
−0.11(0.76)
(n = 54)
0.08(1.14)
(n = 72)
t124 = 1.04 .30 −0.32(0.47)
(n = 32)
−0.41(0.92)
(n = 17)
t47 = −0.50 .62 0.20(0.98)
(n = 22)
0.23(1.16)
(n = 55)
t75 = 0.11 .92
Anxietyseverity
−0.10(1.12)
(n = 53)
0.07(0.89)
(n = 72)
t123 = 0.96 .34 −0.39(0.76)
(n = 31)
−0.13(0.84)
(n = 17)
t46 = 1.06 .30 0.30(1.42)
(n = 22)
0.14(0.91)
(n = 55)
t75 = −0.61 .54
ADHD severityscore,bmean (SD)
6.4(5.8)
(n = 53)
11.1(7.7)
(n = 74)
t125 = 3.7 .003 6.5(5.5)
(n = 32)
9.35(7.89)
(n = 20)
t50 = 1.55 .07 6.4(6.3)
(n = 21)
11.1(7.7)
(n = 54)
t73 = 2.83 .006
GAS score,mean (SD)
80.4(7.8)
(n = 60)
76.4(9.6)
(n = 79)
t137 = −2.59 .01 81.9(6.8)
(n = 37)
85.7(4.3)
(n = 20)
t55 = 2.28 .03 77.9(8.8)
(n = 23)
73.2(8.8)
(n = 59)
t80 = 2.13 .04
Sex, No.
Female 34 46χ2
1 = 0.02 .8817 6
χ21 = 2.02 .16
17 40χ2
1 = 0.53 .47Male 26 37 20 16 6 21
Generation, No.
Second 26 58χ2
1 = 10.1 .00214 11
χ21 = 0.83 .36
12 47χ2
1 = 4.94 .03Third 34 25 23 11 11 14
Age >18 y, No. 34 69 χ21 = 12.1 <.001 15 13 χ2
1 = 1.90 .17 19 56 χ21 = 1.48 .22
LifetimeMDD, No.
12 47 χ21 = 19.3 <.001 0 0 NA NA 12 47 χ2
1 = 4.94 .03
CurrentMDD, No.
0 1 χ21 = 0.73 .39 0 0 NA NA 0 1 χ2
1 = 0.38 .53
Lifetimeanxietydisorder, No.
18 44 χ21 = 7.5 .006 0 0 NA NA 18 44 χ2
1 = 0.32 .57
Current anxietydisorder, No.
4 6 χ21 = 0.017 .90 0 0 NA NA 4 6 χ2
1 = 0.91 .34
LifetimeADHD, No.
3(n = 52)
14(n = 75)
χ21 = 4.41 .04 2
(n = 31)4
(n = 20)χ2
1 = 2.14 .14 1(n = 21)
10(n = 55)
χ21 = 2.21 .14
Abbreviations: ADHD, attention-deficit/hyperactivity disorder; GAS, GlobalAdjustment Scale; HR, high-risk; LR, low-risk; MDD, major depressive disorder;NA, not available.a We constructed an index of the severity of either depressive or anxiety
symptoms across children and adults for use in correlation analyses byconverting the respective measure in each age group into a z score for eachparticipant and then combining those z scores across age groups into a single
variable for each symptom domain. Thus, the z score for depression severitywas constructed using z scores from the Children's Depression RatingScale–Revised and the Hamilton Scale for Depression, and the z score foranxiety severity was constructed using z scores from the Revised Children'sManifest Anxiety Scale and the Hamilton Scale for Anxiety.
b Total score on the DuPaul-Barkley Rating Scale.
Familial Major Depressive Disorder Original Investigation Research
jamapsychiatry.com JAMA Psychiatry Published online December 25, 2013 E3
Copyright 2013 American Medical Association. All rights reserved.
Downloaded From: http://archpsyc.jamanetwork.com/ by a Columbia University User on 12/31/2013

Copyright 2013 American Medical Association. All rights reserved.
the screen clearly. A series of white arrows pointing either leftor right and subtending 1° vertical and 4° horizontal of the vi-sual field were displayed against a black background either tothe left or to the right of white gaze fixation crosshairs posi-tioned at midline. The majority of stimuli were “congruent” ar-rows pointing in the same direction as their position on thescreen (eg, a right-pointing arrow presented to the right of mid-line). A smaller percentage (~7%) of stimuli were “incongru-ent” arrows pointing in a direction opposite their position onthe screen (eg, a left-pointing arrow presented to the right of mid-line), spaced pseudorandomly every 13 to 16 congruent stimuli.We have previously shown that activations in this task formatare attributable to interference and not to oddball effects.32
Participants were instructed to respond as quickly as pos-sible to the direction of the arrow by pressing a button on aresponse box, using the index finger of their right hand for a left-pointing arrow and the middle finger of that hand for a right-pointing arrow. The button press recorded participant re-sponses and reaction times for each trial. Stimulus duration was1300 milliseconds, with an interstimulus interval of 350 milli-seconds. Each run contained 102 stimuli (2 minutes, 48 sec-onds total duration), and each participant performed 10 runs.
Statistical AnalysisWe constructed first-level maps to isolate (1) interference-related activity during correct trials (incongruent correct vscongruent correct trials) and (2) error-related activity (incon-gruent incorrect vs incongruent correct trials). Then, in all sec-ond-level analyses, we first covaried for age, sex, generation(G2 or G3), genealogical index of familiality, and average in-terference scores (the difference in mean reaction times be-tween incongruent correct and congruent correct events). Thegenealogical index of familiality is an average pairwise kin-ship coefficient that has been used extensively in family stud-ies to measure genetic relatedness between participants.33
We use it to control for the nonindependence of data.We then modeled the fMRI data as linear combinations of
the various participant subgroups based on our operationaldefinitions of the 2 endophenotypes and illness effects. Weused Bayesian inference to detect random effects by assess-ing the posterior probability of detecting a within- or between-group difference, β, given the activation map that we at-tained in a particular contrast. We used a posterior probabilityof greater than 98.75% as the threshold for statistical signifi-cance in each of the contrast maps and, in addition, requireda spatial extent of at least 8 contiguous voxels to furtherstrengthen the biological validity of our findings. Unlike a moreconventional second-level analysis that uses classical para-metric inference to detect a group effect in a statistical para-metric map by disproving the null hypothesis (β = 0) at eachvoxel of the image, a group effect using the Bayesian methodinfers the posterior probability of detecting the observed groupeffects (β ≠ 0) given the data in a posterior probability map.34
Whereas the voxelwise tests in a statistical parametric map re-quire correction for the number of statistical comparisons per-formed, the Bayesian method, because it infers posterior prob-ability, by definition, does not generate false positives and doesnot require adjustment of its P values based on stringent P value
thresholding (a feature of these analyses that has been con-firmed in numerous simulations and empirical studies).35,36
In second-level Bayesian analyses, we isolated the risk andresilienceendophenotypesandlifetimeillnesseffects,asfollows:1. We isolated the effects of lifetime illness common to both risk
groups by contrasting activation maps for all persons who hada prior lifetime illness (“HRIll” and “LRIll” combined) with ac-tivation maps for all persons without a prior lifetime illness(“HRHealthy” and “LRHealthy” combined) while covarying forrisk group. To ensure that we isolated in this map only theeffects of prior illness that were common to both risk groups,and not illness effects that may have disproportionately af-fected one risk group or the other, we then masked out of thepreliminary contrast map voxels where we detected a sig-nificant risk group × illness interaction (which we definenext). To isolate the effects of illness specific to each riskgroup, we first constructed maps for lifetime illness effectsseparately in each risk group: in HR participants, we con-trasted activation maps between the HRIll and HRHealthy
groups; in LR participants, we contrasted activation maps be-tween the LRIll and LRHealthy groups. We then contrasted thesemaps for lifetime illness effects across risk groups, in effectmapping the interaction of lifetime illness with risk group.
2. To isolate the risk endophenotype, we contrasted activa-tion maps for all HR participants with activation maps forall LR participants while covarying for lifetime illness, age,sex, and interference scores. This map clearly defined ac-tivations that were distinct from the effects of lifetime ill-ness. Nevertheless, to ensure that we isolated only brain fea-tures for risk and excluded any effects of prior illness thatmay have disproportionately affected one risk group or theother, we masked out of this map voxels that were de-tected as a significant risk group × illness interaction (whichhas already been operationally defined). We defined life-time illness as having had either lifetime MDD or anxiety dis-order because prior studies of this same cohort have shownboth illnesses to occur at elevated rates in the HR group com-pared with the LR group and because the onset of MDD inadolescence or young adulthood is often heralded by thepresence of anxiety disorder in childhood.15 Findings weresimilar when defining lifetime illness as either one of thesedisorders alone and controlling for the presence of the other.
3. To isolate the resilience endophenotype, we contrasted theactivation map for HR participants who had never been ill(“HRHealthy”) with the activation map for LR participants whohad never been ill (“LRHealthy”). We then masked out of thiscontrast map the voxels where we detected a significantmain effect of risk (as already defined), leaving only resil-ience (or protective) effects.
ResultsBehavioral FindingsA repeated-measures analysis of covariance showed a trend(P = .07) toward lower interference scores (better resolutionof cognitive interference) in the HR group compared with theLR group, while covarying for age and sex (Table 2; Figure 1).
Research Original Investigation Familial Major Depressive Disorder
E4 JAMA Psychiatry Published online December 25, 2013 jamapsychiatry.com
Copyright 2013 American Medical Association. All rights reserved.
Downloaded From: http://archpsyc.jamanetwork.com/ by a Columbia University User on 12/31/2013

Copyright 2013 American Medical Association. All rights reserved.
Post hoc analyses showed that this effect derived from thelower scores (P = .01) in the HR group members who had neverbeen ill (ie, those who were “resilient” by our definition). A sec-ondary analysis showed that, compared with LR group, the HRgroup was more accurate when responding to incongruent
stimuli (P < .001), an effect that derived primarily from mem-bers of the HR group who had a lifetime history of illness(P < .001), which suggests that the HR participants with priorillness may be more cautious in their response styles, tendingto sacrifice speed for greater accuracy.
Figure 1. Behavioral Performance on the Simon Task
800
750
700
650
550
600
450
500
400
Reac
tion
Tim
e, m
s
Run No.1 2 3 4 5 6 7 8 9 10
A
105
100
95
90
80
85
75
Perc
enta
ge C
orre
ct
Run No.1 2 3 4 5 6 7 8 9 10
B
LR congruentLR incongruentHR congruentHR incongruent
Reaction times (A) and accuracy scores (B) from each trial across all 10 runs ofthe Simon task were entered as dependent variables in separaterepeated-measures, linear mixed models in SAS (SAS Institute Inc), with riskgroup (high risk [HR] or low risk [LR]), stimulus congruence (incongruent orcongruent), age, sex, and run number (0-10) included as independent variables.The error bars represent standard errors. A, The HR group respondedsignificantly faster, on average, on the incongruent but not congruent trials than
did the LR group, but this faster performance when resolving the cognitiveinterference was driven by members of the HR group who had never hadlifetime major depressive disorder or anxiety disorder (Table 2), which suggeststhat better performance was a resilience effect. B, The HR group, on average,was more accurate than the LR group on incongruent trials, but these groupdifferences were driven by HR participants who had a lifetime history of illness(Table 2).
Table 2. Group Differences on Task Performance Measuresa
Measure
All Participants,Mean (SD)
t Value(df = 141)
PValue
No MDD or AnxietyDisorder, Mean (SD)
t Value(df = 57)
PValue
Lifetime MDDor Anxiety Disorder,
Mean (SD)
t Value(df = 82)
PValue
LR(n = 60)
HR(n = 83)
LRPartici-pants
(n = 37)
HRPartici-pants
(n = 22)
LRPartici-pants
(n = 23)
HRPartici-pants
(n = 61)RT, ms
Incongruent 674.5(6.4)
664.8(5.1)
−1.2 .24 672.5(9.1)
640.8(11.8)
−2.13 .04 669.0(9.3)
668.5(5.6)
−0.04 .96
Congruent 494.8(6.4)
492.0(5.1)
−0.88 .38 498.5(9.1)
482.4(11.8)
−1.09 .28 480.5(9.3)
490.7(5.6)
0.96 .34
InterferenceRT effectb
179.7(3.0)
172.8(2.4)
NA .07 174.0(3.7)
158.4(4.5)
NA .01 188.5(4.8)
177.8(2.9)
NA .23
Accuracy, %
Incongruent 85.9(0.48)
88.6(0.4)
4.45 <.001 85.6(0.6)
86.5(0.8)
0.9 .36 85.2(0.74)
89.4(0.45)
4.9 <.001
Congruent 100.0(0.48)
99.2(0.4)
−1.36 .18 99.3(0.6)
98.5(0.8)
−0.9 .37 99.9(0.74)
99.4(0.45)
−0.56 .58
Interferenceaccuracyeffectc
14.1(0.65)
10.5(0.5)
NA <.001 13.7(0.89)
12.0(1.0)
NA .80 14.7(1.0)
10.0(0.6)
NA .08
Abbreviations: HR, high-risk; LR, low-risk; MDD, major depressive disorder;NA, not available; RT, reaction time.a Values are calculated using the least squares mean values of the mixed model:
RT (or accuracy) = age + diagnosis + sex + congruence + run + run ×congruence + diagnosis × congruence + diagnosis × run × congruence over 10runs. The reduced RT interference effects were derived from those in the HRgroup with no lifetime illness (ie, those who were resilient), whereas theimproved accuracy in responding within the HR group were derived fromthose HR participants who had a lifetime history of illness. Some t values are
not available because, in the mixed model, we used the least squares meanvalues for the diagnosis × congruence term to obtain the t value whencongruence was fixed. The P values for interference RT or accuracy effects aresimply the P values for the diagnosis × congruence term, and no t values areavailable.
b The mean RT for incongruent trials minus the mean RT for congruent trials.c The accuracy during incongruent trials minus the accuracy during congruent
trials, where accuracy is defined as percentage correct trial responses.
Familial Major Depressive Disorder Original Investigation Research
jamapsychiatry.com JAMA Psychiatry Published online December 25, 2013 E5
Copyright 2013 American Medical Association. All rights reserved.
Downloaded From: http://archpsyc.jamanetwork.com/ by a Columbia University User on 12/31/2013

Copyright 2013 American Medical Association. All rights reserved.
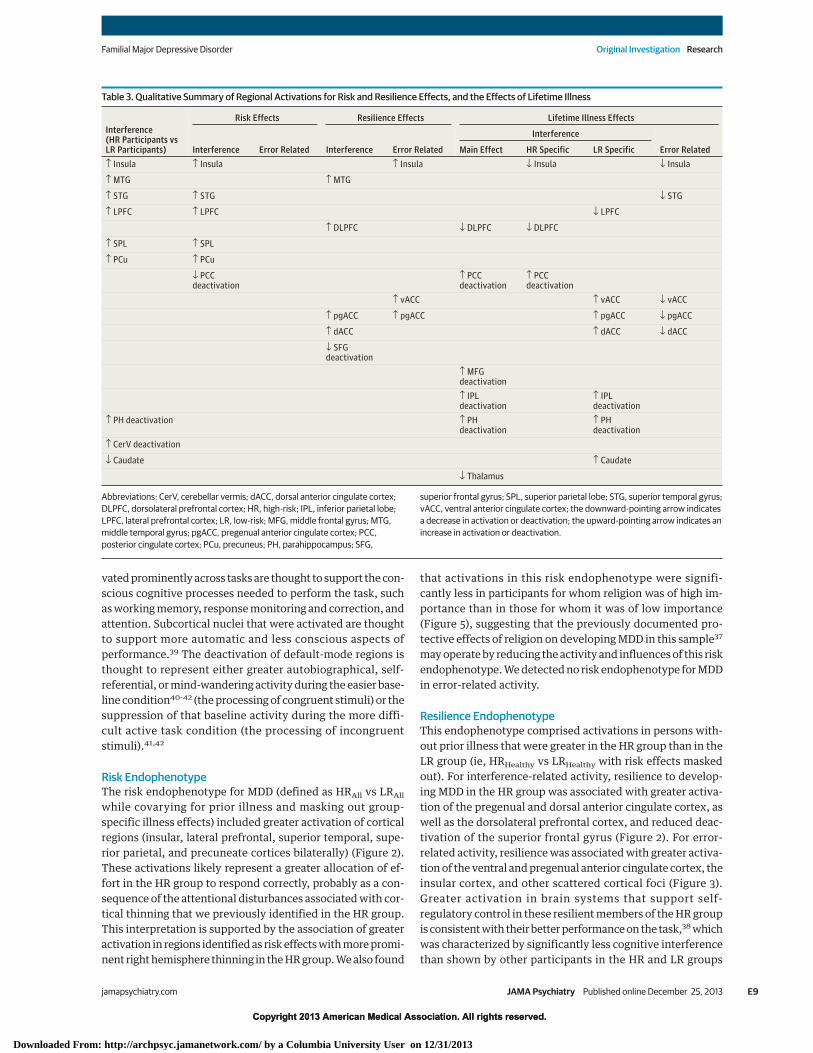
Imaging FindingsThe risk and resilience endophenotypes and lifetime illness ef-fects in brain activation are shown in representative slices inFigures 2 and 3; activations in all slices acquired are shown ineFigures 1 and 2 in eAppendix 2 in the Supplement. The loca-tions of activation for each effect are summarized in Table 3and detailed in eTable 1 in eAppendix 2 in the Supplement.Table 3 shows that some of the activations in the maps for allparticipants (leftmost column) are derived from the specificeffects of trait vulnerabilities, resilience, or lifetime illness,whereas the other effects for vulnerability, resilience, and life-time illness are not evident in the maps for all participants be-cause the effects are diluted by the presence of other groups.These specific effects are provided for both interference con-trasts and error-related activity (see Figure 2, Figure 3, andFigure 4 for corresponding activation maps and eTable 1 in theSupplement for activation coordinates).
Interference-Related ActivityThe risk endophenotype for MDD included greater activationof insular, lateral prefrontal, superior temporal, superior pa-rietal, and precuneate cortices bilaterally (Figure 2). The re-silience endophenotype included greater activation of the pre-genual and dorsal anterior cingulate and dorsolateral prefrontalcortices, as well as reduced deactivation of the superior fron-tal gyrus (Figure 2). Illness-related effects common to both riskgroups included exaggerated deactivation of default-mode cir-cuits, especially in posterior brain regions (Figure 2).
Error-Related ActivityWe detected no risk endophenotype for MDD in error-relatedactivity. Resilience was associated with greater activation ofventral and pregenual anterior cingulate cortex, insular cor-tex, and other scattered foci of cortical activations (Figure 3).Lifetime illness effects included reduced activation of ven-tral and pregenual portions of the anterior cingulate cortex(Figure 3).
Potential ConfoundersFindings were similar to the original (1) when identifying theendophenotypes for either MDD alone, while covarying for life-time anxiety disorder, or anxiety disorder alone, while cova-rying for lifetime MDD (eAppendix 3 and eFigure 3 in theSupplement); (2) when covarying for generation (G2 or G3)(eAppendix 4 and eFigures 4 and 5 in the Supplement); (3)when excluding the 25 participants (20 HR participants and 5LR participants) who were taking a psychotropic medicationat the time of the scan (although lifetime illness effects wereweakened by removing 25 people who had been recently ill)(eAppendix 5, eTable 1, and eFigure 6 in the Supplement); (4)when excluding the 34 participants (21 HR participants and 13LR participants) with a lifetime history of abuse or depen-dence on either drugs (n = 23; 17 HR participants and 6 LR par-ticipants) or alcohol (n = 24; 16 HR participants and 8 LR par-ticipants) (eAppendix 6 and eFigure 7 in the Supplement); (5)when excluding female participants from the analyses andusing bootstrap resampling to assess the effects of unequal sexdistributions across illness groups (eAppendix 7 and eFigure
8 in the Supplement); (6) when including only participantsolder than age 25 years, and who therefore are past the age ofmaximum risk for onset of new illness (Figure 4; eAppendix8, eFigures 9 and 10, and eTables 3 and 4 in the Supplement),indicating that group differences in age and developmentalstage in the overall sample did not confound our findings; (7)when not covarying for generation or the genealogical indexof familiality (eAppendix 9 and eFigure 11 in the Supple-ment); and (8) while covarying for mean reaction times (datanot shown).
Correlation AnalysesThe magnitudes of fMRI activation did not correlate signifi-cantly with measures of task performance or with symptomseverity for depression or anxiety in either the HR group or theLR group. However, in the 134 participants (78 HR partici-pants and 56 LR participants) who had both anatomical andfMRI measures, activation in regions identified as the risk en-dophenotype, particularly the lateral prefrontal (r = −0.26,P < .02) and insular cortices (r = −0.30, P < .008), correlated sig-nificantly in the HR group with the degree of right hemi-sphere cortical thinning (eAppendix 10 and eFigures 12 and 13in the Supplement).
Conjunction AnalysesFindings were replicated using conjunction analyses on the sec-ond-level Bayesian maps (eAppendix 11 and eFigures 14 and15 in the Supplement).
Association With Importance of ReligionGiven the previously reported association of the importanceof religion in protecting against depression and its associa-tion with increasing cortical thickness in this sample,37 wealso assessed the association of the importance of religionwith our fMRI-based risk and resilience endophenotypesand lifetime illness effects. We asked adult participants atthe time of the MRI scan the following question: “Howimportant to you is religion or spirituality?” Their responsesranged from a score of 1 (not important at all) to a score of 4(highly important). We dichotomized responses as either“high” (≥3) or “low” (<3) importance and compared fMRImeasures for interference effects between those for whomreligion was of high importance (n = 23; 12 HR participantsand 11 LR participants; 15 women) and those for whom it wasof low importance (n = 74; 51 HR participants and 23 LR par-ticipants; 45 women), while covarying for age, sex, interfer-ence effects, and risk group. We found that, in participantsfor whom religion was of low importance, interference-related activation was significantly stronger throughoutmost of the cortical regions that this task activates (Figure 5).We created a conjunction for the maps of each of thoseeffects with the map of significant activation comparing highvs low importance, demonstrating that nearly all activationsthat were stronger in participants for whom religion was oflow importance were regions identified as being more activein the risk endophenotype for MDD. Activation in only 1region in 2 adjacent slices was located within a region identi-fied as being a component of the resilience endophenotype,
Research Original Investigation Familial Major Depressive Disorder
E6 JAMA Psychiatry Published online December 25, 2013 jamapsychiatry.com
Copyright 2013 American Medical Association. All rights reserved.
Downloaded From: http://archpsyc.jamanetwork.com/ by a Columbia University User on 12/31/2013

Copyright 2013 American Medical Association. All rights reserved.
Figure 2. Hypothesis Testing for Interference-Related Activity
Interference-Related Activity
Resilience effects
Pregenual and dorsal ACC
Risk effects
Association cortices
Lifetime illness effects
Default-mode circuits
Ins
PH MTG
z = 4 mm
MedialLateral
LPFC
STG
z = 20 mm
STG
z = 30 mm
pgACC
pgACC
dACC
SFG
z = 16 mm
z = 20 mm
DLPFC
z = 30 mm
4 –4–0.50.5
Effect Size
Posterior probability >98.75%
PCC
DLPFC
PCC
MFG
PCC
z = 20 mm
z = 30 mm
SPL
IPL
IPL
z = 42 mm
SPL
IPL
DLPFC PCu
PCCdACC
LPFC
Ins pgACCSTG
Resilience Risk Illness
PCu
A
B
A, Representative 2-dimensional axial slices are shown that demonstrate theeffects of interest. The risk effects map identifying brain features for risk wasconstructed by comparing interference maps for all high-risk (HR) participantswith interference maps for all low-risk (LR) participants, while covarying for age,sex, interference effects, prior illness, generation (second or third generation),and genealogical index of familiality and then masking out of this map all voxelswhere we detected a significant risk group × illness interaction. The resilienceeffects map was constructed by comparing the interference map for theHRHealthy group with the map for the LRHealthy group. We then masked out ofthis map the voxels where we detected a significant main effect of risk, leavingonly resilience (or protective) effects. Maps constructed when includingpersons with major depressive disorder alone or anxiety disorder alone werevery similar (eAppendix 3 and eFigure 3 in the Supplement). The lifetime illnesseffects map for the main effect of illness was constructed by comparing theinterference maps (while covarying for age, sex, interference scores, and risk
group) for all persons who had lifetime illness (the HRIll and LRIll groupscombined) with the interference maps for all persons without lifetime illness(the HRHealthy and LRHealthy groups combined) and then masking out of thismap the voxels where we detected a significant risk group × illness interaction(eFigures 1 and 2, eTable 1, and eAppendix 2 in the Supplement), leaving illnesseffects that were common to both risk groups. B, Surface renderings of thelateral and medial surfaces of the brain generated using Caret 5.62 are shown,with the locations of each of the risk effects (yellow), resilience effects (green),and illness effects (red) color-coded. ACC indicates anterior cingulate cortex;dACC, dorsal anterior cingulate cortex; DLPFC, dorsolateral prefrontal cortex;Ins, insula; IPL, inferior parietal lobe; LPFC, lateral prefrontal cortex;MFG, middle frontal gyrus; MTG, middle temporal gyrus; PCC, posteriorcingulate cortex; PCu, precuneus; pgACC, pregenual anterior cingulate cortex;PH, parahippocampus; SFG, superior frontal gyrus; SPL, superior parietal lobe;STG, superior temporal gyrus; and vACC, ventral anterior cingulate cortex.
Familial Major Depressive Disorder Original Investigation Research
jamapsychiatry.com JAMA Psychiatry Published online December 25, 2013 E7
Copyright 2013 American Medical Association. All rights reserved.
Downloaded From: http://archpsyc.jamanetwork.com/ by a Columbia University User on 12/31/2013

Copyright 2013 American Medical Association. All rights reserved.
and none of the activations were components of the regionsidentified as lifetime illness effects (Figure 5).
DiscussionWe identified the patterns of brain activation for risk endo-phenotypes that were distinct from the patterns associatedwith resilience to illness and the patterns associated with a life-time history of MDD or anxiety disorder (Table 3). Risk-, resil-ience-, and illness-specific effects either remained or strength-ened when including in the analyses only participants olderthan 25 years of age who were past the age of maximum riskfor onset of new illness (eAppendix 8, eFigures 9 and 10, andeTables 3 and 4 in the Supplement), probably because the ef-fects were not diluted by those youngest participants who hadyet to become ill.
Interference-related activity was similar across the HRgroup and the LR group and included activation of numerouscortical areas (anterior cingulate, inferior and dorsolateral pre-frontal, insula, parietal, and superior temporal regions) andsubcortical nuclei (basal ganglia and thalamus), as well as de-
activation of so-called default-mode regions (mesial prefron-tal, inferior parietal/posterior temporal, and posterior cingu-late cortices) (eAppendix 1, eFigures 1 and 2, and eTable 1 inthe Supplement), consistent with numerous prior reports ofactivation using this and similar tasks.22,27 Error-related ac-tivity in both groups included ventral and dorsal anterior cin-gulate, insular, dorsolateral prefrontal, and dorsal parietal cor-tices bilaterally and the caudate nuclei and thalamus (Figure 3;eAppendix 1, eFigures 1 and 2, and eTable 1 in the Supple-ment), similar to findings in previous studies of error-relatedactivity.30,31 Error-related activations were similar to interfer-ence-related ones, although greater in the anterior cingulatecortex and weaker in default-mode regions.
The anterior cingulate cortex activated most consistentlyin both interference- and error-related analyses. The anteriorcingulate is an anatomically and functionally heterogeneousstructure that coordinates and regulates activity across spaceand time in a wide array of neural systems that subserve cog-nitive, behavioral, and emotional processes.27 Its pregenual anddorsal portions play a prominent role in monitoring errors andproviding corrective action to improve performance on sub-sequent trials.38 The other cortical regions that were acti-
Figure 3. Hypothesis Testing for Error-Related Activity
4 –4–0.50.5
Effect Size
Posterior probability >98.75%
z = 16 mm
z = 12 mm
z = 4 mm
z = 16 mm
z = 8 mm
z = 0 mm
Error-Related Activity
HR
not ill
LR
not ill
Resilience
effects
HR illness
effects
HR
Ill
HR
not ill
vACC
Ins
pgACC
pgACC
vACC
Ins
vACC
pgACC
Maps were constructed as described in Figure 2 for interference-related activity,except the contrast maps on which they were based were those forerror-related activity (incongruent incorrect vs incongruent correct trials). Allmaps were covaried for age, sex, interference scores, generation (second orthird generation), and genealogical index of familiality. We did not detectsignificant risk effects or illness effects in the low-risk (LR) group forerror-related activity, and therefore we do not show those maps. Resilience was
associated with greater activation (yellow) of ventral and pregenual anteriorcingulate cortex and insular cortex in the “HR not ill” group compared with the“LR not ill” group. Lifetime illness effects included reduced activation (blue) ofventral and pregenual portions of the anterior cingulate cortex in the “HR ill”group compared with the “HR not ill” group. HR indicates high risk; Ins, insula;pgACC, pregenual anterior cingulate cortex; and vACC, ventral anteriorcingulate cortex.
Research Original Investigation Familial Major Depressive Disorder
E8 JAMA Psychiatry Published online December 25, 2013 jamapsychiatry.com
Copyright 2013 American Medical Association. All rights reserved.
Downloaded From: http://archpsyc.jamanetwork.com/ by a Columbia University User on 12/31/2013
Copyright 2013 American Medical Association. All rights reserved.
vated prominently across tasks are thought to support the con-scious cognitive processes needed to perform the task, suchas working memory, response monitoring and correction, andattention. Subcortical nuclei that were activated are thoughtto support more automatic and less conscious aspects ofperformance.39 The deactivation of default-mode regions isthought to represent either greater autobiographical, self-referential, or mind-wandering activity during the easier base-line condition40-42 (the processing of congruent stimuli) or thesuppression of that baseline activity during the more diffi-cult active task condition (the processing of incongruentstimuli).41,42
Risk EndophenotypeThe risk endophenotype for MDD (defined as HRAll vs LRAll
while covarying for prior illness and masking out group-specific illness effects) included greater activation of corticalregions (insular, lateral prefrontal, superior temporal, supe-rior parietal, and precuneate cortices bilaterally) (Figure 2).These activations likely represent a greater allocation of ef-fort in the HR group to respond correctly, probably as a con-sequence of the attentional disturbances associated with cor-tical thinning that we previously identified in the HR group.This interpretation is supported by the association of greateractivation in regions identified as risk effects with more promi-nent right hemisphere thinning in the HR group. We also found
that activations in this risk endophenotype were signifi-cantly less in participants for whom religion was of high im-portance than in those for whom it was of low importance(Figure 5), suggesting that the previously documented pro-tective effects of religion on developing MDD in this sample37
may operate by reducing the activity and influences of this riskendophenotype. We detected no risk endophenotype for MDDin error-related activity.
Resilience EndophenotypeThis endophenotype comprised activations in persons with-out prior illness that were greater in the HR group than in theLR group (ie, HRHealthy vs LRHealthy with risk effects maskedout). For interference-related activity, resilience to develop-ing MDD in the HR group was associated with greater activa-tion of the pregenual and dorsal anterior cingulate cortex, aswell as the dorsolateral prefrontal cortex, and reduced deac-tivation of the superior frontal gyrus (Figure 2). For error-related activity, resilience was associated with greater activa-tion of the ventral and pregenual anterior cingulate cortex, theinsular cortex, and other scattered cortical foci (Figure 3).Greater activation in brain systems that support self-regulatory control in these resilient members of the HR groupis consistent with their better performance on the task,38 whichwas characterized by significantly less cognitive interferencethan shown by other participants in the HR and LR groups
Table 3. Qualitative Summary of Regional Activations for Risk and Resilience Effects, and the Effects of Lifetime Illness
Interference(HR Participants vsLR Participants)
Risk Effects Resilience Effects Lifetime Illness Effects
Interference Error Related Interference Error Related
Interference
Error RelatedMain Effect HR Specific LR Specific↑ Insula ↑ Insula ↑ Insula ↓ Insula ↓ Insula
↑ MTG ↑ MTG
↑ STG ↑ STG ↓ STG
↑ LPFC ↑ LPFC ↓ LPFC
↑ DLPFC ↓ DLPFC ↓ DLPFC
↑ SPL ↑ SPL
↑ PCu ↑ PCu
↓ PCCdeactivation
↑ PCCdeactivation
↑ PCCdeactivation
↑ vACC ↑ vACC ↓ vACC
↑ pgACC ↑ pgACC ↑ pgACC ↓ pgACC
↑ dACC ↑ dACC ↓ dACC
↓ SFGdeactivation
↑ MFGdeactivation↑ IPLdeactivation
↑ IPLdeactivation
↑ PH deactivation ↑ PHdeactivation
↑ PHdeactivation
↑ CerV deactivation
↓ Caudate ↑ Caudate
↓ Thalamus
Abbreviations: CerV, cerebellar vermis; dACC, dorsal anterior cingulate cortex;DLPFC, dorsolateral prefrontal cortex; HR, high-risk; IPL, inferior parietal lobe;LPFC, lateral prefrontal cortex; LR, low-risk; MFG, middle frontal gyrus; MTG,middle temporal gyrus; pgACC, pregenual anterior cingulate cortex; PCC,posterior cingulate cortex; PCu, precuneus; PH, parahippocampus; SFG,
superior frontal gyrus; SPL, superior parietal lobe; STG, superior temporal gyrus;vACC, ventral anterior cingulate cortex; the downward-pointing arrow indicatesa decrease in activation or deactivation; the upward-pointing arrow indicates anincrease in activation or deactivation.
Familial Major Depressive Disorder Original Investigation Research
jamapsychiatry.com JAMA Psychiatry Published online December 25, 2013 E9
Copyright 2013 American Medical Association. All rights reserved.
Downloaded From: http://archpsyc.jamanetwork.com/ by a Columbia University User on 12/31/2013

Copyright 2013 American Medical Association. All rights reserved.
(Table 2). It could support resilience by helping to regulate emo-tions and the pathogenic cognitions that predispose to MDD.
Lifetime Illness EffectsIllness-related effects (lifetime MDD vs no MDD) common toboth risk groups for interference-related activity included ex-aggerated deactivation of default-mode circuits, especially inposterior brain regions (Figure 2). We attribute these illness ef-fects to increased self-referential thinking and mind wander-ing during the easier baseline task, possibly representing theproclivity that persons with MDD or anxiety disorder have torumination.43,44 Whether exaggerated deactivation of default-mode circuits is a cause or consequence of overt MDD illnessis impossible to say in this cross-sectional study. A definitiveunderstanding of the direction of causality will require morescanning at future time points to determine whether default-mode activity predicts future illness or vice versa.
Relation to Prior Studies of MDDPrior studies of MDD have generally included only personswho were ill at the time of the study, making their findingsmost relevant only to our lifetime illness effects. Extensivereviews have shown that the most consistent imaging find-ing for persons already affected with MDD is greater base-line activity in the mesial prefrontal cortex (especiallythe anterior cingulate cortex) and in other portions of thedefault-mode network (including the posterior cingulate,precuneate, inferior parietal, and parahippocampalcortices),45-47 consistent with the greater default-modedeactivations that we detected as lifetime illness effects.Previous studies have suggested that successful treat-ment may normalize activity in these default-moderegions.45,46,48,49 Functional abnormalities in default-moderegions may derive from reduced underlying gray mattervolumes and reduced glial cell densities in the subgenual
Figure 4. Interference Effects for Participants Older Than 25 Years
Interference-Related Activity
Resilience effects
Pregenual and dorsal ACC
Risk effects
Association cortices
Lifetime illness effects
Default-mode circuits
Ins
PH MTG
z = 4 mm
LPFC
STG
z = 20 mm
PCu
STG
z = 30 mm
pgACC
SFG
pgACC
dACC
SFG
z = 16 mm
z = 20 mm
DLPFC
z = 30 mm
4 –4–0.50.5
Effect Size
Posterior probability >98.75%
PCC
DLPFC
PCC
MFG
z = 20 mm
z = 30 mm
SPL
IPL
IPL
z = 42 mm
Effects were defined as in Figure 2. Findings are unchanged from thoseidentified in the entire cohort. ACC indicates anterior cingulate cortex; dACC,dorsal anterior cingulate cortex; DLPFC, dorsolateral prefrontal cortex; Ins,insula; IPL, inferior parietal lobe; LPFC, lateral prefrontal cortex; MFG, middle
frontal gyrus; MTG, middle temporal gyrus; PCC, posterior cingulate cortex;PCu, precuneus; pgACC, pregenual anterior cingulate cortex; PH,parahippocampus; SFG, superior frontal gyrus; SPL, superior parietal lobe; STG,superior temporal gyrus; and vACC, ventral anterior cingulate cortex.
Research Original Investigation Familial Major Depressive Disorder
E10 JAMA Psychiatry Published online December 25, 2013 jamapsychiatry.com
Copyright 2013 American Medical Association. All rights reserved.
Downloaded From: http://archpsyc.jamanetwork.com/ by a Columbia University User on 12/31/2013

Copyright 2013 American Medical Association. All rights reserved.
anterior cingulate cortex of persons with active MDD.50,51
Meta-analyses of anatomical studies have also concludedthat gray matter volumes in MDD are reduced not only inthe anterior cingulate cortex, but also in the orbitofrontaland dorsal prefrontal cortices, the hippocampus, the puta-men, and the caudate nucleus,26 regions generally impli-cated in our risk endophenotype (Figure 2). In addition togreater activity in default-mode systems, prior studies havereported reduced cortical activity in persons alreadyaffected with MDD,45,46 including adolescents with MDDperforming the Simon or other self-regulatory tasks,29 con-sistent with the reduced cortical activation that we detectedin those who have a lifetime history of illness, regardless offamilial risk status (Figure 2).
The few preliminary studies relevant to the identifica-tion of risk endophenotypes in persons who have not beenovertly ill with MDD have reported reduced volumes of thesubgenual anterior cingulate cortex early in the course of ill-ness and in young adults at high familial risk for MDD.52,53
One study reported a positive correlation of dorsal anteriorcingulate volumes with trait measures of emotion regula-tion in healthy women.54 The anatomical endophenotypefor risk that we previously reported for familial MDDincluded widespread thinning of the mesial wall of the lefthemisphere,21 subsuming the majority of regions of the
default-mode network. One fMRI study using a verbalworking memory task in young people at HR comparedwith those at LR for familial MDD reported greater activa-tion in the superior temporal, superior parietal, and lateraloccipital cortices in the HR group,55 consistent withthe greater cortical activation that we identified as a riskendophenotype. To our knowledge, no prior studies haveidentified resilience endophenotypes in persons at riskfor MDD.
ConclusionFuture studies should assess the utility of our risk, resil-ience, and illness effects in predicting future illness in youthwith a family history of MDD but who have not passedthrough the age of risk for onset. If sufficiently predictive,these endophenotypes could then be used to aid in deter-mining who should be targeted for preventive interven-tions. Bolstering the function of the anterior cingulate anddorsolateral prefrontal cortices, components of the resil-ience endophenotype, using cognitive exercises, electro-physiological stimulation, or appropriate medications,should be considered a target in developing new and moreeffective treatments for MDD.
Figure 5. Association of Activations With Importance of Religion
High ReligionEffects
Conjunction:High Religion
and Risk
Conjunction:High Religion
and ResilienceRisk EffectsResilience
Effects
LPFC
SFG
STG
SPL
SFG
PH
SFG
DLPFC
STG
PCC
PCu
STG
STG
SFG
z Co
ord
ina
te, m
m12
16
20
24
36
42
Po
sterio
r pro
ba
bility
>9
8.7
5%
Effect
Size
Interference
4
0.5
–0.5
–4
LPFC
STG
STG
SPL
SFG PCC
PCu
LPFC
STG
SPL
SFG PCC
STG
PCu
SFG
DLPFC
SFG
pgACC
dACC
The first column shown the comparison of interference-related activations inparticipants for whom religion was of high importance (n = 23) vs participantsfor whom religion was of low importance (n = 74), while controlling for age, sex,interference scores, and risk group. The second column shows the riskendophenotype in the selected slices, whereas the third column shows theconjunction of activations in the first and second columns, in effect identifyingactivations associated with the importance of religion that are located withinthe risk endophenotype. The fourth column shows the resilienceendophenotype in the selected slices, and the fifth column shows theconjunction of the first and fourth columns, identifying activations associatedwith the importance of religion that are located within the resilience
endophenotype (high importance of religion was associated with a moreprominent deactivation of the superior frontal gyrus in 2 adjacent slices). Asimilar conjunction of the first column with the effects of lifetime illness wasempty and therefore is not shown. The high importance of religion is associatedprimarily with reduced activation within regions that constitute the riskendophenotype. dACC, indicates dorsal anterior cingulate cortex; DLPFC,dorsolateral prefrontal cortex; LPFC, lateral prefrontal cortex; PCC, posteriorcingulate cortex; PCu, precuneus; pgACC, pregenual anterior cingulate cortex;PH, parahippocampus; SFG, superior frontal gyrus; SPL, superior parietal lobe;and STG, superior temporal gyrus.
Familial Major Depressive Disorder Original Investigation Research
jamapsychiatry.com JAMA Psychiatry Published online December 25, 2013 E11
Copyright 2013 American Medical Association. All rights reserved.
Downloaded From: http://archpsyc.jamanetwork.com/ by a Columbia University User on 12/31/2013

Copyright 2013 American Medical Association. All rights reserved.
ARTICLE INFORMATION
Submitted for Publication: November 14, 2012;final revision received August 27, 2013; acceptedSeptember 2, 2013.
Published Online: December 25, 2013.doi:10.1001/jamapsychiatry.2013.4048.
Author Contributions: Dr Peterson had full accessto all of the data in the study and takesresponsibility for the integrity of the data and theaccuracy of the data analysis.Study concept and design: Peterson,Wickramaratne, Weissman.Acquisition of data: Peterson, Warner, Klahr, Garcia,Adams, Gerber, Weissman.Analysis and interpretation of data: Peterson, Wang,Horga, Rutherford, Graniello, Wickramaratne,Garcia, Yu, Hao, Qian, Liu, Gerber.Drafting of the manuscript: Peterson, Wang,Warner, Adams, Qian, Weissman.Critical revision of the manuscript for importantintellectual content: Peterson, Wang, Horga,Rutherford, Klahr, Graniello, Wickramaratne, Garcia,Yu, Hao, Liu, Gerber, Weissman.Statistical analysis: Peterson, Wang, Horga,Graniello, Garcia, Liu.Obtained funding: Peterson, Weissman.Administrative, technical, or material support:Peterson, Klahr, Garcia, Hao, Adams, Qian,Weissman.Study supervision: Peterson, Horga, Warner.
Conflict of Interest Disclosures: None reported.
Funding/Support: This work was supported in partby National Institute of Mental Health grantsMH36197 and K02-74677, a grant from the estate ofEleanore Jeleniauskas and the Brain and BehaviorResearch Foundation, a National Institute on DrugAbuse supplement to grant MH36197, the TomKlingenstein and Nancy Perlman Family Fund, theSackler Institute at Columbia University, and theTempleton Foundation.
Role of the Sponsor: The funding organizationshad no role in the design and conduct of the study;collection, management, analysis, or interpretationof the data; preparation, review, or approval of themanuscript; and decision to submit the manuscriptfor publication.
REFERENCES
1. Wang PS, Aguilar-Gaxiola S, Alonso J, et al. Use ofmental health services for anxiety, mood, andsubstance disorders in 17 countries in the WHOworld mental health surveys. Lancet.2007;370(9590):841-850.
2. Weissman MM, Bland RC, Canino GJ, et al.Cross-national epidemiology of major depressionand bipolar disorder. JAMA. 1996;276(4):293-299.
3. Ustün TB, Ayuso-Mateos JL, Chatterji S, MathersC, Murray CJL. Global burden of depressivedisorders in the year 2000. Br J Psychiatry.2004;184:386-392.
4. Weissman MM, Wickramaratne P, Nomura Y,et al. Families at high and low risk for depression: a3-generation study. Arch Gen Psychiatry.2005;62(1):29-36.
5. Beardslee WR, Versage EM, Gladstone TR.Children of affectively ill parents: a review of thepast 10 years. J Am Acad Child Adolesc Psychiatry.1998;37(11):1134-1141.
6. Kovacs M, Devlin B, Pollock M, Richards C,Mukerji P. A controlled family history study ofchildhood-onset depressive disorder. Arch GenPsychiatry. 1997;54(7):613-623.
7. Bierut LJ, Heath AC, Bucholz KK, et al. Majordepressive disorder in a community-based twinsample: are there different genetic andenvironmental contributions for men and women?Arch Gen Psychiatry. 1999;56(6):557-563.
8. Sullivan PF, Neale MC, Kendler KS. Geneticepidemiology of major depression: review andmeta-analysis. Am J Psychiatry. 2000;157(10):1552-1562.
9. Lieb R, Isensee B, Höfler M, Pfister H, WittchenHU. Parental major depression and the risk ofdepression and other mental disorders in offspring:a prospective-longitudinal community study. ArchGen Psychiatry. 2002;59(4):365-374.
10. Keller MB, Beardslee WR, Dorer DJ, Lavori PW,Samuelson H, Klerman GR. Impact of severity andchronicity of parental affective illness on adaptivefunctioning and psychopathology in children. ArchGen Psychiatry. 1986;43(10):930-937.
11. Wickramaratne PJ, Greenwald S, Weissman MM.Psychiatric disorders in the relatives of probandswith prepubertal-onset or adolescent-onset majordepression. J Am Acad Child Adolesc Psychiatry.2000;39(11):1396-1405.
12. Fava M, Uebelacker LA, Alpert JE, NierenbergAA, Pava JA, Rosenbaum JF. Major depressivesubtypes and treatment response. Biol Psychiatry.1997;42(7):568-576.
13. Kendler KS. Is seeking treatment for depressionpredicted by a history of depression in relatives?implications for family studies of affective disorder.Psychol Med. 1995;25(4):807-814.
14. Hammen C, Burge D, Burney E, Adrian C.Longitudinal study of diagnoses in children ofwomen with unipolar and bipolar affective disorder.Arch Gen Psychiatry. 1990;47(12):1112-1117.
15. Pine DS, Cohen P, Gurley D, Brook J, Ma Y. Therisk for early-adulthood anxiety and depressivedisorders in adolescents with anxiety anddepressive disorders. Arch Gen Psychiatry.1998;55(1):56-64.
16. Warner V, Wickramaratne P, Weissman MM. Therole of fear and anxiety in the familial risk for majordepression: a three-generation study. Psychol Med.2008;38(11):1543-1556.
17. Peterson BS, Weissman MM. A brain-basedendophenotype for major depressive disorder.Annu Rev Med. 2011;62:461-474.
18. Gottesman II, Gould TD. The endophenotypeconcept in psychiatry: etymology and strategicintentions. Am J Psychiatry. 2003;160(4):636-645.
19. Feder A, Nestler EJ, Charney DS. Psychobiologyand molecular genetics of resilience. Nat RevNeurosci. 2009;10(6):446-457.
20. Masten AS, Coatsworth JD. The developmentof competence in favorable and unfavorableenvironments: lessons from research on successfulchildren. Am Psychol. 1998;53(2):205-220.
21. Peterson BS, Warner V, Bansal R, et al. Corticalthinning in persons at increased familial risk formajor depression. Proc Natl Acad Sci U S A.2009;106(15):6273-6278.
22. Peterson BS, Kane MJ, Alexander GM, et al. Anevent-related functional MRI study comparinginterference effects in the Simon and Stroop tasks.Brain Res Cogn Brain Res. 2002;13(3):427-440.
23. Dubin MJ, Maia TV, Peterson BS. Cognitivecontrol in the service of self-regulation. In: Koob GF,Le Moal M, Thompson RF, eds. Encyclopedia ofBehavioral Neuroscience. Vol 1. Oxford, England:Academic Press; 2010:288-293.
24. Joormann J, Gotlib IH. Emotion regulation indepression: relation to cognitive inhibition. CognEmot. 2010;24(2):281-298.
25. Phillips ML, Ladouceur CD, Drevets WC. Aneural model of voluntary and automatic emotionregulation: implications for understanding thepathophysiology and neurodevelopment of bipolardisorder. Mol Psychiatry. 2008;13(9):833-857.
26. Koolschijn PC, van Haren NE, Lensvelt-MuldersGJ, Hulshoff Pol HE, Kahn RS. Brain volumeabnormalities in major depressive disorder: ameta-analysis of magnetic resonance imagingstudies. Hum Brain Mapp. 2009;30(11):3719-3735.
27. Peterson BS, Skudlarski P, Gatenby JC, ZhangH, Anderson AW, Gore JC. An fMRI study of Stroopword-color interference: evidence for cingulatesubregions subserving multiple distributedattentional systems. Biol Psychiatry.1999;45(10):1237-1258.
28. Posner MI, Rothbart MK, Sheese BE, Tang Y.The anterior cingulate gyrus and the mechanism ofself-regulation. Cogn Affect Behav Neurosci.2007;7(4):391-395.
29. Halari R, Simic M, Pariante CM, et al. Reducedactivation in lateral prefrontal cortex and anteriorcingulate during attention and cognitive controlfunctions in medication-naïve adolescents withdepression compared to controls. J Child PsycholPsychiatry. 2009;50(3):307-316.
30. Rubia K, Smith AB, Taylor E, Brammer M.Linear age-correlated functional development ofright inferior fronto-striato-cerebellar networksduring response inhibition and anterior cingulateduring error-related processes. Hum Brain Mapp.2007;28(11):1163-1177.
31. King JA, Korb FM, von Cramon DY, UllspergerM. Post-error behavioral adjustments are facilitatedby activation and suppression of task-relevant andtask-irrelevant information processing. J Neurosci.2010;30(38):12759-12769.
32. Leung HC, Skudlarski P, Gatenby JC, PetersonBS, Gore JC. An event-related functional MRI studyof the Stroop color word interference task. CerebCortex. 2000;10(6):552-560.
33. Blumenthal DT, Cannon-Albright LA. Familialityin brain tumors. Neurology. 2008;71(13):1015-1020.
34. Neumann J, Lohmann G. Bayesian second-levelanalysis of functional magnetic resonance images.Neuroimage. 2003;20(2):1346-1355.
35. Friston KJ, Penny W, Phillips C, Kiebel S, HintonG, Ashburner J. Classical and Bayesian inference inneuroimaging: theory. Neuroimage.2002;16(2):465-483.
36. Friston KJ, Penny W. Posterior probability mapsand SPMs. Neuroimage. 2003;19(3):1240-1249.
37. Miller L, Bansal R, Wickramaratne P, et al.Neuroanatomical correlates of religiosity andspirituality: a study in adults at high and low familial
Research Original Investigation Familial Major Depressive Disorder
E12 JAMA Psychiatry Published online December 25, 2013 jamapsychiatry.com
Copyright 2013 American Medical Association. All rights reserved.
Downloaded From: http://archpsyc.jamanetwork.com/ by a Columbia University User on 12/31/2013

Copyright 2013 American Medical Association. All rights reserved.
risk for depression [published online December 25,2013]. JAMA Psychiatry. doi:10.1001/jamapsychiatry.2013.3067.
38. Kerns JG. Anterior cingulate and prefrontalcortex activity in an FMRI study of trial-to-trialadjustments on the Simon task. Neuroimage.2006;33(1):399-405.
39. Packard MG, Knowlton BJ. Learning andmemory functions of the basal ganglia. Annu RevNeurosci. 2002;25:563-593.
40. Vann SD, Aggleton JP, Maguire EA. What doesthe retrosplenial cortex do? Nat Rev Neurosci.2009;10(11):792-802.
41. Mason MF, Norton MI, Van Horn JD, WegnerDM, Grafton ST, Macrae CN. Wandering minds: thedefault network and stimulus-independentthought. Science. 2007;315(5810):393-395.
42. McKiernan KA, D’Angelo BR, Kaufman JN,Binder JR. Interrupting the “stream ofconsciousness”: an fMRI investigation. Neuroimage.2006;29(4):1185-1191.
43. Nolen-Hoeksema S. Ruminative coping withdepression. In: Heckhausen J, Dweck CS, eds.Motivation and Self-Regulation Across the Life Span.New York, NY: Cambridge University Press;1998:237-256.
44. Cooney RE, Joormann J, Eugène F, Dennis EL,Gotlib IH. Neural correlates of rumination indepression. Cogn Affect Behav Neurosci.2010;10(4):470-478.
45. Drevets WC, Price JL, Furey ML. Brainstructural and functional abnormalities in mooddisorders: implications for neurocircuitry models ofdepression. Brain Struct Funct. 2008;213(1-2):93-118.
46. Koenigs M, Grafman J. The functionalneuroanatomy of depression: distinct roles forventromedial and dorsolateral prefrontal cortex.Behav Brain Res. 2009;201(2):239-243.
47. Pizzagalli DA. Frontocingulate dysfunction indepression: toward biomarkers of treatmentresponse. Neuropsychopharmacology.2011;36(1):183-206.
48. Fitzgerald PB, Oxley TJ, Laird AR, Kulkarni J,Egan GF, Daskalakis ZJ. An analysis of functionalneuroimaging studies of dorsolateral prefrontalcortical activity in depression. Psychiatry Res.2006;148(1):33-45.
49. Posner J, Hellerstein DJ, Gat I, et al.Antidepressants normalize the default modenetwork in patients with dysthymia. JAMAPsychiatry. 2013;70(4):373-382.
50. Drevets WC, Price JL, Simpson JR Jr, et al.Subgenual prefrontal cortex abnormalities in mooddisorders. Nature. 1997;386(6627):824-827.
51. Coryell W, Nopoulos P, Drevets W, Wilson T,Andreasen NC. Subgenual prefrontal cortexvolumes in major depressive disorder andschizophrenia: diagnostic specificity and prognosticimplications. Am J Psychiatry. 2005;162(9):1706-1712.
52. Botteron KN, Raichle ME, Drevets WC, HeathAC, Todd RD. Volumetric reduction in left subgenualprefrontal cortex in early onset depression. BiolPsychiatry. 2002;51(4):342-344.
53. Hirayasu Y, Shenton ME, Salisbury DF, et al.Subgenual cingulate cortex volume in first-episodepsychosis. Am J Psychiatry. 1999;156(7):1091-1093.
54. Giuliani NR, Drabant EM, Gross JJ. Anteriorcingulate cortex volume and emotion regulation: isbigger better? Biol Psychol. 2011;86(3):379-382.
55. Mannie ZN, Harmer CJ, Cowen PJ, Norbury R.A functional magnetic resonance imaging study ofverbal working memory in young people atincreased familial risk of depression. Biol Psychiatry.2010;67(5):471-477.
Familial Major Depressive Disorder Original Investigation Research
jamapsychiatry.com JAMA Psychiatry Published online December 25, 2013 E13
Copyright 2013 American Medical Association. All rights reserved.
Downloaded From: http://archpsyc.jamanetwork.com/ by a Columbia University User on 12/31/2013