Digital modulation techniques
40
CHAPTER 5 Digital modulation techniques Modulation is defined as the process by which some characteristics of a carrier is varied in accordance with a modulating wave. In digital communications, the modulating wave consists of binary data or an M-ary encoded version of it and the carrier is sinusoidal wave. Different Shift keying methods that are used in digital modulation techniques are Amplitude shift keying [ASK] Frequency shift keying [FSK] Phase shift keying [PSK] Fig shows different modulations
-
Upload
khangminh22 -
Category
Documents
-
view
4 -
download
0
Transcript of Digital modulation techniques

CHAPTER 5
Digital modulation techniques
Modulation is defined as the process by which some characteristics of a carrier is
varied in accordance with a modulating wave. In digital communications, the
modulating wave consists of binary data or an M-ary encoded version of it and the
carrier is sinusoidal wave.
Different Shift keying methods that are used in digital modulation techniques are
Amplitude shift keying [ASK]
Frequency shift keying [FSK]
Phase shift keying [PSK]
Fig shows different modulations

1. ASK[Amplitude Shift Keying]:
In a binary ASK system symbol ‘1’ and ‘0’ are transmitted as
tfCosT
EtS
b
b11 2
2)( for symbol 1
0)(2 tS for symbol 0
2. FSK[Frequency Shift Keying]:
In a binary FSK system symbol ‘1’ and ‘0’ are transmitted as
tfCosT
EtS
b
b11 2
2)( for symbol 1
tfCosT
EtS
b
b22 2
2)( for symbol 0
3. PSK[Phase Shift Keying]:
In a binary PSK system the pair of signals S1(t) and S2(t) are used to representbinary symbol ‘1’ and ‘0’ respectively.
tfCosT
EtS c
b
b 22
)(1 --------- for Symbol ‘1’
tfCosT
EtfCos
T
EtS c
b
bc
b
b 22
)2(2
)(2 ------- for Symbol ‘0’
Hierarchy of digital modulation technique
Digital Modulation Technique
Coherent Non - Coherent
Binary(m) = 2
M - ary Hybrid
* ASK M-ary ASK M-ary APK* FSK M-ary FSK M-ary QAM* PSK M-ary PSK
(QPSK)
Binary(m) = 2
M - ary
* ASK M-ary ASK* FSK M-ary FSK* DPSK M-ary DPSK
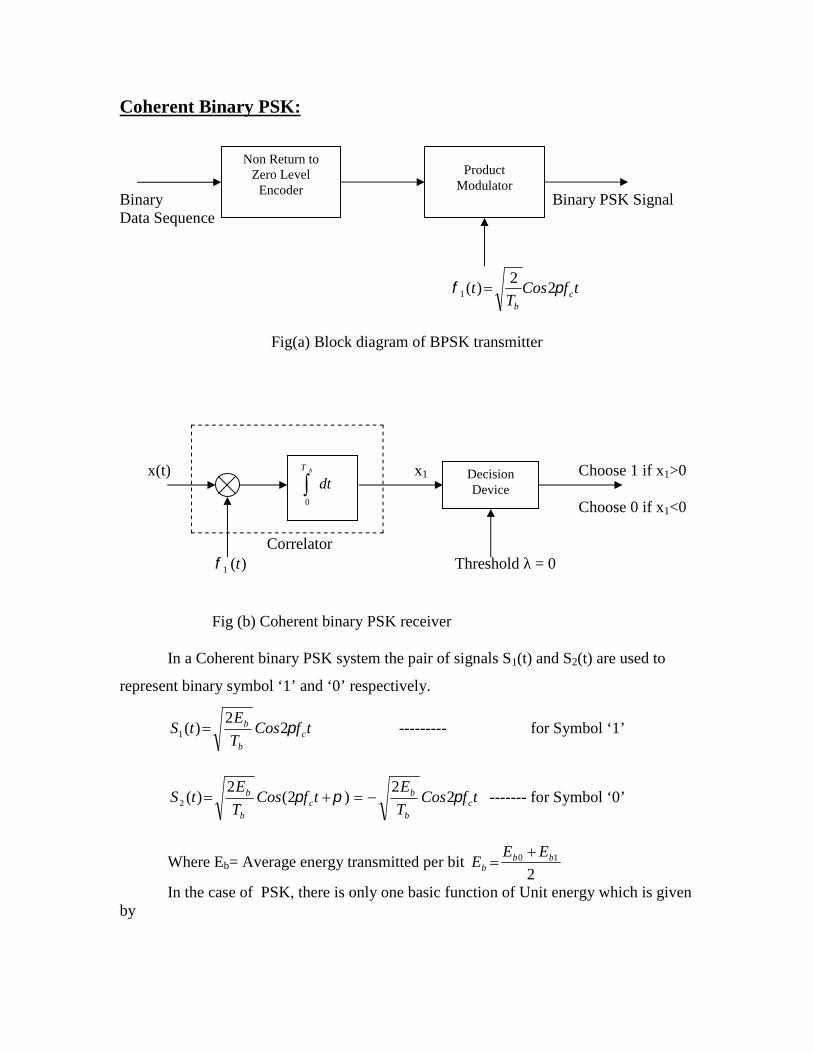
Coherent Binary PSK:
Binary Binary PSK SignalData Sequence
tfCosT
t cb
22
)(1
Fig(a) Block diagram of BPSK transmitter
x(t) x1 Choose 1 if x1>0
Choose 0 if x1<0
Correlator)(1 t Threshold λ = 0
Fig (b) Coherent binary PSK receiver
In a Coherent binary PSK system the pair of signals S1(t) and S2(t) are used to
represent binary symbol ‘1’ and ‘0’ respectively.
tfCosT
EtS c
b
b 22
)(1 --------- for Symbol ‘1’
tfCosT
EtfCos
T
EtS c
b
bc
b
b 22
)2(2
)(2 ------- for Symbol ‘0’
Where Eb= Average energy transmitted per bit2
10 bbb
EEE
In the case of PSK, there is only one basic function of Unit energy which is givenby
Non Return toZero Level
Encoder
ProductModulator
bT
dt0
DecisionDevice
bcb
TttfCosT
t 022
)(1
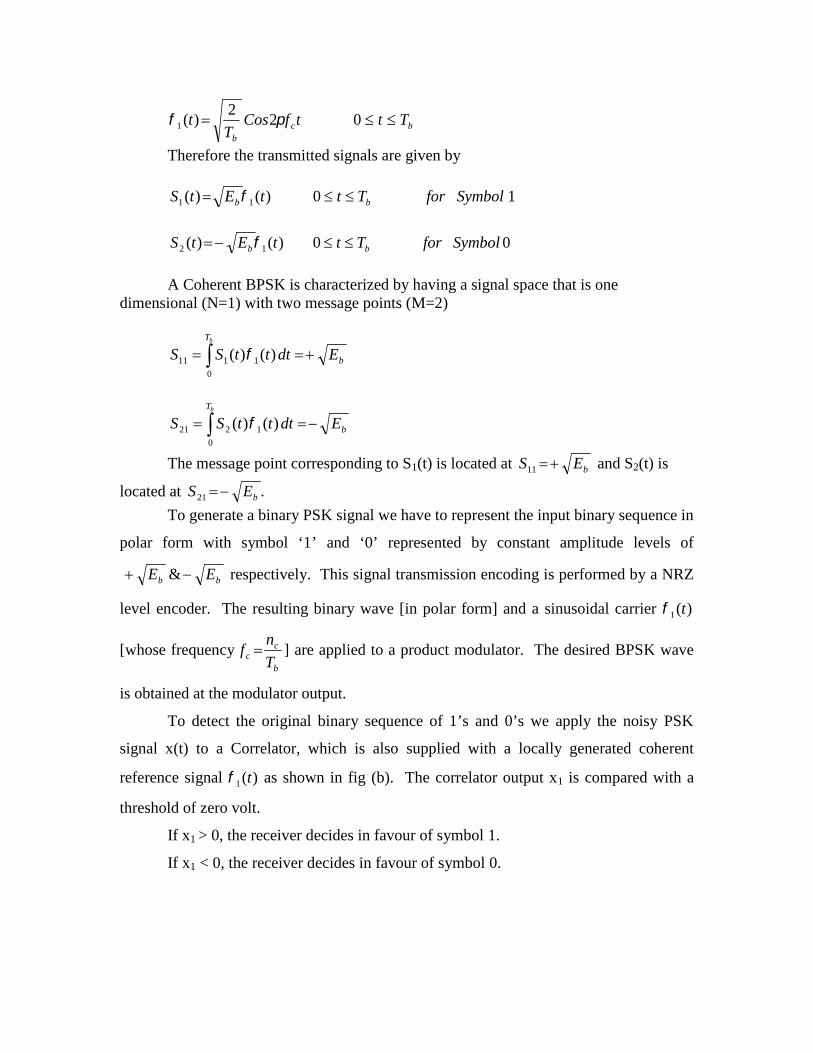
Therefore the transmitted signals are given by
10)()( 11 SymbolforTttEtS bb
00)()( 12 SymbolforTttEtS bb
A Coherent BPSK is characterized by having a signal space that is onedimensional (N=1) with two message points (M=2)
b
T
EdtttSSb
)()( 1
0
111
b
T
EdtttSSb
)()( 1
0
221
The message point corresponding to S1(t) is located at bES 11 and S2(t) is
located at .21 bES To generate a binary PSK signal we have to represent the input binary sequence in
polar form with symbol ‘1’ and ‘0’ represented by constant amplitude levels of
bb EE & respectively. This signal transmission encoding is performed by a NRZ
level encoder. The resulting binary wave [in polar form] and a sinusoidal carrier )(1 t
[whose frequencyb
cc T
nf ] are applied to a product modulator. The desired BPSK wave
is obtained at the modulator output.
To detect the original binary sequence of 1’s and 0’s we apply the noisy PSK
signal x(t) to a Correlator, which is also supplied with a locally generated coherent
reference signal )(1 t as shown in fig (b). The correlator output x1 is compared with a
threshold of zero volt.
If x1 > 0, the receiver decides in favour of symbol 1.
If x1 < 0, the receiver decides in favour of symbol 0.

Probability of Error Calculation ‘Or’Bit Error rate Calculation [BER Calculation] :-
In BPSK system the basic function is given by
bcb
TttfCosT
t 022
)(1
The signals S1(t) and S2(t) are given by
10)()( 11 SymbolforTttEtS bb
00)()( 12 SymbolforTttEtS bb
The signal space representation is as shown in fig (N=1 & M=2)
0
Fig. Signal Space Representation of BPSKThe observation vector x1 is related to the received signal x(t) by
dtttxxT
0
11 )()(
If the observation element falls in the region R1, a decision will be made in favour
of symbol ‘1’. If it falls in region R2 a decision will be made in favour of symbol ‘0’.
The error is of two types
1) Pe(0/1) i.e. transmitted as ‘1’ but received as ‘0’ and
2) Pe(1/0) i.e. transmitted as ‘0’ but received as ‘1’.
Error of 1st kind is given by
1
02
21
2 2
)(exp
2
1)0/1( dx
xPe
Assuming Gaussian Distribution
Region R1Region R2
Message Point 2S2(t)
Message Point 1S1(t)Decision Boundary
-bE bE

Where μ = mean value = bE for the transmission of symbol ‘0’
2 = Variance =2
0Nfor additive white Gaussiance noise.
Threshold Value λ = 0. [Indicates lower limit in integration]
Therefore the above equation becomes
1
0 0
21
0
0
)(exp
1)0/1( dx
N
Ex
NPP b
ee
Put0
1
N
ExZ b
dzZPPNE
ee
b
)/(
20
0
)(exp1
)0/1(
02
1)0/1(
N
EerfcP b
e
Similarly02
1)1/0(
N
EerfcP b
e
The total probability of error )1()1/0()0()0/1( eeeee PPPPP assuming
probability of 1’s and 0’s are equal.
)1/0()0/1([2
1eee PPP ]
02
1
N
EerfcP b
e
Coherent Binary FSK
In a binary FSK system symbol ‘1’ and ‘0’ are transmitted as
tfCosT
EtS
b
b11 2
2)( for symbol 1
tfCosT
EtS
b
b22 2
2)( for symbol 0
Frequencyb
ci T
inf
for some fixed integer nc and i=1, 2
The basic functions are given by

tfCosT
tb
11 22
)( and
OtherwiseZeroandTtfortfCosT
t bb
022
)( 22
Therefore FSK is characterized by two dimensional signal space with twomessage points i.e. N=2 and m=2.
The two message points are defined by the signal vector
01
bES and
bES
02
Generation and Detection:-
fig: FSK transmitter and receiver
fig a
fig b

A binary FSK Transmitter is as shown in fig. (a). The incoming binary
data sequence is applied to on-off level encoder. The output of encoder is bE volts for
symbol 1 and 0 volts for symbol ‘0’. When we have symbol 1 the upper channel is
switched on with oscillator frequency f1, for symbol ‘0’, because of inverter the lower
channel is switched on with oscillator frequency f2. These two frequencies are combined
using an adder circuit and then transmitted. The transmitted signal is nothing but
required BFSK signal.
The detector consists of two correlators. The incoming noisy BFSK signal x(t) is
common to both correlator. The Coherent reference signal )()( 21 tandt are supplied to
upper and lower correlators respectively.
The correlator outputs are then subtracted one from the other and resulting a
random vector ‘l’ (l=x1 - x2). The output ‘l’ is compared with threshold of zero volts.
If l > 0, the receiver decides in favour of symbol 1.
l < 0, the receiver decides in favour of symbol 0.
Probability of Error Calculation:-
In binary FSK system the basic functions are given by
bb
TttfCosT
t 022
)( 11
bb
TttfCosT
t 022
)( 22
The transmitted signals S1(t) and S2(t) are given by
)()( 11 tEtS b for symbol 1
)()( 22 tEtS b for symbol 0
Therefore Binary FSK system has 2 dimensional signal space with two messages
S1(t) and S2(t), [N=2 , m=2] they are represented as shown in fig.

Fig. Signal Space diagram of Coherent binary FSK system.
The two message points are defined by the signal vector
01
bES and
bES
02
The observation vector x1 and x2 ( output of upper and lower correlator) are
related to input signal x(t) as
bT
dtttxx0
11 )()( and
bT
dtttxx0
22 )()(
Assuming zero mean additive white Gaussian noise with input PSD2
0N. with
variance2
0N.
The new observation vector ‘l’ is the difference of two random variables x1 & x2.
l = x1 – x2

When symbol ‘1’ was transmitted x1 and x2 has mean value of 0 and
bE respectively.
Therefore the conditional mean of random variable ‘l’ for symbol 1 was
transmitted is
b
b
E
E
xE
xE
lE
0
11121
Similarly for ‘0’ transmission bEl
E
0
The total variance of random variable ‘l’ is given by
0
21 ][][][
N
xVarxVarlVar
The probability of error is given by
dlN
El
NPP b
ee
0 0
2
0
0 2
)(exp
2
1)0/1(
Put02N
ElZ b
0
2
20
22
1
)exp(1
0
N
Eerfc
dzzP
b
N
E
e
b
Similarly
01 22
1
N
EerfcP b
e

The total probability of error = )1/0()0/1([2
1eee PPP ]
Assuming 1’s & 0’s with equal probabilities
Pe= ][2
110 ee PP
022
1
N
EerfcP b
e
BINARY ASK SYSTEM:-
Binary Binary ASK
Data Sequence Signal
tfCosT
t eb
22
)(1
Fig (a) BASK transmitter
x(t) If x > λ choose symbol 1
If x < λ choose symbol 0
)(1 t Threshold λ
Fig (b) Coherent binary ASK demodulator
In Coherent binary ASK system the basic function is given by
beb
TttfCosT
t 022
)(1
The transmitted signals S1(t) and S2(t) are given by
1)()( 11 SymbolfortEtS b
00)(2 SymbolfortS
The BASK system has one dimensional signal space with two messages (N=1, M=2)
ProductModulator
ON-OFFLevel
Encoder
DecisionDevice
X bT
dt0

bE
)(1 t
02
bE
Fig. (c) Signal Space representation of BASK signal
In transmitter the binary data sequence is given to an on-off encoder. Which
gives an output bE volts for symbol 1 and 0 volt for symbol 0. The resulting binary
wave [in unipolar form] and sinusoidal carrier )(1 t are applied to a product modulator.
The desired BASK wave is obtained at the modulator output.
In demodulator, the received noisy BASK signal x(t) is apply to correlator with
coherent reference signal )(1 t as shown in fig. (b). The correlator output x is compared
with threshold λ.
If x > λ the receiver decides in favour of symbol 1.
If x < λ the receiver decides in favour of symbol 0.
BER Calculation:
In binary ASK system the basic function is given by
bcb
TttfCosT
t 022
)(1
The transmitted signals are given by
1)()( 11 SymbolfortEtS b
00)(2 SymbolfortS
Therefore the average transmitted energy per bit42
20
2
2
2
10 b
b
bbb
TATA
EEE
The probability of error is given by
Region E1Region E2
MessagePoint 2
MessagePoint 1

dxN
x
NP
bE oe
2
2
0
0
)0(exp
1
Where ‘x’ is the observed random vector. μ = 0, because the average value for symbol ‘0’
transmission is zero (0).
202 N
assuming additive white Gaussian noise with into PSD2
0N
Let0N
xZ
0
2
20
22
1
)exp(1
0
N
Eerfc
dzzP
b
N
E
e
b
similarly
01 22
1
N
EerfcP b
e
The total probability of error = ][2
110 ee PP
022
1
N
EerfcP b
e
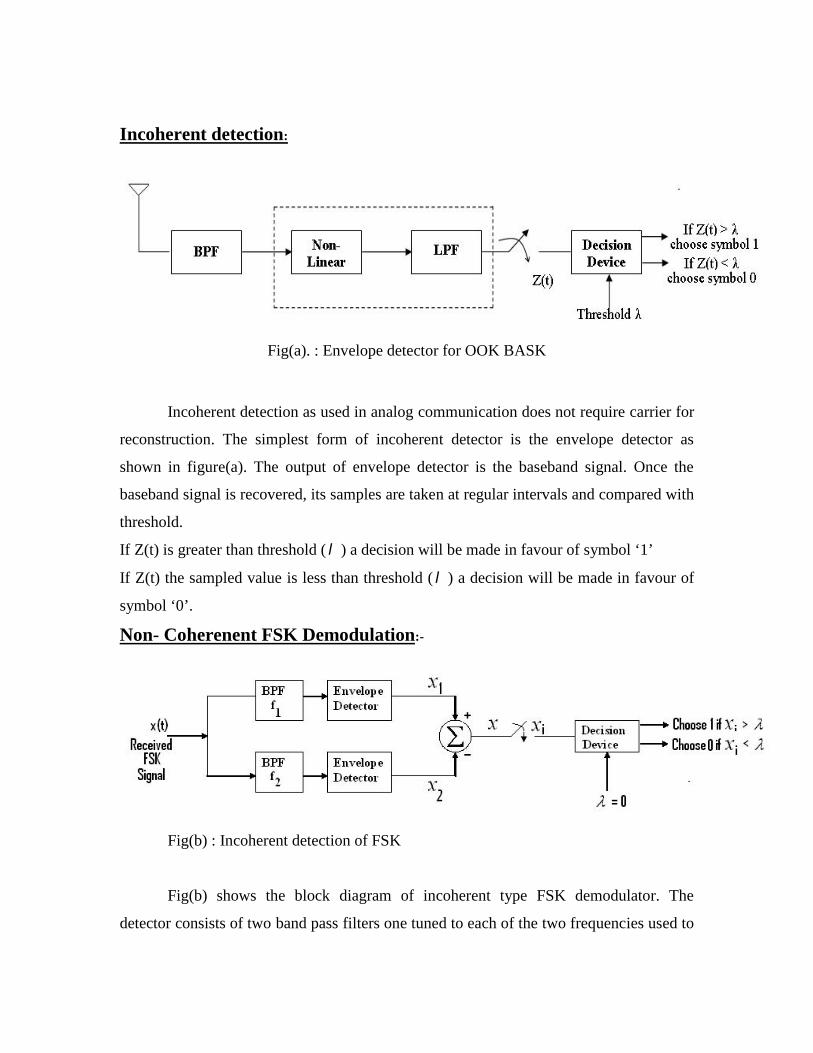
Incoherent detection:
Fig(a). : Envelope detector for OOK BASK
Incoherent detection as used in analog communication does not require carrier for
reconstruction. The simplest form of incoherent detector is the envelope detector as
shown in figure(a). The output of envelope detector is the baseband signal. Once the
baseband signal is recovered, its samples are taken at regular intervals and compared with
threshold.
If Z(t) is greater than threshold ( ) a decision will be made in favour of symbol ‘1’
If Z(t) the sampled value is less than threshold ( ) a decision will be made in favour of
symbol ‘0’.
Non- Coherenent FSK Demodulation:-
Fig(b) : Incoherent detection of FSK
Fig(b) shows the block diagram of incoherent type FSK demodulator. The
detector consists of two band pass filters one tuned to each of the two frequencies used to

communicate ‘0’s and ‘1’s., The output of filter is envelope detected and then baseband
detected using an integrate and dump operation. The detector is simply evaluating which
of two possible sinusoids is stronger at the receiver. If we take the difference of the
outputs of the two envelope detectors the result is bipolar baseband.
The resulting envelope detector outputs are sampled at t = kTb and their values are
compared with the threshold and a decision will be made infavour of symbol 1 or 0.
Differential Phase Shift Keying:- [DPSK]
Fig. (a) DPSK Transmitter
Fig. (b) DPSK Receiver
A DPSK system may be viewed as the non coherent version of the PSK. It eliminates
the need for coherent reference signal at the receiver by combining two basic operations
at the transmitter
(1) Differential encoding of the input binary wave and
(2) Phase shift keying

Hence the name differential phase shift keying [DPSK]. To send symbol ‘0’ we
phase advance the current signal waveform by 1800 and to send symbol 1 we leave the
phase of the current signal waveform unchanged.
The differential encoding process at the transmitter input starts with an arbitrary
first but, securing as reference and thereafter the differentially encoded sequence{dk} is
generated by using the logical equation.
bdbdd kkkkk 11
Where bk is the input binary digit at time kTb and dk-1 is the previous value of the
differentially encoded digit. Table illustrate the logical operation involved in the
generation of DPSK signal.
Input Binary Sequence {bK} 1 0 0 1 0 0 1 1
Differentially Encoded 1
sequence {dK}
1 0 1 1 0 1 1 1
Transmitted Phase 0 0 Π 0 0 Π 0 0 0
Received Sequence
(Demodulated Sequence)
1 0 0 1 0 0 1 1
A DPSK demodulator is as shown in fig(b). The received signal is first passed
through a BPF centered at carrier frequency fc to limit noise power. The filter output and
its delay version are applied to correlator the resulting output of correlator is proportional
to the cosine of the difference between the carrier phase angles in the two correlator
inputs. The correlator output is finally compared with threshold of ‘0’ volts .
If correlator output is +ve -- A decision is made in favour of symbol ‘1’
If correlator output is -ve --- A decision is made in favour of symbol ‘0’

COHERENT QUADRIPHASE – SHIFT KEYING
Fig. (a) QPSK Transmitter
Fig. (b) QPSK Receiver
In case of QPSK the carrier is given by
410)2sin(]4/)12sin[(2
)2cos(]4/)12[(2
)(
410]4/)12(2[2
)(
toiTttfiT
EtfiCos
T
Ets
toiTtitfCosT
Ets
cci
ci

Fig. (c) QPSK Waveform
In QPSK system the information carried by the transmitted signal is contained in
the phase. The transmitted signals are given by
114
72cos
2)(
014
52cos
2)(
004
32cos
2)(
104
2cos2
)(
3
2
1
dibitinputfortT
Et
dibitinputfortT
Et
dibitinputfortT
Et
bitdiinputfortT
Et
fS
fS
fS
fS
ct
c
c
c
Where the carrier frequency7nf C
C for some fixed integer nc

E = the transmitted signal energy per symbol.
T = Symbol duration.
The basic functions bygivenaretandt )()(21
Tttt
Tttt
fT
fT
cb
cb
02sin2
)(
02cos2
)(
2
1
There are four message points and the associated signal vectors are defined by
4,3,2,1
412sin
412cos
i
iE
iE
Si
The table shows the elements of signal vectors, namely Si1 & Si2
Table:-
Input dibit Phase of
QPSK
signal(radians)
Coordinates of message
points
Si1 Si2
10
4
2
E 2E
00
4
32
E 2E
01
4
52
E 2E
11
4
72
E 2E

Therefore a QPSK signal is characterized by having a two dimensional signal
constellation(i.e.N=2)and four message points(i.e. M=4) as illustrated in fig(d)
.Fig (d) Signal-space diagram of coherent QPSK system.
Generation:-
Fig(a) shows a block diagram of a typical QPSK transmitter, the incoming binary
data sequence is first transformed into polar form by a NRZ level encoder. Thus the
symbols 1& 0 are represented by EE bband respectively. This binary wave is
next divided by means of a demultiplexer [Serial to parallel conversion] into two separate
binary waves consisting of the odd and even numbered input bits. These two binary
waves are denoted by ao(t) and ae(t)
The two binary waves ao(t) and ae(t) are used to modulate a pair of quadrature
carriers or orthonormal basis functions )(&)(21
tt which are given by
tT
t
tT
t
f
f
c
c
2sin2
)(
&
2cos2
)(
2
1
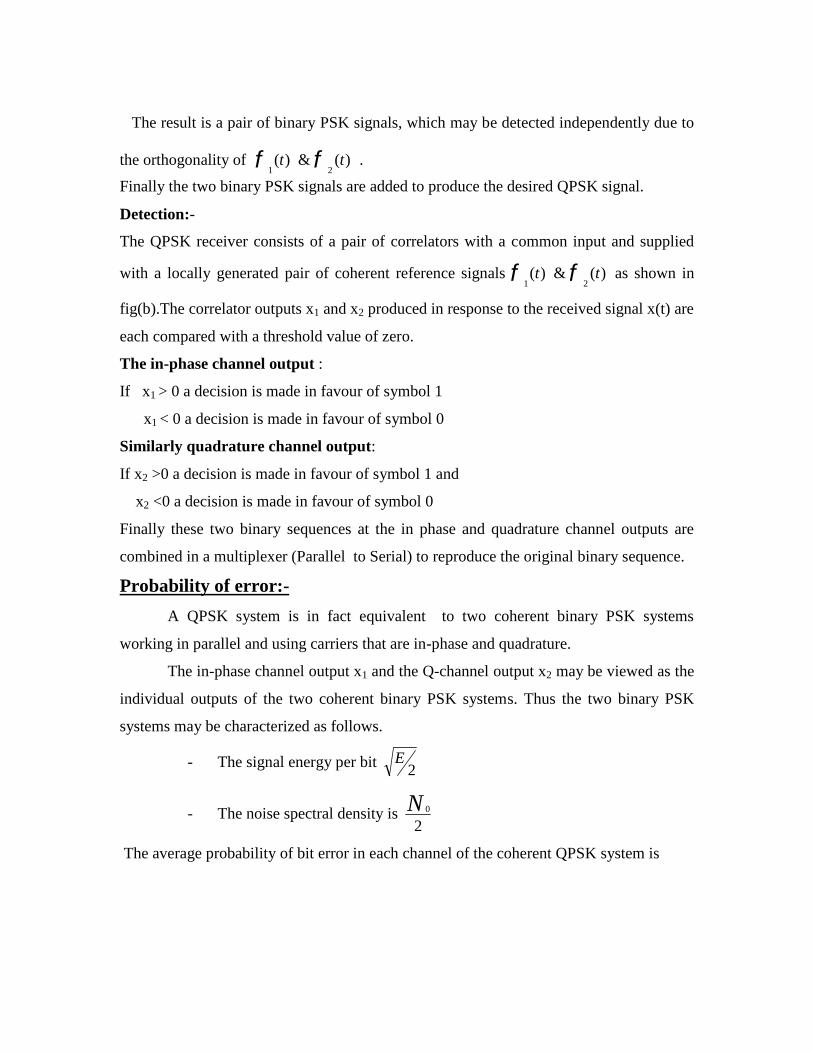
The result is a pair of binary PSK signals, which may be detected independently due to
the orthogonality of )(&)(21
tt .
Finally the two binary PSK signals are added to produce the desired QPSK signal.
Detection:-
The QPSK receiver consists of a pair of correlators with a common input and supplied
with a locally generated pair of coherent reference signals )(&)(21
tt as shown in
fig(b).The correlator outputs x1 and x2 produced in response to the received signal x(t) are
each compared with a threshold value of zero.
The in-phase channel output :
If x1 > 0 a decision is made in favour of symbol 1
x1 < 0 a decision is made in favour of symbol 0
Similarly quadrature channel output:
If x2 >0 a decision is made in favour of symbol 1 and
x2 <0 a decision is made in favour of symbol 0
Finally these two binary sequences at the in phase and quadrature channel outputs are
combined in a multiplexer (Parallel to Serial) to reproduce the original binary sequence.
Probability of error:-
A QPSK system is in fact equivalent to two coherent binary PSK systems
working in parallel and using carriers that are in-phase and quadrature.
The in-phase channel output x1 and the Q-channel output x2 may be viewed as the
individual outputs of the two coherent binary PSK systems. Thus the two binary PSK
systems may be characterized as follows.
- The signal energy per bit 2E
- The noise spectral density is2
0N
The average probability of bit error in each channel of the coherent QPSK system is

N
N
Eerfc
EEE
erfcP
2 0
0
1
2
1
22
2
1
The bit errors in the I-channel and Q-channel of the QPSK system are statistically
independent . The I-channel makes a decision on one of the two bits constituting a
symbol (di bit) of the QPSK signal and the Q-channel takes care of the other bit.
Therefore, the average probability of a direct decision resulting from the
combined action of the two channels working together is
pc= probability of correct reception
p1= probability of error
No
Eerfc
No
Eerfc
No
Eerfc
PPC
24
1
21
22
11
1
2
2
21
The average probability of symbol error for coherent QPSK is given by
No
Eerfc
No
Eerfc
PP Ce
24
1
2
1
2
In the region where 12
oN
E We may ignore the second term and so the
approximate formula for the average probability of symbol error for coherent QPSK
system is
No
EerfcPe 2

Minimum shift keying:-
In a continuous phase frequency shift keying [CPFSK] system the transmitted
signal is given by
0)0(2cos2
1)0(2cos2
)(
2
1
symbolfort
symbolfort
tS
fTE
fTE
b
b
b
b
Where Eb is the transmitted signal energy per bit and Tb is bit duration the CPSK signal
S(t) is expressed in the conventional form of an angle modulated signal as
)0(2cos2
)( ttS fTE
cb
b
The phase θ(t) is a continuous function of time which is given by
ratiodeviationtheh
frequencycarriertheWhere
Th
h
h
bygivenaresfrequenciedtransmitteThe
tt
t
fff
fffT
ff
Tff
ff
TTh
c
b
c
bc
bc
bb
&
)(
)(2/1
&
0)0()(
21
21
2
1
21
2
2
The variation of phase θ(t) with time t follows a path consisting of sequence of straight
lines, the slope of which represent frequency change Fig(a) shows the possible paths
starting from time t=0. This plot is known as “Phase tree”.
When h= ½ the frequency deviation equals half the bit rate. This is the minimum
frequency difference (deviation) that allows the two FSK signals representing symbol ‘1’

& ‘0’. For this reason a CPFSK signal with a deviation ratio of one- half is commonly
referred to as “minimum shift keying”[MSK].
Deviation ratio h is measured with respect to the bit rate 1/Tb
at t =Tb
fig(b) phase tree
Fig(c): Phase Trellis, for sequence 1101000
In terms of In phase and Quadrature Component
0
1)0()(
Symbolforh
SymbolforhTb
)2()]([2
)2()]([2
)( tfSintSinT
EtfCostCos
T
Ets c
b
bc
b
b

with the deviation ratio h=1/2
+ Sign corresponds to symbol 1
- Sign corresponds to symbol 0
In phase components
For the interval of
consists of half cosine pulse
+ Sign corresponds to θ(0) =0
- Sign corresponds to θ(0) = п
Quadrature components
For the interval of
consists of half sine pulse
+ Sign corresponds to θ(Tb) =п/2
- Sign corresponds to θ(Tb) = -п/2
bb
TttT
t 02
)0()(
bbbb
b
bb
b
b
b
TtTtT
CosT
E
tT
CosCosT
E
tCosT
Ets
2
2
2])0([
2
])([2
)(1
bb TtT
bbb
b
bb
b
b
b
bQ
TttTT
E
tT
CosTSinT
E
tSinT
Ets
202
sin2
2])([
2
])([2
)(
bTt 20

since the phase states θ(0) and θ(Tb) can each assume one of the two possible values,
any one of the four possibilities can arise
Basic functions are given by
we may express the MSK signal in the form
The coefficients are given by
and
bbcbb
TtTtfCostT
CosT
t
)2(
2
2)(1
bcbb
TttfSintT
SinT
t 20)2(2
2)(2
bTttststs 0)()()( 2211
bbb
T
T
TtTCosE
dtttssb
b
)0(
)()( 11
bbb
T
TtTSinE
dtttssb
b
20)(
)()(2
0
22

The signal space diagram for MSK system is as shown in fig
Fig: signal space diagram for MSK system
Signal Space Characterization of MSK

Fig: sequence and waveforms for MSK signal
(a) input binary sequence (b) scaled time function )(11 ts
(c) scaled time function )(22 ts (d)obtained by adding (b) and (c)
In the case of AWGN channel, the received signal is given by
x(t) = s(t) + w(t)
where s(t) is the transmitted MSK signal and w(t) is the sample function of a white
Gaussian noise.
The projection of the received signal x(t) onto the reference signal )(1 t is
similarly the projection of the received signal x(t) onto the reference signal )(2 t isbb
T
T
TtTws
dtttxxb
b
11
11 )()(
b
T
Ttws
dtttxxb
20
)()(
22
2
0
22

If x2>0, the receiver chooses the estimate2
)(^ bT . If, on the other hand, x2<0, it
chooses the estimate2
)(^ bT .
To reconstruct the original binary sequence, we interleave the above two sets ofphase decisions,
1 If we have the estimates 0)0(^
and2
)(^ bT , or alternatively if we have the
estimates )0(^
and2
)(^ bT , the receiver makes a final decision in favor of
symbol 0.
2 If we have the estimates )0(^
and2
)(^ bT , or alternatively if we have
the estimates 0)0(^
and2
)(^ bT , the receiver makes a final decision in favor of
symbol 1.
Generation and detection of MSK signal:-
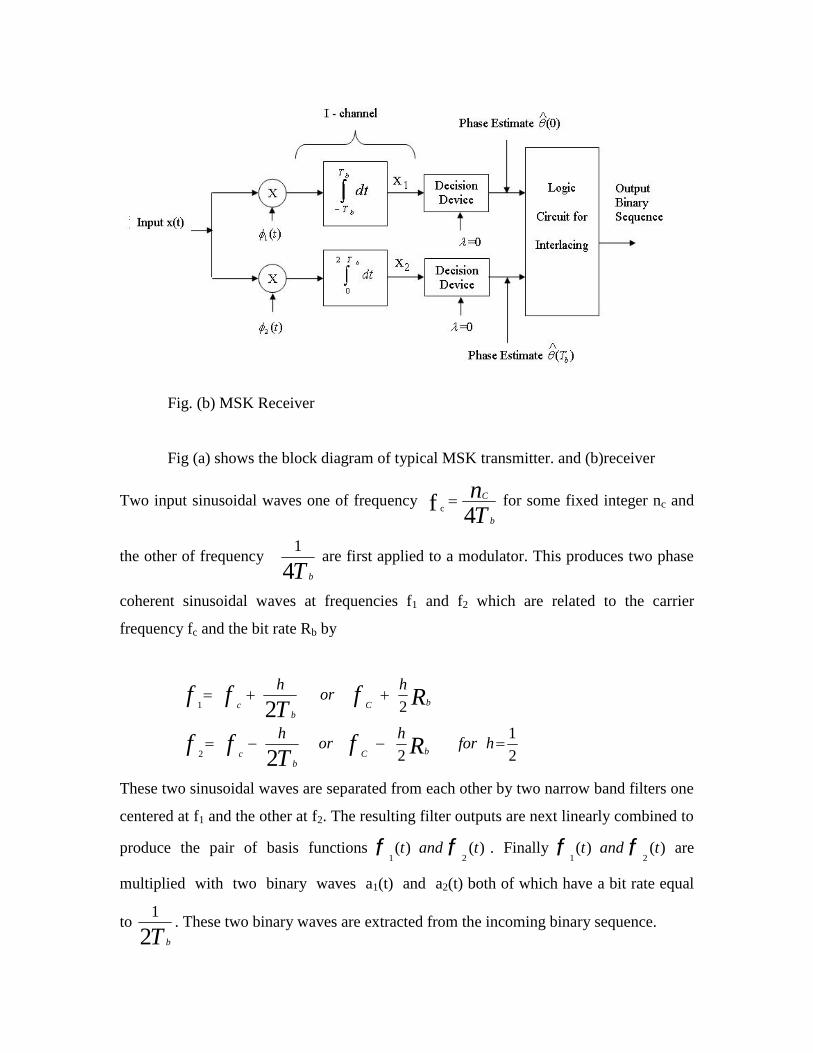
Fig. (b) MSK Receiver
Fig (a) shows the block diagram of typical MSK transmitter. and (b)receiver
Two input sinusoidal waves one of frequencyTn
b
C
4f c for some fixed integer nc and
the other of frequencyT b41
are first applied to a modulator. This produces two phase
coherent sinusoidal waves at frequencies f1 and f2 which are related to the carrier
frequency fc and the bit rate Rb by
2
1
2
2
2
2
2
1
hforh
orh
hor
h
RfT
ff
RfT
ff
bCb
c
bCb
c
These two sinusoidal waves are separated from each other by two narrow band filters one
centered at f1 and the other at f2. The resulting filter outputs are next linearly combined to
produce the pair of basis functions )()(21
tandt . Finally )()(21
tandt are
multiplied with two binary waves a1(t) and a2(t) both of which have a bit rate equal
toT b21
. These two binary waves are extracted from the incoming binary sequence.

Fig (b) shows the block diagram of a typical MSK receiver. The received signal
x(t) is correlated with locally generated replicas of the coherent reference signals
)()(21
tandt . The integration in the Q – channel is delayed by Tb seconds with
respect to the I - channel.
The resulting in-phase and quadrature channel correlator outputs x1 and x2 are
each compared with a threshold of zero. To estimate the phase θ(0) and θ(Tb). Finally
these phase decisions are interleaved so as to reconstruct the original input binary
sequence with a minimum average probability of symbol error in an AGWN channel.

PROBLEM 1.
Binary data has to be transmitted over a telephone link that has a usable bandwidth of
3000Hz and a maximum achievable signal-to-noise power ratio of 6 dB at its output..
a. Determine the maximum signaling rate and probability of error if a coherent
ASK scheme is used for transmitting binary data through this channel.
b. If the data is maintained at 300 bits/sec, calculate the error probability.
Solution:
a) If we assume that an ASK signal requires a bandwidth of 3rb Hz, then the
maximum signaling rate permissible is given by
Bandwidth =3 rb=3000 Hz
rb=1000 bits/sec.
0003.0464.312
124,
000,48
000,124
300022
4
2
2
2
2
QQP
andrAHence
A
A
PowerNoise
PowerSignalAverage
PowerNoise
APowerSignalAverage
e
b
b) If the bit rate is reduced to 300 bits/sec, then
10
2
10326.640
404
QQPe
r
A
b

PROBLEM 2
Binary data is transmitted over an RF band pass channel with a usable bandwidth of
10 MHz at a rate of (4.8) (106) bits/sec using an ASK signaling method. The carrier
amplitude at the receiver antenna is 1 mv and the noise power spectral density at the
receiver input is 10-15 watt/Hz. Find the error probability of a coherent and non coherent
receiver..
Solution:
a) The bit error probability for the coherent demodulator is
).10(226
/102/
8.4/10,1;4
7
15
62
QPe
Hzwatt
TmvATA
QP bb
e
b) for non coherent ASK pe is given by
,)16/(exp2
1 2 be TAP
pe = 0.0008
PROBLEM 3.
Binary data is transmitted at a rate of 106 bits/sec over a microwave link having a
bandwidth of 3 MHz. Assume that the noise power spectral density at the receiver
input is ./102/ 10 Hzwatt Find the average carrier power required at the receiver
input for coherent PSK and DPSK signaling schemes to maintain Pe ≤10-4.

Solution:
The probability of error for the PSK scheme is
dBmS
TS
Hence
TAP
schemeDPSKtheFor
dBmS
TS
thus
TSQP
DPSKav
bav
bDPSKe
av
bav
bavPSKe
3.3.2
517.8/
,
,102/exp2
1
48.1)10()10()75.3()(
75.3/2
,10/2
42
6102
4
This example illustrates that the DPSK signaling scheme requires about 1 dB more
power than the coherent PSK scheme when the error probability is of the order of
10-4.

Probability of Error
Definition: Defines average probability of error that can occur in a Communication
system
Error Functions(1) Error function erf(u):
u
dzzuerf0
2 )exp(2
)( -------- ( A6.1)
(2) Complementary error function erfc(u):
u
dzzuerfc )exp(2
)( 2
-------- ( A6.2)
Properties of Error function
1. erf(-u) = -erf(u) - Symmetry.
2. erf(u) approaches unity as u tends towards infinity.
1)exp(2
0
2
dzz -------- ( A6.3)
3. For a Random variable X, with mean mx and variance σx2, the probability
of X is defined by
X
XX
aerfamXamP
2)(
-------- ( A6.4)
Note: Relation: erfc(u) = 1 – erf(u)Tables are used to find these values.
Approximate Relation: ( only for large values of u )
)exp(
)(2u
uerfc
-------- ( A6.5)
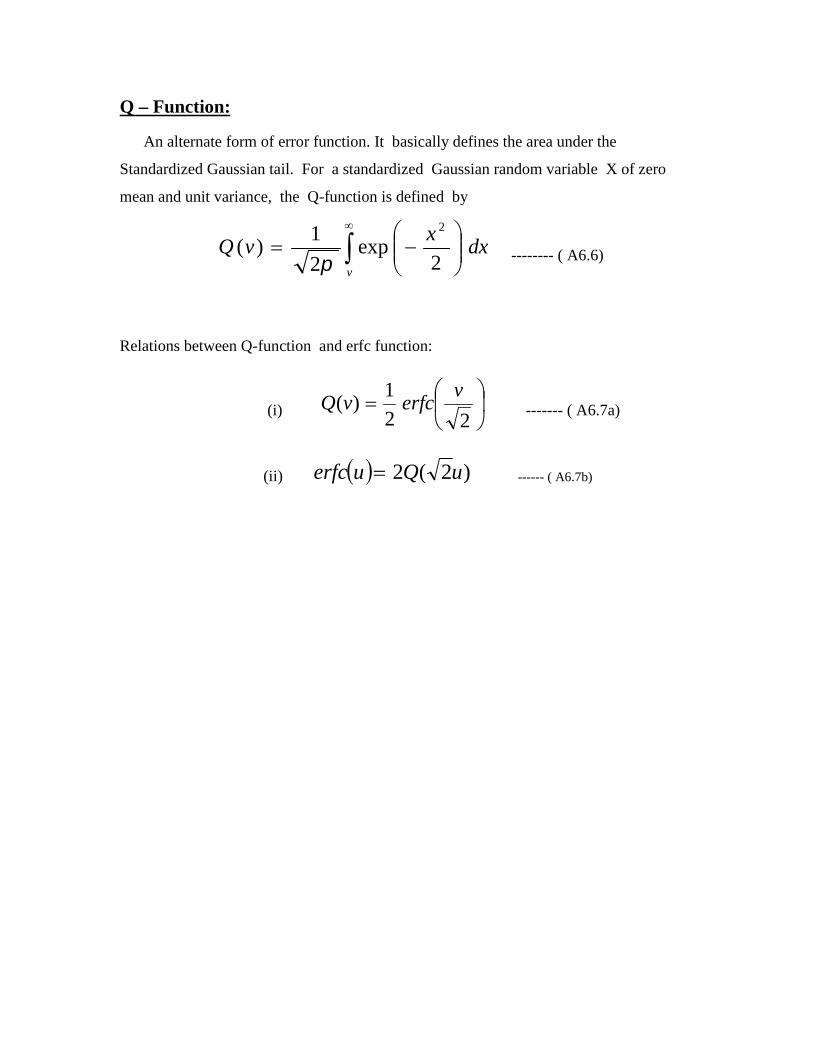
Q – Function:
An alternate form of error function. It basically defines the area under the
Standardized Gaussian tail. For a standardized Gaussian random variable X of zero
mean and unit variance, the Q-function is defined by
dxx
vQv
2exp
2
1)(
2
-------- ( A6.6)
Relations between Q-function and erfc function:
(i)
22
1)(
verfcvQ ------- ( A6.7a)
(ii) )2(2 uQuerfc ------ ( A6.7b)

Probability of Error Calculation for Binary PCM Systems
Consider a binary communication system in which the two symbols binary1 and binary0
are represented by the signals s1(t) and s2(t) respectively. Let E1 and E2 represent the
energies of the signals s1(t) and s2(t) respectively.
dttsETb
0
211 )( and dttsE
Tb
0
222 )( ----- ( A6.8)
The Probability of error for Communication Systems can be defined as
02
)1(
2
1
N
EerfcP b
e
--------- ( A6.9)
Where Eb is the average energy per bit defined by
221 EE
Eb
--------- ( A6.10)
and ρ is the correlation coefficient
dttstsE
Tb
b0
21 )()(1
------ ( A6.11)
and (No/2) represent the noise power spectral density in W/Hz.
Case (1): Uni-polar signaling:
In this scheme the signals are represented as
10)(1 SymbolforTtatS b
000)(2 SymbolforTttS b

Signal energies are E1 = a2 Tb and E2 = 0
Average energy per bit, Eb = a2 Tb/2.
Correlation coefficient = 0.
Probability of error,
02
)1(
2
1
N
EerfcP b
e
0
2
421
N
TaerfcP b
e
Case (2): Polar signaling:
In this scheme the signals are represented as
10)(1 SymbolforTtatS b
00)(2 SymbolforTtatS b

Signal energies are E1 = a2 Tb and E2 = a2 Tb
Average energy per bit, Eb = a2 Tb
Correlation coefficient = -1.
Probability of error,
02)1(
21
N
EerfcP b
e
0
2
2
1
N
TaerfcP b
e
Case (3): Manchester signaling:
In this scheme the signals are represented as
bb
b
TtTa
SymbolforTtatS
2/2/
12/02/)(1
bb
b
TtTa
SymbolforTtatS
2/2/
02/02/)(2
Signal energies are E1 = a2 Tb/4 and E2 = a2 Tb/4
Average energy per bit, Eb = a2 Tb/4
Correlation coefficient = -1.
Probability of error,
02)1(
21
N
EerfcP b
e
Reduces to
0
2
421
N
TaerfcP b
e

Example:
A binary PCM system using NRZ signaling operates just above the error threshold
with an average probability of error equal to 10-6. If the signaling rate is doubled,
find the new value of the average probability of error.
Solution:
For probability of error equal to 10-6.
Eb/N0 = 3.3 (from table)
The probability of error is
02
1
N
EerfcP b
e
If the signaling rate is doubled then Eb is reduced by a factor of 2 and correspondingly
Eb/N0 also reduces by 2. Hence the new probability of error will become .
310eP