Study on dyeing behavior of cotton organic cotton knitted fabrics
Diffusion of Bt cotton in India: Impact of Seed Prices and Varietal Approval
ANCHAL ARORACentre for International Trade and Development
School of International StudiesJawaharlal Nehru University
SANGEETA BANSALCentre for International Trade and Development Centre for International Trade and Development
School of International StudiesJawaharlal Nehru University
Paper prepared for presentation at the 15th ICABR C onference“Sustainability and The Bioeconomy”
Frascati (Rome), Italy, June 26-29, 2011
CONTENTS
• Introduction and spread of Bt cotton in India.• Price controls and Government Intervention.• Motivation.• Objective and scope of this study.• Description of various Diffusion models.• Methodology• Estimation and interpretation of results.• Estimation of Elasticities.• Predictions• Predictions• Conclusion• Policy Implications.
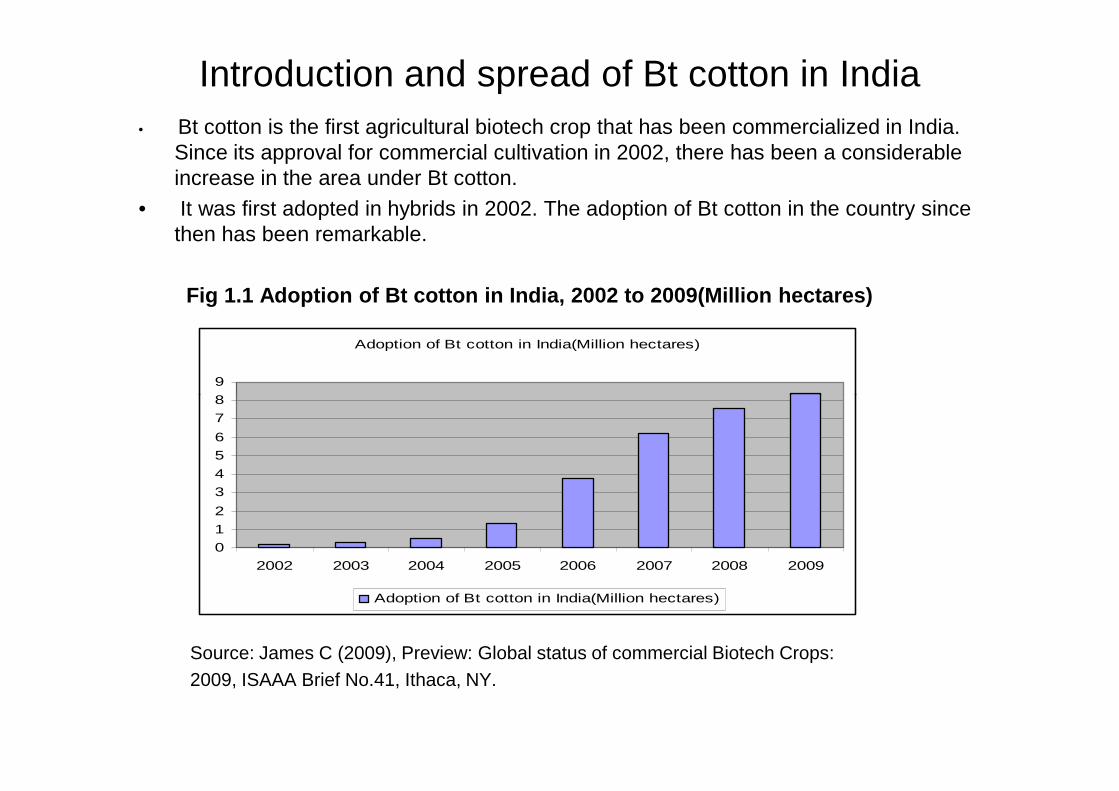
Introduction and spread of Bt cotton in India• Bt cotton is the first agricultural biotech crop that has been commercialized in India.
Since its approval for commercial cultivation in 2002, there has been a considerable increase in the area under Bt cotton.
• It was first adopted in hybrids in 2002. The adoption of Bt cotton in the country since then has been remarkable.
Fig 1.1 Adoption of Bt cotton in India, 2002 to 2009(Million hectares)
Adoption of Bt cotton in India(Million hectares)
8
9
Source: James C (2009), Preview: Global status of commercial Biotech Crops:2009, ISAAA Brief No.41, Ithaca, NY.
0
1
2
3
4
5
6
7
8
2002 2003 2004 2005 2006 2007 2008 2009
Adoption of Bt cotton in India(Million hectares)
PRICE CONTROLS AND GOVERNMENT INTERVENTION
• Monsanto (a US firm) in collaboration with an Indian firm, Mahyco, released 3 Btcotton hybrids for cultivation in India in March 2002.The domestic companies wholicensed the Bt trait from MMB (Mahyco-Monsanto Biotech) paid a one time licensefee as well as royalty fee in order to avail the gene. This additional cost incurred bythe domestic firms was passed on to the farmers.
• In 2006, the government of Andhra Pradesh (AP) intervened to control seed pricesand passed an ordinance directing MMB to reduce the price of 450 gm packet ofBollgard-I seeds from Rs 1600 to Rs 750. Other cotton growing states of Indiafollowed suit.
• After the initial approval of three hybrids, many more Bt cotton hybrids have beenapproved for cultivation in India. The number of hybrids increased from 4 in 2004 to62 in 2006 and further to 274 in 2008 (James C., 2008).
• This can be considered as the “Varietal Approval” that has increased portfolio ofchoice for farmers.
MOTIVATION
Qaim and de Janvry, 2003:
� They analyzed adoption and impact of Bt cotton in Argentina against the backgroundof monopoly pricing.
� Using farmers willingness to pay (WTP) for Bt cotton seeds and the expected level ofdemand for the new technology under different pricing regimes, they found the demandfor GM seeds to be price responsive, and the WTP to be much lower than the currentmarket price of Bt seeds.
� Hence, they postulated that a lower price would not only increase benefits for growers,� Hence, they postulated that a lower price would not only increase benefits for growers,but could also multiply company’s profits, thus resulting in a pareto improvement.
Sadashivappa and Qaim, 2009:
� They analyzed the adoption of Bt cotton in India in the light of government seed priceinterventions and found that the price controls have further increased the profits tofarmers but the impact of price controls on aggregate technology adoption is relativelysmall. Rather, these interventions may have negative implications for the company toinnovate in future.
� According to them, the take off phase for Bt cotton had already begun before 2006and today’s adoption rates would not be much lower even without the interventions.
.
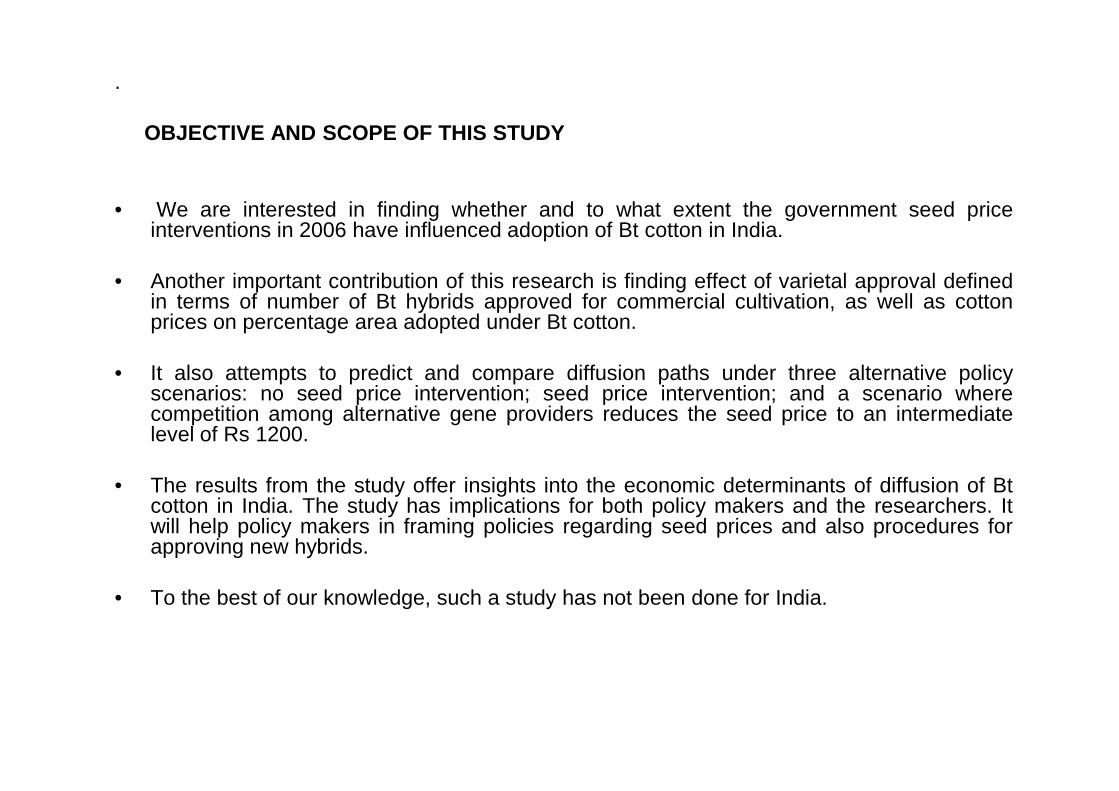
OBJECTIVE AND SCOPE OF THIS STUDY
• We are interested in finding whether and to what extent the government seed priceinterventions in 2006 have influenced adoption of Bt cotton in India.
• Another important contribution of this research is finding effect of varietal approval definedin terms of number of Bt hybrids approved for commercial cultivation, as well as cottonprices on percentage area adopted under Bt cotton.
• It also attempts to predict and compare diffusion paths under three alternative policyscenarios: no seed price intervention; seed price intervention; and a scenario wherescenarios: no seed price intervention; seed price intervention; and a scenario wherecompetition among alternative gene providers reduces the seed price to an intermediatelevel of Rs 1200.
• The results from the study offer insights into the economic determinants of diffusion of Btcotton in India. The study has implications for both policy makers and the researchers. Itwill help policy makers in framing policies regarding seed prices and also procedures forapproving new hybrids.
• To the best of our knowledge, such a study has not been done for India.
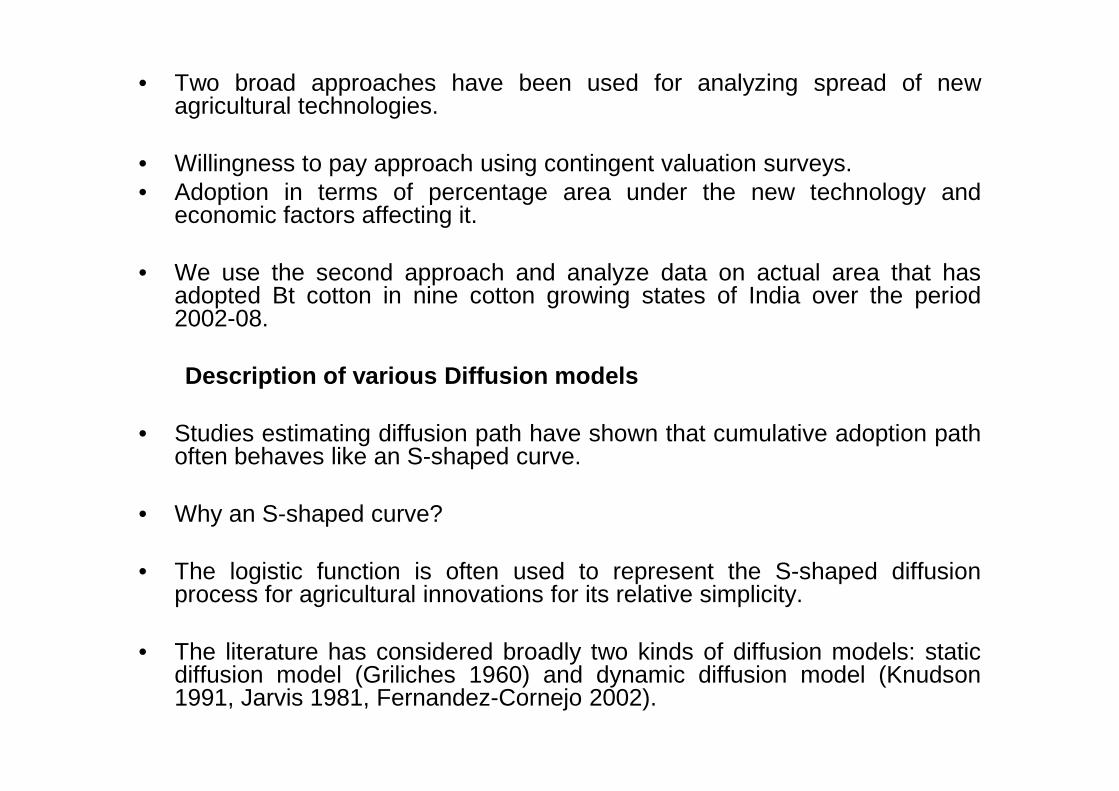
• Two broad approaches have been used for analyzing spread of newagricultural technologies.
• Willingness to pay approach using contingent valuation surveys.• Adoption in terms of percentage area under the new technology and
economic factors affecting it.
• We use the second approach and analyze data on actual area that hasadopted Bt cotton in nine cotton growing states of India over the period2002-08.
Description of various Diffusion models
• Studies estimating diffusion path have shown that cumulative adoption pathoften behaves like an S-shaped curve.
• Why an S-shaped curve?
• The logistic function is often used to represent the S-shaped diffusionprocess for agricultural innovations for its relative simplicity.
• The literature has considered broadly two kinds of diffusion models: staticdiffusion model (Griliches 1960) and dynamic diffusion model (Knudson1991, Jarvis 1981, Fernandez-Cornejo 2002).
Rationale for using a particular model
• An innovation’s profitability as compared with the traditional alternative is often regarded as the primary motivation behind adoption. This suggests that the widespread adoption of Bt cotton can be explained by its perceived profitability over the conventional cotton.
• Now, both seed prices and cotton prices could affect the rate of diffusion through • Now, both seed prices and cotton prices could affect the rate of diffusion through affecting profitability of the technology. Also, varietal approval could affect rate of diffusion.
• Since all these factors are impacting the rate of diffusion, we use a variable slope dynamic logistic model for our purpose.
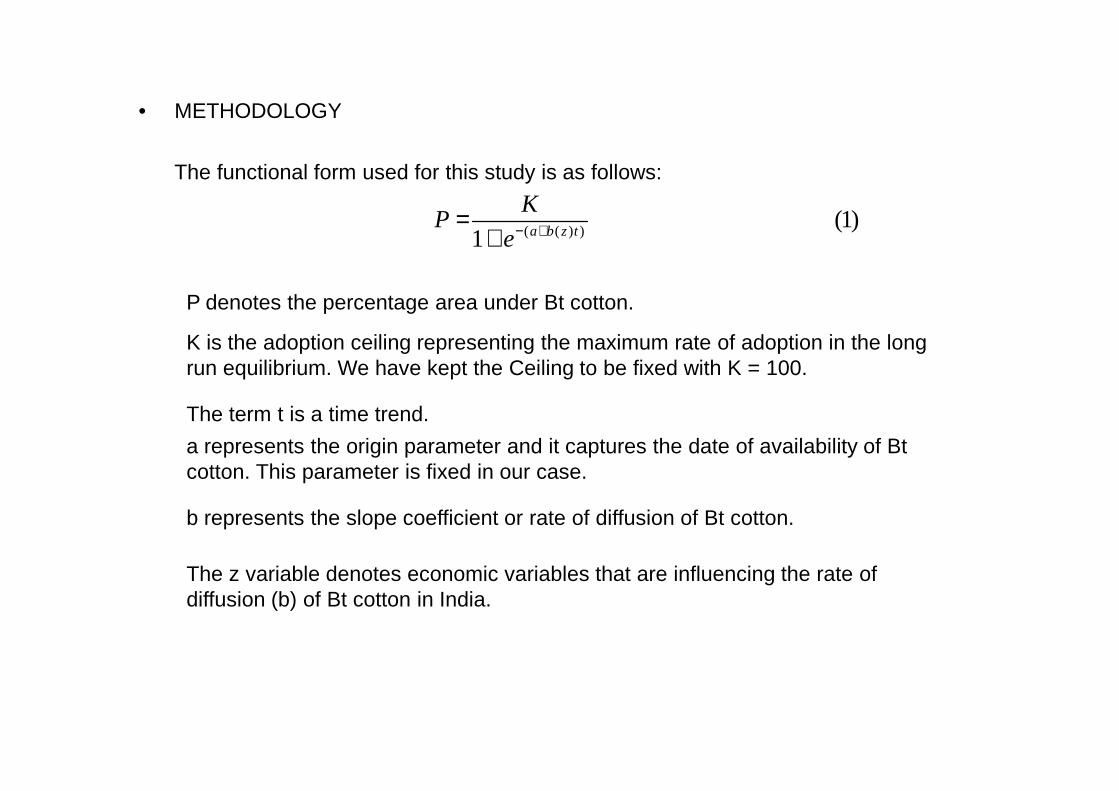
• METHODOLOGY
The functional form used for this study is as follows:
( ( ) )(1)
1 a b z t
KP
e− +=+
P denotes the percentage area under Bt cotton.
K is the adoption ceiling representing the maximum rate of adoption in the long run equilibrium. We have kept the Ceiling to be fixed with K = 100.
The term t is a time trend.
a represents the origin parameter and it captures the date of availability of Bt cotton. This parameter is fixed in our case.
b represents the slope coefficient or rate of diffusion of Bt cotton.
The z variable denotes economic variables that are influencing the rate of diffusion (b) of Bt cotton in India.
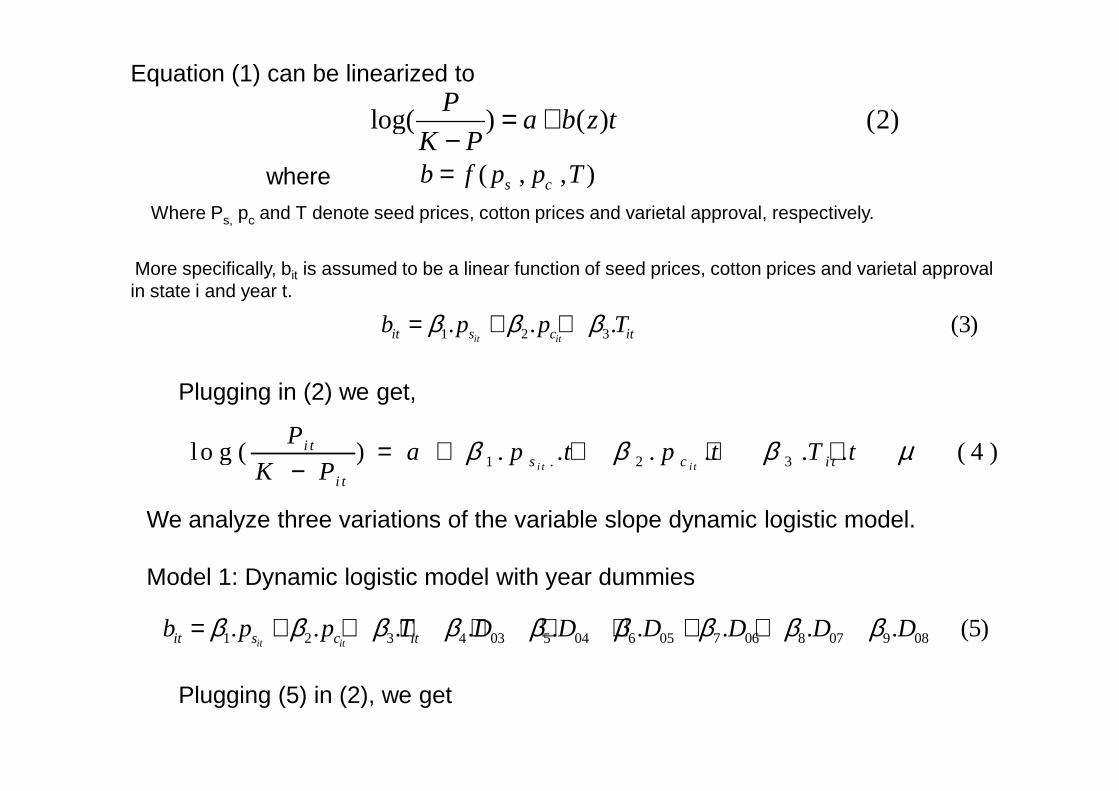
( , , )s cb f p p T=
1 2 3. . . (3)it itit s c itb p p Tβ β β= + +
More specifically, bit is assumed to be a linear function of seed prices, cotton prices and varietal approvalin state i and year t.
Where Ps, pc and T denote seed prices, cotton prices and varietal approval, respectively.
where
Plugging in (2) we get,
log( ) ( ) (2)P
a b z tK P
= +−
Equation (1) can be linearized to
We analyze three variations of the variable slope dynamic logistic model.
Model 1: Dynamic logistic model with year dummies
1 2 3 4 03 5 04 6 05 7 06 8 07 9 08. . . . . . . . . (5)it itit s c itb p p T D D D D D Dβ β β β β β β β β= + + + + + + + +
Plugging in (2) we get,
1 . 2 3lo g ( ) . . . . . . ( 4 )i t i t
i ts c i t
i t
Pa p t p t T t
K Pβ β β µ= + + + +
−
Plugging (5) in (2), we get
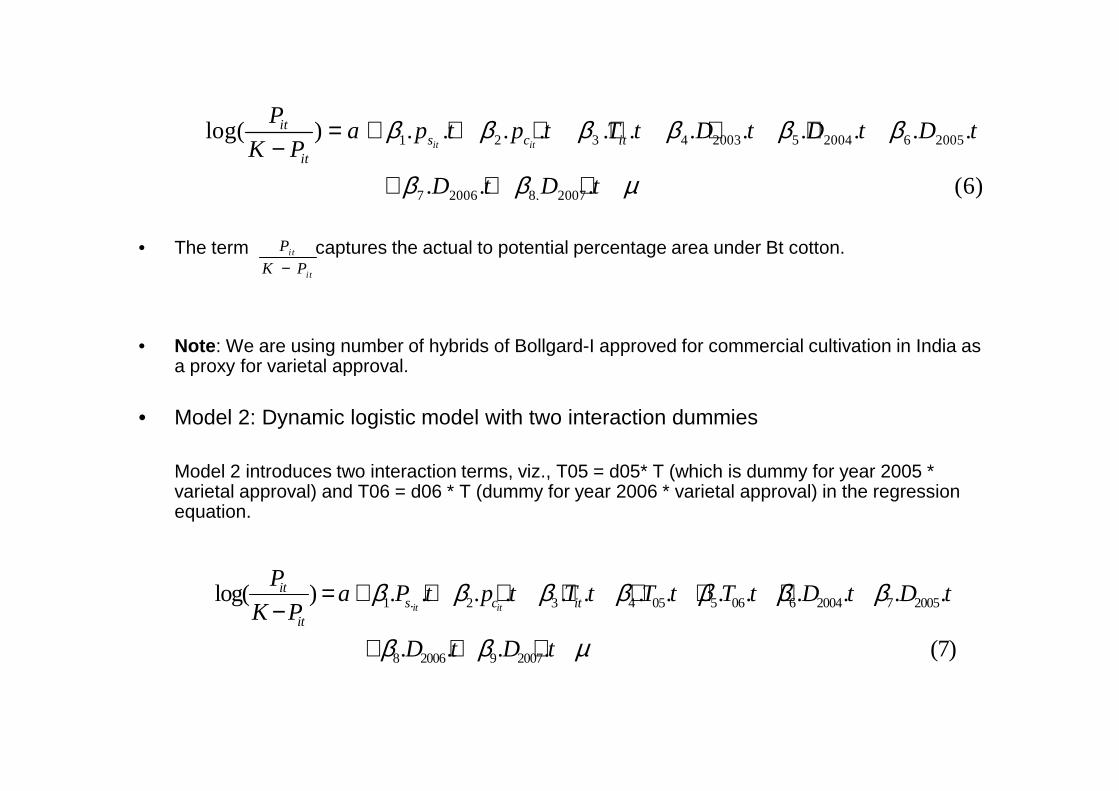
• The term captures the actual to potential percentage area under Bt cotton.
• Note: We are using number of hybrids of Bollgard-I approved for commercial cultivation in India as a proxy for varietal approval.
1 2 3 4 2003 5 2004 6 2005
7 2006 8. 2007
log( ) . . . . . . . . . . . .
. . . (6)
it it
its c it
it
Pa p t p t T t D t D t D t
K P
D t D t
β β β β β β
β β µ
= + + + + + +−
+ + +
i t
i t
P
K P−
• Model 2: Dynamic logistic model with two interaction dummies
Model 2 introduces two interaction terms, viz., T05 = d05* T (which is dummy for year 2005 * varietal approval) and T06 = d06 * T (dummy for year 2006 * varietal approval) in the regression equation.
1 . 2 3 4 05 5 06 6 2004 7 2005
8 2006 9 2007
log( ) . . . . . . . . . . . . . .
. . . . (7)
it it
its c it
it
Pa P t p t T t T t T t D t D t
K P
D t D t
β β β β β β β
β β µ
= + + + + + + +−
+ + +
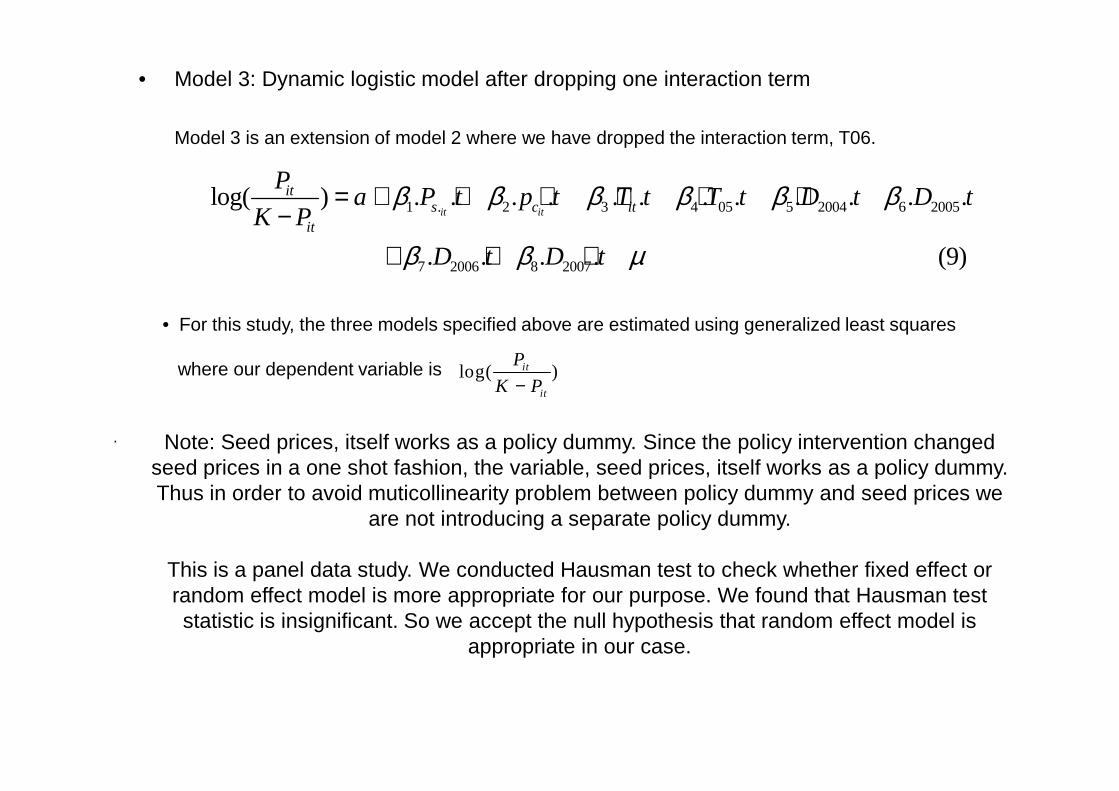
• Model 3: Dynamic logistic model after dropping one interaction term
Model 3 is an extension of model 2 where we have dropped the interaction term, T06.
1 . 2 3 4 05 5 2004 6 2005
7 2006 8 2007
log( ) . . . . . . . . . . . .
. . . . (9)
it it
its c it
it
Pa P t p t T t T t D t D t
K P
D t D t
β β β β β β
β β µ
= + + + + + +−
+ + +
• For this study, the three models specified above are estimated using generalized least squares
where our dependent variable is log( )it
it
P
K P− itK P−
. Note: Seed prices, itself works as a policy dummy. Since the policy intervention changed seed prices in a one shot fashion, the variable, seed prices, itself works as a policy dummy. Thus in order to avoid muticollinearity problem between policy dummy and seed prices we
are not introducing a separate policy dummy.
This is a panel data study. We conducted Hausman test to check whether fixed effect or random effect model is more appropriate for our purpose. We found that Hausman teststatistic is insignificant. So we accept the null hypothesis that random effect model is
appropriate in our case.
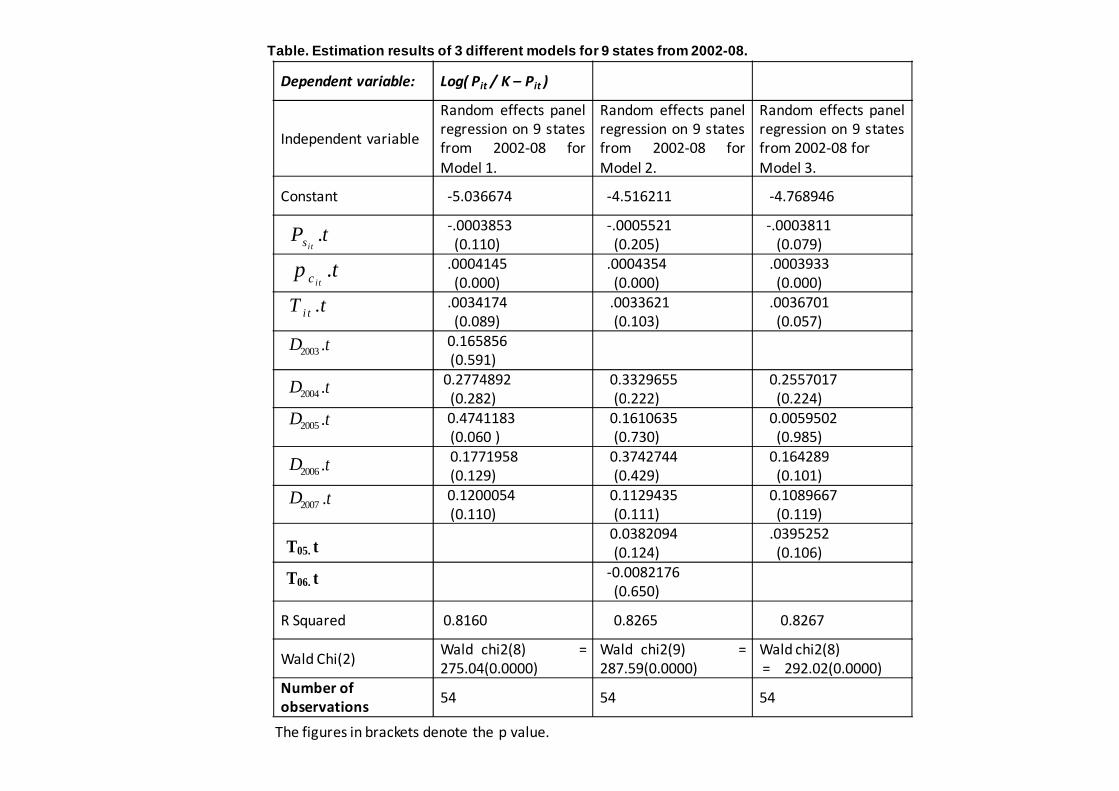
Table. Estimation results of 3 different models for 9 states from 2002-08.
.itsP t
.i tcp t
.i tT t
2003D .t
2004D .t
Dependent variable: Log( Pit / K – Pit )
Independent variable
Random effects panel
regression on 9 states
from 2002-08 for
Model 1.
Random effects panel
regression on 9 states
from 2002-08 for
Model 2.
Random effects panel
regression on 9 states
from 2002-08 for
Model 3.
Constant -5.036674 -4.516211 -4.768946
-.0003853
(0.110)
-.0005521
(0.205)
-.0003811
(0.079)
.0004145
(0.000)
.0004354
(0.000)
.0003933
(0.000)
.0034174
(0.089)
.0033621
(0.103)
.0036701
(0.057)
0.165856
(0.591)
0.2774892
(0.282)
0.3329655
(0.222)
0.2557017
(0.224)
The figures in brackets denote the p value.
2004D .t
2005D .t
2006D .t
2007D .t
T05. t
T06. t
(0.282) (0.222) (0.224)
0.4741183
(0.060 )
0.1610635
(0.730)
0.0059502
(0.985)
0.1771958
(0.129)
0.3742744
(0.429)
0.164289
(0.101)
0.1200054
(0.110)
0.1129435
(0.111)
0.1089667
(0.119)
0.0382094
(0.124)
.0395252
(0.106)
-0.0082176
(0.650)
R Squared 0.8160 0.8265 0.8267
Wald Chi(2)Wald chi2(8) =
275.04(0.0000)
Wald chi2(9) =
287.59(0.0000)
Wald chi2(8)
= 292.02(0.0000)
Number of
observations54 54 54
RESULTS
• The diffusion rate (b) is negatively and significantly related to the price of the seed indicating that as seedprices decline the incentive to adopt Bt cotton increases. From (5) it also implies that a one rupee declinein seed prices will lead to 0.038% increase in the diffusion rate.
• Since there is no variability in the data on seed prices other than that caused by government intervention,the significance of this variable implies that the government seed price interventions in 2006 weresuccessful in impacting the diffusion rate.
• Similarly, a rupee increase in cotton prices will lead to 0.041% increase in the rate of diffusion of Btcotton. Similarly the coefficient for varietal approval is significant and has the expected positive signwhich again implies that as the number of hybrids approved of Bt cotton increases rate of diffusion alsoincreases. In particular, a unit increase in will lead to 0.34% increase in diffusion rates.
• The value of the coefficient for 2005 is larger as compared to 2006 and 2007. This is an interestingresult and suggests that some significant changes must have occurred in 2005 that had considerable
i tcp
i tT
result and suggests that some significant changes must have occurred in 2005 that had considerableimpact on the diffusion rate and ultimately on the percentage area under Bt cotton (Pit).
• Around 20 new hybrids of bollgard-I were introduced in year 2005 and among these some werespecifically suited for agro-ecological conditions of the northern zone.
• Hence in order to see whether the increase in diffusion rates in 2005 and 2006 could be explained byvarietal approval or not, we introduce 2 interaction terms, namely, T05 (T05 = d05*T) and T06 (T06 =d06 *T) in Model 2.
• An important thing to note is that while the coefficient for the interaction term (T05) is significant ataround 12 percent, coefficient for d2005 (year dummy for 2005) is insignificant. This implies that theeffect of the number of hybrids approved was stronger in 2005 than in other year. This confirms ourearlier result that in 2005 there was for the first time Bt varieties commercialized for northern India.
• Also note that both the coefficients for T06 and d2006 are insignificant. We check possibility ofmulticollinearity among these two variables by conducting an F test for both variables individually.
• The F test results suggested that the coefficient for T06 is less significantthan d2006. Hence, in Model 3 we have dropped the interaction term T06.
• Interestingly, the coefficient of d2006 which was insignificant in theprevious model is now significant at 10 percent. This suggests that otherthan changes in seed prices, varietal approval, and cotton prices, somethingelse happened in 2006 which impacted the diffusion rates.
• One possible factor could be the introduction of Bollgard II in 2006. Also,J.K Agri Genetics Ltd and Nath Seeds Ltd introduced some events whichfurther increased portfolio of choice for farmers and may have led to anincrease in the diffusion rates.further increased portfolio of choice for farmers and may have led to anincrease in the diffusion rates.
• Thus, the increase in the adoption of Bt cotton in 2006 cannot be attributedentirely to the seed price interventions of the government, approval ofcertain specific events and hybrids of Bt cotton (Bollgard II) may also havecontributed to an increase in the adoption.
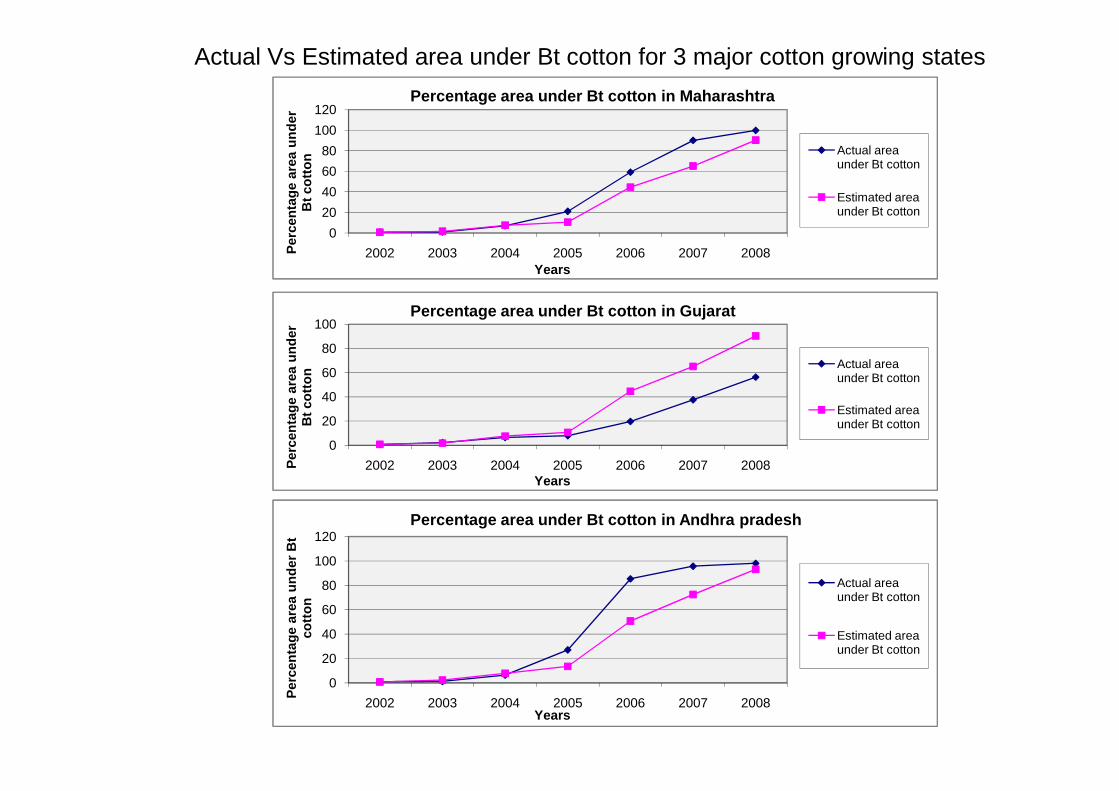
• Using the estimated coefficients from Model 3, we estimate percentage areaunder Bt cotton (Pit ).
0
20
40
60
80
100
120
2002 2003 2004 2005 2006 2007 2008Per
cen
tag
e ar
ea u
nd
er
Bt
cott
on
Years
Percentage area under Bt cotton in Maharashtra
Actual area under Bt cotton
Estimated area under Bt cotton
40
60
80
100
Per
cen
tag
e ar
ea u
nd
er
Bt
cott
on
Percentage area under Bt cotton in Gujarat
Actual area under Bt cotton
Actual Vs Estimated area under Bt cotton for 3 major cotton growing states
0
20
40
2002 2003 2004 2005 2006 2007 2008Per
cen
tag
e ar
ea u
nd
er
Bt
cott
on
Years
Estimated area under Bt cotton
0
20
40
60
80
100
120
2002 2003 2004 2005 2006 2007 2008
Per
cen
tag
e ar
ea u
nd
er B
t co
tto
n
Years
Percentage area under Bt cotton in Andhra pradesh
Actual area under Bt cotton
Estimated area under Bt cotton
PREDICTIONS
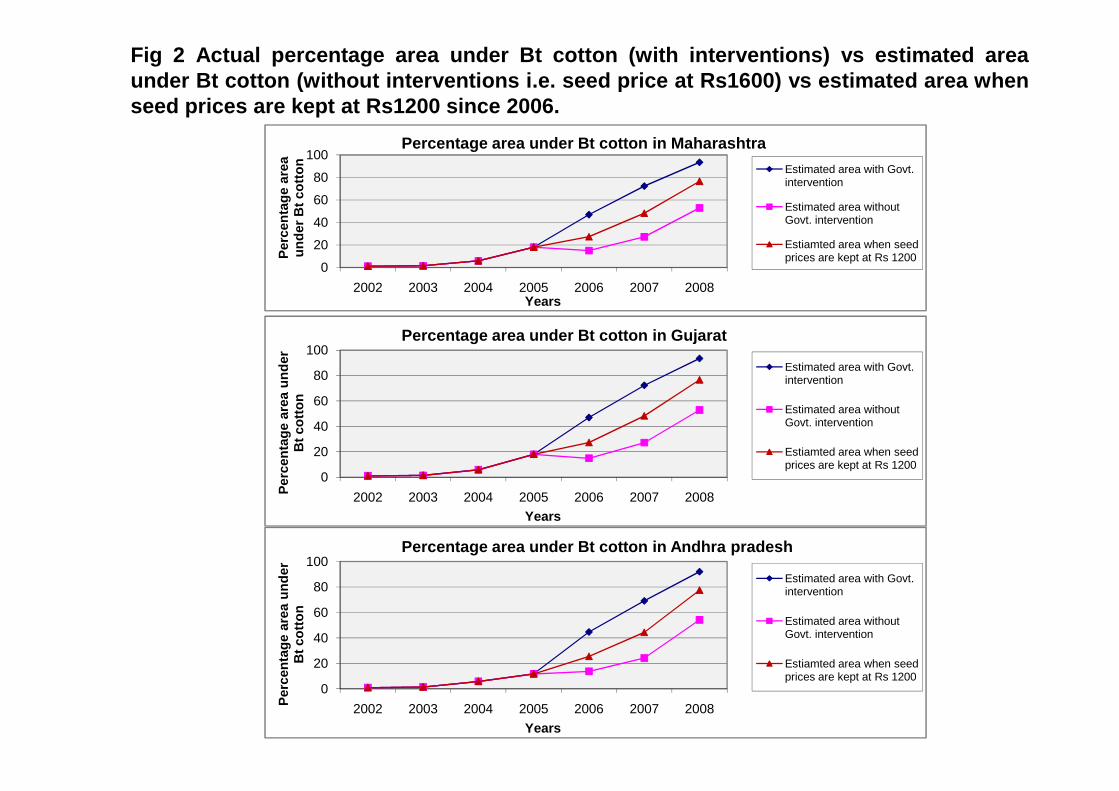
• To examine the impact of seed price intervention, we have tried to trace diffusion path under three alternative scenarios and compare them with the base scenario.
• Scenario I: Base scenario The base scenario is the estimated diffusion path using estimated coefficients and actual data on percentage area under Bt cotton.
• Scenario II: No seed price intervention The second scenario traces diffusion path if the government had not The second scenario traces diffusion path if the government had not intervened in seed prices, and the seed prices continued at the rate of Rs 1600 for a packet of 450 gm.
• Another interesting scenario would be to allow competition among the gene providers bring down seed prices instead of government intervention doing it.
• Scenario III: Prices for Bt cotton seeds are brought down to Rs 1200 for a packet of 450 gm in 2006 and remain at that level.
0
20
40
60
80
100
2002 2003 2004 2005 2006 2007 2008P
erce
nta
ge
area
u
nd
er B
t co
tto
nYears
Percentage area under Bt cotton in Maharashtra
Estimated area with Govt. intervention
Estimated area without Govt. intervention
Estiamted area when seed prices are kept at Rs 1200
60
80
100
Per
cen
tag
e ar
ea u
nd
er
Bt
cott
on
Percentage area under Bt cotton in Gujarat
Estimated area with Govt. intervention
Fig 2 Actual percentage area under Bt cotton (with interventions) vs estimated areaunder Bt cotton (without interventions i.e. seed price at Rs1600) vs estimated area whenseed prices are kept at Rs1200 since 2006.
0
20
40
60
2002 2003 2004 2005 2006 2007 2008Per
cen
tag
e ar
ea u
nd
er
Bt
cott
on
Years
Estimated area without Govt. intervention
Estiamted area when seed prices are kept at Rs 1200
0
20
40
60
80
100
2002 2003 2004 2005 2006 2007 2008Per
cen
tag
e ar
ea u
nd
er
Bt
cott
on
Years
Percentage area under Bt cotton in Andhra pradesh
Estimated area with Govt. intervention
Estimated area without Govt. intervention
Estiamted area when seed prices are kept at Rs 1200

• Estimation of Elasticities—
• Our dynamic logistic model with year dummies is given by—
• Define = y
( )( ) 1
1* .
its
yt
y pβ
∂=
∂
1 2 3 4 2003 5 2004 6 2005
7 2006 8. 2007
log( ) . . . . . . . . . . . .
. . .
it it
its c it
it
Pa p t p t T t D t D t D t
K P
D t D t
β β β β β β
β β µ
= + + + + + +−
+ + +it
it
P
K P−
* 1
1. .
s it it
it
yp s ss
yp p t
y pη β∂= =
∂
1. .s ityp sp tη β=
Where is the elasticity of y w.r.t seed prices. Here we found that this elasticity is variable. So we computed elasticities at mean which is given by—
sypη
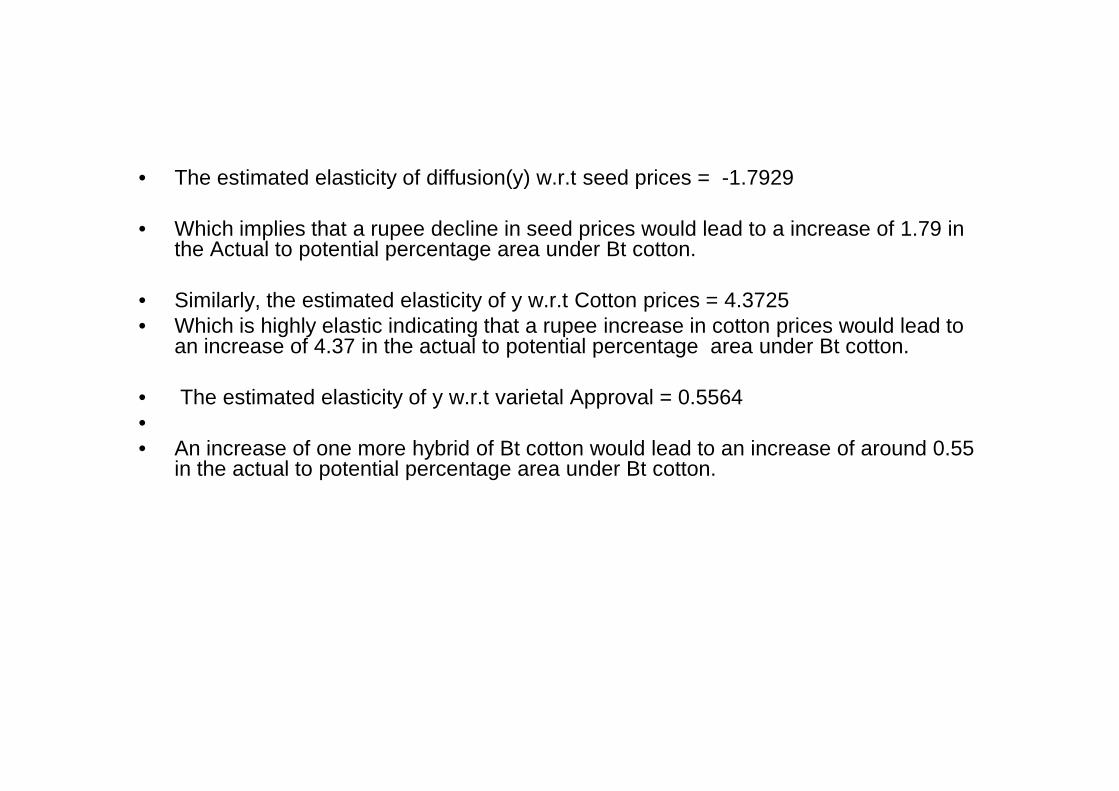
• The estimated elasticity of diffusion(y) w.r.t seed prices = -1.7929
• Which implies that a rupee decline in seed prices would lead to a increase of 1.79 in the Actual to potential percentage area under Bt cotton.
• Similarly, the estimated elasticity of y w.r.t Cotton prices = 4.3725• Which is highly elastic indicating that a rupee increase in cotton prices would lead to
an increase of 4.37 in the actual to potential percentage area under Bt cotton.
• The estimated elasticity of y w.r.t varietal Approval = 0.5564• The estimated elasticity of y w.r.t varietal Approval = 0.5564•• An increase of one more hybrid of Bt cotton would lead to an increase of around 0.55
in the actual to potential percentage area under Bt cotton.
CONCLUSION
• Using three variations of dynamic logistic model with variable slope coefficient, wefound that the variables (seed prices, technological development and cotton prices)are significant and have the expected signs.
• While varietal approval as well as cotton prices are positively impacting the diffusionrates, seed prices are impacting it negatively.
• Some significant changes must have occurred in 2005 that had considerable impacton the diffusion rate. Around 20 new hybrids of Bollgard-I were introduced in year2005 and among these some were specifically suited for agro-ecological conditions ofthe northern zone.the northern zone.
• Apart from seed prices, varietal approval and cotton prices, some other factorsimpacted the diffusion rates in 2006.
• Thus, the increase in percentage area under Bt cotton in 2006 cannot be attributedentirely to seed price interventions of the government rather certain other factors likeapproval of some specific events and hybrids (Bollgard II) of Bt cotton would have ledto an increase in the adoption of Bt cotton in India.
POLICY IMPLICATION
• Our results provide inputs for the government policy by quantifying the effect of government seedprice intervention on diffusion rates. Further they suggest that the government should look forother policies which would enhance the diffusion rates and improve overall welfare.
• One could be simplifying the process of approval of Bt hybrids. This will ensure the benefits notonly to the farmers in terms of greater portfolio of choices which will increase the diffusion ratesbut also for the company as it will protect their interests to innovate in the future.
• Also, simplification of our regulatory procedure would encourage new seed companies to come inwhich would enforce competition among them. This competition among alternative gene providerscould reduce the seed prices on its own (rather than the government doing it) and could ultimatelycould reduce the seed prices on its own (rather than the government doing it) and could ultimatelyincrease the diffusion rates.
• Moreover, government should make indigeneous research more aggressive and shouldencourage and support farmer scientists who develop their own hybrids, allow them to researchand network better so that these alternative hybrids could provide competition to the privatetechnology providers.

Thank you
Copyright © 2022 FDOKUMEN