Differential sensitivity of in vivo and ex vivo diffusion tensor imaging to evolving optic nerve...
10
Differential sensitivity of in vivo and ex vivo diffusion tensor imaging to evolving optic nerve injury in mice with retinal ischemia Shu-Wei Sun, a, * Hsiao-Fang Liang, a Tuan Q. Le, b Regina C. Armstrong, b,d Anne H. Cross, c and Sheng-Kwei Song a a Department of Radiology, Washington University School of Medicine, St. Louis, MO 63110, USA b Department of Anatomy, Physiology, and Genetics, Uniformed Services University of the Health Sciences, Bethesda, MD 20814-4799, USA c Department of Neurology, Washington University School of Medicine, St. Louis, MO 63110, USA d Program in Neuroscience, Uniformed Services University of the Health Sciences, Bethesda, MD 20814-4799, USA Received 21 December 2005; revised 22 March 2006; accepted 28 April 2006 Available online 22 June 2006 Decreased axial ( k || ) and increased radial ( k – ) diffusivity have been shown to reflect axonal and myelin injury respectively. In the present study, evolving white matter injury within the optic nerves of mice with retinal ischemia was examined by in vivo and ex vivo measurements of k || and k – . The results show that at 3 days after retinal ischemia, a 33% decrease in vivo and a 38% decrease ex vivo in k || without change in k – was observed in the injured optic nerve compared to the control, suggestive of axonal damage without myelin injury. At 14 days, both in vivo and ex vivo measured k – increased significantly to 220 – 240% of the control level in the injured optic nerve suggestive of myelin damage. In contrast, the axonal injury that was clearly detected in vivo as a significantly decreased k || (33% decrease) was not as clearly detected by ex vivo k || (17% decrease). The current findings suggest that ex vivo k – is comparable to in vivo k – in detecting myelin injury. However, the structural changes resulting from axonal damage causing the decreased in vivo k || may not be preserved ex vivo in the fixed tissues. Despite the accurate depiction of the pathology using k || and k – in vivo, the use of ex vivo k || to extrapolate the status of axonal injury in vivo would require further investigation. D 2006 Elsevier Inc. All rights reserved. Introduction Tissue fixation is a ubiquitous laboratory practice, and it has become increasingly common to obtain magnetic resonance images (MRI) from fixed tissues (Ahrens et al., 1998; Bonny and Renou, 2002; Holmes et al., 2000; Hsu et al., 1998; Jacobs et al., 1999; Mori et al., 1999, 2001; Pfefferbaum et al., 2004; Wedeen et al., 2001). Recent applications of diffusion tensor imaging (DTI) to fixed tissue demonstrated that it is possible to obtain data with high signal-to-noise ratio (SNR) at high spatial resolution without motion artifact as compared with in vivo studies (Mori et al., 1999, 2001). Postmortem brain specimens from patients with Alzheimer’s disease (Bronge et al., 2002) or multiple sclerosis (Schmierer et al., 2003, 2004) have been examined using MRI to identify neuropathology. Although increased T2 and decreased magnetization transfer ratio have shown high correlation to histological abnormalities in white matter, these MRI measurements do not differentiate the underlying axonal and myelin damage (Meier et al., 2004). To improve the specificity of MRI to underlying pathology, the directional diffusivities derived from DTI were separated to components describing water movement along (k || , axial diffusiv- ity) and across (k – , radial diffusivity) the white matter tract. It has been demonstrated in living central and peripheral nervous systems that axonal injury in white matter results in reduced k || while myelin damage increases k – (Arfanakis et al., 2002; Beaulieu et al., 1996; Kim et al., 2006; Song et al., 2002, 2003; Sun et al., 2006; Thomalla et al., 2004). However, application of directional diffusivity to fixed specimens has only been reported recently in studies examining the effect of demyelination on k – (Song et al., 2005). Many factors may alter the water diffusion characteristics in formalin-fixed specimens. For example, decrease in tissue temper- ature (Sun et al., 2003, 2005), cessation of cellular transport (Le Bihan, 1995; van der Toorn et al., 1996) and possible change of cellular membrane permeability (Benga et al., 1986; Gold and Widnell, 1976; Ormerod et al., 1993; Sehy et al., 2002) in fixed tissues can lead to changes in the measured DTI parameters. Thus, careful comparison of in vivo and ex vivo diffusion properties is crucial in establishing the validity and relevance of MRI of fixed specimens. Some preliminary findings suggest that intravoxel anisotropy and inter-voxel coherence of water diffusion are main- tained in tissue after fixation (Crespigny et al., 2005; Guilfoyle et al., 2003; Sun et al., 2003, 2005). A 50–70% decrease in mean 1053-8119/$ - see front matter D 2006 Elsevier Inc. All rights reserved. doi:10.1016/j.neuroimage.2006.04.212 * Corresponding author. Biomedical MR Laboratory, Campus Box 8227, Washington University School of Medicine, 660 S. Euclid Avenue, St. Louis, MO 63110, USA. Fax: +1 314 362 0526. E-mail address: [email protected] (S.-W. Sun). Available online on ScienceDirect (www.sciencedirect.com). www.elsevier.com/locate/ynimg NeuroImage 32 (2006) 1195 – 1204
-
Upload
independent -
Category
Documents
-
view
1 -
download
0
Transcript of Differential sensitivity of in vivo and ex vivo diffusion tensor imaging to evolving optic nerve...
www.elsevier.com/locate/ynimg
NeuroImage 32 (2006) 1195 – 1204
Differential sensitivity of in vivo and ex vivo diffusion tensor imaging
to evolving optic nerve injury in mice with retinal ischemia
Shu-Wei Sun,a,* Hsiao-Fang Liang,a Tuan Q. Le,b Regina C. Armstrong,b,d
Anne H. Cross,c and Sheng-Kwei Song a
aDepartment of Radiology, Washington University School of Medicine, St. Louis, MO 63110, USAbDepartment of Anatomy, Physiology, and Genetics, Uniformed Services University of the Health Sciences, Bethesda, MD 20814-4799, USAcDepartment of Neurology, Washington University School of Medicine, St. Louis, MO 63110, USAdProgram in Neuroscience, Uniformed Services University of the Health Sciences, Bethesda, MD 20814-4799, USA
Received 21 December 2005; revised 22 March 2006; accepted 28 April 2006
Available online 22 June 2006
Decreased axial (kkkk ||) and increased radial (kkkk–) diffusivity have been
shown to reflect axonal and myelin injury respectively. In the present
study, evolving white matter injury within the optic nerves of mice with
retinal ischemia was examined by in vivo and ex vivo measurements of
kkkk || and kkkk–. The results show that at 3 days after retinal ischemia, a
33% decrease in vivo and a 38% decrease ex vivo in kkkk || without change
in kkkk– was observed in the injured optic nerve compared to the control,
suggestive of axonal damage without myelin injury. At 14 days, both in
vivo and ex vivo measured kkkk– increased significantly to 220–240% of
the control level in the injured optic nerve suggestive of myelin damage.
In contrast, the axonal injury that was clearly detected in vivo as a
significantly decreased kkkk || (33% decrease) was not as clearly detected
by ex vivo kkkk || (17% decrease). The current findings suggest that ex vivo
kkkk– is comparable to in vivo kkkk– in detecting myelin injury. However,
the structural changes resulting from axonal damage causing the
decreased in vivo kkkk || may not be preserved ex vivo in the fixed tissues.
Despite the accurate depiction of the pathology using kkkk || and kkkk– in
vivo, the use of ex vivo kkkk || to extrapolate the status of axonal injury in
vivo would require further investigation.
D 2006 Elsevier Inc. All rights reserved.
Introduction
Tissue fixation is a ubiquitous laboratory practice, and it has
become increasingly common to obtain magnetic resonance images
(MRI) from fixed tissues (Ahrens et al., 1998; Bonny and Renou,
2002; Holmes et al., 2000; Hsu et al., 1998; Jacobs et al., 1999;
Mori et al., 1999, 2001; Pfefferbaum et al., 2004; Wedeen et al.,
1053-8119/$ - see front matter D 2006 Elsevier Inc. All rights reserved.
doi:10.1016/j.neuroimage.2006.04.212
* Corresponding author. Biomedical MR Laboratory, Campus Box 8227,
Washington University School of Medicine, 660 S. Euclid Avenue, St.
Louis, MO 63110, USA. Fax: +1 314 362 0526.
E-mail address: [email protected] (S.-W. Sun).
Available online on ScienceDirect (www.sciencedirect.com).
2001). Recent applications of diffusion tensor imaging (DTI) to
fixed tissue demonstrated that it is possible to obtain data with high
signal-to-noise ratio (SNR) at high spatial resolution without motion
artifact as compared with in vivo studies (Mori et al., 1999, 2001).
Postmortem brain specimens from patients with Alzheimer’s disease
(Bronge et al., 2002) or multiple sclerosis (Schmierer et al., 2003,
2004) have been examined using MRI to identify neuropathology.
Although increased T2 and decreased magnetization transfer
ratio have shown high correlation to histological abnormalities in
white matter, these MRI measurements do not differentiate the
underlying axonal and myelin damage (Meier et al., 2004). To
improve the specificity of MRI to underlying pathology, the
directional diffusivities derived from DTI were separated to
components describing water movement along (k ||, axial diffusiv-
ity) and across (k–, radial diffusivity) the white matter tract. It has
been demonstrated in living central and peripheral nervous systems
that axonal injury in white matter results in reduced k || whilemyelin damage increases k– (Arfanakis et al., 2002; Beaulieu et
al., 1996; Kim et al., 2006; Song et al., 2002, 2003; Sun et al.,
2006; Thomalla et al., 2004). However, application of directional
diffusivity to fixed specimens has only been reported recently in
studies examining the effect of demyelination on k– (Song et al.,
2005).
Many factors may alter the water diffusion characteristics in
formalin-fixed specimens. For example, decrease in tissue temper-
ature (Sun et al., 2003, 2005), cessation of cellular transport (Le
Bihan, 1995; van der Toorn et al., 1996) and possible change
of cellular membrane permeability (Benga et al., 1986; Gold and
Widnell, 1976; Ormerod et al., 1993; Sehy et al., 2002) in fixed
tissues can lead to changes in the measured DTI parameters. Thus,
careful comparison of in vivo and ex vivo diffusion properties is
crucial in establishing the validity and relevance of MRI of fixed
specimens. Some preliminary findings suggest that intravoxel
anisotropy and inter-voxel coherence of water diffusion are main-
tained in tissue after fixation (Crespigny et al., 2005; Guilfoyle et
al., 2003; Sun et al., 2003, 2005). A 50–70% decrease in mean
S.-W. Sun et al. / NeuroImage 32 (2006) 1195–12041196
apparent diffusion coefficient (ADC) after fixation was also
reported (Sun et al., 2003, 2005). The decrease in ADC is not
uniform across the entire brain. Different regional changes in
diffusion magnitude after fixation result in an altered image
contrast of ex vivo ADC maps. This alteration has resulted in
the loss of sensitivity using ADC to detect an area of acute stroke
after fixation (Sun et al., 2005).
To test the utility of k || and k– as well as to evaluate the general
diffusion characteristics in injured white matter of fixed specimens,
the mouse model of transient retinal ischemia (Kawai et al., 2001;
Rosenbaum et al., 2001; Song et al., 2003) was employed in this
study. The distinct pattern of optic nerve (ON) injury resulting
from retinal ischemia, i.e., acute axonal damage followed by
coexistence of axonal and myelin damage (Adachi et al., 1996;
Song et al., 2003), makes it an ideal model to evaluate both types
of injury. Serial examinations of mice undergoing transient retinal
ischemia have confirmed the previously reported time course of the
injury progression. Two time points were selected representing two
different pathological states based on the in vivo DTI findings.
Histological analyses after ex vivo DTI were performed to verify
the DTI findings.
Methods
Retinal ischemia
Male Swiss Webster mice, 6–8 weeks of age underwent
transient retinal ischemia (Song et al., 2003). Briefly, 100–120 mm
Hg intraocular pressure was applied to the right eye of each mouse
by inserting into the anterior chamber a 32-gauge needle
connecting to a saline reservoir placed above the eye for 1 h.
Reperfusion started immediately after removal of the cannula. The
left eye, which was not cannulated, served as the control.
Eight mice were used to evaluate the temporal evolution of ON
degeneration after retinal ischemia. For each mouse, in vivo DTI
was conducted 1, 3, 5, 7, 14, and 21 days after the retinal ischemia
to assess the extent of axonal and myelin damage (Song et al.,
2003). Based on the longitudinal findings, two time points
representing two different conditions of the injury were examined:
(a) 3 days after retinal ischemia where axonal damage was
observed without myelin damage (Song et al., 2003), and (b) the
coexistence of axonal and myelin damage at 14 days after retinal
ischemia. Sixteen mice undergoing retinal ischemia were divided
into two groups (8 mice each) and examined using in vivo DTI at 3
and 14 days after the surgery followed by ex vivo DTI measure-
ments and histological analyses.
Diffusion tensor imaging
In vivo DTI of live mice
Mice were anesthetized with a mixture of oxygen and
isoflurane (Baxtor Healthcare Corporation, IL, USA) using an
isoflurane vaporizer (D. R. C., Inc, KY, USA). Seven percent
isoflurane was used for induction and 2% for maintenance. The
core body temperature was maintained using warm water
circulating in a pad. After the appropriate anesthesia level was
reached, mice were placed in a custom-made, magnetic-resonance-
compatible stereotaxic device to immobilize the head. A 9-cm
inner diameter Helmoltz coil served as the RF transmitter. A 1.5-
cm outer diameter circular surface coil was placed on top of the
head to serve as the RF receiver. The entire device was put in an
Oxford Instruments 200/330 (4.7 T, 33 cm clear bore) magnet
equipped with a 16-cm inner diameter, actively shielded Oxford
gradient coil (18 G/cm, 200 As rise time). The magnet, gradient
coil, and Techron gradient power supply were interfaced with a
Varian UNITY-INOVA console controlled by a Sun Microsystems
Ultra-60 Sparc workstation. A conventional spin echo imaging
sequence, modified by adding a Stejskal-Tanner diffusion sensi-
tizing gradient pair, was employed for acquisition of the required
series of diffusion-weighted images. The images were acquired
with repetition time (TR) 1.7 s, spin echo time (TE) 50 ms, time
between application of gradient pulses (D) 25 ms, diffusion
gradient on time (y) 8 ms, diffusion sensitizing gradient strength
9.1 G/cm, 4 scans averaged per k space line, slice thickness 0.5
mm (5 slices total), field of view 3 cm, data matrix 256 � 256 (zero
filled to 512 � 512). Diffusion sensitizing gradients were applied
in six orientations: [Gx, Gy, Gz] = [1, 1, 0], [1, 0, 1], [0, 1, 1], [�1,1, 0], [0, �1, 1], and [1, 0, �1]. Two diffusion-sensitizing factors,
or b values, were used: 0 and 0.838 ms/Am2. Each multi-slice,
whole-brain, DTI data set was obtained with an acquisition time of
3 h.
Ex vivo DTI of fixed brains
At the conclusion of in vivo DTI examinations, mice were
euthanized and perfused through the left cardiac ventricle with
phosphate-buffered saline (PBS) followed by 4% paraformalde-
hyde in PBS. The intact brain was excised, placed in 4%
paraformaldehyde/PBS at 4-C for 1 week and then stored in
PBS at 4-C for an extra week before imaging.
Fixed brains were placed in a 1-cm inner diameter solenoid coil
to serve as the RF transmitter and receiver for the MR signal. Data
were acquired in an Oxford Instruments 200/400 (4.7 T, 40 cm
clear bore) magnet equipped with a 10-cm inner diameter, actively
shielded Magnex gradient coil (60 G/cm, 100 As rise time). The
magnet, gradient coil, and Techron gradient power supply were
interfaced with a Varian UNITY-INOVA console controlled by a
Sun Microsystems Ultra-60 Sparc workstation. An electric fan was
used to maintain a constant flow of cool air throughout the entire
experiment to maintain the sample temperature (Sun et al., 2003,
2005). Since the apparent diffusion coefficient (ADC) in a fixed
brain is about 50% lower than it in the live brain (Sun et al., 2003,
2005), D of 45 ms, d of 4 ms, and diffusion sensitizing gradient
strength of 19 G/cm were used to double the diffusion time of in
vivo DTI. In addition, the b value was set to maintain the same b �ADC for the same degree of diffusion weighting for both in vivo
and ex vivo measurements. Therefore, b = 1.805 ms/Am2 was used
for ex vivo DTI. The spatial resolution of ex vivo DTI was
maintained the same as in vivo DTI. Other acquisition parameters
include TR 1 s, TE 63 ms, and 2 scans averaged per k space line to
achieve similar signal-to-noise ratio (SNR) for T2-weighted images
as that of in vivo measurements. Each DTI data set was obtained
with an acquisition time of one hour.
Data analysis
The six independent elements of the diffusion tensor were
calculated from each diffusion-weighted image. The resulting
tensor element maps were used to derive eigenvalues (k1, k2, and
k3) of the diffusion tensor by matrix diagonalization (Basser and
Pierpaoli, 1996). On a pixel-by-pixel basis, quantitative indices,
including axial diffusivity (k ||), radial diffusivity (k–), relative
anisotropy (RA), and trace of the diffusion tensor (Tr), were
S.-W. Sun et al. / NeuroImage 32 (2006) 1195–1204 1197
derived using software written in Matlab (MathWorks, Natick,
MA, USA) defined by the following equations:
Tr ¼ k1 þ k2 þ k3 ð1Þ
k� ¼ k1 ð2Þ
k8 ¼ 0:5� k2 þ k3ð Þ ð3Þ
RA ¼
ffiffiffiffiffiffiffiffiffiffiffiffiffiffiffiffiffiffiffiffiffiffiffiffiffiffiffiffiffiffiffiffiffiffiffiffiffiffiffiffiffiffiffiffiffiffiffiffiffiffiffiffiffiffiffiffiffiffiffiffiffiffiffiffiffiffiffiffiffiffiffiffiffiffiffiffiffiffiffiffiffiffiffiffiffiffiffiffik1 � Tr=3ð Þ2 þ k2 � Tr=3ð Þ2 þ k3 � Tr=3ð Þ2
qffiffiffi3p
Tr=3ð Þ: ð4Þ
Regions of interest (ROI) were selected in left and right ON
(control and injured respectively) based on the image contrast of
DTI indices maps and the images with b = 0 (B0 images or T2-
weighted images, T2WI) referencing to a mouse brain atlas
(Franklin and Paxinos, 1997). The definition of ROI is shown in
Fig. 1. The delineated ROI was also employed for SNR
determinations on B0 images. SNR was defined as the quotient
of mean signal intensity in each ROI and standard deviation of the
background noise divided by 0.66 in consideration of Rayleigh
statistics (Edelstein et al., 1984). Data were presented as mean Tstandard deviation. Two-tailed paired t test was performed to
compare the measurements between control and experimental
groups. Statistical significance was accepted at P < 0.05.
Histological examinations
At the conclusion of ex vivo DTI examinations, 2-mm-thick
coronal tissue blocks were obtained from each brain. The tissues
from four mice each at 3-day and 14-day post-injury were
embedded in OCT for frozen cutting, and the remaining tissues
were embedded in paraffin. For each mouse brain, a notch was
marked on the right hemisphere. Transverse slices were cut starting
from the optic chiasm. The slice matching the ROI selected from
the DTI image located at 1 mm anterior to the optic chiasm. The
transverse sections including both injured (right eye) and the
control ON (left eye) were mounted on the same slide for the
staining.
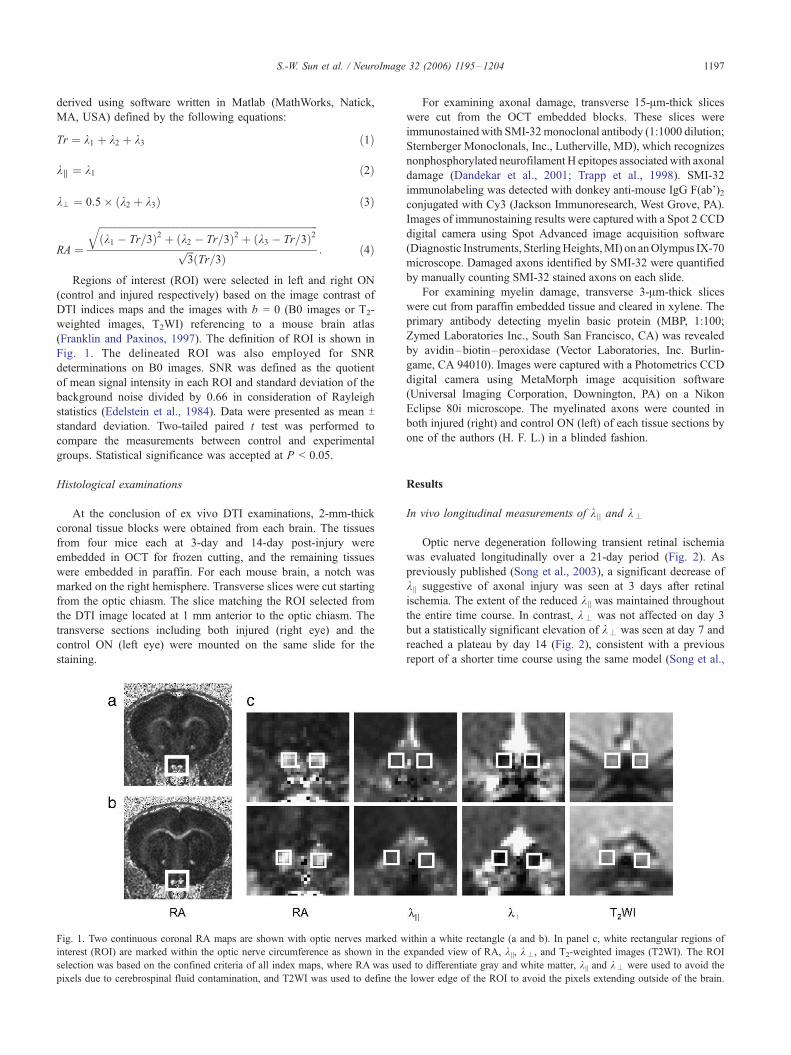
Fig. 1. Two continuous coronal RA maps are shown with optic nerves marked w
interest (ROI) are marked within the optic nerve circumference as shown in the
selection was based on the confined criteria of all index maps, where RA was use
pixels due to cerebrospinal fluid contamination, and T2WI was used to define the
For examining axonal damage, transverse 15-Am-thick slices
were cut from the OCT embedded blocks. These slices were
immunostained with SMI-32 monoclonal antibody (1:1000 dilution;
Sternberger Monoclonals, Inc., Lutherville, MD), which recognizes
nonphosphorylated neurofilament H epitopes associatedwith axonal
damage (Dandekar et al., 2001; Trapp et al., 1998). SMI-32
immunolabeling was detected with donkey anti-mouse IgG F(ab’)2conjugated with Cy3 (Jackson Immunoresearch, West Grove, PA).
Images of immunostaining results were captured with a Spot 2 CCD
digital camera using Spot Advanced image acquisition software
(Diagnostic Instruments, SterlingHeights,MI) on anOlympus IX-70
microscope. Damaged axons identified by SMI-32 were quantified
by manually counting SMI-32 stained axons on each slide.
For examining myelin damage, transverse 3-Am-thick slices
were cut from paraffin embedded tissue and cleared in xylene. The
primary antibody detecting myelin basic protein (MBP, 1:100;
Zymed Laboratories Inc., South San Francisco, CA) was revealed
by avidin–biotin–peroxidase (Vector Laboratories, Inc. Burlin-
game, CA 94010). Images were captured with a Photometrics CCD
digital camera using MetaMorph image acquisition software
(Universal Imaging Corporation, Downington, PA) on a Nikon
Eclipse 80i microscope. The myelinated axons were counted in
both injured (right) and control ON (left) of each tissue sections by
one of the authors (H. F. L.) in a blinded fashion.
Results
In vivo longitudinal measurements of k|| and k–
Optic nerve degeneration following transient retinal ischemia
was evaluated longitudinally over a 21-day period (Fig. 2). As
previously published (Song et al., 2003), a significant decrease of
k || suggestive of axonal injury was seen at 3 days after retinal
ischemia. The extent of the reduced k || was maintained throughout
the entire time course. In contrast, k– was not affected on day 3
but a statistically significant elevation of k– was seen at day 7 and
reached a plateau by day 14 (Fig. 2), consistent with a previous
report of a shorter time course using the same model (Song et al.,
ithin a white rectangle (a and b). In panel c, white rectangular regions of
expanded view of RA, k ||, k–, and T2-weighted images (T2WI). The ROI
d to differentiate gray and white matter, k || and k– were used to avoid the
lower edge of the ROI to avoid the pixels extending outside of the brain.
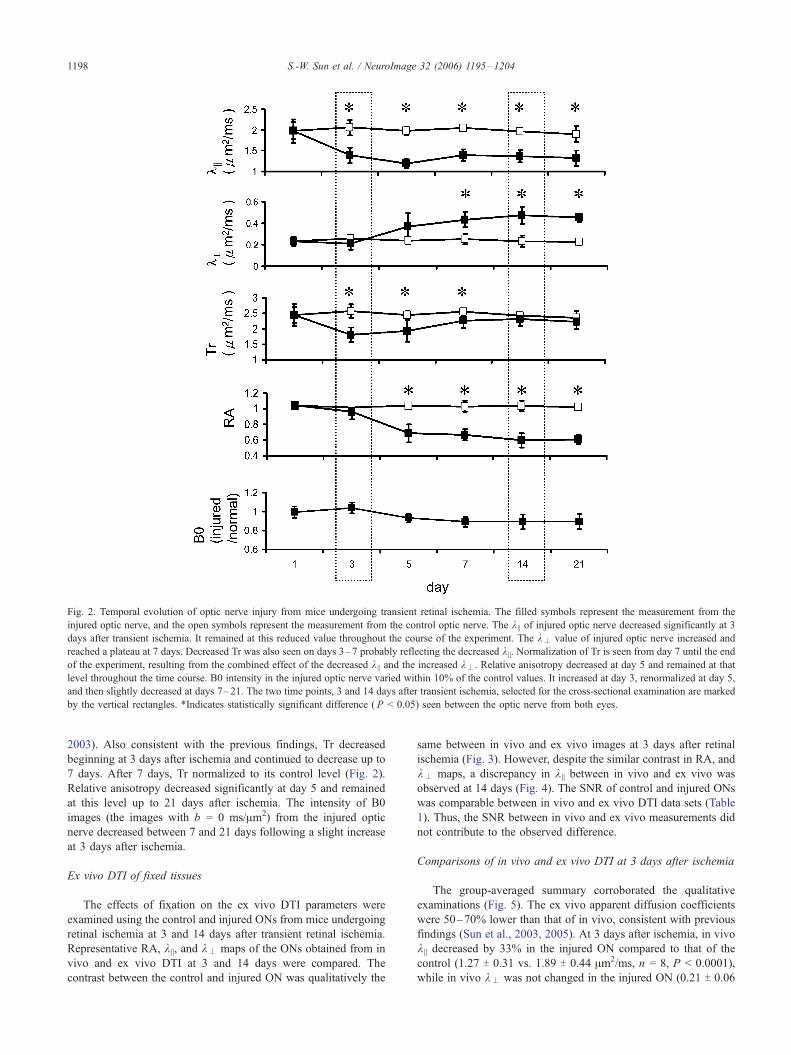
Fig. 2. Temporal evolution of optic nerve injury from mice undergoing transient retinal ischemia. The filled symbols represent the measurement from the
injured optic nerve, and the open symbols represent the measurement from the control optic nerve. The k || of injured optic nerve decreased significantly at 3
days after transient ischemia. It remained at this reduced value throughout the course of the experiment. The k– value of injured optic nerve increased and
reached a plateau at 7 days. Decreased Tr was also seen on days 3–7 probably reflecting the decreased k ||. Normalization of Tr is seen from day 7 until the end
of the experiment, resulting from the combined effect of the decreased k || and the increased k–. Relative anisotropy decreased at day 5 and remained at that
level throughout the time course. B0 intensity in the injured optic nerve varied within 10% of the control values. It increased at day 3, renormalized at day 5,
and then slightly decreased at days 7–21. The two time points, 3 and 14 days after transient ischemia, selected for the cross-sectional examination are marked
by the vertical rectangles. *Indicates statistically significant difference ( P < 0.05) seen between the optic nerve from both eyes.
S.-W. Sun et al. / NeuroImage 32 (2006) 1195–12041198
2003). Also consistent with the previous findings, Tr decreased
beginning at 3 days after ischemia and continued to decrease up to
7 days. After 7 days, Tr normalized to its control level (Fig. 2).
Relative anisotropy decreased significantly at day 5 and remained
at this level up to 21 days after ischemia. The intensity of B0
images (the images with b = 0 ms/Am2) from the injured optic
nerve decreased between 7 and 21 days following a slight increase
at 3 days after ischemia.
Ex vivo DTI of fixed tissues
The effects of fixation on the ex vivo DTI parameters were
examined using the control and injured ONs from mice undergoing
retinal ischemia at 3 and 14 days after transient retinal ischemia.
Representative RA, k ||, and k– maps of the ONs obtained from in
vivo and ex vivo DTI at 3 and 14 days were compared. The
contrast between the control and injured ON was qualitatively the
same between in vivo and ex vivo images at 3 days after retinal
ischemia (Fig. 3). However, despite the similar contrast in RA, and
k– maps, a discrepancy in k || between in vivo and ex vivo was
observed at 14 days (Fig. 4). The SNR of control and injured ONs
was comparable between in vivo and ex vivo DTI data sets (Table
1). Thus, the SNR between in vivo and ex vivo measurements did
not contribute to the observed difference.
Comparisons of in vivo and ex vivo DTI at 3 days after ischemia
The group-averaged summary corroborated the qualitative
examinations (Fig. 5). The ex vivo apparent diffusion coefficients
were 50–70% lower than that of in vivo, consistent with previous
findings (Sun et al., 2003, 2005). At 3 days after ischemia, in vivo
k || decreased by 33% in the injured ON compared to that of the
control (1.27 T 0.31 vs. 1.89 T 0.44 Am2/ms, n = 8, P < 0.0001),
while in vivo k– was not changed in the injured ON (0.21 T 0.06
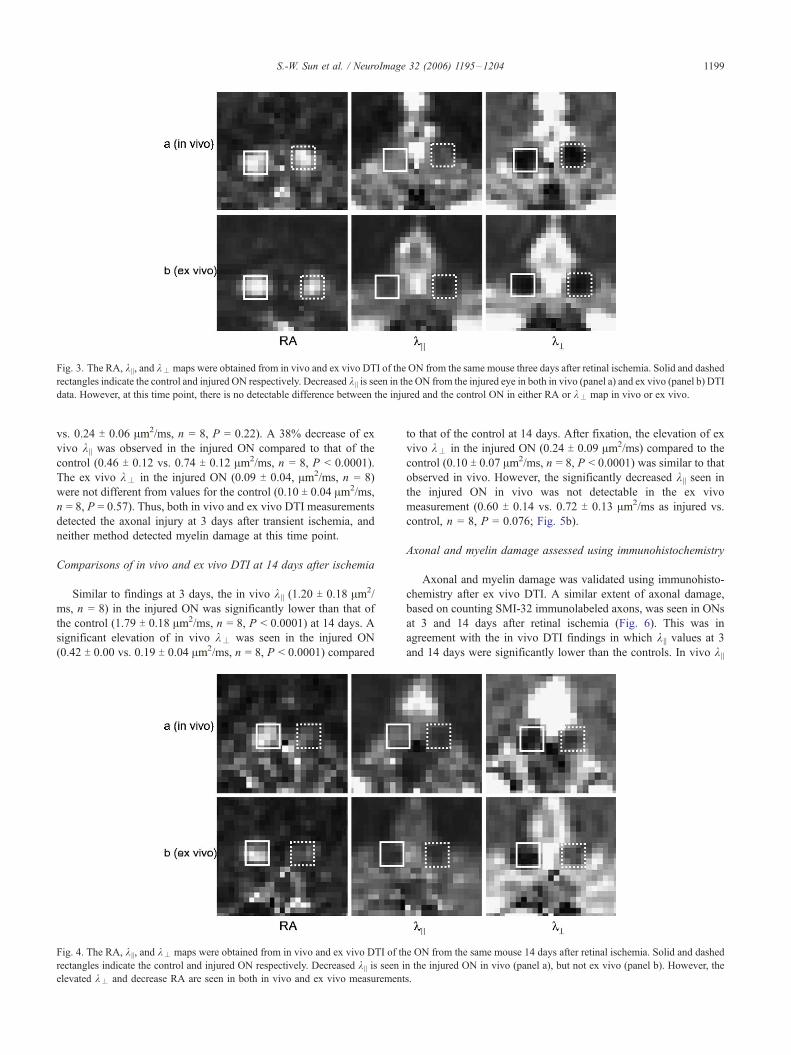
Fig. 3. The RA, k ||, and k–maps were obtained from in vivo and ex vivo DTI of the ON from the same mouse three days after retinal ischemia. Solid and dashed
rectangles indicate the control and injured ON respectively. Decreased k || is seen in the ON from the injured eye in both in vivo (panel a) and ex vivo (panel b) DTI
data. However, at this time point, there is no detectable difference between the injured and the control ON in either RA or k– map in vivo or ex vivo.
S.-W. Sun et al. / NeuroImage 32 (2006) 1195–1204 1199
vs. 0.24 T 0.06 Am2/ms, n = 8, P = 0.22). A 38% decrease of ex
vivo k || was observed in the injured ON compared to that of the
control (0.46 T 0.12 vs. 0.74 T 0.12 Am2/ms, n = 8, P < 0.0001).
The ex vivo k– in the injured ON (0.09 T 0.04, Am2/ms, n = 8)
were not different from values for the control (0.10 T 0.04 Am2/ms,
n = 8, P = 0.57). Thus, both in vivo and ex vivo DTI measurements
detected the axonal injury at 3 days after transient ischemia, and
neither method detected myelin damage at this time point.
Comparisons of in vivo and ex vivo DTI at 14 days after ischemia
Similar to findings at 3 days, the in vivo k || (1.20 T 0.18 Am2/
ms, n = 8) in the injured ON was significantly lower than that of
the control (1.79 T 0.18 Am2/ms, n = 8, P < 0.0001) at 14 days. A
significant elevation of in vivo k– was seen in the injured ON
(0.42 T 0.00 vs. 0.19 T 0.04 Am2/ms, n = 8, P < 0.0001) compared
Fig. 4. The RA, k ||, and k– maps were obtained from in vivo and ex vivo DTI of th
rectangles indicate the control and injured ON respectively. Decreased k || is seen i
elevated k– and decrease RA are seen in both in vivo and ex vivo measurement
to that of the control at 14 days. After fixation, the elevation of ex
vivo k– in the injured ON (0.24 T 0.09 Am2/ms) compared to the
control (0.10 T 0.07 Am2/ms, n = 8, P < 0.0001) was similar to that
observed in vivo. However, the significantly decreased k || seen in
the injured ON in vivo was not detectable in the ex vivo
measurement (0.60 T 0.14 vs. 0.72 T 0.13 Am2/ms as injured vs.
control, n = 8, P = 0.076; Fig. 5b).
Axonal and myelin damage assessed using immunohistochemistry
Axonal and myelin damage was validated using immunohisto-
chemistry after ex vivo DTI. A similar extent of axonal damage,
based on counting SMI-32 immunolabeled axons, was seen in ONs
at 3 and 14 days after retinal ischemia (Fig. 6). This was in
agreement with the in vivo DTI findings in which k || values at 3
and 14 days were significantly lower than the controls. In vivo k ||
e ON from the same mouse 14 days after retinal ischemia. Solid and dashed
n the injured ON in vivo (panel a), but not ex vivo (panel b). However, the
s.
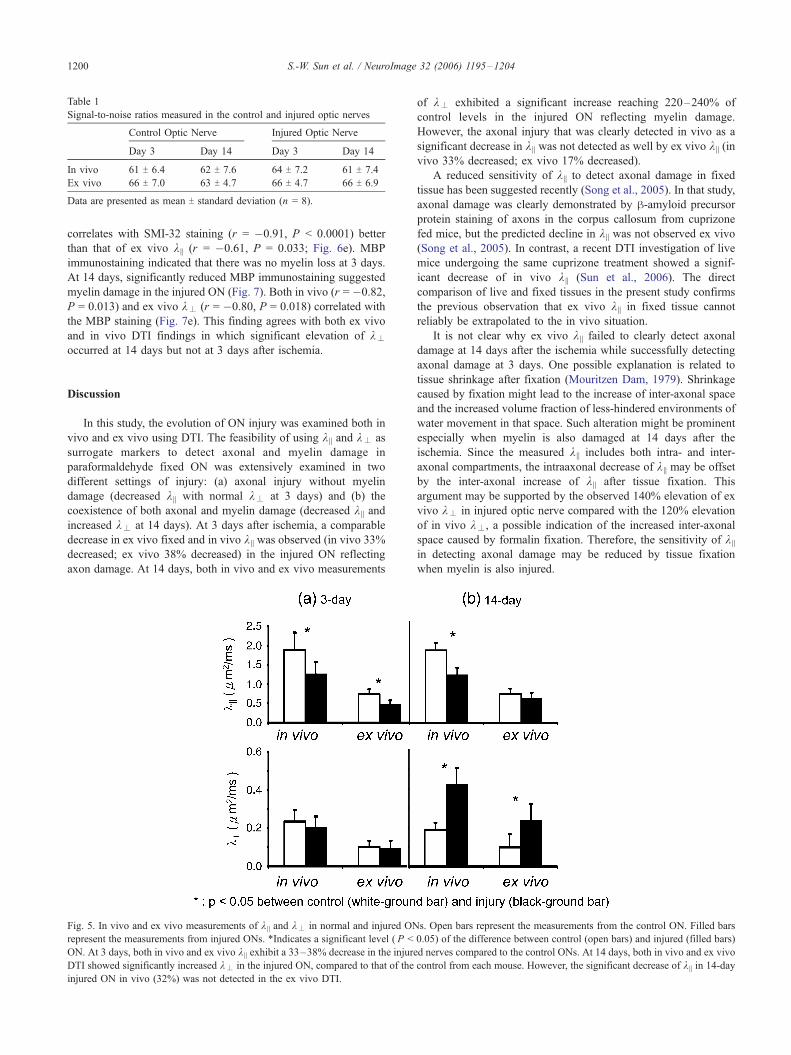
Table 1
Signal-to-noise ratios measured in the control and injured optic nerves
Control Optic Nerve Injured Optic Nerve
Day 3 Day 14 Day 3 Day 14
In vivo 61 T 6.4 62 T 7.6 64 T 7.2 61 T 7.4
Ex vivo 66 T 7.0 63 T 4.7 66 T 4.7 66 T 6.9
Data are presented as mean T standard deviation (n = 8).
S.-W. Sun et al. / NeuroImage 32 (2006) 1195–12041200
correlates with SMI-32 staining (r = �0.91, P < 0.0001) better
than that of ex vivo k || (r = �0.61, P = 0.033; Fig. 6e). MBP
immunostaining indicated that there was no myelin loss at 3 days.
At 14 days, significantly reduced MBP immunostaining suggested
myelin damage in the injured ON (Fig. 7). Both in vivo (r = �0.82,P = 0.013) and ex vivo k– (r = �0.80, P = 0.018) correlated with
the MBP staining (Fig. 7e). This finding agrees with both ex vivo
and in vivo DTI findings in which significant elevation of k–
occurred at 14 days but not at 3 days after ischemia.
Discussion
In this study, the evolution of ON injury was examined both in
vivo and ex vivo using DTI. The feasibility of using k || and k– as
surrogate markers to detect axonal and myelin damage in
paraformaldehyde fixed ON was extensively examined in two
different settings of injury: (a) axonal injury without myelin
damage (decreased k || with normal k– at 3 days) and (b) the
coexistence of both axonal and myelin damage (decreased k || and
increased k– at 14 days). At 3 days after ischemia, a comparable
decrease in ex vivo fixed and in vivo k || was observed (in vivo 33%
decreased; ex vivo 38% decreased) in the injured ON reflecting
axon damage. At 14 days, both in vivo and ex vivo measurements
Fig. 5. In vivo and ex vivo measurements of k || and k– in normal and injured ON
represent the measurements from injured ONs. *Indicates a significant level ( P <
ON. At 3 days, both in vivo and ex vivo k || exhibit a 33–38% decrease in the injure
DTI showed significantly increased k– in the injured ON, compared to that of the
injured ON in vivo (32%) was not detected in the ex vivo DTI.
of k– exhibited a significant increase reaching 220–240% of
control levels in the injured ON reflecting myelin damage.
However, the axonal injury that was clearly detected in vivo as a
significant decrease in k || was not detected as well by ex vivo k || (in
vivo 33% decreased; ex vivo 17% decreased).
A reduced sensitivity of k || to detect axonal damage in fixed
tissue has been suggested recently (Song et al., 2005). In that study,
axonal damage was clearly demonstrated by h-amyloid precursor
protein staining of axons in the corpus callosum from cuprizone
fed mice, but the predicted decline in k || was not observed ex vivo
(Song et al., 2005). In contrast, a recent DTI investigation of live
mice undergoing the same cuprizone treatment showed a signif-
icant decrease of in vivo k || (Sun et al., 2006). The direct
comparison of live and fixed tissues in the present study confirms
the previous observation that ex vivo k || in fixed tissue cannot
reliably be extrapolated to the in vivo situation.
It is not clear why ex vivo k || failed to clearly detect axonal
damage at 14 days after the ischemia while successfully detecting
axonal damage at 3 days. One possible explanation is related to
tissue shrinkage after fixation (Mouritzen Dam, 1979). Shrinkage
caused by fixation might lead to the increase of inter-axonal space
and the increased volume fraction of less-hindered environments of
water movement in that space. Such alteration might be prominent
especially when myelin is also damaged at 14 days after the
ischemia. Since the measured k || includes both intra- and inter-
axonal compartments, the intraaxonal decrease of k || may be offset
by the inter-axonal increase of k || after tissue fixation. This
argument may be supported by the observed 140% elevation of ex
vivo k– in injured optic nerve compared with the 120% elevation
of in vivo k–, a possible indication of the increased inter-axonal
space caused by formalin fixation. Therefore, the sensitivity of k ||
in detecting axonal damage may be reduced by tissue fixation
when myelin is also injured.
s. Open bars represent the measurements from the control ON. Filled bars
0.05) of the difference between control (open bars) and injured (filled bars)
d nerves compared to the control ONs. At 14 days, both in vivo and ex vivo
control from each mouse. However, the significant decrease of k || in 14-day
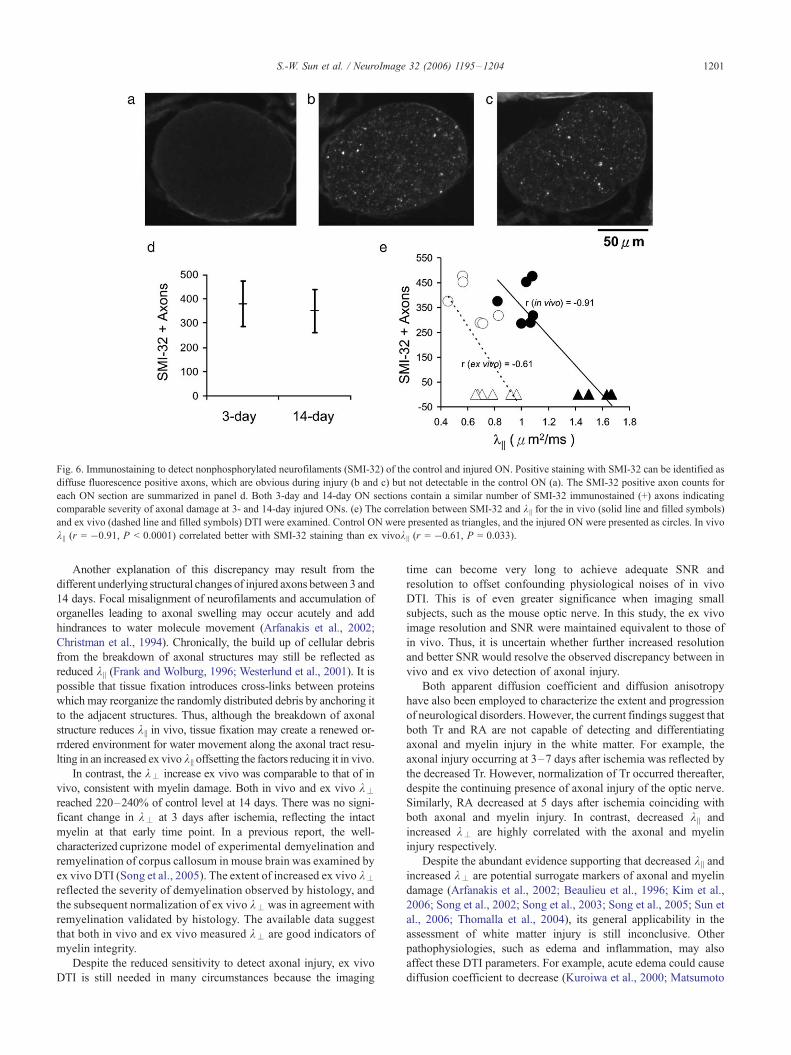
Fig. 6. Immunostaining to detect nonphosphorylated neurofilaments (SMI-32) of the control and injured ON. Positive staining with SMI-32 can be identified as
diffuse fluorescence positive axons, which are obvious during injury (b and c) but not detectable in the control ON (a). The SMI-32 positive axon counts for
each ON section are summarized in panel d. Both 3-day and 14-day ON sections contain a similar number of SMI-32 immunostained (+) axons indicating
comparable severity of axonal damage at 3- and 14-day injured ONs. (e) The correlation between SMI-32 and k || for the in vivo (solid line and filled symbols)
and ex vivo (dashed line and filled symbols) DTI were examined. Control ON were presented as triangles, and the injured ON were presented as circles. In vivo
k || (r = �0.91, P < 0.0001) correlated better with SMI-32 staining than ex vivok || (r = �0.61, P = 0.033).
S.-W. Sun et al. / NeuroImage 32 (2006) 1195–1204 1201
Another explanation of this discrepancy may result from the
different underlying structural changes of injured axons between 3 and
14 days. Focal misalignment of neurofilaments and accumulation of
organelles leading to axonal swelling may occur acutely and add
hindrances to water molecule movement (Arfanakis et al., 2002;
Christman et al., 1994). Chronically, the build up of cellular debris
from the breakdown of axonal structures may still be reflected as
reduced k || (Frank and Wolburg, 1996; Westerlund et al., 2001). It is
possible that tissue fixation introduces cross-links between proteins
which may reorganize the randomly distributed debris by anchoring it
to the adjacent structures. Thus, although the breakdown of axonal
structure reduces k || in vivo, tissue fixation may create a renewed or-
rrdered environment for water movement along the axonal tract resu-
lting in an increased ex vivo k || offsetting the factors reducing it in vivo.
In contrast, the k– increase ex vivo was comparable to that of in
vivo, consistent with myelin damage. Both in vivo and ex vivo k–
reached 220–240% of control level at 14 days. There was no signi-
ficant change in k– at 3 days after ischemia, reflecting the intact
myelin at that early time point. In a previous report, the well-
characterized cuprizone model of experimental demyelination and
remyelination of corpus callosum in mouse brain was examined by
ex vivo DTI (Song et al., 2005). The extent of increased ex vivo k–
reflected the severity of demyelination observed by histology, and
the subsequent normalization of ex vivo k–was in agreement with
remyelination validated by histology. The available data suggest
that both in vivo and ex vivo measured k– are good indicators of
myelin integrity.
Despite the reduced sensitivity to detect axonal injury, ex vivo
DTI is still needed in many circumstances because the imaging
time can become very long to achieve adequate SNR and
resolution to offset confounding physiological noises of in vivo
DTI. This is of even greater significance when imaging small
subjects, such as the mouse optic nerve. In this study, the ex vivo
image resolution and SNR were maintained equivalent to those of
in vivo. Thus, it is uncertain whether further increased resolution
and better SNR would resolve the observed discrepancy between in
vivo and ex vivo detection of axonal injury.
Both apparent diffusion coefficient and diffusion anisotropy
have also been employed to characterize the extent and progression
of neurological disorders. However, the current findings suggest that
both Tr and RA are not capable of detecting and differentiating
axonal and myelin injury in the white matter. For example, the
axonal injury occurring at 3–7 days after ischemia was reflected by
the decreased Tr. However, normalization of Tr occurred thereafter,
despite the continuing presence of axonal injury of the optic nerve.
Similarly, RA decreased at 5 days after ischemia coinciding with
both axonal and myelin injury. In contrast, decreased k || and
increased k– are highly correlated with the axonal and myelin
injury respectively.
Despite the abundant evidence supporting that decreased k || andincreased k– are potential surrogate markers of axonal and myelin
damage (Arfanakis et al., 2002; Beaulieu et al., 1996; Kim et al.,
2006; Song et al., 2002; Song et al., 2003; Song et al., 2005; Sun et
al., 2006; Thomalla et al., 2004), its general applicability in the
assessment of white matter injury is still inconclusive. Other
pathophysiologies, such as edema and inflammation, may also
affect these DTI parameters. For example, acute edema could cause
diffusion coefficient to decrease (Kuroiwa et al., 2000; Matsumoto
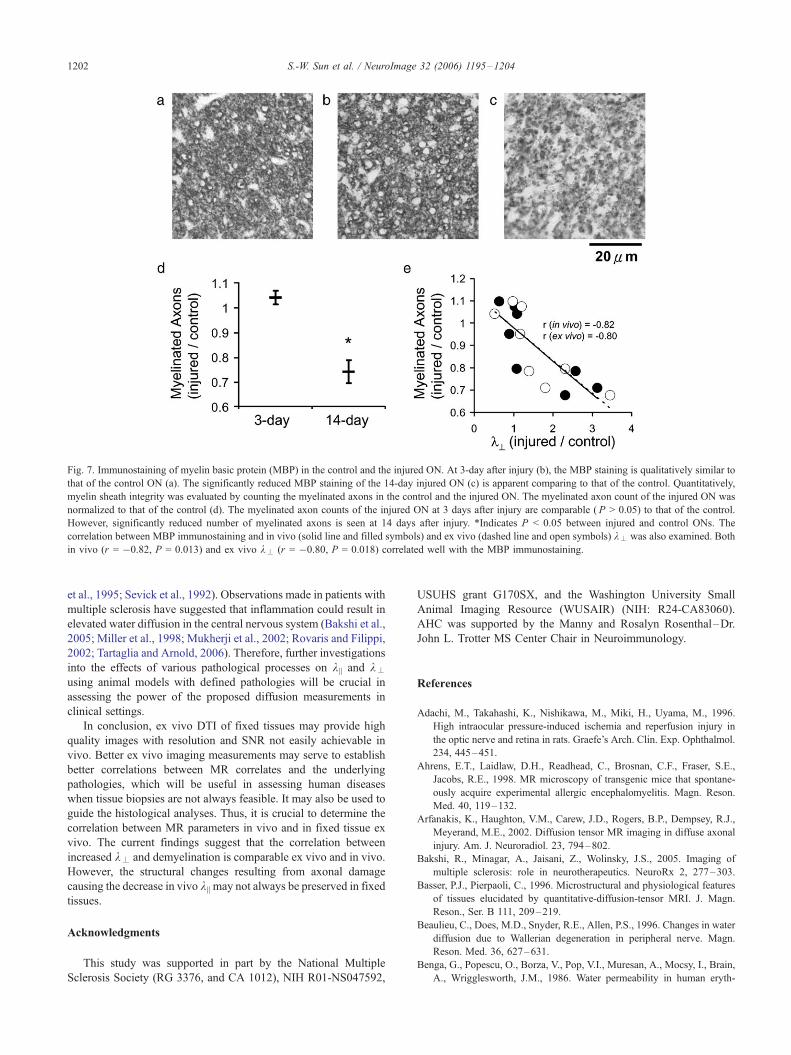
Fig. 7. Immunostaining of myelin basic protein (MBP) in the control and the injured ON. At 3-day after injury (b), the MBP staining is qualitatively similar to
that of the control ON (a). The significantly reduced MBP staining of the 14-day injured ON (c) is apparent comparing to that of the control. Quantitatively,
myelin sheath integrity was evaluated by counting the myelinated axons in the control and the injured ON. The myelinated axon count of the injured ON was
normalized to that of the control (d). The myelinated axon counts of the injured ON at 3 days after injury are comparable ( P > 0.05) to that of the control.
However, significantly reduced number of myelinated axons is seen at 14 days after injury. *Indicates P < 0.05 between injured and control ONs. The
correlation between MBP immunostaining and in vivo (solid line and filled symbols) and ex vivo (dashed line and open symbols) k– was also examined. Both
in vivo (r = �0.82, P = 0.013) and ex vivo k– (r = �0.80, P = 0.018) correlated well with the MBP immunostaining.
S.-W. Sun et al. / NeuroImage 32 (2006) 1195–12041202
et al., 1995; Sevick et al., 1992). Observations made in patients with
multiple sclerosis have suggested that inflammation could result in
elevated water diffusion in the central nervous system (Bakshi et al.,
2005; Miller et al., 1998; Mukherji et al., 2002; Rovaris and Filippi,
2002; Tartaglia and Arnold, 2006). Therefore, further investigations
into the effects of various pathological processes on k || and k–
using animal models with defined pathologies will be crucial in
assessing the power of the proposed diffusion measurements in
clinical settings.
In conclusion, ex vivo DTI of fixed tissues may provide high
quality images with resolution and SNR not easily achievable in
vivo. Better ex vivo imaging measurements may serve to establish
better correlations between MR correlates and the underlying
pathologies, which will be useful in assessing human diseases
when tissue biopsies are not always feasible. It may also be used to
guide the histological analyses. Thus, it is crucial to determine the
correlation between MR parameters in vivo and in fixed tissue ex
vivo. The current findings suggest that the correlation between
increased k– and demyelination is comparable ex vivo and in vivo.
However, the structural changes resulting from axonal damage
causing the decrease in vivo k || may not always be preserved in fixed
tissues.
Acknowledgments
This study was supported in part by the National Multiple
Sclerosis Society (RG 3376, and CA 1012), NIH R01-NS047592,
USUHS grant G170SX, and the Washington University Small
Animal Imaging Resource (WUSAIR) (NIH: R24-CA83060).
AHC was supported by the Manny and Rosalyn Rosenthal–Dr.
John L. Trotter MS Center Chair in Neuroimmunology.
References
Adachi, M., Takahashi, K., Nishikawa, M., Miki, H., Uyama, M., 1996.
High intraocular pressure-induced ischemia and reperfusion injury in
the optic nerve and retina in rats. Graefe’s Arch. Clin. Exp. Ophthalmol.
234, 445–451.
Ahrens, E.T., Laidlaw, D.H., Readhead, C., Brosnan, C.F., Fraser, S.E.,
Jacobs, R.E., 1998. MR microscopy of transgenic mice that spontane-
ously acquire experimental allergic encephalomyelitis. Magn. Reson.
Med. 40, 119–132.
Arfanakis, K., Haughton, V.M., Carew, J.D., Rogers, B.P., Dempsey, R.J.,
Meyerand, M.E., 2002. Diffusion tensor MR imaging in diffuse axonal
injury. Am. J. Neuroradiol. 23, 794–802.
Bakshi, R., Minagar, A., Jaisani, Z., Wolinsky, J.S., 2005. Imaging of
multiple sclerosis: role in neurotherapeutics. NeuroRx 2, 277–303.
Basser, P.J., Pierpaoli, C., 1996. Microstructural and physiological features
of tissues elucidated by quantitative-diffusion-tensor MRI. J. Magn.
Reson., Ser. B 111, 209–219.
Beaulieu, C., Does, M.D., Snyder, R.E., Allen, P.S., 1996. Changes in water
diffusion due to Wallerian degeneration in peripheral nerve. Magn.
Reson. Med. 36, 627–631.
Benga, G., Popescu, O., Borza, V., Pop, V.I., Muresan, A., Mocsy, I., Brain,
A., Wrigglesworth, J.M., 1986. Water permeability in human eryth-
S.-W. Sun et al. / NeuroImage 32 (2006) 1195–1204 1203
rocytes: identification of membrane proteins involved in water
transport. Eur. J. Cell Biol. 41, 252–262.
Bonny, J.M., Renou, J.P., 2002. Water diffusion features as indicators of
muscle structure ex vivo. Magn. Reson. Imaging 20, 395–400.
Bronge, L., Bogdanovic, N., Wahlund, L.O., 2002. Postmortem MRI and
histopathology of white matter changes in Alzheimer brains. A
quantitative, comparative study. Dementia Geriatr. Cognit. Disord. 13,
205–212.
Christman, C.W., Grady, M.S., Walker, S.A., Holloway, K.L., Povlishock,
J.T., 1994. Ultrastructural studies of diffuse axonal injury in humans. J.
Neurotrauma 11, 173–186.
Crespigny, A.J.d., D’Arceuil, H.E., Dai, G.G., Wang, R., Kim, Y.,
Mandeville, J.B., Wedeen, V.J., 2005. Comparison of in vivo and ex
vivo diffusion spectrum imaging (DSI) of rat brain. Proc. Intl. Soc.
Mag. Reson. Med. 13, 583.
Dandekar, A.A., Wu, G.F., Pewe, L., Perlman, S., 2001. Axonal damage is
T cell mediated and occurs concomitantly with demyelination in mice
infected with a neurotropic coronavirus. J. Virol. 75, 6115–6120.
Edelstein, W.A., Bottomley, P.A., Pfeifer, L.M., 1984. A signal-to-noise
calibration procedure for NMR imaging systems. Med. Phys. 11,
180–185.
Frank, M., Wolburg, H., 1996. Cellular reactions at the lesion site after
crushing of the rat optic nerve. Glia 16, 227–240.
Franklin, K.B., Paxinos, G., 1997. The Mouse Brain in Stereotaxic
Coordinates. Academic Press, San Diego.
Gold, G., Widnell, C.C., 1976. Relationship between microsomal mem-
brane permeability and the inhibition of hepatic glucose-6-phosphatase
by pyridoxal phosphate. J. Biol. Chem. 251, 1035–1041.
Guilfoyle, D.N., Helpern, J.A., Lim, K.O., 2003. Diffusion tensor imaging
in fixed brain tissue at 7.0 T. NMR Biomed. 16, 77–81.
Holmes, A.A., Scollan, D.F., Winslow, R.L., 2000. Direct histological
validation of diffusion tensor MRI in formaldehyde-fixed myocardium.
Magn. Reson. Med. 44, 157–161.
Hsu, E.W., Muzikant, A.L., Matulevicius, S.A., Penland, R.C., Henri-
quez, C.S., 1998. Magnetic resonance myocardial fiber-orientation
mapping with direct histological correlation. Am. J. Physiol. 274,
H1627–H1634.
Jacobs, R.E., Ahrens, E.T., Dickinson, M.E., Laidlaw, D., 1999. Towards a
microMRI atlas of mouse development. Comput. Med. Imaging Graph.
23, 15–24.
Kawai, S.I., Vora, S., Das, S., Gachie, E., Becker, B., Neufeld, A.H.,
2001. Modeling of risk factors for the degeneration of retinal ganglion
cells after ischemia/reperfusion in rats: effects of age, caloric
restriction, diabetes, pigmentation, and glaucoma. FASEB J. 15,
1285–1287.
Kim, J.H., Budde, M.D., Liang, H.F., Klein, R.S., Russell, J.H., Cross,
A.H., Song, S.K., 2006. Detecting axon damage in spinal cord from a
mouse model of multiple sclerosis. Neurobiol. Dis. 21, 626–632.
Kuroiwa, T., Nagaoka, T., Miyasaka, N., Akimoto, H., Zhao, F., Yamada, I.,
Ueki, M., Ichinose, S., 2000. Time course of trace of diffusion tensor
[Trace(D)] and histology in brain edema. Acta Neurochir., Suppl. 76,
191–194.
Le Bihan, D., 1995. Molecular diffusion, tissue microdynamics and
microstructure. NMR Biomed. 8, 375–386.
Matsumoto, K., Lo, E.H., Pierce, A.R., Wei, H., Garrido, L., Kowall,
N.W., 1995. Role of vasogenic edema and tissue cavitation in
ischemic evolution on diffusion-weighted imaging: comparison with
multiparameter MR and immunohistochemistry. Am. J. Neuroradiol.
16, 1107–1115.
Meier, D.S., Weiner, H.L., Khoury, S.J., Guttmann, C.R., 2004. Magnetic
resonance imaging surrogates of multiple sclerosis pathology and their
relationship to central nervous system atrophy. J. Neuroimaging 14,
46S–53S.
Miller, D.H., Grossman, R.I., Reingold, S.C., McFarland, H.F., 1998. The
role of magnetic resonance techniques in understanding and managing
multiple sclerosis. Brain 121 (Pt. 1), 3–24.
Mori, S., Crain, B.J., Chacko, V.P., van Zijl, P.C., 1999. Three-dimensional
tracking of axonal projections in the brain by magnetic resonance
imaging. Ann. Neurol. 45, 265–269.
Mori, S., Itoh, R., Zhang, J., Kaufmann, W.E., van Zijl, P.C., Solaiyappan,
M., Yarowsky, P., 2001. Diffusion tensor imaging of the developing
mouse brain. Magn. Reson. Med. 46, 18–23.
Mouritzen Dam, A., 1979. Shrinkage of the brain during histological
procedures with fixation in formaldehyde solutions of different
concentrations. J. Hirnforsch. 20, 115–119.
Mukherji, S.K., Chenevert, T.L., Castillo, M., 2002. Diffusion-weighted
magnetic resonance imaging. J. Neuroophthalmol. 22, 118–122.
Ormerod, M.G., Sun, X.M., Snowden, R.T., Davies, R., Fearnhead, H.,
Cohen, G.M., 1993. Increased membrane permeability of apoptotic
thymocytes: a flow cytometric study. Cytometry 14, 595–602.
Pfefferbaum, A., Sullivan, E.V., Adalsteinsson, E., Garrick, T., Harper, C.,
2004. Postmortem MR imaging of formalin-fixed human brain. Neuro-
Image 21, 1585–1595.
Rosenbaum, D.M., Rosenbaum, P.S., Singh, M., Gupta, G., Gupta, H., Li,
B., Roth, S., 2001. Functional and morphologic comparison of two
methods to produce transient retinal ischemia in the rat. J. Neuro-
ophthalmol. 21, 62–68.
Rovaris, M., Filippi, M., 2002. MR-based technology for in vivo detection,
characterization, and quantification of pathology of relapsing-remitting
multiple sclerosis. J. Rehabil. Res. Dev. 39, 243–259.
Schmierer, K., Scaravilli, F., Barker, G.J., Gordon, R., MacManus, D.G.,
Miller, D.H., 2003. Stereotactic co-registration of magnetic resonance
imaging and histopathology in post-mortem multiple sclerosis brain.
Neuropathol. Appl. Neurobiol. 29, 596–601.
Schmierer, K., Scaravilli, F., Altmann, D.R., Barker, G.J., Miller, D.H.,
2004. Magnetization transfer ratio and myelin in postmortem multiple
sclerosis brain. Ann. Neurol. 56, 407–415.
Sehy, J.V., Banks, A.A., Ackerman, J.J., Neil, J.J., 2002. Importance of
intracellular water apparent diffusion to the measurement of membrane
permeability. Biophys. J. 83, 2856–2863.
Sevick, R.J., Kanda, F., Mintorovitch, J., Arieff, A.I., Kucharczyk, J.,
Tsuruda, J.S., Norman, D., Moseley, M.E., 1992. Cytotoxic brain
edema: assessment with diffusion-weighted MR imaging. Radiology
185, 687–690.
Song, S.K., Sun, S.W., Ramsbottom, M.J., Chang, C., Russell, J., Cross,
A.H., 2002. Dysmyelination revealed through MRI as increased
radial (but unchanged axial) diffusion of water. NeuroImage 17,
1429–1436.
Song, S.K., Sun, S.W., Ju, W.K., Lin, S.J., Cross, A.H., Neufeld, A.H.,
2003. Diffusion tensor imaging detects and differentiates axon and
myelin degeneration in mouse optic nerve after retinal ischemia.
NeuroImage 20, 1714–1722.
Song, S.K., Yoshino, J., Le, T.Q., Lin, S.J., Sun, S.W., Cross,
A.H., Armstrong, R.C., 2005. Demyelination increases radial
diffusivity in corpus callosum of mouse brain. NeuroImage 26,
132–140.
Sun, S.W., Neil, J.J., Song, S.K., 2003. Relative indices of water diffusion
anisotropy are equivalent in live and formalin-fixed mouse brains.
Magn. Reson. Med. 50, 743–748.
Sun, S.W., Neil, J.J., Liang, H.F., He, Y.Y., Schmidt, R.E., Hsu, C.Y., Song,
S.K., 2005. Formalin fixation alters water diffusion coefficient
magnitude but not anisotropy in infarcted brain. Magn. Reson. Med.
53, 1447–1451.
Sun, S.W., Liang, H.F., Trinkaus, K., Cross, A.H., Armstrong, R.C., Song,
S.K., 2006. Noninvasive detection of cuprizone induced axonal damage
and demyelination in the mouse corpus callosum. Magn. Reson. Med.
55, 302–308.
Tartaglia, M.C., Arnold, D.L., 2006. The role of MRS and fMRI in multiple
sclerosis. Adv. Neurol. 98, 185–202.
Thomalla, G., Glauche, V., Koch, M.A., Beaulieu, C., Weiller, C., Rother,
J., 2004. Diffusion tensor imaging detects early Wallerian degenera-
tion of the pyramidal tract after ischemic stroke. NeuroImage 22,
1767–1774.
Trapp, B.D., Peterson, J., Ransohoff, R.M., Rudick, R., Mork, S., Bo, L.,

S.-W. Sun et al. / NeuroImage 32 (2006) 1195–12041204
1998. Axonal transection in the lesions of multiple sclerosis. N. Engl. J.
Med. 338, 278–285.
van der Toorn, A., Sykova, E., Dijkhuizen, R.M., Vorisek, I., Vargova, L.,
Skobisova, E., van Lookeren Campagne, M., Reese, T., Nicolay, K.,
1996. Dynamic changes in water ADC, energy metabolism, extracel-
lular space volume, and tortuosity in neonatal rat brain during global
ischemia. Magn. Reson. Med. 36, 52–60.
Wedeen, V.J., Reese, T.G., Napadow, V.J., Gilbert, R.J., 2001. Demonstra-
tion of primary and secondary muscle fiber architecture of the bovine
tongue by diffusion tensor magnetic resonance imaging. Biophys. J. 80,
1024–1028.
Westerlund, T., Vuorinen, V., Roytta, M., 2001. Same axonal regeneration
rate after different endoneurial response to intraneural glycerol and
phenol injection. Acta Neuropathol. (Berl.) 102, 41–54.