Differential limb loading in miniature pigs (Sus scrofa domesticus): a test of chondral modeling...
12
1472 INTRODUCTION Chondral modeling is defined as the adaptive ontogenetic response of cartilage to regional variation in hydrostatic pressure, resulting in increased chondrocyte mitosis and synthesis of the extracellular matrix (ECM), influencing overall joint topography, congruence and size (Frost, 1979; Frost, 1999; Hamrick, 1999; Murray et al., 2001; Carter and Wong, 2003; Plochocki et al., 2009). Such chondrogenic changes are believed to facilitate normal joint movement and minimize dangerously high regional contact stresses (Frost, 1979). Chondral modeling theory predicts regional or widespread thickening of cartilage, changes in cellular and extracellular cartilage composition, and differential mineralization and ossification of hyaline tissue, thereby directly influencing bony morphology through increased bone deposition. There is evidence that chondral modeling occurs at articular and physeal cartilage surfaces (Hammond et al., 2010) and it is hypothesized to occur at sites of fascial, tendinous and ligamentous insertion (Frost, 1979). Postnatal variation in mechanical loading has been shown to yield changes in chondrocyte proliferation and metabolism, as well as changes in the synthesis and proteoglycan content of the ECM, ultimately influencing adult form (Eggli et al., 1988; Kiviranta et al., 1988; Wu and Chen, 2000; Liu et al., 2001; Carter and Wong, 2003; Ravosa et al., 2007; Ravosa et al., 2008a; Ravosa et al., 2008b; Hammond et al., 2010). Chondrocytes, in various stages of development, are the only cells located in cartilage. They are responsible for the production and maintenance of the ECM, and regulate the numerous changes thought to occur during chondral modeling (Kiviranta et al., 1988). It has been suggested that a range of physiological loading results in maximal stimulation of regional cartilage growth (Frost, 1979). Frost observed that cartilage synthesis is reduced under routinely high compressive loads, but enhanced under moderate loads, and hypothesized that unequal mechanical loads are responsible for the observed patterns of morphological variation in adult cartilage (Frost, 1979). Accordingly, cartilage regions subjected to greater loads are posited to display a decrease in chondrocyte density and an increase in cell area compared with less heavily loaded regions (Eggli et al., 1988). In a re-evaluation of chondral modeling theory, Hamrick discussed the effect of hydrostatic pressure on both the range of cartilage loading magnitude and loading frequency (Hamrick, 1999). Under moderately increased levels of mechanical stimuli, chondrocytes are predicted to exhibit increased division and ECM synthesis in order to produce uniform hydrostatic pressure throughout the tissue. In this regard, in vitro cyclic loading resulted The Journal of Experimental Biology 215, 1472-1483 © 2012. Published by The Company of Biologists Ltd doi:10.1242/jeb.061531 RESEARCH ARTICLE Differential limb loading in miniature pigs (Sus scrofa domesticus): a test of chondral modeling theory Kimberly A. Congdon 1 , Ashley S. Hammond 1 and Matthew J. Ravosa 2,3 1 Department of Pathology and Anatomical Sciences, University of Missouri School of Medicine, Columbia, MO 65212, USA, 2 Departments of Biological Sciences, Aerospace and Mechanical Engineering, and Anthropology, University of Notre Dame, Notre Dame, IN 46556 and 3 Department of Anatomy and Cell Biology, Indiana University School of Medicine – South Bend, South Bend, IN 46617, USA Author for correspondence ([email protected]) Accepted 28 December 2011 SUMMARY Variation in mechanical loading is known to influence chondrogenesis during joint formation. However, the interaction among chondrocyte behavior and variation in activity patterns is incompletely understood, hindering our knowledge of limb ontogeny and function. Here, the role of endurance exercise in the development of articular and physeal cartilage in the humeral head was examined in 14 miniature swine (Sus scrofa domesticus). One group was subjected to graded treadmill running over a period of 17 weeks. A matched sedentary group was confined to individual pens. Hematoxylin and eosin staining was performed for histomorphometry of cartilage zone thickness, chondrocyte count and cell area, with these parameters compared multivariately between exercised and sedentary groups. Comparisons were also made with femora from the same sample, focusing on humerus–femur differences between exercised and sedentary groups, within-cohort comparisons of humerus–femur responses and correlated changes within and across joints. This study shows conflicting support for the chondral modeling theory. The humeral articular cartilage of exercised pigs was thinner than that of sedentary pigs, but their physeal cartilage was thicker. While articular and physeal cartilage demonstrated between-cohort differences, humeral physeal cartilage exhibited load-induced responses of greater magnitude than humeral articular cartilage. Controlling for cohort, the humerus showed increased chondrocyte mitosis and cell area, presumably due to relatively greater loading than the femur. This represents the first known effort to evaluate chondral modeling across multiple joints from the same individuals. Our findings suggest the chondral response to elevated loading is complex, varying within and among joints. This has important implications for understanding joint biomechanics and development. Key words: cartilage, mechanobiology, limbs, chondrogenesis, joints, mammals, plasticity. THE JOURNAL OF EXPERIMENTAL BIOLOGY THE JOURNAL OF EXPERIMENTAL BIOLOGY
Transcript of Differential limb loading in miniature pigs (Sus scrofa domesticus): a test of chondral modeling...

1472
INTRODUCTIONChondral modeling is defined as the adaptive ontogenetic responseof cartilage to regional variation in hydrostatic pressure, resultingin increased chondrocyte mitosis and synthesis of the extracellularmatrix (ECM), influencing overall joint topography, congruence andsize (Frost, 1979; Frost, 1999; Hamrick, 1999; Murray et al., 2001;Carter and Wong, 2003; Plochocki et al., 2009). Such chondrogenicchanges are believed to facilitate normal joint movement andminimize dangerously high regional contact stresses (Frost, 1979).Chondral modeling theory predicts regional or widespreadthickening of cartilage, changes in cellular and extracellular cartilagecomposition, and differential mineralization and ossification ofhyaline tissue, thereby directly influencing bony morphologythrough increased bone deposition. There is evidence that chondralmodeling occurs at articular and physeal cartilage surfaces(Hammond et al., 2010) and it is hypothesized to occur at sites offascial, tendinous and ligamentous insertion (Frost, 1979).
Postnatal variation in mechanical loading has been shown to yieldchanges in chondrocyte proliferation and metabolism, as well aschanges in the synthesis and proteoglycan content of the ECM,ultimately influencing adult form (Eggli et al., 1988; Kiviranta etal., 1988; Wu and Chen, 2000; Liu et al., 2001; Carter and Wong,
2003; Ravosa et al., 2007; Ravosa et al., 2008a; Ravosa et al., 2008b;Hammond et al., 2010). Chondrocytes, in various stages ofdevelopment, are the only cells located in cartilage. They areresponsible for the production and maintenance of the ECM, andregulate the numerous changes thought to occur during chondralmodeling (Kiviranta et al., 1988). It has been suggested that a rangeof physiological loading results in maximal stimulation of regionalcartilage growth (Frost, 1979). Frost observed that cartilage synthesisis reduced under routinely high compressive loads, but enhancedunder moderate loads, and hypothesized that unequal mechanicalloads are responsible for the observed patterns of morphologicalvariation in adult cartilage (Frost, 1979). Accordingly, cartilageregions subjected to greater loads are posited to display a decreasein chondrocyte density and an increase in cell area compared withless heavily loaded regions (Eggli et al., 1988).
In a re-evaluation of chondral modeling theory, Hamrickdiscussed the effect of hydrostatic pressure on both the range ofcartilage loading magnitude and loading frequency (Hamrick,1999). Under moderately increased levels of mechanical stimuli,chondrocytes are predicted to exhibit increased division and ECMsynthesis in order to produce uniform hydrostatic pressurethroughout the tissue. In this regard, in vitro cyclic loading resulted
The Journal of Experimental Biology 215, 1472-1483© 2012. Published by The Company of Biologists Ltddoi:10.1242/jeb.061531
RESEARCH ARTICLE
Differential limb loading in miniature pigs (Sus scrofa domesticus): a test of chondralmodeling theory
Kimberly A. Congdon1, Ashley S. Hammond1 and Matthew J. Ravosa2,3
1Department of Pathology and Anatomical Sciences, University of Missouri School of Medicine, Columbia, MO 65212, USA,2Departments of Biological Sciences, Aerospace and Mechanical Engineering, and Anthropology, University of Notre Dame, NotreDame, IN 46556 and 3Department of Anatomy and Cell Biology, Indiana University School of Medicine – South Bend, South Bend,
IN 46617, USAAuthor for correspondence ([email protected])
Accepted 28 December 2011
SUMMARYVariation in mechanical loading is known to influence chondrogenesis during joint formation. However, the interaction amongchondrocyte behavior and variation in activity patterns is incompletely understood, hindering our knowledge of limb ontogenyand function. Here, the role of endurance exercise in the development of articular and physeal cartilage in the humeral head wasexamined in 14 miniature swine (Sus scrofa domesticus). One group was subjected to graded treadmill running over a period of17 weeks. A matched sedentary group was confined to individual pens. Hematoxylin and eosin staining was performed forhistomorphometry of cartilage zone thickness, chondrocyte count and cell area, with these parameters compared multivariatelybetween exercised and sedentary groups. Comparisons were also made with femora from the same sample, focusing onhumerus–femur differences between exercised and sedentary groups, within-cohort comparisons of humerus–femur responsesand correlated changes within and across joints. This study shows conflicting support for the chondral modeling theory. Thehumeral articular cartilage of exercised pigs was thinner than that of sedentary pigs, but their physeal cartilage was thicker. Whilearticular and physeal cartilage demonstrated between-cohort differences, humeral physeal cartilage exhibited load-inducedresponses of greater magnitude than humeral articular cartilage. Controlling for cohort, the humerus showed increasedchondrocyte mitosis and cell area, presumably due to relatively greater loading than the femur. This represents the first knowneffort to evaluate chondral modeling across multiple joints from the same individuals. Our findings suggest the chondralresponse to elevated loading is complex, varying within and among joints. This has important implications for understanding jointbiomechanics and development.
Key words: cartilage, mechanobiology, limbs, chondrogenesis, joints, mammals, plasticity.
THE JOURNAL OF EXPERIMENTAL BIOLOGYTHE JOURNAL OF EXPERIMENTAL BIOLOGY
1473Limb loading and joint plasticity
in differentially greater chondrocyte proliferation in immature vsmore mature hypertrophic chondrocytes (Wu and Chen, 2000). Thissuggested that certain effects of mechanical loading may vary withage. Another in vitro study examined the effect of vibration onproteoglycan synthesis in articular cartilage of rabbits, and foundthat moderate frequencies of vibration, applied intermittently,resulted in an increase in proteoglycan content, whereas higherfrequencies inhibited proteoglycan synthesis (Liu et al., 2001).Similar findings have been observed in the jaw joints of growingrabbits subjected to long-term elevation of masticatory stresses(Ravosa et al., 2007; Ravosa et al., 2008a; Ravosa et al., 2008b).An in silico analysis suggests that intermittent hydrostatic pressureswould result in cartilage maintenance, but repetitive tensile strainswould result in elevated cartilage modeling (Carter and Wong, 2003).Lastly, while cartilage plasticity involves a number of changes atthe protein and molecular levels (e.g. Carvalho et al., 1995;Mizoguchi et al., 1996; Grodzinsky et al., 2000; Wong and Carter,2003), chondral modeling theory has largely focused on tissue andcellular changes (e.g. Frost, 1979; Eggli et al., 1988; Hamrick, 1999;Wu and Chen, 2000).
Comparisons of articular and physeal cartilage have demonstratedtissue-level differences in the ontogenetic responses to alteredloading conditions, specifically the pathological conditions ofchondrocytes, the relative expression of collagen type I, II, X andXI, and the molecular underpinnings of angiogenesis (Wardale andDuance, 1993; Wardale and Duance, 1994; Stempel et al., 2011).There is evidence that articular chondrocytes derive from a uniquecellular subpopulation prior to early embryological differentiation(Hyde et al., 2007). While both cartilage types express many of thesame transcription factors during development, such transcriptionfactors play different roles in articular vs physeal cartilage (Dy etal., 2010). Further variation in the distribution of collagen type XIIunderscores embryological differences between these two cartilagetypes, suggesting the possibility of differing responses to similarstimuli at very early ages (Gregory et al., 2001). This couldcontribute to different load-induced plasticity, which deservesfurther investigation, particularly in an experimental setting whereone can examine both cartilage types within the same joint.
In this regard, a recent study found dissimilar results regardingthe plasticity responses of articular and physeal cartilage to alteredlimb loading (Hammond et al., 2010). In particular, support for thepredictions of chondral modeling theory, including increased cellproliferation and cartilage height, was observed only for the physealcartilage. While neither cartilage height nor cellularity discriminatedwell between the articular cartilage in the proximal femur of exercisevs sedentary pigs, both parameters in the physeal cartilage werehighly successful in discriminating between loading cohorts. Suchdissimilarities in the response of different cartilage types highlightthe possibility of site-specific variability in chondrogenesis and,ultimately, variation in cartilage proportions within the same jointof members of a given loading cohort (Hammond et al., 2010).Additional in vivo data on load-induced responses of the ECM aswell as chondrocyte proliferation and hypertrophy would beinvaluable for further illuminating issues regarding intralimbvariation in chondrogenesis as it relates to altered loading regimes.
With this in mind, a further examination of the humeri from thesame subjects examined previously (Hammond et al., 2010)represents a unique opportunity to evaluate the chondral responsein different joints in the same experimental animals. By comparingdifferences in loaded vs unloaded cohorts in another joint from thesame organism, one can better evaluate the general relevance of thepredictions of chondral modeling theory. In addition, as prior work
has demonstrated that domestic pigs are ‘forelimb dominant’,experiencing greater vertical reaction forces in the forelimb vs thehindlimb (Thorup et al., 2007; Von Wachenfelt et al., 2009a; VonWachenfelt et al., 2009b; Von Wachenfelt et al., 2010), comparisonsof multiple joints in the same individuals may be informative aboutthe relative magnitude of cartilaginous responses in different jointssubjected to the same locomotor regimes. By detailing how multiplejoints respond to loading within a given organism, we can enhanceour understanding of joint formation and norms of reaction inmammalian limbs. Such information would be valuable not only tobiomedical research exploring the applicability of exercise as atherapeutic method but also to paleontological fields wherelocomotor reconstructions of fossil material could benefit greatlyfrom a better understanding of the adaptive response of joints.
To determine the adaptive responses of cartilage to altered loadsin the growing limb, the proximal humerus of exercised (Ex) andsedentary (Sed) juvenile miniature pigs (Sus scrofa domesticus) wasevaluated. Following the expectations of chondral modeling theory,it was hypothesized that an increase in mechanical loading of theproximal humerus would result in chondrocyte hypertrophy andproliferation, with corresponding increases in cartilage height (Frost,1979; Frost, 1999; Hamrick, 1999; Murray et al., 2001; Carter andWong, 2003; Plochocki et al., 2009). As pig forelimbs are knownto be loaded more heavily than their hindlimbs (Thorup et al., 2007;Von Wachenfelt et al., 2009a; Von Wachenfelt et al., 2009b; VonWachenfelt et al., 2010), chondral modeling was further examinedvia cohort-controlled analyses of the proximal humerus and proximalfemur. For such comparisons, we predicted that the humerus wouldexhibit elevated chondrocyte hypertrophy and proliferation as wellas greater cartilage height than the femur. To the best of ourknowledge, this represents the first study to evaluate adaptivechondrogenesis in two limb joints from the same experimentalsample.
MATERIALS AND METHODSSample
Fifteen castrated male juvenile miniature Yucatan swine (S. s.domesticus, Erxleben 1777) (Sinclair Bio Resources, Auxvasse, MO,USA) began the protocol at 8months of age and were killed in the17th week of participation in the experiment. Pigs are skeletallyimmature until approximately 6years of age (Dyce et al., 2002);therefore, these individuals can be considered juveniles for the extentof the study period. The pigs were divided into two groups composedof seven exercised and eight sedentary control animals. Exercisedpigs completed treadmill running 5days a week, while members ofthe sedentary cohort were raised without exercise for the same timeperiod. All other aspects of the experimental protocol were identicalbetween groups. Treadmill running consisted of four stages: a 5minwarm-up (2.0–2.5m.p.h., where 1m.p.h.1.609kmh–1), 15min sprint(4.0–7.0m.p.h.), a period of endurance running (3.0–5.0m.p.h.), anda 5min cool-down (2.0–2.5m.p.h.). The endurance running periodvaried among both individuals and exercise sessions, and wasdetermined behaviorally by the subject’s willingness to run (Table1);all subjects showed age-related increases in the weekly mean amountof time they were able to perform endurance running. Ultimately,seven right humeri from each group were preserved, with fourspecimens per group of sufficient quality for histomorphometry[additional details on the housing and care of experimental subjects,as well as sample acquisition and preparation can be found elsewhere(Hammond et al., 2010)]. All in vivo procedures were approved bythe University of Missouri Animal Care and Use Committee underprotocol 472-2.
THE JOURNAL OF EXPERIMENTAL BIOLOGYTHE JOURNAL OF EXPERIMENTAL BIOLOGY

1474
One additional caveat to consider is the effect of castration onchondrogenesis. Earlier research has shown that castration, andthereby the absence of testosterone, can increase apoptosis anddecrease chondrocyte proliferation in rabbits (Irie et al., 2005). Whilein this case all the animals were castrated and therefore the absenceof testosterone is likely not underlying differences between groups,it is possible that all individuals exhibited less chondrocyteproliferation than they would have if left intact. Given the relativelyyoung age of the sample, this is likely to have been less an issuethan if the period of experimental modification were continued intosubadult and adult stages.
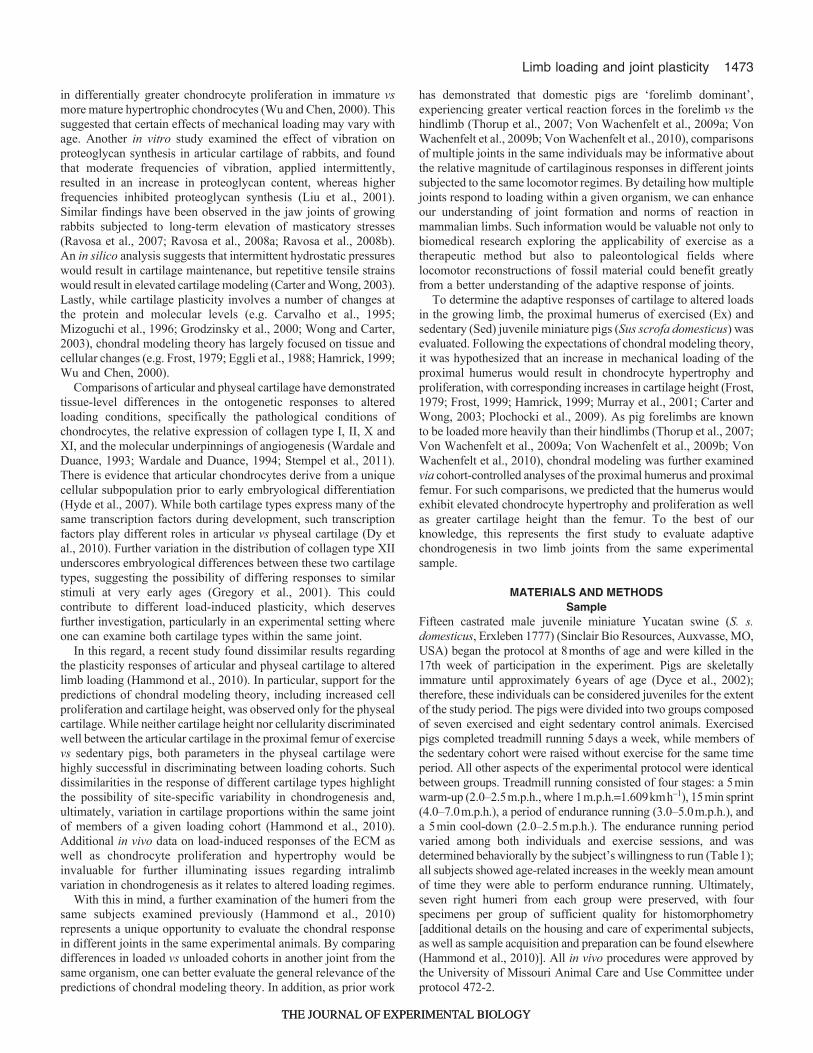
MeasurementsAfter dissection, coronal sections of proximal humerus bone andcartilage were prepared using standard histological methods.Hematoxylin and eosin stain (H&E) was used to identify articularand physeal cartilage for histomorphometry. Cartilage for both siteswas imaged at four regions with an Olympus BX41 microscope(Fig.1). Physeal cartilage zones (reserve, proliferative, hypertrophic;Fig.2A) were delineated based on cell morphology (Niehoff et al.,2004) (Fig.2B) and measured as a linear mean in each standardsection. Articular cartilage was measured as total mean heightbecause zones could not be sufficiently defined based on cellmorphology. In each cartilage zone, ratios of ‘scaled cell counts’in a 300m wide standard column height were calculated by takinga raw count of cell number and dividing that value by the height ofa cartilage region. A ‘cell area’ A was calculated for both articularand physeal chondrocytes from the formula A(0.5h�0.5l�),where h and l are the height and length measurement, respectively,of the cell. Corresponding histomorphometric data were availablefrom a similar study of the proximal femur (Hammond et al., 2010).When comparing Ex humeri to Sed humeri, a mean for each of thefour regions sampled was calculated for the articular cartilagevariables, with one mean per region per zone calculated for thephyseal cartilage variables.
It is important to note that these are two-dimensionalmeasurements from two-dimensional images of what are in factthree-dimensional structures. In all cases, considerable caution wasemployed to ensure that specimen orientation was consistent forhistological sections, and thus histomorphometric parameters, atmid-joint. Such a protocol is crucial for the within- and between-
K. A. Congdon, A. S. Hammond and M. J. Ravosa
joint comparisons performed herein. While outside of the scope andgoals of this study, another goal is to perform more exhaustiveanalyses of cartilage histomorphometry so as to more thoroughlycharacterize within-joint three-dimensional variation in cartilageform and function.
AnalysesBetween-group scaled cell counts, cell area and cartilage height werecompared via a series of discriminant function analyses (DFA). DFAis a multivariate statistical test that uses a priori knowledge of groupcomposition to examine the extent a set of parameters correctly sortsthe members of a cohort. To ensure that a given variable would nothave an undue influence on such multivariate analyses, only
Table 1. Weekly mean (±s.d.) duration of endurance running sessions (min)
Week Pig 1 Pig 2 Pig 3 Pig 4 Pig 5 Pig 6 Pig 7
1 20.8±1.1 22.0±1.6 22.0±2.7 24.0±2.2 22.0±1.6 24.0±2.2 22.0±1.62 27.0±1.2 26.8±1.6 25.8±1.8 27.0±1.6 27.0±1.6 27.4±2.2 27.0±1.63 30.6±1.3 32.0±1.6 30.0±0.0 32.0±1.6 32.0±1.6 34.0±2.2 32.0±1.64 34.8±0.8 37.0±1.6 33.0±2.7 37.0±1.6 37.0±1.6 35.8±1.8 37.0±1.65 38.4±2.3 39.0±2.2 40.0±0.0 40.0±0.0 40.0±0.0 40.0±0.0 40.0±0.06 41.2±1.3 43.0±1.6 40.0±0.0 42.0±1.6 42.0±1.6 41.0±2.2 43.0±1.67 44.8±0.5 45.0±0.0 45.0±0.0 45.0±0.0 45.0±0.0 45.0±0.0 45.0±0.08 46.2±1.3 48.0±1.6 39.0±10.8 47.0±1.6 47.0±1.6 47.0±2.7 48.0±1.69 49.8±0.5 50.0±0.0 47.0±2.7 46.0±8.9 50.0±0.0 50.0±0.0 50.0±0.010 51.2±1.3 50.4±0.6 47.0±11.0 41.2±23.1 43.2±18.6 53.0±2.7 53.0±1.611 56.0±1.6 55.8±1.9 44.8±25.3 49.4±6.6 57.0±1.6 57.0±2.7 58.0±1.612 60.0±0.0 60.0±0.0 45.6±11.3 56.0±8.9 60.0±0.0 60.0±0.0 44.0±19.813 60.0±0.0 57.0±4.5 27.6±16.6 52.0±5.7 60.0±0.0 60.0±0.0 60.0±0.014 54.0±13.4 51.0±8.2 56.0±5.5 47.0±4.5 60.0±0.0 60.0±0.0 60.0±0.015 56.0±4.2 44.0±26.1 49.0±10.8 53.0±6.7 60.0±0.0 42.2±21.3 57.0±6.716 37.0±33.8 37.8±23.4 56.0±5.5 29.0±16.7 48.0±26.8 32.0±29.3 58.0±4.5
Humeri were sampled from pigs 1–4, femora from pigs 2–7.A roughly equivalent weekly mean and standard deviation indicate that the pig was not run for 1 of the 5 sessions that week.
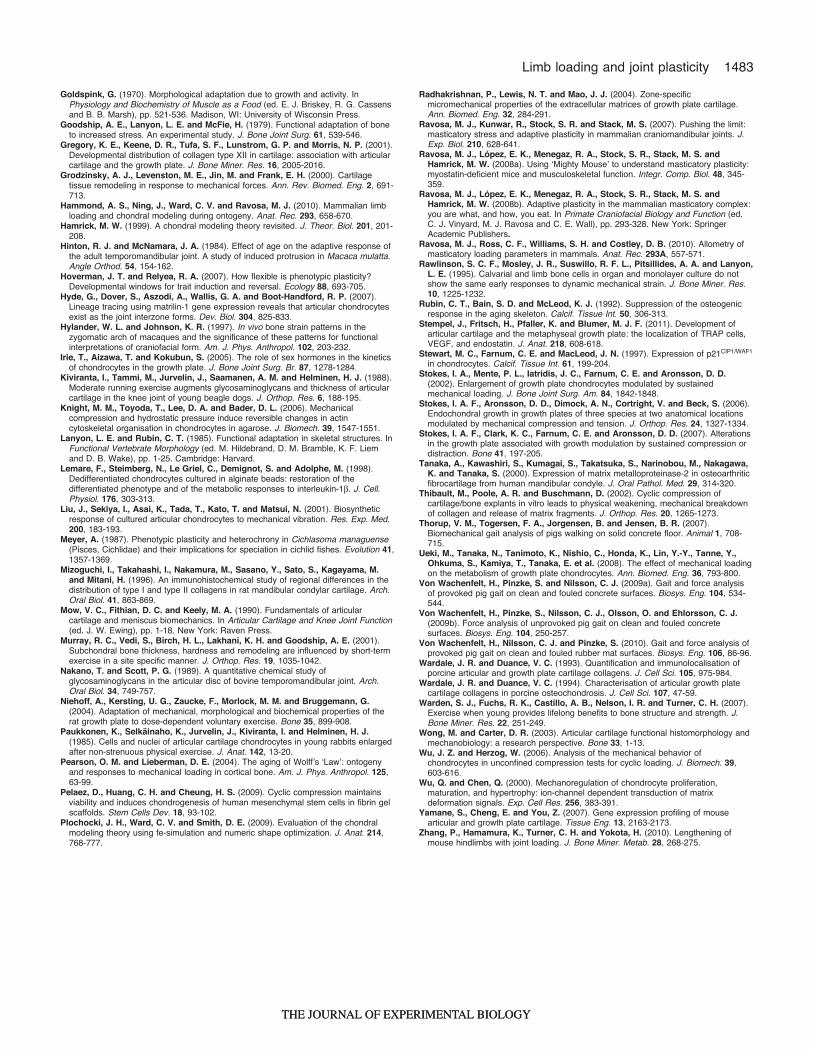
Fig.1. Illustration of 8 sampled regions from the humeral head (Ar,articular; gp, physeal). Regions are referred to as articular regions I–IV andphyseal regions I–IV. This is a longitudinal section of humeral head, withthe epiphyses oriented towards the left.
THE JOURNAL OF EXPERIMENTAL BIOLOGYTHE JOURNAL OF EXPERIMENTAL BIOLOGY

1475Limb loading and joint plasticity
variables of similar scale were included in a given DFA. Thus, ratiodata, linear measurements and cell counts were analyzed separately,controlling for articular and physeal cartilage. For each DFAperformed, each individual was represented by one mean value foreach variable included. As an example, for the DFA of articularvariables comparing Sed humeri with Ex humeri, each individualwas represented by one mean scaled cell count, one mean cartilageheight and one mean cell area. To accommodate constraints on thenumber of variables that could be included in a given DFA relatedto the sample sizes, it was necessary to separately analyze somedata of similar scale from similar cartilage types. Thus, in certaincases physeal values were sorted into central regions (identified as2 and 3) and peripheral regions (identified as 1 and 4). We chosethe variables based on joint site, with central regions closer to themiddle of the physis and peripheral regions near the edges of thephysis. Because of the smaller sample sizes, only DFAs with a meancorrect classification percentage above 75% were considerednoteworthy, indicating that three out of four individuals werecorrectly classified.
Non-parametric ANOVA (Mann–Whitney U-test) was usedsolely to identify a variable(s) that may be underlying the between-group variation detected via DFA. Thus, in addition to followingthe convention where statistical significance between groups isevaluated at P≤0.05, mean trends were indicated for those variablesoccurring at P≤0.10 and P≤0.20. In the absence of a univariate trend,notable variation detected by DFA was considered to be driven bythe totality of the multivariate pattern for a given cohort.
DFA and ANOVA were also used to evaluate differencesbetween humerus and femur parameters within each pig,controlling for locomotor behavior. When comparing humeri withfemora, elements were represented by one mean value, poolingthe four measured regions for each variable, ultimately yieldingone value for each articular cartilage variable and one value perzone for each physeal cartilage variable. DFAs for this sampleexamined height (including all articular and physeal values), cellcount (including all articular and physeal values) and cell area(including only physeal values, as articular cell areas could notbe accurately measured for the femora because of insufficientclarity of cell borders).
Similar articular and physeal cartilage variables were tested forstrength of within-cohort associations via Pearson correlationcoefficients (r); specifically, total height, cell count and cell area inthe humerus and total height and cell count in the femur, as werehomologous variables within articular and physeal cartilage across
joints of the same cohort. Both r-values and P-values from bivariateregressions are reported. Correlations were tested for all Sed andEx variables in both humeral and femoral samples. Statisticalsignificance was evaluated at P≤0.05, with trends indicated forcomparisons occurring at P≤0.20.
RESULTSBetween-cohort comparisons in the humerus
For DFA of articular cartilage height, 75% of Sed individuals wereclassified correctly, while 50% of Ex individuals were classifiedcorrectly (Fig.3A). Using ANOVA (Table2), region 2 tended tohave a higher mean height in the Sed vs Ex group, with all otherregions tending to be similar between the two groups.
DFA for articular scaled cell counts had 100% of the membersof both loading cohorts classified correctly (Fig.3A,B). Based onANOVA, all regions tended to be similar among cohorts (Table2).
A DFA of articular cartilage cell area correctly classified 75%of the members of each loading cohort (Fig.3A). ANOVA indicatedthat means for all regions tended to be similar between the twogroups (Table2).
For physeal cartilage heights, in the peripheral regions, 100% ofSed individuals were classified correctly, whereas only 75% of Exindividuals were classified correctly. In the central regions, membersof both groups sorted equally well at 100% accuracy (Fig.3A). Thereserve zone region 1 tended to have a higher mean in the Ex group,while regions 3 and 4 tended to be similar between Sed and Exgroups (Table3). For the proliferative zone, the mean for region 4tended to be greater in the Ex group, with regions 1, 2 and 3 havingmeans similar between Sed and Ex cohorts. For the hypertrophiczone, all means tended to be similar in the two cohorts (Table3).
DFA for physeal scaled cell counts had 100% of all individualsin each group classified correctly for peripheral physeal regions andcentral physeal regions (Fig.3A,C). ANOVA showed that allreserve regions tended to be similar for the two groups (Table3).Proliferative zone regions 2 and 4 means tended to be greater in theSed group, while means for regions 1 and 3 were similar for thetwo cohorts. Hypertrophic zone regions all tended to be similarbetween treatment cohorts.
Physeal cell area DFA had 100% of the members in both loadingcohorts classified correctly for peripheral physeal regions (Fig.3A).In the central physeal regions, 75% of Sed individuals wereclassified correctly, whereas all Ex individuals sorted properly. Inthe reserve zone, ANOVA demonstrated that the mean for region4 tended to be greater for the Ex cohort, while the mean for region
A
BFig.2. Morphology of growth plate cartilage. (A)Thereserve, proliferative and hypertrophic zones.Oriented with the epiphyseal plate towards the topright corner of the image. (B)Characteristicmorphology of reserve cells (RZ), proliferative cells(PZ) and hypertrophic cells (HZ).
THE JOURNAL OF EXPERIMENTAL BIOLOGYTHE JOURNAL OF EXPERIMENTAL BIOLOGY

1476
1 was significantly higher in the Sed group (Table3). Regions 2and 3 were similar between groups. In the proliferative zone allregions were similar between cohorts. In the hypertrophic zone, themean for region 3 tended to be higher in the Sed cohort, and themeans for all other regions were similar in the two groups.
Within-cohort comparisons in the humerus and femurSedentary cohort
All cartilage heights were classified correctly via DFA for both limbelements (Fig.4A). Mean articular cartilage height was similar inall regions. ANOVA indicated that in the physeal cartilage, theproliferative zone mean tended to be higher in the femur, while thereserve and hypertrophic zones were roughly equal (Table4).
Combined articular and physeal scaled cell count DFA classified75% of the limb elements correctly (Fig.4A). Mean articular scaledcell counts tended to be higher in the femur (Table4). Physealregions exhibited similar means in the reserve and hypertrophic
K. A. Congdon, A. S. Hammond and M. J. Ravosa
zones, while the mean for the proliferative zone was similarbetween the two limbs (Table4).
All cell areas were classified correctly for both limb elements(Fig.4A,B). In all three physeal zones, the mean for the humerustended to be higher than the mean for the femur.
Exercised cohortCombined articular and physeal cartilage heights were classifiedcorrectly via DFA in 100% of both limb elements (Fig.5A).ANOVA demonstrated that mean articular cartilage height tendedto be similar in the humerus and femur (Table4). In the physealcartilage, the mean for the hypertrophic zone tended to be higherin the humerus, with the reserve and proliferative zone means beingsimilar between the two groups.
Scaled cell counts were classified correctly in 100% of the limbelements (Fig.5A). Mean articular cell counts tended to be greaterin the femur than in the humerus (Table4). While the reserve zone
40
50
60
70
80
90
100
AR height AR cellcount
AR cellarea
GP cellcount
GP cellarea
Variables
% C
orre
ct
Ex humeriSed humeri
GP height
A
Bi
Bii
Ci
Cii
Fig.3. Ex and Sed humeri DFA results. (A)Linegraph of the percentage correct for articular (AR)and physeal (GP) height, scaled cell count and cellarea. Physeal values for peripheral and centralregions have been averaged. (B)Examples of thearticular cell counts for humeri from sedentary(Sed, i) and exercised (Ex, ii) pigs. (C)Examples ofthe physeal cell counts for Sed (i) and Ex (ii)humeri. The growth plate is oriented towards thetop of the image.
THE JOURNAL OF EXPERIMENTAL BIOLOGYTHE JOURNAL OF EXPERIMENTAL BIOLOGY

1477Limb loading and joint plasticity
means were similar, means for the proliferative and hypertrophiczones tended to be higher in the femur than in the humerus.
Cell areas were classified correctly in 100% of both limbelements (Fig.5A). In all three zones, means for the humerus tendedto be higher than for the femur (Table4).
Comparisons of articular and physeal variables in thehumerus and femur
In Sed humeri, the correlation between articular and physeal cellcounts was not significant, exhibiting only a negative trend. Sedcorrelations for humerus cartilage heights and cell areas were notsignificant (Table5). None of the Ex correlations for humerus cellcounts, cartilage heights or cell areas were statistically significant(Table5).
In Sed femora, articular and physeal cell counts were significantlypositively correlated, whereas the correlation between cartilageheights was not significant (Table5). In Ex femora, the correlationbetween articular and physeal cell counts was not significant,showing only a positive trend (Table5). The Ex correlation for femurcartilage heights was not significant.
In the Sed cohort, the correlation between humeral and femoraltotal articular height was significantly negatively correlated. Therewere no significant correlations for total physeal height, articularor physeal cell count or physeal cell area between the humerus andfemur (Table6).
In the Ex cohort, the correlation between humeral and femoraltotal articular height was significantly negatively correlated. Therewere no significant correlations for total physeal height, articularor physeal cell count, or physeal cell area between the humerus andfemur (Table6).
DISCUSSIONChondral modeling theory predicts that growing joints subjected toelevated mechanical stresses exhibit an adaptive response, includingelevated chondrocyte mitosis and hypertrophy, which results inincreased cartilage formation and larger joints (Frost, 1979; Frost,1999; Hamrick, 1999; Murray et al., 2001; Carter and Wong, 2003;Plochocki et al., 2009). This hypothesis was investigated in twoways in a sample of growing pigs subjected to different loadingregimes: (1) the effects of exercise vs sedentary locomotion oncartilage plasticity in the proximal humerus; and (2) behavior-
controlled comparisons of cartilage histomorphometry between theproximal humerus and proximal femur. The former set ofcomparisons was performed between cohorts that differedpostnatally in both loading magnitude and loading frequency, whilethe latter suite of analyses contrasted groups that differed in loadingmagnitude.
The humerusWhen comparing humerus parameters across cohorts, differenceswere observed between the responses of articular vs physealcartilage to greater loading. The articular cartilage in the Ex groupwas characterized by greater cell proliferation, which is consistentwith the predictions of chondral modeling theory. However, a lackof correspondingly greater cartilage heights in the Ex groupindicates that there is not a corresponding increase in ECMproduction. In fact, such a result may even suggest a relativedecrease in the amount of ECM generated by articularchondrocytes under increased loading. This finding is opposite topredictions that greater loads will result in an increase in cartilageheight. There was also no associated increase in articular
Table 2. Univariate statistics (means ± s.d.) for articular cartilagevariables in Sed and Ex humeri
Sed (N4) Ex (N4)
Height (m)Region 1 713.54±129.36 637.32±116.84Region 2 632.19±63.75 547.62±101.751
Region 3 799.07±177.78 830.92±184.94Region 4 1118.80±197.16 910.24±121.42
Cell countRegion 1 0.24±0.09 0.18±0.12Region 2 0.21±0.01 0.27±0.04Region 3 0.20±0.01 0.23±0.03Region 4 0.19±0.02 0.19±0.01
Area (m2)Region 1 124.03±28.67 118.55±6.77Region 2 91.72±15.80 84.33±8.57Region 3 79.44±15.48 92.33±16.33Region 4 105.08±26.77 107.68±21.07
Sed, sedentary; Ex, exercised.Significantly different from Sed value: 1P<0.20.
Table 3. Univariate statistics (means ± s.d.) for physeal cartilagevariables in Sed and Ex humeri
Sed (N4) Ex (N4)
Height (m)RZ region 1 145.04±42.12 200.47±13.631
RZ region 2 107.90±17.71 147.07±10.92RZ region 3 190.46±42.02 157.88±9.55RZ region 4 185.59±39.83 298.99±81.82PZ region 1 147.19±53.05 135.52±50.82PZ region 2 133.67±33.08 179.40±32.51PZ region 3 135.25±13.58 136.78±25.59PZ region 4 125.30±40.48 168.87±48.621
HZ region 1 137.68±49.00 126.19±39.77HZ region 2 133.06±44.75 117.52±26.52HZ region 3 136.85±27.19 145.52±34.26HZ region 4 116.50±24.01 136.25±15.12
Scaled cell countRZ region 1 0.34±0.09 0.28±0.12RZ region 2 0.38±0.07 0.36±0.09RZ region 3 0.35±0.10 0.34±0.04RZ region 4 0.31±0.08 0.46±0.20PZ region 1 0.95±0.14 0.62±0.37PZ region 2 0.78±0.23 0.53±0.081
PZ region 3 0.81±0.12 0.80±0.16PZ region 4 1.09±0.30 0.72±0.181
HZ region 1 0.48±0.10 0.48±0.21HZ region 2 0.55±0.11 0.50±0.18HZ region 3 0.64±0.14 0.63±0.06HZ region 4 0.65±0.14 0.63±0.14
Cell area (m2)RZ region 1 124.88±19.47 76.06±11.462
RZ region 2 79.17±11.46 100.75±37.80RZ region 3 125.46±60.92 163.24±46.54RZ region 4 74.04±13.32 104.13±25.501
PZ region 1 70.71±15.81 86.71±41.40PZ region 2 69.67±13.60 85.00±35.45PZ region 3 71.05±11.76 78.85±24.18PZ region 4 62.81±15.22 80.28±27.46HZ region 1 291.71±87.29 342.00±72.64HZ region 2 271.85±62.40 260.86±43.89HZ region 3 291.89±30.07 262.05±21.271
HZ region 4 326.68±95.99 326.84±29.30
RZ, reserve zone; PZ, proliferative zone; Hz, hypertrophic zone.Significantly different from Sed value: 1P<0.20; 2P<0.05.
THE JOURNAL OF EXPERIMENTAL BIOLOGYTHE JOURNAL OF EXPERIMENTAL BIOLOGY

1478
chondrocyte size in the Ex group, which is also contrary topredictions of chondral modeling theory.
The physeal cartilage demonstrated the most differences inregional cartilage heights and scaled cell counts between cohorts,but the results were somewhat contradictory. While a greatercartilage height in the Ex group suggests elevated ECMproduction in accordance with predictions, the lack of an increasein scaled cell count is contrary to predictions that greatermechanical loading also results in increased chondrocyte mitosis.Moreover, mean cell area demonstrated notable regional variation.The significantly greater mean cell area in reserve zone region 1of the Sed group contradicts expectations that an increase inmechanical loading will result in greater cell area, and themajority of physeal cartilage regions across all three zones didnot show a tendency for a larger cell area in the Ex cohort. Asbone calcification and growth progresses, it is the hypertrophyof physeal chondrocytes that contributes most to this process
K. A. Congdon, A. S. Hammond and M. J. Ravosa
(Farnum et al., 2002). We would therefore expect an increase inthe cell area of hypertrophic zone chondrocytes in the Ex cohort,as this is the primary mechanism by which new (load-induced)bone occurs. However, this effect was not observed in thehypertrophic chondrocytes of Ex humeri.
When considering the traditional predictions of chondralmodeling theory, the articular and physeal cartilage showed differingresponses to mechanical loading. The articular cartilage was mostresponsive via greater cellularity without a corresponding increasein cartilage height, suggesting that articular cartilage responds toloading by greater chondrocyte mitosis without increasing ECMproduction. This runs counter to predictions that mechanical loadinginduces higher cartilage viscoelasticity via elevated ECMproduction. In contrast, physeal cartilage responded to loading withan increase in height and cell area in the relative absence of anincrease in cellularity, essentially producing an opposite signal tothat observed in articular cartilage.
40
50
60
70
80
90
100
Height Cell count Cell areaVariables
% C
orre
ct
Sed humeri
Sed femora
Bi Bii
A Fig.4. Sed humeri and femora DFAresults. (A)Line graph of thepercentage correct for cartilage height,cell count and cell area (both articularand physeal). Physeal values forperipheral and central regions havebeen averaged. (B)Examples of theproliferative zone cell areas for humeri(i) and femora (ii). The growth plate isoriented towards the bottom of theimage. Diagonal lines delineate aregion representative of theproliferative zone (PZ).
Table 4. Univariate statistics (means ± s.d.) for humeri and femora of Sed and Ex pigs
Sed Ex
Variable Humerus (N4) Femur (N4) Humerus (N3) Femur (N3)
Articular height (m) 756.94±59.55 678.07±45.58 671.99±100.07 725.11±105.43Articular cell count 0.21±0.03 0.25±0.021 0.21±0.01 0.23±0.0041
RZ height (m) 140.48±24.33 122.17±14.20 159.26±40.96 123.62±21.10PZ height (m) 128.32±33.18 179.43±33.841 162.69±17.77 178.84±8.85HZ height (m) 103.03±10.46 93.56±17.72 108.03±9.86 85.83±19.261
RZ cell count 0.34±0.05 0.32±0.05 0.35±0.10 0.33±0.03PZ cell count 0.91±0.09 0.76±0.19 0.65±0.14 0.73±0.062
HZ cell count 0.58±0.06 0.58±0.06 0.54±0.10 0.61±0.132
RZ cell area (m2) 95.22±22.62 48.50±11.222 116.73±37.50 41.69±7.802
PZ cell area (m2) 68.56±14.35 49.79±8.033 82.71±12.06 53.49±3.702
HZ cell area (m2) 295.76±42.95 208.99±33.602 297.93±29.27 180.71±14.942
Significantly different from corresponding humerus value: 1P<0.20; 2P<0.10; 3P<0.05.
THE JOURNAL OF EXPERIMENTAL BIOLOGYTHE JOURNAL OF EXPERIMENTAL BIOLOGY

1479Limb loading and joint plasticity
Other studies examining specific responses of cartilage tomechanical loading have yielded possible explanations for suchvariable responses, which in some cases also contradict thepredictions of chondral modeling. While the differences in articularand physeal responses found here could be the result of a depth-dependent chondrogenic response (Wu and Herzog, 2006) or achange in load magnitude as it is transmitted distally across the joint,it is also possible that this variation is simply a reflection of inherentbiological differences among articular and physeal cartilage.Specifically, articular and growth plate cartilage in pigs differ inboth the types and relative amounts of collagen present, and growthplate cartilage is known to contain less total collagen than articularcartilage (Wardale and Duance, 1993). In the absence of variationin other ECM components or cartilage proportions that also influencetissue mechanical properties, this would suggest that the growth plateis perhaps less viscoelastic than articular cartilage. Earlier work hasdemonstrated that different growth plate zones have different elasticmoduli, with the stiffness gradually increasing from the reserve zoneto the calcification zone (Rhadakrishnan et al., 2004). This impliesnot only that chondrocytes in different zones are experiencing theinduced load differentially but also that the unknown compressivestresses combined with the variable elastic modulus make it difficultto infer how individual zones experience a given load.
Prior research has also shown that p21, a cyclin-dependent kinaseinhibitor that plays an important role in the terminal differentiationof chondrocytes, is upregulated in chondrocytes undergoinghypertrophic differentiation (Stewart et al., 1997). It is possible thatthis cell-specific upregulation could be playing a role in the cellcount differences observed here, particularly in the hypertrophiczone of the growth plate, in which all regions were found to beequivalent among Sed and Ex humeri. In conjunction with thosefindings, certain growth factors are found to be more heavilyexpressed in the reserve zone of growth plate cartilage than thecomparable surface zone of articular cartilage (Yamane et al., 2007),
likely resulting in the widely acknowledged lack of proliferation ofarticular chondrocytes and potentially contributing to the higher cellcounts observed in the reserve and proliferative zones of the growthplate cartilage from this study.
It has previously been suggested that cyclic, highly compressiveloads can lead to fluid exudation in the superficial zone of articularcartilage (Carter and Wong, 2003). If this is occurring in the articularcartilage of Ex humeri, then it is possible that articular chondrocytesdid increase ECM production in response to loading, as predictedby the chondral modeling theory, but this increased productionsimply resulted in maintained articular cartilage size and shape soas to compensate for fluid lost in exudation. When consideringactivity levels insufficient to induce gross changes in joint size orshape, this kind of maintenance would be useful in maintaining jointintegrity in the face of increased loads. This could further complicatepaleontological reconstructions of locomotor behavior, as it mustbe accepted that the soft tissue of joints may have the ability tomitigate certain variations in activity level, preventing them frominfluencing the ultimate skeletal form. Alternatively, disparity incell counts in Ex vs Sed humeri also suggests a differential ECMresponse as opposed to cellularity, perhaps a load-induced changethat may augment tissue viscoelasticity via an increase in ECMvolume surrounding a chondrocyte (Eggli et al., 1988). This wouldresult in greater cartilage viscoelasticity without a necessary increasein height or cellularity, which could contribute positively to theability of cartilage to respond to elevated loading.
The larger relative cell area in some humerus articular regionsand physeal zones observed in response to mechanical loading maybe related to an increase in the number of cytoskeletal proteins (i.e.intermediate filaments) and glycogen within the chondrocytes, whichcontribute to cell structural integrity (Eggli et al., 1988; Benjaminand Ralphs, 1998). This interpretation is further supported by an invitro study that found remodeling of actin myofilaments in articularchondrocytes can be induced by both static and cyclic mechanical
40
50
60
70
80
90
100
Height Cell count Cell areaVariables
% C
orre
ct
Ex humeri
Ex femora
Bi Bii
A Fig.5. Ex humeri and femora DFAresults. (A)Line graph of thepercentage correct for cartilage height,cell count and cell area (both articularand physeal). (B)Examples of thehypertrophic zone heights for humeri (i)and femora (ii). The growth plate isoriented towards the bottom of theimage. Lines delineate a regionrepresentative of the hypertrophic zone(HZ).
THE JOURNAL OF EXPERIMENTAL BIOLOGYTHE JOURNAL OF EXPERIMENTAL BIOLOGY

1480
loads, and that this remodeling may reverse after time (Knight etal., 2006). Alternatively, it has been suggested that such a load-induced increase in area is a temporary swelling due to elevatedmatrix production within the cell, which would subside when loadingceases (Paukkonen et al., 1985). It is therefore worth noting that allEx pigs were exercised the day before they were killed, whilePaukkonen et al. (Paukkonen et al., 1985) make no predictionsregarding the duration of this temporary swelling.
Regional variation in cartilage responses may be explained byFrost’s predictions that areas of very high loading will show adecrease in variables relevant to chondral modeling, with an increasevisible in nearby areas of moderate loading (Frost, 1999). Withoutin vivo data or in silico estimates of forces distributed across thearticular surface of the pig humeral head, it is difficult to gauge thefunctional significance of regional variation in cartilage parameters.Interestingly, a recent study demonstrated the presence of regionaldifferences in articular chondrocyte responses to mechanical loading,suggesting the possibility that even under uniform loads differentcartilage regions may not respond uniformly (Bevill et al., 2009).As chondrocytes are particularly sensitive to the three-dimensionalmicroenvironment and differentiate in response to local signals(Lemare et al., 1998; Goldring, 2004a; Goldring, 2004b), theexpression of cartilage ECM elements likely exhibit regionalvariation due to subtle differences in loading patterns in distinctjoint regions (Bayliss et al., 1983; Nakano and Scott, 1989; Mowet al., 1990; Mizoguchi et al., 1996; Tanaka et al., 2000). It isunknown how velocity-related changes in limb posture affect loadorientation. However, as it is unlikely that loads are distributedevenly across the joint surface during walking or running, disparityin regional loads could also account for regional differencesobserved in this study.
Comparison with femurWithin-joint analyses
Overall, the articular cartilage appears to have a more uniformresponse to increased loading across joints than the physeal cartilage.When comparing the results of the within-humerus comparisonsmade here with those obtained previously for pig femora (Hammondet al., 2010), there is not a consistent signal for both articular andphyseal cartilage changes. The femur and humerus exhibited similarpatterns of increased chondrocyte mitosis in response to mechanicalloading for articular chondrocytes. The Ex femora, but not the Exhumeri, exhibited an increase in physeal cell proliferation, decreasedphyseal zone heights and decreased articular zone heights
A number of factors could contribute to the observed differencesbetween the humerus and femur. The growth plate may be moreresponsive to mechanical loading than the articular cartilageregardless of the location because it is the primary site of limbelongation. Thus, as a site of active chondrogenesis, the growth plate
K. A. Congdon, A. S. Hammond and M. J. Ravosa
has a greater potential for load-induced tissue plasticity than thearticular cartilage (Ravosa et al., 2008b). As the proximal humerusand femur fuse at different ages (Dyce, 2002), the differences inphyseal cartilage response could be attributable to the two jointsbeing at different stages of ossification. Previous work in diversevertebrates has also demonstrated that musculoskeletal plasticity isnot uniform across ontogeny, with reaction norms being greater inyounger organisms (Goldspink, 1970; Hinton and McNamara,1984; Meyer, 1987; Bouvier, 1988; Rubin et al., 1992; Ravosa etal., 2008b). For this reason, it is possible that individuals of eitheryounger or older ages subjected to the same experimental regimencould yield somewhat different results (Bertram and Swartz, 1991;Pearson and Lieberman, 2004; Hoverman and Relyea, 2007; Ravosaet al., 2008a; Ravosa et al., 2008b).
However, differential loading between the humerus and the femurcould be responsible for a number of the differences observedbetween these two elements. Previous studies have examineddifferences in ground reaction forces (GRFs) between the forelimband hindlimb in pigs, noting that substrate surface can significantlyimpact the magnitude of the vertical GRFs (Von Wachenfelt et al.,2009a; Von Wachenfelt et al., 2009b; Von Wachenfelt et al., 2010).As research cited above only examined the effects of walking, it isunknown how the GRF differential is affected by elevated loadsduring running, as is the case with this study. Alternatively, theeffects of mechanically loading limbs may be more individuallyvariable than predicted by chondral modeling theory.
Controlling for cohortAs previous work has demonstrated increased vertical GRFs in thedomestic pig forelimb compared with the hindlimb (Thorup et al.,2007; Von Wachenfelt et al., 2009a; Von Wachenfelt et al., 2009b;Von Wachenfelt et al., 2010), we should expect that humeralcartilages will demonstrate increased ECM production, chondrocytemitosis and hypertrophy compared with femoral cartilages. Thisstudy yielded conflicting results in this regard.
When considering articular chondrocyte mitosis and cartilageheight together, certain observations are noteworthy. In the articularcartilage, the similar heights of Sed humeri vs Sed femora and Exhumeri vs Ex femora combined with the lower cell counts suggestthat there may be an overall increase in ECM volume, much aspredicted by Eggli et al. (Eggli et al., 1988). Alternatively, this mayrelate more to the presence of routinely high loads and correspondingdecreases in chondrogenesis (cf. Frost, 1999). As loading frequencyis likely to be the same across limbs when exercise level isincreased, it is unlikely these findings are the result of a frequency-induced variation in loads between limbs.
The physeal cartilage demonstrated trends that varied amongcartilage zones. None of the zones exhibited a mean cell count thatwas greater in the humerus, and only the hypertrophic zone of Ex
Table 5. Correlations (r) between physeal and articular cartilagevariables within joints
Humerus Femur
Sed (N4) Ex (N4) Sed (N8) Ex (N6)
Height 0.42 0.66 0.33 0.14Cell count –0.801 –0.36 0.882 0.741
Cell area <0.01 0.72 NA NA
Significant correlation between physeal and articular values: 1P<0.20;2P<0.05.
NA, absence of cell area data in the femora prevented comparison.
Table 6. Correlations (r) of within-cohort humerus and femurarticular and physeal cartilage
Articular Physeal
Sed (N4) Ex (N3) Sed (N4) Ex (N3)
Height –0.961 0.991 –0.35 –0.43Cell count –0.33 0.32 0.08 0.53Cell area NA NA 0.72 –0.71
Significant correlation between humerus and femur values: 1P<0.05.NA, absence of articular cell area data in the femora prevented comparison.
THE JOURNAL OF EXPERIMENTAL BIOLOGYTHE JOURNAL OF EXPERIMENTAL BIOLOGY

1481Limb loading and joint plasticity
humeri exhibited a greater mean height. Contrary to predictions,the proliferative zone of Sed femora exhibited a greater meancartilage height than that of the Sed humeri. However, for both Sedand Ex humeri, all three zones exhibited a larger mean cell areathan their femoral counterparts. The similar cell counts inconjunction with the shorter zone height in the Sed humeri suggestadditional support for the role of ECM exudation during increasedloading (cf. Carter and Wong, 2003).
Overall, this further indicates that different physeal zones mayrespond differently to similar loading regimens. In this regard, Uekiet al. (Ueki et al., 2008) showed that mechanical loading of thegrowth plate of Wistar rats resulted in increased chondrocyteproliferation and matrix formation. For the current study, thissuggests that elevated mechanical loading could result in lowerscaled cell counts for the reserve and hypertrophic zones and highercounts for the proliferative zone, as the loading regimen increasesthe rate at which reserve zone cells enter the proliferative phase andhypertrophic cells become incorporated into the bony matrix of thelimb element. Work by Amini et al. found zonal differences inchondrocyte bulk strains, with greater strains recorded in theproliferative and hypertrophic chondrocytes, as well as a decreaseof the cell to matrix volume ratio following compression in thereserve and hypertrophic zones, coupled with an increase in theproliferative zone (Amini et al., 2010). This demonstrates furthersupport for possible alternative explanations for findings thatcontradict traditional chondral modeling theory.
The differences observed here in the within-joint comparisonsand within-cohort comparisons could also result from variability inloading parameters. In the case of the within-joint comparison, whereEx humeri were compared with Sed humeri, an increase in both themagnitude and frequency of loading could be contributing to ourresults, whereas within-cohort comparisons across joints are likelyaffected solely by loading magnitude. Previous work has attemptedto address the differential role of loading magnitude vs frequencyin cartilage growth and remodeling. Specifically, it has beensuggested that cyclic loads of moderate magnitude applied to an invitro mesenchymal sample result in the maintenance of chondrocyteviability and chondrogenesis (Pelaez et al., 2009). An in vitro studyof chick mesenchymal cells yielded results that implied bothmagnitude and frequency were integral to connective tissuedevelopment (Elder et al., 2001). Further in vitro research comparingthe effect of static vs dynamic loads demonstrated that, while staticloading leads to suppression of chondrocyte matrix metabolism,dynamic loads lead to matrix synthesis (Davisson et al., 2002). Anin vitro study of articular cartilage showed that high loads appliedwith moderate frequency can in fact lead to cartilage degradationand this may be a contributing factor in the onset of osteoarthritis(Thibault et al., 2002). These findings may account for the greateruniformity observed among behaviorally similar cohorts (i.e. Sedhumerus vs femur, Ex humerus vs femur). For example, all but one(Sed cell count) articular and physeal variables discriminate,respectively, Ex and Sed humeri from Ex and Sed femora with 100%accuracy, and all physeal zone cell areas follow the predicted trendof being larger in the more heavily loaded groups.
It should be noted that previous work (Stokes et al., 2002; Stokeset al., 2006; Stokes et al., 2007) has shown that prolongedcompression leads to a decrease in cartilage growth, while prolongeddistraction results in increased growth. However, the cyclic loadingexperienced by these study animals is distinctly different from staticloading in that the former includes periods of unloading. Cyclicloading of immature rat knees has been shown to result in the growthof physeal cartilage (Zhang et al., 2010); specifically, increased
height of proliferative and hypertrophic zones. While this findingfollows Frost’s predictions that moderate, cyclic loads result inchondrogenesis (Frost, 1999), in our study physeal cartilage heightincreases were largely restricted to the reserve zone. This couldsuggest variability in the response of cartilage from different joints.Indeed, a greater understanding of chondral modeling requiresadditional data on the singular roles of loading magnitude andloading frequency as well as how such factors interact to influencechondrogenesis.
By testing for an association between similar articular andphyseal variables, we were able to assess whether there are loading-specific patterns of covariation in cartilage parameters and whetherlow loading levels resulted in a decoupling of cartilage parameters.Interestingly, increased loading appears to influence the relationshipbetween articular and physeal values within joints. However, thisresponse does not appear to be uniform either between variables oracross joints. In the humerus, increased loading appears to increasethe likelihood of covariation between both articular and physealcartilage height and chondrocyte hypertrophy, but decreases thelikelihood of covaration between articular and physeal chondrocyteproliferation. Contrastingly, increased loading appears to decoupleboth height and cell proliferation in the femora. As cartilage heightis at least in part a byproduct of chondrocyte size and proliferation,it must be considered that the correlation between articular andphyseal height in both humeri and femora is being influenced bythe changes in the other two variables and ECM synthesis. Whilewe can assume that these two cartilage types are experiencing similarloading magnitudes by being located in the same region of the samelimb, this decoupling of chondrocyte proliferation in both thehumerus and femur could be an indication that there is a greaterdisparity in how the increased stress is experienced in the two typesof cartilage than when considering the lower loading levels andfrequency experienced by sedentary individuals. The general lackof a similar pattern for cartilage in the humerus and femur furtherreinforces the possibility that the effects of loading on joints mustbe considered individually for each skeletal element considered.
When considering the relationship between cartilage of the sametype across the two joints examined here, different patterns emerge.While we cannot assume that the loads being experienced byhomologous types of cartilage are uniform across joints, we can doso for loading frequency. Increased load frequency appears to havevery little effect on the relationship between articular cartilage inthe humerus and the femur. In the physeal cartilage, onlychondrocyte proliferation appears to be more closely linked betweenthe humerus and the femur by an increase in loading frequency.This could indicate that load magnitude is more influential than loadfrequency for both cartilage types. It could also suggest that bothcartilage sites are responding with relative uniformity to increasedloading frequency. Ultimately these comparisons indicate that thedifferential experience of load magnitude within joints is moredisruptive to the relationship between cartilage types than a changeof load frequency is to cartilage of the same type located in differentjoints.
CONCLUSIONChondral modeling theory posits a series of predictions regardingcartilage responses to elevated mechanical loads. These predictionsinclude an increase in chondrocyte mitosis, greater chondrocyte areaand an increase in ECM production. Ultimately, this should resultin thicker cartilage that better maintains joint integrity during routineloading. The aim of this study was to test these predictions bothwithin and across joints subjected to one of two loading regimens.
THE JOURNAL OF EXPERIMENTAL BIOLOGYTHE JOURNAL OF EXPERIMENTAL BIOLOGY

1482
Our results have several implications for evaluating chondralmodeling theory. In particular, it is apparent that articular andphyseal cartilage respond differently to mechanical loading duringdevelopment. This suggests that chondral modeling theory shouldaccount for cartilage type and function as well as the distinctlygrowth-related nature of physeal cartilage. Moreover, humeralarticular cartilage responded disparately to mechanical loading viagreater chondrocyte mitosis, while physeal cartilage exhibited anincrease in cartilage height and cell area. Additionally, increasedloading and load frequency may impact covariation patterns fordifferent cartilage types within joints as well as similar cartilagetypes across joints. These findings correspond favorably to priorwork on the proximal femur in pigs, where the physeal cartilagewas differentially responsive to elevated loading (Hammond et al.,2010).
There are several explanations for why these two cartilage typesexhibited different responses to similar loading regimes. It ispossible that chondral modeling may be subject to a threshold effect,with articular and physeal cartilage reaching a response thresholdat different force magnitudes. When examining more heavily loadedgroups, articular cartilage expressed increased cellularity withinhumeri, but decreased cellularity between Sed and Ex humeri andfemora, while the physeal cartilage exhibited greater heights withinhumeri and greater cell area when comparing Sed humeri withfemora and Ex humeri with femora. Alternatively, articular cartilagemay dissipate loads sufficiently after a period of altered loadingsuch that it no longer responds with increased chondral modeling,with forces transmitted to the physeal cartilage where the remainingadaptive changes are observed in the joint due in part to the growth-related nature of physeal cartilage. This latter explanation suggeststhat tissue location, both within and between cartilage types, is likelyto play a role in the adaptive nature of chondrogenesis.
There are also broader implications that should be considered.Previous work has shown that an exercise regimen implementedduring development can have a lifelong impact, increasing bonestrength and fatigue life (Warden et al., 2007). As is well known,elevated loading can also lead to increased modeling and remodelingof bone (e.g. Bouvier and Hylander, 1981; Lanyon and Rubin, 1985;Biewener et al., 1986). In the light of such evidence, studies thatexamine the chondral response to exercise should in turn considerthe long-term effects on bone. Such knowledge would benefit thosedisciplines that rely on an understanding of the plasticity responseof bone to activity and loading.
Additional explanations for responses observed herein ofcartilage to mechanical loading appear to contradict those ofchondral modeling theory. These findings suggest that there aremultiple solutions to the biological process whereby cartilageresponds to mechanical loading so as to optimize joint congruence,facilitate joint movement and minimize traumatic joint stresses.This implies that the specific predictions of chondral modelingtheory as to how cartilage achieves that goal may not hold underall circumstances. The fact that the intensity of the load, as wellas the type of cartilage and developmental stage of thechondrocytes could play a role in the response of cartilagesuggests that, at the very least, the predicted responses ofchondrocytes to loading should be regarded separately for articularvs physeal cartilage, different cartilage sites and zones, anddisparate anatomical joints. The complexity of this process mightbe more fully understood via an integrative analysis of cartilageresponses at the tissue, cellular, protein and molecular level.Investigations that characterize the cascade of chondrogenicevents during ontogeny as well as the local and global effects of
K. A. Congdon, A. S. Hammond and M. J. Ravosa
stresses on joint formation will undoubtedly increase ourknowledge of the mechanobiology of connective tissues. Futureresearch should also pursue integrative analysis of multiple jointsand multiple joint regions in the same individuals, and recorddata not only on chondral changes but also on the specific loadsexperienced at each site. Clearly, there are extrinsic and intrinsicinfluences on regional and local variation in chondrogenic stimuli.Coupled with the fact that there are strain-mediated, site-specificosteogenic thresholds throughout the skeleton (Goodship et al.,1979; Rawlinson et al., 1995; Hylander and Johnson, 1997;Ravosa et al., 2010), this suggests it is highly likely that a similarscenario applies to both hard and soft connective tissues.
ACKNOWLEDGEMENTSMany thanks to Harold Laughlinʼs lab, particularly David Harah for access tospecimens, Bobby Colley for access to laboratory machinery, and the Universityof Missouri Veterinary Medical Diagnostic Laboratory for histological preparations.We also thank Carol Ward, Erin Franks, Casey Holliday, Mike Plavcan, GregBlomquist, Andy Biewener and two anonymous reviewers for valuable feedback.
FUNDINGK.A.C. and A.S.H. are supported by Life Sciences Fellowships from the Universityof Missouri. This study was partly funded by the National Institutes of Health [grantno. PO1-HL52490 to H. Laughlin]. Deposited in PMC for release after 12 months.
REFERENCESAmini, S., Veilleux, D. and Villemure, I. (2010). Tissue and cellular morphological
changes in growth plate explants under compression. J. Biomech. 43, 2582-2588.Bayliss, M. T., Venn, M., Maroudas, A. and Ali, S. Y. (1983). Structure of
proteoglycans from different layers of human articular cartilage. Biochem. J. 209,387-400.
Benjamin, M. and Ralphs, R. J. (1998). Fibrocartilage in tendons and ligaments – anadaptation to compressive load. J. Anat. 193, 481-494.
Bertram, J. E. and Swartz, S. M. (1991). The law of bone transformation: a case ofcrying Wolff? Biol. Rev. Camb. Philos. Soc. 66, 245-273.
Bevill, S. L., Briant, P. L., Levenston, M. E. and Andriacchi, T. P. (2009). Centraland peripheral region tibial plateau chondrocytes respond differently to in vitrodynamic compression. Osteoarth. Cartil. 17, 980-987.
Biewener, A. A., Swartz, S. M. and Bertram, J. E. A. (1986). Bone modeling duringgrowth: dynamic strain equilibrium in the chick tibiotarsus. Calcif. Tissue Int. 39, 390-395.
Bouvier, M. (1988). Effects of age on the ability of the rat temporomandibular joint torespond to changing functional demands. J. Dent. Res. 67, 1206-1212.
Bouvier, M. and Hylander, W. L. (1981). Effect of bone strain on cortical bonestructure in macaques (Macaca mulatta). J. Morphol. 167, 1-12.
Carter, D. R. and Wong, M. (2003). Modelling cartilage mechanobiology. Philos.Trans. Biol. Sci. 358, 1461-1471.
Carvalho, R. S., Yen, E. H. and Suga, D. M. (1995). Glycosaminoglycan synthesis inthe rat articular disc in response to mechanical stress. Am. J. Orthod. DentofacialOrthop. 107, 401-410.
Davisson, T., Kunig, S., Chen, A., Sah, R. and Ratcliffe, A. (2002). Static anddynamic compression modulate matrix metabolism in tissue engineered cartilage. J.Orthop. Res. 20, 842-848.
Dy, P., Smits, P., Silvester, A., Penzo-Mendez, A., Dumitriu, B., Han, Y., de laMotte, C. A., Kingsley, D. M. and Lefebvre, V. (2010). Synovial jointmorphogenesis requires the chondrogenic action of Sox5 and Sox6 in growth plateand articular cartilage. Dev. Biol. 340, 346-359.
Dyce, K. M., Sack, W. O. and Wensing, C. J. G. (2002). Textbook of VeterinaryAnatomy. Philadelphia: Saunders/Elsevier.
Eggli, P. S., Hunziker, E. B. and Schenk, R. K. (1988). Quantitation of structuralfeatures characterizing weight-and less-weight-bearing regions in articular cartilage:a stereological analysis of medial femoral condyles in young adult rabbits. Anat. Rec.222, 217-227.
Elder, S. H., Goldstein, S. A., Kimura, J. H., Soslowsky, L. J. and Spengler, D. M.(2001). Chondrocyte differentiation is modulated by frequency and duration of cycliccompressive loading. Ann. Biomed. Eng. 29, 476-482.
Farnum, C. E., Lee, R., OʼHara, K. and Urban, J. P. G. (2002). Volume increase ingrowth plate chondrocytes during hypertrophy: the contribution of organic osmolytes.Bone 30, 574-581.
Frost, H. M. (1979). A chondral modeling theory. Calcif. Tissue Int. 28, 181-200.Frost, H. M. (1999). Joint anatomy, design and arthroses: insights of the Utah
paradigm. Anat. Rec. 255, 162-174.Goldring, M. B. (2004a). Human chondrocyte cultures as models of cartilage-specific
gene regulation. In Methods in Molecular Medicine: Human Cell Culture Protocols,2nd edn (ed. J. Picot), pp. 69-96. Totowa, NJ: Humana Press.
Goldring, M. B. (2004b). Immortalization of human articular chondrocytes forgeneration of stable, differentiated cell lines. In Methods in Molecular Medicine:Cartilage and Osteoarthritis, Vol. 1, Cellular and Molecular Tools (ed. M. Sabatini, P.Pastoureau and F. de Ceuninck), pp. 23-36. Totowa, NJ: Humana Press.
THE JOURNAL OF EXPERIMENTAL BIOLOGYTHE JOURNAL OF EXPERIMENTAL BIOLOGY
1483Limb loading and joint plasticity
Goldspink, G. (1970). Morphological adaptation due to growth and activity. InPhysiology and Biochemistry of Muscle as a Food (ed. E. J. Briskey, R. G. Cassensand B. B. Marsh), pp. 521-536. Madison, WI: University of Wisconsin Press.
Goodship, A. E., Lanyon, L. E. and McFie, H. (1979). Functional adaptation of boneto increased stress. An experimental study. J. Bone Joint Surg. 61, 539-546.
Gregory, K. E., Keene, D. R., Tufa, S. F., Lunstrom, G. P. and Morris, N. P. (2001).Developmental distribution of collagen type XII in cartilage: association with articularcartilage and the growth plate. J. Bone Miner. Res. 16, 2005-2016.
Grodzinsky, A. J., Levenston, M. E., Jin, M. and Frank, E. H. (2000). Cartilagetissue remodeling in response to mechanical forces. Ann. Rev. Biomed. Eng. 2, 691-713.
Hammond, A. S., Ning, J., Ward, C. V. and Ravosa, M. J. (2010). Mammalian limbloading and chondral modeling during ontogeny. Anat. Rec. 293, 658-670.
Hamrick, M. W. (1999). A chondral modeling theory revisited. J. Theor. Biol. 201, 201-208.
Hinton, R. J. and McNamara, J. A. (1984). Effect of age on the adaptive response ofthe adult temporomandibular joint. A study of induced protrusion in Macaca mulatta.Angle Orthod. 54, 154-162.
Hoverman, J. T. and Relyea, R. A. (2007). How flexible is phenotypic plasticity?Developmental windows for trait induction and reversal. Ecology 88, 693-705.
Hyde, G., Dover, S., Aszodi, A., Wallis, G. A. and Boot-Handford, R. P. (2007).Lineage tracing using matrilin-1 gene expression reveals that articular chondrocytesexist as the joint interzone forms. Dev. Biol. 304, 825-833.
Hylander, W. L. and Johnson, K. R. (1997). In vivo bone strain patterns in thezygomatic arch of macaques and the significance of these patterns for functionalinterpretations of craniofacial form. Am. J. Phys. Anthropol. 102, 203-232.
Irie, T., Aizawa, T. and Kokubun, S. (2005). The role of sex hormones in the kineticsof chondrocytes in the growth plate. J. Bone Joint Surg. Br. 87, 1278-1284.
Kiviranta, I., Tammi, M., Jurvelin, J., Saamanen, A. M. and Helminen, H. J. (1988).Moderate running exercise augments glycosaminoglycans and thickness of articularcartilage in the knee joint of young beagle dogs. J. Orthop. Res. 6, 188-195.
Knight, M. M., Toyoda, T., Lee, D. A. and Bader, D. L. (2006). Mechanicalcompression and hydrostatic pressure induce reversible changes in actincytoskeletal organisation in chondrocytes in agarose. J. Biomech. 39, 1547-1551.
Lanyon, L. E. and Rubin, C. T. (1985). Functional adaptation in skeletal structures. InFunctional Vertebrate Morphology (ed. M. Hildebrand, D. M. Bramble, K. F. Liemand D. B. Wake), pp. 1-25. Cambridge: Harvard.
Lemare, F., Steimberg, N., Le Griel, C., Demignot, S. and Adolphe, M. (1998).Dedifferentiated chondrocytes cultured in alginate beads: restoration of thedifferentiated phenotype and of the metabolic responses to interleukin-1. J. Cell.Physiol. 176, 303-313.
Liu, J., Sekiya, I., Asai, K., Tada, T., Kato, T. and Matsui, N. (2001). Biosyntheticresponse of cultured articular chondrocytes to mechanical vibration. Res. Exp. Med.200, 183-193.
Meyer, A. (1987). Phenotypic plasticity and heterochrony in Cichlasoma managuense(Pisces, Cichlidae) and their implications for speciation in cichlid fishes. Evolution 41,1357-1369.
Mizoguchi, I., Takahashi, I., Nakamura, M., Sasano, Y., Sato, S., Kagayama, M.and Mitani, H. (1996). An immunohistochemical study of regional differences in thedistribution of type I and type II collagens in rat mandibular condylar cartilage. Arch.Oral Biol. 41, 863-869.
Mow, V. C., Fithian, D. C. and Keely, M. A. (1990). Fundamentals of articularcartilage and meniscus biomechanics. In Articular Cartilage and Knee Joint Function(ed. J. W. Ewing), pp. 1-18. New York: Raven Press.
Murray, R. C., Vedi, S., Birch, H. L., Lakhani, K. H. and Goodship, A. E. (2001).Subchondral bone thickness, hardness and remodeling are influenced by short-termexercise in a site specific manner. J. Orthop. Res. 19, 1035-1042.
Nakano, T. and Scott, P. G. (1989). A quantitative chemical study ofglycosaminoglycans in the articular disc of bovine temporomandibular joint. Arch.Oral Biol. 34, 749-757.
Niehoff, A., Kersting, U. G., Zaucke, F., Morlock, M. M. and Bruggemann, G.(2004). Adaptation of mechanical, morphological and biochemical properties of therat growth plate to dose-dependent voluntary exercise. Bone 35, 899-908.
Paukkonen, K., Selkäinaho, K., Jurvelin, J., Kiviranta, I. and Helminen, H. J.(1985). Cells and nuclei of articular cartilage chondrocytes in young rabbits enlargedafter non-strenuous physical exercise. J. Anat. 142, 13-20.
Pearson, O. M. and Lieberman, D. E. (2004). The aging of Wolffʼs ʻLawʼ: ontogenyand responses to mechanical loading in cortical bone. Am. J. Phys. Anthropol. 125,63-99.
Pelaez, D., Huang, C. H. and Cheung, H. S. (2009). Cyclic compression maintainsviability and induces chondrogenesis of human mesenchymal stem cells in fibrin gelscaffolds. Stem Cells Dev. 18, 93-102.
Plochocki, J. H., Ward, C. V. and Smith, D. E. (2009). Evaluation of the chondralmodeling theory using fe-simulation and numeric shape optimization. J. Anat. 214,768-777.
Radhakrishnan, P., Lewis, N. T. and Mao, J. J. (2004). Zone-specificmicromechanical properties of the extracellular matrices of growth plate cartilage.Ann. Biomed. Eng. 32, 284-291.
Ravosa, M. J., Kunwar, R., Stock, S. R. and Stack, M. S. (2007). Pushing the limit:masticatory stress and adaptive plasticity in mammalian craniomandibular joints. J.Exp. Biol. 210, 628-641.
Ravosa, M. J., López, E. K., Menegaz, R. A., Stock, S. R., Stack, M. S. andHamrick, M. W. (2008a). Using ʻMighty Mouseʼ to understand masticatory plasticity:myostatin-deficient mice and musculoskeletal function. Integr. Comp. Biol. 48, 345-359.
Ravosa, M. J., López, E. K., Menegaz, R. A., Stock, S. R., Stack, M. S. andHamrick, M. W. (2008b). Adaptive plasticity in the mammalian masticatory complex:you are what, and how, you eat. In Primate Craniofacial Biology and Function (ed.C. J. Vinyard, M. J. Ravosa and C. E. Wall), pp. 293-328. New York: SpringerAcademic Publishers.
Ravosa, M. J., Ross, C. F., Williams, S. H. and Costley, D. B. (2010). Allometry ofmasticatory loading parameters in mammals. Anat. Rec. 293A, 557-571.
Rawlinson, S. C. F., Mosley, J. R., Suswillo, R. F. L., Pitsillides, A. A. and Lanyon,L. E. (1995). Calvarial and limb bone cells in organ and monolayer culture do notshow the same early responses to dynamic mechanical strain. J. Bone Miner. Res.10, 1225-1232.
Rubin, C. T., Bain, S. D. and McLeod, K. J. (1992). Suppression of the osteogenicresponse in the aging skeleton. Calcif. Tissue Int. 50, 306-313.
Stempel, J., Fritsch, H., Pfaller, K. and Blumer, M. J. F. (2011). Development ofarticular cartilage and the metaphyseal growth plate: the localization of TRAP cells,VEGF, and endostatin. J. Anat. 218, 608-618.
Stewart, M. C., Farnum, C. E. and MacLeod, J. N. (1997). Expression of p21CIP1/WAF1
in chondrocytes. Calcif. Tissue Int. 61, 199-204.Stokes, I. A., Mente, P. L., Iatridis, J. C., Farnum, C. E. and Aronsson, D. D.
(2002). Enlargement of growth plate chondrocytes modulated by sustainedmechanical loading. J. Bone Joint Surg. Am. 84, 1842-1848.
Stokes, I. A. F., Aronsson, D. D., Dimock, A. N., Cortright, V. and Beck, S. (2006).Endochondral growth in growth plates of three species at two anatomical locationsmodulated by mechanical compression and tension. J. Orthop. Res. 24, 1327-1334.
Stokes, I. A. F., Clark, K. C., Farnum, C. E. and Aronsson, D. D. (2007). Alterationsin the growth plate associated with growth modulation by sustained compression ordistraction. Bone 41, 197-205.
Tanaka, A., Kawashiri, S., Kumagai, S., Takatsuka, S., Narinobou, M., Nakagawa,K. and Tanaka, S. (2000). Expression of matrix metalloproteinase-2 in osteoarthriticfibrocartilage from human mandibular condyle. J. Oral Pathol. Med. 29, 314-320.
Thibault, M., Poole, A. R. and Buschmann, D. (2002). Cyclic compression ofcartilage/bone explants in vitro leads to physical weakening, mechanical breakdownof collagen and release of matrix fragments. J. Orthop. Res. 20, 1265-1273.
Thorup, V. M., Togersen, F. A., Jorgensen, B. and Jensen, B. R. (2007).Biomechanical gait analysis of pigs walking on solid concrete floor. Animal 1, 708-715.
Ueki, M., Tanaka, N., Tanimoto, K., Nishio, C., Honda, K., Lin, Y.-Y., Tanne, Y.,Ohkuma, S., Kamiya, T., Tanaka, E. et al. (2008). The effect of mechanical loadingon the metabolism of growth plate chondrocytes. Ann. Biomed. Eng. 36, 793-800.
Von Wachenfelt, H., Pinzke, S. and Nilsson, C. J. (2009a). Gait and force analysisof provoked pig gait on clean and fouled concrete surfaces. Biosys. Eng. 104, 534-544.
Von Wachenfelt, H., Pinzke, S., Nilsson, C. J., Olsson, O. and Ehlorsson, C. J.(2009b). Force analysis of unprovoked pig gait on clean and fouled concretesurfaces. Biosys. Eng. 104, 250-257.
Von Wachenfelt, H., Nilsson, C. J. and Pinzke, S. (2010). Gait and force analysis ofprovoked pig gait on clean and fouled rubber mat surfaces. Biosys. Eng. 106, 86-96.
Wardale, J. R. and Duance, V. C. (1993). Quantification and immunolocalisation ofporcine articular and growth plate cartilage collagens. J. Cell Sci. 105, 975-984.
Wardale, J. R. and Duance, V. C. (1994). Characterisation of articular growth platecartilage collagens in porcine osteochondrosis. J. Cell Sci. 107, 47-59.
Warden, S. J., Fuchs, R. K., Castillo, A. B., Nelson, I. R. and Turner, C. H. (2007).Exercise when young provides lifelong benefits to bone structure and strength. J.Bone Miner. Res. 22, 251-249.
Wong, M. and Carter, D. R. (2003). Articular cartilage functional histomorphology andmechanobiology: a research perspective. Bone 33, 1-13.
Wu, J. Z. and Herzog, W. (2006). Analysis of the mechanical behavior ofchondrocytes in unconfined compression tests for cyclic loading. J. Biomech. 39,603-616.
Wu, Q. and Chen, Q. (2000). Mechanoregulation of chondrocyte proliferation,maturation, and hypertrophy: ion-channel dependent transduction of matrixdeformation signals. Exp. Cell Res. 256, 383-391.
Yamane, S., Cheng, E. and You, Z. (2007). Gene expression profiling of mousearticular and growth plate cartilage. Tissue Eng. 13, 2163-2173.
Zhang, P., Hamamura, K., Turner, C. H. and Yokota, H. (2010). Lengthening ofmouse hindlimbs with joint loading. J. Bone Miner. Metab. 28, 268-275.
THE JOURNAL OF EXPERIMENTAL BIOLOGYTHE JOURNAL OF EXPERIMENTAL BIOLOGY