Reproductive isolation between chromosomal races of the house mouse Mus musculus domesticus in a...
12
Reproductive isolation between chromosomal races of the house mouse Mus musculus domesticus in a parapatric contact area revealed by an analysis of multiple unlinked loci P. FRANCHINI, R. CASTIGLIA & E. CAPANNA Dipartimento di Biologia Animale e dell’Uomo, University of Rome ‘‘La Sapienza’’, Rome, Italy Introduction Several authors have stressed the importance of chro- mosomal rearrangements [e.g. Robertsonian (Rb) fusions and fissions, translocations and inversions] in speciation (White, 1978; King, 1993). In the western house mouse, Mus musculus domesticus, the repeated occurrence and rapid fixation of Rb fusions have led to the formation of several chromosomal races, providing an excellent model to investigate this process (Sage et al., 1993). Fusion between different telocentric chromosomes and, more rarely, whole-arm reciprocal translocations (WARTs) have produced 97 populations with distinct combinations of metacentrics, with a diploid number reduced to 2n = 22 from the standard 2n = 40 typical of the species (Capanna, 1982; Pia ´lek et al., 2005). The rearranged races are scattered within the distribution area of M. m. domesticus, i.e. western Europe and North Africa. Since the discovery of the first race in the Swiss-Italian Alps (Gropp et al., 1969), several studies have been carried out on the house mouse, with particular attention Correspondence: Paolo Franchini, Dipartimento di Biologia Animale e dell’Uomo, University of Rome ‘‘La Sapienza’’, Via A. Borelli 50, 00161 Rome, Italy. Tel.: +39 06 4991 8022; fax: +39 06 4457516; e-mail: [email protected] ª 2008 THE AUTHORS. J. EVOL. BIOL. 21 (2008) 502–513 502 JOURNAL COMPILATION ª 2008 EUROPEAN SOCIETY FOR EVOLUTIONARY BIOLOGY Keywords: chromosomal races; gene flow; house mouse; hybrid zone; microsatellite; reproductive isolation. Abstract The house mouse, Mus musculus domesticus, exhibits a high level of chromo- somal polymorphism because of the occurrence and fast fixation of Robert- sonian fusions between telocentric chromosomes. For this reason, it has been considered a classical speciation model to analyse the role of the chromosomal changes in reproductive isolation. In this study, we analysed a parapatric contact area between two metacentric races in central Italy, the Cittaducale race (CD: 2n = 22) and the Ancarano race (ACR: 2n = 24), to estimate gene flow at the boundary. Hybrids between these two races show high levels of structural heterozygosity and are expected to be highly infertile. A sample of 88 mice from 14 sites was used. The mice were genotyped by means of eight microsatellite loci mapped in four different autosomal arms. The results show clear genetic differentiation between the CD and ACR races, as revealed by differences in allele frequencies, factorial correspondence analysis and indexes of genetic population (e.g. F ST and R ST ) along the contact zone. The genetic differentiation between the races was further highlighted by assignation and clustering analyses, in which all the individuals were correctly assigned by their genotypes to the source chromosomal race. This result is particularly interesting in view of the absence of any geographical or ecological barrier in the parapatric contact zone, which occurs within a village. In these conditions, the observed genetic separation suggests an absence of gene flow between the races. The CD–ACR contact area is a rare example of a final stage of speciation between chromosomal races of rodents because of their chromosomal incompatibility. doi: 10.1111/j.1420-9101.2007.01492.x
Transcript of Reproductive isolation between chromosomal races of the house mouse Mus musculus domesticus in a...
Reproductive isolation between chromosomal races of the housemouse Mus musculus domesticus in a parapatric contact arearevealed by an analysis of multiple unlinked loci
P. FRANCHINI, R. CASTIGLIA & E. CAPANNA
Dipartimento di Biologia Animale e dell’Uomo, University of Rome ‘‘La Sapienza’’, Rome, Italy
Introduction
Several authors have stressed the importance of chro-
mosomal rearrangements [e.g. Robertsonian (Rb) fusions
and fissions, translocations and inversions] in speciation
(White, 1978; King, 1993).
In the western house mouse, Mus musculus domesticus,
the repeated occurrence and rapid fixation of Rb fusions
have led to the formation of several chromosomal races,
providing an excellent model to investigate this process
(Sage et al., 1993).
Fusion between different telocentric chromosomes
and, more rarely, whole-arm reciprocal translocations
(WARTs) have produced 97 populations with distinct
combinations of metacentrics, with a diploid number
reduced to 2n = 22 from the standard 2n = 40 typical of
the species (Capanna, 1982; Pialek et al., 2005). The
rearranged races are scattered within the distribution
area of M. m. domesticus, i.e. western Europe and North
Africa.
Since the discovery of the first race in the Swiss-Italian
Alps (Gropp et al., 1969), several studies have been
carried out on the house mouse, with particular attention
Correspondence: Paolo Franchini, Dipartimento di Biologia Animale e
dell’Uomo, University of Rome ‘‘La Sapienza’’, Via A. Borelli 50, 00161
Rome, Italy.
Tel.: +39 06 4991 8022; fax: +39 06 4457516;
e-mail: [email protected]
ª 2 0 0 8 T H E A U T H O R S . J . E V O L . B I O L . 2 1 ( 2 0 0 8 ) 5 0 2 – 5 1 3
502 J O U R N A L C O M P I L A T I O N ª 2 0 0 8 E U R O P E A N S O C I E T Y F O R E V O L U T I O N A R Y B I O L O G Y
Keywords:
chromosomal races;
gene flow;
house mouse;
hybrid zone;
microsatellite;
reproductive isolation.
Abstract
The house mouse, Mus musculus domesticus, exhibits a high level of chromo-
somal polymorphism because of the occurrence and fast fixation of Robert-
sonian fusions between telocentric chromosomes. For this reason, it has been
considered a classical speciation model to analyse the role of the chromosomal
changes in reproductive isolation. In this study, we analysed a parapatric
contact area between two metacentric races in central Italy, the Cittaducale
race (CD: 2n = 22) and the Ancarano race (ACR: 2n = 24), to estimate gene
flow at the boundary. Hybrids between these two races show high levels of
structural heterozygosity and are expected to be highly infertile. A sample of
88 mice from 14 sites was used. The mice were genotyped by means of eight
microsatellite loci mapped in four different autosomal arms. The results show
clear genetic differentiation between the CD and ACR races, as revealed by
differences in allele frequencies, factorial correspondence analysis and indexes
of genetic population (e.g. FST and RST) along the contact zone. The genetic
differentiation between the races was further highlighted by assignation and
clustering analyses, in which all the individuals were correctly assigned by
their genotypes to the source chromosomal race. This result is particularly
interesting in view of the absence of any geographical or ecological barrier in
the parapatric contact zone, which occurs within a village. In these conditions,
the observed genetic separation suggests an absence of gene flow between the
races. The CD–ACR contact area is a rare example of a final stage of speciation
between chromosomal races of rodents because of their chromosomal
incompatibility.
doi: 10.1111/j.1420-9101.2007.01492.x
to the contact zones between Rb races and between Rb
races and surrounding standard populations (Castiglia &
Capanna, 1999a; Britton-Davidian et al., 2000). These
zones represent a perfect model to study ongoing
chromosomal speciation, based on the evidence that
structural heterozygosity plays a significant role in
the reduction of fitness of hybrid individuals (Redi &
Capanna, 1988; Hauffe & Searle, 1998; Castiglia &
Capanna, 2000). In this situation, gene exchange should
be reduced and the barriers to gene flow should depend
on the karyotype compatibility of the races involved.
Furthermore, gene flow can be influenced by chiasma
repatterning, leading to recombination suppression of
pericentromeric zones of hybrids in structural heteroz-
ygosis (Bidau et al., 2001; Castiglia & Capanna, 2002;
Panithanarak et al., 2004).
Many studies have indirectly investigated gene flow
through hybrid fertility. However, with the diffusion of
molecular techniques, mitochondrial and nuclear DNA
are now the best tools to estimate the amount of gene
exchange between taxonomical units. Recent studies
(Dallas et al., 1998; Panithanarak et al., 2004) have
shown that microsatellites, i.e. nuclear markers charac-
terized by a high mutation rate, are an ideal instrument
to genetically compare the Rb races of this house mouse
subspecies, which presumably have appeared in the last
10 000–3000 years (Auffray et al., 1990; Cucchi et al.,
2005).
In this study, we used microsatellite loci to analyse a
well-known contact area between two metacentric races
in central Italy, the Cittaducale race (CD: 2n = 22) and
the Ancarano race (ACR: 2n = 24). Background studies
of this area were based on cytogenetics (Castiglia &
Capanna, 1999b), mtDNA control region analysis
(Castiglia et al., 2002) and behavioural experiments
(Carpineti & Castiglia, 2004). The CD and ACR races,
which share no metacentrics, represent an extreme case
of diversification between karyotypes in Mus: the CD
karyotype is characterized by the Rb chromosomes 1.7,
2.18, 3.8, 4.15, 5.17, 6.13, 9.16, 10.11, 12.14 (where the
nomenclature ‘x.x’ indicates the telocentric chromo-
somes involved in the centric fusion) and the telocentric
19; the ACR karyotype is characterized by the Rb 1.2, 3.9,
4.17, 5.13, 6.16, 8.14, 10.12, 11.15 and the telocentrics 7,
18, 19 (Fig. 1). These karyotypes lead to the formation in
first generation hybrids of a long multivalent ring of 14
metacentrics and a shorter chain of five chromosomes
(Castiglia & Capanna, 1999b).
A preliminary study based on electron microscopic
observation of the testes suggested the sterility of F1
males (Malorni et al., 1982), although the low number of
animals analysed is inadequate to definitively confirm
this event. In fact, the sterility of some hybrid males may
be detected among a larger sample of fertile ones, as
revealed by Chatti et al. (2005) in a hybrid zone in
Tunisia. Furthermore, the female fertility has not yet
been analysed.
Previous cytogenetic characterization of the present
sample revealed the parapatric distribution of the two
karyotypes, except for the occurrence of one hybrid with
an ACR chromosomal background presenting two differ-
ent metacentrics (Castiglia & Capanna, 1999b): one typical
of the CD race (6.13) and one arising by WART (5.16).
Analysis of the mtDNA control region clearly showed the
genetic differentiation of the two races, with the near
absence of shared haplotypes (Castiglia et al., 2002).
The current situation suggests reduced gene flow
between the chromosomal races, although sporadic
hybridization events observed prevent us from establish-
ing the precise strength of the barrier to gene exchange.
At present, there are limitations to the estimation of
gene flow by mtDNA analysis and by cytogenetic
comparisons, because of certain features and mecha-
nisms of these methods. The mtDNA-based techniques
only investigate the maternal lineages and the mutation
rate of mitochondrial markers is slow compared with the
extremely rapid raciation process of M. m. domesticus.
Moreover, trying to detect a hybridization event by
cytogenetic analysis alone could lead to underestimation
of the effective gene exchange. In fact, segregation
events occurring during the meiosis of F1 hybrids may
separate the chromosomes involved in the ring and
in the chain, leading to the formation of gametes
bearing the parental karyotypes. These events can
restore parental karyotypes even in the first backcross
generation.
The aim of this study was to obtain an accurate
estimate of the gene flow between the ACR and CD races
through microsatellite analysis. The karyotype incom-
patibility is a good reason to assume a reduction but not
complete absence of gene flow between the races. In
another well-known Rb system, i.e. Sorex araneus, An-
dersson et al. (2004) and Basset et al. (2006) used
microsatellites to show the occurrence of gene flow
despite the high level of structural heterozygosity in the
F1 hybrids. Therefore, the mechanisms supporting gene
flow in such chromosomal hybrid zones must still be
fully clarified.
This case-study deals with a key issue in the chromo-
somal speciation of M. m. domesticus.
Materials and methods
Sampling and molecular methods
Eighty-eight mice were collected between June 1998 and
March 2000 from 14 localities along the Aterno River, in
an Apennine valley in central Italy (Fig. 2). According to
the karyotype analysis performed during the sampling
period, the specimens were assigned to the CD or ACR
chromosomal race (Castiglia et al., 2002). As the two
races exhibit parapatric contact, only CD or ACR spec-
imens were found in each locality. In some analyses, the
individuals of several sample sites were grouped together
Contact area between chromosomal races 503
ª 2 0 0 8 T H E A U T H O R S . J . E V O L . B I O L . 2 1 ( 2 0 0 8 ) 5 0 2 – 5 1 3
J O U R N A L C O M P I L A T I O N ª 2 0 0 8 E U R O P E A N S O C I E T Y F O R E V O L U T I O N A R Y B I O L O G Y
to increase the population size for the microsatellite
analysis (Table 1, Fig. 2). Groupings were made on the
basis of proximity and habitat continuity. We refer to
these groups of sites as ‘populations’ throughout the
paper. Genetic analyses were performed on six popula-
tions, four with the ACR karyotype (CAP, CAS, MAR and
PizACR) and two with the CD karyotype (PizCD and
SVT) (Table 1, Fig. 2). The mice were trapped using
Sherman live traps (H.B. Sherman Traps, Inc., Tallahas-
see, FL, USA) and tissue samples were stored in ethanol
(80%) at 4 �C for DNA extraction.
Eight microsatellite loci in four different autosomal
arms were selected from the mouse genome database of
the Whitehead Institute for Biomedical Research (http://
www.genome.wi.mit.edu): D6Mit138, D6Mit26,
D9Mit251, D9Mit52, D12Mit182, D12Mit30, D19Mit6
and D19Mit94. They are named ‘DXMitY’ according to
the nomenclature suggested by Davisson (1996), where
‘X’ indicates the chromosome arm number and Y the
locus number.
Total genomic DNA was extracted from tissue samples
(kidney or muscle) with the DNeasy Tissue Kit (Qiagen,
Valencia, CA, USA). Polymerase chain reaction (PCR)
was performed in a 10 lL final volume containing: 1 lL
template DNA (�25 ng), 1 lL 10x Tris buffer, 0.6 lL
MgCl2 25 mMM, 1 lL dNTP mix 2.5 mMM, 1 lL 5 lMM of each
primer and 0.25 U Taq Polymerase (Promega, Madison,
USA). Amplifications were carried out in a Thermocycler
T1 (Biometra, Gottingen, Germany) using the following
conditions: one cycle of 4 min at 94 �C (initial denatur-
ation); 30 cycles of 1 min at 94 �C (denaturation), 45 s at
55–57 �C (depending on the primer pair annealing
temperature) and 45 s at 72 �C; ending with 10 min at
72 �C.
The PCR products were run on 6.5% denaturing
polyacrylamide gels using a LI-COR DNA 4200 auto-
mated sequencer (LI-COR Biosciences, Cambridge, UK).
Allele sizes were estimated using GENEENEIMAGEMAGEIR v4.05
software (Scanalytics, Fairfax, VA, USA) by comparison
with infrared molecular size standards for LI-COR DNA
analysers.
Statistical analysis
Genotype frequencies were tested for departures from
Hardy–Weinberg (H–W) equilibrium expectations with
Fig. 1 G-banded karyotypes of the CD race (2n = 22) and of the ACR race (2n = 24).
504 P. FRANCHINI ET AL.
ª 2 0 0 8 T H E A U T H O R S . J . E V O L . B I O L . 2 1 ( 2 0 0 8 ) 5 0 2 – 5 1 3
J O U R N A L C O M P I L A T I O N ª 2 0 0 8 E U R O P E A N S O C I E T Y F O R E V O L U T I O N A R Y B I O L O G Y
Fisher’s exact test (Louis & Dempster, 1987) using GENE-GENE-
POPPOP v3.4 (Raymond & Rousset, 1995). GENEPOPGENEPOP was also
used to calculate linkage disequilibrium between all pairs
of loci according to Goudet et al. (1996). Significance
levels were calculated by the Markov Chain method
(Guo & Thompson, 1992) using 10 000 permutations,
5000 dememorization steps and 500 batches.
The inter-population level of genetic differentiation
was analysed with the F- and R-statistic. FST values,
estimated by theta (h), were calculated according to Weir
& Cockerham (1984) using FSTATFSTAT v2.9.3.2 (Goudet,
2001). RST values, estimated by rho (q), were calculated
according to Slatkin (1995) using RSTCALCRSTCALC v2.2 (Good-
man, 1997). A statistical analysis of the single locus G
values was used to test the significance of FST over all loci
(Reich et al., 1999). For the significance of pairwise FST
values, we applied a test based on the Markov Chain
method using 10 000 permutations, 5000 dememoriza-
tion steps and 500 batches. Significance levels of RST
values were calculated in a bootstrap procedure using
1000 permutations.
The correlation between geographical and genetic
distances was analysed with a Mantel test (‘Isolde’
subroutine, GENEPOP)GENEPOP). The value FST ⁄ (1 ) FST) was com-
pared with the natural logarithm of the distance
(Rousset, 1997).
To describe population differentiation, we performed a
factorial correspondence analysis (FCA) on all genotypes
using GENETIXGENETIX v4.05 (Belkhir et al., 2004). FCA is a
statistical method allowing to condense the information
contained in a contingency data table by representing set
of objects and set of variables, graphically and synthet-
ically, in a lower dimensional space, denominated facto-
rial space (Benzecri, 1973).
Fig. 2 Location of the 14 sample sites along the contact zone. In Table 1, sample sites and karyotype of each site are described. Pooled sites are
grouped into circles (see text for detailed explanation).
Table 1 Localities, sample size (in brackets), populations and
chromosomal characteristic of mice from the contact zone.
Capture sites
number Locality Population
Chromosomal
race
1 Marana (4) MAR (4) ACR, 2n = 24
2 Mopolino (2) CAP (9) ACR, 2n = 24
3 Capitignano (7)
4 Cascina (20) CAS (20) ACR, 2n = 24
5 Barete (3) PizACR (33) ACR, 2n = 24
6 Pizzoli 8 (8)
7 Pizzoli 9 (10)
8 Pizzoli 10 (9)
9 Pizzoli 11 (3)
10 Pizzoli 13 (5) PizCD (19) CD, 2n = 22
11 Pizzoli 14 (5)
12 Villa S.Pietro (6)
13 San Lorenzo (3)
14 San Vittorino (3) SVT (3) CD, 2n = 22
Contact area between chromosomal races 505
ª 2 0 0 8 T H E A U T H O R S . J . E V O L . B I O L . 2 1 ( 2 0 0 8 ) 5 0 2 – 5 1 3
J O U R N A L C O M P I L A T I O N ª 2 0 0 8 E U R O P E A N S O C I E T Y F O R E V O L U T I O N A R Y B I O L O G Y
Assignment tests and clustering analyses were per-
formed to identify a genetic structure in the dataset. An
assignment test was carried out to assign the individuals
of the entire sample to the different populations and, in a
further level of analysis, to the chromosomal races. The
software GENECLASSENECLASS v2.0 (Piry et al., 2004) was used to
compute the probability that an individual belonged to
each reference group, in this case populations and races
respectively. Each individual was then assigned to its
more probable group. For each group, the software
simulated a large population of multilocus genotypes
according to the allele frequency in the sample. The
analysis was performed using a Bayesian algorithm based
on the maximum likelihood method. For a more precise
computation, the number of simulated individuals was
set at 10 000. The assignment threshold was set at 0.05 to
assign each individual to a group only when the
probability of it belonging to that group was > 5%.
STRUCTURE VTRUCTURE V2.1 (Pritchard et al., 2000; Falush et al.,
2003) was used to infer the presence of genetic clustering
in the sample. The analysis was performed without prior
information about the population structure using the
admixture model used in the software. The model is
based on the evidence that individuals may have mixed
ancestry, so that they inherit some fraction of their
genome from ancestors in population K. The program
assumes K clusters and, with a Bayesian-based algorithm,
all individuals were assigned to produce H–W equilib-
rium and the absence of linkage disequilibrium within
the hypothesized K groups. The optimal values of K were
selected according to the formula suggested by Evanno
et al. (2005): DK = m|L¢(K)| ⁄ s[L(K)]. This procedure
allows one to choose the cluster subdivision that captures
the uppermost level of genetic structure. The final step
was to assign the average proportion of membership (Qi)
of the sampled population to each of the inferred clusters,
setting a threshold Qi > 0.90. When an individual had
Qi < 0.90, it was considered admixed jointly to two or
more clusters. To select an appropriate burning length, so
as to obtain accurate parameter estimates, several runs at
each K (K = 1–6) were performed. The analysis was
conducted with the default option of the admixture
model used by STRUCTURETRUCTURE, with a burn-in chain
length = 1 000 000 and a Markov Chain Monte Carlo
length = 1 000 000.
An accurate estimate of gene flow was obtained through
the use of BAYESAYESASS+SS+ v1.3 (Wilson & Rannala, 2003). The
Bayesian approach implemented in the software allows
computing the asymmetrical migration rates, m, between
the races and among the populations without assuming
H–W equilibrium within them. The program was run with
1 000 000 iterations of the Monte Carlo Markov Chains
(with a length of the burn-in of 1 000 000). To infer
posterior probability distributions of the migration rates,
samples were collected every 2000 iterations.
The detection of hybrids in the sample was also
investigated by the software NEWEWHYBRIDSYBRIDS v1.11.1 (Ander-
son & Thompson, 2002).. As revealed by Vaha & Primmer
(2006), NEWEWHYBRIDSYBRIDS is more indicated than STRUCTURETRUCTURE
to analyse hybridization when both F1 and backcross
hybrids are present in a dataset. NEWEWHYBRIDSYBRIDS computes
the posterior probabilities that each individual of the
sample belongs into different parental ⁄ hybrid categories.
The six genotypic classes hypothesized are constituted by
the two parental types (Pure CD and Pure ACR), F1 and
F2 hybrids, backcrosses of F1 with the first parental (B1)
and backcrosses of F1 with the second parental (B2). The
probabilities of belonging to one of these classes were
evaluated after 100 000 iterations of the Monte Carlo
Markov Chains, without using any individual or allele
frequency prior information. The threshold probability to
assign individuals to one of the six classes was set to
P > 0.90.
A hierarchical differentiation analysis (AMOVAAMOVA) was
performed using Wright’s F-statistics (Wright, 1951) as
implemented in ARLEQUINRLEQUIN v3.0 (Excoffier et al., 2005). In
this analysis, the geographical populations were clustered
by chromosomal races (CD and ACR).
Results
Microsatellite genotyping for the eight loci was successful
for the entire sample (see Appendix A).
The intra-population level of analysis showed that the
observed heterozygosity over all loci was rather high in
all populations, ranging from 0.46 in PizCD to 0.70 in
SVT (Appendix A). The exact test for H–W equilibrium
for each locus in each population showed a significant
deviation from expectations at loci D9Mit52 and
D12Mit30 in PizACR and at locus D19Mit6 in PizCD
(tablewide Bonferroni corrected level of a = 0.0011).
After Bonferroni correction, there was no evidence of
genotypic linkage disequilibrium at any pair of loci (all
P > 0.0003).
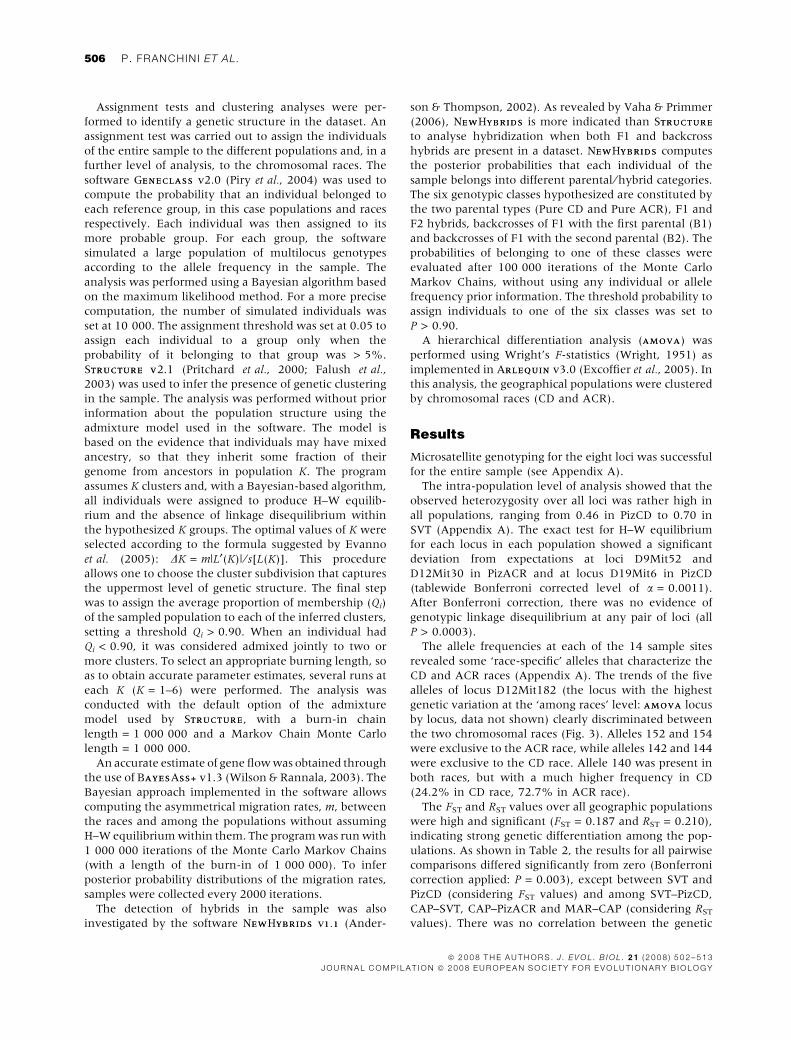
The allele frequencies at each of the 14 sample sites
revealed some ‘race-specific’ alleles that characterize the
CD and ACR races (Appendix A). The trends of the five
alleles of locus D12Mit182 (the locus with the highest
genetic variation at the ‘among races’ level: AMOVAAMOVA locus
by locus, data not shown) clearly discriminated between
the two chromosomal races (Fig. 3). Alleles 152 and 154
were exclusive to the ACR race, while alleles 142 and 144
were exclusive to the CD race. Allele 140 was present in
both races, but with a much higher frequency in CD
(24.2% in CD race, 72.7% in ACR race).
The FST and RST values over all geographic populations
were high and significant (FST = 0.187 and RST = 0.210),
indicating strong genetic differentiation among the pop-
ulations. As shown in Table 2, the results for all pairwise
comparisons differed significantly from zero (Bonferroni
correction applied: P = 0.003), except between SVT and
PizCD (considering FST values) and among SVT–PizCD,
CAP–SVT, CAP–PizACR and MAR–CAP (considering RST
values). There was no correlation between the genetic
506 P. FRANCHINI ET AL.
ª 2 0 0 8 T H E A U T H O R S . J . E V O L . B I O L . 2 1 ( 2 0 0 8 ) 5 0 2 – 5 1 3
J O U R N A L C O M P I L A T I O N ª 2 0 0 8 E U R O P E A N S O C I E T Y F O R E V O L U T I O N A R Y B I O L O G Y
and geographic distances [regression of FST ⁄ (1 ) FST)
over geographic distance, Mantel test, P > 0.05] for the
total set and for the ACR race.
As described in Materials and methods, a factorial
correspondence analysis of microsatellite genotypes was
performed to investigate population differentiation. The
individual genotypes of the ACR and CD populations
were grouped separately on the left and right side of the
FCA plot (Fig. 4), along the axis that explains most of the
genetic variation (10.4%).
The assignment test performed by GENECLASSENECLASS showed
a high percentage of correctly assigned individuals in all
populations, ranging between 33.3% for individuals from
SVT (low value possibly explained by the small popula-
tion size) and 100% for individuals from CAS and MAR
(Table 3). The total value of 89.7% of correct assign-
ments, supported by a high quality index value of 88.4%
(an estimate of the test significance that indicates the
cumulative measure of the percentage assignment of
each individual to a group chosen a priori), showed
a level of genetic differentiation constituted by the
populations. Most significantly, the analysis revealed
another level of genetic separation constituted by the
chromosomal races: there were no bad assignments from
a population of one chromosomal race to a population of
the other race. In the light of this evidence, the
assignment test was also performed on the two chromo-
somal races. In this approach, the analysis was applied to
a dataset in which each specimen was assigned to the
source chromosomal race. The strong genetic subdivision
between the two groups of specimens highlighted in the
previous analysis was confirmed. In fact, all individuals
(100%) were correctly assigned to the source race, with a
high quality index value (95.6%).
The STRUCTURETRUCTURE software revealed strong genetic struc-
turing in the dataset. The posterior probability of the
Fig. 3 Allele frequencies at the locus D12Mit182 for each of the 14
sample sites.
Table 2 FST- (below diagonal) and RST-values (above diagonal) for
each pair of populations.
SVT PizCD PizACR CAP CAS MAR
SVT – )0.043 0.201 0.099 0.282 0.305
PizCD 0.107 – 0.258 0.187 0.384 0.419
PizACR 0.183 0.166 – 0.136 0.110 0.075
CAP 0.150 0.154 0.124 – 0.161 0.277
CAS 0.240 0.254 0.156 0.119 – 0.299
MAR 0.225 0.245 0.154 0.215 0.215 –
Significance differences are marked in bold (P < 0.003, corrected
threshold through the Bonferroni procedure).
Axis 1 (10.4%)
Axi
s 2
(6.
7%)
0 1 2–1
0
1
–1
SVTPizCDPizACRCAPCASMAR
CD raceACR race
Fig. 4 Factorial correspondence analysis (FCA) of the individual
mouse genotypes computed using eight microsatellite loci; the graph
shows the first two factorial components, FCI and FCII.
Table 3 Number of individuals in each population assigned to the
source population (in bold) or to other populations.
Population
Assignation populationCorrect
assignations (%)SVT PizCD PizACR CAP CAS MAR
SVT 1 2 – – – – 33.3
PizCD 2 16 – – – – 88.8
PizACR – – 30 2 2 – 88.2
CAP – – 1 8 – – 88.8
CAS – – – – 20 – 100
MAR – – – – – 4 100
Contact area between chromosomal races 507
ª 2 0 0 8 T H E A U T H O R S . J . E V O L . B I O L . 2 1 ( 2 0 0 8 ) 5 0 2 – 5 1 3
J O U R N A L C O M P I L A T I O N ª 2 0 0 8 E U R O P E A N S O C I E T Y F O R E V O L U T I O N A R Y B I O L O G Y

data, P(D), increased from K = 1 to K = 5, where it
reached its maximum value and exhibited a plateau,
showing genetic differentiation between most of the
sampling sites. Further confirmation of a structure came
from the asymmetric proportion of the sample assigned
to each population (P „ 1 ⁄ K). Evanno et al. (2005)
formula DK = m|L¢(K)| ⁄ s[L(K)] indicates that splitting of
the samples into two or three groups should represent
the optimal subdivision of the data and that further
clustering could correspond to unjustified oversplitting
(Fig. 5). This means that the information included in the
K > 3 clusters is less important than the information in
the first two. As shown by the bar-plots (Fig. 6), when K
was set at 2, there was a high percentage of assignment of
each individual, Qi (average Qi of all individuals = 0.98),
to one of the two clusters, as well as full correspondence
of the inferred clusters with the chromosomal races. A
threshold probability Qi = 0.90 excluded only one spec-
imen from the ACR cluster, belonging to CAP, even
though the assignment was stronger for the source
chromosomal race (Qi = 0.67) than for the CD one.
When three clusters were hypothesized, one of them still
showed full correspondence with the CD race, while the
other two consisted of several admixed individuals,
showing a weak genetic structure within the ACR race.
Increasing the number of K resulted in a weaker genetic
structure within the ACR race and the absence of
individuals with admixed genotypes between the two
chromosomal races.
The analysis performed by the software BAYESAYESASS+SS+
detected a low migration rate among all the populations,
except for the two ones of the CD race (Table 4), where
the migration rate is 0.13 (from SVT to PizCD). It should
be noted that gene flow is also nearly absent between the
two parapatric populations PizCD and PizACR (m < 0.03
in each direction: PizCDMPizACR).
A specialized approach to detect hybridization through
the algorithms implemented in NEWEWHYBRIDSYBRIDS was used.
The analysis performed by the program showed similar
results to that obtained by STRUCTURETRUCTURE. Eighty-four of the
total eighty-eight individuals were assigned to the source
parental race with a probability (pA) higher than 0.90
(Fig. 7a). As revealed by the box-plots in Fig. 7b, the four
2 3 4 5 6 7 8 9 10 11 12 13 14 150
2
4
6
8
10
12
K
K
Fig. 5 DK calculated as DK = m|L¢(K)| ⁄ s[L(K)]. The modal value of
this distribution is the true K. As shown in the graph, K = 2 and
K = 3 correspond to the uppermost levels of structure.
SVT PizACR CAP CAS MAR
CD Group ACR Group
K = 2
K = 4
K = 3
K = 5
PizCD
SVT PizACR CAP CAS MARPizCD
SVT PizACR CAP CAS MARPizCD
SVT PizACR CAP CAS MARPizCD
Fig. 6 Assignment graphs based on the individual genotype built by
STRUCTURETRUCTURE software through the admixture model. Each individual is
represented by a single vertical bar broken in K tinted segments, with
lengths proportional to each of the K inferred clusters. The populations
are shown to identify the individuals, as the clustering analysis infers a
genetic structure from a genotype dataset alone, without inclusion of
the source population in the input file.
Table 4 Mean values of the posterior distributions of m, the
migration rate into each population.
Recipient
population
Source population
SVT PizCD PizACR CAP CAS MAR
SVT 0.746 0.003 0.003 0.007 0.003 0.021
PizCD 0.125 0.981 0.003 0.008 0.003 0.025
PizACR 0.031 0.003 0.961 0.012 0.003 0.024
CAP 0.031 0.003 0.013 0.950 0.003 0.039
CAS 0.028 0.004 0.014 0.010 0.982 0.051
MAR 0.037 0.003 0.004 0.010 0.003 0.837
Source populations (the origin of the migrants) are listed in rows,
while recipient populations (population in which individuals are
migrating) are listed in the columns. Migration rates ‡ 0.100 are in
bold. Standard deviations for all the mean distributions are < 0.050.
508 P. FRANCHINI ET AL.
ª 2 0 0 8 T H E A U T H O R S . J . E V O L . B I O L . 2 1 ( 2 0 0 8 ) 5 0 2 – 5 1 3
J O U R N A L C O M P I L A T I O N ª 2 0 0 8 E U R O P E A N S O C I E T Y F O R E V O L U T I O N A R Y B I O L O G Y
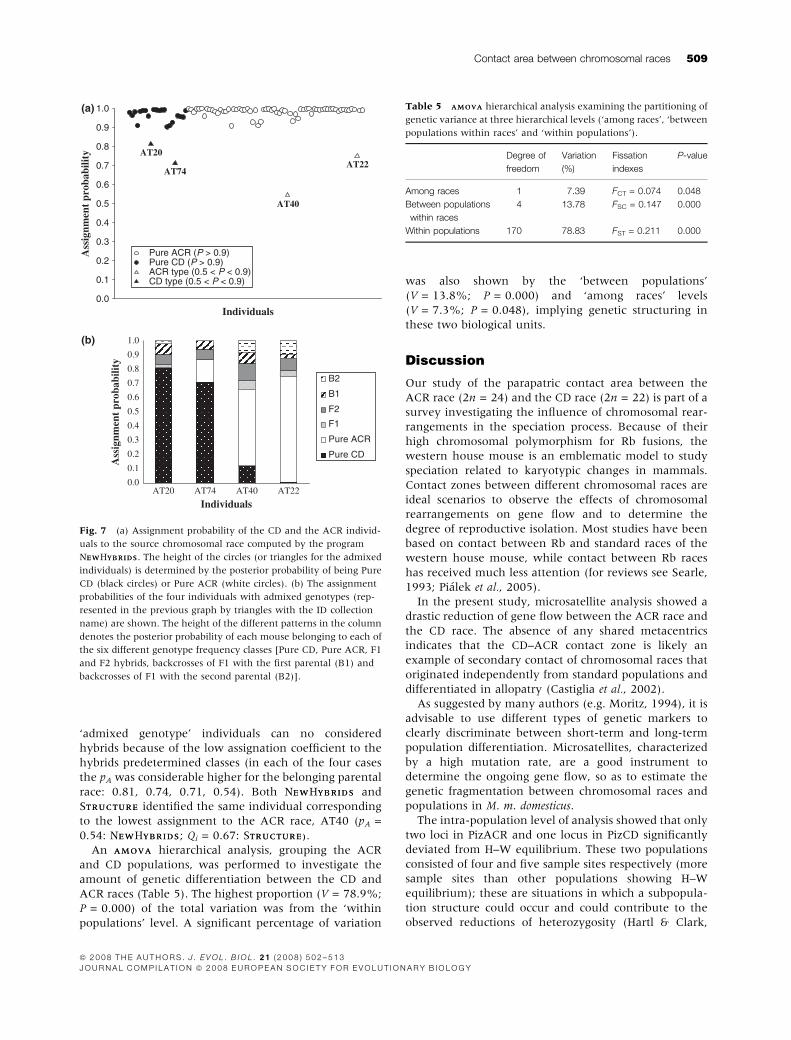
‘admixed genotype’ individuals can no considered
hybrids because of the low assignation coefficient to the
hybrids predetermined classes (in each of the four cases
the pA was considerable higher for the belonging parental
race: 0.81, 0.74, 0.71, 0.54). Both NEWEWHYBRIDSYBRIDS and
STRUCTURETRUCTURE identified the same individual corresponding
to the lowest assignment to the ACR race, AT40 (pA =
0.54: NEWEWHYBRIDSYBRIDS; Qi = 0.67: STRUCTURE).TRUCTURE).
An AMOVAAMOVA hierarchical analysis, grouping the ACR
and CD populations, was performed to investigate the
amount of genetic differentiation between the CD and
ACR races (Table 5). The highest proportion (V = 78.9%;
P = 0.000) of the total variation was from the ‘within
populations’ level. A significant percentage of variation
was also shown by the ‘between populations’
(V = 13.8%; P = 0.000) and ‘among races’ levels
(V = 7.3%; P = 0.048), implying genetic structuring in
these two biological units.
Discussion
Our study of the parapatric contact area between the
ACR race (2n = 24) and the CD race (2n = 22) is part of a
survey investigating the influence of chromosomal rear-
rangements in the speciation process. Because of their
high chromosomal polymorphism for Rb fusions, the
western house mouse is an emblematic model to study
speciation related to karyotypic changes in mammals.
Contact zones between different chromosomal races are
ideal scenarios to observe the effects of chromosomal
rearrangements on gene flow and to determine the
degree of reproductive isolation. Most studies have been
based on contact between Rb and standard races of the
western house mouse, while contact between Rb races
has received much less attention (for reviews see Searle,
1993; Pialek et al., 2005).
In the present study, microsatellite analysis showed a
drastic reduction of gene flow between the ACR race and
the CD race. The absence of any shared metacentrics
indicates that the CD–ACR contact zone is likely an
example of secondary contact of chromosomal races that
originated independently from standard populations and
differentiated in allopatry (Castiglia et al., 2002).
As suggested by many authors (e.g. Moritz, 1994), it is
advisable to use different types of genetic markers to
clearly discriminate between short-term and long-term
population differentiation. Microsatellites, characterized
by a high mutation rate, are a good instrument to
determine the ongoing gene flow, so as to estimate the
genetic fragmentation between chromosomal races and
populations in M. m. domesticus.
The intra-population level of analysis showed that only
two loci in PizACR and one locus in PizCD significantly
deviated from H–W equilibrium. These two populations
consisted of four and five sample sites respectively (more
sample sites than other populations showing H–W
equilibrium); these are situations in which a subpopula-
tion structure could occur and could contribute to the
observed reductions of heterozygosity (Hartl & Clark,
B2
B1
F2
F1
Pure ACR
Pure CD
AT20 AT74 AT40
Individuals
0.0
0.1
0.2
0.3
0.4
0.5
0.6
0.7
0.8
0.9
1.0
Ass
ignm
ent
prob
abili
ty
AT22
(a)
(b)
Individuals
Ass
ignm
ent
prob
abili
ty
0.0
0.1
0.2
0.3
0.4
0.5
0.6
0.7
0.8
0.9
1.0
Pure ACR (P > 0.9) Pure CD (P > 0.9) ACR type (0.5 < P < 0.9) CD type (0.5 < P < 0.9)
AT20
AT74
AT40
AT22
Fig. 7 (a) Assignment probability of the CD and the ACR individ-
uals to the source chromosomal race computed by the program
NEWEWHYBRIDSYBRIDS. The height of the circles (or triangles for the admixed
individuals) is determined by the posterior probability of being Pure
CD (black circles) or Pure ACR (white circles). (b) The assignment
probabilities of the four individuals with admixed genotypes (rep-
resented in the previous graph by triangles with the ID collection
name) are shown. The height of the different patterns in the column
denotes the posterior probability of each mouse belonging to each of
the six different genotype frequency classes [Pure CD, Pure ACR, F1
and F2 hybrids, backcrosses of F1 with the first parental (B1) and
backcrosses of F1 with the second parental (B2)].
Table 5 AMOVAAMOVA hierarchical analysis examining the partitioning of
genetic variance at three hierarchical levels (‘among races’, ‘between
populations within races’ and ‘within populations’).
Degree of
freedom
Variation
(%)
Fissation
indexes
P-value
Among races 1 7.39 FCT = 0.074 0.048
Between populations
within races
4 13.78 FSC = 0.147 0.000
Within populations 170 78.83 FST = 0.211 0.000
Contact area between chromosomal races 509
ª 2 0 0 8 T H E A U T H O R S . J . E V O L . B I O L . 2 1 ( 2 0 0 8 ) 5 0 2 – 5 1 3
J O U R N A L C O M P I L A T I O N ª 2 0 0 8 E U R O P E A N S O C I E T Y F O R E V O L U T I O N A R Y B I O L O G Y
1997). Moreover, the absence of linkage disequilibrium
at any pair of loci agreed with the loci mapping; the eight
loci were selected in four different chromosome arms and
the pair of loci in the same arm were mapped in
pericentromeric and telomeric positions, most probably
excluding the occurrence of linkage because of crossing-
over events.
The inter-population level of analysis demonstrated a
high genetic structure over all populations (FST = 0.187
and RST = 0.210), suggesting significant levels of genetic
fragmentation within the study area. However, the result
of the pairwise comparison among all populations
(F- and R-statistic) indicated a higher level of genetic
differentiation between the races than within them,
suggesting that gene flow is more limited inside the
chromosomal races. The F- and R-statistic revealed that
genetic fragmentation within and between races is high.
This result could be explained by two hypotheses. Firstly,
the observed genetic fragmentation can be explained by
the typical population dynamics of the house mouse,
where commensalism plays a fundamental role in lim-
iting dispersal events between different sites. This situa-
tion may enhance the genetic differentiation between
populations, partially hiding the genetic separation
because of the chromosomal races. The high genetic
structuring detected in the present study is comparable to
the levels of genetic structuring found in other studies of
M. m domesticus (FST = 0.15–0.34, values calculated
between 0.5 and 60 km: Dallas et al., 1998; FST = 0.39,
RST = 0.45: Panithanarak et al., 2004). This hypothesis is
supported by microsatellite analyses of noncommensal
small mammals, for example the common shrew Sorex
araneus, which showed weak genetic fragmentation
(FST = 0.05, RST = 0.11: Lugon-Moulin et al., 2000;
FST = 0.018: Andersson et al., 2004), thus confirming
that gene flow in the house mouse is strongly affected by
commensalism. The absence of a correlation between the
genetic and geographical distances can also be explained
by the role of commensalism. In small mammals, it is
intimately related to passive transport via human vehi-
cles (Cucchi et al., 2005), especially in a farming area like
the Apennine valley along the Aterno River, and it could
be the cause of introgression events independent of
house mouse dispersal. Secondly, the high degrees of
polymorphism in microsatellite alleles, leading to high
levels of homoplasy, may cause overestimation of abso-
lute gene flow between populations (underestimating
the real genetic separation between the races). This can
easily occur when a frequency-based model is used, e.g.
the F-statistic (Gaggiotti et al., 1999).
Other analysis, in addition to the F- and R-statistic,
highlighted the genetic differentiation between the ACR
and CD races. FCA plotting (Fig. 4) showed two separate
clusters constituted by the CD and ACR populations
respectively.
The present evidence is also clearly confirmed by the
results of the assignment test performed with the algo-
rithms used in GENECLASS,ENECLASS, by the Bayesian estimates
executed through BAYESAYESASS+SS+ and by the clustering
analysis conducted with STRUCTURETRUCTURE. The assignment
test clearly identified a strong reduction of gene flow
between the chromosomal races, as shown by the 100%
correct assignment of each individual to the source race.
When applied at the population level, the test provided
wrong assignments only between populations belonging
to the same chromosomal races. The absence of incorrect
assignments of individuals of the two races at Pizzoli is
particularly significant. In this village, the two races are
parapatrically distributed without a geographical barrier.
This indicates the presence of a genetic barrier that
prevents gene exchange between the CD and ACR races.
The clustering analysis also identified two main clus-
ters isolated by a barrier to gene flow, corresponding to
the chromosomal races. However, there were different
patterns of differentiation. In the ACR group, the
‘between populations’ level of genetic fragmentation
was shown by the inferred K > 2 clusters. With K = 3, 4,
5, 6, a group subdivision was detected and there was
partial correspondence between the inferred clusters and
the ACR populations. The fragmentation observed in the
ACR race did not occur in the CD race for K > 2, probably
reflecting the different sample sites.
Because of the consistency of the results, the clustering
analysis used in STRUCTURETRUCTURE could be an instrument to
assign individuals collected in this area to one of the two
chromosomal races without karyotypic characterization.
The Bayesian analysis performed by BAYESAYESASS+SS+ con-
firmed the pattern showed by the assignment test and by
the clustering analysis. Indeed, the program detected a
significant gene flow only between the two CD popula-
tions. The most important result obtained by this
approach was the absence of gene flow between the
two races living in the village of Pizzoli. Considering
the parapatric distribution of these populations, without
the presence of physical barriers, this absence demon-
strated that other kinds of barrier to gene flow (easily
represented by kariotypyc incompatibility) were operat-
ing.
The sporadic hybridization events detected in previous
research were not confirmed in the present study.
Castiglia et al. (2002) described one putative hybrid via
a cytogenetic analysis (an individual with ACR chromo-
somal background presenting two different metacentrics,
one typical of the CD race and one arising by WART) and
another ACR individual with CD-like mtDNA haplotype.
The same mice showed no evidence of hybridization in
the microsatellite loci analysis of their genotypes. In the
first case, the WART could arise directly in a mouse with
an ACR normal karyotype. In the second case, the
discrepancy between the different results could be
explained by the rapid mutation rate of microsatellite
sequences, which tends to hide past hybridization events.
Hence, the genotypes detected in this individual could
have originated from hybrid ancestors subjected to many
510 P. FRANCHINI ET AL.
ª 2 0 0 8 T H E A U T H O R S . J . E V O L . B I O L . 2 1 ( 2 0 0 8 ) 5 0 2 – 5 1 3
J O U R N A L C O M P I L A T I O N ª 2 0 0 8 E U R O P E A N S O C I E T Y F O R E V O L U T I O N A R Y B I O L O G Y
generations of interbreeding within the ACR race. This
consideration is supported by the results obtained by the
software NEWEWHYBRIDSYBRIDS, where there was no evidence of
recent hybridization events as revealed by the absence of
F1, F2 and backcrosses.
The reduction of gene flow revealed by the mtDNA
analysis (Castiglia et al., 2002) was underlined by the
unlinked nuclear loci, indicating complete reproductive
isolation of the races. A preliminary behavioural study
suggested that ACR mice are more aggressive than CD
mice (Carpineti & Castiglia, 2004); after the occurrence of
secondary contact, a premating barrier could have been
established between the two races and its uninterrupted
action may be the cause of the increasing genetic isolation
detected by microsatellites, a short-term discriminator.
Capanna et al. (1984) suggested the importance of
aggressiveness between males of two chromosomal
races, Poschiavo (POS: 2n = 26) and Upper Valtellina
(UV: 2n = 24), in the village of Migiondo (Valtellina,
northern Italy) as a likely reason for the absence of
hybridization events. Hauffe & Searle (1992) recorded
the extinction of the less aggressive race (POS) in
Migiondo. This scenario is highly improbable in our
study area because of the lack of geographical isolation.
Thus, there should only be a shift of the contact zone
(detected in the village of Pizzoli), with a geographical
regression of the CD race.
Recent studies considered the possibility of a chromo-
somal-based speciation (reviewed in Rieseberg, 2001)
emphasizing the role of crossover suppression, as a
mechanism reducing gene flow in the rearranged chro-
mosomes. At the contrary, the present work reveals a
case study where, in presence of high level of chromo-
somal heterozigosity, gene flow may be completely
absent, probably because of hybrid dysfunction.
Acknowledgments
This work was supported by MURST 40% and PRIN
funds. Authors thank E. Solano for help in collecting
specimens. A special acknowledgment to Prof. Marco
Corti, promoter of this research programme and great
friend, who prematurely disappeared.
References
Anderson, E.C. & Thompson, E.A. 2002. A model-based method
for identifying species hybrids using multilocus genetic data.
Genetics 160: 1217–1229.
Andersson, A.C., Narain, Y., Tegelstrom, H. & Fredga, K. 2004.
No apparent reduction of gene flow in a hybrid zone
between the West and North European karyotypic groups
of the common shrew, Sorex araneus. Mol. Ecol. 13: 1205–
1215.
Auffray, J.-C., Vanlerberghe, F. & Britton-Davidian, J. 1990. The
house mouse progression in Eurasia: a palaeontological and
archaeozoological approach. Biol. J. Linn. Soc. 41: 13–25.
Basset, P., Yannic, G., Brunner, H. & Hausser, J. 2006. Restricted
gene flow at specific parts of the shrew genome in chromo-
somal hybrid zones. Evolution 60: 1718–1730.
Belkhir, K., Borsa, P., Chikhi, L., Raufaste, N. & Bonhomme, F.
2004. GENETIXGENETIX 4.05, Logiciel Sous WindowsTM Pour la
Genetique Des Populations. Laboratoire Genome, Populations,
Interactions, CNRS UMR 5000, Universite de Montpellier II,
France.
Benzecri, J.P. 1973. L’analyse des Donnees. Tome 1: La Taxinomie;
Tome II: L’analyse des Correspondences. Dunod, Paris.
Bidau, C.J., Gimenez, M.D., Palmer, C.L. & Searle, J.B. 2001.
The effects of Robertsonian fusions on chiasma frequency
and distribution in the house mouse (Mus musculus domes-
ticus) from a hybrid zone in northern Scotland. Heredity 87:
305–313.
Britton-Davidian, J., Catalan, J., Ramalhinho, M.G., Ganem, G.,
Auffray, J.-C., Capela, R., Biscoito, M., Searle, J.B. & Mathias,
M.L. 2000. Rapid chromosomal evolution in island mice.
Nature 403: 158.
Capanna, E. 1982. Robertsonian numerical variation in animal
speciation: Mus musculus, an emblematic model. In: Mechanism of
Speciation (C. Barigozzi, ed.), pp. 155–177. Alan Liss, New York.
Capanna, E., Corti, M., Mainardi, D., Parmigiani, S. & Brain, P.F.
1984. Karyotype and intermale aggression in wild house mice:
ecology and speciation. Behav. Genet. 14: 195–208.
Carpineti, M. & Castiglia, R. 2004. Analysis of behavioural
discrimination mechanisms in a contact zone between two
metacentric races of the house mouse, Mus musculus domesticus,
in central Italy. Rend. Fis. Acc. Lincei 15: 31–41.
Castiglia, R. & Capanna, E. 1999a. Contact zones between
chromosomal races of Mus musculus domesticus. 1. Temporal
analysis of hybrid zone between the CD chromosomal race
(2n = 22) and populations with the standard karyotype.
Heredity 83: 319–326.
Castiglia, R. & Capanna, E. 1999b. Whole-arm reciprocal
translocation (WART) in a feral population of mice. Chromo-
some Res. 7: 493–495.
Castiglia, R. & Capanna, E. 2000. Contact zone between chromo-
somal races of Mus musculus domesticus. 2. Fertility and segrega-
tion in laboratory-reared and wild mice heterozygous for
multiple Robertsonian rearrangements. Heredity 85: 147–156.
Castiglia, R. & Capanna, E. 2002. Chiasma repatterning across a
chromosomal hybrid zone between chromosomal races of Mus
musculus domesticus. Genetica 114: 35–40.
Castiglia, R., Annesi, F. & Capanna, E. 2002. Contact zones
between chromosomal races of Mus musculus domesticus. 3.
Molecular and chromosomal evidence of restricted gene flow
between the CD race (2n = 22) and the ACR race (2n = 24).
Heredity 89: 219–224.
Chatti, N., Britton-Davidian, J., Catalan, J., Auffray, J. & Said, K.
2005. Reproductive trait divergence and hybrid fertility
patterns between chromosomal races of the house mouse in
Tunisia: analysis of wild and laboratory-bred males and
females. Biol. J. Linn. Soc. 84: 407–416.
Cucchi, T., Vigne, J.D. & Auffray, J.-C. 2005. First occurrence of
the house mouse (Mus musculus domesticus Schwarz & Schwarz,
1943) in the Western Mediterranean: a zooarchaeological
revision of sub-fossil house mouse occurrences. Biol. J. Linn.
Soc. 84: 429–445.
Dallas, J.F., Bonhomme, F., Boursot, P., Britton-Davidian, J. &
Bauchau, V. 1998. Population genetic structure in a Robert-
Contact area between chromosomal races 511
ª 2 0 0 8 T H E A U T H O R S . J . E V O L . B I O L . 2 1 ( 2 0 0 8 ) 5 0 2 – 5 1 3
J O U R N A L C O M P I L A T I O N ª 2 0 0 8 E U R O P E A N S O C I E T Y F O R E V O L U T I O N A R Y B I O L O G Y

sonian race of house mice: evidence from microsatellite
polymorphism. Heredity 80: 70–77.
Davisson, M.T. 1996. Rules and guidelines for gene nomencla-
ture. In: Genetic Variants and Strains of the Laboratory Mouse
(M. F. Lyon, S. Rastan & S. D. M. Brown, eds), pp. 1–16.
Oxford University Press, Oxford, UK.
Evanno, G., Regnaut, S. & Goudet, J. 2005. Detecting the
number of clusters of individuals using the software STRUC-TRUC-
TURETURE: a simulation study. Mol. Ecol. 14: 2611–2620.
Excoffier, L., Laval, G. & Schneider, S. 2005. ARLEQUINRLEQUIN ver. 3.0:
an integrated software package for population genetics data
analysis. Evol. Bioinform. Online 1: 47–50.
Falush, D., Stephens, M. & Pritchard, J.K. 2003. Inference of
population structure using multilocus genotype data: linked
loci and correlated allele frequencies. Genetics 164: 1567–
1587.
Gaggiotti, O.E., Lange, O., Rassmann, K. & Gliddon, C. 1999. A
comparison of two indirect methods for estimating average
levels of gene flow using microsatellite data. Mol. Ecol. 8:
1513–1520.
Goodman, S.J. 1997. RST CALCRST CALC: a collection of computer
programs for calculating unbiased estimates of genetic differ-
entiation and determining their significance for microsatellite
data. Mol. Ecol. 6: 881–885.
Goudet, J. 2001. FSTATFSTAT, a Program to Estimate and Test Gene
Diversities and Fixation Indices (Version 2.9.3). Institut
d’Ecologie, Batiment de Biologie, Universite de Lausanne,
Switzerland.
Goudet, J., Raymond, M., De Meeus, T. & Rousset, F. 1996.
Testing differentiation in diploid populations. Genetics 144:
1933–1940.
Gropp, A., Tettenborn, U. & Von Lehmann, E. 1969. Chromos-
omenvariation von Robertson’schen typus bei der tabakmaus,
Mus poschiavinus, und ihren hybriden mit der laboratoriusm-
aus. Cytogenetics 9: 9–23.
Guo, S.W. & Thompson, E.A. 1992. Performing the exact test of
Hardy–Weinberg proportions for multiple alleles. Biometrics 48:
361–372.
Hartl, D.L. & Clark, A.G. 1997. Principles of Population Genetics.
Sinauer, Sunderland, MA.
Hauffe, H.C. & Searle, J.B. 1992. A disappearing speciation
event? Nature 357: 26.
Hauffe, H.C. & Searle, J.B. 1998. Chromosomal heterozygosity
and fertility in house mice (Mus musculus domesticus) from
Northern Italy. Genetics 150: 1143–1154.
King, M. 1993. Species Evolution, the Role of Chromosome Change.
Cambridge University Press, Cambridge.
Louis, E.J. & Dempster, E.R. 1987. An exact test for Hardy–
Weinberg and multiple alleles. Biometrics 43: 805–811.
Lugon-Moulin, N., Balloux, F. & Hausser, J. 2000. Genetic
differentiation of common shrew Sorex araneus populations
among different alpine valleys revealed by microsatellites. Acta
Theriol. 45: 103–117.
Malorni, W., Capanna, E., Cristaldi, M. & De Martino, E. 1982.
Changes of seminiferous epithelium in hybrids of mice
carrying Robertsonian karyotype. Arch. Androl. 9: 333–341.
Moritz, C. 1994. Defining ‘Evolutionarily Significant Units’ for
conservation. Trends Ecol. Evol. 9: 373–375.
Panithanarak, T., Hauffe, H.C., Dallas, J.F., Glover, A., Ward,
R.G. & Searle, J.B. 2004. Linkage-dependent gene flow in a
house mouse chromosomal hybrid zone. Evolution 58: 184–
192.
Pialek, J., Hauffe, H.C. & Searle, J.B. 2005. Chromosomal
variation in the house mouse. Biol. J. Linn. Soc. 84: 535–563.
Piry, S., Alapetite, A., Cornuet, J.M., Paetkau, D., Baudouin, L.
& Estoup, A. 2004. GENECLASSENECLASS 2: a software for genetic
assignment and first-generation migrant detection. J. Hered.
95: 536–539.
Pritchard, J.K., Stephens, M. & Donnelly, P.J. 2000. Inference of
population structure using multilocus genotype data. Genetics
155: 945–959.
Raymond, M. & Rousset, F. 1995. GENEPOPGENEPOP (version 1.2):
population genetics software for exact tests and ecumenicism.
J. Hered. 86: 248–249.
Redi, C.A. & Capanna, E. 1988. Robertsonian heterozygotes in
the house mouse and the fate of their germ cells. In: The
Cytogenetics of Mammalian Autosomal Rearrangements (A. Daniel,
ed.), pp. 315–359. Alan Liss, New York.
Reich, D.E., Feldman, M.W. & Goldstein, D.B. 1999. Statistical
properties of two tests that use multilocus data sets to detect
population expansions. Mol. Biol. Evol. 16: 453–466.
Rieseberg, L.H. 2001. Chromosomal rearrangements and speci-
ation. Trends Ecol. Evol. 16: 351–358.
Rousset, F. 1997. Genetic differentiation and estimation of gene
flow from F-statistics under isolation by distance. Genetics 145:
1219–1228.
Sage, R.D., Atchley, W.R. & Capanna, E. 1993. House mice as
models in systematic biology. Syst. Biol. 42: 523–561.
Searle, J.B. 1993. Chromosomal hybrid zones in eutherian
mammals. In: Hybrid Zones and the Evolutionary Process (R. G.
Harrison, ed.), pp. 309–353. Oxford University Press, New York.
Slatkin, M. 1995. A measure of population subdivision based on
microsatellite allele frequencies. Genetics 139: 457–462.
Vaha, J.P. & Primmer, C.R. 2006. Efficiency of model-based
Bayesian methods for detecting hybrid individuals under
different hybridization scenarios and with different numbers
of loci. Mol. Ecol. 15: 63–72.
Weir, B.S. & Cockerham, C.C. 1984. Estimating F-statistics for
the analysis of population structure. Evolution 38: 1358–
1370.
White, M.J.D. 1978. Modes of Speciation. W.H. Freeman & Co.,
San Francisco.
Wilson, G.A. & Rannala, B. 2003. Bayesian inference of recent
migration rates using multilocus genotypes. Genetics 163:
1177–1191.
Wright, S. 1951. The genetical structure of populations. Ann.
Eugen. 15: 313–354.
Received 16 July 2007; accepted 4 December 2007
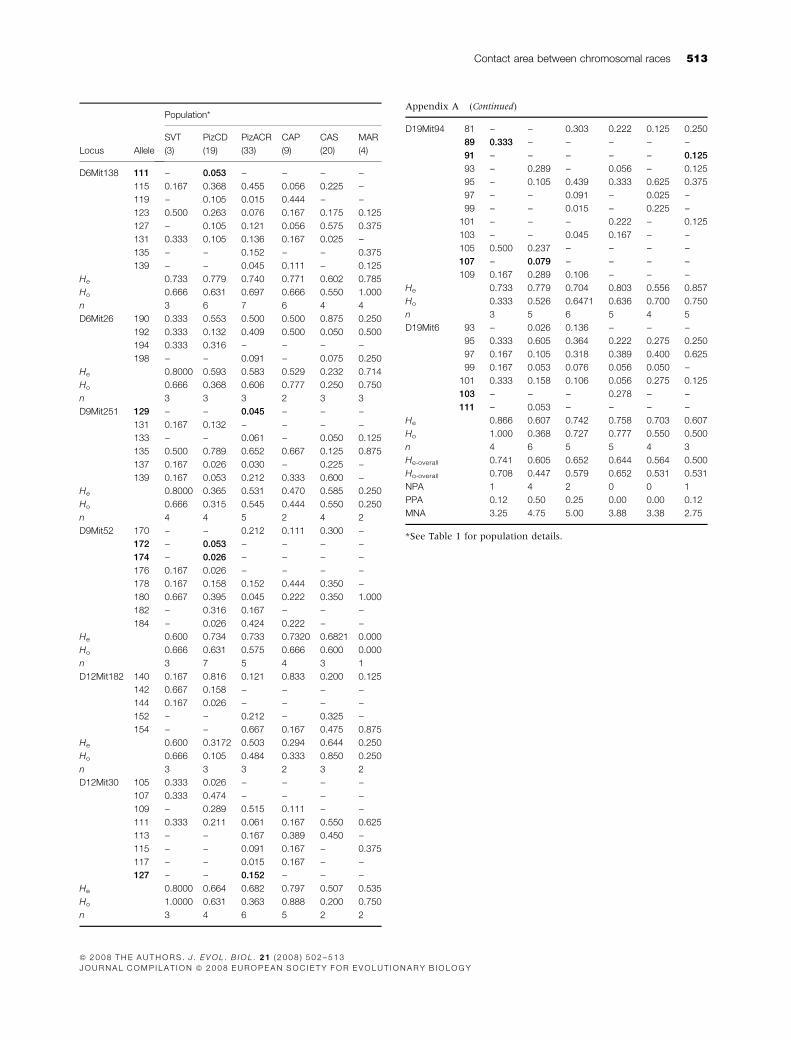
Appendix A
Allele frequencies, observed (Ho) and expected (He)
heterozygosities, number of alleles (n) for the eight
microsatellite loci for each population. Sample size is put
in brackets. Private alleles and their corresponding
frequencies are in bold. Observed (Ho-overall) and ex-
pected (He-overall) heterozygosities for the six populations
calculated over all loci, total number of private alleles
(NPA), proportion of private alleles per locus (PPA) and
mean number of alleles per locus (MNA) for each
population are given at the bottom.
512 P. FRANCHINI ET AL.
ª 2 0 0 8 T H E A U T H O R S . J . E V O L . B I O L . 2 1 ( 2 0 0 8 ) 5 0 2 – 5 1 3
J O U R N A L C O M P I L A T I O N ª 2 0 0 8 E U R O P E A N S O C I E T Y F O R E V O L U T I O N A R Y B I O L O G Y
Locus Allele
Population*
SVT
(3)
PizCD
(19)
PizACR
(33)
CAP
(9)
CAS
(20)
MAR
(4)
D6Mit138 111 – 0.053 – – – –
115 0.167 0.368 0.455 0.056 0.225 –
119 – 0.105 0.015 0.444 – –
123 0.500 0.263 0.076 0.167 0.175 0.125
127 – 0.105 0.121 0.056 0.575 0.375
131 0.333 0.105 0.136 0.167 0.025 –
135 – – 0.152 – – 0.375
139 – – 0.045 0.111 – 0.125
He 0.733 0.779 0.740 0.771 0.602 0.785
Ho 0.666 0.631 0.697 0.666 0.550 1.000
n 3 6 7 6 4 4
D6Mit26 190 0.333 0.553 0.500 0.500 0.875 0.250
192 0.333 0.132 0.409 0.500 0.050 0.500
194 0.333 0.316 – – – –
198 – – 0.091 – 0.075 0.250
He 0.8000 0.593 0.583 0.529 0.232 0.714
Ho 0.666 0.368 0.606 0.777 0.250 0.750
n 3 3 3 2 3 3
D9Mit251 129 – – 0.045 – – –
131 0.167 0.132 – – – –
133 – – 0.061 – 0.050 0.125
135 0.500 0.789 0.652 0.667 0.125 0.875
137 0.167 0.026 0.030 – 0.225 –
139 0.167 0.053 0.212 0.333 0.600 –
He 0.8000 0.365 0.531 0.470 0.585 0.250
Ho 0.666 0.315 0.545 0.444 0.550 0.250
n 4 4 5 2 4 2
D9Mit52 170 – – 0.212 0.111 0.300 –
172 – 0.053 – – – –
174 – 0.026 – – – –
176 0.167 0.026 – – – –
178 0.167 0.158 0.152 0.444 0.350 –
180 0.667 0.395 0.045 0.222 0.350 1.000
182 – 0.316 0.167 – – –
184 – 0.026 0.424 0.222 – –
He 0.600 0.734 0.733 0.7320 0.6821 0.000
Ho 0.666 0.631 0.575 0.666 0.600 0.000
n 3 7 5 4 3 1
D12Mit182 140 0.167 0.816 0.121 0.833 0.200 0.125
142 0.667 0.158 – – – –
144 0.167 0.026 – – – –
152 – – 0.212 – 0.325 –
154 – – 0.667 0.167 0.475 0.875
He 0.600 0.3172 0.503 0.294 0.644 0.250
Ho 0.666 0.105 0.484 0.333 0.850 0.250
n 3 3 3 2 3 2
D12Mit30 105 0.333 0.026 – – – –
107 0.333 0.474 – – – –
109 – 0.289 0.515 0.111 – –
111 0.333 0.211 0.061 0.167 0.550 0.625
113 – – 0.167 0.389 0.450 –
115 – – 0.091 0.167 – 0.375
117 – – 0.015 0.167 – –
127 – – 0.152 – – –
He 0.8000 0.664 0.682 0.797 0.507 0.535
Ho 1.0000 0.631 0.363 0.888 0.200 0.750
n 3 4 6 5 2 2
Appendix A (Continued)
D19Mit94 81 – – 0.303 0.222 0.125 0.250
89 0.333 – – – – –
91 – – – – – 0.125
93 – 0.289 – 0.056 – 0.125
95 – 0.105 0.439 0.333 0.625 0.375
97 – – 0.091 – 0.025 –
99 – – 0.015 – 0.225 –
101 – – – 0.222 – 0.125
103 – – 0.045 0.167 – –
105 0.500 0.237 – – – –
107 – 0.079 – – – –
109 0.167 0.289 0.106 – – –
He 0.733 0.779 0.704 0.803 0.556 0.857
Ho 0.333 0.526 0.6471 0.636 0.700 0.750
n 3 5 6 5 4 5
D19Mit6 93 – 0.026 0.136 – – –
95 0.333 0.605 0.364 0.222 0.275 0.250
97 0.167 0.105 0.318 0.389 0.400 0.625
99 0.167 0.053 0.076 0.056 0.050 –
101 0.333 0.158 0.106 0.056 0.275 0.125
103 – – – 0.278 – –
111 – 0.053 – – – –
He 0.866 0.607 0.742 0.758 0.703 0.607
Ho 1.000 0.368 0.727 0.777 0.550 0.500
n 4 6 5 5 4 3
He-overall 0.741 0.605 0.652 0.644 0.564 0.500
Ho-overall 0.708 0.447 0.579 0.652 0.531 0.531
NPA 1 4 2 0 0 1
PPA 0.12 0.50 0.25 0.00 0.00 0.12
MNA 3.25 4.75 5.00 3.88 3.38 2.75
*See Table 1 for population details.
Contact area between chromosomal races 513
ª 2 0 0 8 T H E A U T H O R S . J . E V O L . B I O L . 2 1 ( 2 0 0 8 ) 5 0 2 – 5 1 3
J O U R N A L C O M P I L A T I O N ª 2 0 0 8 E U R O P E A N S O C I E T Y F O R E V O L U T I O N A R Y B I O L O G Y
![Finale 2003 - [Boleros Medley for 2 pianos (arr. Lito Valle).MUS]](https://static.fdokumen.com/doc/165x107/6332b61808f6dcde650828e2/finale-2003-boleros-medley-for-2-pianos-arr-lito-vallemus.jpg)