
Different evolutionary rates and epidemic growth of hepatitis B virus genotypes A and D
7
Different evolutionary rates and epidemic growth of hepatitis B virus genotypes A and D Gianguglielmo Zehender a, ⁎, Chiara De Maddalena a , Camilla Giambelli a , Laura Milazzo a , Monica Schiavini b , Raffaele Bruno c , Elisabetta Tanzi d , Massimo Galli a a Department of Clinical Sciences “Luigi Sacco”, Section of Infectious Diseases, University of Milan, via G.B. Grassi 74, 20157 Milan, Italy b II Department of Infectious Diseases, Luigi Sacco Hospital, via G.B. Grassi 74, 20157 Milan, Italy c Division of Infectious and Tropical Diseases, IRCCS San Matteo Hospital, University of Pavia, viale Camillo Golgi 19, 27100 Pavia, Italy d Department of Public Health, Microbiology, Virology, University of Milan, via Carlo Pascal 36, 20133 Milan, Italy abstract article info Article history: Received 24 April 2008 Returned to author for revision 30 May 2008 Accepted 12 July 2008 Available online 19 August 2008 Keywords: HBV Molecular epidemiology Coalescent Basic reproductive number Molecular evolution The epidemiological history of HBV genotypes A and D and subgenotypes A2 and D3 was studied on 132 isolates drawn between 1980 and 2005 from patients living in a homogenous geographical area. Evolutionary rates and divergence dates were estimated and HBV demographic history was reconstructed by using a statistical approach based on coalescent theory. The evolutionary rate of A2 was significantly lower than that of D3. The growth rate of D3 epidemic was significantly faster than that of A2; both subgenotypes showed a decreasing growth rate from the mid-1980s. Our data suggest that the important discrepancies observed in the evolutionary rates of HBV genotypes A and D may reflect different population dynamics of their epidemics. These results show the usefulness of phylodynamic studies in reconstructing the history of epidemics due to highly variable DNA viruses, and in evaluating the long-term efficacy of prophylactic measures. © 2008 Elsevier Inc. All rights reserved. Introduction More than 350 million people in the world are infected by hepatitis B virus (HBV), the prevalence of which remains high or very high in developing countries, but is decreasing in the developed world. At the end of the 1970s, more than 2% of the general population in Italy were HBsAg-positive carriers (Stroffolini, 2005) but, since then, HBV epidemiology has significantly changed as a result of improvements in socio-economic and hygienic conditions and the 1991 implementa- tion of compulsory vaccination (Stroffolini, 2005). However, the persistence of a reservoir of approximately 500,000–1 million carriers (largely due to the cohort effect), and the low level of vaccination coverage among high-risk subjects aged more than 25 years, mean that HBV infection is still one of the country's major health problems (Mele et al., 2002; Zanetti et al., 2006). Although it is a DNA virus, HBV is characterised by considerable genetic variability (Okamoto et al., 1987; Orito et al., 1989). Eight genotypes (A–H) have so far been described, which differ from each other by about 8% of nucleotides and have different geographic distributions (Norder et al., 1992; Okamoto et al., 1988). In particular, genotypes A and D are the most prevalent in subjects born in Western countries: genotype A is mainly found in Europe and North America (Chu et al., 2003; Kidd-Ljunggren et al., 2002), whereas genotype D is widespread throughout the world and the prevalent genotype in the Mediterranean basin (Southern Europe and North Africa) (Kidd- Ljunggren et al., 2002; Norder et al., 2004). Subsequent studies have shown that some genotypes can be further segregated into sub- genotypes: strain A segregates into three subgenotypes, whereas strain D shows a more complex phylogenesis clusterizing into five subgenotypes and an intense heterogeneity at intrasubgenotypic level (De Maddalena et al., 2007; Norder et al., 2004). Genotype distribution may also differ on the basis of risk behaviour. In a recent study, we reported a high prevalence of genotype D and A in Italians with dual HIV-1/HBV infection, with genotype D being the most prevalent among IVDUs, and genotype A among men-having-sex-with-men (MSM) (Zehender et al., 2003). In particular, subgenotype D3 was the most frequently found among IVDUs and subgenotype A2 among MSM (De Maddalena et al., 2007). The use of models for inferring the past demographic history of populations on the basis of genealogical trees and improved methods for estimating the evolutionary rates and divergence times of heterochronous sequences (sequences sampled over relatively long Virology 380 (2008) 84–90 ⁎ Corresponding author. Dipartimento di Scienze Cliniche “L. Sacco”, Sezione Malattie Infettive e Tropicali, Università di Milano, c/o Ospedale L. Sacco, Via G.B. Grassi, 74 – 20157 Milan, Italy. Fax: +39 02 50319768. E-mail addresses: [email protected] (G. Zehender), [email protected] (C.D. Maddalena), [email protected] (C. Giambelli), [email protected] (L. Milazzo), [email protected] (M. Schiavini), [email protected] (R. Bruno), [email protected] (E. Tanzi), [email protected] (M. Galli). 0042-6822/$ – see front matter © 2008 Elsevier Inc. All rights reserved. doi:10.1016/j.virol.2008.07.009 Contents lists available at ScienceDirect Virology journal homepage: www.elsevier.com/locate/yviro
Transcript of Different evolutionary rates and epidemic growth of hepatitis B virus genotypes A and D

Virology 380 (2008) 84–90
Contents lists available at ScienceDirect
Virology
j ourna l homepage: www.e lsev ie r.com/ locate /yv i ro
Different evolutionary rates and epidemic growth of hepatitis B virus genotypesA and D
Gianguglielmo Zehender a,⁎, Chiara De Maddalena a, Camilla Giambelli a, Laura Milazzo a , Monica Schiavini b,Raffaele Bruno c, Elisabetta Tanzi d, Massimo Galli a
a Department of Clinical Sciences “Luigi Sacco”, Section of Infectious Diseases, University of Milan, via G.B. Grassi 74, 20157 Milan, Italyb II Department of Infectious Diseases, Luigi Sacco Hospital, via G.B. Grassi 74, 20157 Milan, Italyc Division of Infectious and Tropical Diseases, IRCCS San Matteo Hospital, University of Pavia, viale Camillo Golgi 19, 27100 Pavia, Italyd Department of Public Health, Microbiology, Virology, University of Milan, via Carlo Pascal 36, 20133 Milan, Italy
⁎ Corresponding author. Dipartimento di Scienze CliniInfettive e Tropicali, Università di Milano, c/o Ospedale20157 Milan, Italy. Fax: +39 02 50319768.
E-mail addresses: [email protected]@unimi.it (C.D. Maddalena), camilla(C. Giambelli), [email protected] (L. Milazzo), [email protected] (R. Bruno), [email protected]@unimi.it (M. Galli).
0042-6822/$ – see front matter © 2008 Elsevier Inc. Aldoi:10.1016/j.virol.2008.07.009
a b s t r a c t
a r t i c l e i n f oArticle history:
The epidemiological history Received 24 April 2008Returned to author for revision 30 May 2008Accepted 12 July 2008Available online 19 August 2008Keywords:HBVMolecular epidemiologyCoalescentBasic reproductive numberMolecular evolution
of HBV genotypes A and D and subgenotypes A2 and D3 was studied on 132isolates drawn between 1980 and 2005 from patients living in a homogenous geographical area. Evolutionaryrates and divergence dates were estimated and HBV demographic history was reconstructed by using astatistical approach based on coalescent theory. The evolutionary rate of A2 was significantly lower than thatof D3. The growth rate of D3 epidemic was significantly faster than that of A2; both subgenotypes showed adecreasing growth rate from the mid-1980s. Our data suggest that the important discrepancies observed inthe evolutionary rates of HBV genotypes A and D may reflect different population dynamics of theirepidemics. These results show the usefulness of phylodynamic studies in reconstructing the history ofepidemics due to highly variable DNA viruses, and in evaluating the long-term efficacy of prophylacticmeasures.
© 2008 Elsevier Inc. All rights reserved.
Introduction
More than 350million people in theworld are infected by hepatitisB virus (HBV), the prevalence of which remains high or very high indeveloping countries, but is decreasing in the developed world. At theend of the 1970s, more than 2% of the general population in Italy wereHBsAg-positive carriers (Stroffolini, 2005) but, since then, HBVepidemiology has significantly changed as a result of improvementsin socio-economic and hygienic conditions and the 1991 implementa-tion of compulsory vaccination (Stroffolini, 2005). However, thepersistence of a reservoir of approximately 500,000–1 million carriers(largely due to the cohort effect), and the low level of vaccinationcoverage among high-risk subjects aged more than 25 years, meanthat HBV infection is still one of the country's major health problems(Mele et al., 2002; Zanetti et al., 2006).
Although it is a DNA virus, HBV is characterised by considerablegenetic variability (Okamoto et al., 1987; Orito et al., 1989). Eight
che “L. Sacco”, SezioneMalattieL. Sacco, Via G.B. Grassi, 74 –
(G. Zehender),[email protected]@hsacco.it (M. Schiavini),i.it (E. Tanzi),
l rights reserved.
genotypes (A–H) have so far been described, which differ from eachother by about 8% of nucleotides and have different geographicdistributions (Norder et al., 1992; Okamoto et al., 1988). In particular,genotypes A and D are the most prevalent in subjects born in Westerncountries: genotype A is mainly found in Europe and North America(Chu et al., 2003; Kidd-Ljunggren et al., 2002), whereas genotype D iswidespread throughout the world and the prevalent genotype in theMediterranean basin (Southern Europe and North Africa) (Kidd-Ljunggren et al., 2002; Norder et al., 2004). Subsequent studies haveshown that some genotypes can be further segregated into sub-genotypes: strain A segregates into three subgenotypes, whereasstrain D shows a more complex phylogenesis clusterizing into fivesubgenotypes and an intense heterogeneity at intrasubgenotypic level(De Maddalena et al., 2007; Norder et al., 2004).
Genotype distribution may also differ on the basis of riskbehaviour. In a recent study, we reported a high prevalence ofgenotype D and A in Italians with dual HIV-1/HBV infection, withgenotype D being the most prevalent among IVDUs, and genotype Aamong men-having-sex-with-men (MSM) (Zehender et al., 2003). Inparticular, subgenotype D3 was the most frequently found amongIVDUs and subgenotype A2 among MSM (De Maddalena et al., 2007).
The use of models for inferring the past demographic history ofpopulations on the basis of genealogical trees and improved methodsfor estimating the evolutionary rates and divergence times ofheterochronous sequences (sequences sampled over relatively long

Table 1Evolutionary rates and time of most recent common ancestor (tMRCA) estimates of HBVA and D genotypes and subgenotypes A2 and D3
Genotype/subgenotype
LnLa Evolutionary rate(×10−4)
95%CI(×10−4)
tMRCA(year)
95%CI(years)
A (A1–A2) 2627.89 0.90 0.12–1.7 1768 1560–1976A2 2583 0.91 0.11–1.7 1943 1893–1993D (D1–D4) 7841 3.67 2.85–4.49 1920 1902–1938D3 6586.3 3.29 2.90–3.70 1935 1926–1944
a LnL: negative log-likelihood.
85G. Zehender et al. / Virology 380 (2008) 84–90
periods of time) have recently made it possible to develop coalescent-basedmethods for studying the dynamics of viral populations at intra-and inter-host level. This “phylodynamic” approach (Grenfell et al.,2004) has been used to study the past/recent epidemiology ofinfections due to highly variable RNA-viruses such as HCV (Pybus etal., 2001, 2005; Verbeeck et al., 2006), HIV (Salemi et al., 2005; Walkeret al., 2005), West Nile virus (Snapinn et al., 2007), and foot-and-mouth disease virus (Cottam et al., 2006) and, more recently, DNAviruses (Kitchen et al., 2007).
In order to clarify the nature of their previously observeddifferent rates of heterogeneity, we have attempted to reconstructthe epidemic history of HBV genotypes D and A. Samples collectedfrom HBsAg-positive Italian subjects infected with genotypes D andA between 1980 and 2005 were used to estimate evolutionaryrates and to infer demographic parameters such as the number ofinfections and the rate of growth, in the light of current knowledgeconcerning the epidemiology of hepatitis viruses.
Results
Evolutionary rates and divergence dates
The evolutionary rates of genotypes A and D were separatelyestimated for HBV polymerase (P) and surface antigen (PreS/S) genes.
Fig. 1. Rooted genealogies of HBV subgenotypes A2 and D3 using sequences 1182 nt long, estihave a proportional relationship between branch lengths and time. The main clades are hsignificance of the clades (bootstrap value ≥65% and/or Likelihood ratio test for branch leng
The results were very similar because the overlapping region of thetwo genes was analysed, but the P sequences gave better estimateswith narrower 95% confidence intervals (CIs) and are reported in theTable 1. The estimates were also similar between the genotype Adataset as a whole and the subgenotype A2 dataset, and between thegenotype D and subgenotype D3 datasets. On the contrary, theevolutionary rates of genotype D (3.7×10⁻⁴ subs/site/year) andsubgenotype D3 (3.3×10⁻⁴ subs/site/year) were higher than those ofgenotype A and subgenotype A2 (0.9×10⁻⁴ subs/site/year) and thesedifferences were significant as shown by the non-overlappingconfidence limits (Table 1).
Accordingly, the times of the most recent common ancestor(tMRCA) were dated 1768 (95%CI: 1560–1976) for genotype A and
mated by means of maximum likelihood under the SRDT model using Tipdate. The treesighlighted: red for A2 and blue for D3. Asterisks on the branches indicate statisticalth of zero, Pb0.001 — De Maddalena et al., 2007).

86 G. Zehender et al. / Virology 380 (2008) 84–90
1920 (95%CI: 1902–1938) for genotype D. More similar dates wereobtained for subgenotypes, 1943 (95%CI: 1893–1993) for A2 and 1935(95%CI: 1926–1944) for D3.
Tipdate tree analysis
Analysis of the tipdate trees (Fig. 1) of subgenotype A2 showed amain clade dated 1960 (95%CI: 1927–1993) that further segregatedinto different monophyletic groups. One of these originated in about1966 (95%CI: 1940–1991, red in Fig. 1) and included strains mainlyderived from subjects who were HIV-1 positive (9/14, 64.3%) and/orMSM (6/14, 42.9%): more specifically, the clade included 90% of theHIV-1 positive isolates and 66.7% of the MSM isolates. In order toeliminate the presence of the lamivudine-resistance associatedmutations in positions rt204 and rt180 of the P sequence in themajority of the A isolates as a possible confounding factor, these siteswere removed before the analysis without changing the topology ortime estimates [data not shown].
Analysis of the tipdate tree of subgenotype D3 showed two mainclades originating in about 1950 (95%CI: 1945–1956, Fig.1), and severalsmaller clades originating in the same interval of years. Interestingly,13/16 IVDU isolates (81.2%) clustered in a subclade originating in 1971(95%CI: 1968–1973, blue in Fig. 1), which also included two hetero-sexual, one iatrogenic and eleven community acquired infections; thesame subclade included half of the 14 HIV-1 positive individuals. All ofthe isolates included in this subclade were characterised by thepresence of mutations S90T in PreS1 (corresponding to V93D in thespacer of P protein), T125M and P127T/A in S protein (the last onecorresponding to rtS135Y/C), L116F and P120S in the spacer region of Pprotein and rtC256S and rtV266I/R in the reverse transcriptase. All buttwo isolates also had the mutation T31A in PreS2 corresponding toN142S in spacer of P protein. Themutation T/M in position 125 of the Sprotein appeared at the 1960 node (95%CI: 1955–1965), whereas thetMRCA of all of the other mutations was 1971.
All the other clades originating in 1940s–1950s included mainlyHIV-1 negative subjects with community acquired (about 80%)infections.
Demographic estimates
Different demographic hypotheses were tested by means ofmaximum likelihood analysis using the HBV clock-like trees withnon-contemporary sequences. As shown in Table 2, both the genotypeD dataset as a whole and the subgenotype D3 dataset best fitted thelogistic model of growth (P=0.002 and Pb0.001 by LRT). In the case ofgenotype A, the logistic model was preferred for the A2 sequences(Pb0.01 by LRT), but the dataset as a whole best fitted an expansionmodel (Pb0.001 vs. exponential model by LRT).
Table 2Growth model, negative log-likelihood (LnL), likelihood ratio test (LRT) and demograpin parentheses)
Genotype/subgenotype Selected model LnL LRT Pa N (0)b
A Expansion 269.832 11.3 1700b0.001 (633–5444)
A2 Logistic 266.608 9.6 580b0.01 (318–1340)
D Logistic 697.869 9.5 25910.002 (1523–6021)
D3 Logistic 578.700 32.7 1286b0.001 (912–1897)
a Comparison with the simpler nested model.b N (0): effective number of infections at present.c r: growth rate.d α: population size at t=∞ in expansion model; c: logistic shape parameter.e R0: basic reproductive number for average duration of the infectiousness (D) equal to 1f λ: doubling time for epidemic in years.
The estimates of the demographic parameters for genotypes A andD, and subgenotypes A2 and D3, using the selected models, arereported in Table 2. The growth rate (r) and the basic reproductivenumber (R0) (for D=10 or 30 years) of subgenotype D3 were alwayssignificantly higher than those of subgenotype A2, as shown by thenon-overlapping confidence limits. In particular, the growth rate ofsubgenotype D3was 1.75-fold faster than that of subgenotype A2 (95%CI of r=0.2–0.3 for D3 and 0.09–0.19 for A2). The R0 calculated for theplausible average duration of the infection showed that each primarycase with the D3 subgenotype generated 1.4–1.6 times moresecondary cases than each primary case with A2, and the epidemicdoubling time (λ) estimate was about 5 years for A2 and about 3 yearsfor D3.
Skyline plot analysis
The skyline analysis of the non-parametric estimates of N (t)(Fig. 2) showed that the exponential growth of the subgenotype A2epidemic started in our population in 1960, raised gradually over time,until the equilibrium prevalence reaching a peak in 1986. Since 1994,there has been a 15.7-fold decrease in the number of infections. TheD3 epidemic began in the 1940s and grew exponentially until the1980s when the number of infections reached the plateau and thegrowth rate slowed down. At the peak the number of D3 infectionswas twice that of A2 (Fig. 2).
Discussion
As a result of the use, during viral replication, of a reversetranscriptase lacking the proofreading function, the genetic variabilityof HBV is greater than that of any other DNA virus (Duffy et al., 2008).Previous studies have suggested evolutionary rates ranging from1.5×10−5 to 7.72×10⁻⁴ subs/site/year (Fares and Holmes, 2002;Hannoun et al., 2000; Okamoto et al., 1987; Orito et al., 1989; Osiowyet al., 2006; Zhou and Holmes, 2007).
Our study was based on a homogenous series of HBV-infectedsubjects from the same geographical area whose samples werecollected over a period of 25 years (1980–2005). The estimatedevolutionary rates of genotype D and subgenotype D3 (in the order of3×10−4) were more than three times higher than those of genotype Aand subgenotype A2 (in the order of 0.9×10⁻⁴), and the absence of anyoverlap in the 95% CIs supports a statistically significant differencebetween the two genotypes and subgenotypes.
As recently shown by other authors (Fares and Holmes, 2002; Zhouand Holmes, 2007), recombination occurs frequently among hepadna-viruses. Recombination can affect both phylogeny and the estimation ofthe tMRCA. In particular it has been shown that the presence of onlysmall levels of recombination in the alignment, lets to more frequent
hic parameter estimates (see the legend below) for the analysed data sets (95%CI
rc α/cd R0e (D=10) R0 (D=30) λf
0.075 0.028 1.7 3.2 9.2(0.04–0.11) (0.024–0.12) (1.4–2.1) (2.2–4.6) (6.3–17.3)0.144 0.019 2.4 5.3 4.8(0.09–0.19) (0.0014–0.24) (1.9–2.9) (3.7–6.7) (3.6–6.9)0.115 0.050 2.5 4.5 6.0(0.09–0.13) (0.011–0.36) (1.9–2.3) (3.7–4.9) (5.1–7.4)0.252 2.5×10⁻⁵ 3.5 8.6 2.7(0.2–0.3) (1.8×10⁻⁶–4.3×10⁻⁴) (3.0–4.0) (7–10) (2.3–3.3)
0 or 30 years.

Fig. 2. Skyline plots representing non-parametric (solid line) and induced estimates (dashed line) of N (t) using the polymerase gene of HBV subgenotypes A2 and D3. Geneticdistances were transformed into a time scale of years using the evolutionary rates inferred by means of maximum likelihood. Ordinates: N (t); abscises: time (years).
87G. Zehender et al. / Virology 380 (2008) 84–90
rejections of the molecular clock (Schierup and Hein, 2000). For thesereasons we screened our alignment for recombination with differentprograms and excluded recombinant isolates from further analysis.
Like other authors (Pybus et al., 2005; Salemi et al., 2005), we foundthat the molecular clock hypothesis was easily rejected in each of ourdatasets [data not shown]. However, simulation studies have shownthat, when there is small amount of rate heterogeneity betweenlineages, estimated substitution rates are still reliable indicators of theaverage rate of evolution and can still be used to infer divergence timescorrectly (Jenkins et al., 2002).
On the basis of our estimates, we inferred that the origin of the Dgenotype is relatively recent (about 85 years ago), as well that ofsubgenotypes D3 and A2 (about 70 and 65 years ago).
In a previous study, we found major differences in the viralheterogeneity of HBV genotypes, with genotype D showing morepolymorphism than HBV G or A (De Maddalena et al., 2007). Here wereport a marked difference in the evolutionary rates of genotypes Aand D and subgenotypes A2 and D3.
It is known that genotype D has a highly complex phylogenesis,which has been attributed to its worldwide distribution and/or itspossible ancient origin (Norder et al., 2004). Our data seem to suggestthat other factors, intrinsic to the virus and/or linked to the populationdynamics of the epidemics, may account for both the high evolu-tionary rate and complex phylogeny of this genotype.
Demographic analysis showed that the D3 epidemic grew twice asrapidly as that due to A2, with both showing a logistic trend consisting
of a phase of exponential increase of infections followed by a plateauat equilibrium prevalence. Our data suggest that the exponentialgrowth of the D3 subgenotype began in Italy sometime between 1945and 1956 (more probably in the early '50s), which coincides with theappearance of two major and several minor clades in the tipdate tree,including mainly HIV-1 negative subjects with community acquiredinfections. The equilibrium phase was reached during the 1960s and1970s, when a new clade associated with IVDU and HIV-1positivity emerged.
HBV D3 is themost frequent strain found among IVDUs, inwhom itis characterised by a number of S and P mutations (De Maddalena etal., 2007): in particular, the mutation (T/M) in residue 125 of S proteinhas also been reported by others (Norder et al., 2004). We havepreviously described additional mutations in PreS1 and PreS2(De Maddalena et al., 2007) and now in P protein, characterising thesame IVDUs associated strain. Analysis of the tipdate tree suggeststhat the ancestor of this strain was a single T125M mutant thatprobably emerged between 1955 and 1965, and subsequently spreadamong IVDUs acquiring new mutations.
The exponential growth of subgenotype A2 took place in the 1960s,and reached a plateau in the 1980s. We have previously reported thatgenotype A and subgenotype A2 were the most prevalent HBV strainsamong MSM in Italy (De Maddalena et al., 2007). Interestingly, wefound that the A2 sequences from a 67% of the MSM (and a 90% of theHIV-1 positive individuals) formed a separate clade originatingaround the year 1966.
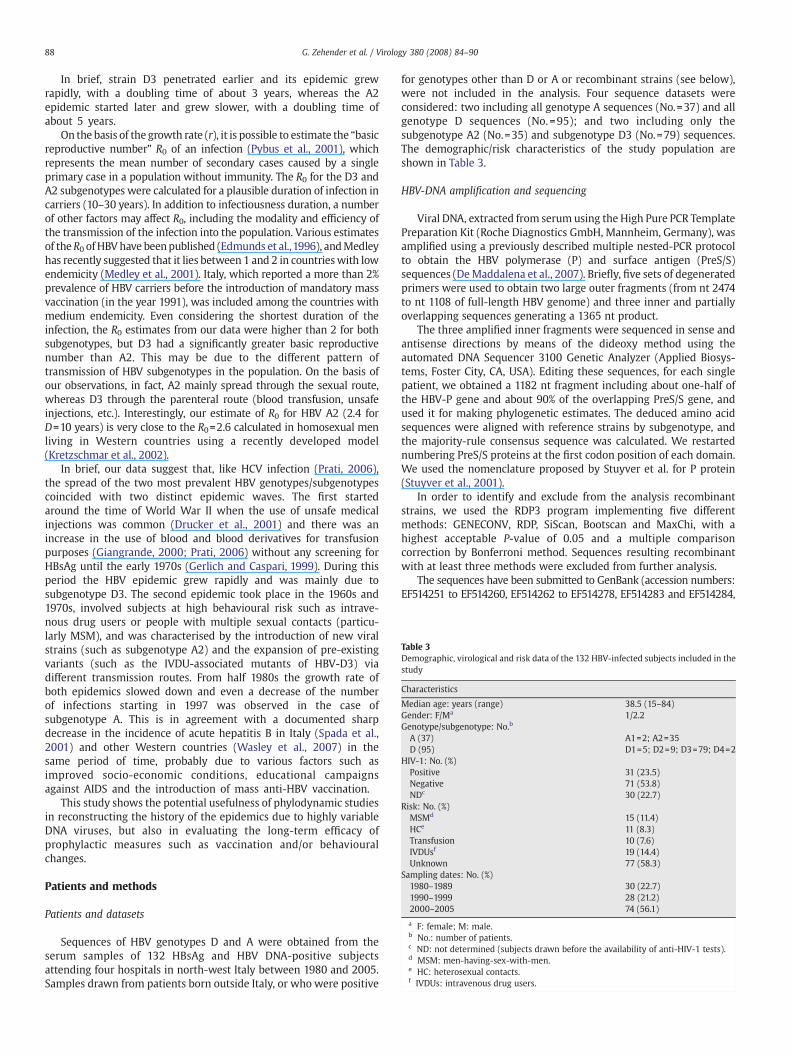
Table 3Demographic, virological and risk data of the 132 HBV-infected subjects included in thestudy
Characteristics
Median age: years (range) 38.5 (15–84)Gender: F/Ma 1/2.2Genotype/subgenotype: No.b
A (37) A1=2; A2=35D (95) D1=5; D2=9; D3=79; D4=2
HIV-1: No. (%)Positive 31 (23.5)Negative 71 (53.8)NDc 30 (22.7)
Risk: No. (%)MSMd 15 (11.4)HCe 11 (8.3)Transfusion 10 (7.6)IVDUsf 19 (14.4)Unknown 77 (58.3)
Sampling dates: No. (%)1980–1989 30 (22.7)1990–1999 28 (21.2)2000–2005 74 (56.1)
a F: female; M: male.b No.: number of patients.c ND: not determined (subjects drawn before the availability of anti-HIV-1 tests).d MSM: men-having-sex-with-men.e HC: heterosexual contacts.f IVDUs: intravenous drug users.
88 G. Zehender et al. / Virology 380 (2008) 84–90
In brief, strain D3 penetrated earlier and its epidemic grewrapidly, with a doubling time of about 3 years, whereas the A2epidemic started later and grew slower, with a doubling time ofabout 5 years.
On the basis of the growth rate (r), it is possible to estimate the “basicreproductive number” R0 of an infection (Pybus et al., 2001), whichrepresents the mean number of secondary cases caused by a singleprimary case in a population without immunity. The R0 for the D3 andA2 subgenotypes were calculated for a plausible duration of infection incarriers (10–30 years). In addition to infectiousness duration, a numberof other factors may affect R0, including the modality and efficiency ofthe transmission of the infection into the population. Various estimatesof theR0 ofHBVhave beenpublished (Edmunds et al.,1996), andMedleyhas recently suggested that it lies between 1 and 2 in countrieswith lowendemicity (Medley et al., 2001). Italy, which reported a more than 2%prevalence of HBV carriers before the introduction of mandatory massvaccination (in the year 1991), was included among the countries withmedium endemicity. Even considering the shortest duration of theinfection, the R0 estimates from our data were higher than 2 for bothsubgenotypes, but D3 had a significantly greater basic reproductivenumber than A2. This may be due to the different pattern oftransmission of HBV subgenotypes in the population. On the basis ofour observations, in fact, A2 mainly spread through the sexual route,whereas D3 through the parenteral route (blood transfusion, unsafeinjections, etc.). Interestingly, our estimate of R0 for HBV A2 (2.4 forD=10 years) is very close to the R0=2.6 calculated in homosexual menliving in Western countries using a recently developed model(Kretzschmar et al., 2002).
In brief, our data suggest that, like HCV infection (Prati, 2006),the spread of the two most prevalent HBV genotypes/subgenotypescoincided with two distinct epidemic waves. The first startedaround the time of World War II when the use of unsafe medicalinjections was common (Drucker et al., 2001) and there was anincrease in the use of blood and blood derivatives for transfusionpurposes (Giangrande, 2000; Prati, 2006) without any screening forHBsAg until the early 1970s (Gerlich and Caspari, 1999). During thisperiod the HBV epidemic grew rapidly and was mainly due tosubgenotype D3. The second epidemic took place in the 1960s and1970s, involved subjects at high behavioural risk such as intrave-nous drug users or people with multiple sexual contacts (particu-larly MSM), and was characterised by the introduction of new viralstrains (such as subgenotype A2) and the expansion of pre-existingvariants (such as the IVDU-associated mutants of HBV-D3) viadifferent transmission routes. From half 1980s the growth rate ofboth epidemics slowed down and even a decrease of the numberof infections starting in 1997 was observed in the case ofsubgenotype A. This is in agreement with a documented sharpdecrease in the incidence of acute hepatitis B in Italy (Spada et al.,2001) and other Western countries (Wasley et al., 2007) in thesame period of time, probably due to various factors such asimproved socio-economic conditions, educational campaignsagainst AIDS and the introduction of mass anti-HBV vaccination.
This study shows the potential usefulness of phylodynamic studiesin reconstructing the history of the epidemics due to highly variableDNA viruses, but also in evaluating the long-term efficacy ofprophylactic measures such as vaccination and/or behaviouralchanges.
Patients and methods
Patients and datasets
Sequences of HBV genotypes D and A were obtained from theserum samples of 132 HBsAg and HBV DNA-positive subjectsattending four hospitals in north-west Italy between 1980 and 2005.Samples drawn from patients born outside Italy, or who were positive
for genotypes other than D or A or recombinant strains (see below),were not included in the analysis. Four sequence datasets wereconsidered: two including all genotype A sequences (No.=37) and allgenotype D sequences (No.=95); and two including only thesubgenotype A2 (No.=35) and subgenotype D3 (No.=79) sequences.The demographic/risk characteristics of the study population areshown in Table 3.
HBV-DNA amplification and sequencing
Viral DNA, extracted from serum using the High Pure PCR TemplatePreparation Kit (Roche Diagnostics GmbH, Mannheim, Germany), wasamplified using a previously described multiple nested-PCR protocolto obtain the HBV polymerase (P) and surface antigen (PreS/S)sequences (DeMaddalena et al., 2007). Briefly, five sets of degeneratedprimers were used to obtain two large outer fragments (from nt 2474to nt 1108 of full-length HBV genome) and three inner and partiallyoverlapping sequences generating a 1365 nt product.
The three amplified inner fragments were sequenced in sense andantisense directions by means of the dideoxy method using theautomated DNA Sequencer 3100 Genetic Analyzer (Applied Biosys-tems, Foster City, CA, USA). Editing these sequences, for each singlepatient, we obtained a 1182 nt fragment including about one-half ofthe HBV-P gene and about 90% of the overlapping PreS/S gene, andused it for making phylogenetic estimates. The deduced amino acidsequences were aligned with reference strains by subgenotype, andthe majority-rule consensus sequence was calculated. We restartednumbering PreS/S proteins at the first codon position of each domain.We used the nomenclature proposed by Stuyver et al. for P protein(Stuyver et al., 2001).
In order to identify and exclude from the analysis recombinantstrains, we used the RDP3 program implementing five differentmethods: GENECONV, RDP, SiScan, Bootscan and MaxChi, with ahighest acceptable P-value of 0.05 and a multiple comparisoncorrection by Bonferroni method. Sequences resulting recombinantwith at least three methods were excluded from further analysis.
The sequences have been submitted to GenBank (accession numbers:EF514251 to EF514260, EF514262 to EF514278, EF514283 and EF514284,
89G. Zehender et al. / Virology 380 (2008) 84–90
EF514287 to EF514304, EF514306 to EF514311, EF514313, EF514315 toEF514333, EF514335 to EF514337, EU908789 to EU908844).
Phylogenetic estimates and calculated evolutionary rates
The genealogies of two datasets of sequences of genotype A or Dwere estimated separately using maximum likelihood (ML) asimplemented in PAUP⁎ (Swofford D, 1998, Sinauer Ass. Inc. Publ.),and the best fitting substitution models and parameters were testedusing the hierarchical likelihood ratio test (LRT) implemented inModeltest 3.07 software (Posada and Crandall, 1998). An HKY model(Hasegawa et al., 1985) with a transition/transvertion ratio of 1.51 andγ-distributed rates among sites (α-shape parameter=0.19) wasselected for the A sequences, and a general time-reversible (GTR)model plus invariable sites (proportion=0.48) and γ-distributed ratesamong sites (α-shape parameter=0.71) for the D sequences.
The ML trees were heuristically searched by means of PAUP⁎ usinga stepwise addition algorithm to construct the starting tree and theTBR algorithm for branch swapping. Each tree was rooted using HBVgenotype F (Acc.N. AB036910 — Nakano et al., 2001) as the outgroup.
As the dates of isolation of our sequences were known, we used theTipDate (Rambaut, 2000) program for the ML estimates of evolu-tionary rates, divergence dates and confidence intervals under asingle-rate dated tips (SRDT) model, which is more relaxed than thesingle-rate molecular clock model. The statistical test was thelikelihood ratio test between SRDT and the unconstrained model(Rambaut, 2000).
Inferring demographic history
The past epidemiology of HBV was estimated using a statisticalmethod based on coalescent theory, according to which the demo-graphic history of a population can be inferred by the shape of a genegenealogy obtained by analysing a small sample of it (Kingman, 2000).The assumptions of the method employed is that genealogy isunaffected by recombination, that the evolutionary rate remains thesame throughout the genealogy, and that the sample size isconsiderably less than the entire population.
The underlying mathematics have been described in great detailelsewhere (Pybus et al., 2000). Using parametric and non-parametric approaches, it is possible to estimate the parametersϑ, corresponding to N (0)μ, and ρ, being r/μ, where N (t) is theeffective number of infections at time t (t=0 at present, and tN0 inthe past), μ the evolutionary rate, and r the growth rate of thepopulation. Six demographic models were considered: constant,exponential, expansion and, logistic, piecewise logistic and piece-wise expansion growth. Equations relating N (t) to other demo-graphic parameters under different models have been reportedelsewhere (Pybus et al., 2005).
The relative value (and 95% confidence interval) of ϑ and ρmaximising the likelihood were obtained for each model. A likelihoodratio test was used to test the goodness of fit of the data to eachmodel.Parameters, c (the shape of the curve) and α (the population size att=∞), which are not influenced by the time scale, were obtained forlogistic and expansion growth, respectively. The logistic shapeparameter correlates with the carrying capacity of the population(Pybus et al., 2001).
Non-parametric estimates of epidemic history were obtained bymeans of skyline plotting (Pybus et al., 2000). The plots show thenumber of effective infections (N (t) in the ordinates) versus time (t inthe abscises). The parametric and non-parametric curves wereindicated simultaneously.
R0 (defined as the basic reproductive number, and indicating themean number of secondary cases generated by a single primary case)was calculated from r using the equation R0= rD+1, where D is theaverage duration of infectiousness (Pybus et al., 2001). The doubling
time of the epidemic was given by the relation λ=ln(2) / r (Walker etal., 2005). All calculations and skyline plots were obtained usingGENIE (Pybus and Rambaut, 2002).
References
Chu, C.J., Keeffe, E.B., Han, S.H., Perrillo, R.P., Min, A.D., Soldevila-Pico, C., Carey, W.,Brown Jr., R.S., Luketic, V.A., Terrault, N., Lok, A.S., 2003. Hepatitis B virus genotypesin the United States: results of a nationwide study. Gastroenterology. 125, 444–451.
Cottam, E.M., Haydon, D.T., Paton, D.J., Gloster, J., Wilesmith, J.W., Ferris, N.P., Hutchings,G.H., King, D.P., 2006. Molecular epidemiology of the foot-and-mouth disease virusoutbreak in the United Kingdom in 2001. J. Virol. 80, 11274–11282.
DeMaddalena, C., Giambelli, C., Tanzi, E., Colzani, D., Schiavini, M., Milazzo, L., Bernini, F.,Ebranati, E., Cargnel, A., Bruno, R., Galli, M., Zehender, G., 2007. High level of geneticheterogeneity in S and P genes of genotype D hepatitis B virus. Virology. 365,113–124.
Drucker, E., Alcabes, P.G., Marx, P.A., 2001. The injection century: massive unsterileinjections and the emergence of human pathogens. Lancet. 358, 1989–1992.
Duffy, S., Shackelton, L.A., Holmes, E.C., 2008. Rates of evolutionary change in viruses:patterns and determinants. Nat. Rev. Genet. 9, 267–276.
Edmunds, W.J., Medley, G.F., Nokes, D.J., O'Callaghan, C.J., Whittle, H.C., Hall, A.J., 1996.Epidemiological patterns of hepatitis B virus (HBV) in highly endemic areas.Epidemiol. Infect. 117, 313–325.
Fares, M.A., Holmes, E.C., 2002. A revised evolutionary history of hepatitis B virus (HBV).J. Mol. Evol. 54, 807–814.
Gerlich, W.H., Caspari, G., 1999. Hepatitis viruses and the safety of blood donations. J.Viral. Hepat. 6 Suppl 1, 6–15.
Giangrande, P.L., 2000. The history of blood transfusion. Br. J. Haematol. 110, 758–767.Grenfell, B.T., Pybus, O.G., Gog, J.R., Wood, J.L., Daly, J.M., Mumford, J.A., Holmes, E.C.,
2004. Unifying the epidemiological and evolutionary dynamics of pathogens.Science. 303, 327–332.
Hannoun, C., Horal, P., Lindh, M., 2000. Long-termmutation rates in the hepatitis B virusgenome. J. Gen. Virol. 81, 75–83.
Hasegawa, M., Kishino, H., Yano, T., 1985. Dating of the human–ape splitting by amolecular clock of mitochondrial DNA. J. Mol. Evol. 22, 160–174.
Jenkins, G.M., Rambaut, A., Pybus, O.G., Holmes, E.C., 2002. Rates of molecular evolutionin RNA viruses: a quantitative phylogenetic analysis. J. Mol. Evol. 54, 156–165.
Kidd-Ljunggren, K., Miyakawa, Y., Kidd, A.H., 2002. Genetic variability in hepatitis Bviruses. J. Gen. Virol. 83, 1267–1280.
Kingman, J.F., 2000. Origins of the coalescent. 1974–1982. Genetics. 156, 1461–1463.Kitchen, A., Miyamoto, M.M., Mulligan, C.J., 2007. Utility of DNA viruses for studying
human host history: case study of JC virus. Mol. Phylogenet. Evol. 18, 18.Kretzschmar, M., de Wit, G.A., Smits, L.J., van de Laar, M.J., 2002. Vaccination against
hepatitis B in low endemic countries. Epidemiol. Infect. 128, 229–244.Medley, G.F., Lindop, N.A., Edmunds,W.J., Nokes, D.J., 2001. Hepatitis-B virus endemicity:
heterogeneity, catastrophic dynamics and control. Nat. Med. 7, 619–624.Mele, A., Stroffolini, T., Zanetti, A.R., 2002. Hepatitis B in Italy: where we are ten years
after the introduction of mass vaccination. J. Med. Virol. 67, 440–443.Nakano, T., Lu, L., Hu, X., Mizokami, M., Orito, E., Shapiro, C., Hadler, S., Robertson, B.,
2001. Characterization of hepatitis B virus genotypes among Yucpa Indians inVenezuela. J. Gen. Virol. 82, 359–365.
Norder, H., Courouce, A.M., Coursaget, P., Echevarria, J.M., Lee, S.D., Mushahwar, I.K.,Robertson, B.H., Locarnini, S., Magnius, L.O., 2004. Genetic diversity of hepatitis Bvirus strains derived worldwide: genotypes, subgenotypes, and HBsAg subtypes.Intervirology. 47, 289–309.
Norder, H., Courouce, A.M., Magnius, L.O., 1992. Molecular basis of hepatitis B virusserotype variations within the four major subtypes. J. Gen. Virol. 73 (Pt 12),3141–3145.
Okamoto, H., Imai, M., Kametani, M., Nakamura, T., Mayumi, M., 1987. Genomicheterogeneity of hepatitis B virus in a 54-year-old woman who contracted theinfection through materno-fetal transmission. Jpn. J. Exp. Med. 57, 231–236.
Okamoto, H., Tsuda, F., Sakugawa, H., Sastrosoewignjo, R.I., Imai, M., Miyakawa, Y.,Mayumi, M., 1988. Typing hepatitis B virus by homology in nucleotide sequence:comparison of surface antigen subtypes. J. Gen. Virol. 69, 2575–2583.
Orito, E., Mizokami, M., Ina, Y., Moriyama, E.N., Kameshima, N., Yamamoto, M., Gojobori, T.,1989.Host-independent evolution anda genetic classification of thehepadnavirus familybased on nucleotide sequences. Proc. Natl. Acad. Sci. U. S. A. 86, 7059–7062.
Osiowy, C., Giles, E., Tanaka, Y., Mizokami, M., Minuk, G.Y., 2006. Molecular evolution ofhepatitis B virus over 25 years. J Virol. 80, 10307–10314.
Posada, D., Crandall, K.A., 1998. MODELTEST: testing the model of DNA substitution.Bioinformatics. 14, 817–818.
Prati, D., 2006. Transmission of hepatitis C virus by blood transfusions and othermedical procedures: a global review. J. Hepatol. 45, 607–616.
Pybus, O.G., Charleston, M.A., Gupta, S., Rambaut, A., Holmes, E.C., Harvey, P.H., 2001.The epidemic behavior of the hepatitis C virus. Science. 292, 2323–2325.
Pybus, O.G., Cochrane, A., Holmes, E.C., Simmonds, P., 2005. The hepatitis C virusepidemic among injecting drug users. Infect Genet. Evol. 5, 131–139.
Pybus, O.G., Rambaut, A., 2002. GENIE: estimating demographic history frommolecularphylogenies. Bioinformatics. 18, 1404–1405.
Pybus,O.G., Rambaut, A.,Harvey, P.H., 2000.An integrated framework for the inferenceof viralpopulation history from reconstructed genealogies. Genetics. 155, 1429–1437.
Rambaut, A., 2000. Estimating the rate of molecular evolution: incorporating non-contemporaneous sequences into maximum likelihood phylogenies. Bioinfor-matics. 16, 395–399.

90 G. Zehender et al. / Virology 380 (2008) 84–90
Salemi, M., de Oliveira, T., Soares, M.A., Pybus, O., Dumans, A.T., Vandamme, A.M.,Tanuri, A., Cassol, S., Fitch, W.M., 2005. Different epidemic potentials of the HIV-1Band C subtypes. J. Mol. Evol. 60, 598–605.
Schierup, M.H., Hein, J., 2000. Recombination and the molecular clock. Mol. Biol. Evol.17, 1578–1579.
Snapinn, K.W., Holmes, E.C., Young, D.S., Bernard, K.A., Kramer, L.D., Ebel, G.D., 2007.Declining growth rate of West Nile virus in North America. J. Virol. 81,2531–2534.
Spada, E., Mele, A., Ciccozzi, M., Tosti, M.E., Bianco, E., Szklo, A., Ragni, P., Gallo, G.,Balocchini, E., Sangalli, M., Lopalco, P.L., Moiraghi, A., Stroffolini, T., 2001. Changingepidemiology of parenterally transmitted viral hepatitis: results from the hepatitissurveillance system in Italy. Dig. Liver Dis. 33, 778–784.
Stroffolini, T., 2005. The changing pattern of hepatitis B virus infection over the pastthree decades in Italy. Dig. Liver Dis. 37, 622–627.
Stuyver, L.J., Locarnini, S.A., Lok, A., Richman, D.D., Carman, W.F., Dienstag, J.L., Schinazi,R.F., 2001. Nomenclature for antiviral-resistant human hepatitis B virus mutationsin the polymerase region. Hepatology. 33, 751–757.
Verbeeck, J., Maes, P., Lemey, P., Pybus, O.G., Wollants, E., Song, E., Nevens, F.,Fevery, J., Delport, W., Van der Merwe, S., Van Ranst, M., 2006. Investigatingthe origin and spread of hepatitis C virus genotype 5a. J. Virol. 80,4220–4226.
Walker, P.R., Pybus, O.G., Rambaut, A., Holmes, E.C., 2005. Comparative populationdynamics of HIV-1 subtypes B and C: subtype-specific differences in patterns ofepidemic growth. Infect Genet. Evol. 5, 199–208.
Wasley, A., Miller, J.T., Finelli, L., 2007. Surveillance for acute viral hepatitis—UnitedStates, 2005. MMWR. Surveill. Summ. 56, 1–24.
Zanetti, A.R., Romano, L., Zappa, A., Velati, C., 2006. Changing patterns of hepatitis Binfection in Italy and NAT testing for improving the safety of blood supply. J. Clin.Virol. 36 Suppl 1, S51–55.
Zehender, G., De Maddalena, C., Milazzo, L., Piazza, M., Galli, M., Tanzi, E., Bruno, R.,2003. Hepatitis B virus genotype distribution in HIV-1 coinfected patients.Gastroenterology 125, 1559–1560 author reply 1660.
Zhou, Y., Holmes, E.C., 2007. Bayesian estimates of the evolutionary rate and age ofhepatitis B virus. J. Mol. Evol. 65, 197–205.