Developmental Progress of the Nanoparticle Field Extraction Thruster
16
American Institute of Aeronautics and Astronautics 092407 1 Developmental Progress of the Nanoparticle Field Extraction Thruster Thomas M. Liu * , Brittany D. Drenkow † , Louis D. Musinski ‡ , Alec D. Gallimore § , Brian E. Gilchrist ** , and Joanna Mirecki-Millunchick †† University of Michigan, Ann Arbor, MI, 48109 David P. Morris ‡‡ ElectroDynamic Applications, Inc., Ann Arbor, MI, 48105 Alexandra L. Doan §§ , Joseph L. Munski *** , and Allison M. Muldoon ††† University of Michigan, Ann Arbor, MI, 48109 The Nanoparticle Field Extraction Thruster (NanoFET) is an electrostatic accelerator technology currently under development at the University of Michigan to accelerate micro-/ nano-particles. The concept exists in two configurations: the liquid configuration stores and transports particulate propellant using microfluidics while the dry configuration eliminates the liquid feed system in favor of particle transport via piezoelectric actuators. Microgravity flight tests of the liquid-NanoFET concept indicate good agreement with theory regarding the threshold electric field for liquid surface instabilities. This threshold electric field was observed to increase in low Bond number systems as the channel diameter decreased and appeared to be governed by the largest characteristic channel orifice dimension. Particle liftoff and extraction from both liquid- and air-filled reservoirs were also demonstrated in the microgravity environment. On the ground, preliminary experiments showed that particle liftoff electric fields could be reduced with the application of inertial accelerations from piezoelectrics to the charging electrode. Both the recent microgravity and ground test results for the NanoFET concept are presented. * Graduate Student, Aerospace Engineering, [email protected], AIAA Student Member † Undergraduate Student, Aerospace Engineering, [email protected], AIAA Student Member ‡ Graduate Student, Electrical Engineering, [email protected], AIAA Student Member § Arthur F. Thurnau Professor, Aerospace Engineering & Applied Physics, [email protected], AIAA Associate Fellow ** Professor, Electrical Engineering & Space Systems, [email protected], AIAA Associate Fellow †† Associate Professor, Materials Science and Engineering, [email protected] ‡‡ Senior Engineer, [email protected], AIAA Member §§ Undergraduate Student, Mechanical Engineering, [email protected] *** Undergraduate Student, Aerospace Engineering, [email protected] ††† Undergraduate Student (Research Experience for Undergraduates participant from College of Mount St. Joseph, Cincinnati, OH), Chemistry, [email protected] 44th AIAA/ASME/SAE/ASEE Joint Propulsion Conference & Exhibit 21 - 23 July 2008, Hartford, CT AIAA 2008-5096 Copyright © 2008 by the American Institute of Aeronautics and Astronautics, Inc. All rights reserved.
-
Upload
independent -
Category
Documents
-
view
4 -
download
0
Transcript of Developmental Progress of the Nanoparticle Field Extraction Thruster
American Institute of Aeronautics and Astronautics
092407
1
Developmental Progress of the Nanoparticle Field
Extraction Thruster
Thomas M. Liu*, Brittany D. Drenkow†, Louis D. Musinski‡, Alec D. Gallimore§, Brian E. Gilchrist**, and Joanna Mirecki-Millunchick††
University of Michigan, Ann Arbor, MI, 48109
David P. Morris‡‡ ElectroDynamic Applications, Inc., Ann Arbor, MI, 48105
Alexandra L. Doan§§, Joseph L. Munski***, and Allison M. Muldoon††† University of Michigan, Ann Arbor, MI, 48109
The Nanoparticle Field Extraction Thruster (NanoFET) is an electrostatic accelerator
technology currently under development at the University of Michigan to accelerate micro-/
nano-particles. The concept exists in two configurations: the liquid configuration stores and
transports particulate propellant using microfluidics while the dry configuration eliminates
the liquid feed system in favor of particle transport via piezoelectric actuators. Microgravity
flight tests of the liquid-NanoFET concept indicate good agreement with theory regarding
the threshold electric field for liquid surface instabilities. This threshold electric field was
observed to increase in low Bond number systems as the channel diameter decreased and
appeared to be governed by the largest characteristic channel orifice dimension. Particle
liftoff and extraction from both liquid- and air-filled reservoirs were also demonstrated in
the microgravity environment. On the ground, preliminary experiments showed that
particle liftoff electric fields could be reduced with the application of inertial accelerations
from piezoelectrics to the charging electrode. Both the recent microgravity and ground test
results for the NanoFET concept are presented.
* Graduate Student, Aerospace Engineering, [email protected], AIAA Student Member † Undergraduate Student, Aerospace Engineering, [email protected], AIAA Student Member ‡ Graduate Student, Electrical Engineering, [email protected], AIAA Student Member § Arthur F. Thurnau Professor, Aerospace Engineering & Applied Physics, [email protected], AIAA Associate Fellow ** Professor, Electrical Engineering & Space Systems, [email protected], AIAA Associate Fellow †† Associate Professor, Materials Science and Engineering, [email protected] ‡‡ Senior Engineer, [email protected], AIAA Member §§ Undergraduate Student, Mechanical Engineering, [email protected] *** Undergraduate Student, Aerospace Engineering, [email protected] ††† Undergraduate Student (Research Experience for Undergraduates participant from College of Mount St. Joseph, Cincinnati, OH), Chemistry, [email protected]
44th AIAA/ASME/SAE/ASEE Joint Propulsion Conference & Exhibit21 - 23 July 2008, Hartford, CT
AIAA 2008-5096
Copyright © 2008 by the American Institute of Aeronautics and Astronautics, Inc. All rights reserved.

American Institute of Aeronautics and Astronautics
092407
2
Nomenclature
aI = inertial acceleration aI
* = critical inertial acceleration a0 = distance of closest approach between surfaces Bo = Bond number Bo* = critical Bond number d = particle diameter E = applied electric field Ec = charging electric field EG = minimum electric field to overcome gravitational forces Elift = particle liftoff electric field Emin = minimum electric field to initiate liquid surface instability FA = adhesion force FE = electrostatic force FG = gravitational force FI = inertial force g = gravitational acceleration h = Lifshitz constant hc = capillary height Isp = specific impulse L = characteristic length of system l = slot orifice length q0 = initial particle charge T = characteristic Taylor cone formation time trise = pulse rise time t99% = pulse settling time to 99% of nominal pulse height w = slot orifice width xp = piezoelectric actuator displacement
= image charge factor = knife-edge expansion angle = surface tension coefficient = orifice diameter = critical orifice diameter = permittivity of ambient environment
l = liquid permittivity
r = relative permittivity
0 = free space permittivity
c = liquid equilibrium contact angle = particle mass density
l = liquid mass density
0 = mass density of ambient environment
l = liquid electrical conductivity
c = characteristic charging time
American Institute of Aeronautics and Astronautics
092407
3
I. Introduction
HE Nanoparticle Field Extraction Thruster (NanoFET) is an electrostatic micro-/ nano-particle accelerator technology that is being developed for use as an electric propulsion system. Conceptually, NanoFET employs
micro-/ nano-electromechanical systems (MEMS/ NEMS) to transport, charge, and accelerate conductive particles.1 A stack of electrode gates is electrically biased to provide the necessary charging and accelerating electric fields, with charged particle passage through arrays of channels etched through the MEMS electrode stack.2 By electrostatically charging the particulate propellant, NanoFET achieves flexibility in adjusting the propellant’s specific charge and in performing dynamic retasking of the host spacecraft. Other potential benefits include NanoFET’s flat-panel array being scalable to accommodate propulsive needs and, by using solid propellants, NanoFET’s improved propulsion system packaging efficiency and increased density-Isp. A separate neutralizer is also not necessary since NanoFET can operate in a bipolar manner to be a self-neutralizing thruster. 3
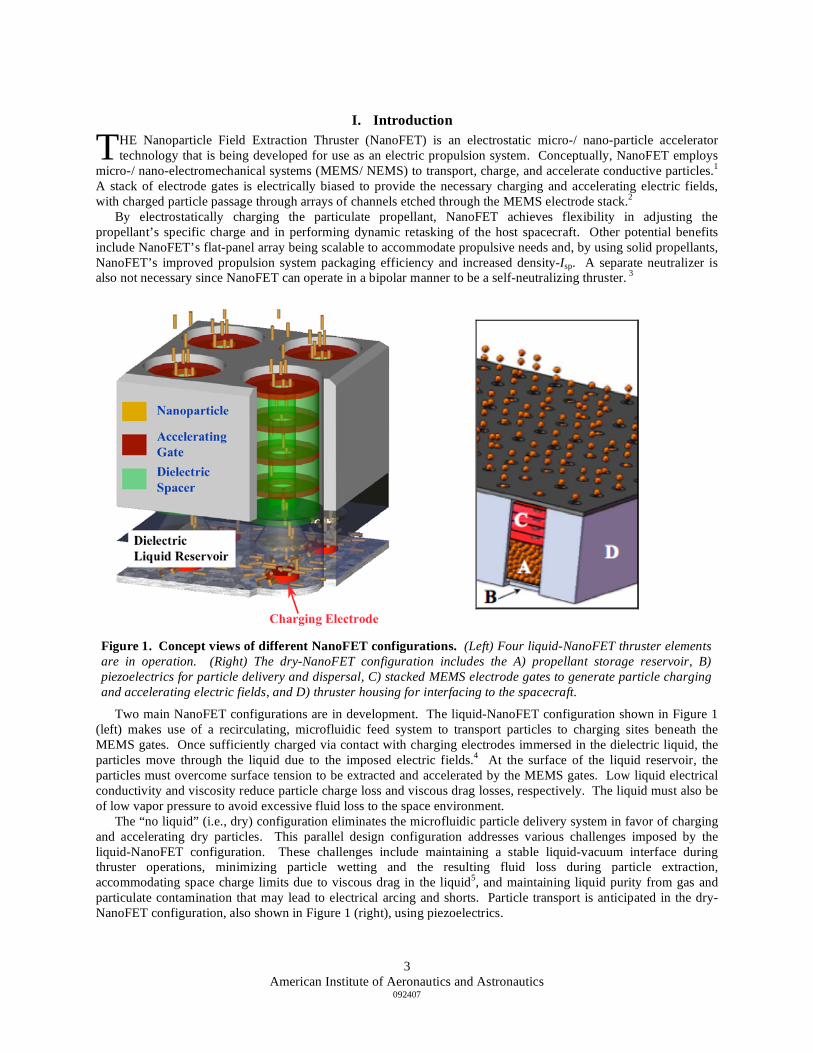
Two main NanoFET configurations are in development. The liquid-NanoFET configuration shown in Figure 1 (left) makes use of a recirculating, microfluidic feed system to transport particles to charging sites beneath the MEMS gates. Once sufficiently charged via contact with charging electrodes immersed in the dielectric liquid, the particles move through the liquid due to the imposed electric fields.4 At the surface of the liquid reservoir, the particles must overcome surface tension to be extracted and accelerated by the MEMS gates. Low liquid electrical conductivity and viscosity reduce particle charge loss and viscous drag losses, respectively. The liquid must also be of low vapor pressure to avoid excessive fluid loss to the space environment. The “no liquid” (i.e., dry) configuration eliminates the microfluidic particle delivery system in favor of charging and accelerating dry particles. This parallel design configuration addresses various challenges imposed by the liquid-NanoFET configuration. These challenges include maintaining a stable liquid-vacuum interface during thruster operations, minimizing particle wetting and the resulting fluid loss during particle extraction, accommodating space charge limits due to viscous drag in the liquid5, and maintaining liquid purity from gas and particulate contamination that may lead to electrical arcing and shorts. Particle transport is anticipated in the dry-NanoFET configuration, also shown in Figure 1 (right), using piezoelectrics.
T
Figure 1. Concept views of different NanoFET configurations. (Left) Four liquid-NanoFET thruster elements are in operation. (Right) The dry-NanoFET configuration includes the A) propellant storage reservoir, B) piezoelectrics for particle delivery and dispersal, C) stacked MEMS electrode gates to generate particle charging and accelerating electric fields, and D) thruster housing for interfacing to the spacecraft.

American Institute of Aeronautics and Astronautics
092407
4
The following sections discuss recent development work on both NanoFET configurations. More details regarding the “no liquid” configuration’s design and initial prototype test results are presented in a companion paper.6
II. Liquid-NanoFET: Preventing Electrohydrodynamic Instabilities
A spherical particle in contact with a charging electrode and exposed to a uniform electric field acquires the charge7
q0 =3
6Ecd
2, (1)
where is the permittivity of the medium about the particle. The specific charge is therefore directly proportional to the charging electric field. Whereas the maximum allowable charging electric field is limited by electron field emission in the dry-NanoFET configuration8, the liquid-NanoFET system has two other limiting factors. The first consideration is the liquid’s dielectric strength so as to avoid electrical breakdown. The second, possibly lower limit is the threshold for liquid surface instabilities.
When a liquid surface is subjected to sufficiently high electric fields, the resulting electric pressure on the charged liquid surface can overcome gravity and surface tension. The result is the formation of Taylor cones on the liquid surface that may result in the ejection of liquid droplets as in a colloid thruster. Such features are undesirable for NanoFET because they lead to fluid loss in the system as well as reduced thrust precision due to a distribution of specific charge in the droplets.
Following Tonks’s approach9, diagramed in Figure 2, a balance of electrostatic, hydrostatic, and surface tension forces at the liquid surface results in the liquid surface first becoming unstable at an applied electric field of
Emin =4 lg
02
1
4
. (2)
If the derivation is redone by neglecting gravitational forces for a system in which the Bond number
Bo lgL2
(3)
is much smaller than the critical value Bo*, then the threshold for liquid surface instability becomes
Emin =8
0
1
2
, (4)
Figure 2. Free-body diagram for Tonks’s derivation of the liquid
surface instability threshold. The derivation assumes that the free liquid surface is uniformly charged and that the incipient distortion ( y 2 ) on the liquid surface is a hemispherical boss of radius R.

American Institute of Aeronautics and Astronautics
092407
5
where /2 is defined in Figure 2 as the effective perturbation hump diameter. Note that the instability threshold, which is independent of a spatial scale when gravitational effects are important, varies with the inverse square root of the system’s characteristic length when gravitational effects are negligible.
A. NanoBLUE Microgravity Flight Experiments
In cooperation with the University of Michigan Student Space Systems Fabrication Laboratory, a student-led organization dedicated to providing university students with practical space systems design-build-test-fly experiences10, a series of microgravity experiments were flown by the undergraduate NanoBLUE team through NASA’s Reduced Gravity Student Flight Opportunities Program.11 The preliminary microgravity flights in May 2007 showed the feasibility of using knife-edge orifices as passive valves to pin liquid surfaces in microgravity; flight data also suggested that liquid surface instabilities become more difficult to excite as the orifice diameter decreases.12
For the 2008 flights, refinements in the test setup were implemented to accomplish the following objectives: • Determine in microgravity the electric field thresholds for liquid surface instabilities and observe the
liquid-wall interactions in knife-edge orifices of different geometric configurations. • Demonstrate in microgravity the liftoff of particles from charging electrodes and extraction through the
liquid surface. 1. Test Cell Design
Polycarbonate test cells were used to contain the test liquid in flight. A dual-channel configuration for the test cells housed independent test channels, thereby permitting one channel to be tested while monitoring the adjacent passive channel for microgravity effects. Following a previous microgravity experiment13, knife-edge orifices were fabricated from polycarbonate plates to pin the liquid surface and prevent the test liquid from climbing the channel walls due to capillary effects. The knife-edge orifice functions due to the principle that a pressure barrier develops when the cross-section of a channel abruptly enlarges; for the knife-edge geometry shown in Figure 3, a
passive valve is formed if
> 90c.14 Knife-
edges used in flight all have an expansion angle of 90°.
As shown in Figure 4, each test cell channel housed a stainless steel electrode flush with the bottom of the channel. An electrode was biased to high voltage to charge the liquid, and an electric field was generated between the charged liquid surface and the grounded glass anode coated with indium tin oxide (ITO). The test cells were sealed against leaks by rubber Buna-N gaskets at the transparent front and back faceplates.
A different set of test cells, shown in Figure 5, were used for liftoff and extraction
demonstrations using 2017-aluminum spheres (1.98 ± 0.03 mm in diameter). Three sets of knife-edge orifice and accelerating grid aperture geometries (a single 25.4-mm diameter circular orifice, three 7.94-mm diameter circular orifices, and a single slot orifice of width 7.94 mm and length 28.58 mm) were used. Whereas soybean oil was used for the liquid surface instability studies due to its low characteristic charging time ( c = l/ l) permitting the liquid surface to become fully charged during each microgravity test period, the particle test cells used 50-cSt silicone oil, whose low electrical conductivity reduced particle charge loss to the liquid. Properties of the test liquids are listed in Table 1.
Figure 3. Charged liquid surface pinned at the knife-edge.
Equipotential lines indicate an intensification of the applied electric field at the knife-edge ( = 90° in the figure).
Liquid Specific
Density r l
[S/m]
[mN/m] c
[deg]
Soybean oil
0.910 3.2 ± 0.3
2 10-3 30.1 15.9
Silicone oil
0.963 2.1 ± 0.1
3 10-13 20.8 30.7
Table 1. Physical properties of microgravity test liquids.
Values are for 25 °C and are usable for actual test conditions. The equilibrium contact angles to polycarbonate were measured via confocal laser scanning microscopy.

American Institute of Aeronautics and Astronautics
092407
6
Figure 4. Dual-channel test cell design for observing liquid surface instabilities in microgravity. The test cells used in flight included both circular (top left) and slot (bottom left) knife-edge orifices. The ends of the slots are semicircles. (Top right) The back of a test cell houses electrical connections to the high-voltage charging electrodes and the grounded ITO anode. (Bottom right) Liquid is filled to just below the knife-edge, leaving an air gap from the knife-edge to the anode.
Figure 5. Test cell design for demonstrating particle liftoff and extraction in microgravity. (Left) The stack configuration contains an accelerating grid that is electrically grounded to the ITO anode. (Right) Particles are charged via three stainless steel electrodes that are in contact with particles at the bottom of the liquid reservoir.

American Institute of Aeronautics and Astronautics
092407
7
2. Experiment Setup The experiment layout onboard the NASA C-9B aircraft is shown in Figure 6. A Glassman EH30N3 negative-polarity, high-voltage power supply (HVPS) was commanded remotely via a LabVIEW-controlled Keithley 2400 sourcemeter. A Gigavac high-voltage single-pole/ double-throw relay connected the pin-switch power distribution system to either the HVPS (to bias test cells) or to a high-power resistor (to discharge the test cells in between tests). This pin-switch power distribution system, when activated via manual switches, permitted specific test channels to be electrically biased. The experiment’s aluminum unistrut frame served as the electrical ground through direct bolting to the aircraft cabin floor.
Two camcorders were mounted on a sliding track to view the test cells during flight. A Sony DCR-DVD505 Handycam provided a front view of the test cell, and its 240-fps record mode was used to capture particle dynamics during the particle liftoff and extraction demonstrations. A Sony DCR-HC26 Handycam provided the top view of the test cells at 30 fps. I-V data was obtained with a Keithley KUSB-3102 data acquisition module connected to a Panasonic Toughbook 52 semi-rugged laptop running the LabVIEW test code. Three-axis accelerometer readings from the aircraft were recorded, and both the aircraft cabin temperature and relative humidity were monitored in flight. A detailed discussion of the experiment design process is presented in a companion paper.15 3. Flight Operations Two sets of parabolic flights were conducted in June 2008 with each parabola providing approximately 20 seconds of microgravity test time. On average, the aircraft cabin had a temperature of 16 ± 2 °C with a relative humidity of 15 ± 3% during the flights. During microgravity periods, the HVPS increased the voltage bias to the liquid instability test cells by 1-kV steps every second, as seen in Figure 7. This voltage profile was implemented so that each test voltage set point may be held for at least the duration of the characteristic Taylor cone formation time16
T = 33/2E 3
l
03
1
2
. (5)
Figure 6. Subsystem interactions in the NanoBLUE microgravity experiment. Multiple test cells were connected to the pin-switch power distribution system. AC power and flight accelerometer readings were provided by the aircraft.

American Institute of Aeronautics and Astronautics
092407
8
For soybean oil under the test conditions, the characteristic Taylor cone formation times are less than 0.3 s, thus justifying the applied voltage profile. A single test channel or particle extraction cell was tested during each microgravity period, which was followed by about 50 s of up to 1.8-g exposure. No tests were performed during these high-gravity periods.
B. Test Results and Discussion
Prior to flight, each test cell was filled such that the liquid meniscus remained below the top of the knife-edge. In microgravity, the meniscus level decreased from its preflight height, suggesting liquid climbing of the knife-edge shelf walls. However, no liquid spillage out of the passive valves prior to Taylor cone formation was apparent with the application of electric fields during testing.
Figure 8 shows a typical Taylor cone formation observed during flight, with cone formation occurring at the knife-edge rather than within the orifice. As shown in Figure 3, the liquid must maintain its equilibrium contact angle with the wall while pinned at the knife-edge, resulting in a liquid surface that is concave upwards. Consequently, the electric field is intensified at the knife-edge’s triple junction, where Taylor cones would be expected to form first. Some liquid spilled from the larger knife-edge orifices during aircraft takeoff; however, subsequent Taylor cone formation occurred away from these spill sites, suggesting that the spills did not impact test results.
With the charged liquid pinned at the knife-edge in microgravity, the effective gap distance may be assumed to be the separation of the ITO anode from the top of the knife-edge. On the ground, the effective gap distance is the nominal fill height (i.e., midway between the bottom and top of the knife-edge shelf) corrected for the capillary climb height
Figure 7. Microgravity test conditions. Time elapsed since the start of the microgravity test period is shown along with representative in-flight sensor data.
Figure 8. Soybean oil Taylor cone formation in microgravity. (Left) Two cones (circled) are visible for the 30-mm diameter knife-edge orifice. (Right) Front view of the same test cell shows the Taylor cones (arrows) along with associated liquid escape from the passive valve, resulting in a dip in the liquid meniscus.
American Institute of Aeronautics and Astronautics
092407
9
hc =4 cos c
lg. (6)
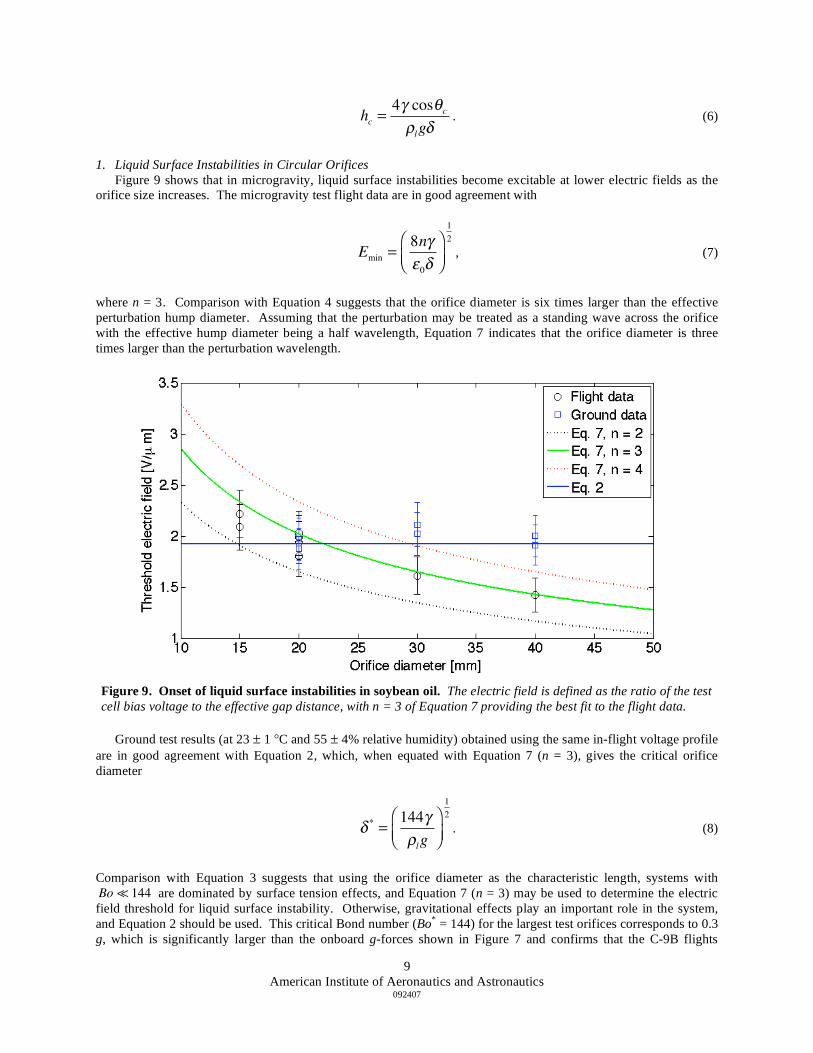
1. Liquid Surface Instabilities in Circular Orifices Figure 9 shows that in microgravity, liquid surface instabilities become excitable at lower electric fields as the orifice size increases. The microgravity test flight data are in good agreement with
Emin =8n
0
1
2
, (7)
where n = 3. Comparison with Equation 4 suggests that the orifice diameter is six times larger than the effective perturbation hump diameter. Assuming that the perturbation may be treated as a standing wave across the orifice with the effective hump diameter being a half wavelength, Equation 7 indicates that the orifice diameter is three times larger than the perturbation wavelength.
Ground test results (at 23 ± 1 °C and 55 ± 4% relative humidity) obtained using the same in-flight voltage profile are in good agreement with Equation 2, which, when equated with Equation 7 (n = 3), gives the critical orifice diameter
*=144
lg
1
2
. (8)
Comparison with Equation 3 suggests that using the orifice diameter as the characteristic length, systems with Bo 144 are dominated by surface tension effects, and Equation 7 (n = 3) may be used to determine the electric field threshold for liquid surface instability. Otherwise, gravitational effects play an important role in the system, and Equation 2 should be used. This critical Bond number (Bo* = 144) for the largest test orifices corresponds to 0.3 g, which is significantly larger than the onboard g-forces shown in Figure 7 and confirms that the C-9B flights
Figure 9. Onset of liquid surface instabilities in soybean oil. The electric field is defined as the ratio of the test cell bias voltage to the effective gap distance, with n = 3 of Equation 7 providing the best fit to the flight data.

American Institute of Aeronautics and Astronautics
092407
10
provided a test environment sufficient to examine systems dominated by surface tension effects. For soybean oil on the ground, the critical orifice diameter is about 22 mm; as the orifice size decreases from this critical value, the system is expected to be increasingly governed by surface tension effects and Equation 7. However, testing of smaller orifices was limited by electrical breakdown in the test cell air gap, especially during ground tests due to the higher humidity levels. 2. Liquid Surface Instabilities in Slot Orifices As shown in Figure 4, slot knife-edged orifices can be specified by two dimensions, the length l and width w. Figure 10 shows the test results for slots with a length of 30 mm. The flight data, with a modest range of slot aspect ratios tested, suggest that in the low Bond number regime, Equation 7 may be used for slot orifices by setting = l. This approach is equivalent to stating that the largest orifice dimension determines the characteristic length. As with the circular orifices, Taylor cones formed at the knife-edges rather than within the orifice.
On the ground, test data display good agreement with Equation 2. Use of the smaller slot width dimensions as the characteristic length still results in Bond numbers on the order of Bo*. Therefore even for the larger slot aspect ratios, gravitational effects remained important in the system for the ground tests, thus justifying the fit to Equation 2. 3. Particle Liftoff and Extraction Particle liftoff from an immersed charging electrode and subsequent extraction from the surface of a dielectric liquid had been previously demonstrated on the ground.17 Demonstrations for particle extraction in microgravity were conducted by applying a constant 21-kV bias to the particle test cells for less than 5 s during each microgravity period. Silicone oil, which was filled on the ground to the bottom of the knife-edge shelf, has a characteristic charging time of over a minute; consequently, the silicone oil did not experience significant charging during these tests. Three particles were present in each test cell and charged on electrodes that were separated by five particle diameters. During aircraft takeoff, some of the particles came off the charging electrodes due to sloshing in the liquid reservoirs and were not charged during testing. Figure 11 shows one of the successfully charged particles liftoff and extract through silicone oil during a microgravity flight. The transit time through the liquid was less than 0.2 s, so the particle experienced negligible charge loss to the silicone oil. During the extraction process, which wetted the particle, the particle induced liquid instability and caused silicone oil to splash out of the knife-edge
Figure 10. Behavior of slot knife-edge orifices (l = 30 mm) in microgravity for soybean oil. Unity aspect ratio refers to circular orifices.

American Institute of Aeronautics and Astronautics
092407
11
orifice. This phenomenon needs to be examined in more depth to understand possible constraints on the liquid-NanoFET configuration. A set of particle test cells without any liquid was also flown. Particles from these cells were lifted off the charging electrodes and accelerated towards the ITO anodes upon application of the 21-kV bias.
III. Dry-NanoFET: Impulse-Assisted
Particle Liftoff
Whereas the presence of a liquid may be used to reduce the cohesive forces among particles and the adhesive force between particles and the charging electrode, the dry-NanoFET configuration must overcome these forces by other means. Current designs for the dry-NanoFET configuration propose using piezoelectric actuators to provide inertial forces for enabling the liftoff and acceleration of individual particles. Previous research has already shown the feasibility of using piezoelectrics to manipulate micro-particles.18
A. Piezoelectric-Driven Charging Electrode
Consider a spherical particle in contact with a smooth, planar electrode. The van der Waals adhesive force scales linearly with particle size as
FA =1
16
h
a02d , (9)
with a0 typically set at 0.4 nm.19 This adhesion force may be overcome by applying a sufficiently high electric field. Using Equation 1, the resulting electrostatic force is
FE = q0Ec =
3
6Ec2d 2 , (10)
with = 0.832 to account for the image charge effect. By accounting for the gravitational force
FG =6 0( )gd 3 , (11)
the electric field required for particle liftoff from the electrode satisfies
Elift2=12 ( )
1 3
8 2
h
a02d 1
± 0( )gd , (12)
depending on the direction of the gravity vector. By adding an inertial force of magnitude
FI = 6aId
3 (13)
Figure 11. Microgravity particle liftoff and extraction
from silicone oil. The particle centroid is plotted for every 1/120 s following particle charging. A splash (arrow) is visible following particle extraction.
American Institute of Aeronautics and Astronautics
092407
12
to the particle, the liftoff electric field may be reduced by
Elift2=12
aI d . (14)
In an inertial reference frame, this inertial force may be imparted to the particle by accelerating the charging electrode. Piezoelectric actuators, devices that undergo mechanical deformation due to crystalline polarization effects when subjected to an applied electric field, represent an attractive means of generating such accelerations with their high spatial resolutions, quick response times, low power consumption, and compact form factors. The ability to adjust the particle liftoff electric field would provide the dry-NanoFET configuration with added flexibility to tune its performance.
B. Proof-of-Concept Experiments
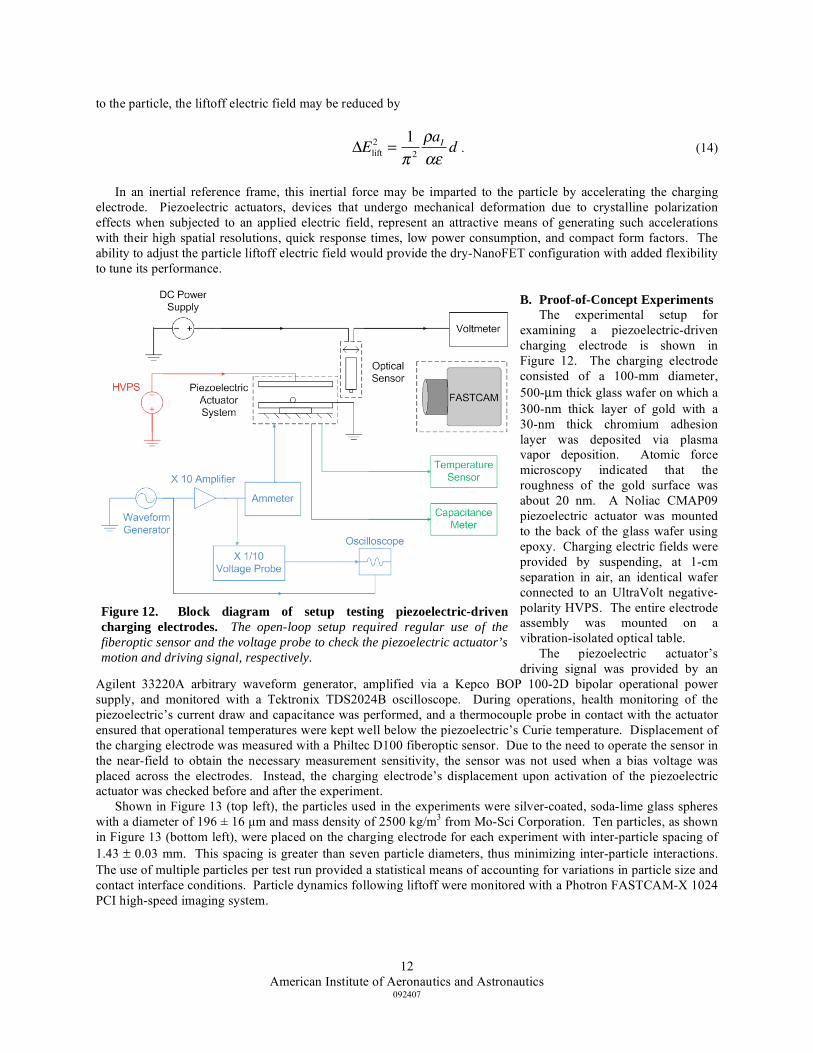
The experimental setup for examining a piezoelectric-driven charging electrode is shown in Figure 12. The charging electrode consisted of a 100-mm diameter, 500-μm thick glass wafer on which a 300-nm thick layer of gold with a 30-nm thick chromium adhesion layer was deposited via plasma vapor deposition. Atomic force microscopy indicated that the roughness of the gold surface was about 20 nm. A Noliac CMAP09 piezoelectric actuator was mounted to the back of the glass wafer using epoxy. Charging electric fields were provided by suspending, at 1-cm separation in air, an identical wafer connected to an UltraVolt negative-polarity HVPS. The entire electrode assembly was mounted on a vibration-isolated optical table. The piezoelectric actuator’s driving signal was provided by an
Agilent 33220A arbitrary waveform generator, amplified via a Kepco BOP 100-2D bipolar operational power supply, and monitored with a Tektronix TDS2024B oscilloscope. During operations, health monitoring of the piezoelectric’s current draw and capacitance was performed, and a thermocouple probe in contact with the actuator ensured that operational temperatures were kept well below the piezoelectric’s Curie temperature. Displacement of the charging electrode was measured with a Philtec D100 fiberoptic sensor. Due to the need to operate the sensor in the near-field to obtain the necessary measurement sensitivity, the sensor was not used when a bias voltage was placed across the electrodes. Instead, the charging electrode’s displacement upon activation of the piezoelectric actuator was checked before and after the experiment. Shown in Figure 13 (top left), the particles used in the experiments were silver-coated, soda-lime glass spheres with a diameter of 196 ± 16 μm and mass density of 2500 kg/m3 from Mo-Sci Corporation. Ten particles, as shown in Figure 13 (bottom left), were placed on the charging electrode for each experiment with inter-particle spacing of 1.43 ± 0.03 mm. This spacing is greater than seven particle diameters, thus minimizing inter-particle interactions. The use of multiple particles per test run provided a statistical means of accounting for variations in particle size and contact interface conditions. Particle dynamics following liftoff were monitored with a Photron FASTCAM-X 1024 PCI high-speed imaging system.
Figure 12. Block diagram of setup testing piezoelectric-driven
charging electrodes. The open-loop setup required regular use of the fiberoptic sensor and the voltage probe to check the piezoelectric actuator’s motion and driving signal, respectively.

American Institute of Aeronautics and Astronautics
092407
13
C. Test Results and Discussion
Square pulses of different rise times were sent to the piezoelectric actuator, resulting in effective inertial accelerations of approximately
aIxp
triset99%
, (15)
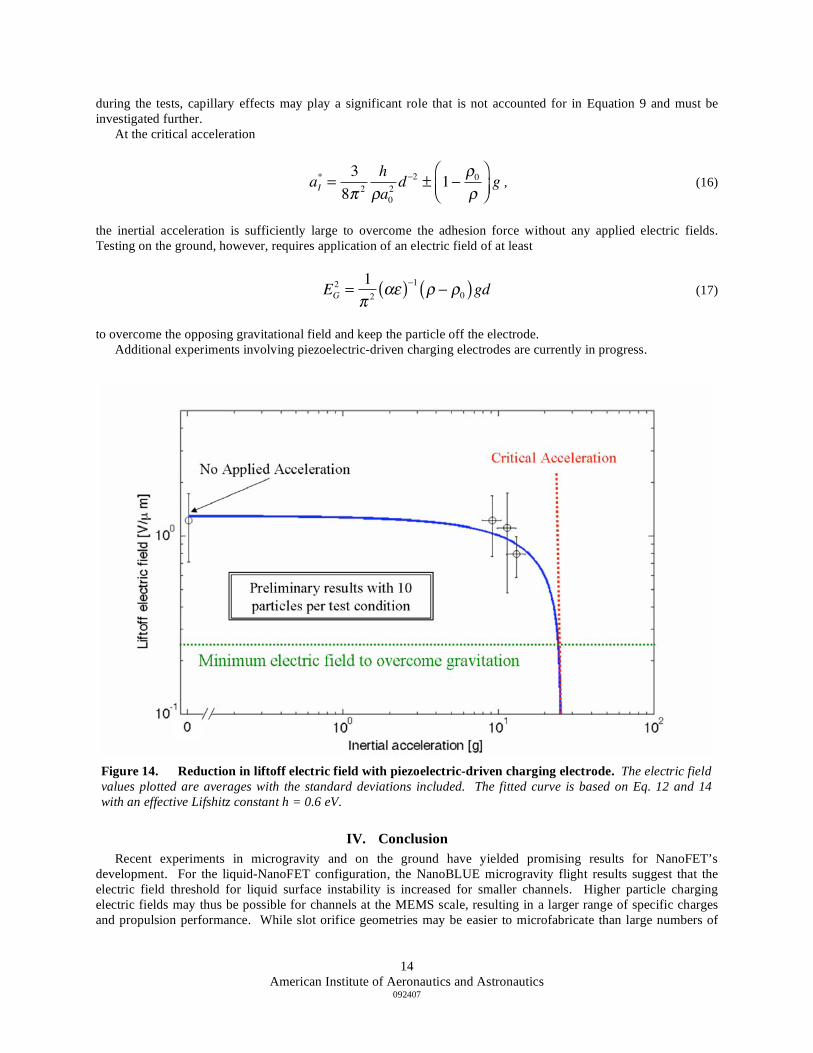
with t99% defined as the settling time from the peak pulse overshoot to 99% of the nominal pulse height. These pulses were at a frequency of 10 Hz (1% duty cycle), which is below the fundamental frequency of the system, and the piezoelectric actuator was kept within its linear operating regime. All tests were conducted under ambient conditions of 24 ± 1 °C and 49 ± 1% relative humidity. Figure 14 shows preliminary results from this experiment with the liftoff electric field decreasing as higher inertial accelerations were applied. At each acceleration test case, the particles displayed a large range of liftoff electric fields, suggesting the impact of variations in local surface conditions. Due to the high humidity levels
Figure 13. Piezoelectric-driven charging electrode experiment. The tests measured the electric fields required to lift silver-coated glass spheres (top left) from a gold electrode (bottom left) accelerated by a mounted piezoelectric actuator driven by pulses (top right). Particles that (B) remained adhered to the electrode at an applied charging electric field lifted off (A) when the electrode was sufficiently accelerated.
American Institute of Aeronautics and Astronautics
092407
14
during the tests, capillary effects may play a significant role that is not accounted for in Equation 9 and must be investigated further. At the critical acceleration
aI*=
3
8 2
h
a02d 2
± 1 0 g , (16)
the inertial acceleration is sufficiently large to overcome the adhesion force without any applied electric fields. Testing on the ground, however, requires application of an electric field of at least
EG2=12 ( )
1
0( )gd (17)
to overcome the opposing gravitational field and keep the particle off the electrode. Additional experiments involving piezoelectric-driven charging electrodes are currently in progress.
IV. Conclusion
Recent experiments in microgravity and on the ground have yielded promising results for NanoFET’s development. For the liquid-NanoFET configuration, the NanoBLUE microgravity flight results suggest that the electric field threshold for liquid surface instability is increased for smaller channels. Higher particle charging electric fields may thus be possible for channels at the MEMS scale, resulting in a larger range of specific charges and propulsion performance. While slot orifice geometries may be easier to microfabricate than large numbers of
Figure 14. Reduction in liftoff electric field with piezoelectric-driven charging electrode. The electric field values plotted are averages with the standard deviations included. The fitted curve is based on Eq. 12 and 14 with an effective Lifshitz constant h = 0.6 eV.

American Institute of Aeronautics and Astronautics
092407
15
circular orifices, the trade-off must be evaluated between manufacturing ease and the reduction in the maximum allowable charging electric field relative to an array of circular orifices.
For the dry-NanoFET configuration, preliminary ground test results have demonstrated the ability to reduce particle liftoff electric fields with the use of inertial accelerations provided to the charging electrode. This phenomenon provides the dry-NanoFET design with added flexibility to tune its performance. Further studies are needed to better understand the particle adhesion and cohesion forces in the NanoFET system and their impacts on NanoFET’s design and operations.
Acknowledgments
The work presented was funded in part by an Air Force Office of Scientific Research grant (FA9550-07-C-0144, managed by Dr. Mitat Birkan) and a National Science Foundation Graduate Research Fellowship (Liu).
The NanoBLUE microgravity project’s flight test opportunity was provided by NASA’s Reduced Gravity Office. Financial support was provided by the Michigan Space Grant Consortium and the University of Michigan (UM) Women In Science and Engineering Office, and laboratory space and facilities support were provided by the UM Student Space Systems Fabrication Laboratory and the Space Physics Research Laboratory. Undergraduate team members Theresa Biehle and Rebecca Wind gave valuable systems engineering and administrative help, and the experiment was conducted on the C-9B aircraft by dedicated flight crew members Horim Han, Patrick Martinchek, Steven Morris, and Kurt Swieringa. Michelle Knapp and Rachel Trabert were instrumental as the ground crew, and team members Benjamin Brierty, John Bell, Matthew Putz, and Christopher Rossi contributed to the project’s design and fabrication phases. The UM Aerospace Engineering technical staff (Thomas Griffin, David McLean, Chris Chartier, and Terry Larrow) and Dr. Christopher Deline (UM Electrical Engineering) provided excellent design insights and recommendations, and Michael Lee at the UM Wilson Student Team Project Center was of particular help during test cell fabrication. Deshpremy Mukhija in Professor Michael Solomon’s UM Chemical Engineering research group performed the confocal laser scanning microscopy, and Bailo Ngom at the UM Plasmadynamics and Electric Propulsion Laboratory kindly helped with creating Figure 1. Thanks to UM professors Mark Burns (Chemical Engineering) and Luis Bernal (Aerospace Engineering) for valuable advice regarding the use of knife-edged orifices and microgravity fluidics experiments.
For the piezoelectric-driven electrode experiment, the electrodes were fabricated at the UM Michigan Nanofabrication Facility. Scanning electron and atomic force microscopy were performed at the UM Electron Microbeam Analysis Laboratory with the aid of Inkyu Eu.
Special thanks to Professor Peter Washabaugh (UM Aerospace Engineering) for his timely advice and generosity in loaning out test equipment.
References
1 Musinski, L., Liu, T., Gilchrist, B., Gallimore, A., and Keidar, M., “Scalable Flat-Panel Nano-Particle MEMS/NEMS
Thruster,” IEPC-2005-176, 29th International Electric Propulsion Conference, Princeton, NJ, 31 October - 4 November 2005. 2 Liu, T., Morris, D., Cionca, C., Gallimore, A., Gilchrist, B., and Clarke, R., “MEMS Gate Structures for Electric Propulsion
Applications,” AIAA-2006-5011, 42nd AIAA/ASME/SAE/ASEE Joint Propulsion Conference, Sacramento, CA, 9-12 July 2006. 3 Liu, T., Musinski, L., Patel, P., Gallimore, A., Gilchrist, B., and Keidar, M., “Nanoparticle Electric Propulsion for Space
Exploration,” in Space Technology and Applications International Forum STAIF 2007, edited by M. S. El-Genk, American Institute of Physics, Albuquerque, NM, 2007, pp. 787-94.
4 Tobazéon, R., “Electrohydrodynamic Behaviour of Single Spherical or Cylindrical Conducting Particles in an Insulating Liquid Subjected to a Uniform DC Field,” J. Phys. D: Appl. Phys., 29 (1996), pp. 2595-608.
5 Liu, T., Keidar, M., Musinski, L., Gallimore, A., and Gilchrist, B., “Theoretical Aspects of Nanoparticle Electric Propulsion,” AIAA-2006-4335, 42nd AIAA/ASME/SAE/ASEE Joint Propulsion Conference, Sacramento, CA, 10-12 July 2006.
6 Musinski, L., Liu, T., Eu, I., Gilchrist, B., Gallimore, A., Millunchick, J., and Morris, D., “Nanoparticle Field Extraction Thruster (NanoFET): Introduction to, Analysis of, and Experimental Results from the ‘No Liquid’ Configuration,” AIAA-2008-5097, 44th AIAA/ASME/SAE/ASEE Joint Propulsion Conference, Hartford, CT, 21-23 July 2008.
7 Félici, N.-J., “Forces et Charges de Petits Objets en Contact avec une Électrode Affectée d’un Champ Électrique,” Revue Générale de l’Électricité, 75 (1966), pp. 1145-60.
8 Trottenberg, T., Kersten, H., and Neumann, H., “Feasibility of Electrostatic Microparticle Thrusters,” IEPC-2007-179, 30th International Electric Propulsion Conference, Florence, Italy, 17-20 September 2007.
9 Tonks, L., “A Theory of Liquid Surface Rupture by a Uniform Electric Field,” Physical Review, Vol. 48, 15 September 1935, pp. 562-8.

American Institute of Aeronautics and Astronautics
092407
16
10 Liu, T., Deline, C., Ramos, R., Sandoval, S., Smetana, A., Gilchrist, B., Washabaugh, P., and Renno, N., “The Student
Space Systems Fabrication Laboratory: An Approach to Space Systems Engineering Education,” ASEE-2006-1917, 113th ASEE Conference, Chicago, IL, 18-21 June 2006.
11 Sopensky, E., “Trying Out Zero Gravity,” IEEE Potentials, Aug./Sept. 1998, pp. 38-41. 12 Liu, T., Musinski, L., Keidar, M., Gallimore, A., and Gilchrist, B., “Physical Models and Performance Implications for the
Nanoparticle Field Extraction Thruster,” IEPC-2007-186, 30th International Electric Propulsion Conference, Florence, Italy, 17-20 September 2007.
13 Bilén, S.G. and Bernal, L.P., “Get Away Special Payload G-093: The VOrtex Ring Transit EXperiment (VORTEX) Flights,” 1999 Shuttle Small Payloads Symposium, Annapolis, MD, 13-15 September 1999, NASA/CP-1999-209476, pp. 129-138.
14 Man, P., Mastrangelo, C., Burns, M., and Burke, D., “Microfabricated Capillarity-Driven Stop Valve and Sample Injector,” in The Eleventh Annual International Workshop on Micro Electro Mechanical Systems (MEMS 98) Proceedings, IEEE, Heidelberg, Germany, 2008, pp. 45-50.
15 Morris, S., Drenkow, B., Liu, T., Biehle, T., et al., “Reduced Gravity Testing of the Nanoparticle Field Extraction Thruster Concept,” AIAA-2008-4995, 44th AIAA/ASME/SAE/ASEE Joint Propulsion Conference, Hartford, CT, 21-23 July 2008.
16 Suvorov, V. and Zubarev, N., “Formation of the Taylor Cone on the Surface of Liquid Metal in the Presence of an Electric Field,” J. Phys. D: Appl. Phys., 37 (2004), pp. 289-97.
17 Musinski, L., Liu, T., Gilchrist, B., Gallimore, A., and Keidar, M., “Nanoparticle Field Extraction Thruster (NanoFET): Design and Results of the Microparticle Emitter Prototype,” IEPC-2007-80, 30th International Electric Propulsion Conference, Florence, Italy, 17-20 September 2007.
18 Hein, K., Hucke, T., Stintz, M., and Ripperger, S., “Analysis of Adhesion Forces Between Particles and Walls Based on the Vibration Method,” Part. Part. Syst. Charact., 19 (2002), pp. 269-76.
19 Bowling, R., “Analysis of Particle Adhesion on Semiconductor Surfaces,” J. Electrochem. Soc., 132 (1985), pp. 2208-14.