Development of epileptiform excitability in the deep entorhinal cortex after status epilepticus
27
Development of epileptiform excitability in the deep entorhinal cortex after status epilepticus Denis E. Bragin 1,4 , Jennifer L. Sanderson 2 , Steven Peterson 3 , John A. Connor 2,4 , and Wolfgang S. Müller 1,4 1 Department of Neurosurgery, University of New Mexico School of Medicine, 2nd Floor ACC, MSC 10 5615, 1 University of New Mexico, Albuquerque, NM 87131–0001, USA 2 Department of Neuroscience, University of New Mexico School of Medicine, 2nd Floor ACC, MSC 10 5615, 1 University of New Mexico, Albuquerque, NM 87131–0001, USA 3 UNM College of Pharmacy, MSC 09 5360, 1 University of New Mexico, Albuquerque, NM 87131–0001, USA 4 UNM BRaIN Imaging Center, 1101 Yale NE, Albuquerque, NM 87131, USA Abstract Epileptiform neuronal activity during seizures is observed in many brain areas, but its origins following status epilepticus (SE) are unclear. We have used the Li-low dose pilocarpine rat model of temporal lobe epilepsy (TLE) to examine early development of epileptiform activity in the deep entorhinal cortex (EC). We show that during the 3 week latent period that follows SE, an increasing percentage of neurons in EC layer 5 respond to a single synaptic stimulus with polysynaptic burst depolarizations. This change is paralleled by a progressive depolarizing shift of the IPSP reversal potential in layer 5 neurons, apparently caused by upregulation of the Cl - inward transporter NKCC1 and concurrent downregulation of the Cl - outward transporter KCC2, both changes favoring intracellular Cl - accumulation. Inhibiting Cl - uptake in the latent period restored more negative GABAergic reversal potentials and eliminated polysynaptic bursts. The changes in the Cl - transporters were highly specific to the deep entorhinal cortex. They did not occur in layers 1-3, perirhinal cortex, subiculum or dentate gyrus during this period. We propose that the changes in Cl - homeostasis facilitate hyperexcitability in the deep entorhinal cortex leading to epileptiform discharge there, which subsequently affects downstream cortical regions. Keywords rat, Li-pilocarpine; GABA; NKCC1; KCC2; bumetanide Introduction Mesial temporal lobe epilepsy (TLE) is the most common type of epilepsy in adults (Engel, 1989), and frequently becomes resistant to drug therapy, leaving ultimately only a neurosurgery option to control seizures. TLE develops following a variety of insults, including brain injury and status epilepticus (SE). Precipitating insults are followed by a characteristic seizure-free “latent period” lasting months or even years in humans (Annegers et al., 1980; Weiss et al., 1986). The TLE in rats that arises several weeks after a lithium- Correspondence: Wolfgang Müller, Dept. of Neurosurgery, University of New Mexico School of Medicine, MSC 105615, 1 University of New Mexico, Albuquerque, NM 87131-5341, USA Fax: USA-505-272-8306 [email protected] . NIH Public Access Author Manuscript Eur J Neurosci. Author manuscript; available in PMC 2010 August 1. Published in final edited form as: Eur J Neurosci. 2009 August ; 30(4): 611–624. doi:10.1111/j.1460-9568.2009.06863.x. NIH-PA Author Manuscript NIH-PA Author Manuscript NIH-PA Author Manuscript
Transcript of Development of epileptiform excitability in the deep entorhinal cortex after status epilepticus

Development of epileptiform excitability in the deep entorhinalcortex after status epilepticus
Denis E. Bragin1,4, Jennifer L. Sanderson2, Steven Peterson3, John A. Connor2,4, andWolfgang S. Müller1,4
1Department of Neurosurgery, University of New Mexico School of Medicine, 2nd Floor ACC,MSC 10 5615, 1 University of New Mexico, Albuquerque, NM 87131–0001, USA2Department of Neuroscience, University of New Mexico School of Medicine, 2nd Floor ACC,MSC 10 5615, 1 University of New Mexico, Albuquerque, NM 87131–0001, USA3UNM College of Pharmacy, MSC 09 5360, 1 University of New Mexico, Albuquerque, NM87131–0001, USA4UNM BRaIN Imaging Center, 1101 Yale NE, Albuquerque, NM 87131, USA
AbstractEpileptiform neuronal activity during seizures is observed in many brain areas, but its originsfollowing status epilepticus (SE) are unclear. We have used the Li-low dose pilocarpine rat modelof temporal lobe epilepsy (TLE) to examine early development of epileptiform activity in the deepentorhinal cortex (EC). We show that during the 3 week latent period that follows SE, anincreasing percentage of neurons in EC layer 5 respond to a single synaptic stimulus withpolysynaptic burst depolarizations. This change is paralleled by a progressive depolarizing shift ofthe IPSP reversal potential in layer 5 neurons, apparently caused by upregulation of the Cl- inwardtransporter NKCC1 and concurrent downregulation of the Cl- outward transporter KCC2, bothchanges favoring intracellular Cl- accumulation. Inhibiting Cl- uptake in the latent period restoredmore negative GABAergic reversal potentials and eliminated polysynaptic bursts. The changes inthe Cl- transporters were highly specific to the deep entorhinal cortex. They did not occur in layers1-3, perirhinal cortex, subiculum or dentate gyrus during this period. We propose that the changesin Cl- homeostasis facilitate hyperexcitability in the deep entorhinal cortex leading to epileptiformdischarge there, which subsequently affects downstream cortical regions.
Keywordsrat, Li-pilocarpine; GABA; NKCC1; KCC2; bumetanide
IntroductionMesial temporal lobe epilepsy (TLE) is the most common type of epilepsy in adults (Engel,1989), and frequently becomes resistant to drug therapy, leaving ultimately only aneurosurgery option to control seizures. TLE develops following a variety of insults,including brain injury and status epilepticus (SE). Precipitating insults are followed by acharacteristic seizure-free “latent period” lasting months or even years in humans (Annegerset al., 1980; Weiss et al., 1986). The TLE in rats that arises several weeks after a lithium-
Correspondence: Wolfgang Müller, Dept. of Neurosurgery, University of New Mexico School of Medicine, MSC 105615, 1University of New Mexico, Albuquerque, NM 87131-5341, USA Fax: USA-505-272-8306 [email protected] .
NIH Public AccessAuthor ManuscriptEur J Neurosci. Author manuscript; available in PMC 2010 August 1.
Published in final edited form as:Eur J Neurosci. 2009 August ; 30(4): 611–624. doi:10.1111/j.1460-9568.2009.06863.x.
NIH
-PA Author Manuscript
NIH
-PA Author Manuscript
NIH
-PA Author Manuscript

pilocarpine induced SE reproduces most clinical and neuropathological features of humanTLE, and presents a very useful animal model of the disease (Ormandy et al., 1989; Turskiet al., 1991; Cavalheiro, 1995; Dube et al., 2000; Andre et al., 2007). Here we exploit thisrat model of TLE for the study of early events in the latent period that cannot be accessed inhuman tissue. Even though initial causes may vary, the behavioral and histo-pathologicalhallmarks of TLE are remarkably similar in all etiologies. This has lead a number ofinvestigators to hypothesize that there is a major common pathway downstream of initiatingcauses, probably the intense synchronous activity that is a signature of seizures (Du et al.,1995; Wu and Schwarcz, 1998; Schwarcz et al., 2000). This synchronous activity is usuallyseen in hippocampus and parahippocampal cortices, including the EC (Schwartzkroin andKnowles, 1984; Bartolomei et al., 2004). Over the longer term, specific mesial temporallobe atrophy has been shown ipsilateral to the seizure focus (Bartolomei et al., 2005).Examination of surgically resected specimens has revealed cell loss and astrogliosis in EC(Yilmazer-Hanke et al., 2000).
Exactly where important early changes in neuronal physiology occur after the SE is unclear;however, neuroprotection experiments of hippocampal Cornu Ammonis (CA) regions vs.parahippocampal cortices suggest a key role of the parahippocampal cortices at the earlysteps of epileptogenesis (Andre et al., 2007). Moreover, we have observed in previousstudies that the deep EC exhibits unusual high network excitation, in striking contrast tolayers 2 and 3 (Gloveli et al., 1999; Egorov et al., 2003), suggesting that the deep EC maybe particularly susceptible to the development of hyperexcitability triggered by statusepilepticus. We demonstrate here the early development of greatly increased excitability inthe deep EC, i.e. during the latent period post SE. Neurons in L5 begin to respond tonormally subthreshold synaptic stimuli with polysynaptic burst discharge. Moreover, weshow that, during this latent period, a large depolarizing shift of the GABAA receptorreversal potential occurs due to altered expression of the Cl- transporters NKCC1 (inward)and KCC2 (outward). These changes in transporter expression occur only in the deep EC,but not adjacent hippocampal and cortical areas, during this early stage of epilepsydevelopment. The direct connection between alterations in Cl- transport activity andincreased polysynaptic bursting is supported by the finding that block of NKCC1 bybumetanide largely restored IPSP reversal potential and greatly reduced polysynaptic burstdischarge. Our results implicate ECL5 as an important locus in the development of TLE.
Materials and MethodsTLE induction
All procedures were approved by the Institutional Animal Care and Use Committee at theUniversity of New Mexico Health Sciences Center and were in accordance with NationalInstitutes of Health Guide for the Care and Use of Laboratory Animals. Our protocol for theexperiments here was a slight modification of a protocol published by Andre et al. (Andre etal., 2007). Twenty four hours prior to seizure induction, male Wistar rats, 2-3 months old,were administered s.c. 3 mmol/kg lithium chloride dissolved in isotonic NaCl saline.Pilocarpine was then administered s.c. (25 mg/kg in isotonic NaCl). Once generalized limbicconvulsions began, subcutaneous needle EEG electrodes were placed to confirm thedevelopment of status epilepticus (SE), defined as the occurrence of continuous highamplitude EEG spiking (Ormandy et al., 1989). These needles were fashioned from 25gauge hypodermic needles (Becton Dickinson), with the hub cut off and bent at 60 degreeangles so they will stay in place. One needle was inserted subcutaneously in the scalp overthe parietal cortex and the other, which served as the reference electrode, over the scapula.The EEG recordings, using a Grass Model 8 electroencephalograph (Astro-Med, WestWarwick, RI), showed continuous high amplitude spiking for a 1 hour period following theonset of SE, in clear contrast to normal EEGs, recorded in a previous study with intracranial
Bragin et al. Page 2
Eur J Neurosci. Author manuscript; available in PMC 2010 August 1.
NIH
-PA Author Manuscript
NIH
-PA Author Manuscript
NIH
-PA Author Manuscript

implanted electrodes (Peterson et al., 2005). Recording was then generally discontinued.Atropine sulfate (10 mg/kg s.c.) and Diazepam (4 mg/kg i.m.) were administered in order toimprove survival, decrease anxiety and induce muscle relaxation. This dose of Diazepam didnot stop seizures but induced muscle relaxation within one hour and rats were lying on theirventral side, not using their limbs. Nor did atropine stop seizures. 12 hours after SE onset theEEG was recorded again for 5-10 min, and all rats had intermittent or organized, i.e. burstsof EEG spiking. Those rats that showed organized EEG spiking at this time, such as burstsof spiking or continuous trains of spiking (~20% of cases) received an additional 2 mg/kgdiazepam, i.m.. 5% dextrose in Ringers solution was administered s.c.12 hours following SEonset.
This protocol differs from the one of Andre et al. (Andre et al., 2007) in that weadministered diazepam 1 hour after onset of SE instead of 2 hours. In addition, we appliedatropine to reduce peripheral pilocarpine effects (Du et al., 1995). We therefore believe thatour protocol should provide a milder insult to the animals.
The protocol of Andre et al. was shown to reliably induce epilepsy in 100% of adult rats(Dube et al., 2000; Andre et al., 2007). This is also true of an earlier protocol from the samelab that used a higher pilocarpine dose with lithium (Dube et al., 2000; Andre et al., 2007).In our lab a previous study using the Andre protocol (Andre et al., 2007) showed all ratsdeveloping spontaneous rank 3, 4 or 5 seizures after a latent period of 28.6 ± 2.43 (SEM)days (n=14; continuous 24 hour/day video recording, S. Peterson, unpublished results). Only1 rat had a seizure by day 15. By day 21 4 rats had experienced a seizure, From fitting theselatency data with a normal distribution it is expected that on average ~25% of rats have hada first seizure within 3 weeks of the pilocarpine/2 hr Diazepam treatment. However, wenever observed seizures during observing and handling rats prior to sacrifice. The epilepticoutcome for our mild protocol was tested 8 weeks post SE with video recordings of up to atotal of 36 hours/rat, and, indeed, spontaneous seizures were observed in 10 out of 13 rats.Given the wide variability of durations of the latent phase in humans, we would surmise thatwith this mild protocol the outcome would reach a significantly higher percentage at longertimes post SE. A total of 155 rats was used, 44 Li-control rats, 42 rats 2 weeks post SE, 47rats 3 weeks post SE, and 22 rats post SE for video recording.
Slice preparationAll experiments were performed on acute horizontal brain slices containing temporalneocortex, entorhinal cortex, subiculum and the ventral hippocampus. Control, or rats 2 or 3weeks post-seizure, were anesthetized deeply with a mixture of ketamine and xylazine (85and 15 mg/ml, respectively) and decapitated. The brains were removed rapidly and placed inan oxygenated (95% O2/5% CO2) ice-cold cutting solution containing (in mM): 3 KCl, 1.25NaH2PO4, 6 MgSO4, 26 NaHCO3, 0.2 CaCl2, 10 glucose, 220 sucrose, and 0.43 ketamine.Slices (350 μm) were cut in ice-cold cutting solution with a vibratome (Dosaka DTK-1000)and transferred from there into Artificial Cerebro-Spinal Fluid (ACSF, in mM: 126 NaCl, 3KCl, 1.25 NaH2PO4, 1 MgSO4, 26 NaHCO3, 2 CaCl2, and 10 glucose) equilibrated with95%O2/5%CO2 at 34°C temperature for recovery. After 1 hr ACSF was changed again, andthe slices were held at room temperature until used for recording.
ElectrophysiologyIndividual slices were transferred to a recording chamber mounted on a fixed-stagemicroscope (Zeiss Axioskop, Jena, Germany) and superfused with warmed (34°C),oxygenated ACSF at 2 ml/min. Intracellular recordings were made from EC layer 5 neuronswith borosilicate glass sharp microelectrodes (80-150 MΩ) filled with either 1 M K2SO4, or0.5 M potassium acetate/0.5 M KCl for lower electrode resistance, or 2 M CsSO4/0.1 M KCl
Bragin et al. Page 3
Eur J Neurosci. Author manuscript; available in PMC 2010 August 1.
NIH
-PA Author Manuscript
NIH
-PA Author Manuscript
NIH
-PA Author Manuscript

for improved space clamp. In the absence of Cl- transport blockers all intracellular solutionsgave identical results for the GABAAergic PSP reversal potential that were therefore pooled(see also: (Misgeld et al., 1986)). During Cl- transport block by bumetanide it was found thatsharp microelectrodes filled with 0.5 M potassium acetate/0.5 M KCl-filled sharpmicroelectrode did shift EIPSP in depolarizing direction by ~20 mV. Therefore all finalrecordings/data for bumetanide effects on GABAergic PSP reversal potential were obtainedwith microelectrodes filled with 1 M K2SO4 or 2 M CsSO4/0.1 M KCl.
Neurons were impaled in the medial entorhinal cortex just above the angular bundle, up to ¼of cortex thickness, using a Nanostepper micropositioner (Scientific Precision Instruments,Oppenheim, Germany). Recordings were made using an Axoclamp 2B amplifier anddigitized and recorded using an Axon Instruments Digidata 1322A (Molecular Devices,Union City, CA). Neurons with a RMP negative to −68 mV were tested withhyperpolarizing pulses to ~ −85 mV for the presence of Ih indicative of pyramidal neurons(Egorov et al., 2002; Egorov et al., 2003). By this criterion 75% of the recorded populationwas pyramidal with the remainder presumably multipolar neurons. In a study by Hamam etal. even 85% of neurons impaled with a sharp electrode in L5 showed a prominent longapical dendrite typical for pyramidal neurons (Hamam et al., 2000). In contrast to our studiesthis study reported presence of Ih also in non-pyramidal neurons (Hamam et al., 2000).Concentric bipolar stimulating electrodes (200 μm diameter, FHC Inc., ME, USA) wereplaced in layer 5 of EC, ~150-250 μm from the recording electrode. Stimuli (70-100 μs,100-800 nA) were controlled by a Master 8 programmable pulse generator connected to astimulus isolation unit (A.M.P.I., Jerusalem, Israel). Full input-output relations for the EPSPand the IPSP were recorded, and stimulation intensities giving 70-90% of maximal responsewere used. Where indicated stimulation intensity was reduced to elicit 5-10% of maximalresponse.
Figure 2A shows the protocol used to determine the reversal potential for GABAA receptor-mediated, postsynaptic potentials. Monosynaptic PSPs were elicited in the presence ofglutamate receptor blockers CNQX (10 μM) and APV (50 μM). Stimulation intensity wasadjusted to give approximately 80% of maximal evoked PSP amplitude. Prior to the fieldstimulus, the membrane voltage (Vm) was changed by either a negative or a positive DCcurrent pulse (500 ms, ≤400 pA). After Vm reached steady state, the PSP was evoked (*). I-V relationships of both the steady membrane potential (Fig. 2B, o’s) and peak voltage of thePSP (Fig. 2B, ×’s), were plotted and the linear regressions calculated using SigmaPlot,giving directly the membrane conductance values. By measuring the I-Vs in the potentialrange of linear membrane behavior (−80 to −50 mV) we avoided errors in the slopeconductance due to voltage-dependent activation of delayed rectifier or other rectifyingcurrents. Reversal potential was determined by the intersection point of the regression lines.Typical PSP traces are shown for both a control and a test animal at 3 weeks. CNQX, DL-2-Amino-5-phosphonopentanoic acid, picrotoxin, bumetanide, pilocarpine, and atropine wereobtained from Sigma, St. Luis, MO. Diazepam was from Hospira Inc., Lake Forest, IL.Stock solutions, 1000-fold concentrated, were stored in the freezer, and were diluted prior touse in ACSF. For stock solutions, CNQX and picrotoxin were dissolved in DMSO,bumetanide in ethanol. Neither DMSO (1:1000) nor ethanol (1:1000) had any effect onPSPs, I-V relations, or burst responses.
ImmunoblottingFor immunoblotting studies, layer 5-6 of medial EC (=tissue adjacent to the angular bundleand up to ~25% of cortical thickness; the angular bundle is well visible in transillumination)were dissected from the 350 μm thick slices, snap-frozen on dry ice and stored at −80°C tillprocessed. For preparation of membrane fractions the tissues were homogenized in buffercontaining 250 mM sucrose, 10 mM Tris-HCl, 10 mM HEPES, 1 mM EDTA and protease
Bragin et al. Page 4
Eur J Neurosci. Author manuscript; available in PMC 2010 August 1.
NIH
-PA Author Manuscript
NIH
-PA Author Manuscript
NIH
-PA Author Manuscript

inhibitors (pH 7.2) followed by differential centrifugation as described previously (Payne etal., 1996). The purified membrane fraction (50μg) was then processed for SDS-polyacrylamide gel electrophoresis (7%) and immunoblotting with anti-KCC2 (1:1000;NeuroMab clone N1/12, UC Davis) and anti-actin (1:500; Sigma) antibodies respectively.Antigen-antibody complex was detected by enhanced chemiluminescence (ECL-plus fromAmersham, Arlington Heights, IL) and x-ray films were quantified using NIH ImageJsoftware.
Fluorescence in-situ hybridization (FISH)When preparing brain slices for FISH, one brain hemisphere was quick-frozen in a beaker ofisopentane equilibrated in dry ice/ethanol slurry and stored at −80°C. Horizontal brainsections (16 μm) were prepared using a cryostat and arranged on slides (Superfrost Plus,VWR), air dried and stored frozen at −80°C until processed.
NKCC1 (clone ID 4824556, accession number BC033003) and KCC2 (clone ID 6838880,accession number BC054808) plasmids were obtained from Open Biosystems (Huntsville,AL). The NKCC1 cDNA sequence was inserted into a pBluescriptR vector between theSalI/XhoI and BamHI restriction sites. KCC2 cDNA sequence was inserted into a pYX-Ascvector between the EcoRI and NotI sites. The plasmids were then sequenced to confirm theNKCC1 and KCC2 sequences (DNA Research Services, University of New Mexico, HealthSciences Center). EcoR1 and Not1 were both used to generate the antisense strand ofdifferent lengths, and Kpn1 for the sense strand (New England Biolabs Inc., Ipswich, MA).The antisense strand for KCC2 was generated using AscI, and PacI for the sense strand. Therestriction digestion reaction was incubated for 2 hours at 37° C.
Single-labeled FISH for NKCC1a,b and KCC2a,b was performed as previously described(Guzowski et al., 1999). Briefly, digoxigenin-labeled KCC2 and NKCC1 whole lengthantisense riboprobes were generated from linearized cDNA using a commercially availabletranscription kit (Maxiscript; Ambion, Austin, TX) and premixed RNA digoxigenin labelednucleotides using T3 polymerase (Roche Molecular Biochemicals, Palo Alto, CA).Hybridization of both NKCC1 and KCC2 digoxigenin-labeled riboprobes was doneovernight at 56°C on separate slides (1ng/μl). Then, anti-digoxigenin horseradish peroxidaseconjugate (HRP; 1:200; Roche Molecular Biochemicals, Palo Alto, CA) was incubatedovernight at 4°C. TSA-cyanine-3 (Cy3) (1:50; PerkinElmer, Waltham, MA) was used todetect the HRP conjugate. Nuclei were counterstained with 4′, 6′-diamidino-2-phenylindole(DAPI) (1:500; Invitrogen, Carlsbad, CA). Images were acquired with Nikon TE2000Uepifluorescence microscope (20X objective) equipped with a spinning disk confocal system(Spinning Disk Confocal Imager CARV, Atto Bioscience, Rockville, MD) and CoolSNAP-Hq CCD Camera (Roper Scientific, Tucson, AZ). The images were further analyzed usingMetaMorph software (Universal Imaging) and quantified using NIH ImageJ software.Signals were corrected for background (obtained with ROIs covering clearly negative areasin the image), and ratios against nuclear stains were calculated. Where indicated these datawere normalized relative to data for control rats.
ImmunohistochemistrySlices were fixed overnight with 4% paraformaldehyde in 100 mM phosphate bufferedsaline (PBS), cryoprotected in 15% and 30% sucrose in PBS and then frozen in OptimalCutting Temperature (OCT) compound (Sakura Finetek, Torrance, CA).Immunohistochemistry was performed at room temperature for 24 hours on 300 μm floatingsections with anti-KCC2 (NeuroMab clone N1/12, UC Davis) or NKCC1 antibodies (rabbitpolyclonal, Chemicon, Temecula, CA; results were in agreement with results obtained withmouse NKCC monoclonal antibody MAb T4, kindly provided by Dr. C. Lytle, UC
Bragin et al. Page 5
Eur J Neurosci. Author manuscript; available in PMC 2010 August 1.
NIH
-PA Author Manuscript
NIH
-PA Author Manuscript
NIH
-PA Author Manuscript

Riverside). Slices were mounted on glass slides and images were taken with a Biorad two-photon microscope and 40x objective 75 μm below the slice surface. NeuroTrace fluorescentStain (Molecular Probes, Eugene, OR) was used for counterstaining neurons in 60 μmsections prepared from slices using a cryostat, and images were taken with anepifluorescence microscope with CCD camera and a 40x objective. For immuno-stainingwith NKCC1 antibody tissue sections were pretreated in 1% SDS and 8% 2-mercaptoethanol for 5 minutes before blocking (Sung et al., 2000). In many attemptswithout this pretreatment we failed to obtain clear NKCC signals with the MAb T4antibody. All sections were blocked with 10% normal goat serum in PBS-T (PBS containing0.2% Triton-X-100) and incubated at 4°C overnight with the respective primary antibodies(1:200). After extensive washes in PBS-T, tissue sections were incubated in Cy3-conjugatedgoat anti-mouse or anti-rabbit IgG (1:200, Jackson Immuno Research, West Grove, PA).Controls received identical treatment without primary antibody and were always negative.Sections were extensively rinsed in PBS-T and cover-slipped for viewing. Hoechst 33342DNA staining (10 μm; Invitrogen, Carlsbad, CA) was used for counterstaining cell nuclei.
StatisticsMeans ± SEM are given where not otherwise indicated. Statistical comparisons betweengroups of data were performed with SigmaPlot software using a two-tailed unpaired, orpaired, where appropriate, Student’s t-test to test the null hypothesis. Values of probabilityof P < 0.05 are considered to be statistically significant.
ResultsDevelopment of polysynaptic burst responses in EC L5 neurons post SE
In slices from control rats, single presynaptic stimulation to EC L5 elicited a monosynaptic,fast EPSP of up to 20mV in amplitude in L5 neurons at resting membrane potential (RMP)of ~ −70 mV (Fig. 1 A), followed by a fast inhibitory postsynaptic potential (IPSP) whoseamplitude varied with the membrane holding potential. In strong contrast, recordings made 3weeks after SE showed polysynaptic epileptiform activity in response to a single synapticstimulation, even when stimulation intensity was greatly reduced from values used for thecontrol preparations (Fig. 1 B). The polysynaptic burst responses showed little change withvariation of the postsynaptic membrane potential by DC injection in a range from −95 to−60 mV, except in firing of action potentials for the more depolarized voltages. In theexample shown, the slight delay of the polysynaptic depolarization with weak stimulationallowed the initial EPSP to become clearly evident; and to be seen as only 1-2mV inamplitude (inset, cell hyperpolarized by negative DC to prevent firing). These weak stimulireliably elicited polysynaptic burst responses in 10.8% of the neurons tested at 2 weeks(n=37), and in 61.8% (n=34) at 3 weeks (Fig. 1C). For these determinations, a polysynapticburst was defined as a post-synaptic response lasting more than 150 ms at half amplitude,elicited from −75 mV < RMP < −68 mV. In control slices such responses were seen only in1 neuron out of 42 recorded neurons.
GABAAergic PSPs become depolarizing, post SE—Drawing on existingobservations of important changes in EIPSP and Cl- transporter systems in a subpopulation ofsubicular neurons with long established TLE (Cohen et al., 2002; de Guzman et al., 2006;Palma et al., 2006; Huberfeld et al., 2007; Munoz et al., 2007; Sen et al., 2007), we lookedfor ongoing changes in GABAergic transmission at the very early stages of interest here thatmight promote burst activity. Figure 2A illustrates monosynaptic GABAAergic PSPs, duringblock of glutamate receptors by CNQX (10 μM) and APV (50 μM), that were elicited byfield stimulation in EC L5 while cells were held at different steady membrane potentials (seeMethods). The PSP reversal potential (E(PSP)) was determined by plotting the I-V
Bragin et al. Page 6
Eur J Neurosci. Author manuscript; available in PMC 2010 August 1.
NIH
-PA Author Manuscript
NIH
-PA Author Manuscript
NIH
-PA Author Manuscript

relationships of both the steady membrane potential (Fig. 2B, o’s) and peak voltage of thePSP (Fig. 2B, ×’s), and calculating the linear regressions. The crossover point of membranepotential and PSP linear regressions is the reversal potential (Fig. 2B, arrows). I-V plots forrepresentative neurons from control rats and from rats 2 and 3 weeks post SE illustrate aprogressive shift of E(PSP) from −68.3±2.1 mV in control to −52.6±1.8 mV 2 weeks and−34.8±1.4 mV 3 weeks post SE, respectively (Fig. 2, B1-3). When the data were plotted ashistograms, we observed two classes of cells in the slices from the treated rats, at both 2 and3 weeks post SE (Fig. 2C, n=84). In one class, the mean E(PSP) was similar to controls, i.e.<5 mV positive to RMP (23.5% and 19.2% of the total cells analyzed at 2 and 3 weeks,respectively). The other class showed strong shifts (76.5% and 80.8% of recorded neurons at2 and 3 weeks, respectively). Both classes of cells were observed not only in slices from thesame rat, but also within single slices. Pre-sacrifice spontaneous seizures, expected in up to~25% of rats at 3 weeks post SE (see Methods), could have further shifted E(PSP) in neuronsfrom these rats, thus establishing a subpopulation with more strongly shifted E(PSP). Thehistogram does not show any sign of such a distinct subpopulation of neurons, indicatingthat spontaneous seizures did either not occur or did not significantly further shift E(PSP).
The bar graph of population data (Fig. 2D) summarizes the mean PSP reversal potential shiftover time, excluding that part of the population where no change occurred (E(PSP) = 3.6±0.5mV positive to RMP of −71.9±1.46 mV in control neurons, n=24; 2 weeks after SE E(PSP) =18.0±3.6 mV positive to RMP of −70.9±2.8 mV, t56=8.3, P=0.006, n=26; three weeks afterSE E(PSP) = 45.1±6.2 mV positive to RMP of −72.9±2.8 mV, t48=9.81, P=0.0008, n=21). Atthe 3 week measurement point, 81% and 75% of neurons in the shifting and non-shiftingpopulation, respectively, were pyramidal and 19% and 25%, respectively, multipolarneurons. These distributions are not significantly different from the overall distribution ofthese two cell types in EC L5 (Egorov et al., 2002;Egorov et al., 2003). It is notable that thepositive shift at 3 weeks brings the E(PSP) very close to the level of spike initiation. Thus,post SE GABA release may not effectively limit repetitive firing, and might possibly evenexcite neurons.
The slightly depolarizing IPSP in control neurons, relative to resting membrane potential,may seem puzzling for a condition where apparently only Cl- outward transport is expressed(see below). The Cl- reversal potential should be negative to the resting membrane potential(or equal to it when Cl- outward transport becomes active only after Cl- influx). However,the GABAA-channels conduct bicarbonate to some extent, about 1/6 of the anionconductance, making the GABA-PSP reversal potential lie between ECl- and EHCO3
-
(Bormann et al., 1987). Intracellular energy metabolism generates carbon dioxide thatreversibly reacts with water, catalyzed by carbonic anhydrase, to form bicarbonate. Thisprocess creates a strong outward gradient for HCO3
- with a reversal potential as positive as−10 mV (Ben-Ari et al., 2007). This should shift the PSP reversal to a value more positivethan ECl in normal animals (Staley et al., 1995). Also, it is possible that limited expressionof Cl- inward transport could produce a slightly depolarizing PSP reversal potential (seebelow).
In addition to the reversal potential change, the membrane slope conductance, and theconductance increase during the PSP progressively declined post SE (cf. Fig. 2, B1-3).Resting conductance fell from 5.9±0.7 nS in control to 4.8±0.7 (t12=3.66, P=0.032) and3.6±0.4 nS (t13= 3.79, P=0.026) 2 and 3 weeks after SE, respectively, probably due todownregulation of leak ion channels (Bernard et al., 2004; Gorter et al., 2006). Similarly,the peak GABA-activated conductance fell from 8.5±0.69 nS in control to 2.1±0.4.3(t12=13.12, P=0.0018) and 0.24±0.07 nS (t13= 6.16, P=0.0005) 2 and 3 weeks after SE,respectively. This decrease was confirmed with larger GABAergic PSPs elicited by
Bragin et al. Page 7
Eur J Neurosci. Author manuscript; available in PMC 2010 August 1.
NIH
-PA Author Manuscript
NIH
-PA Author Manuscript
NIH
-PA Author Manuscript
stimulation intensity close to maximum of the input-output relation, and repeated 3 times at100 Hz, giving a larger undisturbed PSP after the third stimulation for all three groups.
Increase of NKCC1 mRNA after SE—The strongly depolarizing GABAergic PSP postSE, requires active Cl- inward transport. However it is known that there is little expressionof NKCC1 in adult neurons (Delpire, 2000; Wang et al., 2002). We examined whetherNKCC1 mRNA expression is re-established in adult EC L5 neurons during the post SElatent period, recapitulating an early developmental stage (Yamada et al., 2004; Ben-Ari etal., 2007). We found that NKCC1 mRNA fluorescence was very low to absent in EC L5 incontrol rats (Fig. 3A), in agreement with previous studies. In contrast, at 2 and especially 3weeks after Li-pilocarpine induced SE, we observed clear NKCC1 staining (Fig. 3B). At 2weeks post SE, NKCC1 mRNA fluorescence had increased to 237±33.4 % of control and to452±33.5 % at 3 weeks (Fig. 3B, E, n=100 ROIs, see Methods, 4 rats in each group,t38=2.15, P=0.037 and t49=3.54, P=0.0009, respectively). These percentages are somewhatarbitrary given the low expression in controls, but indicate a very large increase inexpression. Nucleus counter-staining with DAPI demonstrated no change in cell numbersover the analysis period (12.2±2.7, 12.8±3.4 and 12.5±3.1 nuclei per 500 μm2 for controland 2 and 3 week post SE, respectively, t68=−0.49, P=0.62 and t68=−2.38, P=0.24,respectively, n=100 ROIs, 4 rats in each group; Fig. 3 A2, B2). Overlay of DAPI andNKCC1 mRNA images showed a primarily perinuclear location of the labeled mRNA (Fig.3 B2). Analysis of NKCC1 positive cells relative to all cells in the fields, showed a labelingof 5.1±2.1 % of the cells in control tissue which increased to 28.5±6.7 % and 56.7±4.3 % at2 and 3 weeks post SE, respectively (Fig. 3D, n=100 ROIs, 4 rats in each group, t38=3.27,P=0.042 and t49=2.71, P=0.0096, respectively).
Increase of NKCC1 protein—To analyze protein level changes of NKCC1 that occurredduring the latent period we performed fluorescence immunohistochemistry. These data wereobtained with the Chemicon NKCC1 antibody, as shown in Fig. 4, and demonstrate aprogressive increase of NKCC1 protein from 2 to 3 weeks after SE, whereas in slices fromcontrol rats, there was very little specific signal (Fig. 4 A-C). Similar results were obtainedwith the MabT4 NKCC antibody. Superposition of stained nucleus images (Hoechst 33342)onto NKCC1 images revealed, particularly at 3 weeks post SE, a preferential perinuclear andsomatic location of NKCC1, suggesting significantly increased neuronal protein synthesis(Fig. 4 B3, C3 and, at higher magnification, Bb4, C4). Again, the number of Hoechst stainednuclei did not show significant differences between the three rat groups (85.3±5.3 in controlvs. 97.7±3.4 two weeks, and 86.0±4.9 three weeks post insult, 4 rats, t20=−1.33, P=0.20 andt18=−2.35, P=0.81, respectively, n=100 ROIs, 4 rats in each group). Fig. 4 D shows thataverage NKCC1 fluorescence intensities from cell bodies were some 350% and 860%, ofcontrol background fluorescence at 2 and 3 weeks respectively (n=100 ROIs, 4 rats in eachgroup, t64=5.32, P=0.0006 and t51=4.56, P=0.0008, respectively). In the neuropil averageNKCC1 fluorescence intensities were 123±21 % and 222±45 % of control backgroundfluorescence at 2 and 3 weeks respectively, suggesting a delayed increase of NKCC1 proteinin dendrites (n=100 ROIs, 4 rats in each group, t32=4.25, P=0.025 and t36=5.31, P=0.008,respectively). In terms of individual cells, 31.2±6.9 % and 56.3±11.2 % of cell bodies wereclearly positive for NKCC1 2 and 3 weeks post SE, respectively, whereas none was evidentin control (Fig. 4 E, n=100 ROIs, 4 rats in each group, t42=11.24, P=0.0009 and t37=7.12,P=0.0007, respectively).
In Fig. 5 neuron-specific NeuroTrace counterstaining was used and showed that 77.1±8.1 %of neurons had become NKCC1 positive 3 weeks after insult (control tissue: 3.0±1.3 %, n=3rats in each group, t21=3.78, P=0.008 and t33=4.23, P=0.001, respectively). The higherpercentage of NKCC1 positive neurons than of NKCC1 positive cells suggests that NKCC1is mostly upregulated in neurons. NeuroTrace positive cell number was also stable over the
Bragin et al. Page 8
Eur J Neurosci. Author manuscript; available in PMC 2010 August 1.
NIH
-PA Author Manuscript
NIH
-PA Author Manuscript
NIH
-PA Author Manuscript

experimental period (35.4±7.2 in control vs. 37.1±6.4 two weeks, and 36.6±6.7 three weekspost insult, 3 rats in each group, t12=−0.51, P=0.6 and t16=−0.30, P=0.8, respectively),indicating that the stable H33342 cell count was not the result of compensating neuron lossand glial cell increase. The gradual increase in NKCC1 expression and the percentage ofpositive neurons is well suited to explain the concurrent progressive depolarizing shift inGABAA-PSP reversal potential.
Progressive decrease of KCC2 mRNA—The demonstrated upregulation of NKCC1suggests active Cl- uptake. Normal Cl- extrusion by the neuronal KCl cotransporter KCC2(Ben-Ari et al., 2007) would compete with, and more or less short-circuit this Cl- uptake. IfKCC2 expression is maintained it would limit the effectiveness of Cl- uptake and wastemetabolic energy. To see if this is the case we studied expression of KCC2 mRNA.
As above, we assessed the expression levels of KCC2 mRNA in L5 neurons by fluorescencein situ hybridization. Fig. 6 shows that KCC2 mRNA was expressed abundantly in controlanimals (A1) while 3 weeks after SE, expression of KCC2 mRNA was strongly diminished(B1). Staining of cell nuclei with DAPI did not show significant differences between the 3time points (11.9±2.9, 12.3±3.8 and 12.1±3.2 nuclei per 500 μm2 respectively, t24=−0.36,P=0.17 and t24=−0.41, P=0.24, respectively, Fig. 6: A2, B2). The merged fluorescenceimages (Fig. 6: A3, B3) show that KCC2 mRNA is localized in the nuclear and perinuclearregions of the cells.
KCC2 mRNA fluorescence, normalized to control, showed a progressive decrease of KCC2mRNA expression 2 and 3 weeks after SE to 81±8.3 and 44±7.8% of control level,respectively (Fig. 6 C, n~100 ROIs, see Methods, 4 rats in each group, t62=1.95, P=0.08 andt62=2.34, P=0.0095, respectively). Similarly, the proportion of EC L5 cells expressingKCC2 mRNA (at least 2 red spots around the nucleus as in Fig. 6 A3 & B3), relative to thenumber of nuclei, decreased from 63.9±8.5% of EC L5 cells in control animals to 47.3±6.7and 36.3±4.3% of total cell number 2 and 3 weeks after SE, respectively (Fig. 6 D, mean±SEM, n~300 cells for 4 rats in each group, t34=3.14, P=0.045 and t28=4.21, P=0.007,respectively).
Progressive decrease of KCC2 protein—We also examined KCC2 protein levels inEC L5 from control and post SE rats using Western blot and single cell analysis. The results,shown in Fig. 7 A, B, illustrate a significant reduction of KCC2 protein 2 and 3 weeks afterSE to 78.8±7.5 and 38.1±4.3% of control levels, respectively (mean±SEM, n=5 rats,t12=2.17, P=0.01 and t18=4.6, P=0.0006, respectively). Using fluorescenceimmunohistochemistry we also studied the distribution of KCC2 protein and its loss aftertreatment (Fig. 7 C). In control rats KCC2 immunoreactivity was detected as densely packedperisomatic fluorescence (Fig. 7 C, top panel, and inset) on top of a diffuse neuropil signal.Two and 3 weeks post SE, KCC2 immunofluorescence had gradually decreased in theneuronal cell bodies (Fig. 7 C, D) with a weak discrete fluorescence remaining in theperisomatic areas of the EC L5 neurons (Fig. 7 C, middle and lower panel, and insets).Somatic immunofluorescence for KCC2 decreased to 66±3.5 and 34±1.9% of control level 2and 3 week after SE, respectively (Fig. 7 D, mean±SEM, n=100 ROIs from 4 rats, t34=7.85,P=0.007 and t41=6.39, P=0.00006, respectively).
In the neuropil, the KCC2 signal decrease was more delayed. Here, the KCC2 signaldecreased to 96±4.1% and 60±4.4%, at 2 and 3 weeks respectively. Roughly estimating a1:1 ratio for soma versus neuropil volume, total KCC2 immunofluorescence changes are ingood agreement with the Western Blot data. To establish that neurons were not dying andreplaced by glia, the neuron-specific fluorescent NeuroTrace Stain was used forcounterstaining. These stainings showed stable number of neurons (157.6±6.5 in control vs.
Bragin et al. Page 9
Eur J Neurosci. Author manuscript; available in PMC 2010 August 1.
NIH
-PA Author Manuscript
NIH
-PA Author Manuscript
NIH
-PA Author Manuscript

154.6±21.3 three weeks post insult, 3 rats, t26=2.34, P=0.44) and that the KCC2 signal washighly specific for neurons (> 95% of KCC2 positive cells were NeuroTrace positive).Interestingly, in the high-dose pilocarpine model, there is also evidence for an early,functional downregulation of KCC2 in the downstream dentate gyrus that compromises thegatekeeper function of this structure for spread of epileptiform activity from the EC into thehippocampus (Pathak et al., 2007). Concurrent with the compromise in this gatekeeperfunction, there is evidence for epileptiform EEG activity in vivo (El-Hassar et al., 2007).
Early changes in NKCC1 and KCC2 are specific to EC L5—The high amplitudeEEG spiking that occurs during SE might well be sufficient to trigger the progressivechanges in NKCC1 and KCC2 expression seen in EC L5 in other cortical areas, includingthe hippocampus and subiculum. We therefore extended our analysis to include thesuperficial layers of the EC, as well as subiculum, dentate gyrus, and perirhinal cortex. Fig.8 A,B show in a low magnification overview, the expression of NKCC1 mRNA in the deepEC 3 weeks after SE, while superficial layers, subiculum, dentate gyrus and perirhinalcortex show no expression. The plot of mean values of fluorescence from these areas (Fig.8C, from higher magnificiation images, and normalized to controls) demonstrates this highlyspecific expression of NKCC1 mRNA in the deep medial EC, and, to a much weaker extent,in the deep lateral EC (columns 2), while all other regions tested negative (columns 3-10).
The same specificity was observed in the corresponding studies of KCC2 expression. Theoverview in Fig. 9 A,B shows downregulation of KCC2 mRNA 3 weeks after SEspecifically in the deep EC, particularly in the medial part. The quantitative analysis of meanfluorescence demonstrates ongoing downregulation of KCC2 mRNA in the deep mEC by56±7.8 % (3 weeks post SE, t62=2.34, P=0.0095) and in the deep lateral EC by 14±4.5 % (3weeks post SE, t62= 2.41, P=0.039), whereas superficial layers of the EC, as well assubiculum, dentate gyrus, and perirhinal cortex do not show any significant changes (Fig.9C).
A further important outcome of the extended analysis is that there is no significant earlyneuronal loss in L3 following the “low dose pilocarpine - Diazepam 1 hour after SE onset”protocol used here, as opposed to “Diazepam administration >2 hour after SE onset”protocols (Du et al., 1995; Kobayashi et al., 2003). First, the absence of significant changesof KCC2 mRNA in EC L3 indicates that L3 pyramidal neurons have not died up to 3 weekspost SE in our rats. Second, neuron survival was confirmed in NeuroTrace stainings thatshowed stable neuron counts in L3 (114±14.2, 112±18.1 and 116±15 neurons in Control and2 and 3 weeks after SE, respectively, t10= −0.18, P= 0.86 and t 10 = −0.77, P= 0.46,respectively, 3 rats).
Cl- transport block inhibited burst activity—To explore the functional role ofNKCC1 upregulation for the shift in EIPSP and the increase in polysynaptic burst responsespost insult we employed bumetanide, a diuretic that acts via blockade of Cl- transporters,and is more effective in blocking NKCC vs. KCC transporters (Russell, 2000; Sung et al.,2000; Hannaert et al., 2002; Beck et al., 2003). Here its lack of absolute specificity iscompensated by 1) the demonstrated strong down-regulation of KCC2 and 2) the fact thatonly Cl- inward transport can shift ECl positive to RMP. Block of residual KCC2 activitywill not prevent a strong hyperpolarizing shift of ECl during block of NKCC1. Fig. 10 Ashows plots of PSP amplitude, 3 weeks post SE, against membrane voltage, demonstratingthat the depolarizing shift in E(PSP) disappeared after a 20 min superfusion with bumetanide(10 μM). This corresponds to a passive redistribution of Cl- across the membrane. Fig. 10 Bshows an average PSP reversal potential relative to RMP (~ −72mV) for EC L5 neurons 3weeks post SE of more than +40 mV in normal recording condition, reduced to only +10mV in the presence of bumetanide (absolute voltage average E(PSP) was −29.7±2.3 mV in
Bragin et al. Page 10
Eur J Neurosci. Author manuscript; available in PMC 2010 August 1.
NIH
-PA Author Manuscript
NIH
-PA Author Manuscript
NIH
-PA Author Manuscript

control conditions, −60.9±4.1 mV in the presence of bumetanide (t24=2.26, P=0.00009), and−34.2±3.4 mV during washout of bumetanide, n=5, t24=1.52, P=0.0057 vs. bumetanide).
If disinhibition, or even excitation, secondary to the depolarizing shift of E(PSP) is crucial forthe occurrence of polysynaptic burst responses in the post SE latent period, then restoringthe reversal potential by bumetanide should also block polysynaptic burst responses. Figure10 C demonstrates that, indeed, perfusion with bumetanide (10 μM) effectively inhibitedpolysynaptic responses to single shock stimulation. After recording the strong polysynapticburst response shown in the top panel of Fig. 10 C, bumetanide superfusion was begun, andby 20 min, burst discharge was strongly attenuated (middle trace). With washout ofbumetanide for 30 minutes the strong polysynaptic response was restored (lower trace). Onaverage, bumetanide reduced the number of neurons with a polysynaptic response from64.8% (9 neurons out of a total of 14) to 11.6% (2/14) of cells from rats 3 weeks afterpilocarpine insult. Washout of bumetanide for 30 min restored the number of neuronsresponding to 35.1% (5/14, Fig. 10 D). The response duration at half-maximal amplitudedecreased in bumetanide by 36±9% of the control response (t13=13.8, P=0.0000000004),and recovered to 75±11 % during washout (t13=−5.07, P=0.0002 vs. bumetanide).
GABAAergic excitation has minor effect on bursts—The depolarizing shift in PSPreversal potential would lead to both, disinhibition and direct GABAergic excitation of L5neurons. We examined the role of direct excitation in burst responses by blockingGABAAergic excitation with picrotoxin. Unlike bumetanide, picrotoxin (100 μM) had onlymodest effects on polysynaptic burst discharge 3 weeks post SE (Fig. 11 A1, A2; inpicrotoxin we observed also spontaneous bursts; only evoked bursts recorded >5s after aspontaneous burst were analyzed; these bursts were apparently not affected by a precedingspontaneous burst). In the population of cells studied, picrotoxin reduced the number ofspikes in polysynaptic burst responses from 9.8±0.8 to 7.9±0.7 at 3 weeks post SE (Fig.11C, n=8 neurons, t24=2.26, P=0.000089). When ten of such responses from the same cellwere averaged, it was found as in Fig. 11 B1, B2, that picrotoxin reduced action potentialamplitudes in the averaged burst responses by 10.5±3.4%, suggesting an increasedvariability in the timing of action potentials after stimulation (n=8, p=0.094). Thus, thepresence of GABAergic excitation apparently increased timing precision of firing in thenetwork, probably due to an overall increase in excitability, rather than direct excitation, asGABAergic transmission may be delayed due to being downstream of interneuronexcitation. By contrast to the modest effect of picrotoxin alone, addition of CNQX (10 μM)plus APV (50 μM) to the ACSF/picrotoxin saline almost completely blocked the synapticresponses (−95.9±0.26%, t7=−10.05, P=0.00002), demonstrating that the bursts weremediated primarily by polysynaptic glutamatergic transmission (Fig. 11 A3, B3; in CNQXand APV, with no picrotoxin, monosynaptic PSPs were evoked, as shown in Fig. 2A). Therewas a trend toward reduction of burst duration in picrotoxin which did not reach statisticalsignificance (Fig. 11D).
DiscussionThe principal findings of this study are that in the latent period post SE, prior to occurrenceof behavioral seizures, there is a strong increase in neuronal excitability in the deep medialEC, i.e. a progressive increase in the percentage of EC L5 neurons that respond to weaksynaptic stimulation with polysynaptic burst discharge. Natural activity patterns in the ECbecome therefore more and more likely to trigger a spontaneous seizure that by definitionwill end the latent period. Our findings suggest that after SE, TLE develops primarily in thedeep EC. To the best of our knowledge there has been no other study demonstratingepileptiform activity in response to synaptic stimulation in any other brain region during thelatent period. This regional specificity is corroborated by the specificity of changes in
Bragin et al. Page 11
Eur J Neurosci. Author manuscript; available in PMC 2010 August 1.
NIH
-PA Author Manuscript
NIH
-PA Author Manuscript
NIH
-PA Author Manuscript

NKCC1 and KCC2 expression for the deep EC which would lead to disinhibition. Theseveral other cortical and hippocampal regions examined did not show any changes,although latent period interictal activity has been shown in-vivo for CA1 in the high-dosepilocarpine model of TLE (El-Hassar et al., 2007). It is very important that the changes inL5 neuron excitability we have reported occurred without appreciable loss of EC L3pyramidal neuron loss. A high degree of loss of L3 pyramidal neurons has been shown to betypical of the pathology of late TLE (Du et al., 1993; Du et al., 1995), and can occur within24 hours of prolonged SE (Du et al., 1995), but these findings are not relevant here sinceappreciable loss does not occur.
Our protocol for generating SE may be considered to be somewhat weaker than that ofAndre et al (Andre et al., 2007) in that Diazepam is administered 1 hr after SE onset ratherthan 2 hr, plus administration of atropine. Even though neither Diazepam nor atropine stopSE immediately at either time point, we found that this alteration facilitated recovery of ratsand produced brain slices with better viability. Rightly or wrongly, we also reasoned that aweaker initial insult might produce more gradually developing cellular or network changesand therefore be easier to analyze. When tested by video monitoring, our protocol produceddemonstrable seizure activity at 8 weeks post SE in 10 of 13 rats observed (see Methods).We surmise that the percentage might have gone higher had resources been available formore extended observations. In any event, the observed cellular changes will facilitateepileptiform activity, and will most likely be triggered also by the stronger Li-pilocarpineSE protocols.
The change in EC L5 excitability is concurrent with, and we propose aided by, a strong andprogressive depolarizing shift in the GABAAergic PSP reversal potential which occurs inabout 80% of EC L5 neurons. This percentage is in excellent agreement with theupregulation of the Cl- inward transporter NKCC1. The concurrent downregulation of theCl- outward transporter KCC2 in most EC L5 neurons will facilitate net Cl- accumulation byNKCC1, but will not bring by itself ECl positive to resting membrane potential. The ongoingchanges in NKCC1 and KCC2 are also in excellent agreement with the strongly shiftedE(PSP) at 3 weeks post SE, even though determination of the latter is less precise, thusadding measurement variability, due to the extrapolation of PSP amplitudes and the reduceddifference in slopes.
Weaker shifts in the GABAergic PSP reversal potential have been observed at a much laterstage of TLE disease progression; i.e., in late chronic epilepsy in subicular neurons,apparently due to much weaker changes in NKCC1 expression (Cohen et al., 2002; deGuzman et al., 2006; Palma et al., 2006; Huberfeld et al., 2007; Munoz et al., 2007; Sen etal., 2007). The differences in region, stage of disease progression, level of interictal and ictalactivity, and expression levels suggest fundamental differences in the signaling network thatinitiate and further control changed expression levels of NKCC1 and KCC2 in the latentperiod vs. late chronic TLE.
Normal reversal potentials for GABA-PSP’s in EC L5 neurons, i.e. ~Vrest, have been foundin two distinct SE-TLE models during chronic epilepsy (Fountain et al., 1998; de Guzman etal., 2006), suggesting that the very large shifts in GABAA E(PSP) we report may largelyrecover once chronic epilepsy has been established. There are also other possibleexplanations: first, recordings may have been obtained from the lateral EC, where we foundonly small changes in NKCC1 and KCC2. Furthermore, different TLE models were used.De Guzman et al. (2006) studied the high dose pilocarpine rat model of TLE that has beenshown to differ significantly from the Li-pilocarpine rat model in the underlying signaltransduction pathways that are activated during SE (Ormandy et al., 1989), and also bydifferences in L3 neuronal loss (above). This could make a difference in the E(PSP) shift as
Bragin et al. Page 12
Eur J Neurosci. Author manuscript; available in PMC 2010 August 1.
NIH
-PA Author Manuscript
NIH
-PA Author Manuscript
NIH
-PA Author Manuscript

well as whether it recovers in chronic epilepsy or not. We are planning to investigate someof these important issues in future studies.
The inference that the strong depolarizing shift in the GABAAergic PSP is the primary causefor the observed change in deep EC excitability is supported by the effects of bumetanide, ablocker of the Cl- inward transporter NKCC1. Bumetanide restored a more hyperpolarizedPSP reversal potential and largely eliminated epileptiform burst responses to stimulation.These findings demonstrate the necessity for a strongly depolarized E(PSP) for theoccurrence of the epileptiform burst responses in this phase post SE, but do not exclude thepossibility that other concurrent changes, e.g. the observed reduction in the inputconductance of L5 neurons, are required, in addition. The effects of bumetanide furtherdemonstrate that, 3 weeks after SE, inhibition can still be very effective despite the observeddecrease in the GABA-PSP conductance that may be due to downregulation of GABAARgenes or loss of inhibitory synapses and interneurons (Bernard et al., 2004; Gorter et al.,2006; Kumar and Buckmaster, 2006). The GABA-PSP has been already slightlydepolarizing in control neurons, and, 3 weeks post SE, bumetanide did not fully restore it tothat level. Thus, inhibition would be always “shunting”, as opposed to “hyperpolarizing”.One should keep in mind, however, that for preventing triggering of AP firing by excitatorycurrents the most important parameter appears to be the amplitude of inhibitory currents atmembrane potentials close to the firing threshold. This current amplitude gradually varieswith a shift in E(PSP) according to the driving force for Cl- close to the firing threshold (~−45 mV). Hence 3 weeks after SE and in the presence of bumetanide (E(PSP) ≈ −60 mV) thedriving force at −45mV is ~15 mV, as opposed to ~26 mV in control rats, and thus reducedby ~ 42%. In consequence Cl- currents in this critical membrane potential region areattenuated by both, a decrease in driving force and in GABA-PSP conductance, but, in thepresence of bumetanide, are still quite effective to suppress epileptiform activity. This giveshope that largely restoring the Cl--gradient may have therapeutic benefits in-vivo.
We believe that our findings uncover key elements operative in the early development ofTLE and emphasize the importance of the deep entorhinal cortex in the origin andprogression of changes that lead to the disorder. As such they may suggest useful startingpoints for blocking the development of TLE following high risk insults.
AcknowledgmentsThis work was supported by National Institutes of Health Grant RR15636. We thank Dr. C. Lytle for a gift ofmonoclonal NKCC antibody, Drs. Fernando Valenzuela and Honglian Shi for helpful discussions and supplyingmolecular biology materials and Drs. Francisco J. Alvarez-Leefmans, Patric K. Stanton and Rafael Gutierrez forhelpful discussions, suggestions, and editorial help. The FISH work was supported by NIH grant AA015614 (toFV). Jennifer Sanderson was supported by funds from NIH training grant #AA014127 and NRSA pre-doctoralfellowship #AA016880.
Abbreviations
ACSF Artificial Cerebro-Spinal Fluid
CA Cornu Ammonis
DAPI 4′, 6′-diamidino-2-phenylindole
EC entorhinal cortex
E(PSP) PSP reversal potential
FISH fluorescence in-situ hybridization
IPSP inhibitory postsynaptic potential
Bragin et al. Page 13
Eur J Neurosci. Author manuscript; available in PMC 2010 August 1.
NIH
-PA Author Manuscript
NIH
-PA Author Manuscript
NIH
-PA Author Manuscript

PBS phosphate buffered saline
PBS-T PBS containing 0.2% Triton-X-100
PSP postsynaptic potential
RMP resting membrane potential
SE status epilepticus
TLE temporal lobe epilepsy
ReferencesAndre V, Dube C, Francois J, Leroy C, Rigoulot MA, Roch C, Namer IJ, Nehlig A. Pathogenesis and
pharmacology of epilepsy in the lithium-pilocarpine model. Epilepsia. 2007; 48(Suppl 5):41–47.[PubMed: 17910580]
Annegers JF, Grabow JD, Groover RV, Laws ER Jr. Elveback LR, Kurland LT. Seizures after headtrauma: a population study. Neurology. 1980; 30:683–689. [PubMed: 7190235]
Bartolomei F, Khalil M, Wendling F, Sontheimer A, Regis J, Ranjeva JP, Guye M, Chauvel P.Entorhinal cortex involvement in human mesial temporal lobe epilepsy: an electrophysiologic andvolumetric study. Epilepsia. 2005; 46:677–687. [PubMed: 15857433]
Bartolomei F, Wendling F, Regis J, Gavaret M, Guye M, Chauvel P. Pre-ictal synchronicity in limbicnetworks of mesial temporal lobe epilepsy. Epilepsy Res. 2004; 61:89–104. [PubMed: 15451011]
Beck J, Lenart B, Kintner DB, Sun D. Na-K-Cl cotransporter contributes to glutamate-mediatedexcitotoxicity. J Neurosci. 2003; 23:5061–5068. [PubMed: 12832529]
Ben-Ari Y, Gaiarsa JL, Tyzio R, Khazipov R. GABA: a pioneer transmitter that excites immatureneurons and generates primitive oscillations. Physiol Rev. 2007; 87:1215–1284. [PubMed:17928584]
Bernard C, Anderson A, Becker A, Poolos NP, Beck H, Johnston D. Acquired dendritic channelopathyin temporal lobe epilepsy. Science. 2004; 305:532–535. [PubMed: 15273397]
Bormann J, Hamill OP, Sakmann B. Mechanism of anion permeation through channels gated byglycine and gamma-aminobutyric acid in mouse cultured spinal neurones. J Physiol. 1987;385:243–286. [PubMed: 2443667]
Cavalheiro EA. The pilocarpine model of epilepsy. Ital J Neurol Sci. 1995; 16:33–37. [PubMed:7642349]
Cohen I, Navarro V, Clemenceau S, Baulac M, Miles R. On the origin of interictal activity in humantemporal lobe epilepsy in vitro. Science. 2002; 298:1418–1421. [PubMed: 12434059]
de Guzman P, Inaba Y, Biagini G, Baldelli E, Mollinari C, Merlo D, Avoli M. Subiculum networkexcitability is increased in a rodent model of temporal lobe epilepsy. Hippocampus. 2006; 16:843–860. [PubMed: 16897722]
Delpire E. Cation-Chloride Cotransporters in Neuronal Communication. News Physiol Sci. 2000;15:309–312. [PubMed: 11390932]
Du F, Eid T, Lothman EW, Kohler C, Schwarcz R. Preferential neuronal loss in layer III of the medialentorhinal cortex in rat models of temporal lobe epilepsy. J Neurosci. 1995; 15:6301–6313.[PubMed: 7472396]
Du F, Whetsell WO, Abou KB, Blumenkopf B, Lothman EW, Schwarcz R. Preferential neuronal lossin layer III of the entorhinal cortex in patients with temporal lobe epilepsy. Epilepsy Res. 1993;16:223–233. [PubMed: 8119273]
Dube C, Marescaux C, Nehlig A. A metabolic and neuropathological approach to the understanding ofplastic changes that occur in the immature and adult rat brain during lithium-pilocarpine-inducedepileptogenesis. Epilepsia. 2000; 41(Suppl 6):S36–43. [PubMed: 10999517]
Egorov AV, Angelova PR, Heinemann U, Müller W. Ca2+-independent muscarinic excitation of ratmedial entorhinal cortex layer V neurons. Eur J Neurosci. 2003; 18:3343–3351. [PubMed:14686907]
Bragin et al. Page 14
Eur J Neurosci. Author manuscript; available in PMC 2010 August 1.
NIH
-PA Author Manuscript
NIH
-PA Author Manuscript
NIH
-PA Author Manuscript

Egorov AV, Heinemann U, Müller W. Differential excitability and voltage-dependent Ca2+ signallingin two types of medial entorhinal cortex layer V neurons. Eur J Neurosci. 2002; 16:1305–1312.[PubMed: 12405991]
El-Hassar L, Milh M, Wendling F, Ferrand N, Esclapez M, Bernard C. Cell domain-dependentchanges in the glutamatergic and GABAergic drives during epileptogenesis in the rat CA1 region.J Physiol. 2007; 578:193–211. [PubMed: 17008374]
Engel J. Clinical evidence for the progressive nature of epilepsy. Epilepsy Res. (Supplement). 1989;12:9–20. Engel, J., (1989). Epilepsy Res. (Supple) 12:9-20.
Fountain NB, Bear J, Bertram EH 3rd, Lothman EW. Responses of deep entorhinal cortex areepileptiform in an electrogenic rat model of chronic temporal lobe epilepsy. J Neurophysiol. 1998;80:230–240. [PubMed: 9658044]
Gloveli T, Egorov AV, Schmitz D, Heinemann U, Müller W. Carbachol-induced changes inexcitability and [Ca2+]i signalling in projection cells of medial entorhinal cortex layers II and III.Eur. J. Neurosci. 1999; 11:3626–3636. [PubMed: 10564370]
Gorter JA, van Vliet EA, Aronica E, Breit T, Rauwerda H, da Silva F.H. Lopes, Wadman WJ.Potential new antiepileptogenic targets indicated by microarray analysis in a rat model fortemporal lobe epilepsy. J Neurosci. 2006; 26:11083–11110. [PubMed: 17065450]
Guzowski JF, McNaughton BL, Barnes CA, Worley PF. Environment-specific expression of theimmediate-early gene Arc in hippocampal neuronal ensembles. Nat Neurosci. 1999; 2:1120–1124.[PubMed: 10570490]
Hamam BN, Kennedy TE, Alonso A, Amaral DG. Morphological and electrophysiologicalcharacteristics of layer V neurons of the rat medial entorhinal cortex. J Comp Neurol. 2000;418:457–472. [PubMed: 10713573]
Hannaert P, Alvarez-Guerra M, Pirot D, Nazaret C, Garay RP. Rat NKCC2/NKCC1 cotransporterselectivity for loop diuretic drugs. Naunyn Schmiedebergs Arch Pharmacol. 2002; 365:193–199.[PubMed: 11882915]
Huberfeld G, Wittner L, Clemenceau S, Baulac M, Kaila K, Miles R, Rivera C. Perturbed chloridehomeostasis and GABAergic signaling in human temporal lobe epilepsy. J Neurosci. 2007;27:9866–9873. [PubMed: 17855601]
Kobayashi M, Wen X, Buckmaster PS. Reduced inhibition and increased output of layer II neurons inthe medial entorhinal cortex in a model of temporal lobe epilepsy. J Neurosci. 2003; 23:8471–8479. [PubMed: 13679415]
Kumar SS, Buckmaster PS. Hyperexcitability, interneurons, and loss of GABAergic synapses inentorhinal cortex in a model of temporal lobe epilepsy. J Neurosci. 2006; 26:4613–4623.[PubMed: 16641241]
Misgeld U, Deisz RA, Dodt HU, Lux HD. The role of chloride transport in postsynaptic inhibition ofhippocampal neurons. Science. 1986; 232:1413–1415. [PubMed: 2424084]
Munoz A, Mendez P, DeFelipe J, Alvarez-Leefmans FJ. Cation-chloride cotransporters and GABA-ergic innervation in the human epileptic hippocampus. Epilepsia. 2007; 48:663–673. [PubMed:17319917]
Ormandy GC, Jope RS, Snead OC 3rd. Anticonvulsant actions of MK-801 on the lithium-pilocarpinemodel of status epilepticus in rats. Exp Neurol. 1989; 106:172–180. [PubMed: 2553470]
Palma E, Amici M, Sobrero F, Spinelli G, Di Angelantonio S, Ragozzino D, Mascia A, Scoppetta C,Esposito V, Miledi R, Eusebi F. Anomalous levels of Cl- transporters in the hippocampalsubiculum from temporal lobe epilepsy patients make GABA excitatory. Proc Natl Acad Sci U SA. 2006; 103:8465–8468. [PubMed: 16709666]
Pathak HR, Weissinger F, Terunuma M, Carlson GC, Hsu FC, Moss SJ, Coulter DA. Disrupteddentate granule cell chloride regulation enhances synaptic excitability during development oftemporal lobe epilepsy. J Neurosci. 2007; 27:14012–14022. [PubMed: 18094240]
Payne JA, Stevenson TJ, Donaldson LF. Molecular characterization of a putative K-Cl cotransporter inrat brain. A neuronal-specific isoform. J Biol Chem. 1996; 271:16245–16252. [PubMed: 8663311]
Peterson SL, Purvis RS, Griffith JW. Comparison of neuroprotective effects induced by alpha-phenyl-N-tert-butyl nitrone (PBN) and N-tert-butyl-alpha-(2 sulfophenyl) nitrone (S-PBN) in lithium-pilocarpine status epilepticus. Neurotoxicology. 2005; 26:969–979. [PubMed: 15890407]
Bragin et al. Page 15
Eur J Neurosci. Author manuscript; available in PMC 2010 August 1.
NIH
-PA Author Manuscript
NIH
-PA Author Manuscript
NIH
-PA Author Manuscript

Russell JM. Sodium-potassium-chloride cotransport. Physiol Rev. 2000; 80:211–276. [PubMed:10617769]
Schwarcz R, Eid T, Du F. Neurons in layer III of the entorhinal cortex. A role in epileptogenesis andepilepsy? Ann N Y Acad Sci. 2000; 911:328–342. [PubMed: 10911883]
Schwartzkroin PA, Knowles WD. Intracellular study of human epileptic cortex: in vitro maintenanceof epileptiform activity? Science. 1984; 223:709–712. [PubMed: 6695179]
Sen A, Martinian L, Nikolic M, Walker MC, Thom M, Sisodiya SM. Increased NKCC1 expression inrefractory human epilepsy. Epilepsy Res. 2007; 74:220–227. [PubMed: 17344024]
Staley KJ, Soldo BL, Proctor WR. Ionic mechanisms of neuronal excitation by inhibitory GABAAreceptors. Science. 1995; 269:977–981. [PubMed: 7638623]
Sung KW, Kirby M, McDonald MP, Lovinger DM, Delpire E. Abnormal GABAA receptor-mediatedcurrents in dorsal root ganglion neurons isolated from Na-K-2Cl cotransporter null mice. JNeurosci. 2000; 20:7531–7538. [PubMed: 11027211]
Turski L, Diedrichs S, Klockgether T, Schwarz M, Turski WA, Sontag KH, Bortolotto ZA,Calderazzo-Filho LS, Cavalheiro EA. Paradoxical anticonvulsant activity of the gamma-aminobutyrate antagonist bicuculline methiodide in the rat striatum. Synapse. 1991; 7:14–20.[PubMed: 2006466]
Wang C, Shimizu-Okabe C, Watanabe K, Okabe A, Matsuzaki H, Ogawa T, Mori N, Fukuda A, SatoK. Developmental changes in KCC1, KCC2, and NKCC1 mRNA expressions in the rat brain.Brain Res Dev Brain Res. 2002; 139:59–66.
Weiss GH, Salazar AM, Vance SC, Grafman JH, Jabbari B. Predicting posttraumatic epilepsy inpenetrating head injury. Arch Neurol. 1986; 43:771–773. [PubMed: 3089201]
Wu HQ, Schwarcz R. Focal microinjection of gamma-acetylenic GABA into the rat entorhinal cortex:behavioral and electroencephalographic abnormalities and preferential neuron loss in layer III. ExpNeurol. 1998; 153:203–213. [PubMed: 9784280]
Yamada J, Okabe A, Toyoda H, Kilb W, Luhmann HJ, Fukuda A. Cl-uptake promoting depolarizingGABA actions in immature rat neocortical neurones is mediated by NKCC1. J Physiol. 2004;557:829–841. [PubMed: 15090604]
Yilmazer-Hanke DM, Wolf HK, Schramm J, Elger CE, Wiestler OD, Blumcke I. Subregionalpathology of the amygdala complex and entorhinal region in surgical specimens from patients withpharmacoresistant temporal lobe epilepsy. J Neuropathol Exp Neurol. 2000; 59:907–920.[PubMed: 11079781]
Bragin et al. Page 16
Eur J Neurosci. Author manuscript; available in PMC 2010 August 1.
NIH
-PA Author Manuscript
NIH
-PA Author Manuscript
NIH
-PA Author Manuscript

Figure 1. Increased polysynaptic burst excitation in EC L5 neurons post SEA: Postsynaptic response in EC-L5 neuron from untreated rat to single presynaptic stimulus(*, 500 nA, 70 μs ). B: Polysynaptic burst response in L5 neuron 3 weeks after SE to a muchsmaller stimulus (*, 100 nA, 70 μs, see also Figs. 10 & 11). The primary evoked PSP (box)is shown enlarged in the inset (30ms × 5mV). For this recording the cell was hyperpolarizedby negative DC to prevent firing. C: Bar chart showing percent of EC-L5 neuronsresponding to a single stimulation with a polysynaptic depolarization. A single stimulusevokes a polysynaptic response in only 2.4% of EC-L5 cells from control rats (n=42), but in10.8% and in 61.8% of cells from rats 2 (n=37) and 3 weeks after SE (n=34), respectively.
Bragin et al. Page 17
Eur J Neurosci. Author manuscript; available in PMC 2010 August 1.
NIH
-PA Author Manuscript
NIH
-PA Author Manuscript
NIH
-PA Author Manuscript

Figure 2. Positive shift of the GABAAergic PSP reversal potential 2 and 3 weeks after SEA: Monosynaptic GABAAergic PSPs evoked at 5 different membrane potentials in EC L5neuron from a control (upper traces) and from a rat 3 weeks after SE (lower traces) recordedwith a sharp microelectrode. Membrane potential was altered by current application (500 mspulses) through the microelectrode. Asterisks denote time of presynaptic stimulus.Recordings were performed in the presence of the AMPA/kainate glutamate receptorantagonist CNQX (10 μM) and the NMDA receptor antagonist APV (50 μM). B1,2,3: I-Vrelationship of prestimulus membrane potential (o) and the absolute value of theGABAAergic PSP (×) measured 15 ms after stimulation vs. electrode current. Data wereobtained using the protocol of part A, fitted with linear regressions. Intersection ofmembrane potential and PSP plots occurs at the PSP reversal potential (EPSP, arrows). C:Histograms showing the number of EC L5 neurons displaying a GABAAergic reversalpotential within a 2 mV range at the 3 time points examined. Envelops (dotted curves) arebest Gaussian fits to the 5 obvious populations. In neurons from control rats, the EPSPGaussian fit has a median value of ~ −69 mV. Neurons from rats both 2 and 3 weeks afterSE broke into 2 classes, no EPSP shift, and significant shift. At 2 weeks 77% of the neuronshad a shifted mean of ~ −54 and at 3 weeks 81% displayed a mean shift to ~ −28 mV. Thenon-shifting neurons comprised 23 and 19% of the populations respectively. Their EPSPdistribution was indistinguishable from the control group. N=24, 34 and 26 recorded cellsfor control and 2 and 3 week groups. D: Mean±SEM of GABAAergic EPSP relative toresting membrane potential (RMP) for the shifted populations 2 (n=26) and 3 weeks after SE(n=21) demonstrate a progressive depolarizing shift of the reversal potential in comparisonwith control (n=24, ** p<0.01, *** p<0.001).
Bragin et al. Page 18
Eur J Neurosci. Author manuscript; available in PMC 2010 August 1.
NIH
-PA Author Manuscript
NIH
-PA Author Manuscript
NIH
-PA Author Manuscript

Figure 3. mRNA for NKCC1, a Cl- inward transporter, progressively increases post SE in EC L5A, B: Fluorescence in-situ-hybridization shows up-regulation of NKCC1 mRNA 3 weeksafter pilocarpine insult in comparison with control (red signal, A1, B1). DAPI nuclear stainindicated no change in cell numbers (blue signal A2, B2). The lower panels, A3 & B3 showmagnified, merged views of the areas outlined in A1,2 & B1,2 and illustrate perinuclearlocalization of NKCC1 mRNA (A3, B3). C: Bar graph showing increase in NKCC1 mRNApost SE. Data were quantified by forming the ratio of the total NKCC1 signal to totalfluorescence of the nuclear stain in a given ROI. These ratios were then normalized to thevalues from control rat (mean±SEM, n~100 ROIs for 4 rats in each group, * p<0.01, ***p<0.001). D: Mean number of NKCC1 mRNA-positive cells, expressed as % of nucleinumber determined from DAPI staining (Mean±SEM, n~300 cells for 4 rats in each group, *p<0.05, ** p<0.01).
Bragin et al. Page 19
Eur J Neurosci. Author manuscript; available in PMC 2010 August 1.
NIH
-PA Author Manuscript
NIH
-PA Author Manuscript
NIH
-PA Author Manuscript

Figure 4. NKCC1 protein is also upregulatedA, B, C: Fluorescence immunohistochemistry demonstrates progressive increase inexpression of NKCC1 protein from 2 to 3 weeks after SE in EC L5 (red signal, A1, B1, C1).Hoechst 33342 nuclei counterstain shows stable cell number (A2, B2 and C2, green signal).Merged views of the upper panel sets (A3, B3, C3) illustrate the pervasive increase inexpression. The boxed regions of these panels are shown enlarged below to better illustrateperinuclear and somatic location of NKCC1 (A4, B4, C4). D: Bar graph showing increase inNKCC1 protein post SE. Data were quantified by forming the ratio of the total NKCC1signal to total fluorescence of the nuclear stain in a given ROI. These ratios were thennormalized to the values from control rat (mean±SEM, 3 rats, ** p<0.01, *** p<0,001). E:Mean number of NKCC1 positive cells, expressed as % of nuclei number (H33342, mean±SEM, 3 rats, *** p<0.01).
Bragin et al. Page 20
Eur J Neurosci. Author manuscript; available in PMC 2010 August 1.
NIH
-PA Author Manuscript
NIH
-PA Author Manuscript
NIH
-PA Author Manuscript

Figure 5. EC L5 neurons increase expression of NKCC1 protein post SEA, B: Fluorescence immunohistochemistry demonstrates strong expression of NKCC1protein 3 weeks after SE in EC L5 (red signal, A1, B1). Neuron-specific NeuroTracecounterstain shows stable cell number (A2, B2, green signal). Overlay views illustrateperinuclear and somatic location of NKCC1 (A3, B3). Here, neurons throughout a 60 μmthick tissue block are shown. C: Mean of NKCC1 positive neurons, in % of NeuroTracepositive cells, progressively increases 2 and 3 weeks after pilocarpine-evoked SE in EC L5(mean±SEM, 3 rats, *** p<0.01).
Bragin et al. Page 21
Eur J Neurosci. Author manuscript; available in PMC 2010 August 1.
NIH
-PA Author Manuscript
NIH
-PA Author Manuscript
NIH
-PA Author Manuscript

Figure 6. mRNA for KCC2, a neuronal Cl- outward transporter, progressively decreases post SEin EC L5A, B: KCC2 mRNA expression detected by fluorescence in-situ-hybridization shows down-regulation of KCC2 mRNA 3 weeks after pilocarpine induced SE in comparison withcontrol (A1, B1, red signal). DAPI nuclear stain indicated no change in cell numbers (A2 &B2: blue signal). Merged magnified views of the areas outlined in A1,2 & B1,2 illustrateperinuclear localization of KCC2 mRNA (A3 & B3). C: Bar graph showing decrease inKCC2 mRNA post SE. Data were quantified by forming the ratio of the total KCC2 signalto total fluorescence of the nuclear stain in a given ROI. These ratios were then normalizedto the values from control rat (mean±SEM, n~100 ROIs for 4 rats in each group, ** p<0.01).D: Mean number of KCC2 positive cells, expressed as % of nuclei number (DAPI, mean±SEM, n~300 cells for 4 rats in each group, * p<0.05 and ** p<0.01, respectively).
Bragin et al. Page 22
Eur J Neurosci. Author manuscript; available in PMC 2010 August 1.
NIH
-PA Author Manuscript
NIH
-PA Author Manuscript
NIH
-PA Author Manuscript

Figure 7. KCC2 protein also decreases post SEA: Western blot KCC2 bands (~150 kDa) show significant gradual down-regulation ofKCC2 in an EC L5 region of rats 2 (2 wks pSE) and 3 weeks (3 wks pSE) after pilocarpineinduced SE in comparison with control. β-actin (~ 40 kDa) served as a loading control. B:Average optical densities, extracted from blots as in A, in % of control (mean±SEM, n=5, **p<0.01, *** p<0.001). These data are in excellent agreement with the mRNA and IPSPreversal potential data. C: Immunohistochemistry shows a gradual decrease of KCC2protein 2 and 3 weeks after pilocarpine induced SE, most prominent in somata. The whiteoutlined boxes in each panel show a magnified view of the cells identified by white arrowsin each panel. D: Bar graph showing decrease in average immunohistochemistry KCC2signals post SE, normalized to control.(mean±SEM, n~100 ROIs for 4 rats in each group, **p<0.01, *** p<0.001).
Bragin et al. Page 23
Eur J Neurosci. Author manuscript; available in PMC 2010 August 1.
NIH
-PA Author Manuscript
NIH
-PA Author Manuscript
NIH
-PA Author Manuscript

Figure 8. mRNA for NKCC1 does not increase in other cortical regionsA, B: Fluorescence in-situ-hybridization studies for NKCC1 mRNA showing the brainregion encompassing medial (mEC) and lateral EC (lEC), angular bundle (ab), subiculum(Sub), dentate gyrus (DG), and perirhinal cortex (PRC): A, control slice; B, slice taken 3weeks post SE. Left panels show DAPI staining of the region overlayed with rough outlinesof the component areas (A1, B1). Middle panels show NKCC1 signal. In control, there islittle to none while 3 weeks after SE signal is apparent in mid EC L5-6 but nowhere else(A2, B2). Images are merged in the right hand panels (A3, B3, for high power images seeFig. 3). C: Bar graph showing increase in NKCC1 mRNA only in deep EC post SE (mECL5, t54=2.15, P=0.037 and t54=3.54, P=0.0009, respectively) and lateral EC L5 labed # 2(t54=1.02, P=0.12 and t54=1.28, P=0.047, respectively), but no significant changes occurredin mEC L3 (# 3, t54=0.93, P=0.24 and t49=0.42, P=0.34, respectively), lEC (# 4, t54=0.27,P=0.86 and t54=0.24, P=0.094, respectively), mEC L1-2 (# 5, t54=−1.25, P=0.32 andt54=0.34, P=0.23, respectively), lEC L1-2 (# 6, t54=1.24, P=0.078 and t54=0.52, P=0.27,respectively), subiculum (# 7, t54=1.54, P=0.49 and t54=1.67, P=0.063, respectively),dentate gyrus (# 8, t54=0.45, P=0.098 and t54=−1.35, P=0.26, respectively), deep perirhinalcortex (# 9, t54=0.53, P=0.47 and t54=2.01, P=0.48, respectively) and PRC L1-3 (# 10 t54=−1.36, P=0.81 and t54=0.28, P=0.81, respectively; data extracted from higher magnificiationimages).
Bragin et al. Page 24
Eur J Neurosci. Author manuscript; available in PMC 2010 August 1.
NIH
-PA Author Manuscript
NIH
-PA Author Manuscript
NIH
-PA Author Manuscript

Figure 9. mRNA for KCC2 decreases only in deep ECA, B: Fluorescence in-situ-hybridization studies for KCC2 mRNA showing the brain regionencompassing medial (mEC) and lateral EC (lEC), angular bundle (ab), subiculum (Sub),dentate gyrus (DG), and perirhinal cortex (PRC): A, control slice; B, slice taken 3 weekspost SE. Left panels show KCC2 staining of the region, overlayed with rough outlines of thecomponent areas (A1, A2). In control, there is ubiquitous expression while 3 weeks after SEsignal has disappeared in EC L5-6, but nowhere else. Middle panels show DAPI staining ofthe region (A2, B2). Images are merged in the right hand panels (A3, B3, for high powerimages see Fig. 6). C: Bar graph showing decrease in KCC2 mRNA only in deep EC postSE (mEC L5, t62=1.95, P=0.082 and t62=2.34, P=0.0095, respectively), and lateral EC L5labed # 2 (t62=1.86, P=0.093 and t62=2.41, P=0.039, respectively), but no significantchanges occurred in mEC L3 (# 3, t62=0.34, P=0.32 and t62=−1.22, P=0.51, respectively),lEC (# 4, t62=−0.25, P=0.17 and t62=0.24, P=0.36, respectively), mEC L1-2 (# 5, t62=1.06,P=0.85 and t62=0.43, P=0.62, respectively), lEC L1-2 (# 6, t62=−0.45, P=0.68 and t62=0.15,P=0.39, respectively), subiculum (# 7, t62=−1.01, P=0.098 and t62=1.84, P=0.065,respectively), dentate gyrus (# 8, t62=1.05, P=0.77 and t62=−2.03, P=0.49, respectively),deep perirhinal cortex (# 9, t62=1.33, P=0.28 and t62=−1.52, P=0.53, respectively) and PRCL1-3 (# 10, t62=1.12, P=0.085 and t62=0.36, P=0.14, respectively; data extracted fromhigher magnificiation images).
Bragin et al. Page 25
Eur J Neurosci. Author manuscript; available in PMC 2010 August 1.
NIH
-PA Author Manuscript
NIH
-PA Author Manuscript
NIH
-PA Author Manuscript

Figure 10. The NKCC1 inhibitor bumetanide partially restores E(PSP), and suppressespolysynaptic excitationA: Plots of PSP amplitude against membrane potential before (top, open circles) and after a20 min exposure to bumetanide (bottom, crosses) of an EC L5 neuron from a rat 3 weeksafter SE demonstrate a hyperpolarizing shift of PSP reversal potential. Data were obtainedfrom protocols shown in Fig. 2A. The E(PSP) shifts from −29.7 mV to −60.9 mV.Measurements were made during block of EPSPs by CNQX (10 μM) and APV (50 μM). B:Population data showing that the positive-shifted GABAA-PSP reversal potential is stronglyand reversibly repolarized by bumetanide (mean±SEM, n=3, *** p<0.001). C: Top recordshows that the polysynaptic response to a single stimulus (100 nA) observed 3 weeks postSE is blocked by bumetanide (middle trace) but shows recovery with 30 minutes washout ofthe drug (bottom trace). D: Population data showing that bumetanide decreases the % of EC-L5 neurons 3 weeks post SE exhibiting a polysynaptic depolarization in response to a singlestimulation from 64.8% to 11.6% (n=14). This number recovered to 35.1% after a 30 minwashout of bumetanide for 30 minutes.
Bragin et al. Page 26
Eur J Neurosci. Author manuscript; available in PMC 2010 August 1.
NIH
-PA Author Manuscript
NIH
-PA Author Manuscript
NIH
-PA Author Manuscript
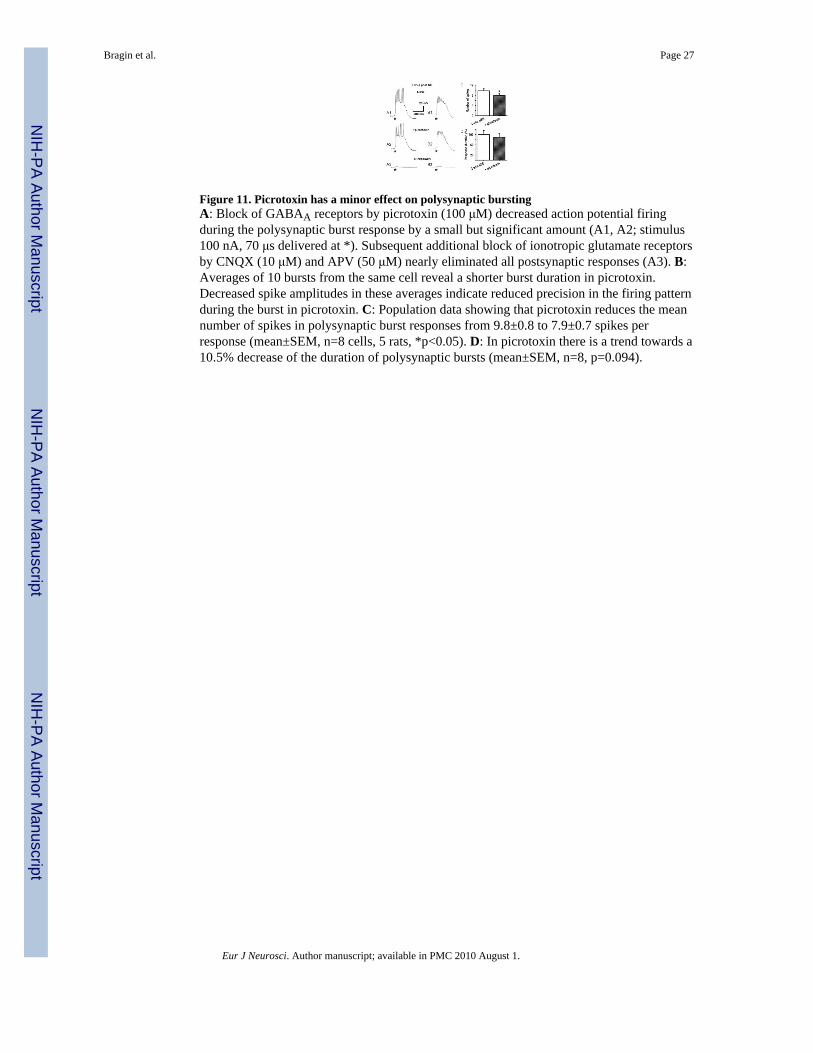
Figure 11. Picrotoxin has a minor effect on polysynaptic burstingA: Block of GABAA receptors by picrotoxin (100 μM) decreased action potential firingduring the polysynaptic burst response by a small but significant amount (A1, A2; stimulus100 nA, 70 μs delivered at *). Subsequent additional block of ionotropic glutamate receptorsby CNQX (10 μM) and APV (50 μM) nearly eliminated all postsynaptic responses (A3). B:Averages of 10 bursts from the same cell reveal a shorter burst duration in picrotoxin.Decreased spike amplitudes in these averages indicate reduced precision in the firing patternduring the burst in picrotoxin. C: Population data showing that picrotoxin reduces the meannumber of spikes in polysynaptic burst responses from 9.8±0.8 to 7.9±0.7 spikes perresponse (mean±SEM, n=8 cells, 5 rats, *p<0.05). D: In picrotoxin there is a trend towards a10.5% decrease of the duration of polysynaptic bursts (mean±SEM, n=8, p=0.094).
Bragin et al. Page 27
Eur J Neurosci. Author manuscript; available in PMC 2010 August 1.
NIH
-PA Author Manuscript
NIH
-PA Author Manuscript
NIH
-PA Author Manuscript