14-3-3 Expression in Denervated Hippocampus after Entorhinal Cortex Lesion Assessed by...
10
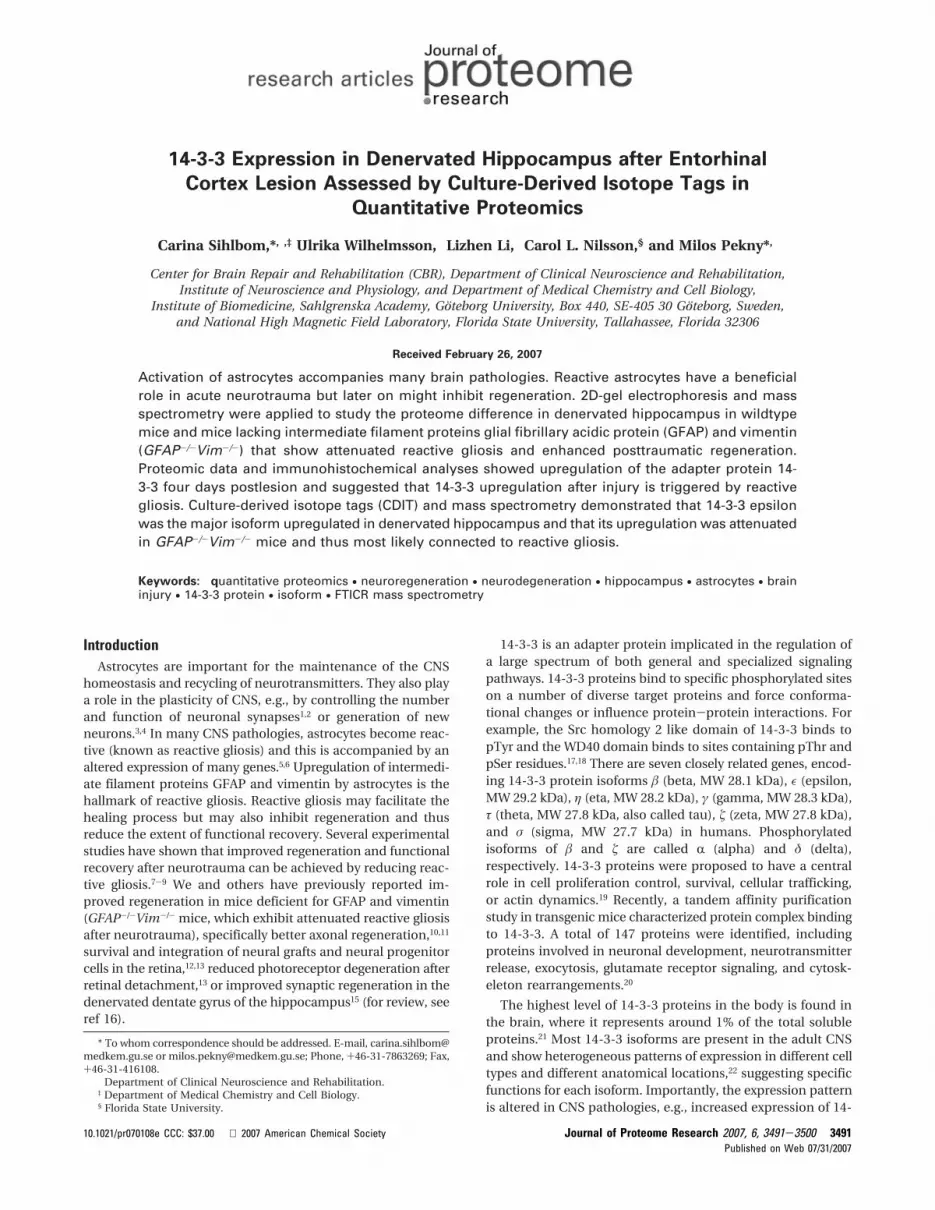
14-3-3 Expression in Denervated Hippocampus after Entorhinal Cortex Lesion Assessed by Culture-Derived Isotope Tags in Quantitative Proteomics Carina Sihlbom,* , ,‡ Ulrika Wilhelmsson, Lizhen Li, Carol L. Nilsson, § and Milos Pekny* , Center for Brain Repair and Rehabilitation (CBR), Department of Clinical Neuroscience and Rehabilitation, Institute of Neuroscience and Physiology, and Department of Medical Chemistry and Cell Biology, Institute of Biomedicine, Sahlgrenska Academy, Go ¨teborg University, Box 440, SE-405 30 Go ¨teborg, Sweden, and National High Magnetic Field Laboratory, Florida State University, Tallahassee, Florida 32306 Received February 26, 2007 Activation of astrocytes accompanies many brain pathologies. Reactive astrocytes have a beneficial role in acute neurotrauma but later on might inhibit regeneration. 2D-gel electrophoresis and mass spectrometry were applied to study the proteome difference in denervated hippocampus in wildtype mice and mice lacking intermediate filament proteins glial fibrillary acidic protein (GFAP) and vimentin (GFAP -/- Vim -/- ) that show attenuated reactive gliosis and enhanced posttraumatic regeneration. Proteomic data and immunohistochemical analyses showed upregulation of the adapter protein 14- 3-3 four days postlesion and suggested that 14-3-3 upregulation after injury is triggered by reactive gliosis. Culture-derived isotope tags (CDIT) and mass spectrometry demonstrated that 14-3-3 epsilon was the major isoform upregulated in denervated hippocampus and that its upregulation was attenuated in GFAP -/- Vim -/- mice and thus most likely connected to reactive gliosis. Keywords: quantitative proteomics • neuroregeneration • neurodegeneration • hippocampus • astrocytes • brain injury • 14-3-3 protein • isoform • FTICR mass spectrometry Introduction Astrocytes are important for the maintenance of the CNS homeostasis and recycling of neurotransmitters. They also play a role in the plasticity of CNS, e.g., by controlling the number and function of neuronal synapses 1,2 or generation of new neurons. 3,4 In many CNS pathologies, astrocytes become reac- tive (known as reactive gliosis) and this is accompanied by an altered expression of many genes. 5,6 Upregulation of intermedi- ate filament proteins GFAP and vimentin by astrocytes is the hallmark of reactive gliosis. Reactive gliosis may facilitate the healing process but may also inhibit regeneration and thus reduce the extent of functional recovery. Several experimental studies have shown that improved regeneration and functional recovery after neurotrauma can be achieved by reducing reac- tive gliosis. 7-9 We and others have previously reported im- proved regeneration in mice deficient for GFAP and vimentin (GFAP -/- Vim -/- mice, which exhibit attenuated reactive gliosis after neurotrauma), specifically better axonal regeneration, 10,11 survival and integration of neural grafts and neural progenitor cells in the retina, 12,13 reduced photoreceptor degeneration after retinal detachment, 13 or improved synaptic regeneration in the denervated dentate gyrus of the hippocampus 15 (for review, see ref 16). 14-3-3 is an adapter protein implicated in the regulation of a large spectrum of both general and specialized signaling pathways. 14-3-3 proteins bind to specific phosphorylated sites on a number of diverse target proteins and force conforma- tional changes or influence protein-protein interactions. For example, the Src homology 2 like domain of 14-3-3 binds to pTyr and the WD40 domain binds to sites containing pThr and pSer residues. 17,18 There are seven closely related genes, encod- ing 14-3-3 protein isoforms (beta, MW 28.1 kDa), (epsilon, MW 29.2 kDa), η (eta, MW 28.2 kDa), γ (gamma, MW 28.3 kDa), τ (theta, MW 27.8 kDa, also called tau), œ (zeta, MW 27.8 kDa), and σ (sigma, MW 27.7 kDa) in humans. Phosphorylated isoforms of and œ are called R (alpha) and δ (delta), respectively. 14-3-3 proteins were proposed to have a central role in cell proliferation control, survival, cellular trafficking, or actin dynamics. 19 Recently, a tandem affinity purification study in transgenic mice characterized protein complex binding to 14-3-3. A total of 147 proteins were identified, including proteins involved in neuronal development, neurotransmitter release, exocytosis, glutamate receptor signaling, and cytosk- eleton rearrangements. 20 The highest level of 14-3-3 proteins in the body is found in the brain, where it represents around 1% of the total soluble proteins. 21 Most 14-3-3 isoforms are present in the adult CNS and show heterogeneous patterns of expression in different cell types and different anatomical locations, 22 suggesting specific functions for each isoform. Importantly, the expression pattern is altered in CNS pathologies, e.g., increased expression of 14- * To whom correspondence should be addressed. E-mail, carina.sihlbom@ medkem.gu.se or [email protected]; Phone, +46-31-7863269; Fax, +46-31-416108. Department of Clinical Neuroscience and Rehabilitation. ‡ Department of Medical Chemistry and Cell Biology. § Florida State University. 10.1021/pr070108e CCC: $37.00 2007 American Chemical Society Journal of Proteome Research 2007, 6, 3491-3500 3491 Published on Web 07/31/2007
-
Upload
independent -
Category
Documents
-
view
7 -
download
0
Transcript of 14-3-3 Expression in Denervated Hippocampus after Entorhinal Cortex Lesion Assessed by...
14-3-3 Expression in Denervated Hippocampus after Entorhinal
Cortex Lesion Assessed by Culture-Derived Isotope Tags in
Quantitative Proteomics
Carina Sihlbom,*,†,‡ Ulrika Wilhelmsson,† Lizhen Li,† Carol L. Nilsson,§ and Milos Pekny*,†
Center for Brain Repair and Rehabilitation (CBR), Department of Clinical Neuroscience and Rehabilitation,Institute of Neuroscience and Physiology, and Department of Medical Chemistry and Cell Biology,
Institute of Biomedicine, Sahlgrenska Academy, Goteborg University, Box 440, SE-405 30 Goteborg, Sweden,and National High Magnetic Field Laboratory, Florida State University, Tallahassee, Florida 32306
Received February 26, 2007
Activation of astrocytes accompanies many brain pathologies. Reactive astrocytes have a beneficialrole in acute neurotrauma but later on might inhibit regeneration. 2D-gel electrophoresis and massspectrometry were applied to study the proteome difference in denervated hippocampus in wildtypemice and mice lacking intermediate filament proteins glial fibrillary acidic protein (GFAP) and vimentin(GFAP-/-Vim-/-) that show attenuated reactive gliosis and enhanced posttraumatic regeneration.Proteomic data and immunohistochemical analyses showed upregulation of the adapter protein 14-3-3 four days postlesion and suggested that 14-3-3 upregulation after injury is triggered by reactivegliosis. Culture-derived isotope tags (CDIT) and mass spectrometry demonstrated that 14-3-3 epsilonwas the major isoform upregulated in denervated hippocampus and that its upregulation was attenuatedin GFAP-/-Vim-/- mice and thus most likely connected to reactive gliosis.
Keywords: quantitative proteomics • neuroregeneration • neurodegeneration • hippocampus • astrocytes • braininjury • 14-3-3 protein • isoform • FTICR mass spectrometry
IntroductionAstrocytes are important for the maintenance of the CNS
homeostasis and recycling of neurotransmitters. They also playa role in the plasticity of CNS, e.g., by controlling the numberand function of neuronal synapses1,2 or generation of newneurons.3,4 In many CNS pathologies, astrocytes become reac-tive (known as reactive gliosis) and this is accompanied by analtered expression of many genes.5,6 Upregulation of intermedi-ate filament proteins GFAP and vimentin by astrocytes is thehallmark of reactive gliosis. Reactive gliosis may facilitate thehealing process but may also inhibit regeneration and thusreduce the extent of functional recovery. Several experimentalstudies have shown that improved regeneration and functionalrecovery after neurotrauma can be achieved by reducing reac-tive gliosis.7-9 We and others have previously reported im-proved regeneration in mice deficient for GFAP and vimentin(GFAP-/-Vim-/- mice, which exhibit attenuated reactive gliosisafter neurotrauma), specifically better axonal regeneration,10,11
survival and integration of neural grafts and neural progenitorcells in the retina,12,13 reduced photoreceptor degeneration afterretinal detachment,13 or improved synaptic regeneration in thedenervated dentate gyrus of the hippocampus15 (for review, seeref 16).
14-3-3 is an adapter protein implicated in the regulation ofa large spectrum of both general and specialized signalingpathways. 14-3-3 proteins bind to specific phosphorylated siteson a number of diverse target proteins and force conforma-tional changes or influence protein-protein interactions. Forexample, the Src homology 2 like domain of 14-3-3 binds topTyr and the WD40 domain binds to sites containing pThr andpSer residues.17,18 There are seven closely related genes, encod-ing 14-3-3 protein isoforms â (beta, MW 28.1 kDa), ε (epsilon,MW 29.2 kDa), η (eta, MW 28.2 kDa), γ (gamma, MW 28.3 kDa),τ (theta, MW 27.8 kDa, also called tau), ú (zeta, MW 27.8 kDa),and σ (sigma, MW 27.7 kDa) in humans. Phosphorylatedisoforms of â and ú are called R (alpha) and δ (delta),respectively. 14-3-3 proteins were proposed to have a centralrole in cell proliferation control, survival, cellular trafficking,or actin dynamics.19 Recently, a tandem affinity purificationstudy in transgenic mice characterized protein complex bindingto 14-3-3. A total of 147 proteins were identified, includingproteins involved in neuronal development, neurotransmitterrelease, exocytosis, glutamate receptor signaling, and cytosk-eleton rearrangements.20
The highest level of 14-3-3 proteins in the body is found inthe brain, where it represents around 1% of the total solubleproteins.21 Most 14-3-3 isoforms are present in the adult CNSand show heterogeneous patterns of expression in different celltypes and different anatomical locations,22 suggesting specificfunctions for each isoform. Importantly, the expression patternis altered in CNS pathologies, e.g., increased expression of 14-
* To whom correspondence should be addressed. E-mail, [email protected] or [email protected]; Phone, +46-31-7863269; Fax,+46-31-416108.
† Department of Clinical Neuroscience and Rehabilitation.‡ Department of Medical Chemistry and Cell Biology.§ Florida State University.
10.1021/pr070108e CCC: $37.00 2007 American Chemical Society Journal of Proteome Research 2007, 6, 3491-3500 3491Published on Web 07/31/2007

3-3 proteins in reactive astrocytes was found in brain samplesfrom patients with multiple sclerosis,22,23 Creutzfeldt-Jacob’sdisease25 or stroke.26 14-3-3 proteins may also be released intothe cerebrospinal fluid in patients with neurodegenerativediseases and have recently been used as a diagnostic markerfor sporadic Creutzfeldt-Jacob’s disease.27-29 14-3-3 proteinshave been identified in neurofibrillary tangles in Alzheimer’sdisease30,31 and through mediating the phosphorylation of tau,they may promote their formation.32-34 Similarly, 14-3-3 pro-teins may contribute to the pathology of Parkinson’s disease:14-3-3 interacts and colocalizes with alpha-synuclein35-37 in theintracellular inclusions characteristic for the disease and 14-3-3 eta has been shown to inhibit the activity of parkinubiquitin ligase.38
Here we have used both classical differential proteomics anda novel application of quantitative proteomics with CDIT tostudy the protein expression levels in denervated hippocampusafter entorhinal cortex lesion in GFAP-/-Vim-/- and wildtypemice. GFAP-/-Vim-/- mice exhibit attenuated reactive gliosisafter neurotrauma. We performed classical proteomics bycombining 2D-gel electrophoresis (2D-GE) and mass spectro-metric analysis to identify differentially expressed proteins. Toallow quantitative analysis of specific proteins, mass spectrom-etry-based quantification with stable isotope labeling wasapplied. A novel approach based on stable isotope labeling byamino acids in cell culture (SILAC),39-41 uses culture-derivedisotope labeled proteins as internal standards for quantitativetissue proteomics.42 Quantitative changes of protein expressionin tissue can be estimated by comparing the calculated averageratio of peptide areas from CDIT and tissue peptides asdetermined with mass spectromery. By combining the CDIT-based method and immunohistochemical analysis of contralat-eral and lesioned brains, we show that 14-3-3 protein isupregulated in denervated hippocampus and that 14-3-3epsilon is the isoform most responsible for this upregulation.Moreover, we show that upregulation of 14-3-3 is connectedwith the response of astrocytes to neurotrauma, i.e., withreactive gliosis.
Experimental SectionMice and Surgical Procedures. Mice carrying a null muta-
tion in the GFAP and vimentin gene and the wildtype controlshave been described,16,43-46 were on C57Bl/6-129Sv-129Olagenetic background and were 7-12 months old, mixed femalesand males in both GFAP-/-Vim-/- and wildtype groups of mice,and maintained in a barrier animal facility. All experimentswere approved by the ethical committee at Goteborg University.Unilateral entorhinal cortex lesion was performed as describedpreviously.15,47-49 Briefly, anesthetized mice were placed in astereotactic frame, and a hole was drilled through the skull. Aretractable wire knife (David Kopf Instruments, Tujunga, CA)was lowered 1 mm down from the dura +3.6 mm laterally and-0.2 mm posterior to lambda. The wire knife was expanded 2mm horizontally and then lowered 2 mm twice at +30 and-135° to avoid the hippocampal formation. The mice werekilled 4 days after the lesion. For proteomic analysis, thecomplete hippocampus, according to the anatomy describedby Franklin and Paxinos,50 was dissected out and stored at -80°C until analysis. For immunohistochemical analysis, the micewere perfused transcardially with phosphate buffered 4%paraformaldehyde.
Hippocampus Sample Preparation for 2D Gel Electro-phoresis. Frozen mouse hippocampus, from 6 wildtype mice,
6 GFAP-/-Vim-/- mice, 6 wildtype mice after injury, and 6GFAP-/-Vim-/- mice after injury, was homogenized in 460 µLlysis buffer containing 5 M urea, 2 M thiourea, 4% CHAPS, 40mM Tris base, 100 mM DTT, 1 mM EDTA, 2% immobilizedpH gradient (IPG) buffer, and proteinase inhibitor (CompleteMini cocktail tablet, Roche Diagnostics) using a motor-drivengrinder pestle. The sample was then sonicated during 1 minand agitated for 1 h. The crude protein extract was centrifugedat 13 000 rpm for 15 min at room temperature. Total proteinassays were performed with the Bradford method using Coo-massie Plus (Pierce) and measuring absorbance at 595 nm.Bromophenol blue solution (1-2 µL) was added to the hip-pocampus protein sample.
2D Gel Electrophoresis. Isoelectric focusing was performedwith 24 cm immobilized pH gradient (IPG) strips (ImmobilineDryStrip pH 3-10 nonlinear, Amersham Biosciences/GE Health-care) in the Ettan IPGphor IEF System (Amersham Biosciences/GE Healthcare). Active rehydration was performed at 30 V for12 h in 450 µL sample solution described above. The focusingstep was completed at 55 000 Vhrs with a program of 500 V for1 h, 1000 V for 1 h and a gradient up to 8000 V during 1 h at 20°C. The IPG strips were incubated with gentle shaking inequilibration buffer (50 mM Tris-HCl pH 8.8, 6 M urea, 30%glycerol, 2% SDS, bromphenol blue) containing 1% DTT for 15min and 2.5% iodoacetamide for additional 15 min. The seconddimension separation was carried out by use of in-house made12% polyacrylamide (Bio-Rad) slab gels with the strip laid onthe top in the presence of 0.5% agarose prepared in runningbuffer. Gels were run in the Protean plus Dodeca Cell apparatus(Bio-Rad) at 18 °C and 10 mA/gel for 1 h and then 25 mA/gelovernight in 125 mM Tris, 960 mM glycine, 0.5% SDS. Afterwashing for 1 h in 10% v/v ethanol, 7% (v/v) acetic acid inwater, staining was carried out overnight in 350 mL Sypro RubyProtein stain (Molecular Probes). Gels were destained for 30min in a 10% v/v ethanol and 7% (v/v) acetic acid solutionand maintained in water. Images were acquired with a 2D 2920Master Imager (Amersham Biosciences/GE Healthcare). Thescan parameters were: excitation at 540 nm, emission at 630nm during 3 s with 16-bit pixel density and image resolutionof 150 µm. The optical density of protein spots is proportionalto protein concentration.
2D-Gel Image Analysis. Image analysis was carried out withthe PD-Quest software (Bio-Rad). Protein levels were evaluatedas volumes (spot area optical density) for the protein spotsmatched among gels representing all groups. Spot volume wasnormalized for each gel on total density in gel image. Data werelog transformed and analyzed with Mann-Whitney statisticstools included in the PD-Quest software. Altered spots wereselected using the average of six gels within one group andcompared to another group at confidence levels 90 and 99%,respectively. Spots which gave significant results were verifiedvisually to exclude artifacts.
Immunohistochemistry. The brains were dissected out,post-fixed in phosphate buffered 4% paraformaldehyde over-night at 4 °C, and immersed in 30% sucrose in phosphate bufferfor several days at 4 °C. Horizontal 25 µm sections were cutwith a cryostat and stored in cryoprotectant at -20 °C untilused for immunohistochemistry as described.15 Primary anti-bodies used were goat anti 14-3-3 eta (1:50; Santa CruzBiotechnology), rabbit anti-14-3-3 epsilon (1:100; Santa CruzBiotechnology), mouse anti-GFAP (1:100; Sigma-Aldrich), andbiotin-conjugated mouse anti-NeuN (1:100, Chemicon EuropeLtd), followed by secondary antibodies conjugated with Alexa
research articles Sihlbom et al.
3492 Journal of Proteome Research • Vol. 6, No. 9, 2007

Fluor 488 or 568 (Invitrogen) and TO-PRO-3 (Invitrogen) forvisualization of nuclei. In two sections or more from each of10 lesioned mice the cellular distribution of 14-3-3 epsilonimmunoreactivity was investigated. Representative images ofthe findings were obtained using a Leica TCS SP2 laser scanningconfocal microscopy (Leica Microsystems GmbH).
Mouse Hippocampus Protein Preparation for 1D GelElectrophoresis. Frozen mouse hippocampus, from 5 wildtypemice, 3 GFAP-/-Vim-/- mice, 4 wildtype mice after injury and4 GFAP-/-Vim-/- mice after injury, was homogenized in 400µL lysis buffer containing 50 mM DTT, 25 mM Tris HCl, 35mM Tris base, 0.5% lithium dodecyl sulfate (LDS), 2.5% glycerol,12.5 mM EDTA, and proteinase inhibitor using a motor-drivengrinder pestle. The sample was then sonicated for 1 min,agitated for 2 h, and heated to about 80 °C during 3 min. Thecrude protein extract was treated in the same way as inpreparation for 2D-GE.
Culture-Derived Isotope Tagging (13C-Labeled AstrocyteCulture). Primary astrocyte cultures were prepared from a2-day old wildtype mouse as described51 and maintained inDulbecco’s modified Eagle’s medium (Specialty media, Milli-pore,) deficient in L-leucine, supplied with 13C6-leucine (Cam-bridge Isotope Laboratories), 10% fetal calf serum (Gibco BRL),L-glutamine (2 mM), and penicillin/streptomycin (Gibco BRL).The cultures containing about 95% astrocytes were grown toconfluency in 10 cm Petri dishes and washed 10 times withice-cold phosphate buffered saline (PBS) prior to harvesting.Cells were scraped in PBS and centrifuged at 500× g for 5 min.After removal of the buffer, the cells were frozen and stored at-80 °C until analysis. The astrocyte pellet was suspended in350 µL 1D gel lysis buffer as described.
1D Gel Electrophoresis for Quantification of HippocampalProteins. The sample volume of total hippocampal protein wasadjusted (15-25 µL) to gain an equal loading of 30 µg proteinand 8 µL of 13C6-leucine labeled astrocyte lysate was added toall tubes resulting in a 1:1 mixture. 1D gel electrophoresis wasperformed on NuPAGE Novex Bis-Tris 10% acrylamide gel usingMOPS SDS running buffer (Invitrogen) at 200 V, constantvoltage.
In-Gel Trypsin Digestion. Each selected spot or band wascut with a biopsy punch and processed as described51 withminor modifications. Briefly, the gel pieces were washed twicein 100 µL of H2O/CH3CN (1:1 v/v) for 30 min, dried in a vacuumcentrifuge, rehydrated in 10 µL of digestion buffer (25 mM NH4-HCO3) containing 12.5 ng/µL sequencing grade trypsin (Prome-ga), and incubated at 37 °C overnight. Any remaining digestionwas stopped with 10 µL 1% HCOOH (Merck) in water. Thesupernatant was collected, and the peptides were extractedtwice with 30 µL of 0.1% HCOOH in water/CH3CN (1:1). Thecombined supernatants were evaporated to dryness in avacuum centrifuge. Tryptic digests were reconstituted in 18 µL0.1% HCOOH.
Mass Spectrometry and Database Searches. NanoLC-MS/MS was performed on a C18-fused silica column packed in-house and connected to a hybrid linear ion trap-FourierTransform Ion Cyclotron mass spectrometer (FTICR-MS)(LTQ-FT, Thermo Electron), equipped with a 7 T magnet.Sample injections (2 µL) were made (HTC-PAL auto sampler,CTC Analytics AG), and the tryptic peptides were trapped on aC18-precolumn (4.5 cm × 100 µm i.d.) and separated in a 20cm × 50 µm i.d. fused silica column packed with ReproSil-PurC18-AQ 3 µm porous particles (Dr. Maisch GmbH). After 3 minlinear run, loading the precolumn, the gradient was 0-50%
CH3CN, starting with HCOOH 0.2% in water for 40 min (flowrate 100 nL/min, Agilent 1100 binary pump), and the eluentwas electrosprayed (+1.4 kV) from the emitter tip (20 µm i.d.,150 µm o.d., Polymicro) into the heated capillary of the massspectrometer. The mass spectrometer was operated in the data-dependent mode to automatically switch between MS and MS/MS acquisition. Survey MS spectra (m/z 400-1600) wereacquired with the FTICR-MS, and the three most abundantdoubly or triply protonated ions in each FT-scan were selectedfor isolation, fragmentation and detection in the linear ion trap.The exclusion time for isobaric precursor ions was 6 s. In theanalysis of 1D gel samples for protein quantification, aninclusion list of peptides was used to select peptides of specialinterest. Mass calibration was performed with a mixture,including caffeine, the peptide MRFA, and Ultramark 1621 (m/z195 to 1822), dissolved in 50:50 water/acetonitrile solution,according to the manufacturer’s recommendation (ESI calibra-tion solution, Thermo Electron). The typical mass accuracy is<2 ppm in MS mode and 300-400 ppm in MS/MS mode. Thesensitivity of the described nanoLC-MS/MS system is about 1femtomole as determined by analysis of a tryptic digest ofbovine serum albumin (about 50 pg BSA).
Measured peptide masses and their CID spectra wereanalyzed by MASCOT database search software version 2.1.6(Matrix Science),53 which incorporates a probability-basedscoring. The peak list was generated with extract_msn.exeincluded in the ThermoElectron Bioworks browser version 3.2,using data import filter for mass 400-3000, minimum numberof peaks 5, threshold 2000 and the precursor charge state wascalculated by XCalibur version 1.4. Swiss-Prot database (from051205 for 2D-gel samples and from 060629 for 1D gel samples)was used for protein identification. Database interrogation wascarried out using monoisotopic masses, 5 ppm precursor-ionmass tolerance window, 0.5 Da fragment-ion mass tolerancewindow, Mus musculus as taxonomic category. The maximumnumber of allowed missed tryptic cleavages was set to one. Theinterrogation also included possible modifications such asoxidation of methionine and the alkylation of cysteine residues
Figure 1. Schematic drawing of a horizontal section throughhippocampus and the entorhinal cortex (EC) after EC lesion. EClesion disrupts the perforant path innervating the outer molecularlayer (OML, light gray) of the ipsilateral dentate gyrus of thehippocampus. This leads to axonal and synaptic degenerationin the OML, astrocyte activation in the same area and limitedsynaptic regeneration later on.
14-3-3 Expression in Denervated Hippocampus research articles
Journal of Proteome Research • Vol. 6, No. 9, 2007 3493
by iodoacetamide (2D-gels) or propionamide (1D-gels). Thecriteria for positive identification of proteins were set asfollows: peptide scores were considered significant when theprobability of random events was less than 1 in 100 (p < 0.01)for more than one peptide.
Non-labeled leucine-containing peptides were identified bythe Mascot tool. The quantification was based on peptide setsthat were well separated and free from interfering peaks. Severalpeptides from the same protein were examined to ensure thatthe extent of change was the same. The m/z of leucine-containing peptides and their scan number information wereused for extraction of mass chromatograms. The total areasfor both the normal leucine (light) and 13C6-leucine (heavy)peptides were obtained in the extracted mass chromatogramwith XCalibur software version 1.4.
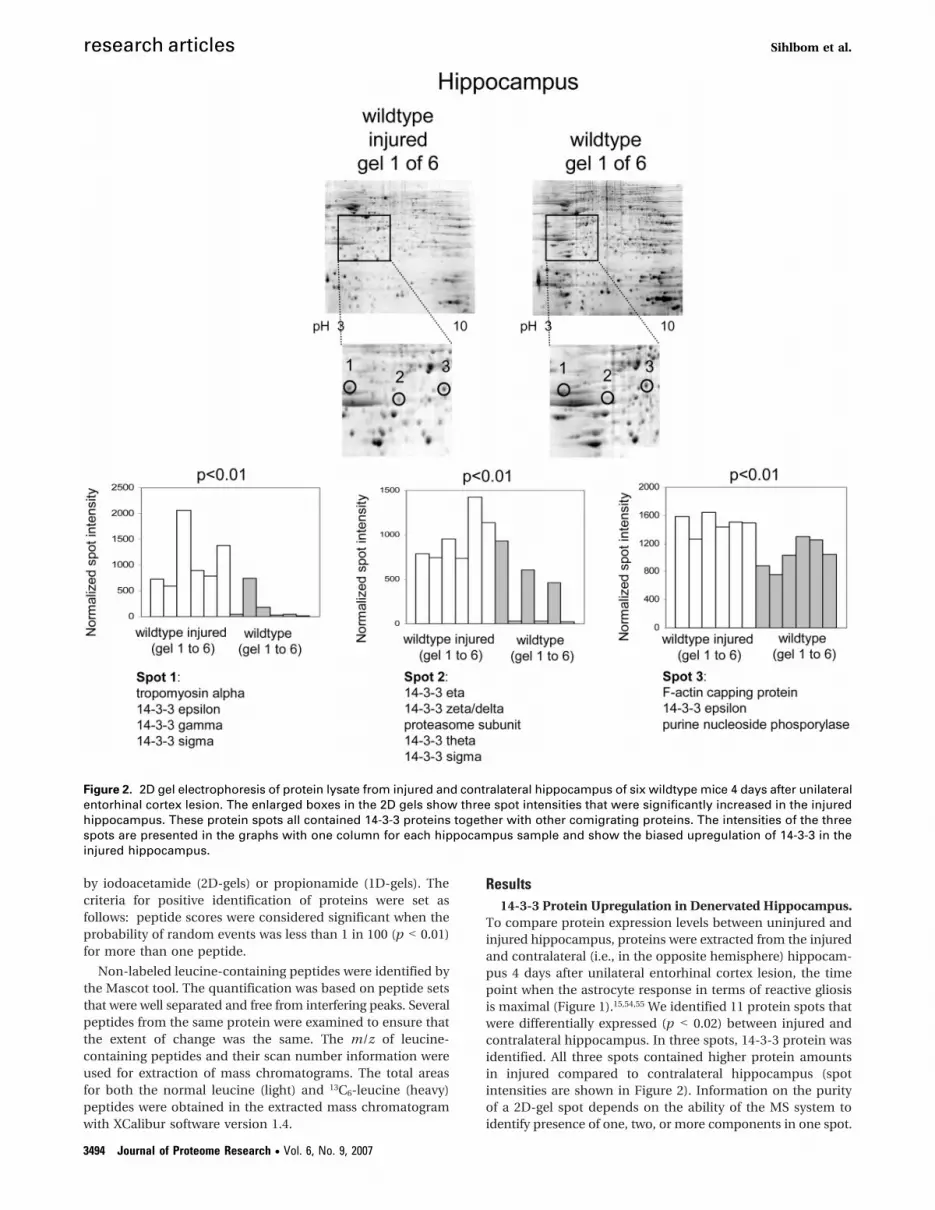
Results14-3-3 Protein Upregulation in Denervated Hippocampus.
To compare protein expression levels between uninjured andinjured hippocampus, proteins were extracted from the injuredand contralateral (i.e., in the opposite hemisphere) hippocam-pus 4 days after unilateral entorhinal cortex lesion, the timepoint when the astrocyte response in terms of reactive gliosisis maximal (Figure 1).15,54,55 We identified 11 protein spots thatwere differentially expressed (p < 0.02) between injured andcontralateral hippocampus. In three spots, 14-3-3 protein wasidentified. All three spots contained higher protein amountsin injured compared to contralateral hippocampus (spotintensities are shown in Figure 2). Information on the purityof a 2D-gel spot depends on the ability of the MS system toidentify presence of one, two, or more components in one spot.
Figure 2. 2D gel electrophoresis of protein lysate from injured and contralateral hippocampus of six wildtype mice 4 days after unilateralentorhinal cortex lesion. The enlarged boxes in the 2D gels show three spot intensities that were significantly increased in the injuredhippocampus. These protein spots all contained 14-3-3 proteins together with other comigrating proteins. The intensities of the threespots are presented in the graphs with one column for each hippocampus sample and show the biased upregulation of 14-3-3 in theinjured hippocampus.
research articles Sihlbom et al.
3494 Journal of Proteome Research • Vol. 6, No. 9, 2007
The highly sensitive nanoLC FTICR-MS/MS system identifiedtropomyosin (spot 1), proteasome subunit alpha type 3 (spot2) and F-actin capping protein beta subunit together withpurine nucleoside phosphorylase (spot 3) in the protein spotsof 14-3-3 (identification information in supplementary TableS1, Supporting Information). The presence of more than oneprotein in a 2D-gel spot due to comigration makes it difficultto interpret the result from the image analysis. However, ourproteomic results showed a strong trend of 14-3-3 proteinupregulation in injured hippocampus.
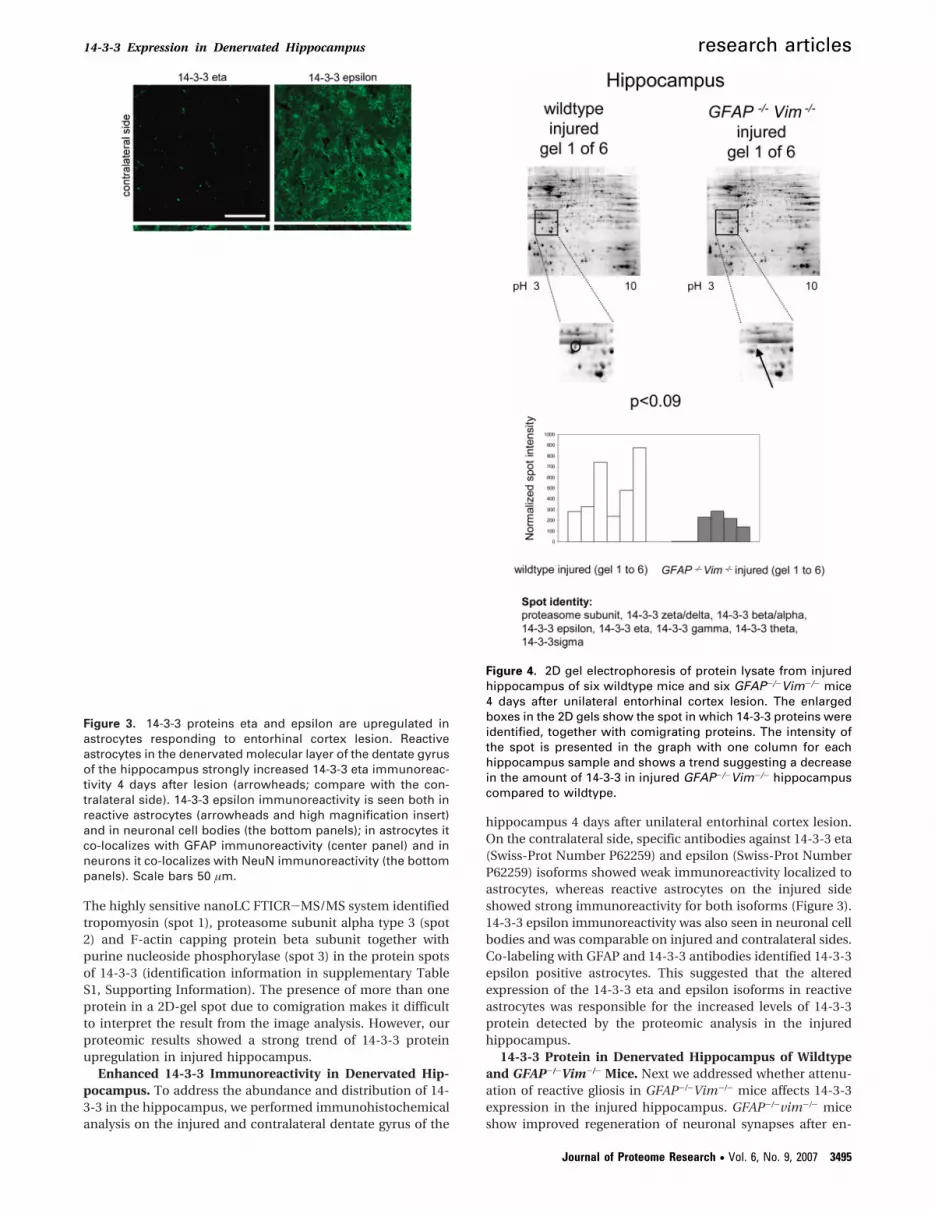
Enhanced 14-3-3 Immunoreactivity in Denervated Hip-pocampus. To address the abundance and distribution of 14-3-3 in the hippocampus, we performed immunohistochemicalanalysis on the injured and contralateral dentate gyrus of the
hippocampus 4 days after unilateral entorhinal cortex lesion.On the contralateral side, specific antibodies against 14-3-3 eta(Swiss-Prot Number P62259) and epsilon (Swiss-Prot NumberP62259) isoforms showed weak immunoreactivity localized toastrocytes, whereas reactive astrocytes on the injured sideshowed strong immunoreactivity for both isoforms (Figure 3).14-3-3 epsilon immunoreactivity was also seen in neuronal cellbodies and was comparable on injured and contralateral sides.Co-labeling with GFAP and 14-3-3 antibodies identified 14-3-3epsilon positive astrocytes. This suggested that the alteredexpression of the 14-3-3 eta and epsilon isoforms in reactiveastrocytes was responsible for the increased levels of 14-3-3protein detected by the proteomic analysis in the injuredhippocampus.
14-3-3 Protein in Denervated Hippocampus of Wildtypeand GFAP-/-Vim-/- Mice. Next we addressed whether attenu-ation of reactive gliosis in GFAP-/-Vim-/- mice affects 14-3-3expression in the injured hippocampus. GFAP-/-vim-/- miceshow improved regeneration of neuronal synapses after en-
Figure 3. 14-3-3 proteins eta and epsilon are upregulated inastrocytes responding to entorhinal cortex lesion. Reactiveastrocytes in the denervated molecular layer of the dentate gyrusof the hippocampus strongly increased 14-3-3 eta immunoreac-tivity 4 days after lesion (arrowheads; compare with the con-tralateral side). 14-3-3 epsilon immunoreactivity is seen both inreactive astrocytes (arrowheads and high magnification insert)and in neuronal cell bodies (the bottom panels); in astrocytes itco-localizes with GFAP immunoreactivity (center panel) and inneurons it co-localizes with NeuN immunoreactivity (the bottompanels). Scale bars 50 µm.
Figure 4. 2D gel electrophoresis of protein lysate from injuredhippocampus of six wildtype mice and six GFAP-/-Vim-/- mice4 days after unilateral entorhinal cortex lesion. The enlargedboxes in the 2D gels show the spot in which 14-3-3 proteins wereidentified, together with comigrating proteins. The intensity ofthe spot is presented in the graph with one column for eachhippocampus sample and shows a trend suggesting a decreasein the amount of 14-3-3 in injured GFAP-/-Vim-/- hippocampuscompared to wildtype.
14-3-3 Expression in Denervated Hippocampus research articles
Journal of Proteome Research • Vol. 6, No. 9, 2007 3495

torhinal cortex lesion.15 In the affected dentate gyrus of thehippocampus, astrocytes in GFAP-/-vim-/- mice reach a com-parable volume of tissue as in wild-type mice, but the maincellular processes of GFAP-/-vim-/- astrocytes are shorter andless straight compared to wild-type.15 Using 2D-gel electro-
phoresis, we identified four protein spots that were differentiallyexpressed. In one of them, the 14-3-3 protein was identified(14-3-3 protein was identified in the hippocampus of six outof six wildtype and in four out of six GFAP-/-Vim-/- mice). Thespot densities suggested a trend for more 14-3-3 protein in the
Table 1. 14-3-3 Epsilon Quantification by Protein Ratio Based on Four Peptides Unique for the 14-3-3 Epsilon Isoforma
ratio L/H
wildtype GFAP-/- Vim-/- wildtype lesioned GFAP-/-Vim-/- lesioned
hippocampus 1 2.009 1.939 2.623 2.328hippocampus 2 1.606 1.592 2.648 2.102hippocampus 3 1.648 1.684 2.488 2.011hippocampus 4 1.839 2.832 1.969hippocampus 5 1.834average 1.787 1.738 2.648 2.103std error of mean 0.13 0.13 0.09 0.11RSD 9.1% 10.3% 5.3% 7.6%
L: mouse hippocampus originH: culture-derived isotope tag ratio
L/H: average between the four peptides below
m/z L RT peptide
413.22253+ 12.2 HLIPAANTGESK441.56973+ 13.7 KEAAENSLVAYK462.23323+ 15.2 YLAEFATGNDRK628.79882+ 17.3 YLAEFATGNDR
wildtype lesioned
vs wildtype
GFAP-/-Vim-/- lesioned
vs GFAP-/-Vim-/-
wildtype vs
GFAP-/-Vim-/-
wildtype lesioned vs
GFAP-/-Vim-/- lesioned
ratio 1.5 1.2 1.0 1.3adjusted p-value < 0.001 0.010 0.529 0.005
a The estimated protein ratio from three to five experiments was pair wise compared with a 95% confidence interval and p-values between the groups. Datawere analyzed in a mixed model (SAS 8.2, Proc Mixed and Proc Multtest) with mouse as random effect. Type of mouse, lesioned, and the interaction betweentype and lesioned were used as fixed effects. Adjustment for multiple comparisons within each analysis was done with the Holm-Bonferroni’s step-downmethod.
Table 2. Total 14-3-3 Protein Quantification Using Protein Ratio Based on Three Common Peptides (All Three Peptides Are Presentin Alpha/Beta, Epsilon, Eta, Gamma, Sigma, Theta, and Delta/Zeta Isoforms)a
ratio L/H
wildtype GFAP-/-Vim-/- wildtype lesioned GFAP-/-Vim-/- lesioned
hippocampus 1 3.003 3.219 3.563 3.459hippocampus 2 2.846 2.805 3.384 3.346hippocampus 3 3.156 2.286 2.792 2.839hippocampus 4 2.285 3.243 3.100hippocampus 5 3.294 4.052average 2.917 2.770 3.407 3.186std error of mean 0.28 0.32 0.32 0.22RSD 13.4% 16.9% 13.5% 8.7%
L: mouse hippocampus originH: culture-derived isotope tag ratio
L/H: average between the three peptides below
m/z L RT peptide
408.72402+ 11.0 LAEQAER454.75592+ 19.0 NLLSVAYK595.33612+ 28.7 DSTLIMQLLR
wildtype lesioned
vs wildtype
GFAP-/-Vim-/- lesioned
vs GFAP-/-Vim-/-
wildtype vs
GFAP-/-Vim-/-
wildtype lesioned vs
GFAP-/-Vim-/- lesioned
ratio 1.2 1.2 1.1 1.1adjusted p-value 0.195 0.322 1.000 1.000
a The estimated protein ratio from three to five experiments was pair wise compared with a 95% confidence interval and p-values between the groups. Datawere analyzed in a mixed model (SAS 8.2, Proc Mixed and Proc Multtest) with mouse as random effect. Type of mouse, lesioned, and the interaction betweentype and lesioned were used as fixed effects. Adjustment for multiple comparisons within each analysis was done with the Holm-Bonferroni’s step-downmethod.
research articles Sihlbom et al.
3496 Journal of Proteome Research • Vol. 6, No. 9, 2007

wildtype compared to GFAP-/-Vim-/- mice (Figure 4). Withinthe same spot we also detected proteasome subunit alpha(details in supplementary Table S1).
14-3-3 Epsilon Immunoreactivity is Absent in GFAP-/-Vim-/-
Reactive Astrocytes. By using protein overlay analysis ofastrocyte cultures, 14-3-3 epsilon has previously been reportedto bind to intermediate filament proteins GFAP and vimentin.23
To investigate whether the abundance and distribution of 14-3-3 epsilon was altered in astrocytes devoid of intermediatefilaments, we compared the 14-3-3 epsilon immunoreactivityin the partially denervated molecular layer of the dentate gyrusof the hippocampus of GFAP-/-Vim-/- and wildtype mice 4 daysafter unilateral entorhinal cortex lesion (Figure 5). We sawintense 14-3-3 epsilon immunoreactivity in reactive astrocytesof wildtype mice, but this immunoreactivity was absent inGFAP-/-Vim-/- mice. The immunoreactivity of neuronal cellbodies was comparable between the injured and contralateralside in both wildtype and GFAP-/-Vim-/- mice. This suggestsaltered abundance and/or distribution of 14-3-3 epsilon inreactive astrocytes in GFAP-/-Vim-/- mice.
Quantification of Protein in Hippocampus with CDIT asInternal Standard. Next, we used CDIT quantitative proteomics(Scheme 1) to compare 14-3-3 protein in the hippocampus ofwildtype and GFAP-/-Vim-/- mice after unilateral entorhinalcortex lesion. Proteins that could be quantified with this specificCDIT method must contain leucine. Leucine, lysine, andarginine are three of the most abundant of the essential aminoacids and were therefore chosen for isotope labeling in theSILAC method.39 For our target protein 14-3-3, we calculatedthe distribution of leucine based on tryptic peptides with nomissed cleavage, a minimum of five amino acids, and a size ofat least 400 Da. 14-3-3 epsilon has 21 tryptic peptides, of which71% contain leucine, 38% arginine, and 57% lysine. 14-3-3 etahas 20 tryptic peptides of which 55% containing leucine.Labeled 13C6-leucine was added to the amino acid deficient cellculture media and incorporated into all newly synthesizedproteins. All tryptic peptides containing leucine were isotope-labeled in the astrocyte culture. An equal volume of 13C6-leucinelabeled lysate of wildtype astrocytes was added to each hip-
pocampal lysate with equalized protein concentration. Themixed lysate was separated according to molecular weight by1D gel electrophoresis. Corresponding light and heavy peptidesfrom the same protein were coeluted by chromatographicseparation in the MS scan. MS and MS/MS spectra for allpeptides used for quantification were individually inspectedand verified. Relative quantification was obtained as the ratiobetween intensity areas of the two peaks in the MS scan. Toobtain a protein ratio, individual peptide ratios were averagedand compared between the groups (Table 1 and Table 2). Ourrelative standard deviation (RSD) values were 5-10% for thepeptide ratio L/H within each group and were comparable tothose previously reported (6%).42 As another validation step,we measured the relative expression levels of actin in thecontralateral hippocampus of wildtype and GFAP-/-Vim-/-
mice. RSD of five peptides in five wildtype hippocampus were10% and similar within the group of GFAP-/-Vim-/- mousehippocampus. There was no significant difference in actin levelsbetween wildtype and GFAP-/-Vim-/- mice; the average peptideratio was 1.1 (data not shown) compared to 1.0 for 14-3-3epsilon (Table 1), which also confirms an equal sample loadingon the 1D gel.
Upregulation of 14-3-3 Epsilon in Denervated Hippocam-pus and Attenuation of this Response in GFAP-/-Vim-/- Mice.In order to establish which of the seven isoforms of 14-3-3 areupregulated in the denervated hippocampus and to studywhether attenuated reactive gliosis in GFAP-/-Vim-/- miceaffected 14-3-3 upregulation after entorhinal cortex lesion, weused the above-described CDIT approach. About half of thetheoretical tryptic peptides, in the range m/z 800-2500, areunique for the 14-3-3 epsilon isoform and thus not found forthe other isoforms (see peptide sequences used for quantifica-tion in Table 1 compared to Table 2). We found that 14-3-3epsilon was upregulated after injury in both wildtype andGFAP-/-Vim-/- mouse hippocampus (Table 1 and Figure 6).However, injured GFAP-/-Vim-/- hippocampus contained less14-3-3 epsilon than wildtype while there was no difference inthe amount of 14-3-3 epsilon in the contralateral hippocampusof wildtype compared to GFAP-/-Vim-/- mice. We identified14-3-3 epsilon as the major isoform responsible for the up-regulation of 14-3-3 in the denervated hippocampus, since thedifference in the 14-3-3 amount was not significant whenpeptides common to all 14-3-3 isoforms were used for quan-tification (Table 2).
Discussion
We have shown that the protein levels of 14-3-3 are increasedin the mouse denervated hippocampus following unilateralentorhinal cortex lesion and that the 14-3-3 epsilon isoform isthe major isoform that is upregulated. Entorhinal cortex lesionpartially denervates the molecular layer of the dentate gyrusof the hippocampus, resulting in neuronal degeneration andlater on synaptic regeneration in an anatomically well-definedarea situated a long distance from the lesion itself. Theentorhinal cortex lesion model is thus suitable to study expres-sion of proteins involved in these processes. Based on theimmunohistochemical analysis of brain tissue from patientswith multiple sclerosis, 14-3-3 epsilon was recently proposedas a marker for reactive astrocytes in chronic demyelinatinglesions24 and in chronic ischemic lesions.26 It was speculatedthat 14-3-3 plays a role in organizing the intermediate filamentnetwork and their dynamics in reactive astrocytes.24,56 Our studyshows that 14-3-3 epsilon and also 14-3-3 eta are upregulated
Figure 5. 14-3-3 epsilon immunoreactivity is upregulated inreactive astrocytes (arrowheads) in the dentate gyrus of thehippocampus of wildtype mice 4 days after entorhinal cortexlesion, whereas no upregulation is seen in GFAP-/-Vim-/- mice.Scale bar 50 µm.
14-3-3 Expression in Denervated Hippocampus research articles
Journal of Proteome Research • Vol. 6, No. 9, 2007 3497

in reactive astrocytes in the hippocampus after partial deaf-ferentiation of the molecular layer of its dentate gyrus byentorhinal cortex lesion. We showed that the amount of 14-3-3 epsilon extracted from the whole hippocampus, most likelylargely “diluted” by relatively uninjured hippocampal tissue,was increased after lesion.
GFAP-/-Vim-/- mice that exhibit attenuated reactive gliosisand improved aspects of CNS regeneration, (for review, see 15),showed a dual response to hippocampal denervation afterentorhinal cortex lesion. At the acute stage, neurodegenerationand synaptic loss were increased, whereas later on synapticregeneration was improved.15 Interestingly, we found that aupregulation of the adapter protein 14-3-3 epsilon seen inwildtype mice after hippocampal denervation was much lesspronounced in GFAP-/-Vim-/- mice. Consistent with thisfinding, immunohistochemical analysis showed only very weak14-3-3 immunoreactivity in the injured hippocampus ofGFAP-/-Vim-/- mice in contrast to strong immunostaining inwildtype mice. This supports the conclusion that 14-3-3expression, and in particular the expression of the 14-3-3epsilon isoform, has a role in reactive gliosis. It is interestingto speculate that the upregulation of 14-3-3 epsilon is triggeredby upregulation of intermediate filaments and constitutes animportant aspect of reactive gliosis. 14-3-3 proteins were shownto bind to keratin intermediate filaments and proposed to playa role in the organization and distribution of keratin intermedi-ate filaments in epithelial cells.57 Interestingly, 14-3-3 seemsto bind to individual keratin intermediate filament proteinswith different affinity.58 In cultured astrocytes, both GFAP andvimentin were documented to interact with 14-3-3.24 Apart fromits upregulation, the intermediate filament network of reactiveastrocytes undergoes changes both in its arrangement andcomposition, the functional significance of which remainsunknown. Thus, 14-3-3 isoforms might interact differently withindividual astrocyte intermediate filament proteins and withthe intermediate filament network of nonreactive astrocytesand reactive astrocytes in neurotrauma or other CNS patholo-gies.
2D-GE can be successfully applied to systematically analyzea large amount of proteins in a tissue in an accurate manner.
Scheme 1. Quantitative Proteomics of the Tissue from Mouse Hippocampus Using Culture-Derived Isotope Tags (CDIT)a
a An equal volume of 13Cx6 -leucine labeled wildtype astrocyte lysate is added to each hippocampal lysate. The mixed lysate isseparated according to molecular weight. The ratio between the two isotopic distributions of a peptide with the same sequence, onefrom the hippocampal sample (light) and one from the isotopically labeled astrocytes (heavy), can be determined from the masschromatograms (typical data shown). The average ratio for peptides representing one protein is compared between the groups (Table1 and Table 2).
Figure 6. 14-3-3 quantification by using the CDIT approach.Average peptide ratios, calculated from the peptide areas asshown in Scheme 1, were compared between contralateral andinjured hippocampus of wildtype (WT) and GFAP-/-Vim-/- (GV)mice. Ratios for individual peptides and ratios between groupsare shown in Table 1 and 2. The ratios for 14-3-3 epsilon proteinin the injured compared to contralateral hippocampus were 1.5and 1.2 for wildtype and GFAP-/-Vim-/- mice, respectively, and1.2 for the injured wildtype and GFAP-/-Vim-/- hippocampus.*, p < 0.01; **, p < 0.005; ***, p < 0.001.
research articles Sihlbom et al.
3498 Journal of Proteome Research • Vol. 6, No. 9, 2007

However, 2D-GE also has weaknesses and limitations, such ascomigrating proteins and a single protein present in multiplespots.59-62 To accurately quantify specific proteins, the massspectrometry-based quantification with CDIT42 was applied toassess protein expression levels in a defined part of the brainafter a specific neurosurgical intervention that induced astro-cyte activation and reactive gliosis. Astrocytes were chosen asinternal standard because they are the most abundant cells inthe CNS and the activation of astrocytes is a hallmark of thisneurotrauma model. This approach allowed us to accuratelyand efficiently determine the levels of specific isoforms of 14-3-3. The differential protein levels of the 14-3-3 isoforms couldbe assessed directly without using 2D-GE, with the use ofappropriate software for comprehensive quantitative calcula-tion of peptide area ratios for the proteins present in the MSdata set. Here, we demonstrate the importance of using uniqueisoform-specific peptides in the quantification. The presentstudy represents the first application of the CDIT approach inan experimental neurosurgery model with the aim to improvethe understanding of a disease pathogenesis.
Conclusions
We demonstrate that the CDIT-based quantitative proteomicmethod is a highly useful approach to assess protein expressionlevels in defined parts of the brain after specific neurosurgicalinterventions and that the upregulation of the adaptor protein14-3-3 in neurotrauma is connected to reactive gliosis.
Abbreviations: CNS, central nervous system; GFAP, glialfibrillary acidic protein; Vim, vimentin; CDIT, culture-derivedisotope tags; 2D-GE, 2D-gel electrophoresis; SILAC, stableisotope labelling by amino acids in cell culture.
Acknowledgment. We express our appreciation toMagnus Kjaer at AstraZeneca R&D, Molndal, Sweden for helpwith biostatistic calculations. We thank Hasse Karlsson for thenanoLC column setup and mass spectrometry advices andThomas Larsson for help with database searches and valuablecomments. This work was supported by DMR 0084173, theSwedish Research Council 11548 (M.P.), ALF Goteborg, Hjarn-fonden, the Swedish Stroke Association and Torsten och RagnarSoderbergs stiftelser, the Region of Vastra Gotaland (RUN), theSwedish Society for Medicine, “Konung Gustav V:s och Drott-ning Victorias Stiftelse”, the Edit Jacobsson Foundation, theAxel Linder Foundation, Carl Trigger Foundation, Rune ochUlla Amlovs stiftelse and Trygghansa to M.P., the SwedishMedical Society 16850, Wilhelm och Martina Lundgrens stif-telse, Hjarnfonden, Tore Nilssons stiftelse, FRF-stiftelsen andÅhlen-stiftelsen to U.W., Wilhelm and Martina Lundgrensstiftelse to C.S. The purchase of the LTQ-FTICR mass spec-trometer was made possible through a grant from Knut andAlice Wallenberg Foundation.
Supporting Information Available: Detailed MSinformation on protein identification of 2D-gel spots (Table S1).This material is available free of charge via the Internet athttp://pubs.acs.org.
References
(1) Ullian, E. M.; Sapperstein, S. K.; Christopherson, K. S.; Barres, B.A. Science 2001, 291(5504), 657-661.
(2) Christopherson, K. S.; Ullian, E. M.; Stokes, C. C.; Mullowney, C.E.; Hell, J. W.; Agah, A.; Lawler, J.; Mosher, D. F.; Bornstein, P.;Barres, B. A. Cell 2005, 120(3), 421-433.
(3) Laywell, E. D.; Rakic, P.; Kukekov, V. G.; Holland, E. C.; Steindler,D. A. Proc. Natl. Acad. Sci. U.S.A. 2000, 97(25), 13883-13888.
(4) Song, H.; Stevens, C. F.; Gage, F. H. Nature 2002, 417(6884), 39-44.
(5) Eng, L. F.; Ghirnikar, R. S. Brain Pathol. 1994, 4(3), 229-237.(6) Hernandez, M. R.; Agapova, O. A.; Yang, P.; Salvador-Silva, M.;
Ricard, C. S.; Aoi, S. Glia 2002, 38(1), 45-64.(7) Brambilla, R.; Bracchi-Ricard, V.; Hu, W. H.; Frydel, B.; Bramwell,
A.; S., K.; Green, E. J.; Bethea, J. R.; Hinson, S. R. J. Exp. Med.2005, 202(1), 145-156.
(8) Goldshmit, Y.; Galea, M. P.; Wise, G.; Bartlett, P. F.; Turnley, A.M. J. Neurosci. 2004, 24(45), 10064-10073.
(9) Tian, D. S.; Yu, Z. Y.; Xie, M. J.; Bu, B. T.; Witte, O. W.; Wang, W.J. Neurosci. Res. 2006, 84(5), 1053-1063.
(10) Menet, V.; Prieto, M.; Privat, A.; Gimenez y Ribotta, M. Proc. Natl.Acad. Sci. U.S.A. 2003, 100(15), 8999-9004.
(11) Cho, K. S.; Yang, L.; Lu, B.; Feng Ma, H.; Huang, X.; Pekny, M.;Chen, D. F. J. Cell Sci. 2005, 118(Pt 5), 863-872.
(12) Kinouchi, R.; Takeda, M.; Yang, L.; Wilhelmsson, U.; Lundkvist,A.; Pekny, M.; Chen, D. F. Nat. Neurosci. 2003, 6(8), 863-868.
(13) Widestrand, Å.; Faijerson, J.; Wilhelmsson, U.; Smith, P. L. P.; Li,L.; Sihlbom, C.; Eriksson, P. S.; Pekny, M. Increased neurogenesisand astrogenesis from neural progenitor cells grafted in thehippocampus of GFAP-/-Vim-/- mice. Stem Cells 2007, in press.
(14) Nakazawa, T.; Takeda, M.; Lewis, G. P.; Cho, K. S.; Jiao, J.;Wilhelmsson, U.; Fisher, S. K.; Pekny, M.; Chen, D. F.; Miller, J.W. Invest. Ophthalmol. Vis. Sci. 2007, 48(6), 2760-2768.
(15) Wilhelmsson, U.; Li, L.; Pekna, M.; Berthold, C. H.; Blom, S.;Eliasson, C.; Renner, O.; Bushong, E.; Ellisman, M.; Morgan, T.E.; Pekny, M. J. Neurosci. 2004, 24(21), 5016-5021.
(16) Pekny, M.; Wilhelmsson, U. Intermediate filaments in astrocytesin health and disease. In Intermediate filaments; Paramio, J. M.,Ed.; Landes Bioscience: Georgetown, Tx, 2006; pp 10-26.
(17) Bradshaw, J. M.; Waksman, G. Adv. Protein Chem. 2002, 61, 161-210.
(18) Yaffe, M. B.; Elia, A. E. Curr. Opin. Cell Biol. 2001, 13(2), 131-138.
(19) Mackintosh, C. Biochem. J. 2004, 381(Pt 2), 329-342.(20) Angrand, P. O.; Segura, I.; Volkel, P.; Ghidelli, S.; Terry, R.;
Brajenovic, M.; Vintersten, K.; Klein, R.; Superti-Furga, G.; Drewes,G.; Kuster, B.; Bouwmeester, T.; Acker-Palmer, A. Mol. Cell.Proteomics 2006, in press.
(21) Dougherty, M. K.; Morrison, D. K. J. Cell Sci. 2004, 117(Pt 10),1875-1884.
(22) Baxter, H. C.; Liu, W. G.; Forster, J. L.; Aitken, A.; Fraser, J. R.Neuroscience 2002, 109(1), 5-14.
(23) Kawamoto, Y.; Akiguchi, I.; Kovacs, G. G.; Flicker, H.; Budka, H.Acta Neuropathol (Berl) 2004, 107(2), 137-143.
(24) Satoh, J.; Yamamura, T.; Arima, K. Am. J. Pathol. 2004, 165(2),577-592.
(25) Kawamoto, Y.; Akiguchi, I.; Jarius, C.; Budka, H. Acta Neuropathol.(Berl.) 2004, 108(4), 302-308.
(26) Kawamoto, Y.; Akiguchi, I.; Tomimoto, H.; Shirakashi, Y.; Honjo,Y.; Budka, H. Stroke 2006, 37(3), 830-835.
(27) Green, A. J. Biochem. Soc. Trans. 2002, 30(4), 382-386.(28) Krasnianski, A.; Meissner, B.; Heinemann, U.; Zerr, I. Folia
Neuropathol. 2004, 42(Suppl B), 24-38.(29) Van Everbroeck, B. R.; Boons, J.; Cras, P. J Neurol Neurosurg
Psychiatry 2005, 76(1), 100-102.(30) Layfield, R.; Fergusson, J.; Aitken, A.; Lowe, J.; Landon, M.; Mayer,
R. J. Neurosci. Lett. 1996, 209(1), 57-60.(31) Umahara, T.; Uchihara, T.; Tsuchiya, K.; Nakamura, A.; Iwamoto,
T.; Ikeda, K.; Takasaki, M. Acta Neuropathol. (Berl.) 2004, 108(4),279-286.
(32) Agarwal-Mawal, A.; Qureshi, H. Y.; Cafferty, P. W.; Yuan, Z.; Han,D.; Lin, R.; Paudel, H. K. J. Biol. Chem. 2003, 278(15), 12722-12728.
(33) Chun, J.; Kwon, T.; Lee, E. J.; Kim, C. H.; Han, Y. S.; Hong, S. K.;Hyun, S.; Kang, S. S. Mol. Cells 2004, 18(3), 360-368.
(34) Yuan, Z.; Agarwal-Mawal, A.; Paudel, H. K. J. Biol. Chem. 2004,279(25), 26105-26114.
(35) Ostrerova, N.; Petrucelli, L.; Farrer, M.; Mehta, N.; Choi, P.; Hardy,J.; Wolozin, B. J. Neurosci. 1999, 19(14), 5782-5791.
(36) Kawamoto, Y.; Akiguchi, I.; Nakamura, S.; Honjyo, Y.; Shibasaki,H.; Budka, H. J. Neuropathol. Exp. Neurol. 2002, 61(3), 245-253.
(37) Ubl, A.; Berg, D.; Holzmann, C.; Kruger, R.; Berger, K.; Arzberger,T.; Bornemann, A.; Riess, O. Brain Res. Mol. Brain. Res. 2002,108(1-2), 33-39.
(38) Sato, S.; Chiba, T.; Sakata, E.; Kato, K.; Mizuno, Y.; Hattori, N.;Tanaka, K. EMBO J. 2006, 25(1), 211-221.
14-3-3 Expression in Denervated Hippocampus research articles
Journal of Proteome Research • Vol. 6, No. 9, 2007 3499
(39) Ong, S. E.; Blagoev, B.; Kratchmarova, I.; Kristensen, D. B.; Steen,H.; Pandey, A.; Mann, M. Mol. Cell. Proteomics 2002, 1(5), 376-386.
(40) Romijn, E. P.; Christis, C.; Wieffer, M.; Gouw, J. W.; Fullaondo,A.; van der Sluijs, P.; Braakman, I.; Heck, A. J. Mol. Cell. Proteomics2005, 4(9), 1297-1310.
(41) Zhou, Y.; Wang, Y.; Kovacs, M.; Jin, J.; Zhang, J. Mol. Cell.Proteomics 2005, 4(10), 1471-1479.
(42) Ishihama, Y.; Sato, T.; Tabata, T.; Miyamoto, N.; Sagane, K.;Nagasu, T.; Oda, Y. Nat. Biotechnol. 2005, 23(5), 617-621.
(43) Pekny, M.; Johansson, C. B.; Eliasson, C.; Stakeberg, J.; Wallen,A.; Perlmann, T.; Lendahl, U.; Betsholtz, C.; Berthold, C. H.; Frisen,J. J. Cell Biol. 1999, 145(3), 503-514.
(44) Eliasson, C.; Sahlgren, C.; Berthold, C. H.; Stakeberg, J.; Celis, J.E.; Betsholtz, C.; Eriksson, J. E.; Pekny, M. J. Biol. Chem. 1999,274(34), 23996-24006.
(45) Colucci-Guyon, E.; Portier, M. M.; Dunia, I.; Paulin, D.; Pournin,S.; Babinet, C. Cell 1994, 79(4), 679-694.
(46) Pekny, M.; Leveen, P.; Pekna, M.; Eliasson, C.; Berthold, C. H.;Westermark, B.; Betsholtz, C. EMBO J. 1995, 14(8), 1590-1598.
(47) Stone, D. J.; Rozovsky, I.; Morgan, T. E.; Anderson, C. P.; Finch,C. E. J. Neurosci. 1998, 18(9), 3180-3185.
(48) Jensen, M. B.; Hegelund, I. V.; Poulsen, F. R.; Owens, T.; Zimmer,J.; Finsen, B. Neuroscience 1999, 93(2), 507-518.
(49) Mingorance, A.; Fontana, X.; Soriano, E.; Del Rio, J. A. Mol. Cell.Neurosci. 2005, 29(3), 471-483.
(50) Franklin, K.; Paxinos, G. The mouse brain in stereotaxic coordi-nates; Academic Press: San Diego, 1997.
(51) Pekny, M.; Eliasson, C.; Chien, C. L.; Kindblom, L. G.; Liem, R.;Hamberger, A.; Betsholtz, C. Exp. Cell Res. 1998, 239(2), 332-343.
(52) Shevchenko, A.; Wilm, M.; Mann, M. J. Protein Chem. 1997, 16(5),481-490.
(53) Perkins, D. N.; Pappin, D. J.; Creasy, D. M.; Cottrell, J. S.Electrophoresis 1999, 20(18), 3551-3567.
(54) Steward, O.; Torre, E. R.; Phillips, L. L.; Trimmer, P. A. J. Neurosci.1990, 10(7), 2373-2384.
(55) Rose, G.; Lynch, G.; Cotman, C. W. Brain Res. Bull 1976, 1(1),87-92.
(56) Li, H.; Guo, Y.; Teng, J.; Ding, M.; Yu, A. C.; Chen, J. J. Cell Sci.2006, 119(Pt 21), 4452-4461.
(57) Ku, N. O.; Liao, J.; Omary, M. B. EMBO J. 1998, 17(7), 1892-1906.(58) Liao, J.; Omary, M. B. J. Cell Biol. 1996, 133(2), 345-357.(59) Gygi, S. P.; Corthals, G. L.; Zhang, Y.; Rochon, Y.; Aebersold, R.
Proc. Natl. Acad. Sci. U.S.A. 2000, 97(17), 9390-9395.(60) Rabilloud, T. Anal. Chem. 2000, 72(1), 48A-55A.(61) Castagna, A.; Campostrini, N.; Farinazzo, A.; Zanusso, G.; Monaco,
S.; Righetti, P. G. Electrophoresis 2002, 23(2), 339-346.(62) Yang, J. W.; Czech, T.; Lubec, G. Electrophoresis 2004, 25(7-8),
1169-1174.
PR070108E
research articles Sihlbom et al.
3500 Journal of Proteome Research • Vol. 6, No. 9, 2007