Thermal Effect on E/M Impedance Spectroscopy of Piezoelectric Wafer Active Sensors
Upload
khangminh22Category
view
3download
0
Energie & Umwelt / Energy & EnvironmentBand/ Volume 312ISBN 978-3-95806-129-3
Mem
ber
of th
e H
elm
holtz
Ass
ocia
tion
Energie & Umwelt / Energy & EnvironmentBand/ Volume 312ISBN 978-3-95806-129-3
Development of Embedded Thermocouple Sensors for Thermal Barrier Coatings (TBCs) by a Laser Cladding Process
Yanli Zhang
Development of Embedded Thermocouple Sensors for Thermal Barrier Coatings (TBCs) by a Laser Cladding Process
Dissertation zur
Erlangung des Grades Doktor-Ingenieurin
der
Fakultät für Maschinenbau der Ruhr-Universität Bochum
von
Yanli Zhang
Zoucheng, China
Bochum 2015


Dissertation eingereicht am: 20.10.2015 Tag der mündlichen Prüfung: 03.12.2015 Erster Referent: Prof. Dr. Robert Vaßen Zweiter Referent: Prof. Dr. Detlev Stöver

Forschungszentrum Jülich GmbHInstitute of Energy and Climate ResearchMaterials Synthesis and Processing (IEK-1)
Development of Embedded Thermocouple Sensors for Thermal Barrier Coatings (TBCs) by a Laser Cladding Process
Yanli Zhang
Schriften des Forschungszentrums JülichReihe Energie & Umwelt / Energy & Environment Band / Volume 312
ISSN 1866-1793 ISBN 978-3-95806-129-3

Bibliographic information published by the Deutsche Nationalbibliothek.The Deutsche Nationalbibliothek lists this publication in the Deutsche Nationalbibliografie; detailed bibliographic data are available in the Internet at http://dnb.d-nb.de.
Publisher and Forschungszentrum Jülich GmbHDistributor: Zentralbibliothek 52425 Jülich Tel: +49 2461 61-5368 Fax: +49 2461 61-6103 Email: [email protected] www.fz-juelich.de/zb Cover Design: Grafische Medien, Forschungszentrum Jülich GmbH
Printer: Grafische Medien, Forschungszentrum Jülich GmbH
Copyright: Forschungszentrum Jülich 2016
Schriften des Forschungszentrums JülichReihe Energie & Umwelt / Energy & Environment, Band / Volume 312
D 294 (Diss., Bochum, Univ., 2015)
ISSN 1866-1793ISBN 978-3-95806-129-3
The complete volume is freely available on the Internet on the Jülicher Open Access Server (JuSER) at www.fz-juelich.de/zb/openaccess.
This is an Open Access publication distributed under the terms of the Creative Commons Attribution License 4.0, which permits unrestricted use, distribution, and reproduction in any medium, provided the original work is properly cited.
Abstract:
Thermal barrier coatings (TBCs) are now being widely used on gas turbine engines to lower the
surface temperatures of metallic substrate from extreme hot gas stream in combustor and turbine
components. The thermally grown oxide (TGO) growth rate plays an important role in the life
time of TBC systems. The accurate real-time monitoring of bond-coat/ 8YSZ interface
temperature in thermal barrier coatings (TBCs) in hostile environments opens large benefits to
efficient and safe operation of gas turbines. A new method for fabricating high temperature
thermocouple sensors which can be placed close to this interface using laser cladding technology
has been developed.
K-type thermocouple powders consisting of alumel (Ni2Al2Mn1Si) and chromel (Ni10Cr) were
studied as candidate feedstock materials. A thermocouple sensor using these materials was first
produced by coaxial continuous wave (CW) or pulsed laser cladding process onto the standard
yttria partially stabilized zirconia (7~8 wt.% YSZ) coated substrate and afterwards embedded
with a second YSZ layer deposited by the atmospheric plasma spray (APS) process. The process
parameters of the laser cladding were optimized with respect to the degradation of the substrate,
dimensions, topography, thermosensitivity and embeddability, respectively. Infrared cameras
were used to monitor the surface temperature of clads during this process.
The manufacture of the cladded thermocouple sensors provides minimal intrusive features to the
substrate. The dimensions were in the range of two hundred microns in thickness and width for
CW laser cladding and less than 100 microns for pulsed laser cladding. Additionally, continuous
thermocouple sensors with reliable performance were produced. It is possible to embed sensors
manufactured by CW laser cladding rather than by pulsed laser cladding due to the limited
bonding strength between the clads and the substrate. Periodically droplets were formed along
the clads under improper parameters, the mechanism to this is discussed in terms of particle size
distribution after interaction with the laser beam, melts duration and Rayleigh’s theory.
To sum up, laser cladding is a prospective technology for manufacturing microsensors on the
surface of or even embedded into functional coatings that can survive in operation environments
for in-situ monitoring. Production of sensors within thermal barrier coatings (TBCs) increases
the application field of the laser cladding technique.

Kurzfassung:
Wärmedämmschichten (WDS) werden aktuell verbreitet in Gasturbinen genutzt, um die
Oberflächentemperatur des metallischen Substrates in der Brennkammer und den
Turbinenkomponenten gegenüber dem extrem heißen Gasstrom zu senken. Die genaue
Echtzeitmessung von Oberflächentemperaturen oder der Innentemperatur einer
Wärmedämmschicht in aggressiver Umgebung eröffnet beträchtliche Vorteile für den effizienten
und sicheren Betrieb von Gasturbinen. Es wurde eine neue Methode zur Herstellung von
Hochtemperatur-Thermoelementen für Gasturbinen mittels Laser-Auftragsschweißen entwickelt.
Alumel (Ni2Al2Mn1Si) und Chromel (Ni10Cr) wurden in Pulverform als Ausgangsmaterialien
für Thermoelemente des K-Typs untersucht. Um einen Thermoelement-Sensor mit diesen
Materialien herzustellen, wurde zunächst auf ein mit herkömmlichem Yttriumoxid-
teilstabilisiertem Zirkoniumdioxid (7~8 wt.% YSZ) beschichtetes Substrat der Sensor durch
koaxiales, kontinuierliches oder gepulstes Laser-Auftragsschweißen aufgebracht. Anschließend
wurde die Einbettung durch atmosphärisches Plasmaspritzen (APS) einer weiteren YSZ-Schicht
durchgeführt. Die Prozessparameter des Laser-Auftragsschweißens wurden optimiert in Bezug
auf die Degradation des Substrats, die Dimensionen, Topographie, Wärmeempfindlichkeit und
Einbettungsmöglichkeit. Es wurden Infrarotkameras eingesetzt, um die Oberflächentemperatur
der Aufschweißung während des Prozesses zu verfolgen.
Die Herstellung des aufgeschweißten Hochtemperatursensors beeinflusst minimal die Funktion
des Substrates. Die Abmessungen liegen für kontinuierliches Laser-Auftragsschweißen im
Bereich von 200 µm und für gepulstes Laser-Auftragsschweißen unter 100 µm. Außerdem
wurden kontinuierliche Thermosensoren mit zuverlässigen Ergebnissen hergestellt. Wegen der
begrenzten Bindungsstärke zwischen den Aufschweißungen und dem Substrat ist es eher
möglich, Sensoren durch koaxiales, kontinuierliches Laser-Auftragsschweißen herzustellen, als
mit gepulstem Laser-Auftragsschweißen. Mit ungeeigneten Prozessparametern wurden
periodische Tropfen entlang der Aufschweißungen gebildet. Der Mechanismus hierfür wird unter
den Gesichtspunkten der Partikelgrößenverteilung nach dem Einwirken des Laserstrahls, der
Schmelzdauer und der Rayleighs Theorie diskutiert.

Laser-Auftragsschweißen ist eine aussichtsreiche Technologie zur Herstellung von
Mikrosensoren, die an der Oberfläche oder sogar eingebettet in funktionellen Beschichtungen
unter Arbeitsbedingungen direkte Messungen ermöglichen. Die Produktion von Sensoren in
Wärmedämmschichten erweitert den Anwendungsbereich für das Laser-Auftragsschweißen.
Table of Contents
I
Table of Contents Abbreviations ................................................................................................................................. I
1. Introduction and Objectives .................................................................................................... 1
2. Background and Basic Overview ............................................................................................ 3
2.1 Introduction of Thermal Barrier Coatings (TBCs) ................................................................ 3 2.2 Spray Techniques of TBCs ................................................................................................... 5
2.2.1 Electron Beam Physical Vapor Deposition (EB-PVD) .................................................. 5 2.2.2 Atmospheric Plasma Spray (APS) .................................................................................. 6
2.3 Introduction of ‘Smart’ Coatings .......................................................................................... 7 2.4 State of the Art Deposition Methods for Sensors .................................................................. 7
2.4.1 Mask-based Twin Wire Arc Deposition ......................................................................... 7 2.4.2 Mask-based Sputtering ................................................................................................... 8 2.4.3 Direct-Write Thermal Spray (DWTS) ............................................................................ 8
2.5 Introduction of Laser Cladding Technology ......................................................................... 9 2.5.1 Laser Beam Characteristics ............................................................................................ 9 2.5.2 Different Methods of Laser Cladding ........................................................................... 11 2.5.3 Clad Dimensional Characteristics ................................................................................ 14 2.5.4 Important Parameters in Laser Cladding ...................................................................... 14 2.5.5 Non-invasive Thermal Imaging Techniques ................................................................ 18 2.5.6 Traditional Applications ............................................................................................... 20 2.5.7 New Applications ......................................................................................................... 20
3. Experimental Methods ........................................................................................................... 23
3.1 Concept of Embedded Thermocouple (TC) Sensors ........................................................... 23 3.2 Substrate Materials .............................................................................................................. 24 3.3 Feedstock Selection ............................................................................................................. 24 3.4 Thermal Spray Processes .................................................................................................... 25
3.4.1 Vacuum Plasma Spraying (VPS) .................................................................................. 25 3.4.2 Atmospheric Plasma Spray (APS) ................................................................................ 26
3.5 Laser Cladding Technology ................................................................................................ 27 3.6 Characterization Techniques ............................................................................................... 29
3.6.1 Particle Size Distribution .............................................................................................. 29
Table of Contents
II
3.6.2 Micro-spot Monitor (MSM) ......................................................................................... 29 3.6.3 Infrared (IR) Camera .................................................................................................... 29 3.6.4 Cyberscan Topographer ................................................................................................ 30 3.6.5 Light Microscopy and Confocal Laser Microscopy ..................................................... 30 3.6.6 Ohmmeter and Four Probe Tester ................................................................................ 30 3.6.7 Measurement of the Seebeck Coefficient ..................................................................... 31 3.6.8 Shear Force Measurements ........................................................................................... 32
4. Experimental Results and Discussion ................................................................................... 35
4.1 Feedstock Characterization ................................................................................................. 35 4.2 Laser Beam Characterization .............................................................................................. 36
4.2.1 Spatial Distribution of the Laser Beam ........................................................................ 36 4.2.2 Spot Size Determination ............................................................................................... 37
4.3 Powder Feeding Rate .......................................................................................................... 37 4.4 Deposition of K-type TCs with a continuous wave (CW) Laser ........................................ 38
4.4.1 Deposition of Alumel Tracks ....................................................................................... 38 4.4.2 Deposition of Chromel Tracks ..................................................................................... 47 4.4.3 Preparation of K-type TC with Relatively Optimized Parameters ............................... 48 4.4.4 Thermosensitivity Characterization of the Cladded TC ............................................... 53 4.4.5 Characterization of the Cladded TC Sensor ................................................................. 55 4.4.6 Embedding of Cladded Type-K TC .............................................................................. 56 4.4.7 Deposition of TCs in Small Dimensions ...................................................................... 61
4.5 Deposition of K-type TC with a Pulsed Laser .................................................................... 67 4.5.1 Optimization of Alumel Tracks .................................................................................... 67 4.5.2 Optimization of Chromel Tracks .................................................................................. 74 4.5.3 Preparation of K-type TCs ............................................................................................ 77 4.5.4 Embedding of the Cladded TCs .................................................................................... 78
4.6 Shear Force Measurements ................................................................................................. 80 4.7 Summary of Optimized Tracks ........................................................................................... 81
5. Droplets Formation Mechanism ............................................................................................ 83
6. Summary and Outlook ........................................................................................................... 91
7. Literature ................................................................................................................................. 93
Abbreviations
I
Abbreviations
CW Continuous wave YSZ Yttria partially stabilized zirconia APS Atmospheric plasma spraying/ sprayed TBCs Thermal barrier coatings CSZ Calcia stabilized zirconia MSZ Magnesia stabilized zirconia EB-PVD Electron beam physical vapor deposition/ deposited DC Direct current DWTS Direct-write thermal spray WH Width of the heat affected zone WC Track width HC Clad height HD Depth of the dilution HH Depth of the heat affected zone P Laser power Db Spot size V Scanning velocity Vp Shielding gas rate Vc Carrier gas rate E Energy input per unit length G Mass of injected powder per unit length E0 Laser pulse energy t Laser pulse width f Laser pulse frequency P0 Average power C Duty cycle TC Thermocouple VPS Vacuum plasma spraying MSM Micro-spot Monitor

Abbreviations
II
IR Infrared camera R Resistance A Cross-sectional area L Length of a track ρ Resistivity S Stand-off distance t Cladding time cp Specific heat capacity Tm Melting point RT Room temperature Hfusion Latent heat of fusion 2D Two dimensional HAZ Heat affected zone EMF Electromotive force LC Laser cladding TBC Top barrier coating BC Bond coat CTE Coefficient of thermal expansion σ Surface tension τ Break up time λ Wavelength of the disturbance Rc Radius of an cylinder ρc Density
1. Introduction and Objectives
1
1. Introduction and Objectives
Thermal barrier coatings (TBCs) are now being widely used in gas turbine engines to lower the
surface temperatures of metallic substrate in an extreme hot gas stream in combustor and turbine
components. On one hand, life capabilities of engines could be extended. On the other hand, an
increase of the turbine inlet temperatures could also be allowed, thereby, the operation efficiency
and performance of turbine engines could be improved [1-8].
Higher efficiency demands lead to increased combustion temperatures in gas turbine engines.
Applying higher engine operating temperature requires accurate knowledge of the turbine blade
temperature to avoid damage of engine components. Effective monitoring and diagnosis in such
harsh operating conditions is of critical importance. If critical operating conditions could be
continuously monitored in real-time, problems can be detected and solved during operation.
‘Smart’ coatings are generally proposed for the purpose of in-situ monitoring during operation of
turbine blades in order to better control surrounding environment and design coatings with
appropriate structures. ‘Smart’ coatings are the coatings integrated with embedded sensors, such
as thermocouple sensors or strain gauge sensors and so on. This kind of coatings combines the
function of a thermal barrier coating and a sensor, with which feedback about the functional
status and operating history of the coatings as well as of the coated structure and surrounding
environment could be provided.
In this study, a new method for fabricating high temperature type K thermocouple sensors using
laser cladding technology has been developed. The desired TC sensors deposited by this process
should contain certain properties: minimal effect on the substrate; small dimensions (minimal
intrusion to the substrate); electrical conductivity as well as embedded feature for monitoring the
internal temperature within a certain depth of the coatings.
There are a couple of challenges when applying this technique: first of all, a melting pool on the
substrate surface needs to be formed for the traditional laser cladding, but sensors with little
impact to the substrate are required to keep the original performance of TBCs; secondly, tracks
tend to detach due to the low adhesion strength; thirdly, sensors in small dimensions or high
roughness (discontinuous) tend to lose their electrical conductivity; furthermore, cladded sensors
1. Introduction and Objectives
2
have the risk to lose the electrical conductivity during embedding within a second YSZ layer
because of continuous impingement of ceramic particles to the tracks; mismatched Seebeck
coefficient of cladded type K TC sensors to that of commercial ones would mislead the
temperature recording during operation, therefore, reliable temperature cannot be captured.
The aim of this work is to fabricate K-type TC sensors with properties of minimal impact to the
substrate, small dimension as well as roughness and good electrical conductivity by laser
cladding technology, moreover, to embed them by a second ceramic layer. The success of this
work could increase application field of the laser cladding technique.
2. Background and Basic Overview
3
2. Background and Basic Overview
2.1 Introduction of Thermal Barrier Coatings (TBCs)
Superalloys used in commercial gas turbine engines normally melt in the range of 1230 oC~1315 oC and the operation temperature in a combustion gas environment typically above 1370 oC. In
order to avoid failure caused by melting, thermal fatigue or creep, airfoils along with effective
cooling geometries and hollow structures were designed and the engine efficiency was improved
considerably. Higher efficiency demands led to innovative technologies that could further reduce
the surface temperatures of superalloys. One method of protecting gas turbine engine
components is through the application of thermal barrier coatings [1].
Thermal barrier coatings (TBCs) are now being widely used in gas turbine engines to lower the
surface temperatures of metallic substrate from extreme hot gas stream in combustor and turbine
components [2-5]. The application of TBCs (100 ~ 500 µm in thickness) along with internal
cooling systems enables a large temperature drop (several 100 K) across the ceramic layer, hence,
modern gas turbine engines could be operated well above the melting point of metallic materials
(~1300 oC) [3, 6, 7]. Extended life capabilities of engines could be achieved by lowering the
substrate temperatures. On the other hand, an increase of the turbine inlet temperatures could
also be allowed, thereby, the operation efficiency and performance of turbine engines could be
improved [3-5, 7-9]. TBCs are also being used in certain diesel engines, where higher operation
temperatures translate into increased fuel economy and cleaner exhaust [2].
The TBC components must withstand very harsh environment accompanied by high temperature,
large temperature gradient, complex stress condition and corrosion atmosphere. No single
material is satisfied for these multifunctional requirements. As a result, TBC system with duplex-
type consists of a metallic bond coat (75~150 µm thick) and an insulating ceramic topcoat
(300~600 µm thick) was established. The bond coat protects the underneath substrate from high
temperature oxidation and corrosion as well as improves the adhesion strength between the
substrate and the topcoat. The ceramic topcoat that normally has a low thermal conductivity
could prevent the heat flux into the metallic substrate [2, 3, 5, 7, 9].
2. Background and Basic Overview
4
The earliest ceramic coatings were frit enamels which were applied to aircraft engine
components in the 1950s. In the 1960s, flame sprayed ceramic coatings with NiAl bond coats
were developed in commercial aero engines. Among the various early ceramic materials
evaluated for thermal barrier applications, alumina and zirconia were identified as promising
candidate materials. The effectiveness of alumina coatings was limited by the relatively high
thermal conductivity and destabilization upon temperatures above 1100 oC. Pure zirconia is also
not suitable for the application as it undergoes a different phase transition from martensitic
monoclinic to tetragonal at about 1000 oC accompanied by a large volume change (3 to 9 %).
Therefore, different doping additions, such as MgO or CaO, were used with the intent of
stabilizing the cubic phases [10]. V. S. Stubican [11] reported that the cubic phases were not
stable below about 1140 oC for calcia stabilized zirconia (CSZ) and 1400 oC for magnesia
stabilized zirconia (MSZ). Succeeding decades showed continuous improvements in the TBC
materials and coating technology. It was however in the 1980s when the TBCs were significantly
improved. During this decade, yttria stabilized zirconia (YSZ) was identified as an exceptional
ceramic topcoat material due to its high melting point, low thermal conductivity, relatively high
coefficient of thermal expansion when compared to other oxides and high thermal shock
resistance [12, 13]. This modification has resulted in a fourfold improvement in durability [14].
The initial zirconia-yttria TBCs contained 12-20 % Y2O3 to fully stabilize the cubic phase [10]
and Stecura proved that lowering the yttria level to 6-8 wt.%, TBC exhibited better performance
at the end of the 1970s [12] and has been frequently used in aero and stationary gas turbines
since the beginning of the 1980s [14-15]. Another reason for the frequent use of (6-8 wt.%) YSZ
is the contributed to relatively good fracture toughness of this material [16]. A higher amount of
stabilizer would lead to a fully stabilized cubic zirconia with a relatively low toughness. A lower
amount of stabilizing additive leads to a higher toughness at room temperature, but detrimental
phase transformations during heating could not be completely prevented [9]. Up to now, a
candidate ceramic layer that is better than YSZ in all terms of relevant properties has not been
discovered yet.

2. Background and Basic Overview
5
2.2 Spray Techniques of TBCs
In terms of preparation techniques, although there are various methods for depositing ceramic
layers on metal substrates, electron beam physical vapor deposition (EB-PVD) and atmospheric
plasma spraying (APS) are the most frequently used technologies for the deposition [2, 3, 5, 7, 9].
2.2.1 Electron Beam Physical Vapor Deposition (EB-PVD)
In the EB-PVD process, vapors are produced by heating the porous ingot of a ceramic material
with a high energy electron beam in a vacuum chamber, and the evaporated atoms condense on
the typically preheated substrates. Crystal nuclei form on favored sites, growing laterally and in
thickness to form individual columns. A rather globular microstructure is initially formed which
will then transition into a columnar structure due to the selection of a favorable growth direction
during further deposition [17]. The microstructure of an EB-PVD deposited TBC is shown in
Figure 2.1. The clearly visible columnar morphology can accommodate stress build-up under
tensile loading and the spacing between the columns allows a free expansion [18]. The EB-PVD
produced coatings offer the advantage of superior strain, erosion, and thermal shock tolerant
behavior as well as retain an aerodynamically favorable smooth surface and usually exhibit long
lifetime. Nevertheless, these advantages are gained at the expense of rather high-thermal
conductivity and production cost [5, 19-22, 23].
Figure 2.1 The microstructure of a 7YSZ thermal barrier coating deposited by EB-PVD on NiPtAl bond coat [17].
2. Background and Basic Overview
6
2.2.2 Atmospheric Plasma Spray (APS)
APS technique has been widely employed for TBC applications. The plasma gun typically
consists of a tungsten cathode and anode surrounded by a cooling jacket and passages for the
carrier gas. The plasma is generated by striking an arc between the cathode and anode with a
high direct current (DC) in the presence of the electrically excitable primary gas in confined
space. Argon or nitrogen is commonly applied as the primary gas. A high enthalpy secondary gas,
typically H2 or He, is injected into the established plasma plume to enhance the plasma
performance. The torch components are water cooled to prevent the cathode and anode from
degradation and melting by the high temperature plasma.
During spraying, the spray feedstock, typically in the form of powders but sometimes liquid,
suspension or wire, is injected into high temperature plasma and accelerated to high velocities,
impinging upon the substrate, and rapidly solidified to form a “splat” (a flattened particle). The
coating develops by successive impingement and interlock among the splats, resulting in laminar
microstructures and microcracks parallel to the metal/ceramic interface which provide low
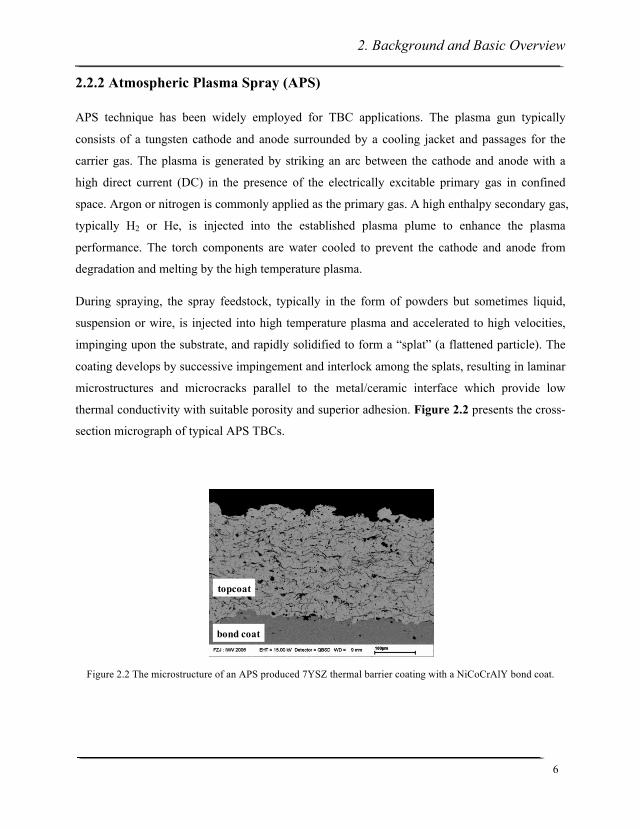
thermal conductivity with suitable porosity and superior adhesion. Figure 2.2 presents the cross-
section micrograph of typical APS TBCs.
Figure 2.2 The microstructure of an APS produced 7YSZ thermal barrier coating with a NiCoCrAlY bond coat.
topcoat
bond coat
2. Background and Basic Overview
7
APS TBCs are attractive for commercial application due to its versatility and low production
costs. However, APS TBCs generally have shorter thermal-cycling lives than EB-PVD TBCs,
because the proliferation of microstructural defects parallel to the interface and the roughness of
the interface. Hence, APS TBCs are typically not applied on the most demanding locations in
aircraft engines but on combustors, fuel vaporizers, after burner flame holders, and stator vanes.
APS TBCs have served extremely well in industrial gas turbine engines, including blade and
vane applications, because of lower operation temperatures, reduced temperature gradients, and
fewer thermal cycles [2].
2.3 Introduction of ‘Smart’ Coatings
Higher efficiency demands lead to increased combustion temperatures in gas turbine engines.
However, achieving higher engine operating temperature requires accurate knowledge of the
turbine blade temperature. Effective monitoring and diagnosis in such harsh operating conditions
is of critical importance. If critical operating conditions could be continuously monitored in real-
time, problems can be detected and solved during the operation. ‘Smart’ Coatings are generally
proposed for the purpose of in-situ monitoring during operation of turbine blades in order to
better control surrounding environment and design coatings with appropriate structures.
‘Smart’ coatings are coatings with integrated embedded sensors, such as thermocouple sensors or
strain gauge sensors and so on. This kind of coatings possesses multiple functions as thermal
barrier and sensors, with which feedback about the functional status and operating history of the
coatings as well as of the coated structure and surrounding environment could be provided.
2.4 State of the Art Deposition Methods for Sensors
2.4.1 Mask-based Twin Wire Arc Deposition
The embedded sensors within the coatings by thermal spray technology were first addressed by
Fasching et al. [24]. A mask-based twin wire arc deposition process was used to fabricate
2. Background and Basic Overview
8
thermocouples. In arc spraying, two conductive materials are injected into a direct current arc
and melted; an atomizing gas breaks up the molten materials into droplets at the wire tips and
propels it towards the prepared workpiece surface to form the coatings [25].
For preparing a thermocouple sensor within the coatings, a mask with constructed pattern was
placed on an insulating substrate and the first thermoleg was sprayed on it, leaving a thin wire
trace connected to a small pad. The second thermoleg was similarly sprayed by using another
mask and the junction was formed with connected pads. Additional insulation layers could be
sprayed onto the sensor to fully embed it. Feature sizes achievable with this approach are in the
order of 200 µm. The yielded Seebeck coefficients of sprayed thermocouples were reasonably
approaching bulk values when testing up to 200 °C.
2.4.2 Mask-based Sputtering
Magnetron sputtering is a plasma vapor deposition process in which plasma is created and
positively charged ions from the plasma are accelerated by an electrical field superimposed on
the negatively charged electrode or "target". The positive ions strike the negative electrode with
sufficient force to dislodge and eject atoms from the target [26]. The fabrication of the thin film
sensors was performed in a class 1000 cleanroom to minimize possible contamination. The
thermocouple Pt/ Pt13Rh thin film sensors were patterned with stenciled shadow masks during
sputter deposition. The PdCr gauge was prepared first by sputtering and then patterned with the
photolithography technique and chemical etching. These thin film sensors provided minimally
intrusive features. However, the disadvantages of this technology are quite time-consuming
because of either the application of masks or strict deposition conditions [27].
2.4.3 Direct-Write Thermal Spray (DWTS)
Over the past decade, thermal spray has been demonstrated the capability to fabricate a variety of
sensors that are particularly well suited under harsh environments. Up to now, thermocouple and
thermistor sensors, heaters, strain sensors, heat flux, and high density thermopile devices for
2. Background and Basic Overview
9
electricity production have been successfully fabricated [26, 28-35]. The typical dimension for
sensors formed using commercial thermal spray process is several centimeters and far from
applications. One approach to reduce the linewidth is to use a mask, which is placed over the
substrate to block a portion of the plume. Linewidths less than 1 mm can be achieved. However,
this approach restricts to non-conformal geometries. Apart from this, changes in the feature
geometry require a new mask which also limits its application. Another approach is to place an
aperture-collimator combined with a robotic motion control close to the torch to block the outer
portion of the spray plume in flight, resulting in a smaller linewidth. Linewidths in the order of
100 µm could be produced with this system [36-37]. This provides a variety of vital advantages:
reliability, robustness and survivability in extremely harsh thermal and chemical environments,
cost effective implementation, and fabrication onto surfaces that are large, conformal and
flexible [34].
Fabrication of finer linewidths is challenged by using thermal spray alone and cannot be reliably
prepared using this additive process alone. Laser micromachining of thermal spray coatings for
sensor applications was demonstrated [30] and feature sizes approaching to 15-20 µm could be
readily achieved [37].
2.5 Introduction of Laser Cladding Technology
Laser cladding is a well-established industrial technology, which utilizes a focused or defocused
laser beam as heating source to melt a thin layer of substrate and additive materials to create a
pore-free and crack-free coating.
2.5.1 Laser Beam Characteristics
Laser beam characteristics play an important role in laser cladding process. The quality of a laser
beam is indicated by many parameters. Some of them are beam parameter product (BPP), laser
beam mode, energy distribution over the beam spot area, polarization and focusability.
2. Background and Basic Overview
10
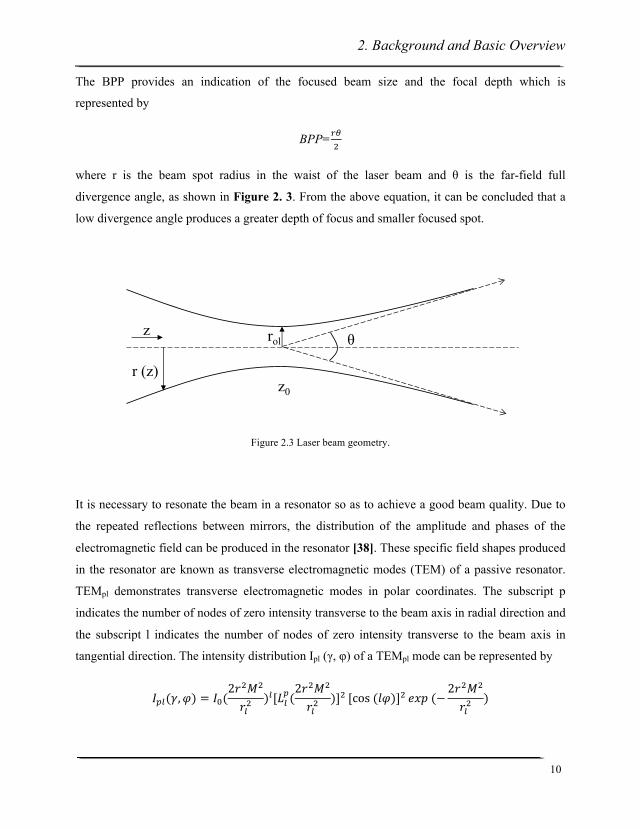
The BPP provides an indication of the focused beam size and the focal depth which is
represented by
BPP=!"!
where r is the beam spot radius in the waist of the laser beam and θ is the far-field full
divergence angle, as shown in Figure 2. 3. From the above equation, it can be concluded that a
low divergence angle produces a greater depth of focus and smaller focused spot.
Figure 2.3 Laser beam geometry.
It is necessary to resonate the beam in a resonator so as to achieve a good beam quality. Due to
the repeated reflections between mirrors, the distribution of the amplitude and phases of the
electromagnetic field can be produced in the resonator [38]. These specific field shapes produced
in the resonator are known as transverse electromagnetic modes (TEM) of a passive resonator.
TEMpl demonstrates transverse electromagnetic modes in polar coordinates. The subscript p
indicates the number of nodes of zero intensity transverse to the beam axis in radial direction and
the subscript l indicates the number of nodes of zero intensity transverse to the beam axis in
tangential direction. The intensity distribution Ipl (γ, φ) of a TEMpl mode can be represented by
𝐼!"(𝛾,𝜑) = 𝐼!(2𝑟!𝑀!
𝑟!!)![𝐿!
!(2𝑟!𝑀!
𝑟!!)]! [cos (𝑙𝜑)]! 𝑒𝑥𝑝 (−
2𝑟!𝑀!
𝑟!!)
z0
z
r (z)
rol θ
2. Background and Basic Overview
11
where I0 is the intensity scale factor (W/ m2), rl is the radius of the laser beam profile, M2 is the
beam quality factor and 𝐿!! is the generalized Laguerre polynomial of order p and index l [39].
The propagation can be illustrated by the quality factor M2, which is related as
M2=!"!!" !!!
where λ is the laser wavelength in the used medium (m), n is the index of reflection. The
propagation factor k is defined as
k= !!! −
!!!"!!" !
If k=M2=1, the laser beam is Gaussian.
2.5.2 Different Methods of Laser Cladding
Basically, there are two different kinds of techniques for laser cladding: two-step process and
single-step process. In the two-step process, the coating material in the form of powder is
preplaced on the substrate and melted with a laser beam to form a coating. In the single-step
cladding, an additive material is fed into the melting pool created by the laser beam as a powder,
wire, paste, or melts to form the coating [40-42].
2.5.2.1 Laser Cladding with Pre-placed Powder
Prior to the laser treatment, the powder particles are pre-placed with a certain thickness on the
surface of the substrate. Since pre-placed particles do not have enough bonding to the substrate,
it is necessary to prevent the particles from blowing away due to the gas flow during melting in
the second step. A chemical binder is usually mixed with particles to ensure its adhesion with the
substrate during laser treatment. In the second step of the process, a melting pool is created on
the top surface of pre-placed powders due to the laser radiation. A melt advances from the
surface towards to the interface due to the heat conduction. If the energy is sufficient, the heat
will penetrate into the substrate and a fusion bond will be created between the substrate and the
2. Background and Basic Overview
12
coating. Good adhesion and low dilution are obtained when supplying just enough energy.
Excessive energy leads to excessive dilution while insufficient energy causes incomplete melting
of particles or poor bonding strength [41, 43]. Results show that this technique works well for
single track production but is not suitable for multiple ones [44].
Some drawbacks of this process: it is time consuming due to additional slurry preparation and
difficult to deposit uniform layers on the surface of complex shaped components, therefore, it is
hardly used in industrial application. Bad quality clads with porous and high roughness are
always formed due to the evaporation or decomposition of residual binder. In addition, this
process usually has a small processing window. Therefore, two step processes always present
lower productivity and higher costs when comparing to the single step ones. Generally, injecting
the feedstock directly into the melting pool is preferred [41-42, 45-46].
2.5.2.2 One-Step Laser Cladding
Laser Cladding by Wire Feeding
In this process, wires are fed into the melting pool through a ceramic drum usually to produce a
layer of clad. Wire feeding is useful in cladding rotationally symmetric components that can be
rotated such that the surface can be clad in one continuous track [44]. Due to the feeding
mechanisms, it is essential to use a wire that have been strengthened and stored without plastic
deformation to guarantee stable feeding [43, 47-48]. This approach seems advantageous because
it is a single step process and material use efficiency is higher. The wire feeding nozzle must be
positioned close to the melt pool to ensure accurate feeding of the material to the proposed area.
Besides, the wire must be carefully controlled so it will not disturb the melting pool. A problem
with using wire is that the laser beam is partially shielded from the melt pool by the solid wire
and the laser energy is poorly absorbed by the wire, thus, the results tend to have limited
reproducibility. In summary, the wire feeding process has some major drawbacks. On one hand,
both the wire feeding rate and dilution are difficult to be controlled. On the other hand, low
surface energy and bonding strength, porosity and cracks are easily emerged [41, 44].
2. Background and Basic Overview
13
Laser Cladding by Paste
In laser cladding by paste, a stream of additive material in a form of paste is injected on the
substrate which is normally a little bit ahead of the laser beam [49]. The paste consists of the
powder particles mixed with a suitable binder. However, the binder must be dried within a short
time while the powder still keeps compact, otherwise, the particles would be blown away by the
shrouding gas. Therefore, a special paste feeding system needs to be carefully designed for this
process. Extreme sensitivity of this process to disturbances, high porosity and difficulties in paste
feeding mechanism limit its application [43].
Laser Cladding by Powder Injection
In laser cladding by powder injection, the clad material is injected as powder instead of wire into
the melting pool to produce a layer with a laser beam. A powder feeding system must be used. A
typical powder feeding system involves a powder feeder, powder delivery tubes and a powder
feed nozzle. Special powder feeders have been designed for laser cladding [50-51], but powder
feeders for plasma spray are more often applied. The powder feeder can be categorized into
gravity feed and carrier gas propelled. The carrier gas feeder is most commonly used. Powder
delivery tubes convey the powder to the nozzle by a carrier gas and the powder feeding nozzle is
classified as either lateral or coaxial. In lateral powder feeding, particles are injected into
interaction region from one side without preheating. Different cladding directions lead to
completely different local cladding conditions while the powder stream is injected off-axis from
the laser beam. When the powder stream is fed to the molten pool created by the laser beam from
the front, the powder utilization efficiency is the maximum compared to the other feeding
locations [45, 52]. Therefore, in terms of this process, such a feeding system has certain
limitations. First, it is difficult to align the location of the powder delivery with respect to the
laser beam center. This positioning is very critical, and a small deviation will greatly decrease
the powder utilization efficiency, and lead to a poor quality of cladding tracks. Moreover, this
technique does not work well for complex geometric patterns which require multidirectional
motions [53]. Several designs of coaxial nozzles were reported [54-56]. In a coaxial feeding
nozzle, the focused laser beam passes through a central cone which is kept unobstructed by a
2. Background and Basic Overview
14
flow of argon, and the powder is transported by a flow of inert gas through an outer cone. A
concentric powder stream is injected from all radial directions during the coaxial laser cladding
process. Equivalent tracks are fabricated independent of cladding directions perpendicular to the
laser beam. Therefore, coaxial laser cladding is more widely used for industrial purposes. This
advantage of coaxial laser cladding is employed in the formation of metallic parts from 3D
designs.
2.5.3 Clad Dimensional Characteristics
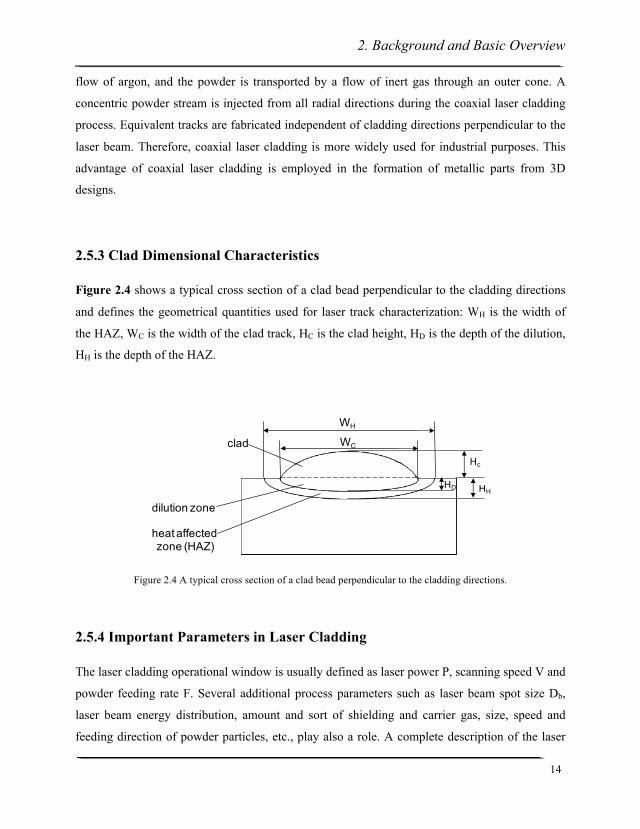
Figure 2.4 shows a typical cross section of a clad bead perpendicular to the cladding directions
and defines the geometrical quantities used for laser track characterization: WH is the width of
the HAZ, WC is the width of the clad track, HC is the clad height, HD is the depth of the dilution,
HH is the depth of the HAZ.
Figure 2.4 A typical cross section of a clad bead perpendicular to the cladding directions.
2.5.4 Important Parameters in Laser Cladding
The laser cladding operational window is usually defined as laser power P, scanning speed V and
powder feeding rate F. Several additional process parameters such as laser beam spot size Db,
laser beam energy distribution, amount and sort of shielding and carrier gas, size, speed and
feeding direction of powder particles, etc., play also a role. A complete description of the laser
clad
heat affected zone (HAZ)
dilution zone
WC
WH
Hc
HHHD
2. Background and Basic Overview
15
cladding technique with injecting powder into a laser melt pool is rather complex because of
numerous interactions (laser beam/powder, laser beam/substrate, powder stream/melt pool,
powder stream/ solid substrate, etc.) with different physical phenomena (mass and heat transfer,
fluid flow, phase transformations, etc.) involved [45].
Since there are many parameters involved in LC which are strongly coupled with each other, the
energy input per unit area (E = P/ VDb) and the mass of injected powder per unit area (G=F/ VDb)
are considered to be two important combined process parameters for the quality of the clad [57].
Dilution
The dilution quantifies the relative amount of the substrate that has been molten during the
cladding process and mixed with an additive material. Although, for successful cladding some
dilution between the coating and substrate is always required to ensure a good metallurgical bond,
the fact that the high dilutions may degrade coating properties requires that it stays reasonable
low. According to the specified parameters in Figure 2.4, the dilution is
dilution = !!!!!!!
Laser Pulse Shaping
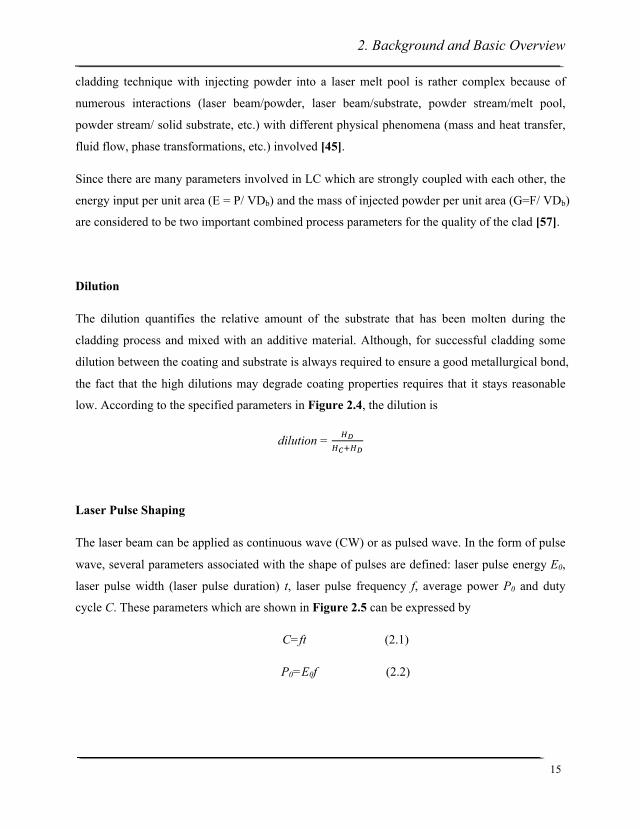
The laser beam can be applied as continuous wave (CW) or as pulsed wave. In the form of pulse
wave, several parameters associated with the shape of pulses are defined: laser pulse energy E0,
laser pulse width (laser pulse duration) t, laser pulse frequency f, average power P0 and duty
cycle C. These parameters which are shown in Figure 2.5 can be expressed by
C=ft (2.1)
P0=E0f (2.2)
2. Background and Basic Overview
16
Figure 2.5 Laser pulse shaping.
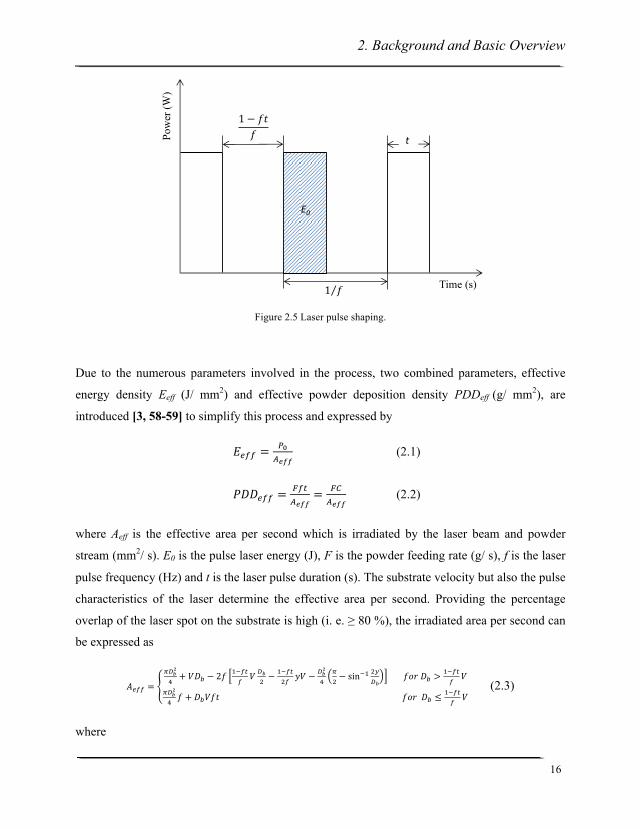
Due to the numerous parameters involved in the process, two combined parameters, effective
energy density Eeff (J/ mm2) and effective powder deposition density PDDeff (g/ mm2), are
introduced [3, 58-59] to simplify this process and expressed by
𝐸!"" =!!!!""
(2.1)
𝑃𝐷𝐷!"" =!"#!!""
= !"!!""
(2.2)
where Aeff is the effective area per second which is irradiated by the laser beam and powder
stream (mm2/ s). E0 is the pulse laser energy (J), F is the powder feeding rate (g/ s), f is the laser
pulse frequency (Hz) and t is the laser pulse duration (s). The substrate velocity but also the pulse
characteristics of the laser determine the effective area per second. Providing the percentage
overlap of the laser spot on the substrate is high (i. e. ≥ 80 %), the irradiated area per second can
be expressed as
𝐴!"" =
!!!!
!+ 𝑉𝐷! − 2𝑓
!!!"!𝑉 !!
!− !!!"
!!𝑦𝑉 − !!
!
!!!− sin!! !!
!! 𝑓𝑜𝑟 𝐷! >
!!!"!𝑉
!!!!
! 𝑓 + 𝐷!𝑉𝑓𝑡 𝑓𝑜𝑟 𝐷! ≤!!!"! 𝑉
(2.3)
where
Pow
er (W
)
Time (s)
E0
t
2. Background and Basic Overview
17
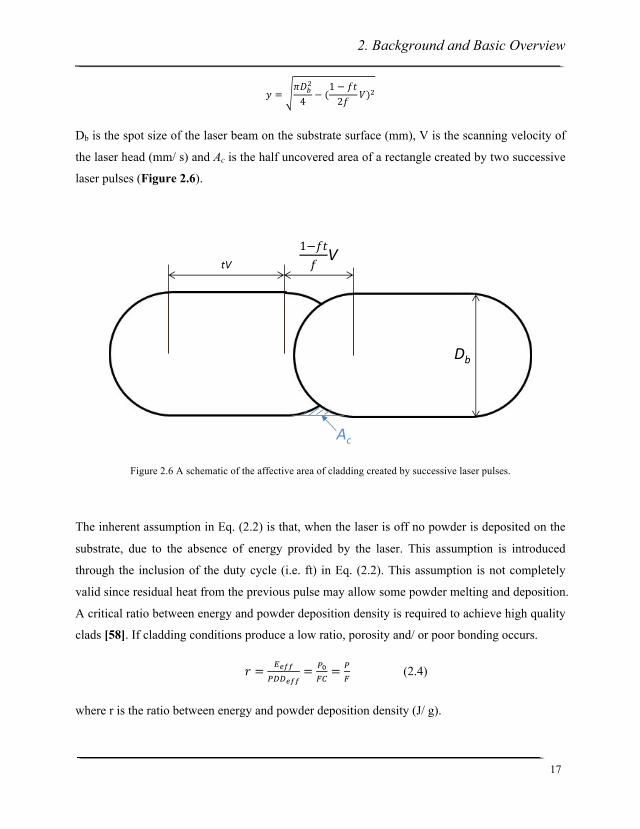
𝑦 =𝜋𝐷!!
4− (
1 − 𝑓𝑡2𝑓
𝑉)!
Db is the spot size of the laser beam on the substrate surface (mm), V is the scanning velocity of
the laser head (mm/ s) and Ac is the half uncovered area of a rectangle created by two successive
laser pulses (Figure 2.6).
Figure 2.6 A schematic of the affective area of cladding created by successive laser pulses.
The inherent assumption in Eq. (2.2) is that, when the laser is off no powder is deposited on the
substrate, due to the absence of energy provided by the laser. This assumption is introduced
through the inclusion of the duty cycle (i.e. ft) in Eq. (2.2). This assumption is not completely
valid since residual heat from the previous pulse may allow some powder melting and deposition.
A critical ratio between energy and powder deposition density is required to achieve high quality
clads [58]. If cladding conditions produce a low ratio, porosity and/ or poor bonding occurs.
𝑟 = !!""!""!""
= !!!"= !
! (2.4)
where r is the ratio between energy and powder deposition density (J/ g).
tVV
Ac
Db
2. Background and Basic Overview
18
2.5.5 Non-invasive Thermal Imaging Techniques
A two dimensional (2D) temperature mapping is useful to optimize the cladding parameters.
Especially if the surface structure is non-uniform, cooling of the tracks could be hindered to
some extent leading to non-uniform temperature distributions. The non-uniform temperature
distribution indicates that the injection conditions were not properly adjusted. On the other hand,
the smooth and regular shape of temperature distribution corresponds to the well-optimized
cladding [60].
To date, some research has been done to detect and monitor the temperature by applying non-
contact thermal imaging techniques during the laser processing. Thermocouple and imaging
techniques were used to monitor the thermal signature during the laser rapid forming process,
and study the solidification behavior, residual stress, and microstructural evolution which were
determined by the thermal history [61]. Temperature measurement by a pyrometer was carried
out and the control of the laser power was realized [62]. The temperature of the formed layer by
an IR pyrometer was measured and the powder efficiency through an inverse calculation of the
boundary temperature obtained from observed surface temperature was estimated [63]. The
temperature of the molten pool in the process of the laser rapid forming with a two-color infrared
thermometer and the influences of the laser processing parameters on the temperature of molten
pool was investigated [64].
Black-Body Radiation
Each body with a temperature above the absolute zero (0 Kelvin) emits an electromagnetic
radiation from its surface, which arises from the motion of atoms which make up the body. In
1879, Stefan proposed a law that related the total energy radiated from a body to its temperature
which can be expressed by means of the following equation:
R=σεT4

2. Background and Basic Overview
19
where R is the total thermal radiation per unit surface area of the body, σ is the Stefan’s constant,
ε is the emissivity which depends on the nature of the emitting surface and T is the absolute
temperature.
A black body is a radiator, which absorbs all incoming radiation and shows neither reflection nor
transmissivity.
α= ε = 1
where α is called absorptivity.
The total radiation emitted by a black-body according to Stefan’s law is:
R=σT4
The entire emitted radiation of a black body within the overall wavelength range increases
proportional to the fourth power of its absolute temperature.
Real Body Radiation
The intensity of infrared radiation depends on the temperature as well as on the radiation features
of the surface material of the measuring object. The emissivity is used as a material constant
factor to describe the ability of the body to emit infrared energy. The emissivity depends on the
material, its surface, temperature and wavelength. Many objects consisting of nonmetallic
material show a high and relatively constant emissivity independent from their surface
consistency, at least in longwave ranges. If the emissivity chosen is too high, the infrared
thermometer displays a temperature value much lower than the real temperature of the measuring
object. A low emissivity carries the risk of inaccurate measuring results due to interference of
infrared radiation emitted by background objects.
2. Background and Basic Overview
20
2.5.6 Traditional Applications
Current trends of laser cladding are to produce multifunctional protective coatings for the
modification of surface properties, such as, wear and corrosion resistance, abrasion and thermal
resistance, or the repair of critical components with a laser beam [65-68]. The majority of work
is the metallic coating production by laser cladding process for aerospace, medical and
automotive industrial applications. Nickel-based superalloys [69-74], titanium-based alloys [75-
78] and cobalt-based alloys [79-81] are some of the popular alloys that are deposited on different
substrates to improve the substrate capability as wear and high temperature resistance. With high
speed cladding and the characteristic of rapid solidification processes, extremely homogeneous
structures could be obtained on the surface of work pieces [82-83]. Recently, production of
glassy metallic layers which provide superior resistance against wear and corrosion by laser
cladding was reported [84]. Bioceramics coating on titanium alloys applied in orthopedic
implants was also conducted by laser cladding [85].
A new and increasingly important application of laser cladding is rapid fabrication of complex
components and tools in additive manufacturing. With this technology, high value tools and
components can be produced with low manufacturing cost, good surface quality and a short
manufacturing time [86]. Additive manufacturing technologies allow an accurate model of a
previously designed in a computer without the need for conventional manufacturing techniques,
and the production time is significant reduced by 40 percent with laser cladding process [87-88].
2.5.7 New Applications
Contrary to the traditional laser cladding process, type K thermocouple (TC) sensors fabricated
with this technique without altering the surface structures of the substrate is described in this
work. Several advantages are possessed by the produced TC sensors, such as neither vacuum
processing nor application of masks as well as short-time processing. Feature sizes achievable
with this approach are in the range of several ten microns. The resistivity values of the cladded
TCs are estimated and compared to that of the commercial standard K-type TC. The thermal and

2. Background and Basic Overview
21
electrical performance of manufactured TC sensors is also evaluated and characterized at high
temperatures.

2. Background and Basic Overview
22
3. Experimental Methods
23
3. Experimental Methods
3.1 Concept of Embedded Thermocouple (TC) Sensors
The aim is to fabricate functional electrical structures within layered TBC systems: electric
conductive structures need isolation otherwise a short circuit will occur; sensor structures have to
be isolated against the metallic substrate by at least a thin ceramic layer. Therefore, a thin layer
of a TBC ceramic material is used as the substrate. Another ceramic layer (again TBC utilized)
to protect sensor structures from harsh environment is applied (not strictly necessary); if
insulation against each other by ceramic in between is possible, several sensors in different
locations and/or height within the same ceramic coating layer of the same component could be
implemented. Thereby, sensors monitoring surface temperature distribution or the heat flux
through a coating can be realized. Typically such embedded thermocouple sensors will be
located close to the ceramic top coat/ bond coat interface, the interface temperature which
determines the thermally grown oxides (TGO) growth rate can be approximately measured.
Hence, the life time of TBC system would be further evaluated. Figure 3.1 displays the
framework of one embedded thermocouple sensor.

3. Experimental Methods
24
Figure 3.1 Concept of one embedded thermocouple sensor.
3.2 Substrate Materials
Since Ni-based superalloys possess excellent high temperature corrosion resistance and
mechanical properties, they were widely used on gas turbine engines. Inconel 738 LC was
studied as the initial metallic substrate. Much cheaper stainless steel was employed as the
candidate substrate material for those experiments aimed for process optimization and where no
subsequent heat treatment has been planned.
3.3 Feedstock Selection
For the thermal spray and the laser cladding processes, powderous feedstocks have been used.
Amdry 386 (Oerlikon Metco, Wohlen, Switzerland), composed of Ni-21Co-17Cr-12Al-1Y, was
selected as the bond coat material which was manufactured by vacuum plasma spraying.
Both insulation layers made of ZrO2-8Y2O3 (Oerlikon Metco 204NS, Wohlen, Switzerland) were
produced by APS process with standard spraying parameters.
metallic substrate
YSZbond coat TC
+
-‐
top insulation layerbottom insulation layer
thermocouple layerjunction
top view
3. Experimental Methods
25
Nitrogen gas atomized type-K thermocouple powders provided by Sandvik Osprey company
(Sandvik Osprey, United Kingdom) were chosen as the candidate thermocouple sensor materials
due to its high output voltage and a wide working range of temperatures. Alumel (Ni-2Al-2Mn-
1Si) and chromel (Ni-10Cr) create a circuit with negative and positive polarities for the K type
thermocouple.
3.4 Thermal Spray Processes
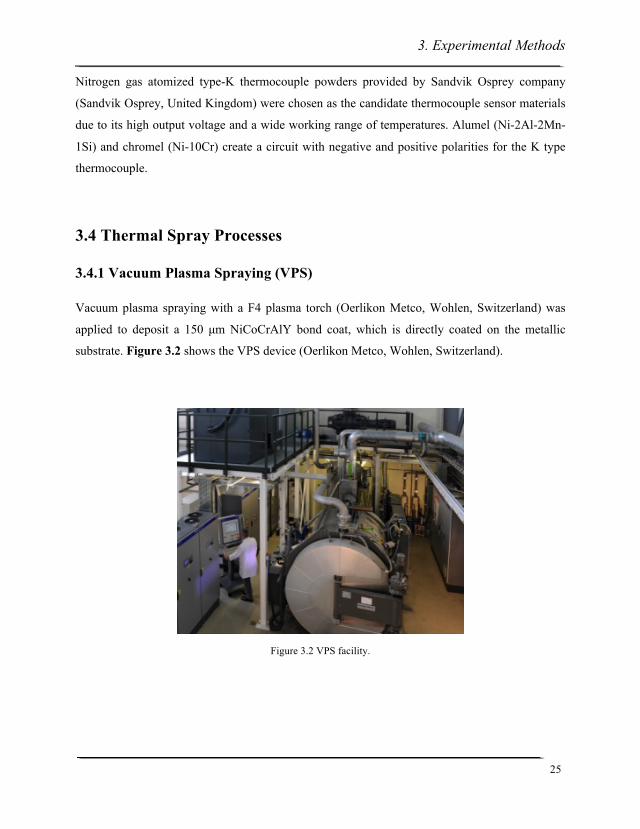
3.4.1 Vacuum Plasma Spraying (VPS)
Vacuum plasma spraying with a F4 plasma torch (Oerlikon Metco, Wohlen, Switzerland) was
applied to deposit a 150 µm NiCoCrAlY bond coat, which is directly coated on the metallic
substrate. Figure 3.2 shows the VPS device (Oerlikon Metco, Wohlen, Switzerland).
Figure 3.2 VPS facility.
3. Experimental Methods
26
3.4.2 Atmospheric Plasma Spray (APS)
Both insulation layers with 17 % ~ 18 % porosity were produced from a commercially available
YSZ powder (Oerlikon Metco 204NS) and these layers were deposited by APS process in a
Multicoat facility (Oerlikon Metco, Wohlen, Switzerland) with a three-cathode TriplexProTM 210
gun, as shown in Figure 3.3. The bottom YSZ layer was deposited with a thickness of about 200
µm and the top YSZ layer with variable thicknesses. Before coating, the metallic substrate was
previously sand-blasted with alumina particles with an average size of 0.71 µm and
ultrasonically cleaned in an ethanol bath. The stainless steel plate coated with 200 µm thickness
thermally sprayed yttria partially stabilized zirconia (8YSZ, ZrO2-8Y2O3) coatings was used as
the substrate for the subsequent laser cladding, the dimension of which was about 50 mm (length)
× 50 mm (width) × 3 mm (thickness). The substrate was cleaned in an ethanol bath and dried
with compressed air before deposition of the sensor structures.
Figure 3.3 A Oerlikon Metco TriplexPro 210 APS plasma gun in operation
3. Experimental Methods
27
3.5 Laser Cladding Technology
The deposition of type K thermocouple sensors was performed by coaxial laser cladding
technique. The experiments were conducted with a 400 W Nd: YAG laser system TruLaser Cell
3008 (Trumpf, Germany) combined with a fiber laser TruFiber 400 (Trumpf, Germany) as the
power source. A three-axis CNC (computerized-numerical-control) table was employed to move
the laser beam and the powder feeding system over the substrate with a controlled scanning
speed. A coaxial powder nozzle Coax 8 (ILT, Aachen, Germany) and a powder hopper (TWIN-
10-2, Oerlikon Metco, Wohlen, Switzerland) as a powder feeder were used. Argon was used on
one hand as carrier gas to deliver both thermocouple powders respectively from the powder
hopper and on the other hand as shielding gas to protect the process from oxidation while the
laser beam scans the surface of the substrate. Figure 3.4 shows the laser cladding device and the
coaxial jet nozzle with injected powder.
Figure 3.4 Experimental setup: (a) laser system TruLaser Cell 3008 and (b) coaxial jet-nozzle with injected powder.
The spot size was varied by adjusting the position of internal lens of the laser beam. The
variation of the stand-off distance S, shown in Figure 3.5 changes with the different focus
position of the laser beam while the divergence angle of the laser beam keeps constant. The
(a) (b)
3. Experimental Methods
28
focus position was 9.0 mm when the laser beam was focused 7.0 mm below the laser nozzle
(S=0). With the increase/ decrease of stand-off distance, the focus position was increased/
decreased correspondingly.
Figure 3.5 Schematic of laser cladding process.
The powder feeding rate is varied by controlling the disk rotation speed of the rotating disk. A
disk with a notch of 5 mm × 0.6 mm for the powder hopper (Figure 3.6) was applied. A funnel-
shaped powder feed geometry was obtained as seen in Figure 3.4b. The powder focus position
was 7 mm underneath the coaxial jet nozzle and the minimum powder focus size was about 0.2
mm.
Figure 3.6 Disk for the powder hopper.
5 mm
0.6 mm
3. Experimental Methods
29
3.6 Characterization Techniques
3.6.1 Particle Size Distribution
The particle size distribution of both feedstock powders was characterized by Particle Analyzer
Horiba LA-950V2 (Horiba Europe GmbH, Germany). The LA-950 measures light scattering
patterns of the particle sizes with the interaction of the laser light. The scattering-degree
increases with decreasing particle size and vice versa. The number of particles is represented by
the intensity of the scattered light. It is able to measure the particle size over a range of 0.01 µm-
3000 µm.
3.6.2 Micro-spot Monitor (MSM)
The spatial power density distribution of the laser beam which is one of the important factors to
affect the track geometry was measured by a Micro-spot Monitor (MSM, Primes, Germany). The
MSM is a camera-based, beam diagnostic system capable of measuring wavelengths from 248
nm to 1100 nm. The device is used for the analysis of focused laser beams. It measures the
spatial power density distribution within the focus range of the processing optics. The
measurement is done using a diffraction limited objective projecting the image of the power
density distribution onto a CCD-sensor.
This device was set right beneath the laser head nozzle with a certain distance. By varying the
position of the lens within its focus range, the spatial power density distribution could be
characterized. The spot size and center as well as the focus position of the laser beam could be
further derived.
3.6.3 Infrared (IR) Camera
An infrared camera Optris PI200 (Optris GmbH, Germany) equipped by an ZnSe sensor with 7.5
to 13 µm band pass arranged on 160 × 120 pixel array with up to 128 Hz, was applied to monitor
the surface temperature for a travelling speed up to 400 mm/ min. The measuring range is up to
3. Experimental Methods
30
1500 oC with an accuracy of ± 2 oC. This IR camera was positioned 50 mm from the deposition
area with an integration time of 20 ms and a single pixel size of 0.13 mm.
An infrared camera (FLIR SC655, Germany) equipped by a FOL25SF10 lens with 640 × 120
pixels was applied to monitor the surface temperature at higher travelling speeds up to 1500 mm/
min. The measurable temperature range is up to 2000 oC. The integration time and single pixel
size are 5 ms and 0.18 mm, respectively.
3.6.4 Cyberscan Topographer
Surface topography, dimensions, cross-sectional area and roughness measurement of cladded
tracks were carried out with a Cyber Scan CT200 (Technologies GmbH, Ingolstadt, Germany)
non-contact laser scanning inspection system equipped with a confocal laser sensor LT-9010M
(Keyence Deutschland GmbH, Neu-Isenburg, Germany) and a laser Triangulations sensor DRS
8000 (Cyber Optics Ltd., North Yorkshire, UK).
3.6.5 Light Microscopy and Confocal Laser Microscopy
For the investigation of macroscopic and cross sectional structures of tracks after laser cladding,
a stereo-microscope SZX12 (Olympus, Japan) and a laser microscope VK-9710K (Keyence,
Japan) were used, respectively. By illuminating the sample at an angle from the side under the
stereo microscope, shadows of cladded tracks could be observed which implied whether
homogeneous and well-bonded tracks could be obtained or not. A HAZ can be analyzed with the
laser microscope on cross-sections of deposited clads.
3.6.6 Ohmmeter and Four Probe Tester
The electrical conductivity properties of cladded tracks were first roughly estimated with an
Ohmmeter (Meterman, Germany), if conductive, a self-assembled direct-current Four Probe
3. Experimental Methods
31
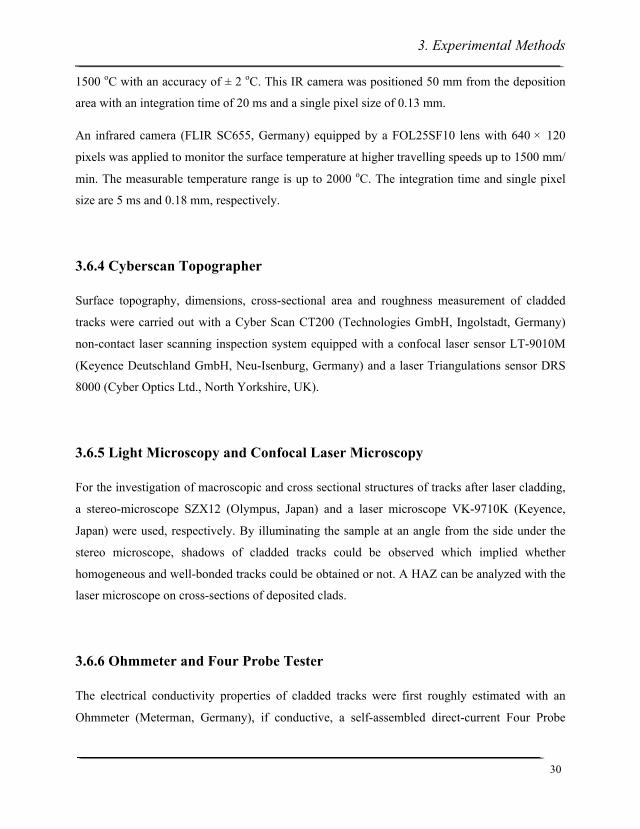
Tester was utilized to further examine the resistance (Figure 3.7). The resistivity of cladded
tracks could be calculated with the following equation:
𝜌 =𝑅 ∙ 𝐴𝐿
where R is resistance (Ω), A is the cross-sectional area (m2) and L is the length (m). The cross-
sectional area is estimated under the Cyberscan topographer and the length is the distance
between voltage sense connections.
Figure 3.7 Schematic of four point resistance measurement of one clad.
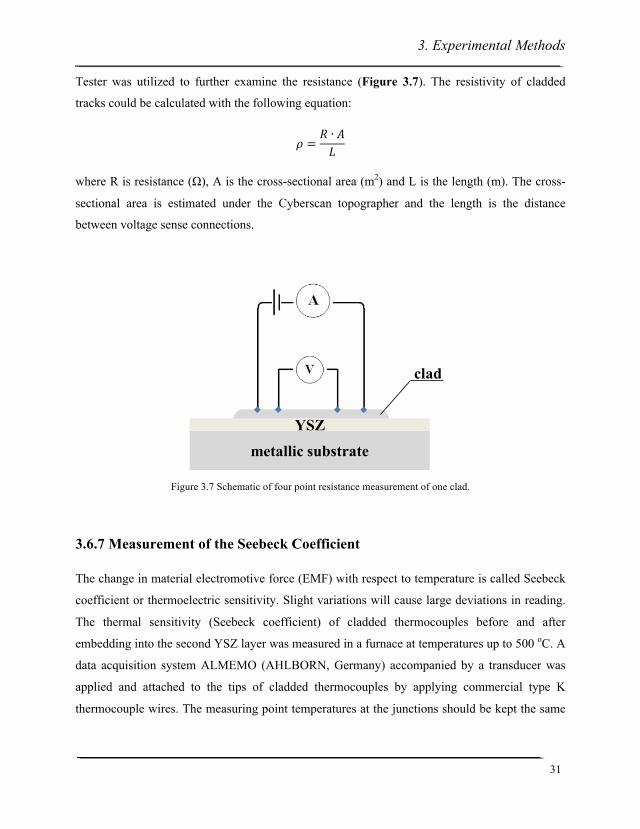
3.6.7 Measurement of the Seebeck Coefficient
The change in material electromotive force (EMF) with respect to temperature is called Seebeck
coefficient or thermoelectric sensitivity. Slight variations will cause large deviations in reading.
The thermal sensitivity (Seebeck coefficient) of cladded thermocouples before and after
embedding into the second YSZ layer was measured in a furnace at temperatures up to 500 oC. A
data acquisition system ALMEMO (AHLBORN, Germany) accompanied by a transducer was
applied and attached to the tips of cladded thermocouples by applying commercial type K
thermocouple wires. The measuring point temperatures at the junctions should be kept the same
metallic substrate
YSZ
clad
3. Experimental Methods
32
to have the reliable temperature reading. Figure 3.8 illustrates the setup for the Seebeck
coefficient measurement.
Figure 3.8 Seebeck coefficient measurement setup.
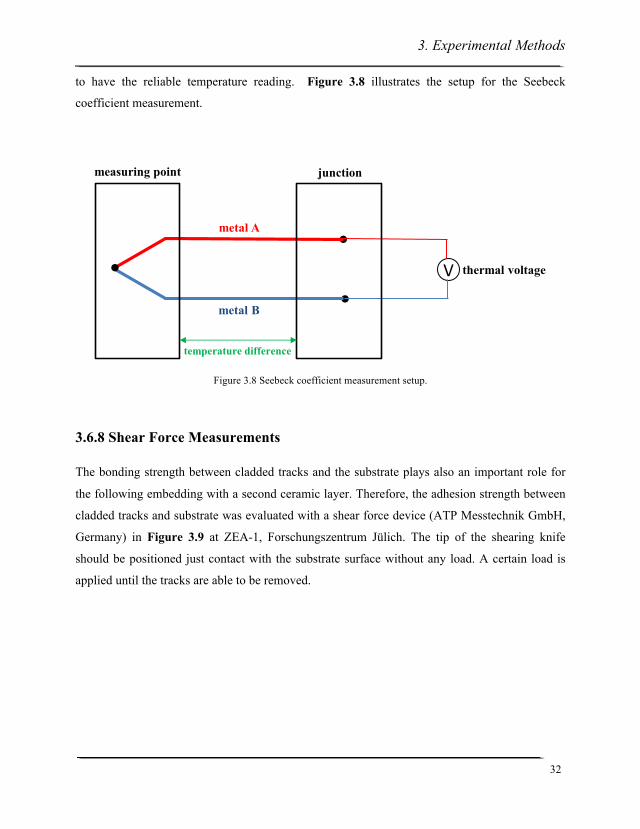
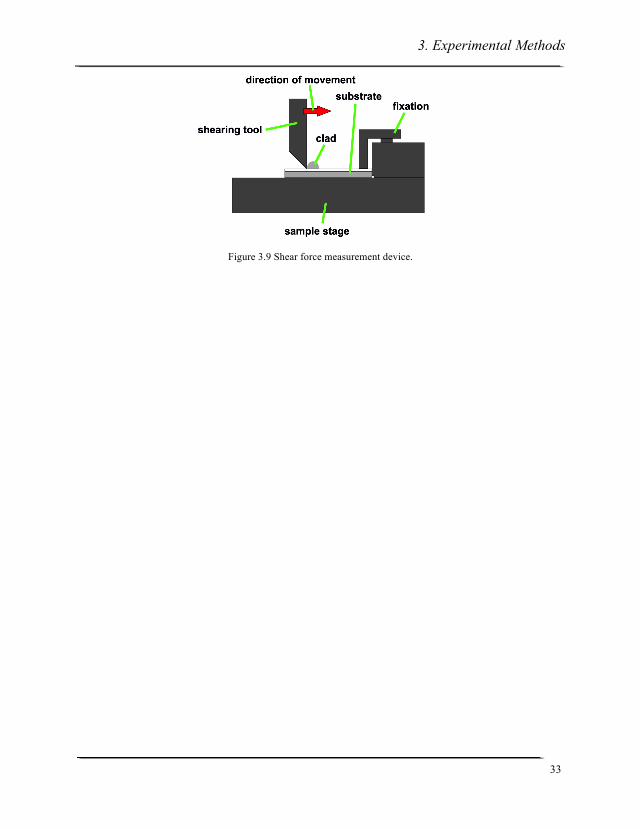
3.6.8 Shear Force Measurements
The bonding strength between cladded tracks and the substrate plays also an important role for
the following embedding with a second ceramic layer. Therefore, the adhesion strength between
cladded tracks and substrate was evaluated with a shear force device (ATP Messtechnik GmbH,
Germany) in Figure 3.9 at ZEA-1, Forschungszentrum Jülich. The tip of the shearing knife
should be positioned just contact with the substrate surface without any load. A certain load is
applied until the tracks are able to be removed.
metal A
metal B
V
temperature difference
thermal voltage
measuring point junction
3. Experimental Methods
33
Figure 3.9 Shear force measurement device.

3. Experimental Methods
34
4. Experimental Results and Discussion
35
4. Experimental Results and Discussion
4.1 Feedstock Characterization
The particle size distribution for both bond-coat and YSZ insulation layer was measured by static
laser scattering. The average diameter for the bond coat is 24 µm (d10=15 µm, d90=36 µm) and
for the YSZ layer is 54 µm (d10=28 µm, d90=85 µm), respectively.
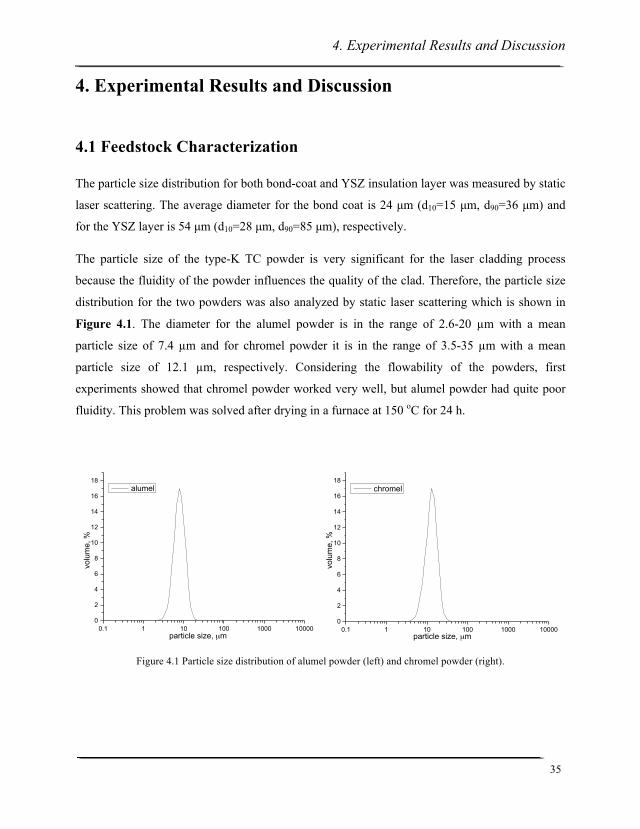
The particle size of the type-K TC powder is very significant for the laser cladding process
because the fluidity of the powder influences the quality of the clad. Therefore, the particle size
distribution for the two powders was also analyzed by static laser scattering which is shown in
Figure 4.1. The diameter for the alumel powder is in the range of 2.6-20 µm with a mean
particle size of 7.4 µm and for chromel powder it is in the range of 3.5-35 µm with a mean
particle size of 12.1 µm, respectively. Considering the flowability of the powders, first
experiments showed that chromel powder worked very well, but alumel powder had quite poor
fluidity. This problem was solved after drying in a furnace at 150 oC for 24 h.
Figure 4.1 Particle size distribution of alumel powder (left) and chromel powder (right).
0.1 1 10 100 1000 100000
2
4
6
8
10
12
14
16
18
volu
me,
%
particle size, µm
alumel
0.1 1 10 100 1000 100000
2
4
6
8
10
12
14
16
18
volu
me,
%
particle size, µm
chromel
4. Experimental Results and Discussion
36
4.2 Laser Beam Characterization
4.2.1 Spatial Distribution of the Laser Beam
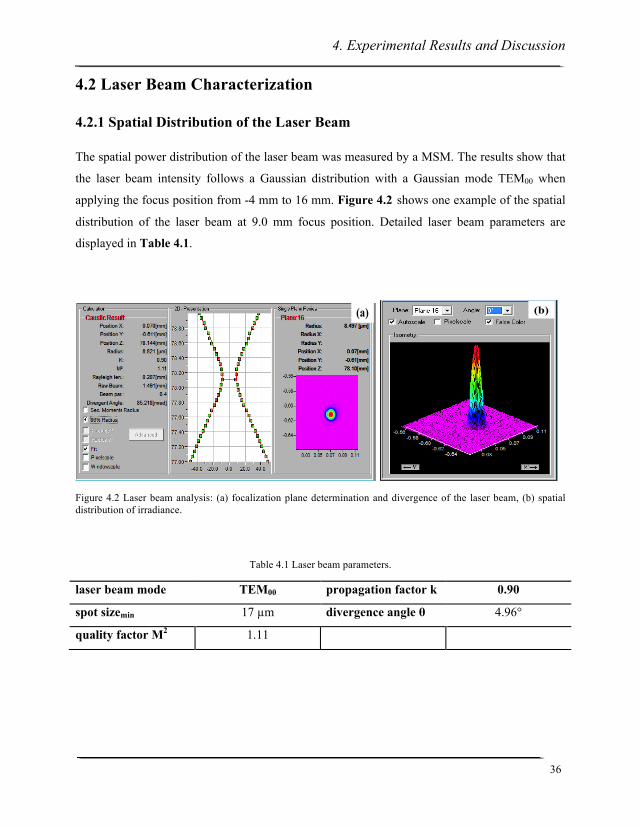
The spatial power distribution of the laser beam was measured by a MSM. The results show that
the laser beam intensity follows a Gaussian distribution with a Gaussian mode TEM00 when
applying the focus position from -4 mm to 16 mm. Figure 4.2 shows one example of the spatial
distribution of the laser beam at 9.0 mm focus position. Detailed laser beam parameters are
displayed in Table 4.1.
Figure 4.2 Laser beam analysis: (a) focalization plane determination and divergence of the laser beam, (b) spatial distribution of irradiance.
Table 4.1 Laser beam parameters.
laser beam mode TEM00 propagation factor k 0.90
spot sizemin 17 µm divergence angle θ 4.96°
quality factor M2 1.11
(a) (b)

4. Experimental Results and Discussion
37
4.2.2 Spot Size Determination
Since the track width is strongly dependent on the spot size on the substrate [62], the relationship
of the spot size and the focus position measured by the MSM is given in Figure 4.3. It can be
seen that the minimum laser beam diameter is about 17 µm at 9.0 mm focus position and the spot
size is linearly increasing accordingly when decreasing or increasing the focus position.
Figure 4.3 The relationship between the spot size and focus position.
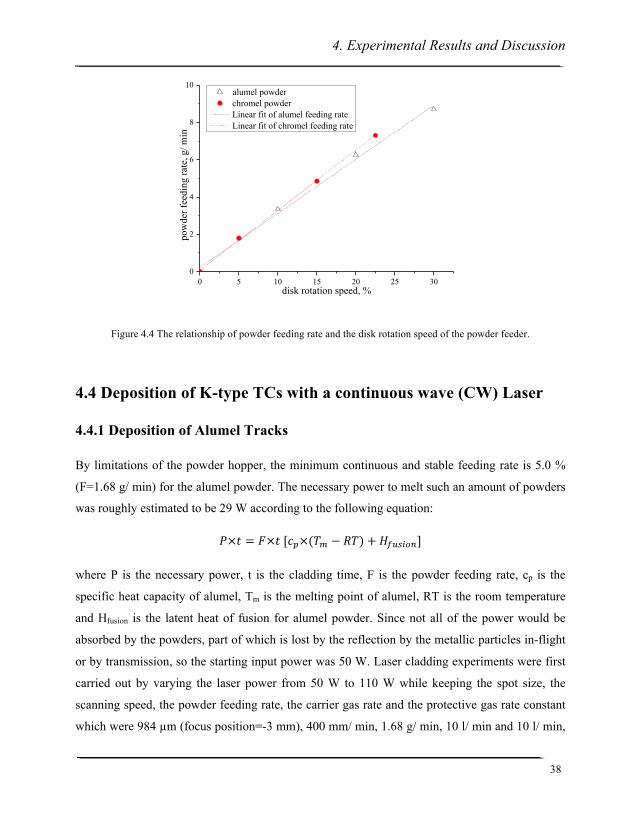
4.3 Powder Feeding Rate
The powder feeding rate for both powders under the different disk rotation speed was separately
measured by collecting powders at the nozzle exit for 5 minutes feeding into a clean bottle
without activating the laser. The results are displayed in Figure 4.4.
-5 0 5 10 15 20 25
0
200
400
600
800
1000
1200
Spot
size
, µm
Focus position, mm
Coax-Nozzle with MSM
4. Experimental Results and Discussion
38
Figure 4.4 The relationship of powder feeding rate and the disk rotation speed of the powder feeder.
4.4 Deposition of K-type TCs with a continuous wave (CW) Laser
4.4.1 Deposition of Alumel Tracks
By limitations of the powder hopper, the minimum continuous and stable feeding rate is 5.0 %
(F=1.68 g/ min) for the alumel powder. The necessary power to melt such an amount of powders
was roughly estimated to be 29 W according to the following equation:
𝑃×𝑡 = 𝐹×𝑡 [𝑐!×(𝑇! − 𝑅𝑇)+ 𝐻!"#$%&]
where P is the necessary power, t is the cladding time, F is the powder feeding rate, cp is the
specific heat capacity of alumel, Tm is the melting point of alumel, RT is the room temperature
and Hfusion is the latent heat of fusion for alumel powder. Since not all of the power would be
absorbed by the powders, part of which is lost by the reflection by the metallic particles in-flight
or by transmission, so the starting input power was 50 W. Laser cladding experiments were first
carried out by varying the laser power from 50 W to 110 W while keeping the spot size, the
scanning speed, the powder feeding rate, the carrier gas rate and the protective gas rate constant
which were 984 µm (focus position=-3 mm), 400 mm/ min, 1.68 g/ min, 10 l/ min and 10 l/ min,
0 5 10 15 20 25 300
2
4
6
8
10 alumel powder chromel powder Linear fit of alumel feeding rate Linear fit of chromel feeding rate
pow
der f
eedi
ng ra
te, g
/ min
disk rotation speed, %
4. Experimental Results and Discussion
39
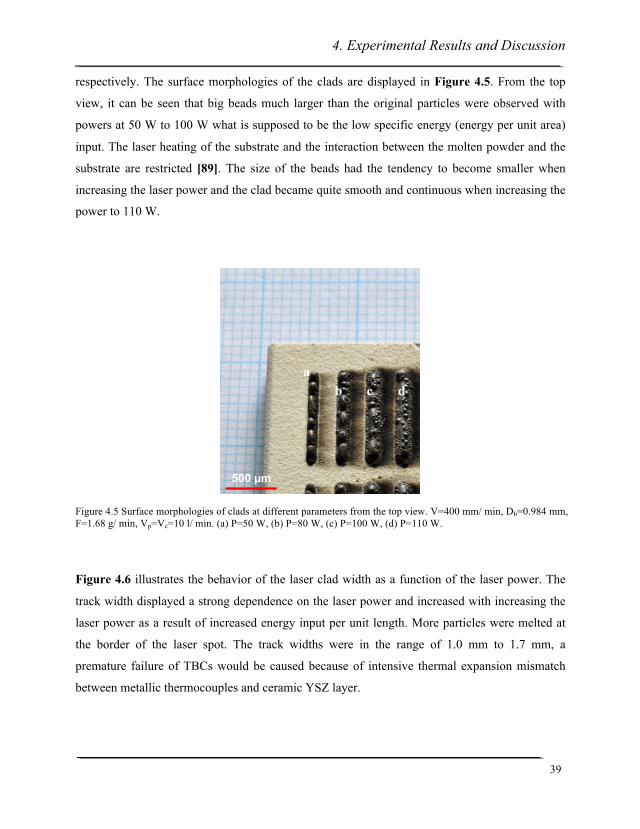
respectively. The surface morphologies of the clads are displayed in Figure 4.5. From the top
view, it can be seen that big beads much larger than the original particles were observed with
powers at 50 W to 100 W what is supposed to be the low specific energy (energy per unit area)
input. The laser heating of the substrate and the interaction between the molten powder and the
substrate are restricted [89]. The size of the beads had the tendency to become smaller when
increasing the laser power and the clad became quite smooth and continuous when increasing the
power to 110 W.
Figure 4.5 Surface morphologies of clads at different parameters from the top view. V=400 mm/ min, Db=0.984 mm, F=1.68 g/ min, Vp=Vc=10 l/ min. (a) P=50 W, (b) P=80 W, (c) P=100 W, (d) P=110 W.
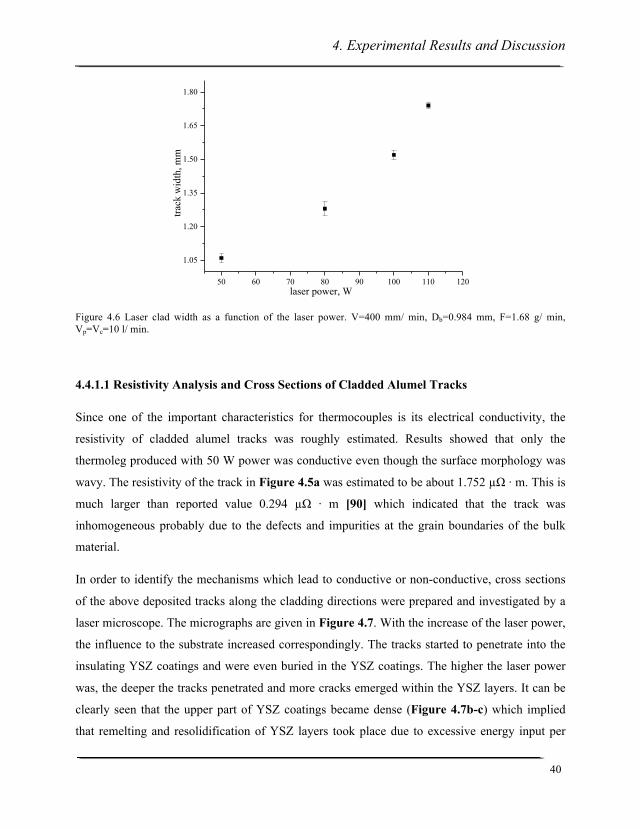
Figure 4.6 illustrates the behavior of the laser clad width as a function of the laser power. The
track width displayed a strong dependence on the laser power and increased with increasing the
laser power as a result of increased energy input per unit length. More particles were melted at
the border of the laser spot. The track widths were in the range of 1.0 mm to 1.7 mm, a
premature failure of TBCs would be caused because of intensive thermal expansion mismatch
between metallic thermocouples and ceramic YSZ layer.
ab c d
500 µm
4. Experimental Results and Discussion
40
Figure 4.6 Laser clad width as a function of the laser power. V=400 mm/ min, Db=0.984 mm, F=1.68 g/ min, Vp=Vc=10 l/ min.
4.4.1.1 Resistivity Analysis and Cross Sections of Cladded Alumel Tracks
Since one of the important characteristics for thermocouples is its electrical conductivity, the
resistivity of cladded alumel tracks was roughly estimated. Results showed that only the
thermoleg produced with 50 W power was conductive even though the surface morphology was
wavy. The resistivity of the track in Figure 4.5a was estimated to be about 1.752 µΩ · m. This is
much larger than reported value 0.294 µΩ · m [90] which indicated that the track was
inhomogeneous probably due to the defects and impurities at the grain boundaries of the bulk
material.
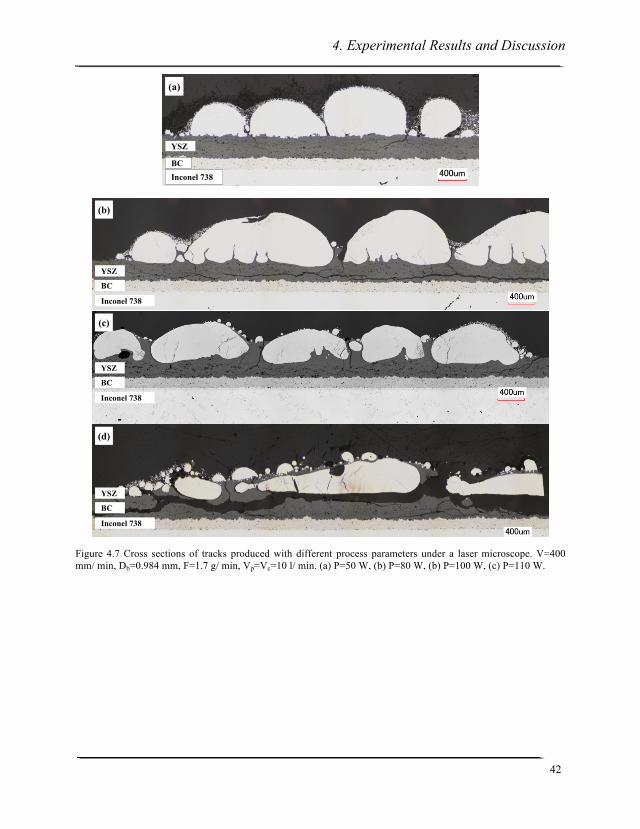
In order to identify the mechanisms which lead to conductive or non-conductive, cross sections
of the above deposited tracks along the cladding directions were prepared and investigated by a
laser microscope. The micrographs are given in Figure 4.7. With the increase of the laser power,
the influence to the substrate increased correspondingly. The tracks started to penetrate into the
insulating YSZ coatings and were even buried in the YSZ coatings. The higher the laser power
was, the deeper the tracks penetrated and more cracks emerged within the YSZ layers. It can be
clearly seen that the upper part of YSZ coatings became dense (Figure 4.7b-c) which implied
that remelting and resolidification of YSZ layers took place due to excessive energy input per
50 60 70 80 90 100 110 120
1.05
1.20
1.35
1.50
1.65
1.80
track
wid
th, m
m
laser power, W
4. Experimental Results and Discussion
41
unit length. This amount of energy was not only absorbed by the injected particles but also by the
substrate. The reason that the first track was conductive is the slight contact of the big beads. The
beads in Figure 4.7b-c were intermittently and the track in Figure 4.7c started to be buried by
the YSZ coating leading to these two tracks non-conductive. The last track in Figure 4.7d was
totally buried and discontinuous that made this track non-conductive. The dense YSZ layer was
transparent [91], so the deposited track in Figure 4.7d could still be recognized.
Figure 4.8 displays the depth of the HAZ plotted against the laser power. It can be seen that the
dimension of the HAZ was highly related to the input laser power. When given a low laser power
of 50 W, there was no obvious effect on the substrate. However, the HAZ was increased
dramatically when increasing the laser power and spread the entire ceramic layer when
increasing the laser power up to 110 W.
4. Experimental Results and Discussion
42
Figure 4.7 Cross sections of tracks produced with different process parameters under a laser microscope. V=400 mm/ min, Db=0.984 mm, F=1.7 g/ min, Vp=Vc=10 l/ min. (a) P=50 W, (b) P=80 W, (b) P=100 W, (c) P=110 W.
YSZ
BCInconel 738
(a)
(b)
Inconel 738
BC
YSZ
(c)
Inconel 738
BC
YSZ
(d)
Inconel 738
BC
YSZ
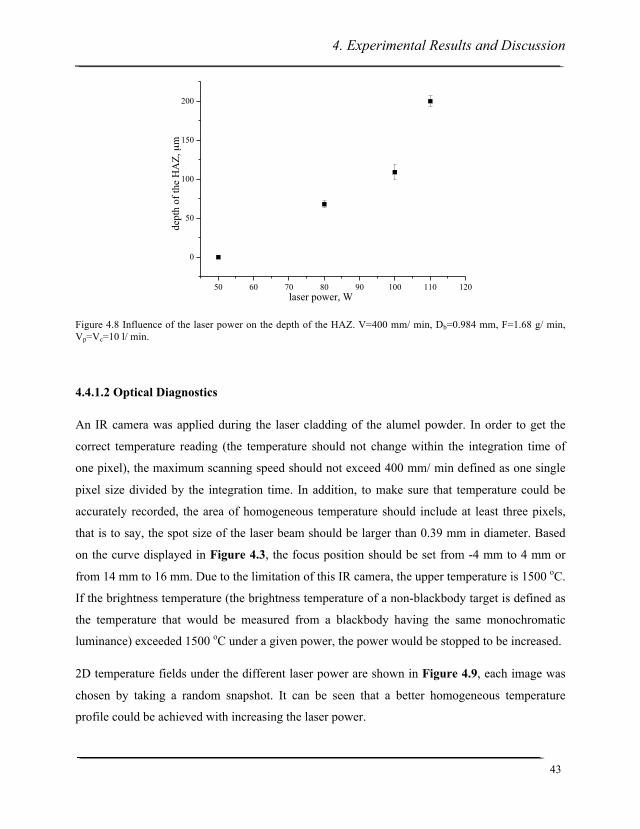
4. Experimental Results and Discussion
43
Figure 4.8 Influence of the laser power on the depth of the HAZ. V=400 mm/ min, Db=0.984 mm, F=1.68 g/ min, Vp=Vc=10 l/ min.
4.4.1.2 Optical Diagnostics
An IR camera was applied during the laser cladding of the alumel powder. In order to get the
correct temperature reading (the temperature should not change within the integration time of
one pixel), the maximum scanning speed should not exceed 400 mm/ min defined as one single
pixel size divided by the integration time. In addition, to make sure that temperature could be
accurately recorded, the area of homogeneous temperature should include at least three pixels,
that is to say, the spot size of the laser beam should be larger than 0.39 mm in diameter. Based
on the curve displayed in Figure 4.3, the focus position should be set from -4 mm to 4 mm or
from 14 mm to 16 mm. Due to the limitation of this IR camera, the upper temperature is 1500 oC.
If the brightness temperature (the brightness temperature of a non-blackbody target is defined as
the temperature that would be measured from a blackbody having the same monochromatic
luminance) exceeded 1500 oC under a given power, the power would be stopped to be increased.
2D temperature fields under the different laser power are shown in Figure 4.9, each image was
chosen by taking a random snapshot. It can be seen that a better homogeneous temperature
profile could be achieved with increasing the laser power.
50 60 70 80 90 100 110 120
0
50
100
150
200
dept
h of
the
HA
Z, µ
m
laser power, W

4. Experimental Results and Discussion
44
Figure 4.9 Two-dimensional temperature fields in coaxial laser cladding of alumel on substrate; V=400 mm/min, Db=0.984 mm, F=1.68 g/min, Vp=Vc=10 l/min, (a) P=50 W; (b) P=80 W; (c) P=100 W; (d) P=110 W.
In conclusion, critical defects like severe HAZ and cracks emerged after the first laser cladding
experiments which destroyed the original microstructures of the TBCs, thus, the life time
performance of TBCs would be degraded. Discontinuous clads were generated which need to be
avoided to ensure the electrical conductivity of the cladded tracks. Furthermore, tracks in small
dimensions are more suitable for the following embedding to create an in-situ temperature
monitoring system in TBCs. Therefore, homogeneous tracks with little impact to the substrate
and in small dimensions are desired to be deposited. It confirms that the application of IR camera
is one of the useful tools to optimize the cladding process parameters. However, higher travelling
speed than 400 mm/ min cannot be applied due to the limitation of this IR camera, the following
work was done without using it.
系列1
系列5250
350
450
550
650
750
1 2 3 4 5 6 7 8 9 1011 12 13 14 15 16 17 18 19 20 21 22
650-‐750
550-‐650
450-‐550
350-‐450
250-‐350
a b
系列1
系列60
200
400
600
800
1000
1200
1 3 5 7 9 11 13 15 17 19 21
1000-‐1200
800-‐1000
600-‐800
400-‐600
200-‐400
0-‐200
c
系列1
系列6
系列110
200400600800
1000
1200
1400
1 3 5 7 9 11 13 15 17 19 21
1200-‐1400
1000-‐1200
800-‐1000
600-‐800
400-‐600
200-‐400
0-‐200
d
系列1
系列6
系列110
500
1000
1500
2000
1 3 5 7 9 11 13 15 17 19 21
1500-‐2000
1000-‐1500
500-‐1000
0-‐500
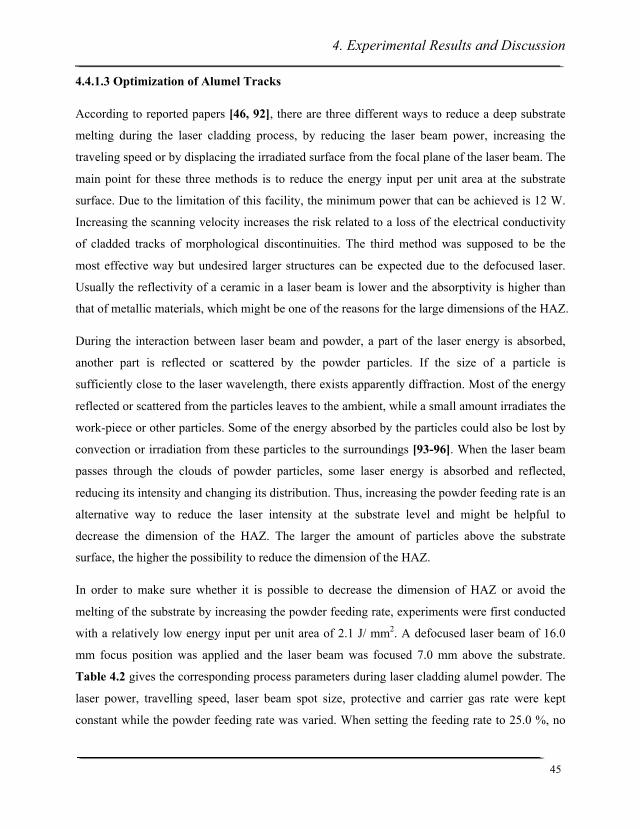
4. Experimental Results and Discussion
45
4.4.1.3 Optimization of Alumel Tracks
According to reported papers [46, 92], there are three different ways to reduce a deep substrate
melting during the laser cladding process, by reducing the laser beam power, increasing the
traveling speed or by displacing the irradiated surface from the focal plane of the laser beam. The
main point for these three methods is to reduce the energy input per unit area at the substrate
surface. Due to the limitation of this facility, the minimum power that can be achieved is 12 W.
Increasing the scanning velocity increases the risk related to a loss of the electrical conductivity
of cladded tracks of morphological discontinuities. The third method was supposed to be the
most effective way but undesired larger structures can be expected due to the defocused laser.
Usually the reflectivity of a ceramic in a laser beam is lower and the absorptivity is higher than
that of metallic materials, which might be one of the reasons for the large dimensions of the HAZ.
During the interaction between laser beam and powder, a part of the laser energy is absorbed,
another part is reflected or scattered by the powder particles. If the size of a particle is
sufficiently close to the laser wavelength, there exists apparently diffraction. Most of the energy
reflected or scattered from the particles leaves to the ambient, while a small amount irradiates the
work-piece or other particles. Some of the energy absorbed by the particles could also be lost by
convection or irradiation from these particles to the surroundings [93-96]. When the laser beam
passes through the clouds of powder particles, some laser energy is absorbed and reflected,
reducing its intensity and changing its distribution. Thus, increasing the powder feeding rate is an
alternative way to reduce the laser intensity at the substrate level and might be helpful to
decrease the dimension of the HAZ. The larger the amount of particles above the substrate
surface, the higher the possibility to reduce the dimension of the HAZ.
In order to make sure whether it is possible to decrease the dimension of HAZ or avoid the
melting of the substrate by increasing the powder feeding rate, experiments were first conducted
with a relatively low energy input per unit area of 2.1 J/ mm2. A defocused laser beam of 16.0
mm focus position was applied and the laser beam was focused 7.0 mm above the substrate.
Table 4.2 gives the corresponding process parameters during laser cladding alumel powder. The
laser power, travelling speed, laser beam spot size, protective and carrier gas rate were kept
constant while the powder feeding rate was varied. When setting the feeding rate to 25.0 %, no
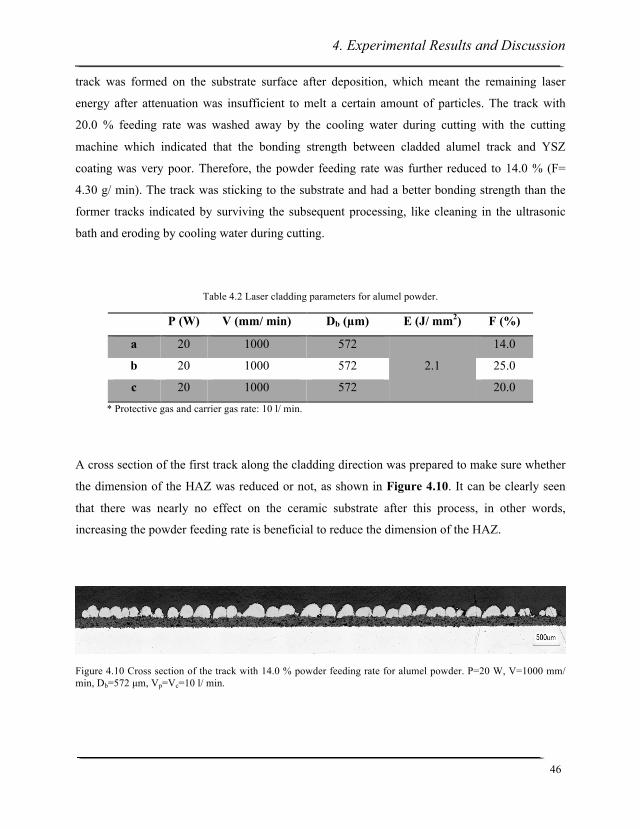
4. Experimental Results and Discussion
46
track was formed on the substrate surface after deposition, which meant the remaining laser
energy after attenuation was insufficient to melt a certain amount of particles. The track with
20.0 % feeding rate was washed away by the cooling water during cutting with the cutting
machine which indicated that the bonding strength between cladded alumel track and YSZ
coating was very poor. Therefore, the powder feeding rate was further reduced to 14.0 % (F=
4.30 g/ min). The track was sticking to the substrate and had a better bonding strength than the
former tracks indicated by surviving the subsequent processing, like cleaning in the ultrasonic
bath and eroding by cooling water during cutting.
Table 4.2 Laser cladding parameters for alumel powder.
P (W) V (mm/ min) Db (µm) E (J/ mm2) F (%)
a 20 1000 572
2.1
14.0
b 20 1000 572 25.0
c 20 1000 572 20.0
* Protective gas and carrier gas rate: 10 l/ min.
A cross section of the first track along the cladding direction was prepared to make sure whether
the dimension of the HAZ was reduced or not, as shown in Figure 4.10. It can be clearly seen
that there was nearly no effect on the ceramic substrate after this process, in other words,
increasing the powder feeding rate is beneficial to reduce the dimension of the HAZ.
Figure 4.10 Cross section of the track with 14.0 % powder feeding rate for alumel powder. P=20 W, V=1000 mm/ min, Db=572 µm, Vp=Vc=10 l/ min.
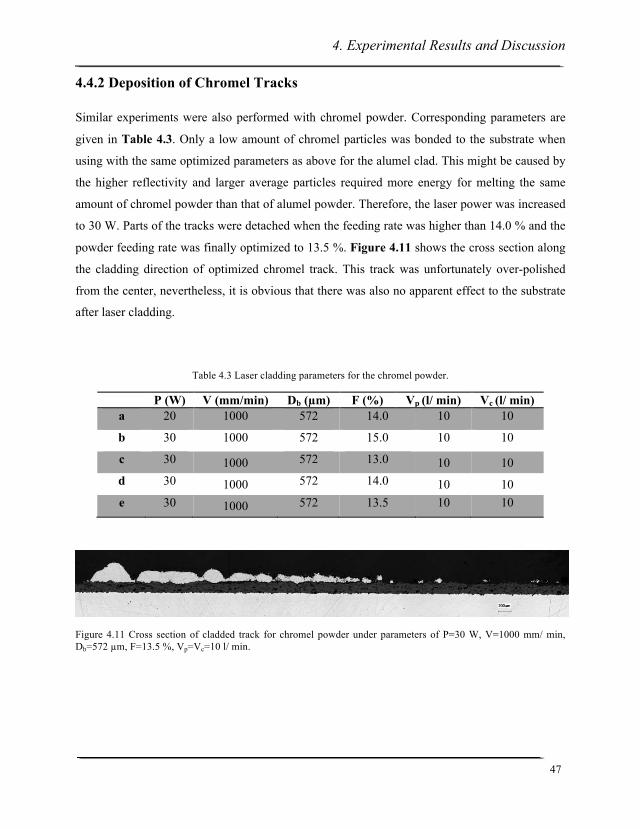
4. Experimental Results and Discussion
47
4.4.2 Deposition of Chromel Tracks
Similar experiments were also performed with chromel powder. Corresponding parameters are
given in Table 4.3. Only a low amount of chromel particles was bonded to the substrate when
using with the same optimized parameters as above for the alumel clad. This might be caused by
the higher reflectivity and larger average particles required more energy for melting the same
amount of chromel powder than that of alumel powder. Therefore, the laser power was increased
to 30 W. Parts of the tracks were detached when the feeding rate was higher than 14.0 % and the
powder feeding rate was finally optimized to 13.5 %. Figure 4.11 shows the cross section along
the cladding direction of optimized chromel track. This track was unfortunately over-polished
from the center, nevertheless, it is obvious that there was also no apparent effect to the substrate
after laser cladding.
Table 4.3 Laser cladding parameters for the chromel powder.
P (W) V (mm/min) Db (µm) F (%) Vp (l/ min) Vc (l/ min) a 20 1000 572 14.0 10 10
b 30 1000 572 15.0 10 10
c 30 1000 572 13.0 10 10 d 30 1000 572 14.0 10 10 e 30 1000 572 13.5 10 10
Figure 4.11 Cross section of cladded track for chromel powder under parameters of P=30 W, V=1000 mm/ min, Db=572 µm, F=13.5 %, Vp=Vc=10 l/ min.
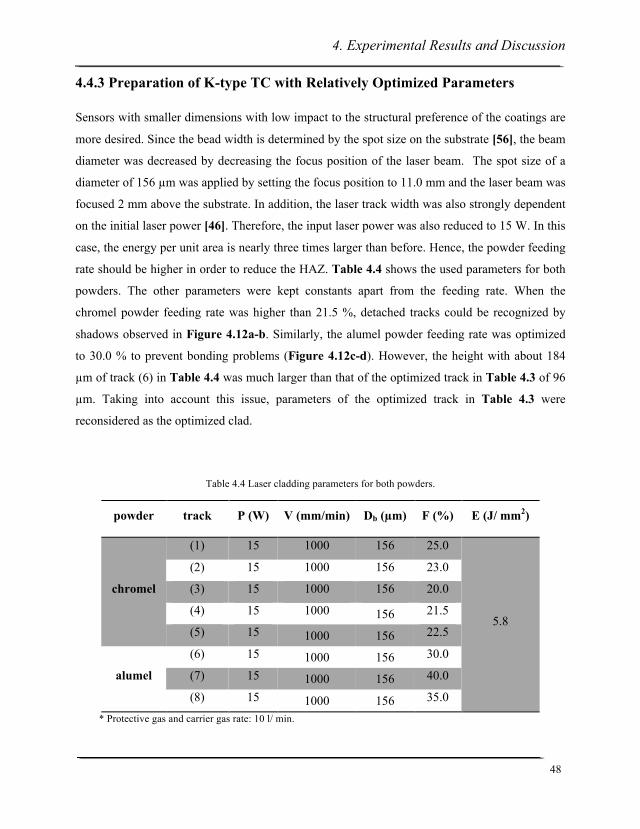
4. Experimental Results and Discussion
48
4.4.3 Preparation of K-type TC with Relatively Optimized Parameters
Sensors with smaller dimensions with low impact to the structural preference of the coatings are
more desired. Since the bead width is determined by the spot size on the substrate [56], the beam
diameter was decreased by decreasing the focus position of the laser beam. The spot size of a
diameter of 156 µm was applied by setting the focus position to 11.0 mm and the laser beam was
focused 2 mm above the substrate. In addition, the laser track width was also strongly dependent
on the initial laser power [46]. Therefore, the input laser power was also reduced to 15 W. In this
case, the energy per unit area is nearly three times larger than before. Hence, the powder feeding
rate should be higher in order to reduce the HAZ. Table 4.4 shows the used parameters for both
powders. The other parameters were kept constants apart from the feeding rate. When the
chromel powder feeding rate was higher than 21.5 %, detached tracks could be recognized by
shadows observed in Figure 4.12a-b. Similarly, the alumel powder feeding rate was optimized
to 30.0 % to prevent bonding problems (Figure 4.12c-d). However, the height with about 184
µm of track (6) in Table 4.4 was much larger than that of the optimized track in Table 4.3 of 96
µm. Taking into account this issue, parameters of the optimized track in Table 4.3 were
reconsidered as the optimized clad.
Table 4.4 Laser cladding parameters for both powders.
powder track P (W) V (mm/min) Db (µm) F (%) E (J/ mm2)
chromel
(1) 15 1000 156 25.0
5.8
(2) 15 1000 156 23.0
(3) 15 1000 156 20.0
(4) 15 1000 156 21.5
(5) 15 1000 156 22.5
alumel
(6) 15 1000 156 30.0
(7) 15 1000 156 40.0
(8) 15 1000 156 35.0
* Protective gas and carrier gas rate: 10 l/ min.
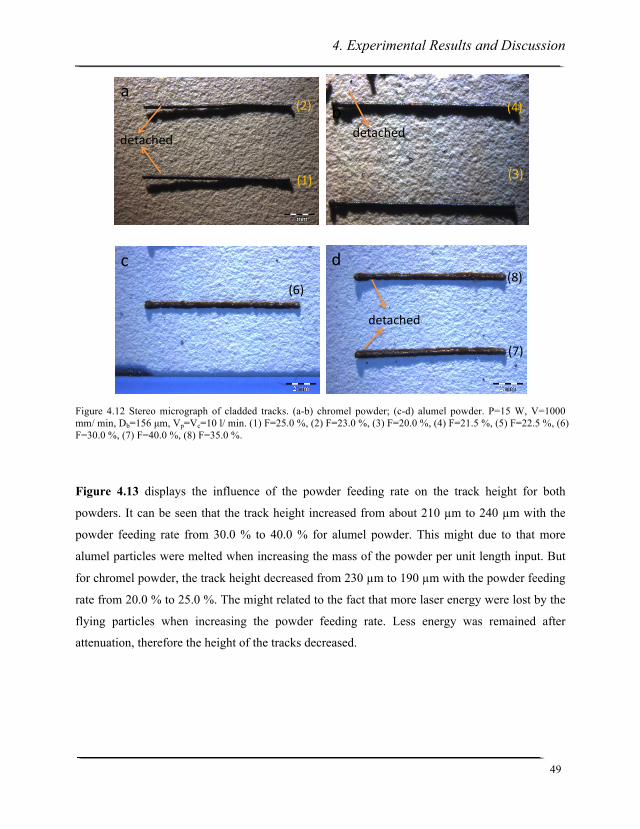
4. Experimental Results and Discussion
49
Figure 4.12 Stereo micrograph of cladded tracks. (a-b) chromel powder; (c-d) alumel powder. P=15 W, V=1000 mm/ min, Db=156 µm, Vp=Vc=10 l/ min. (1) F=25.0 %, (2) F=23.0 %, (3) F=20.0 %, (4) F=21.5 %, (5) F=22.5 %, (6) F=30.0 %, (7) F=40.0 %, (8) F=35.0 %.
Figure 4.13 displays the influence of the powder feeding rate on the track height for both
powders. It can be seen that the track height increased from about 210 µm to 240 µm with the
powder feeding rate from 30.0 % to 40.0 % for alumel powder. This might due to that more
alumel particles were melted when increasing the mass of the powder per unit length input. But
for chromel powder, the track height decreased from 230 µm to 190 µm with the powder feeding
rate from 20.0 % to 25.0 %. The might related to the fact that more laser energy were lost by the
flying particles when increasing the powder feeding rate. Less energy was remained after
attenuation, therefore the height of the tracks decreased.
a
(1)
(2)
detached
b
(3)
(4)
detached
c(6)
d(8)
(7)
detached

4. Experimental Results and Discussion
50
Figure 4.13 Influence of the powder feeding rate on the height of the tracks. P=15 W, V=1000 mm/ min, Db=156 µm, Vp=Vc=10 l/ min. (a) alumel and (b) chromel.
The above two optimized thermolegs (alumel: P=20 W, V=1000 mm/ min, Db=572 µm,
F=14.0 %, Vp=Vc=10 l/ min; chromel: P=15 W, V=1000 mm/ min, Db=156 µm, F=22.5 %,
Vp=Vc=10 l/ min) were analyzed by the Cyberscan topographer in Figure 4.14. The surface
morphology of alumel was not even what might be related to the poor wetting of the powder
particles. Unlike the cladded alumel track, a chromel track with very homogeneous morphology
was gained. Good wetting behavior was supposed to be the reason due to the chromium. During
the process, chromium has the tendency to segregate at the interface and form Cr-O clusters,
which are beneficial for the improvement of the wetting behavior [97]. Besides, it can be seen
from the cross-sectional microstructure in Figure 4.15 that no additional influence on the
substrate was visible.
30 32 34 36 38 40
210
215
220
225
230
235
240tra
ck h
eigh
t, µm
powder feeding rate, %
(a)
20 21 22 23 24 25190
200
210
220
230
track
hei
ght, µm
powder feeding rate, %
(b)
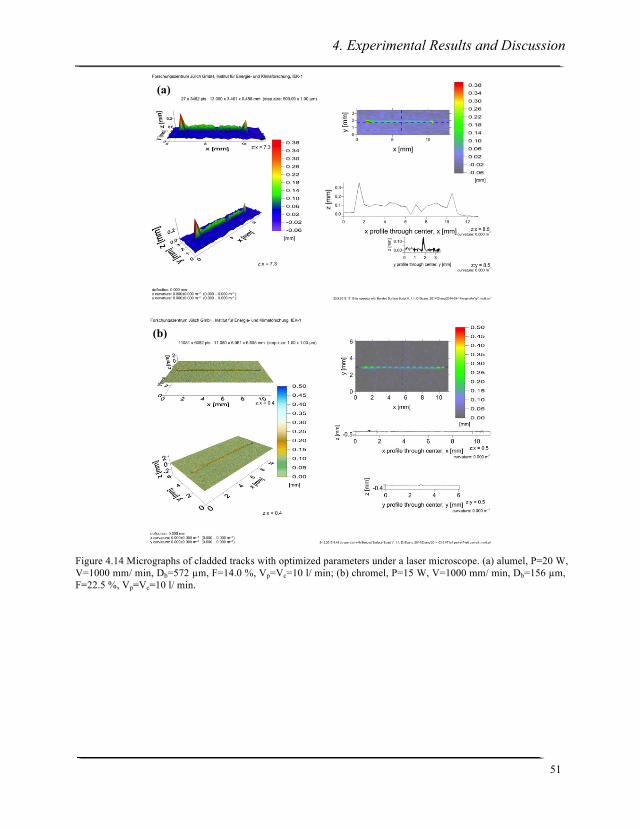
4. Experimental Results and Discussion
51
Figure 4.14 Micrographs of cladded tracks with optimized parameters under a laser microscope. (a) alumel, P=20 W, V=1000 mm/ min, Db=572 µm, F=14.0 %, Vp=Vc=10 l/ min; (b) chromel, P=15 W, V=1000 mm/ min, Db=156 µm, F=22.5 %, Vp=Vc=10 l/ min.
(a)
(b)
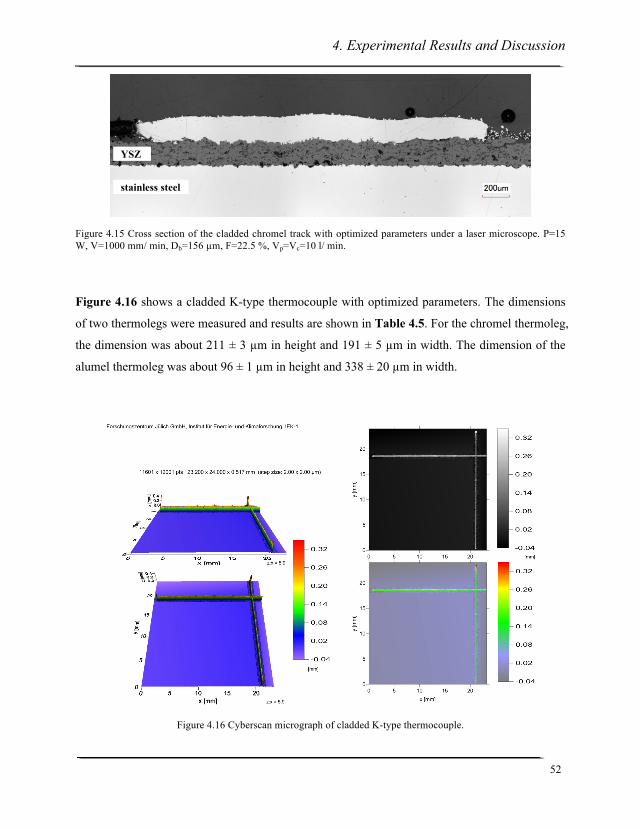
4. Experimental Results and Discussion
52
Figure 4.15 Cross section of the cladded chromel track with optimized parameters under a laser microscope. P=15 W, V=1000 mm/ min, Db=156 µm, F=22.5 %, Vp=Vc=10 l/ min.
Figure 4.16 shows a cladded K-type thermocouple with optimized parameters. The dimensions
of two thermolegs were measured and results are shown in Table 4.5. For the chromel thermoleg,
the dimension was about 211 ± 3 µm in height and 191 ± 5 µm in width. The dimension of the
alumel thermoleg was about 96 ± 1 µm in height and 338 ± 20 µm in width.
Figure 4.16 Cyberscan micrograph of cladded K-type thermocouple.
YSZ
stainless steel
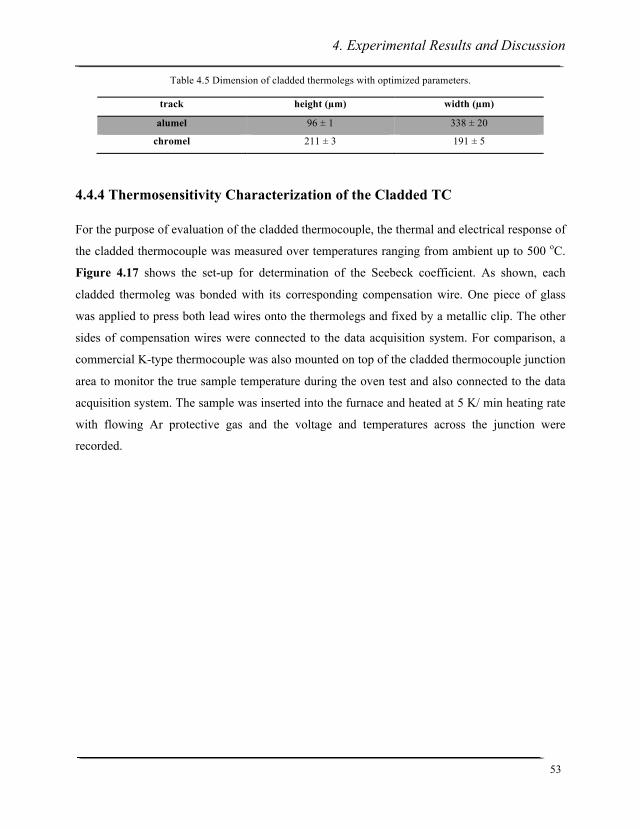
4. Experimental Results and Discussion
53
Table 4.5 Dimension of cladded thermolegs with optimized parameters.
track height (µm) width (µm)
alumel 96 ± 1 338 ± 20
chromel 211 ± 3 191 ± 5
4.4.4 Thermosensitivity Characterization of the Cladded TC
For the purpose of evaluation of the cladded thermocouple, the thermal and electrical response of
the cladded thermocouple was measured over temperatures ranging from ambient up to 500 oC.
Figure 4.17 shows the set-up for determination of the Seebeck coefficient. As shown, each
cladded thermoleg was bonded with its corresponding compensation wire. One piece of glass
was applied to press both lead wires onto the thermolegs and fixed by a metallic clip. The other
sides of compensation wires were connected to the data acquisition system. For comparison, a
commercial K-type thermocouple was also mounted on top of the cladded thermocouple junction
area to monitor the true sample temperature during the oven test and also connected to the data
acquisition system. The sample was inserted into the furnace and heated at 5 K/ min heating rate
with flowing Ar protective gas and the voltage and temperatures across the junction were
recorded.

4. Experimental Results and Discussion
54
The thermocouple voltage versus temperature data is shown in Figure 4.18. The blue curve and
the black curve correspond to the temperature signal of the reference TC and cladded TC,
respectively. The lack of data above 480 oC is due to the bad connection between cladded
thermolegs and lead wires, at the elevated temperature where the metallic clip failed and the
signals could not be recorded any more. Results indicated that the cladded thermocouple had a
nearly linear relationship between thermoelectric output voltage and temperature at the
experimental temperature range. Its Seebeck coefficient is estimated as 40.9 µV/ K with a
regression factor of 0.9996 by a linear fit. A commercial K-type thermocouple typically has a
sensitivity of 41.1 µV/ K [98]. So the measured values by the cladded thermocouple were quite
reliable and it implied that the cladded thermocouple worked very well as a thermocouple. The
difference of the intercept values between the theoretical data of the commercial thermocouple
and that of the cladded thermocouple is due to delayed temperature equilibrium during the
heating period due to a naturally limited heat transfer/ conduction because the heat element of
the furnace was indirect contact to the specimen.
NiAl
NiCr
data collection system
overlap+
-‐
junction
Figure 4.17 Schematic of the set-up for collecting temperature signals.
4. Experimental Results and Discussion
55
Figure 4.18 K-type thermocouple response from ambient to 500 oC.
4.4.5 Characterization of the Cladded TC Sensor
The electrical resistance of both tracks was examined by a self-assembled DC Four Probe Tester.
A value of about 0.03 ± 0.0004 Ω was measured when the track length was about 2.3 ± 0.05 mm
for the alumel track and 0.08 ± 0.004 Ω when the track length was about 3.6 ± 0.03 mm for the
chromel track. The cross-sectional area was estimated from the profile of a Cyberscan
topographer to be about 0.0506 mm2 for alumel and 0.0377 mm2 for chromel. Thus, the
resistivity for both thermolegs could be calculated and are given in Table 4.6. It can be seen that
the calculated values are larger than the reported values [90]. In particular for the alumel track,
the resistivity is two times bigger than its nominal value. This may be due to the easy oxidation
of aluminum which can be found especially at the grain boundaries of alumel. The alumina scale
formed during the process is non-conductive and can block the electrical current, so the electrical
resistivity is higher than the commercial value. The chromium oxide scale in the chromel tracks
is conductive and probably this is why there is no big difference to the reported value.
0 100 200 300 400 5000
5
10
15
20
40.9 µV/ K
Laser cladded type K thermocouple Commercial type K thermocouple Linear fit of cladded type K thermocouple
Out
put v
olta
ge, m
V
Temperature from commercial TC, oC
4. Experimental Results and Discussion
56
Table 4.6 Experimental and nominal resistivity of the thermocouple materials.
resistivity (µΩ·m)
alumel chromel
experiment 0.638 0.776
reported [94] 0.29-0.33 0.706
4.4.6 Embedding of Cladded Type-K TC
Before embedding of thermocouples, the embedding of individual tracks has been tried. In order
to evaluate the statistical scatter of the results, several tracks under the same parameters were
prepared onto the surface of YSZ-based substrate and embedded into YSZ coatings with
standard spraying parameters. Contact areas of the tracks were kept accessible by applying a
metallic mask (Figure 4.19a) in front of the substrate during spraying. Figure 4.19b-c shows
embedded alumel and chromel tracks, the thickness of top YSZ layer is about 200 µm. Table 4.7
presents the detailed cladding parameters for both powders. The results represent that 80% of the
alumel tracks and 100% of the chromel tracks kept their electrical conductivity after embedding
with a second ceramic layer. This means it is possible to embed these cladded thermolegs under
the above parameters within functional TBCs.
4. Experimental Results and Discussion
57
Figure 4.19 The mask used during spraying (a); negative (b) and positive (c) conductor of type K thermocouple with YSZ overcoated.
Table 4.7 Laser cladding parameters for the type K thermocouple deposition.
P (W) V (mm/min) Db (µm) F (%) Vp (l/ min) Vc (l/ min)
alumel 15 1000 156 30.0 10 10
chromel 15 1000 156 22.5 10 10
Laser cladded K-type thermocouples consisting of Ni2Al2Mn1Si and Ni10Cr were fabricated in
the shape of a cross by cladding conductor tracks of alumel and chromel on top of a 30 mm × 40
mm × 3.5 mm aluminum substrate that had been previously coated with 200 µm of APS sprayed
(a)
(b) (c)
4. Experimental Results and Discussion
58
TBC (8YSZ). Figure 4.20 gives a top view of a bared laser cladded thermocouple (left) as well
as a thermocouple that has been overcoated with YSZ coatings (right) of 50 µm thickness to
demonstrate the ability to embed such sensors underneath functional coatings. The topographies
of the coatings were analyzed under the Cyberscan topographer. It is worth mentioning that the
scanning area was only the area where tracks were deposited. The scales on the right side reveal
the height information of the layers. The dimensions were measured which were 184 ± 5 µm in
height and 305 ± 2 µm in width for alumel and 211 ± 3 µm in height and 191 ± 5 µm in width for
chromel, respectively. The average roughness was also measured for the cladded alumel which
was 10 ± 2 µm and for the chromel was 9 ± 2 µm.
Figure 4.20 Cyberscan micrograph of the cladded K-type thermocouple before (left) and after embedding (right).
Hereafter, the cladded thermocouple was embedded with a YSZ layer of increasing thickness as
shown in Figure 4.21a-c to investigate whether this thermocouple would lose its electrical
conductivity or not. A steel sheet (Figure 4.21d) was applied as a mask when spraying the
second layer leaving two bared tips for the junction. The cladded thermocouple kept its
conductive property after spraying ~200 µm thick YSZ coatings.
0
100
200
300
400
µmmm
0.5
-0.5
-0.25
0
0.25

4. Experimental Results and Discussion
59
Figure 4.21 The embedded type K thermocouple by YSZ coatings with different thickness: (a) ~50 µm; (b) ~100 µm; (c) ~200 µm. (d) mask.
For the evaluation of the cladded thermocouple before and after embedding with a second
ceramic layer, the thermal and electrical response was measured over temperature ranging from
ambient up to 450 oC, and the results were compared with an industrial standard K-type
thermocouple. Figure 4.22 shows a photo and a set-up for the measurement. The sample was put
into the furnace with 5 K/ min heating rate under argon protective gas atmosphere that could be
able to reduce the oxidation of the produced thermocouple. The voltage and temperatures across
the junction were recorded.
-‐
+
2nd YSZ layer
1st YSZ layer
(a) (b)
-‐
+
2nd YSZ layer
1st YSZ layer
+
-‐2nd YSZ layer
1st YSZ layer
(c) (d)
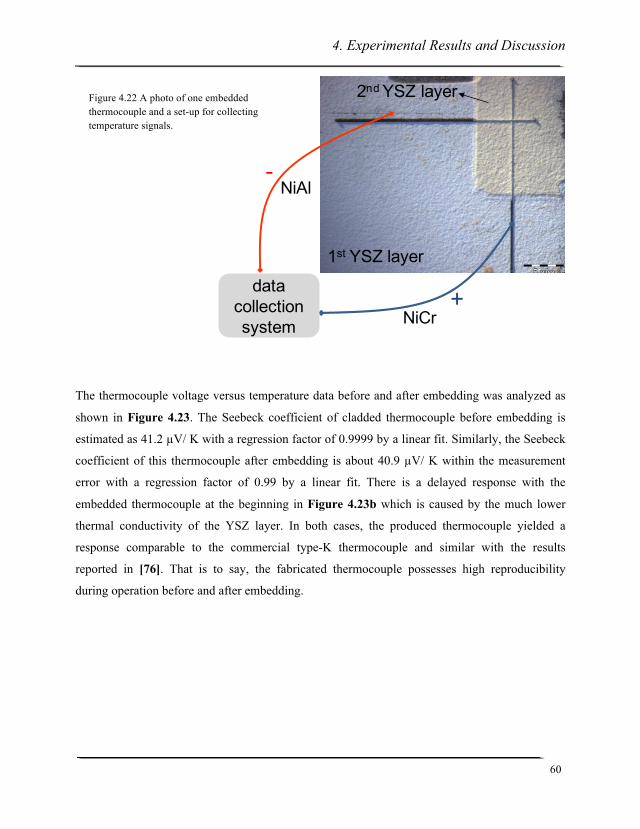
4. Experimental Results and Discussion
60
The thermocouple voltage versus temperature data before and after embedding was analyzed as
shown in Figure 4.23. The Seebeck coefficient of cladded thermocouple before embedding is
estimated as 41.2 µV/ K with a regression factor of 0.9999 by a linear fit. Similarly, the Seebeck
coefficient of this thermocouple after embedding is about 40.9 µV/ K within the measurement
error with a regression factor of 0.99 by a linear fit. There is a delayed response with the
embedded thermocouple at the beginning in Figure 4.23b which is caused by the much lower
thermal conductivity of the YSZ layer. In both cases, the produced thermocouple yielded a
response comparable to the commercial type-K thermocouple and similar with the results
reported in [76]. That is to say, the fabricated thermocouple possesses high reproducibility
during operation before and after embedding.
2nd YSZ layer
1st YSZ layer
+
-‐
data collection system
NiAl
NiCr
Figure 4.22 A photo of one embedded thermocouple and a set-up for collecting temperature signals.
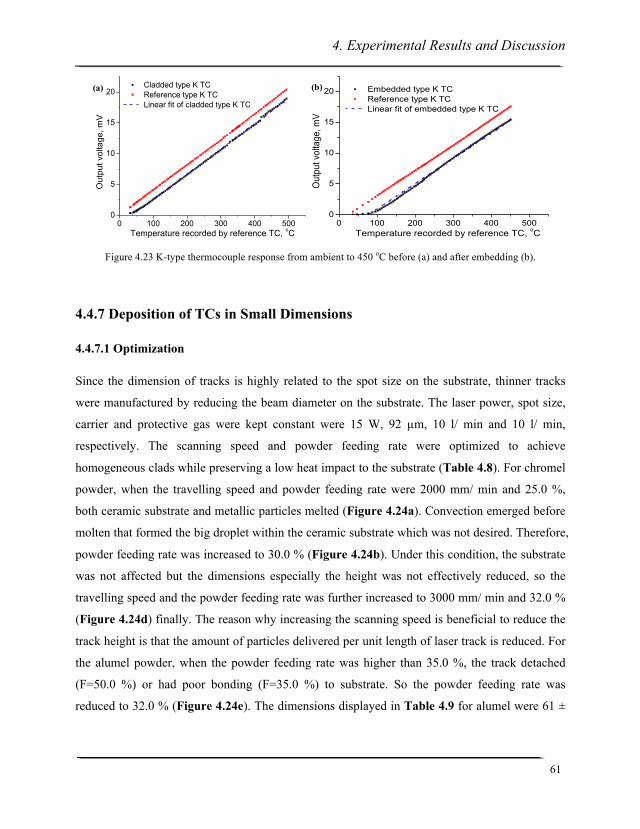
4. Experimental Results and Discussion
61
Figure 4.23 K-type thermocouple response from ambient to 450 oC before (a) and after embedding (b).
4.4.7 Deposition of TCs in Small Dimensions
4.4.7.1 Optimization
Since the dimension of tracks is highly related to the spot size on the substrate, thinner tracks
were manufactured by reducing the beam diameter on the substrate. The laser power, spot size,
carrier and protective gas were kept constant were 15 W, 92 µm, 10 l/ min and 10 l/ min,
respectively. The scanning speed and powder feeding rate were optimized to achieve
homogeneous clads while preserving a low heat impact to the substrate (Table 4.8). For chromel
powder, when the travelling speed and powder feeding rate were 2000 mm/ min and 25.0 %,
both ceramic substrate and metallic particles melted (Figure 4.24a). Convection emerged before
molten that formed the big droplet within the ceramic substrate which was not desired. Therefore,
powder feeding rate was increased to 30.0 % (Figure 4.24b). Under this condition, the substrate
was not affected but the dimensions especially the height was not effectively reduced, so the
travelling speed and the powder feeding rate was further increased to 3000 mm/ min and 32.0 %
(Figure 4.24d) finally. The reason why increasing the scanning speed is beneficial to reduce the
track height is that the amount of particles delivered per unit length of laser track is reduced. For
the alumel powder, when the powder feeding rate was higher than 35.0 %, the track detached
(F=50.0 %) or had poor bonding (F=35.0 %) to substrate. So the powder feeding rate was
reduced to 32.0 % (Figure 4.24e). The dimensions displayed in Table 4.9 for alumel were 61 ±
0 100 200 300 400 5000
5
10
15
20 Cladded type K TC Reference type K TC Linear fit of cladded type K TC
Out
put v
olta
ge, m
V
Temperature recorded by reference TC, oC
(a)
0 100 200 300 400 5000
5
10
15
20
Out
put v
olta
ge, m
V
Temperature recorded by reference TC, oC
Embedded type K TC Reference type K TC Linear fit of embedded type K TC
(b)
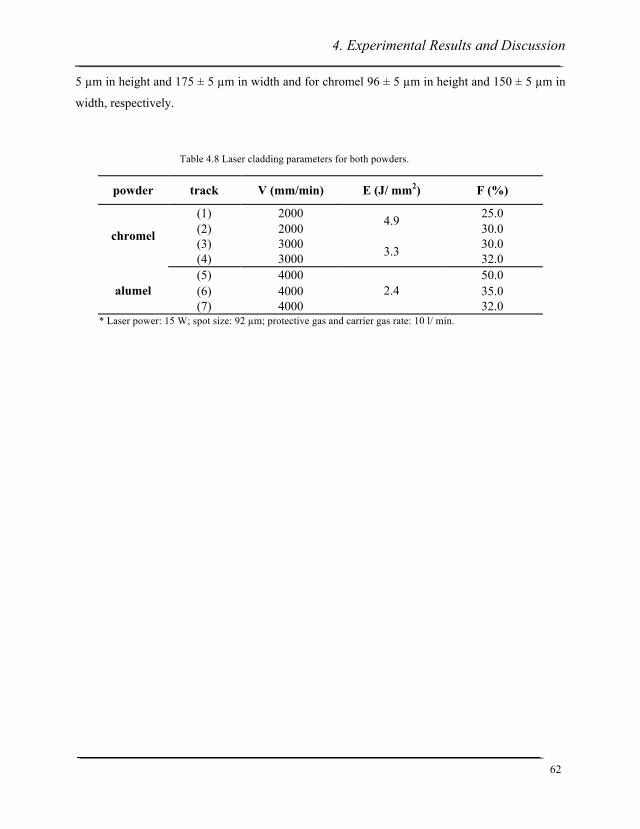
4. Experimental Results and Discussion
62
5 µm in height and 175 ± 5 µm in width and for chromel 96 ± 5 µm in height and 150 ± 5 µm in
width, respectively.
Table 4.8 Laser cladding parameters for both powders.
powder track V (mm/min) E (J/ mm2) F (%)
chromel
(1) 2000 4.9 25.0 (2) 2000 30.0 (3) 3000 3.3 30.0 (4) 3000 32.0
alumel (5) 4000
2.4 50.0
(6) 4000 35.0 (7) 4000 32.0
* Laser power: 15 W; spot size: 92 µm; protective gas and carrier gas rate: 10 l/ min.
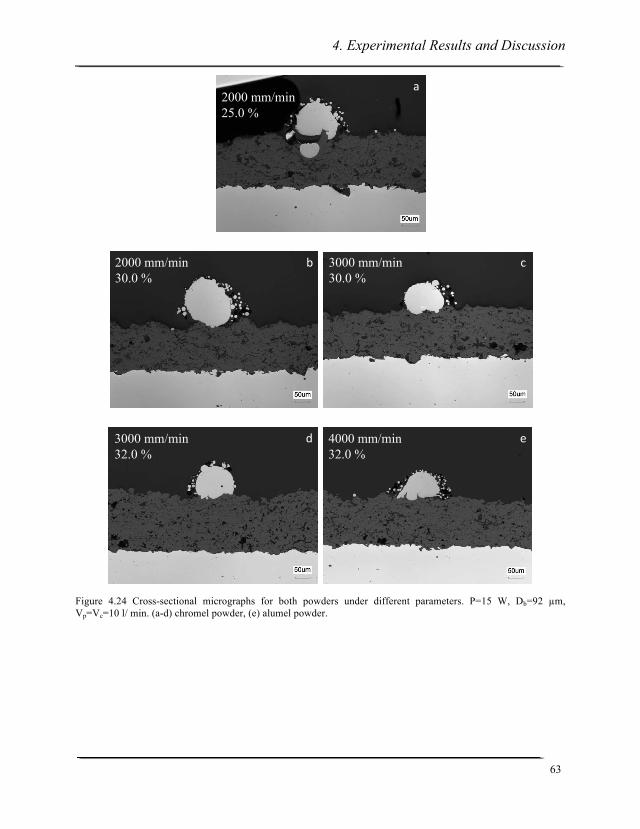
4. Experimental Results and Discussion
63
Figure 4.24 Cross-sectional micrographs for both powders under different parameters. P=15 W, Db=92 µm, Vp=Vc=10 l/ min. (a-d) chromel powder, (e) alumel powder.
2000 mm/min25.0 %
a
2000 mm/min30.0 %
b 3000 mm/min30.0 %
c
3000 mm/min32.0 %
d 4000 mm/min32.0 %
e
4. Experimental Results and Discussion
64
Table 4.9 Dimension of cladded thermolegs with optimized parameters.
track height (µm) width (µm)
alumel 61 ± 5 175 ± 5
chromel 96 ± 5 150 ± 5
Figure 4.25 shows the influence of the powder feeding rate and the travelling speed to the height
of the cladded tracks. The track height was increased from about 115 µm to 170 µm by
increasing the powder feeding rate from 25.0 % to 30.0 % and decreased by increasing the
travelling speed from 2000 mm/ min to 3000 mm/ min. As mentioned before, the input powder
mass per unit length was increased by increasing the powder feeding rate. More particles could
be melted if the laser input energy is sufficient. And the input powder mass per unit length was
decreased by increasing the travelling speed.
Figure 4.25 Influence of the powder feeding rate (a) and the travelling speed (b) on the height of the chromel tracks by fixing the spot size. P=15 W, Db=92 µm, Vp=Vc=10 l/ min.
4.4.7.2 Depositing and Embedding K-type TC
K-type thermocouple were cladded in a crosswise geometry with the above optimized parameters
(alumel: P=15 W, V=4000 mm/ min, Db=92 µm, F=32.0 %, Vp=Vc=10 l/ min; chromel: P=15 W,
V=3000 mm/ min, Db=92 µm, F=32.0 %, Vp=Vc=10 l/ min) as shown in Figure 4.26a.
25 26 27 28 29 30 31
110
120
130
140
150
160
170
180
track
hei
ght, µm
powder feeding rate, %
(a)
2000 2200 2400 2600 2800 3000
100
120
140
160
180
track
hei
ght, µm
travelling speed, mm/ min
(b)
4. Experimental Results and Discussion
65
Afterwards, it was embedded by a second ceramic layer with a thickness of about 200 µm
(Figure 4.26b). A steel sheet was used as a mask when spraying the second layer leaving two
bared tips for the junction. However, after spraying the second layer, the cladded thermocouple
did not work due to a non-sufficient electrical conductivity. In order to find out the reason for
this, cross sections of embedded specimen were prepared. Figure 4.27a shows deposited alumel
along the cladding direction and Figure 4.27b shows deposited chromel perpendicular to the
cladding direction. Holes indicating removed alumel particles happened during metallographic
preparation can be observed at the interface between cladded alumel and ceramic substrate after
embedding the second layer. It implied that the mechanical bonding strength between were very
poor when compared to the metallurgical adhesion. From this point of view, more stable tracks
need to be produced and better balance between good bonding and little HAZ should be figured
out.
4. Experimental Results and Discussion
66
Figure 4.26 Cladded thermocouple (a) before embedding (b) after embedding.
Figure 4.27 Cross sections of embedded thermolegs. (a) alumel along cladding direction, (b) chromel perpendicular to cladding direction.
4. Experimental Results and Discussion
67
In conclusion, increasing the powder feeding rate is an effective method to avoid melting of
ceramic substrate because of the attenuation of laser beam energy by particle clouds above the
substrate. Laser cladding parameters were optimized and a cladded thermocouple with desired
properties like no impact to the substrate, relatively small dimensions, and good electrical and
thermal response was possible to be deposited. A thinner thermocouple with optimized
parameters was also produced, however, the first attempt to embed it failed. Poor mechanical
bonding and alumel clad quality might be the main reason leading to this problem. Therefore, a
balance of mechanical bonding and minimal disturbance to the substrate needs to be adjusted
according to the dimensions of the tracks and the substrate roughness.
4.5 Deposition of K-type TC with a Pulsed Laser
4.5.1 Optimization of Alumel Tracks
As a result of the bad wetting behavior of NiAl (alumel) powder on the YSZ ceramic substrate,
inhomogeneous tracks with large droplets were formed with the continuous wave laser cladding
process. As a result, the following embedding with a second ceramic layer was more difficult
and complicated. The dimension of the HAZ was effectively diminished by increasing the
powder feeding rate to increase the reflection of the laser beam by the metallic powder and the
shadowing effect. Contrary to the continuous wave laser cladding, the pulsed laser cladding
offers a number of advantages [99]: lower heat build-up in the workpiece and therefore lower
HAZ and dilution. Meanwhile, the laser power-off period between two pulses allows the melt
pool to cool down, therefore, the melts duration is shorter in pulsed laser cladding than in
continuous wave laser cladding. This might be helpful to avoid the formation of large droplets.
Taking into consideration these issues, pulsed laser was applied to deposit tracks.
In order to optimize the process parameters, a number of tracks were deposited at different
parameters. The detailed cladding parameters are given in Table 4.10. The experiments for
alumel powder were performed with fixed spot size on the ceramic surface, powder feeding rate,
pulse duration, frequency, protective and carrier gas rate which were 92 µm, 30.0 %, 0.5 ms, 250
Hz, 10 l/ min and 10 l/ min, respectively. As mentioned before, the dimension of the HAZ could
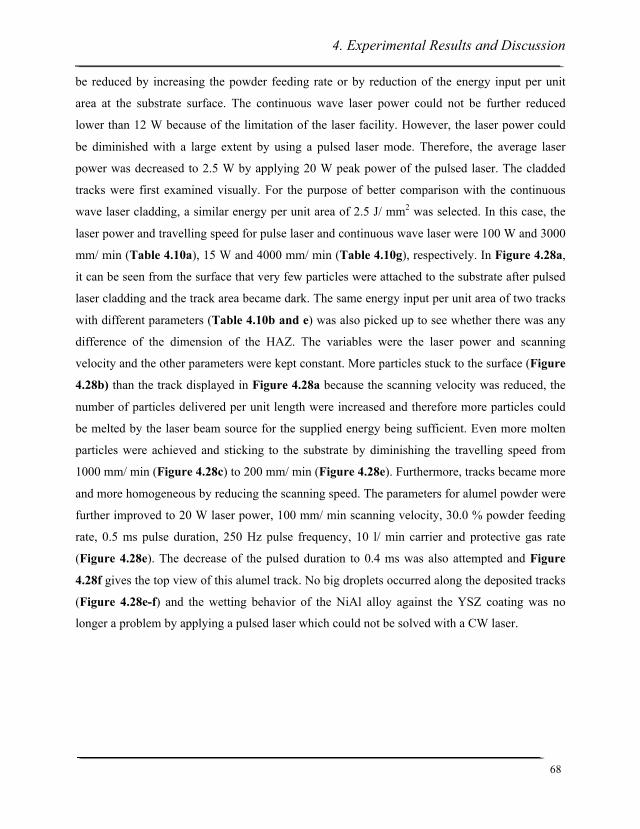
4. Experimental Results and Discussion
68
be reduced by increasing the powder feeding rate or by reduction of the energy input per unit
area at the substrate surface. The continuous wave laser power could not be further reduced
lower than 12 W because of the limitation of the laser facility. However, the laser power could
be diminished with a large extent by using a pulsed laser mode. Therefore, the average laser
power was decreased to 2.5 W by applying 20 W peak power of the pulsed laser. The cladded
tracks were first examined visually. For the purpose of better comparison with the continuous
wave laser cladding, a similar energy per unit area of 2.5 J/ mm2 was selected. In this case, the
laser power and travelling speed for pulse laser and continuous wave laser were 100 W and 3000
mm/ min (Table 4.10a), 15 W and 4000 mm/ min (Table 4.10g), respectively. In Figure 4.28a,
it can be seen from the surface that very few particles were attached to the substrate after pulsed
laser cladding and the track area became dark. The same energy input per unit area of two tracks
with different parameters (Table 4.10b and e) was also picked up to see whether there was any
difference of the dimension of the HAZ. The variables were the laser power and scanning
velocity and the other parameters were kept constant. More particles stuck to the surface (Figure
4.28b) than the track displayed in Figure 4.28a because the scanning velocity was reduced, the
number of particles delivered per unit length were increased and therefore more particles could
be melted by the laser beam source for the supplied energy being sufficient. Even more molten
particles were achieved and sticking to the substrate by diminishing the travelling speed from
1000 mm/ min (Figure 4.28c) to 200 mm/ min (Figure 4.28e). Furthermore, tracks became more
and more homogeneous by reducing the scanning speed. The parameters for alumel powder were
further improved to 20 W laser power, 100 mm/ min scanning velocity, 30.0 % powder feeding
rate, 0.5 ms pulse duration, 250 Hz pulse frequency, 10 l/ min carrier and protective gas rate
(Figure 4.28e). The decrease of the pulsed duration to 0.4 ms was also attempted and Figure
4.28f gives the top view of this alumel track. No big droplets occurred along the deposited tracks
(Figure 4.28e-f) and the wetting behavior of the NiAl alloy against the YSZ coating was no
longer a problem by applying a pulsed laser which could not be solved with a CW laser.
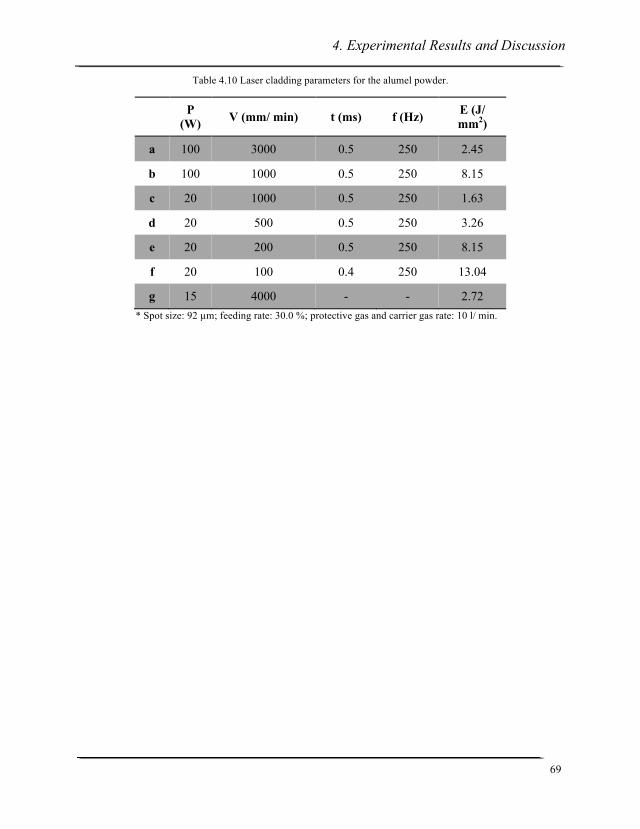
4. Experimental Results and Discussion
69
Table 4.10 Laser cladding parameters for the alumel powder.
P (W) V (mm/ min) t (ms) f (Hz) E (J/
mm2)
a 100 3000 0.5 250 2.45
b 100 1000 0.5 250 8.15
c 20 1000 0.5 250 1.63
d 20 500 0.5 250 3.26
e 20 200 0.5 250 8.15
f 20 100 0.4 250 13.04
g 15 4000 - - 2.72 * Spot size: 92 µm; feeding rate: 30.0 %; protective gas and carrier gas rate: 10 l/ min.

4. Experimental Results and Discussion
70
Figure 4.28 Stereo micrographs of cladded tracks for alumel powder. Db=92 µm, F=30.0 %, f=250 Hz, Vp=Vc=10 l/ min. (a) P=100 W, V=3000 mm/ min, t=0.5 ms; (b) P=100 W, V=1000 mm/ min, t=0.5 ms; (c) P=20 W, V=1000 mm/ min, t=0.5 ms; (d) P=20 W, V=500 mm/ min, t=0.5 ms; (e) P=20 W, V=200 mm/ min, t=0.5 ms ; (f) P=20 W, V=100 mm/ min, t=0.4 ms.
a b
c d
e f
4. Experimental Results and Discussion
71
Figure 4.29 shows the cross sections of some cladded tracks perpendicular to the cladding
directions. Even though similar energy per unit area was applied for both pulsed and CW laser
cladding, the dimensions of the HAZ were completely different (Figure 4.29a and e). The HAZ
for pulsed laser cladding was much more severe and affected the entire YSZ coatings underneath
the clad (Figure 4.29a). However, little effect to the YSZ coating was observed in Figure 4.29e.
Therefore, it can be concluded that under similar energy per unit area, a higher peak power leads
to a larger HAZ. The dimension of the HAZ in Figure 4.29b was more serious than that in
Figure 4.29a and more particles were penetrated into the ceramic coating which maybe induced
by the higher energy input per unit length. Likewise, with the same energy per unit area but
different peak power (Figure 4.29b-c), the HAZ was also quite different. When the laser peak
power was decreased to 20 W, there was little influence to the YSZ substrate due to the laser
cladding as can be seen in Figure 4.29c. With optimized parameters, there was no obvious
impact of the clad to the substrate as can be seen from the cross section in Figure 4.29d.
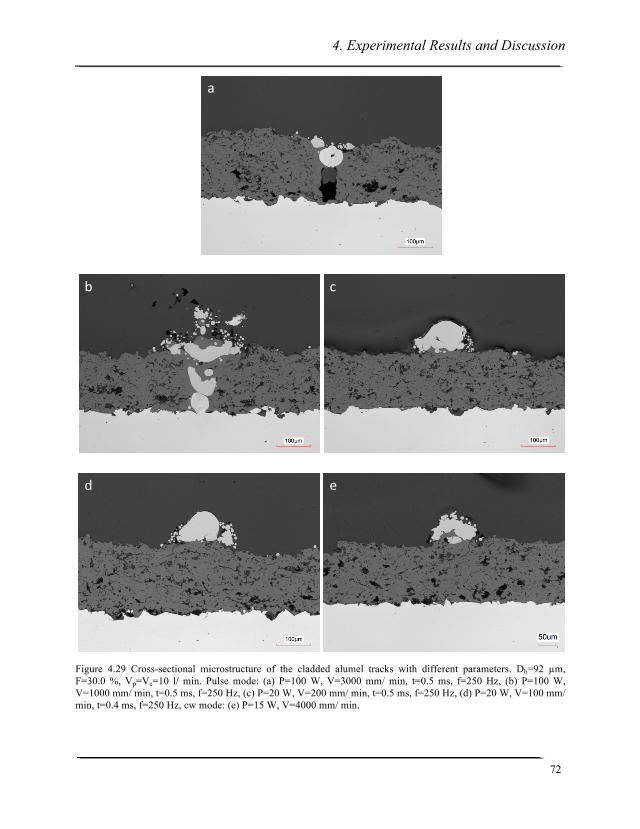
4. Experimental Results and Discussion
72
Figure 4.29 Cross-sectional microstructure of the cladded alumel tracks with different parameters. Db=92 µm, F=30.0 %, Vp=Vc=10 l/ min. Pulse mode: (a) P=100 W, V=3000 mm/ min, t=0.5 ms, f=250 Hz, (b) P=100 W, V=1000 mm/ min, t=0.5 ms, f=250 Hz, (c) P=20 W, V=200 mm/ min, t=0.5 ms, f=250 Hz, (d) P=20 W, V=100 mm/ min, t=0.4 ms, f=250 Hz, cw mode: (e) P=15 W, V=4000 mm/ min.
a
b c
d e

4. Experimental Results and Discussion
73
According to the above results, the following conclusions are obtained: once there are too less
powder particles sticking to the substrate, two cases maybe involved. One is that the remaining
energy after attenuation by in-flight particles is insufficient to melt a certain amount of powder
and the ceramic surface keeps nearly intact. The other is that the remaining energy after
attenuation is so high that the ceramic layer and injected particles are both melted and most
powder particles are buried by or penetrated into the ceramic substrate (Figure 4.28a and
Figure 4.29a). The ceramic surface becomes dark which is probably induced by the loss of
oxygen atoms during laser cladding operation and/ or the color from the buried cladding layer
because of the transparency of the ceramic coatings.
The above optimized alumel track (P=20 W, V=100 mm/ min, Db=92 µm, F=30.0 %, Vp=Vc=10
l/ min, t=0.4 ms, f=250 Hz) was further analyzed by the Cyberscan topographer as given in
Figure 4.30. Obviously, this deposited clad was very smooth as desired. The dimension for this
cladded layer was about 95 ± 20 µm in height and 119 ± 13 µm in width.
Figure 4.30 Cyberscan micrograph of the cladded alumel track. P=20 W, V=100 mm/ min, Db=92 µm, F=30.0 %, Vp=Vc=10 l/ min, t=0.4 ms, f=250 Hz.
4. Experimental Results and Discussion
74
4.5.2 Optimization of Chromel Tracks
Also for the chromel powder, which composes the type-K thermocouple together with the alumel
thermoleg, similar parameters were first attempted (Table 4.11) as optimized for the alumel. The
laser power, spot size, pulse duration, pulse frequency, carrier and protective gas rate were kept
constant, and the powder feeding rate of 15.0 % and 17.5 % were applied with 100 mm/ min and
150 mm/ min travelling speed, respectively. The reason for using 150 mm/ min is to further
reduce the width of the tracks [45]. When the feeding rate was more than 20.0 %, detached tracks
were obtained (Figure 4.31a) or even no tracks formed on the substrate as a result of the
insufficient energy of the laser beam after attenuation by the particle cloud. Macroscopic
morphologies were displayed in Figure 4.31b-d. It turned out that all tracks were bonded to the
substrate, but the electrical continuity was unstable with 150 mm/ min scanning velocity. This
might be attributed to the decrease of delivered particle numbers, thereby, the melted particles
became less and were insufficient to ensure its conductivity.
Table 4.11 Laser cladding parameters for the chromel powder.
V (mm/ min) F (%) t (ms) E0 (J) P0 (W)
(1) 100 26.0 0.4 0.008 2
(2) 100 20.0 0.4 0.008 2
(3) 100 15.0 0.4 0.008 2
(4) 100 17.5 0.4 0.008 2
(5) 150 15.0 0.4 0.008 2
(6) 150 17.5 0.4 0.008 2
* Spot size: 92 µm; power: 20 W; laser pulse frequency: 250 Hz; protective gas and carrier gas rate: 10 l/ min.
4. Experimental Results and Discussion
75
Figure 4.31 Stereo micrographs of cladded tracks for the chromel powder. P=20 W, Db=92 µm, f=250 Hz, t=0.4 ms, Vp=Vc=10 l/ min. (1) V=100 mm/ min, F=26.0 %; (2) V=100 mm/ min, F=20.0 %; (3) V=100 mm/ min, F=15.0 %; (4) V=100 mm/ min, F=17.5 %; (5) V=150 mm/ min, F=15.0 %; (6) V=150 mm/ min, F=17.5 %.
The cross sections of deposited tracks perpendicular to the cladding directions for chromel
powder were given in Figure 4.32 from track 3 to track 6 (Figure 4.31). It can be seen that the
YSZ substrate was not seriously influenced by the laser cladding process. In addition, the
morphologies in Figure 4.32a and c were with more regular structures with 15.0 % powder
feeding rate. Instead, the morphologies of cladded tracks (Figure 4.32b and d) were irregular if
the remaining energy was insufficient to totally melt the injected particles with 17.5 % powder
feeding rate. Thus, the chromel track with the parameters of P=20 W, Db=92 µm, V=100 mm/
min, F=15.0 %, t=0.4 ms, f=250 Hz, Vp=Vc=10 l/ min was taken as the optimized clad.
Considering to obtain smaller dimension chromel thermoleg, the laser peak power of 15 W was
adopted and the process parameters were eventually optimized to P=15 W, V=80 mm/ min,
a
(1)
(2)
detached
b
(3)
c
(5)
(4)
d
(6)
4. Experimental Results and Discussion
76
Db=92 µm, F=16.0 %, Vp=Vc=10 l/ min, t=0.5 ms, f=250 Hz with a similar optimization
procedure.
Figure 4.32 Cross-sectional microstructure of the cladded chromel tracks with different parameters. P=20 W, Db=92 µm, t=0.4 ms, f=250 Hz, Vp=Vc=10 l/ min. (a) V=100 mm/ min, F=15.0 %; (b) V=100 mm/ min, F=17.5 %; (c) V=150 mm/ min, F=15.0 %; (d) V=150 mm/ min, F=17.5 %.
Figure 4.33 displays the behavior of the clad height as a function of the powder feeding rate and
the travelling speed for chromel powder. Similarly, the track height increased with the powder
feeding rate and decreased with the travelling speed. The track height was about 90 µm with
15.0 % powder feeding rate and increased to about 135 µm by applying 17.5 % powder feeding
a b
c d

4. Experimental Results and Discussion
77
rate. When increasing the travelling speed from 100 mm/ min to 150 mm/ min, the track height
was decreased from about 92 µm to 88 µm.
Figure 4.33 Influence of the powder feeding rate (a) and the travelling speed (b) on the height of the cladded chromel tracks. P=20 W, Db=92 µm, t=0.4 ms, f=250 Hz, Vp=Vc=10 l/ min.
4.5.3 Preparation of K-type TCs
The K-type thermocouples were cladded in an arrow layout with the above optimized parameters
(alumel: P=20 W, V=100 mm/ min, Db=92 µm, F=30.0 %, Vp=Vc=10 l/ min, t=0.4 ms, f=250 Hz;
chromel: P=20 W, V=100 mm/ min, Db=92 µm, F=15.0 %, Vp=Vc=10 l/ min, t=0.4 ms, f=250
Hz) shown in Figure 4.34a. For this cladded thermocouple, the dimensions for alumel were 82 ±
3 µm in height and 113 ± 16 µm in width and 114 ± 10 µm in height and 81 ± 18 µm in width for
chromel, respectively. The average roughness for the clad alumel was 13 ± 3 µm and for chromel
13 ± 3 µm. The thermocouple was also deposited with slightly varied parameters (alumel: P=20
W, V=100 mm/ min, Db=92 µm, F=30.0 %, Vp=Vc=10 l/ min, t=0.4 ms, f=250 Hz; chromel:
P=15 W, V=80 mm/ min, Db=92 µm, F=16.0 %, Vp=Vc=10 l/ min, t=0.5 ms, f=250 Hz) and the
microstructure is shown in Figure 4.34b. Part of the alumel track was missing after cleaning in
the ethanol bath and it can be clearly seen that YSZ substrate was not obviously affected by this
process. In addition, it implies that the adhesion between alumel track and YSZ substrate was
poor. For the chromel thermoleg, the dimension was about 124 ± 9 µm in height and 90 ± 3 µm
15.0 15.5 16.0 16.5 17.0 17.5
90
100
110
120
130
140
150
track
hei
ght, µm
powder feeding rate, %
(a)
100 110 120 130 140 15085
86
87
88
89
90
91
92
93
track
hei
ght, µm
travelling speed, mm/ min
(b)
4. Experimental Results and Discussion
78
in width. The dimension of alumel thermoleg was about 94 ± 3 µm in height and 125 ± 4 µm in
width. The average roughness was about 9 ± 3 µm and 13 ± 3 µm for alumel and chromel. Since
the track quality is very sensitive to these above mentioned issues, specimens with flat surface
should be carefully processed.
Figure 4.34 Micrographs of cladded TCs with optimized parameters. (a) alumel: P=20 W, V=100 mm/ min, Db=92 µm, F=30.0 %, Vp=Vc=10 l/ min, t=0.4 ms, f=250 Hz; chromel: P=20 W, V=100 mm/ min, Db=92 µm, F=15.0 %, Vp=Vc=10 l/ min, t=0.4 ms, f=250 Hz; (b) alumel: P=20 W, V=100 mm/ min, Db=92 µm, F=30.0 %, Vp=Vc=10 l/ min, t=0.4 ms, f=250 Hz; chromel: P=15 W, V=80 mm/ min, Db=92 µm, F=16.0 %, Vp=Vc=10 l/ min, t=0.5 ms, f=250 Hz.
4.5.4 Embedding of the Cladded TCs
A steel sheet was used as a mask when spraying a second YSZ layer, leaving two bared tips for
the junctions. When trying to place the mask, segmental spalling of the TC legs could be
observed during preparation (Figures 4.34b, Figure 4.35). The second YSZ layer was sprayed
only for one pass to easier find out the reasons causing the problem of non-conductivity.
Apparently, width and height of clads were reduced at some locations of the tracks which are
marked in Figure 4.35b-c. The potential reason might be due to ruptures taking place due to the
impingement of the ceramic particles on the tracks. Certainly, parameters need to be further
optimized with pulsed laser cladding.
-‐ +
(a)
-‐
+
missing
overlap
(b)

4. Experimental Results and Discussion
79
Figure 4.35 Microstructures of embedded thermocouple with the second YSZ layer under the stereo microscope. (a) low magnification, (b) high magnification for the alumel track, (c) high magnification for the chromel track.
To sum up, both the energy input per unit area and pulsed energy played an important role for
the dimension of the HAZ, reducing the laser peak power or increasing the powder feeding rate
is helpful to diminish the influence of cladding process to the ceramic substrate significantly. K-
type thermocouples in the range of 100 µm were possible to be fabricated with the desired
properties like no impact to substrate, conductive and low roughness by applying pulsed laser
with optimizing the process parameters. Unfortunately, the cladded thermocouple produced with
a pulsed laser was failed to work after embedding. There might be two reasons for the
degradation. One might be the quality of the cladded thermocouple which was not perfect, so
interruptions took place after spraying. A second factor might be the shear force. The
measurements of the adhesion strength showed that it plays an important role but not the most
significant factor for the successful embedding.
b
c
ainterruption & detached-‐
+2nd YSZ
layer spalling
spalling
4. Experimental Results and Discussion
80
4.6 Shear Force Measurements
From the experience of the previous experiments, it is clear that the bonding strength between
cladded tracks and the substrate plays also an important role for the following embedding with
the second ceramic layer. Therefore, the shear force measurement was carried out with all the
optimized parameters for both kind of clads to evaluate the adhesion strength. The results are
shown in Figure 4.36. A big scattering is observed for chromel tracks. There is not much
difference of the mean shear force per unit area for these three different cladding parameters. For
tracks made of alumel powder, there is no big scattering of the shear force except the third
deposited clad. From the aforementioned results, it is already known that it is possible to embed
the produced thermocouples with parameters of P=15 W, V=1000 mm/ min, Db=156 µm,
F=30.0 %, Vp=Vc=10 l/ min for alumel powder and P=15 W, V=1000 mm/ min, Db=156 µm,
F=22.5 %, Vp=Vc=10 l/ min for chromel powder while clads with other parameters were still
unable to be which possess similar adhesion strength. In other words, the bonding plays an
important role but not the most significant factor for the successful embedding.
4. Experimental Results and Discussion
81
Figure 4.36 Shear force measurement of relatively optimized cladding parameters, the carrier and shielding gas rate are 10 l/ min.
4.7 Summary of Optimized Tracks
Table 4.12 summarizes the optimized parameters for both type-K TC tracks. The cladded tracks
can be successfully embedded or not are also described.
0.0
0.2
0.4
P=15 W,
V=80 mm/ min
D=92 µmF=16.0 %
t=0.5 msf=250 HZ
P=15 W,
V=1000 mm/ min
D=156 µmF=22.5 %
She
ar fo
rce
per a
rea
(MP
a)
chromel
P=15 W,
V=3000 mm/ min
D=92 µmF=32.0 %
0.0
0.2
0.4
0.6
P=20 W,
V=100 mm/ min
D=92 µmF=30.0 %
t=0.4 msf=250 HZ
P=15 W,
V=4000 mm/ min
D=92 µmF=32.0 %
P=15 W,
V=1000 mm/ min
D=156 µmF=30.0 %
P=20 W,
V=1000 mm/ min
D=572 µmF=14.0 %
She
ar fo
rce
per a
rea
(MP
a)
alumel

4. Experimental Results and Discussion
82
Table 4.12 Optimized parameters for both tracks.
P (W) V (mm/ min) Db (µm) F (%) t (ms) f (Hz) successful embedding?
chromel
15 1000 156 22.5 - - √
15 3000 92 32 - - ×
15 80 92 16 0.5 250 ×
alumel
20 1000 572 14 - - ×
15 1000 156 30 - - √
15 4000 92 32 - - ×
20 100 92 30 0.4 250 ×
5. Droplets Formation Mechanism
83
5. Droplets Formation Mechanism
The laser cladding process depends on a number of variables: laser power, scanning speed,
powder feeding rate, duration of particle interaction with the laser beam, relative positions of the
laser beam waist, substrate and nozzle outlet, respectively. Droplets were observed from time to
time during cladding. This phenomenon is determined by the temperature-dependent rheological
properties of the melt (viscosity, surface tension, wettability, etc.) and the amount of melt
produced during laser heating [100]. The relation between travelling velocity, power density and
powder feeding rate determines whether a deposited layer is smooth and continuous or it is
divided into separate segments. So a series of experiments have been made to analyze the
influence of the above mentioned parameters on the surface of the stainless steel coated with
YSZ layers to better understand the mechanisms controlling this phenomenon. Corresponding
parameters are given in Table 5.1.
Table 5.1 Laser cladding parameters for different tracks.
chromel alumel
a b c d e f g h P (W) 15 15 22 15 15 15 25 15
V (mm/min) 1000 1500 1500 1000 1000 2500 2500 1000 F (%) 22.5 22.5 22.5 17.5 29 29 29 20
* Spot size: 156 µm; protective gas and carrier gas rate: 10 l/ min.
It can be clearly seen in Figure 5.1 that droplets occurred periodically along the clads. Compared
to a homogenous clad (Figure 5.1a), the droplets that are much larger than its original particle
sizes are induced to be formed by reducing the powder feeding rate (Figure 5.1d) or increasing
the laser power (Figure 5.1c) for chromel powder. Similar results were also observed with
alumel powder (Figure 5.1e-h). Both reduction of powder feeding rate (the remaining energy
after attenuation by the particle clouds is higher with reduced powder feeding rate due to less
reflection by sparser powder density) and increase of power will lead an increase of the peak
temperatures during this process. The higher the temperature is, the smaller the viscosity and
5. Droplets Formation Mechanism
84
surface tension are [101]. In accordance with this, the melts should be prone for spreading or
have better wettability on the substrate, thus, clads with smoother morphology should be
acquired. However, the experimental results were contrary to this hypothesis. Therefore, the
droplets formation should be related to some other factors.
Table 5.2 shows two combined parameters during laser cladding process: energy input per unit
mass of the powder (P/ F, J/ g) and injected powder per unit length (F/ V, g/ m). For chromel, it
can be clearly seen that droplets have the less tendency to be formed by reducing the energy
input per unit mass of the powder (Figure 5.1a-c). The injected powder per unit length plays an
important role under the same energy input per unit mass of the powder as well. By increasing
the injected powder per unit length, droplets have the less tendency to be formed (Figure 5.1c-d).
In another words, duration of melt is obviously critical for the droplets formation. Similar
phenomena were also observed for alumel powder. Fewer droplets formed by reducing the
energy input per unit mass of the powder or by increasing the injected powder per unit length
under the same energy input per unit mass of the powder (Figure 5.1e-h). By proper controlling
both combined parameters, it is beneficial to obtain continuous and smooth tracks.
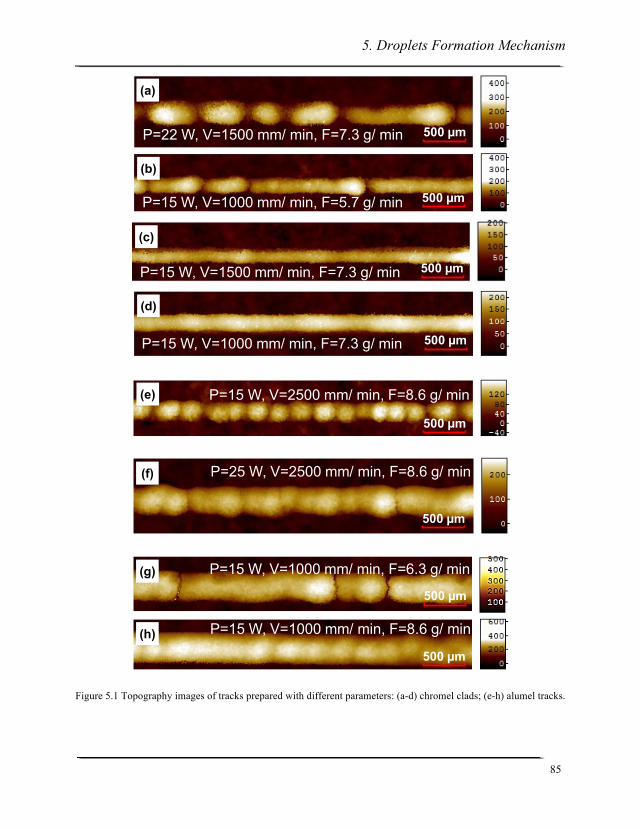
5. Droplets Formation Mechanism
85
Figure 5.1 Topography images of tracks prepared with different parameters: (a-d) chromel clads; (e-h) alumel tracks.
P=22 W, V=1500 mm/ min, F=7.3 g/ min 500 µm
(a)
500 µmP=15 W, V=1000 mm/ min, F=5.7 g/ min
(b)
500 µmP=15 W, V=1500 mm/ min, F=7.3 g/ min
(c)
P=15 W, V=1000 mm/ min, F=7.3 g/ min 500 µm
(d)
P=15 W, V=2500 mm/ min, F=8.6 g/ min
500 µm
(e)
P=25 W, V=2500 mm/ min, F=8.6 g/ min
500 µm
(f)
P=15 W, V=1000 mm/ min, F=6.3 g/ min
500 µm
(g)
P=15 W, V=1000 mm/ min, F=8.6 g/ min
500 µm
(h)
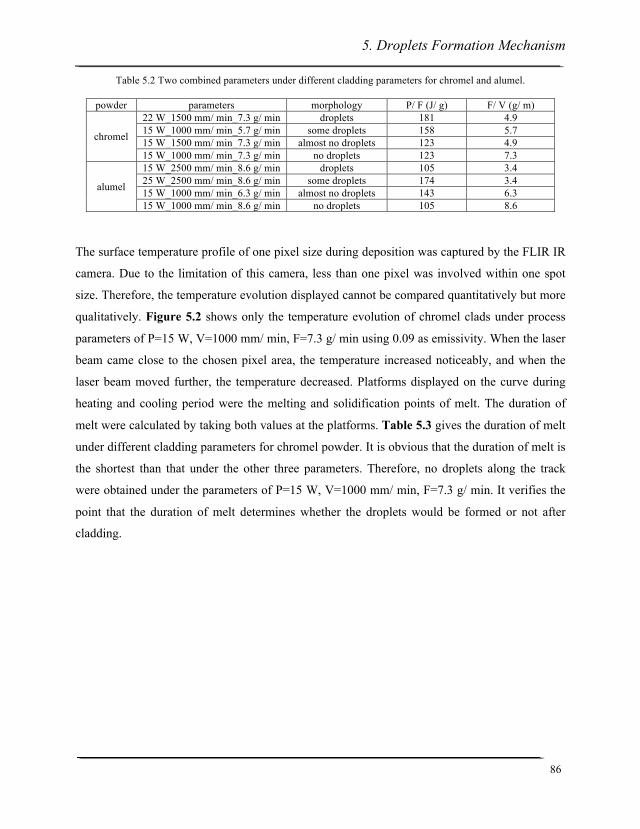
5. Droplets Formation Mechanism
86
Table 5.2 Two combined parameters under different cladding parameters for chromel and alumel.
powder parameters morphology P/ F (J/ g) F/ V (g/ m)
chromel
22 W_1500 mm/ min_7.3 g/ min droplets 181 4.9 15 W_1000 mm/ min_5.7 g/ min some droplets 158 5.7 15 W_1500 mm/ min_7.3 g/ min almost no droplets 123 4.9 15 W_1000 mm/ min_7.3 g/ min no droplets 123 7.3
alumel
15 W_2500 mm/ min_8.6 g/ min droplets 105 3.4 25 W_2500 mm/ min_8.6 g/ min some droplets 174 3.4 15 W_1000 mm/ min_6.3 g/ min almost no droplets 143 6.3 15 W_1000 mm/ min_8.6 g/ min no droplets 105 8.6
The surface temperature profile of one pixel size during deposition was captured by the FLIR IR
camera. Due to the limitation of this camera, less than one pixel was involved within one spot
size. Therefore, the temperature evolution displayed cannot be compared quantitatively but more
qualitatively. Figure 5.2 shows only the temperature evolution of chromel clads under process
parameters of P=15 W, V=1000 mm/ min, F=7.3 g/ min using 0.09 as emissivity. When the laser
beam came close to the chosen pixel area, the temperature increased noticeably, and when the
laser beam moved further, the temperature decreased. Platforms displayed on the curve during
heating and cooling period were the melting and solidification points of melt. The duration of
melt were calculated by taking both values at the platforms. Table 5.3 gives the duration of melt
under different cladding parameters for chromel powder. It is obvious that the duration of melt is
the shortest than that under the other three parameters. Therefore, no droplets along the track
were obtained under the parameters of P=15 W, V=1000 mm/ min, F=7.3 g/ min. It verifies the
point that the duration of melt determines whether the droplets would be formed or not after
cladding.
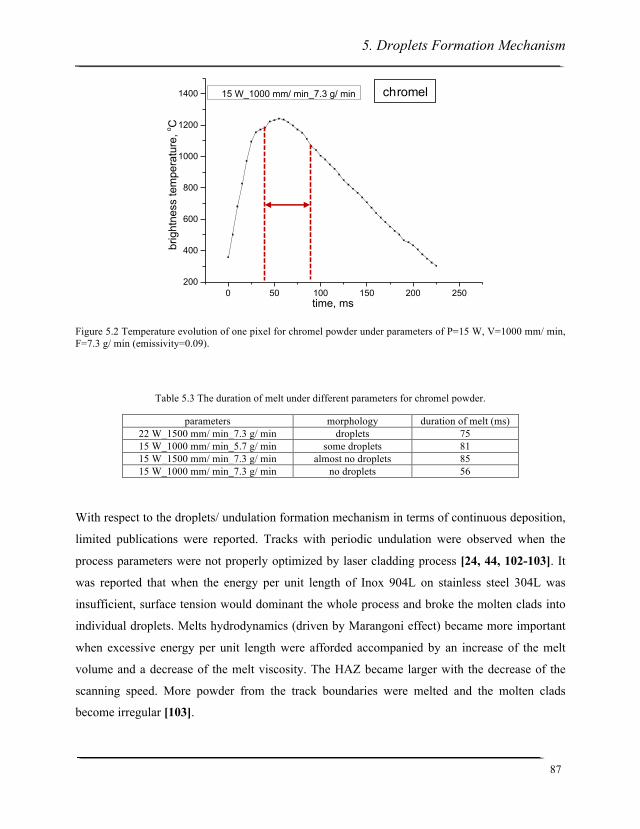
5. Droplets Formation Mechanism
87
Figure 5.2 Temperature evolution of one pixel for chromel powder under parameters of P=15 W, V=1000 mm/ min, F=7.3 g/ min (emissivity=0.09).
Table 5.3 The duration of melt under different parameters for chromel powder.
parameters morphology duration of melt (ms) 22 W_1500 mm/ min_7.3 g/ min droplets 75 15 W_1000 mm/ min_5.7 g/ min some droplets 81 15 W_1500 mm/ min_7.3 g/ min almost no droplets 85 15 W_1000 mm/ min_7.3 g/ min no droplets 56
With respect to the droplets/ undulation formation mechanism in terms of continuous deposition,
limited publications were reported. Tracks with periodic undulation were observed when the
process parameters were not properly optimized by laser cladding process [24, 44, 102-103]. It
was reported that when the energy per unit length of Inox 904L on stainless steel 304L was
insufficient, surface tension would dominant the whole process and broke the molten clads into
individual droplets. Melts hydrodynamics (driven by Marangoni effect) became more important
when excessive energy per unit length were afforded accompanied by an increase of the melt
volume and a decrease of the melt viscosity. The HAZ became larger with the decrease of the
scanning speed. More powder from the track boundaries were melted and the molten clads
become irregular [103].
chromel
0 50 100 150 200 250200
400
600
800
1000
1200
1400
time, ms
brig
htne
ss te
mpe
ratu
re, o C
15 W_1000 mm/ min_7.3 g/ min
5. Droplets Formation Mechanism
88
In order to obtain continuous clads, Steen et al [104] reported that the average energy per unit
area must exceed the threshold value to guarantee good wetting of the Nimonic 75 by the Stellite
12. Mazumder et al [89] reported that minimum average energy per unit area of WC-12 wt.% Co
against low carbon steel was required to form a continuous track during the process.
The humping phenomenon was more observed and reported by arc welding process [105-109].
The backward flow of molten weld metal was proved to be responsible for the initial formation
and the growth of a hump correlated to the high surface tension confirmed by a LaserStrober
video imaging system [109]. The strong momentum of the backward flow of molten metal inside
the weld pool prevents backfilling of the front portion of the weld pool. When increasing the
power or the welding speed, the velocity and momentum of the flow of molten metal towards the
tail of the weld pool must also be higher. Therefore, the droplets on the surface would have
higher tendency to be formed. Different models have also been proposed [110-111] and can
provide plausible explanations of the periodic behavior of the humping phenomenon. Rayleigh’s
theory of the instability of a free liquid cylinder due to surface tension to the humping
phenomenon was applied during the welding process. This is also reasonable to apply this theory
to the laser cladding process because both processes are quite similar.
Consider an infinite cylinder of radius Rc of an ideal fluid which is maintained by surface tension
only [112] and is assumed to be freely suspended in space. A small amplitude perturbation
analysis shows that all disturbances end up in stable vibrations. If the wavelength of the
disturbance exceeds the circumference of the cylinder:
λ > 2πRc
instability starts and the perturbation begins to grow. Eventually the cylinder will break up into
droplets. Furthermore, the analysis provides a break up time τ of that disturbance which grows
fastest where
τ=3 !!!𝑅!!
where ρ c denotes the density, σ the surface tension. So if the solidification time of the droplet
exceeds the break up time, the clad may break into droplets.

5. Droplets Formation Mechanism
89
Table 5.4 gives the radius of the cylinder and break up time under different parameters for
chromel powder. The diameters of the cylinder were defined as the widths of cladded tracks. The
radiuses for the parameters of P=15 W, V=1000 mm/ min, F=7.3 g/ min and P=15 W, V=1500
mm/ min, F=7.3 g/ min were about 0.103 mm and 0.085 mm, respectively. The break up time
was calculated according to the above formula which was below 170 µs. With higher power or
lower powder feeding rate, the radius became larger which were 0.139 mm and 0.114 mm,
respectively. The break up time took longer and was about 263 µs and 192 µs under higher laser
power and lower powder feeding rate. Since the break up time is in the order of µs rather than ms,
this result is not able to interpret the droplets phenomenon quantitatively either.
Table 5.4 The radiuses and break up time of clads under different parameters for chromel powder.
parameters morphology Rc (mm) τ (µs) P=22 W, V=1500 mm/ min, F=7.3 g/ min droplets 0.139 263 P=15 W, V=1000 mm/ min, F=5.7 g/ min some droplets 0.114 192 P=15 W, V=1500 mm/ min, F=7.3 g/ min almost no droplets 0.085 127 P=15 W, V=1000 mm/ min, F=7.3 g/ min no droplets 0.103 167
* ρ=8.91 g/ cm3, σ=1.76 N/ m @ 1450 oC [113]
In general, the wetting behavior for alumel is more difficult than chromel. It is reported that the
addition of Cr (or Cr-O clusters) can significantly improve the wettability of liquid Cu on ZrO2
substrate [114]. According to this, the presence of Cr element in chromel makes the big
difference in the wetting behavior between alumel (Ni-2Al2Mn1Si) and chromel (Ni-10Cr).

5. Droplets Formation Mechanism
90
6. Summary and Outlook
91
6. Summary and Outlook
In this work, a new method for fabricating high temperature type K thermocouple (TC) sensors
using laser cladding technology has been developed.
The first experiment showed that the heat affected zone (HAZ) was significantly influenced by
the energy per unit area and the powder feeding rate as well as the peak power. Reducing the
energy per unit area, the peak power or increasing the powder feeding rate was beneficial to
reduce the dimension of the HAZ.
The dimensions of produced type K TC sensors by continuous wave (CW) laser cladding were in
the range of two hundred microns in thickness and width. The average roughness was for the
cladded alumel was 10 ± 2 µm and for the chromel was 9 ± 2 µm. The resistivity of cladded
alumel (0.638 µΩ·m) is two times larger than its nominal value (0.29-0.33 µΩ·m) after
optimization. This may be due to the easy oxidation of aluminum formed especially at the alumel
grain boundaries. The non-conductive alumina can block the electrical current. The resistivity of
cladded chromel (0.776 µΩ·m) is close to its nominal value (0.706 µΩ·m) after optimization.
This may be due to the conductive chromium oxide scale formed in the chromel tracks. It is
possible to embed sensors manufactured by CW laser cladding and reliable performance was
confirmed with the thermosensitivity measurement. The Seebeck coefficients of cladded
thermocouple are estimated as 41.2 µV/ K before embedding and 40.9 µV/ K after embedding
which are close to the reported value 41.1 µV/ K.
The dimensions of cladded TC sensors by pulsed laser cladding were less than 100 microns by
pulsed laser cladding. It has been not achieved to embed such sensors due to the poor bonding
strength between the clads and the substrate up to now.
The shear force measurements were carried out with all the optimized parameters for both kind
of alumel and chromel clads to evaluate the adhesion strength. Results show that a big scattering
was obtained due to the roughness substrate surface and the tip of the shearing tool was difficult
to be placed. The adhesion strength between the cladded tracks and the substrate plays an
important role but not the most significant factor for the subsequent successful embedding.
6. Summary and Outlook
92
Reducing the powder feeding rate, increasing the travelling speed or the laser power leads to the
formation of periodically droplets along the clads. Regarding to its formation mechanism, the
duration of melt which determined by two important combined parameters (P/ F and F/ V) is
critical for the droplets formation. Smooth tracks can be obtained by reducing the duration of
melt. Rayleigh’s theory could be applied to explain the periodically formed droplets along the
clads. If the wavelength of the disturbance exceeds the circumference of the cylinder, instability
starts and the cylinder will break up into droplets eventually. The presence of Cr in chromel
makes the big difference in the wetting behavior between alumel (Ni-2Al2Mn1Si) and chromel
(Ni-10Cr).
In summary, the manufactured TC sensors by the laser cladding technique provide minimal
intrusion to the substrate, small feature sizes (100~200 µm), low roughness (~10 µm) and
electrical conductivity. Several advantages are possessed by this technique when fabricating TC
sensors, such as neither vacuum processing nor application of masks during cladding as well as
less time-consuming.
This technology is still in its infancy, and there are many opportunities and challenges both in
terms of the process itself and potential applications. However, the microstructure improvement
of laser cladded thermocouple sensors is a topic to be continually focused on. Future work how
the embedded sensors affect the lifetime of TBCs in terms of degradation needs to be studied.
Application and system level issues associated with sensor placement have to be further
addressed. In addition, the different sensors, like strain gauge sensors, flow sensors, piezoelectric
sensors, accelerometers et al need be adopted for different purposes.
7. Literature
93
7. Literature
[1] S. M. Meier, D. K. Gupta; The evolution of thermal barrier coatings in gas turbine engine
applications. Journal of Engineering for Gas Turbines and Power, Vol. 116 (1), 1994, p. 250-
257.
[2] N. P. Padture, M. Gell, E. H. Jordan; Thermal barrier coatings for gas-turbine engine
applications. Science, Vol. 296 (5566), 2002, p. 280-284.
[3] A. Feuerstein, J. Knapp, T. Taylor, A. Ashary, A. Bolcavage, N. Hitchman; Technical and
economical aspects of current thermal barrier coating systems for gas turbine engines by thermal
spray and EB-PVD: a review. Journal of Thermal Spray Technology, Vol. 17 (2), 2008, p. 199-
213.
[4] D. Stöver, G. Pracht, H. Lehmann, M. Dietrich, J. E. Döring, R. Vaßen; New material
concepts for the next generation of plasma-sprayed thermal barrier coatings. Journal of Thermal
Spray Technology, Vol. 13 (1), 2004, p. 76-83.
[5] L. B. Chen; Yttria stabilized zirconia thermal barrier coatings-a review. Surface Review and
Letters, Vol. 13 (05), 2006, p. 535-544.
[6] D. R. Clarke, S. R. Phillpot; Thermal barrier coating materials. Materials Today, Vol. 8 (6),
2005, p. 22-29.
[7] R. Vaßen, M. O. Jarligo, T. Steinke, D. E. Mack, D. Stöver; Overview on advanced thermal
barrier coatings. Surface & Coatings Technology, Vol. 205 (4), 2010, p. 938-942.
[8] D. Zhu, R. A. Miller; Thermal barrier coatings for advanced gas turbine engines. MRS
Bulletin, Vol. 25 (07), 2000, p. 43-47.
[9] R. Vassen, A. Stuke, D. Stöver; Recent developments in the field of thermal barrier coatings.
Journal of thermal spray technology, Vol. 18 (2), 2009, p. 181-186.
[10] R. A. Miller; Thermal barrier coatings for aircraft engines history and directions. Journal of
thermal spray technology, Vol. 6 (1), 1997, p. 35-42.
7. Literature
94
[11] V. S. Stubican; Phase equilibria and metastabilities in the systems ZrO2-MgO, ZrO2-CaO,
and ZrO2-Y2O3. Advanced Ceramic Materials, Vol. 24A, 1984, p. 71-85.
[12] S. Stecura; Optimization of the Ni-Cr-Al-Y/ZrO2-Y2O3 thermal barrier system. Advanced
Ceramic Materials, Vol. 1 (1), 1986, p. 68-76.
[13] R. Darolia; Thermal barrier coatings technology: critical review, progress update, remaining
challenges and prospects. International materials reviews, Vol. 58 (6), 2013, p. 315-348.
[14] S. Bose, J. DeMasi-Marcin; Thermal barrier coating experience in gas turbine engines at
Pratt & Whitney. Journal of thermal spray technology, Vol. 6 (1), 1997, p. 99-104.
[15] W. A. Nelson, R. M. Orenstein; TBC experience in land-based gas turbines. Journal of
thermal spray technology, Vol. 6 (2), 1997, p. 176-180.
[16] C. Mercer, J. R. Williams, D. R. Clarke, and A. G. Evans; On a ferroelastic mechanism
governing the toughness of metastable tetragonal-prime (t’) yttria-stabilized zirconia.
Proceedings of the royal society A, Vol. 463 (2081), 2007, p. 1393-1408.
[17] U. Schulz, M. Schmücker; Microstructure of ZrO2 thermal barrier coatings applied by EB-
PVD. Materials Science and Engineering: A, Vol. 276 (1-2), 2000, p. 1-8.
[18] R. Vaßen; Thermal Barrier Coatings. Ceramics Science and Technology, Wiley-VCH
Verlag GmbH & Co. KGaA, Vol. 4, 2013, p. 95-115.
[19] B. Preauchat, S. Drawin; Isothermal and cycling properties of zirconia-based thermal barrier
coatings deposited by PECVD. Surface and Coatings Technology, Vol. 146-147, 2001, p. 94-101.
[20] T. E. Strangman; Thermal barrier coatings for turbine airfoils. Thin Solid Films, Vol. 127,
1985, p. 93-105.
[21] M. Peters, K. Fritscher, G. Staniek, W. A. Kaysser, U. Schulz; Design and Properties of
Thermal Barrier Coatings for advanced turbine engines. Materials Science and Engineering
Technology, Vol. 28 (8), 1997, p. 357-362.
7. Literature
95
[22] J. R. Nichollsa, K. J. Lawsona, A. Johnstoneb, D. S. Rickerby; Methods to reduce the
thermal conductivity of EB-PVD TBCs. Surface and Coatings Technology, Vol. 151-152, 2002,
p. 383-391.
[23] H. Huang, K. Eguchi, T. Yoshida; Novel structured yttria-stabilized zirconia coatings
fabricated by hybrid thermal plasma spraying. Science and Technology of Advanced Materials,
Vol. 4(6), 2003, p. 617-622.
[24] M. Fasching, F. B. Prinz, L. E. Weiss; ‘Smart’ coatings: a technical note. Journal of
Thermal Spray Technology, Vol. 4 (2), 1995, p. 133-136.
[25] A. P. Newbery, P. S. Grant; Oxidation during electric arc spray forming of steel. Journal of
Materials Processing Technology, Vol. 178 (1-3), 2006, p. 259-269.
[26] P. J. Kelly, R. D. Arnell; Magnetron sputtering: a review of recent developments and
applications. Vacuum, Vol. 56 (3), 2000, p. 159-172.
[27] J. F. Lei, L. C. Martin, H. A. Will; Advances in thin film sensor technologies for engine
applications. ASME 1997 International Gas Turbine and Aeroengine Congress and Exhibition.
American Society of Mechanical Engineers, 1997.
[28] F. B. Prinz, L. E. Weiss, D. P. Siewiorek; Electronic packages and smart structures formed
by thermal spray deposition. U.S. Patent 5278442, 1994.
[29] S. Sampath, A. Patel, A. H. Dent, R. Gambino, H. Herman, R. Greenlaw, E. Tormey;
Thermal spray techniques for fabrication of meso-electronics and sensors. Materials Research
Society Proceedings, Vol. 624, 2000, p. 181-188.
[30] S. Sampath, J. Longtin, R. Gambino, H. Herman, R. Greenlaw, E. Tormey; Direct-write
thermal spraying of multilayer electronics and sensor structures. Direct-Write Technologies for
Rapid Prototyping Applications, A. C. Pique and D. B. Chrisey, Ed., Academic Press, New York,
2002, p. 261-302.
[31] S. Sampath, H. Herman, R. J. Greenlaw; Method and apparatus for fine feature spray
deposition. U.S. Patent 6576861, 2003.
7. Literature
96
[32] J. P. Longtin, S. Sampath, R. Gambino, R. Greenlaw, J. Brogan; Direct-write thermal spray
for sensors and electronics: an overview. NIP & Digital Fabrication Conference, Society for
Imaging Science and Technology, Vol. 2006 (3), 2006, p. 116-119.
[33] C. Gouldstone, J. Brogan, R. Greenlaw, R.J. Gambino, J. Gutleber, S. Sampath, J. Longtin;
Embedded resistive strain sensors for harsh environments. IEEE Aerospace Conference, 2006.
[34] J. Gutleber, J. Brogan, R. Gambino, C. Gouldstone, R. Greenlaw, S. Sampath, J. Longtin;
Embedded temperature and heat flux sensors for advanced health monitoring of turbine engine
components. IEEE Aerospace Conference, 2006.
[35] T. S. Theophilou, J. P. Longtin, S. Sampath, S. Tankiewicz, R. J. Gambino; Integrated heat-
flux sensors for harsh environments using thermal-spray technology. IEEE Sensors Journal, Vol.
6 (5), 2006, p. 1126-1133.
[36] J. Longtin, S. Sampath, S. Tankiewicz, R. J. Gambino, R. J. Greenlaw; Sensors for harsh
environments by direct-write thermal spray. IEEE Sensors Journal, Vol. 4 (1), 2004, p. 118-121.
[37] J. P. Longtin, E. Mari, Y. Tan, S. Sampath; Using thermal spray and laser micromachining
to fabricate sensors. Journal of Thermal Spray Technology, Vol. 20 (4), 2011, p. 958-966.
[38] O. Svelto; Principles of Lasers. Plenum Press, New York, 1998.
[39] V. S. Aizenshtadt, V. I. Krylov, A. S. Metel'skii; Tables of Laguerre Polynomials and
Functions. Pergamon Press, Oxford, 1966.
[40] L. Sexton, S. Lavin, G. Byrne, A. Kennedy; Laser cladding of aerospace materials. Journal
of Materials Processing Technology, Vol. 122 (1), 2002, p. 63-68.
[41] R. Vilar; Laser cladding. Journal of Laser Applications, Vol. 11 (2), 1999, p. 64-79.
[42] R. Vilar; Laser alloying and laser cladding. Materials Science Forum, Vol. 301, 1999, p.
229-252.
[43] E. Toyserkani, A. Khajepour, S. F. Corbin; Laser cladding. CRC press, 2004.

7. Literature
97
[44] J. Laeng, J. G. Stewart, F. W. Liou; Laser metal forming processes for rapid prototyping-a
review. International Journal of Production Research, Vol. 38 (16), 2000, p. 3973-3996.
[45] U. De Oliveira, V. Ocelik, J. T. M. De Hosson; Analysis of coaxial laser cladding
processing conditions. Surface and Coatings Technology, Vol. 197 (2), 2005, p. 127-136.
[46] W. M. Steen, V. M. Weerasinghe, P. Monson; Some aspects of the formation of laser clad
tracks. International Symposium/ Innsbruck. International Society for Optics and Photonics,
1986, p. 226-234.
[47] J. Powell, P. S. Henry, W. M. Steen; Laser cladding with preplaced powder: analysis of
thermal cycling and dilution effects. Surface engineering, Vol. 4 (2), 1988, p. 141-149.
[48] J. D. Kim, Y. Peng; Melt pool shape and dilution of laser cladding with wire feeding.
Journal of Materials Processing Technology, Vol. 104 (3), 2000, p. 284-293.
[49] E. Lugscheider, H. Bolender, H. Krappitz; Laser cladding of paste bound hardfacing alloys.
Surface Engineering, Vol. 7 (4), 1991, p. 341-344.
[50] J. Y. Jeng, B. Quayle, P. J. Modern, W. M. Steen; Computer control of laser multi-powder
feeder cladding system for optimal alloy scan of corrosion and wear resistance. LAMP, Vol. 11
(2), 1992, p. 819-824.
[51] B. Gruenwald, S. Nowotny, W. Henning, F. Dausinger, H. Hugel; New technological
developments in laser cladding. Laser Materials Processing, Vol. 2306, 1994, p. 934-944.
[52] W. M. Steen, V. M. Weerasinghe, P. Monson; High power lasers and their industrial
applications. SPIE, Vol. 650, 1986, p. 226-234.
[53] Y. P. Hu, C. W. Chen, K. Mukherjee; Development of a new laser cladding process for
manufacturing cutting and stamping dies. Journal of materials science, Vol. 33 (5), 1998, p.
1287-1292.
[54] P. A. Vetter, T. Engel, J. Fontaine; Laser cladding: the relevant parameters for process
control. Laser Materials Processing: Industrial and Microelectronics Applications, Vol. 2207,
1994, p. 452-462.
7. Literature
98
[55] M. Murphy, C. Lee, W. M. Steen; Studies in rapid prototyping by laser surface cladding.
Laser Materials Processing, Vol. 2306, 1994, p. 882-887.
[56] J. Lin, W. M. Steen; Design characteristics and development of a nozzle for coaxial laser
cladding. Journal of Laser Applications, Vol. 10 (2), 1998, p. 55-63.
[57] X. Wu, B.Zhu, X.Zeng, X. Hu, K. Cui; Critical state of laser cladding with powder auto-
feeding. Surface and Coatings Technology, Vol. 79, 1996, p. 200-204.
[58] S. F. Corbin, E. Toyserkani, A. Khajepour; Cladding of an Fe-aluminide coating on mild
steel using pulsed laser assisted powder deposition. Materials Science and Engineering: A, Vol.
354 (1-2), 2003, p. 48-57.
[59] E. Toyserkani, S. F. Corbin, A. Khajepour; Iron aluminide coating of mild steel using laser
assisted powder deposition. Proceeding of the 11th International Symposium on Processing and
Fabrication of Advanced Materials Processing, 2002, p. 244-257.
[60] M. Doubenskaia, P. Bertrand, I. Smurov; Optical monitoring of Nd: YAG laser cladding.
Thin Solid Films, Vol. 453-454, 2004, p. 477-485.
[61] M. L. Griffith, M. E. Schlienger, L. D. Harwell, M. S. Oliver; Understanding thermal
behavior in the LENS process. Materials & Design, Vol. 20 (2-3), 1999, p. 107-113.
[62] D. P. Hand, M. D. T. Fox, F. M. Haran, C. Peters, S. A. Morgan, M. A. McLean, W. M.
Steen, J. D. C. Jones; Optical focus control system for laser welding and direct casting. Optics
and Lasers in Engineering, Vol. 34 (4-6), 2000, p. 415-427.
[63] G. Bi, A. Gasser, K. Wissenbach, A. Drenker, R. Poprawe; Identification and qualification
of temperature signal for monitoring and control in laser cladding. Optics and Lasers in
Engineering, Vol. 44 (12), 2006, p. 1348-1359.
[64] H. Tan, J. Chen, X. Lin, F. Zhang, W. Huang; Research on molten pool temperature in the
process of laser rapid forming. Journal of Materials Processing Technology, Vol. 198 (1-3),
2008, p. 454-462.

7. Literature
99
[65] W. C. Lin, C. Chen; Characteristics of thin surface layers of cobalt-based alloys deposited
by laser cladding. Surface and Coatings Technology, Vol. 200 (14-15), 2006, p. 4557-4563.
[66] M. Doubenskaia, I. Smurov, S. Grigoriev, M. Pavlov; Complex analysis of elaboration of
steel-TiC composites by direct metal deposition. Journal of Laser Applications, Vol. 25 (4),
2013, p. 1-8.
[67] W. Gao, S. Zhao, F. Liu, Y. Wang, C. Zhou, X. Lin; Effect of defocus manner on laser
cladding of Fe-based alloy powder. Surface and Coatings Technology, Vol. 248, 2014, p. 54-62.
[68] Y. Sun, M. Hao; Statistical analysis and optimization of process parameters in Ti6Al4V
laser cladding using Nd: YAG laser. Optics and Lasers in Engineering, Vol. 50 (7), 2012, p.
985-995.
[69] J. Feng, M. G. S. Ferreira, R. Vilar; Laser cladding of Ni-Cr/Al2O3 composite coatings on
AISI 304 stainless steel. Surface and Coatings Technology, Vol. 88 (1), 1997, p. 212-218.
[70] J. De Damborenea, A. J. Vázquez; Laser cladding of high-temperature coatings. Journal of
materials Science, Vol. 28 (17), 1993, p. 4775-4780.
[71] L. C. Lim, Q. Ming, Z. D. Chen; Microstructures of laser-clad nickel-based hardfacing
alloys. Surface and Coatings Technology, Vol. 106 (2), 1998, p. 183-192.
[72] Y. Li, W. M. Steen; Laser cladding of stellite and silica on aluminum substrate. Proc. SPIE
1979, International Conference on Lasers and Optoelectronics, 602, 1993.
[73] S. Sircar, C. Ribaudo, J. Mazumder; Laser clad nickel based superalloys: microstructure
evolution and high temperature oxidation studies. Proc. SPIE 0957, Laser Beam Surface
Treating and Coating, 29, 1988.
[74] A. Hidoucia, J. M. Pelletiera, F. Ducoinb, D. Dezertc, R. E. Guerjouma; Microstructural and
mechanical characteristics of laser coatings. Surface and Coatings Technology, Vol. 123 (1),
2000, p. 17-23.
[75] X. Wu; In situ formation by laser cladding of a TiC composite coating with a gradient
distribution. Surface and Coatings Technology, Vol. 115 (2), 1999, p. 111-115.
7. Literature
100
[76] Y. Sen, W. Liu, M. Zhong; Microstructure characteristics and properties of in-situ formed
TiC/Ni based alloy composite coating by laser cladding. Proc. SPIE 4831, First International
Symposium on High-Power Laser Macroprocessing, 481, 2003.
[77] L. R. Katipelli, A. Agarwal, N. B. Dahotre; Laser surface engineered TiC coating on 6061
Al alloy: microstructure and wear. Applied Surface Science, Vol. 153 (2), 2000, p. 65-78.
[78] C. Hu, H. Xin, L. M. Watson, T. N. Baker; Analysis of the phases developed by laser
nitriding Ti-6Al-4V alloys. Acta materialia, Vol. 45 (10), 1997, p. 4311-4322.
[79] P. Ding, J. Liu, G. Shi, S. Zhou, P. Cao; Laser surface alloying of a low alloy steel with
cobalt. Journal of materials processing technology, Vol. 58 (1), 1996, p. 131-135.
[80] A. Frenk, W. Kurz; High speed laser cladding: solidification conditions and microstructure
of a cobalt-based alloy. Materials Science and Engineering: A, Vol. 173 (1), 1993, p. 339-342.
[81] J. Przybylowicz, J. Kusinski; Laser cladding and erosive wear of Co-Mo-Cr-Si coatings.
Surface and Coatings Technology, Vol. 125 (1), 2000, p. 13-18.
[82] A. Frenk, W. Kurz; Microstructure formation in laser materials processing. Lasers in
Engineering, Vol. 1, 1992, p. 193-212.
[83] A. Frenk, M. Vandyoussefi, J. D. Wagnière, W. Kurz, A. Zryd; Analysis of the laser-
cladding process for stellite on steel. Metallurgical and Materials Transactions B, Vol. 28 (3),
1997, p. 501-508.
[84] F. Audebert, R. Colaco, R. Vilar, H. Sirkin; Production of glassy metallic layers by laser
surface treatment. Scripta materialia, Vol. 48 (3), 2003, p. 281-286.
[85] F. Lusquinos, J. Pou, J. L. Arias, M. Larosi, A. de Carlos, B. Leon, M. P. Amor, S. Best, W.
Bonfield, F. C. M. Driessens; Laser surface cladding: a new promising technique to produce
calcium phosphate coatings. Key Engineering Materials, Vol. 218, 2001.
[86] S. Nowotny, S. Scharek, E. Beyer, K. H. Richter; Laser beam build-up welding: precision in
repair, surface cladding, and direct 3D metal deposition. Journal of Thermal Spray Technology,
Vol. 16 (3), 2007, p. 344-348.
7. Literature
101
[87] A. Rosochowski, A. Matuszak; Rapid tooling: the state of the art. Journal of materials
processing technology, Vol. 106 (1), 2000, p. 191-198.
[88] P. F. Jacobs; Stereolithography and other RP and M technologies: from rapid prototyping to
rapid tooling. SME Press, New York, 1996.
[89] J. Mazumder, D. Dutta, N. Kikuchi, A. Ghosh; Closed loop direct metal deposition: art to
part. Optics and Lasers in Engineering, Vol. 34 (4), 2000, p. 397-414.
[90] C. P. Paul, H. Alemohammad, E. Toyserkani, A. Khajepour, S. Corbin; Cladding of WC-12
Co on low carbon steel using a pulsed Nd: YAG laser. Materials Science and Engineering: A,
Vol. 464 (1-2), 2007, p. 170-176.
[91] H. Choi, A. Datta, X. Cheng, X. Li; Microfabrication and characterization of metal-
embedded thin-film thermomechanical microsensors for applications in hostile manufacturing
environments. Journal of Microelectromechanical Systems, Vol. 15 (2), 2006, p. 322-329.
[92] M. Riabkina-Fishman, J. Zahavi; Laser alloying and cladding for improving surface
properties. Applied Surface Science, Vol. 106, 1996, p. 263-267.
[93] F. Hansen, W. W. Duley; Attenuation of laser radiation by particles during laser materials
processing. Journal of laser applications, Vol. 6 (3), 1994, p. 137-143.
[94] M. Gremaud, I. D. Wagnière, A. Zryd, W. Kurz; Laser metal forming: process fundamentals.
Surface Engineering, Vol. 12 (3), 1996, p. 251-259.
[95] J. Lin; Temperature analysis of the powder streams in coaxial laser cladding. Optics &
Laser Technology, Vol. 31 (8), 1999, p. 565-570.
[96] J. Ch. Liu, L. Li, Y. Zhang, X. Xie; Attenuation of laser power of a focused Gaussian beam
during interaction between a laser and powder in coaxial laser cladding. Journal of Physics D:
Applied Physics, Vol. 38 (10), 2005, p. 1546-1550.
[97] K. Nakashima, H. Matsumoto, K. Mori; Effect of additional elements Ni and Cr on wetting
characteristics of liquid Cu on zirconia ceramics. Acta materialia, Vol. 48 (18-19), 2000, p.
4677-4681.
7. Literature
102
[98] R. Marshall, L. Atlas and T. Putner; The preparation and performance of thin film
thermocouples. Journal of Scientific Instruments, Vol. 43 (3), 1996, p. 145-150.
[99] S. Sun, Y. Durandet, M. Brandt; Parametric investigation of pulsed Nd: YAG laser cladding
of stellite 6 on stainless steel. Surface and Coatings Technology, Vol. 194 (2-3), 2005, p. 225-
231.
[100] A. Yakovlev, E. Trunova, D. Grevey, M. Pilloz, I. Smurov; Laser-assisted direct
manufacturing of functionally graded 3D objects. Surface and Coatings Technology, Vol. 190
(1), 2005, p. 15-24.
[101] I. S. Grigoriev, E. Z. Meilikhov, A. A. Radzig; Handbook of Physical Quantities. CRC,
1997.
[102] E. Toyserkani, A. Khajepour, S. Corbin; 3-D finite element modeling of laser cladding by
powder injection: effects of laser pulse shaping on the process. Optics and Lasers in Engineering,
Vol. 41, 2004, p. 849-867.
[103] I. Yadroitsev, P. Bertrand, I. Smurov; Parametric analysis of the selective laser melting
process. Applied surface science, Vol. 253(19), 2007, p. 8064-8069.
[104] W. M. Steen, C. G. H. Courtney; Hardfacing of Nimonic 75 using 2 kW continuous wave
CO2 laser. Metals technology, Vol. 7(1), 1980, p. 232-237.
[105] F. Savage, E. F. Nipples, K. Agusa; Effect of arc force on defect formation in GTA
welding. Welding Journal, Vol. 58 (7), 1979, p. 212-224.
[106] C. E. Albright, S. Chiang; High speed laser welding discontinuities. Journal of Laser
Applications, Vol. 1 (1), 1988, p. 18-24.
[107] S. Tsukamoto, H. Irie, M. Inagaki, T. Hashimoto; Effect of focal position on humping bead
formation in electron beam welding. Transactions of National Research Institute for Metals, Vol.
25 (2), 1983, p. 62-67.

7. Literature
103
[108] S. Tsukamoto, H. Irie, M. Inagaki, T. Hashimoto; Effect of beam current on humping bead
formation in electron beam welding. Transactions of National Research Institute for Metals, Vol.
26 (2), 1984, p. 135-140.
[109] T. C. Nguyen, D. C. Weckman, D. A. Johnson, H. W. Kerr; The humping phenomenon
during high speed gas metal arc welding. Science and Technology of Welding and Joining, Vol.
10 (4), 2005, p. 447-459.
[110] B. J. Bradstreet; Effect of surface tension and metal flow on weld bead formation. Welding
Journal, Vol. 47 (7), 1968, p. 314-322.
[111] U. Gratzke, P. D. Kapadia, J. Dowden, J. Kross, G. Simon; Theoretical approach to the
humping phenomenon in welding processes. Journal of Physics D: Applied Physics, Vol. 25 (11),
1992, p. 1640-1647.
[112] Rayleigh Lord; Theory of sound. New York, 1896, p. 351-362.
[113] J. Brillo, I. Egry; Surface tension of Nickel, copper, iron and their binary alloys. Journal of
Materials Science, Vol. 40, 2005, p. 2213-2216.
[114] K. Nakashima, H. Matsumoto, K. Mori; Effect of additional elements Ni and Cr on wetting
characteristics of liquid Cu on zirconia ceramics. Acta materialia, Vol. 48(18), 2000, p. 4677-
4681.

104

105
Acknowledgements
I would like to express my deep appreciation to Prof. Dr. Robert Vaßen for giving me this
opportunity to come to IEK-1 (Forschungszentrum Jülich) for studying and being my
‘Doktorvater’. I have learned a lot, not only the knowledge but also the dedication to research.
Thanks to Prof. Dr. Detlev Stöver for his work in evaluating my dissertation and being my co-
referee, as well as to Prof. Dr. Marcus Petermann for the chairmanship during the examination.
I am most grateful to Dr. Daniel Emil Mack for his guidance, expertise with knowledge and
interactive discussions in the process for accomplishing of my PhD work. I also appreciate my
co-supervisor, Dr. Georg Mauer for his persistent motivation and endless support on me.
I would like to thank my best German friend Dr. Malte Willberg for his lots of support on my
work, my daily English practicing and German teaching. Thanks for having lunch as well as
spending time with me during my private life. I appreciate it a lot. Best wishes for him and his
family!
Many thanks to Dr. Qianli Ma to support me whenever I need help. I appreciate it a lot. Thanks
for explaining my endless doubts and spending time together to have lunch as well as play card,
mahjong and have parties…I feel very lucky to know him. Best wishes for him and his family as
well!
Thanks to my flatmate Mengchu Tao to live with me for over two years. I am not as active as
now without you. It is full of fun to stay and spend time together. Hope you can find your truth
love soon. All the best to her and her future!
Thanks to Panpan Wang for her support during writing my dissertation. I could work as late as I
want because I knew she was there waiting for me to go back home in the darkness no matter
how late it was. I could not finish my work on time without her. Best kisses and wishes for her
and her PhD work!

106
Thanks to Wenting He for helping me to prepare the documents for the Chinese embassy after I
leave Germany. Thanks for spending time together and we had lots of fun. All the best to her and
her PhD as well.
Many thanks to Dr. Manuel Krott for his support on my work and also to Dr. Philipp Terberger.
Thanks to Jan Bergholz and Dr. Diana Marcano to visit me from time to time and have fun
together (swim, pubs, parties) which makes me much more cosy here. Thank you so much!
Thanks to Dr. Tomas Keuter, Dr. Chih-Long Tsai, Dr. Stefan Rezanka, Markus Mutter, Dr.
Emine Bakan, Yang Liu and Dapeng Zhou for being my lovely colleagues. All the best!
I would also like to give my thanks to my sweet colleagues Kai Wilkner, Mark Kappertz, Ralf
Laufs, Ralf Steinert, Werner Herzhof, Bader Volker, Rainer Kriescher, Frank Vondahlen
especially Karl-Heinz, Rauwald for supporting me on my work in IEK-1. I am not able to finish
my work without them. All the best to all of you!
Many thanks to Iris Schönnneis-Vogel, Vicky Rostin, Hiltrud Moitroux, Stefan Weitz, and
especially Marianne Meyer to support me on my work. I appreciate it a lot!
I would like to express my deepest love to my eternal mom and wish to be your daughter the
next life again!!! My love to my father, my elder brother, my sister-in law and my little nephew,
you have no idea how much I love you all!
Many thanks to Dr. Jian He for your tolerance and your love. Best wishes to you and your future!
Thanks to all of you in IEK-1!

107
Yanli Zhang
● General Information Gender: Female Date of Birth: September 9th, 1986 Place of Birth: Shandong Province, China Tel: 13021168383 Citizenship: People’s Republic of China E-Mail: [email protected] ● Education Oct. 2012-Jan. 2016 PhD Material Engineering Forschungszentrum Jülich (FZJ)
Supervisor: Prof. Dr. Robert Vaßen ² Research field: Laser Cladding, ‘Smart’ Coatings.
Sep. 2009-Feb. 2012 Master Material Science Beihang University Supervisor: Prof. Hongbo Guo ² Research field: Thermal Spray Technique, Thermal Barrier Coatings, Electronic Beam
Physical Vapor Deposition. Sep. 2005-Jun. 2009 Bachelor Chemical Material University of Jinan
² Majors: Chemical Material, Physical Chemistry, Nanomaterials, Principles of Metals, Advanced Materials Processing Engineering, Material Corrosion and Protection, Mechanical Design…
● Researching Experiences Ø Development of In-situ Sensors for High Temperature Coatings
² The deposition of in-situ sensors (such as thermocouples, strain gauges) within Thermal Barrier coatings on the gas turbine engines to monitor its operating history, which is very significant to increase the life time of the coatings.
² One patent has been applied but still under argument. Ø National Natural Science Foundation of China
² The deposition of ceramic coatings with certain composition by electron beam physical vapour deposition (EB-PVD) method to test the thermal conductivity coefficient.
Ø Operation of the High Temperature Performance Laboratory ² To operate the instrument, including Differential Scanning Calorimetry (DSC), Thermogravimetry
(TG), Static Oxidation Instrument to make sure the smoothly running of the different experiments. Ø Influence of the Composition of Bond Coat to the Life Time of the Thermal Barrier Coatings
² The design of the composition, the oxidation and corrosion resistance experiments. ● Publications 1. Y. Zhang, R. Vassen, D. Mack, et al., Embedded sensors for high temperature coatings by laser cladding
technique, German Patent, PT 1.2663 PCT, 2014. 2. Y. Zhang, L. Guo, Y. Yang, et al. Influence of Gd2O3 and Yb2O3 co-doping on the phase stability,

108
thermo-physical properties and sintering of 8YSZ, Chinese Journal of Aeronautics, 25 (2012) 948-953. 3. J. He, H. Guo, Y. Zhang, et al., Improved hot-corrosion resistance of Si/Cr co-doped NiAlDy alloy in
simulative sea-based engine environment, Corrosion Science 85 (2014) 232-240.
● Key Skills
Ø Languages:Chinese, English and German (Elementary)
Ø Instruments: Laser (Cladding) Facility, Scanning Electron Microscope (SEM), X-ray Diffraction (XRD), Laser Thermal Conductivity Meter, Differential Scanning Calorimeter, Thermogravimetry…
● Hobbies
Ø Badminton, swimming.
Schriften des Forschungszentrums Jülich Reihe Energie & Umwelt / Energy & Environment
Band / Volume 299 Optical near-field investigations of photonic structures for application in silicon-based thin-film solar cells A. M. Ermes (2015), vi, 157 ppISBN: 978-3-95806-108-8
Band / Volume 300 Strom- und Gasmarktdesign zur Versorgung des deutschen Straßenverkehrs mit Wasserstoff M. Robinius (2015), VI, 255 ppISBN: 978-3-95806-110-1
Band / Volume 301 Alterung von Vakuum-plasmagespritzten MCrAlY-Schutzschichten und ihre Wechselwirkung mit Nickel- und Cobalt-basierten γ/γ’-Superlegierungen P. J. Terberger (2015), IX, 149 pp ISBN: 978-3-95806-113-2
Band / Volume 302 Verbundvorhaben ELFA Effiziente Luftfahrzeuge Brennstoffzellensysteme zur Energieerzeugung BREZEN – Teilprojekt: Kerosinaufbereitung R. Peters, J. Meißner, J. Pasel, R. C. Samsun, D. Stolten(2016), viii, 84 ppISBN: 978-3-95806-114-9
Band / Volume 303 Cavity-Ringdown-Spektroskopie zur Untersuchung der Rolle höherer Stickoxide für den nächtlichen Schadstoffabbau in der unteren Atmosphäre S. Schrade (2016), II, 118 ppISBN: 978-3-95806-116-3
Band / Volume 304 Thermo-mechanical Properties of Mixed Ionic-Electronic Conducting Membranes for Gas Separation V. K. Stournari (2016), 167 ppISBN: 978-3-95806-117-0
Band / Volume 305 Untersuchungen zu suspensionsplasmagespritzten Wärmedämmschichtsystemen N. Schlegel (2016), X, 136 ppISBN: 978-3-95806-118-7
Schriften des Forschungszentrums Jülich Reihe Energie & Umwelt / Energy & Environment
Band / Volume 306 Laser processing for the integrated series connection of thin-film silicon solar cells
B. Turan (2016), xii, 188 pp ISBN: 978-3-95806-119-4
Band / Volume 307 Development and Application of a Multiscale Model for the magnetic Fusion Edge Plasma Region F. Hasenbeck (2016), 190 pp ISBN: 978-3-95806-120-0 Band / Volume 308 Emissions of Biogenic Volatile Organic Compounds and Ozone Balance under Future Climate Conditions C. Wu (2016), VI, 105 pp ISBN: 978-3-95806-121-7 Band / Volume 309 Computerunterstützte Auslegung eines Brennstoffzellen-Batterie-Hybridsystems für die Bordstromversorgung C. Krupp (2016), iii, 207 pp ISBN: 978-3-95806-124-8 Band / Volume 310 Influence of H2O, HCl and H2S on the Release and Condensation of Trace Metals in Gasification M. Benito Abascal (2016), XIX, 172 pp ISBN: 978-3-95806-125-5 Band / Volume 311 Mechanical and Thermochemical Properties of Nano-structured Membranes for Gas Separation in Fossil-fired Power Plants J. Zhang (2016), II, 134 pp ISBN: 978-3-95806-126-2 Band / Volume 312 Development of Embedded Thermocouple Sensors for Thermal Barrier Coatings (TBCs) by a Laser Cladding Process Y. Zhang (2016), II, 108 pp ISBN: 978-3-95806-129-3 Weitere Schriften des Verlags im Forschungszentrum Jülich unter http://wwwzb1.fz-juelich.de/verlagextern1/index.asp


Energie & Umwelt / Energy & EnvironmentBand/ Volume 312ISBN 978-3-95806-129-3
Mem
ber
of th
e H
elm
holtz
Ass
ocia
tion
Energie & Umwelt / Energy & EnvironmentBand/ Volume 312ISBN 978-3-95806-129-3
Development of Embedded Thermocouple Sensors for Thermal Barrier Coatings (TBCs) by a Laser Cladding Process
Yanli Zhang
Copyright © 2022 FDOKUMEN