Pilot Study of Embedded IMU Sensors and Machine Learning ...
15
Citation: Léger, T.; Renaud, P.J.; Robbins, S.M.; Pearsall, D.J. Pilot Study of Embedded IMU Sensors and Machine Learning Algorithms for Automated Ice Hockey Stick Fitting. Sensors 2022, 22, 3419. https://doi.org/10.3390/s22093419 Academic Editor: Robert Crowther Received: 24 March 2022 Accepted: 27 April 2022 Published: 29 April 2022 Publisher’s Note: MDPI stays neutral with regard to jurisdictional claims in published maps and institutional affil- iations. Copyright: © 2022 by the authors. Licensee MDPI, Basel, Switzerland. This article is an open access article distributed under the terms and conditions of the Creative Commons Attribution (CC BY) license (https:// creativecommons.org/licenses/by/ 4.0/). sensors Article Pilot Study of Embedded IMU Sensors and Machine Learning Algorithms for Automated Ice Hockey Stick Fitting Taylor Léger 1 , Philippe J. Renaud 1 , Shawn M. Robbins 2 and David J. Pearsall 1, * 1 Department of Kinesiology and Physical Education, McGill Research Centre for Physical Activity and Health, McGill University, 475 Pine Avenue West, Montreal, QC H2W 1S4, Canada; [email protected] (T.L.); [email protected] (P.J.R.) 2 Centre for Interdisciplinary Research in Rehabilitation, Lethbridge-Layton-MacKay Rehabilitation Centre, the School of Physical and Occupational Therapy, McGill University, Montreal, QC H2W 1S4, Canada; [email protected] * Correspondence: [email protected]; Tel.: +1-514-398-4184 (ext. 0583) Abstract: The aims of this study were to evaluate the feasibility of using IMU sensors and machine learning algorithms for the instantaneous fitting of ice hockey sticks. Ten experienced hockey players performed 80 shots using four sticks of differing constructions (i.e., each stick differed in stiffness, blade pattern, or kick point). Custom IMUs were embedded in a pair of hockey gloves to capture resultant linear acceleration and angular velocity of the hands during shooting while an 18-camera optical motion capture system and retroreflective markers were used to identify key shot events and measure puck speed, accuracy, and contact time with the stick blade. MATLAB R2020a’s Machine Learning Toolbox was used to build and evaluate the performance of machine learning algorithms using principal components of the resultant hand kinematic signals using principal components accounting for 95% of the variability and a five-fold cross validation. Fine k-nearest neighbors algorithms were found to be highly accurate, correctly classifying players by optimal stick flex, blade pattern, and kick point with 90–98% accuracy for slap shots and 93–97% accuracy for wrist shots in fractions of a second. Based on these findings, it appears promising that wearable sensors and machine learning algorithms can be used for reliable, rapid, and portable hockey stick fitting. Keywords: wearable sensors; ice hockey; hockey stick; equipment fitting; automation; machine learning 1. Introduction Ice hockey sticks are a growing segment of the USD 850+ million hockey equipment market due to increasing global hockey participation and short product shelf life [1]. It is estimated that hockey sticks alone will reach a market value of USD 320 million by the end of 2025 [2]. Since players first began to modify their wooden sticks in the mid-20th century, the technologies, materials, and customizability of hockey sticks has improved greatly [3]. Today, players can purchase off the shelf sticks of various linear bending stiffnesses (“flex”), blade patterns (“curve” and “lie”), and dynamic flex profiles (“kick point”) with the rationale that different stick properties can enhance a player’s on-ice performance, such as shot speed, by “fitting” to their technique and/or style of play. During the shooting motion, the hockey stick functionally acts as a spring by releasing energy at a faster rate than it was previously stored, amplifying shot power. Research on the influence of stick flex on shooting performance to date has been conflicted; however, it appears that players should select their flex based on the way they load the hockey stick. Three possible stick “loading styles” have been reported in the literature. These are Constant Displacement, Constant Force, and Constant Energy [4,5]. In each loading style, a player affects a constant maximal deformation of the shaft, applies an identical level of force, or stores the same maximal amount of energy in the stick regardless of changes in shaft stiffness. At present, the exact origins of these disparate Sensors 2022, 22, 3419. https://doi.org/10.3390/s22093419 https://www.mdpi.com/journal/sensors
-
Upload
khangminh22 -
Category
Documents
-
view
3 -
download
0
Transcript of Pilot Study of Embedded IMU Sensors and Machine Learning ...
Citation: Léger, T.; Renaud, P.J.;
Robbins, S.M.; Pearsall, D.J. Pilot
Study of Embedded IMU Sensors
and Machine Learning Algorithms
for Automated Ice Hockey Stick
Fitting. Sensors 2022, 22, 3419.
https://doi.org/10.3390/s22093419
Academic Editor: Robert Crowther
Received: 24 March 2022
Accepted: 27 April 2022
Published: 29 April 2022
Publisher’s Note: MDPI stays neutral
with regard to jurisdictional claims in
published maps and institutional affil-
iations.
Copyright: © 2022 by the authors.
Licensee MDPI, Basel, Switzerland.
This article is an open access article
distributed under the terms and
conditions of the Creative Commons
Attribution (CC BY) license (https://
creativecommons.org/licenses/by/
4.0/).
sensors
Article
Pilot Study of Embedded IMU Sensors and Machine LearningAlgorithms for Automated Ice Hockey Stick FittingTaylor Léger 1, Philippe J. Renaud 1, Shawn M. Robbins 2 and David J. Pearsall 1,*
1 Department of Kinesiology and Physical Education, McGill Research Centre for Physical Activity and Health,McGill University, 475 Pine Avenue West, Montreal, QC H2W 1S4, Canada; [email protected] (T.L.);[email protected] (P.J.R.)
2 Centre for Interdisciplinary Research in Rehabilitation, Lethbridge-Layton-MacKay Rehabilitation Centre,the School of Physical and Occupational Therapy, McGill University, Montreal, QC H2W 1S4, Canada;[email protected]
* Correspondence: [email protected]; Tel.: +1-514-398-4184 (ext. 0583)
Abstract: The aims of this study were to evaluate the feasibility of using IMU sensors and machinelearning algorithms for the instantaneous fitting of ice hockey sticks. Ten experienced hockey playersperformed 80 shots using four sticks of differing constructions (i.e., each stick differed in stiffness,blade pattern, or kick point). Custom IMUs were embedded in a pair of hockey gloves to captureresultant linear acceleration and angular velocity of the hands during shooting while an 18-cameraoptical motion capture system and retroreflective markers were used to identify key shot events andmeasure puck speed, accuracy, and contact time with the stick blade. MATLAB R2020a’s MachineLearning Toolbox was used to build and evaluate the performance of machine learning algorithmsusing principal components of the resultant hand kinematic signals using principal componentsaccounting for 95% of the variability and a five-fold cross validation. Fine k-nearest neighborsalgorithms were found to be highly accurate, correctly classifying players by optimal stick flex, bladepattern, and kick point with 90–98% accuracy for slap shots and 93–97% accuracy for wrist shotsin fractions of a second. Based on these findings, it appears promising that wearable sensors andmachine learning algorithms can be used for reliable, rapid, and portable hockey stick fitting.
Keywords: wearable sensors; ice hockey; hockey stick; equipment fitting; automation; machine learning
1. Introduction
Ice hockey sticks are a growing segment of the USD 850+ million hockey equipmentmarket due to increasing global hockey participation and short product shelf life [1]. It isestimated that hockey sticks alone will reach a market value of USD 320 million by the endof 2025 [2]. Since players first began to modify their wooden sticks in the mid-20th century,the technologies, materials, and customizability of hockey sticks has improved greatly [3].Today, players can purchase off the shelf sticks of various linear bending stiffnesses (“flex”),blade patterns (“curve” and “lie”), and dynamic flex profiles (“kick point”) with therationale that different stick properties can enhance a player’s on-ice performance, such asshot speed, by “fitting” to their technique and/or style of play. During the shooting motion,the hockey stick functionally acts as a spring by releasing energy at a faster rate than it waspreviously stored, amplifying shot power.
Research on the influence of stick flex on shooting performance to date has beenconflicted; however, it appears that players should select their flex based on the way theyload the hockey stick. Three possible stick “loading styles” have been reported in theliterature. These are Constant Displacement, Constant Force, and Constant Energy [4,5]. Ineach loading style, a player affects a constant maximal deformation of the shaft, appliesan identical level of force, or stores the same maximal amount of energy in the stickregardless of changes in shaft stiffness. At present, the exact origins of these disparate
Sensors 2022, 22, 3419. https://doi.org/10.3390/s22093419 https://www.mdpi.com/journal/sensors
Sensors 2022, 22, 3419 2 of 15
stick loading styles remain unknown; however, there is evidence that such differencesmay arise due to differences in anthropometrics, kinematics, and levels of experience.For example, it is believed that larger, stronger players may be able to use a ConstantDisplacement model while weaker players may follow a Constant Force model [4]. Othershave proposed that players have adopted new shooting techniques to take advantage ofthe spring-like properties of modern carbon composite hockey sticks [3]. These theoriesare consistent with previous findings that stick stiffness may negatively affect the shotvelocities of younger [6] or female [7] players by preventing them from realizing the fullpower-amplifying benefits of the stick. These findings suggest that players should beprovided tailored recommendations of shaft stiffness based on their specific loading style.
Sticks are designed to have specific kick points to maximize specific shot performanceparameters, such as speed, accuracy, and quickness. Kick points are commonly referredto by the desired location of maximum deflection within the shaft. For example, a low-kick-point stick is most flexible at the bottom and increases in stiffness moving up theshaft while a high-kick-point stick is stiffest at the bottom. Published academic researchon the effect of stick dynamic flex profiles is scarce. However, it is generally believed thatlow-kick-point sticks assist with release quickness while high-kick-point sticks are best formaximizing stick bend and puck velocity [8].
Research on the effect of blade patterns has shown that flatter curves may enhanceshot speed by affecting the spatiotemporal characteristics of blade and stick loading duringthe slap shot [9]. This may occur due to systematically decreased lag between blade–toeand blade–heel ice contact similar to how advanced hockey players achieve higher puckspeeds by “pinning” the stick blade earlier and storing more strain potential energy in thestick [10]. In contrast, the very origin of blade curves was to provide players with addedlevels of puck control [11]. Mechanically, more “open” curves make it easier to apply lift tothe puck and consequently reach the upper net on forehand shots while a more pronouncedcurve and proper lie aid in puck control.
While hockey stick technologies have evolved drastically over the past twenty-fiveyears, the means to fit players for them have been much slower to change; players stillbuy sticks mainly in retail stores without much knowledge of which may work best forthem. The data-driven process of matching players with the best stick for them is called“stick fitting”. In recent years, with the incorporation of scanning technologies for hockeyequipment fitting in retail settings, demand has grown for systems that are able to fit playersquickly with little cost, floor space, or manpower required by the retailer. Previous researchhas shown that automated computer vision algorithms can evaluate shot performancemetrics with comparable accuracy to more expensive and cumbersome motion capturesystems [12]; however, the lengthy computation time (111 s/frame) makes it challenging toimplement this automated, low-cost technology in retail settings. Instead, many hockeyequipment retailers use 2D slow-motion video analysis apps, such as CCM Hockey’s StickFitter and Bauer Hockey’s Stick Studio, for stick fitting. No research has yet explored thecombination of embedded sensors and machine learning algorithms for the purpose ofautomating stick fitting, providing recommendations of stick parameters more rapidly toplayers based on objective measures of shooting performance.
The aim of this study was to evaluate the feasibility of using inertial measurementunit sensors (IMUs) and machine learning algorithms for the stick fitting of experiencedice hockey players. This was an exploratory study on the use of in-glove IMUs in ahockey shooting context; however, motivation was derived from previous studies thathave used kinematic signals obtained using IMUs and machine learning algorithms toclassify athletic movement patterns [13,14], including those specific to ice hockey [15,16]. Itwas hypothesized that differences in hand kinematics would be characteristic of differentresponses to stick flex, blade pattern, and kick point.
Sensors 2022, 22, 3419 3 of 15
2. Materials and Methods2.1. Participants
Ten experienced male ice hockey players were recruited for this study. Two participantshad experience at the Junior A level, five at the Canadian/American university level, andthree at the professional level (Table 1). All participants had played hockey in the pastcalendar year and were free of serious injuries at the time of data collection. Descriptivestatistics of the participants are provided in Table 1.
Table 1. Descriptive statistics of study participants.
Measure Mean ± SD
Age (yrs) 25.9 ± 4.9Height (m) 1.81 ± 0.07
Body Mass (kg) 88.5 ± 7.7Hockey Playing Experience (yrs) 20.3 ± 3.7
2.2. Instrumentation and Data Collection
Testing took place in the Biomechanics and Performance Analysis Lab at McGillUniversity’s Currie Gymnasium in Montreal, Quebec. Testing procedures were explainedin written and oral format to the participants, who then provided informed written consentprior to data collection.
An 18-camera Vicon optoelectronic system (Vicon, Oxford, UK) was used to capturethree-dimensional kinematics of the body, stick, and puck during testing. These datawere necessary to identify key shot events and calculate puck velocity (shot speed), radialerror from target center at net entry (shot accuracy), and contact time with the stick blade(shot quickness). The formula of Hancock et al. [17] was used to calculate radial error,where x represents the horizontal distance between the puck center and target center and zrepresents the vertical distance between the puck center and target center at net entry:
RE =√(x2 + z2). (1)
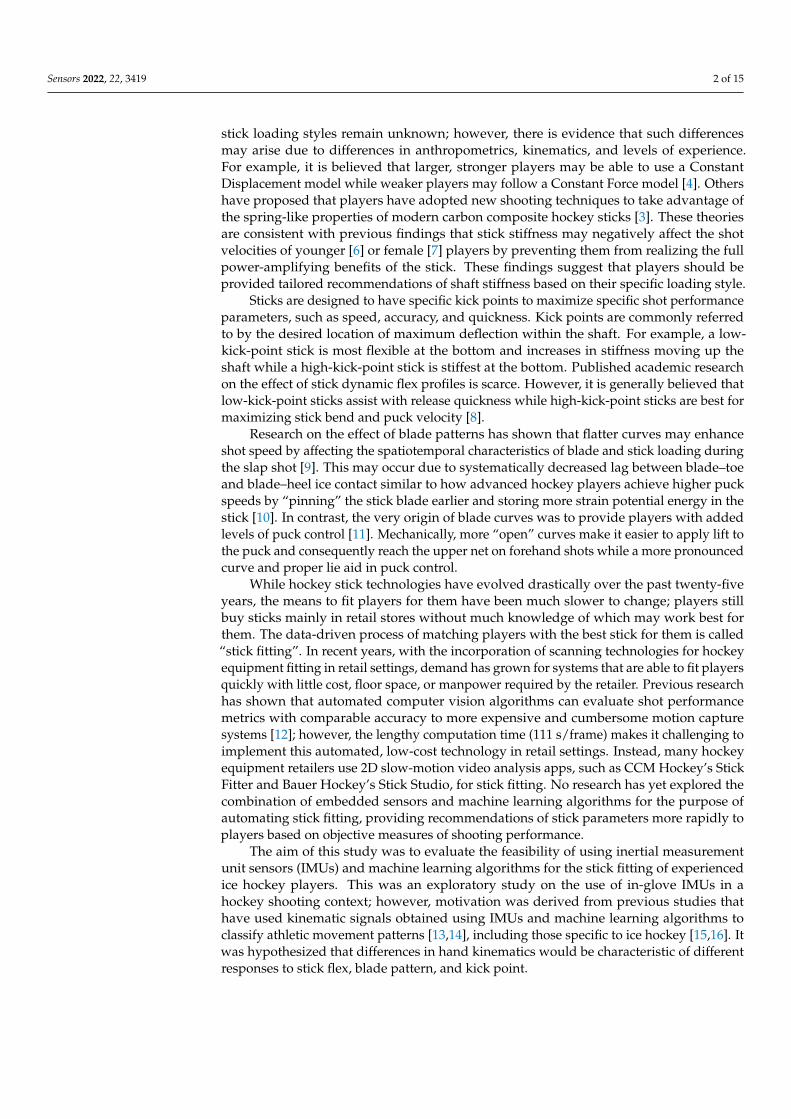
The Vicon system consisted of eight T10S, two T40S, four Vantage V5, and four Vero2.2 cameras, which were positioned on tripods of varying heights around a synthetic ice sur-face (Viking, Toronto, ON, Canada) (Figure 1), providing a capture volume approximately8.0 m long × 3.4 m wide × 2.0 m high. The cameras were connected to an MX Giganetconnection Hub and desktop computer (Nexus 2.6, Vicon, Oxford, UK) and recorded at asampling rate of 240 Hz.
Sensors 2022, 22, x FOR PEER REVIEW 3 of 16
2. Materials and Methods 2.1. Participants
Ten experienced male ice hockey players were recruited for this study. Two partici-pants had experience at the Junior A level, five at the Canadian/American university level, and three at the professional level (Table 1). All participants had played hockey in the past calendar year and were free of serious injuries at the time of data collection. Descriptive statistics of the participants are provided in Table 1.
Table 1. Descriptive statistics of study participants.
Measure Mean ± SD Age (yrs) 25.9 ± 4.9
Height (m) 1.81 ± 0.07 Body Mass (kg) 88.5 ± 7.7
Hockey Playing Experience (yrs) 20.3 ± 3.7
2.2. Instrumentation and Data Collection Testing took place in the Biomechanics and Performance Analysis Lab at McGill Uni-
versity’s Currie Gymnasium in Montreal, Quebec. Testing procedures were explained in written and oral format to the participants, who then provided informed written consent prior to data collection.
An 18-camera Vicon optoelectronic system (Vicon, Oxford, UK) was used to capture three-dimensional kinematics of the body, stick, and puck during testing. These data were necessary to identify key shot events and calculate puck velocity (shot speed), radial error from target center at net entry (shot accuracy), and contact time with the stick blade (shot quickness). The formula of Hancock et al. [17] was used to calculate radial error, where x represents the horizontal distance between the puck center and target center and z repre-sents the vertical distance between the puck center and target center at net entry: 𝑅𝐸 𝑥 𝑧 . (1)
The Vicon system consisted of eight T10S, two T40S, four Vantage V5, and four Vero 2.2 cameras, which were positioned on tripods of varying heights around a synthetic ice surface (Viking, Toronto, ON, Canada) (Figure 1), providing a capture volume approxi-mately 8.0 m long × 3.4 m wide × 2.0 m high. The cameras were connected to an MX Gi-ganet connection Hub and desktop computer (Nexus 2.6, Vicon, Oxford, UK) and rec-orded at a sampling rate of 240 Hz.
(a) (b)
Figure 1. Schematic of the Biomechanics and Performance Analysis Lab layout: (a) top view of the motion capture area during data collection; and (b) net view, including the 0.30 m circular target—suspended in the center of the net using rope—which participants aimed for during each trial.
Figure 1. Schematic of the Biomechanics and Performance Analysis Lab layout: (a) top view of themotion capture area during data collection; and (b) net view, including the 0.30 m circular target—suspended in the center of the net using rope—which participants aimed for during each trial.
Sensors 2022, 22, 3419 4 of 15
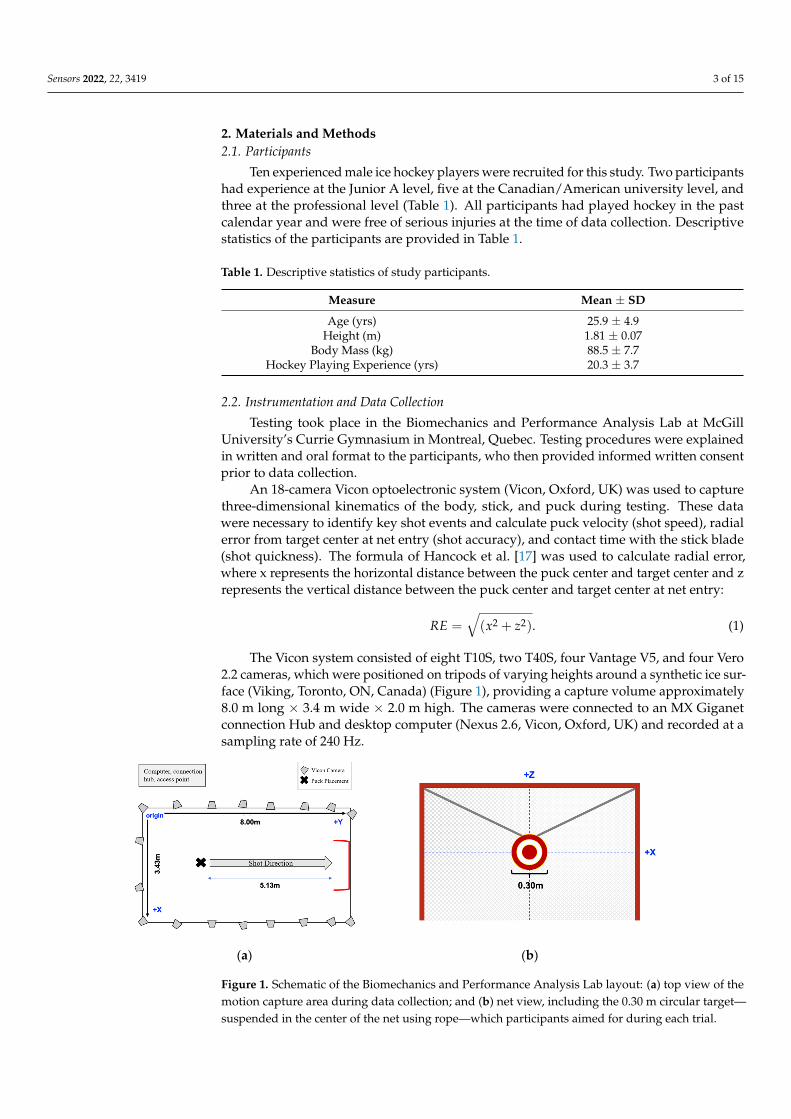
After obtaining informed written consent, anthropometric measurements were takenand participants were fitted with a full-body, tight-fitting Velcro suit (OptiTrack, Corvallis,OR, USA). Fifty-two spherical retroreflective markers with a diameter of 14 mm were placedon the participant in accordance with an adapted version of the Plug-in Gait full-bodymodel (Figure 2). Four markers were placed on the puck and ten along each stick (Figure 2)to measure puck and stick kinematics, respectively. An additional eight markers wereplaced along the posts and crossbar of the net to compute puck-to-target accuracy measures.
Sensors 2022, 22, x FOR PEER REVIEW 4 of 16
After obtaining informed written consent, anthropometric measurements were taken and participants were fitted with a full-body, tight-fitting Velcro suit (OptiTrack, Corval-lis, OR, USA). Fifty-two spherical retroreflective markers with a diameter of 14 mm were placed on the participant in accordance with an adapted version of the Plug-in Gait full-body model (Figure 2). Four markers were placed on the puck and ten along each stick (Figure 2) to measure puck and stick kinematics, respectively. An additional eight markers were placed along the posts and crossbar of the net to compute puck-to-target accuracy measures.
Figure 2. Reflective marker placement on gloves, stick, and puck for tracking by the Vicon system. B1–4 indicate markers used to define the movement of the stick blade during the shooting trials.
Prior to the start of testing, participants recorded a static calibration pose held by each participant for five seconds with the arms parallel with the floor and elbow bent to 90°. This calibration was required to determine the model of each participant’s initial co-ordinate system reference frame. After the static calibration trial was recorded, partici-pants were given time to warm-up and get accustomed to the synthetic ice surface by taking practice shots on the net.
Bespoke IMUs (Motsai Research, Saint-Bruno-de-Montarville, QC, Canada) were in-serted in an opening in the thumb segment of each glove during testing to capture con-current kinematics of the hands. This instrumentation configuration was chosen to ensure the IMU placement would not affect players’ shooting technique during data collection and could be easily replicated in a real-world fitting context. Data capture for the IMU system was initiated by a second researcher using a custom-built tablet application (Bauer Hockey Ltd., Blainville, QC, Canada) over Wi-Fi connection. The IMUs comprised an ac-celerometer capturing linear acceleration in gravitational units and a gyroscope capturing angular velocity in degrees per second at a rate of 200 Hz. Data collection was synchro-nized between the sensors and was triggered when either gyroscope signal passed a threshold of 4 degrees per second, recording for 199 frames.
2.3. Testing Protocol Testing consisted of 10 stationary wrist shots and 10 stationary slap shots with 4 dif-
ferent sticks for a total of 80 shots. Stick A was the “baseline” stick, and Sticks B-D varied from Stick A in bending stiffness, blade pattern, or dynamic bending profile, respectively (Table 2). The sticks were all uniform in length and were representative of those com-monly used by players of similar caliber. The sticks were devoid of graphics to blind par-ticipants to their differences.
At the beginning of each trial, participants stood adjacent to the puck placed 5.13 m away from the net. Participants did not receive specific instructions with respect to their technique but were asked to shoot like they normally would in a game from a stationary
Figure 2. Reflective marker placement on gloves, stick, and puck for tracking by the Vicon system.B1–4 indicate markers used to define the movement of the stick blade during the shooting trials.
Prior to the start of testing, participants recorded a static calibration pose held by eachparticipant for five seconds with the arms parallel with the floor and elbow bent to 90◦.This calibration was required to determine the model of each participant’s initial coordinatesystem reference frame. After the static calibration trial was recorded, participants weregiven time to warm-up and get accustomed to the synthetic ice surface by taking practiceshots on the net.
Bespoke IMUs (Motsai Research, Saint-Bruno-de-Montarville, QC, Canada) wereinserted in an opening in the thumb segment of each glove during testing to captureconcurrent kinematics of the hands. This instrumentation configuration was chosen toensure the IMU placement would not affect players’ shooting technique during datacollection and could be easily replicated in a real-world fitting context. Data capture for theIMU system was initiated by a second researcher using a custom-built tablet application(Bauer Hockey Ltd., Blainville, QC, Canada) over Wi-Fi connection. The IMUs comprised anaccelerometer capturing linear acceleration in gravitational units and a gyroscope capturingangular velocity in degrees per second at a rate of 200 Hz. Data collection was synchronizedbetween the sensors and was triggered when either gyroscope signal passed a threshold of4 degrees per second, recording for 199 frames.
2.3. Testing Protocol
Testing consisted of 10 stationary wrist shots and 10 stationary slap shots with 4 dif-ferent sticks for a total of 80 shots. Stick A was the “baseline” stick, and Sticks B-D variedfrom Stick A in bending stiffness, blade pattern, or dynamic bending profile, respectively(Table 2). The sticks were all uniform in length and were representative of those commonlyused by players of similar caliber. The sticks were devoid of graphics to blind participantsto their differences.
At the beginning of each trial, participants stood adjacent to the puck placed 5.13 maway from the net. Participants did not receive specific instructions with respect to theirtechnique but were asked to shoot like they normally would in a game from a stationaryposition and to strive for maximum velocity and accuracy, aiming at a 0.3 m-diametercircular target suspended from the center of the net crossbar (Figure 1).
Sensors 2022, 22, 3419 5 of 15
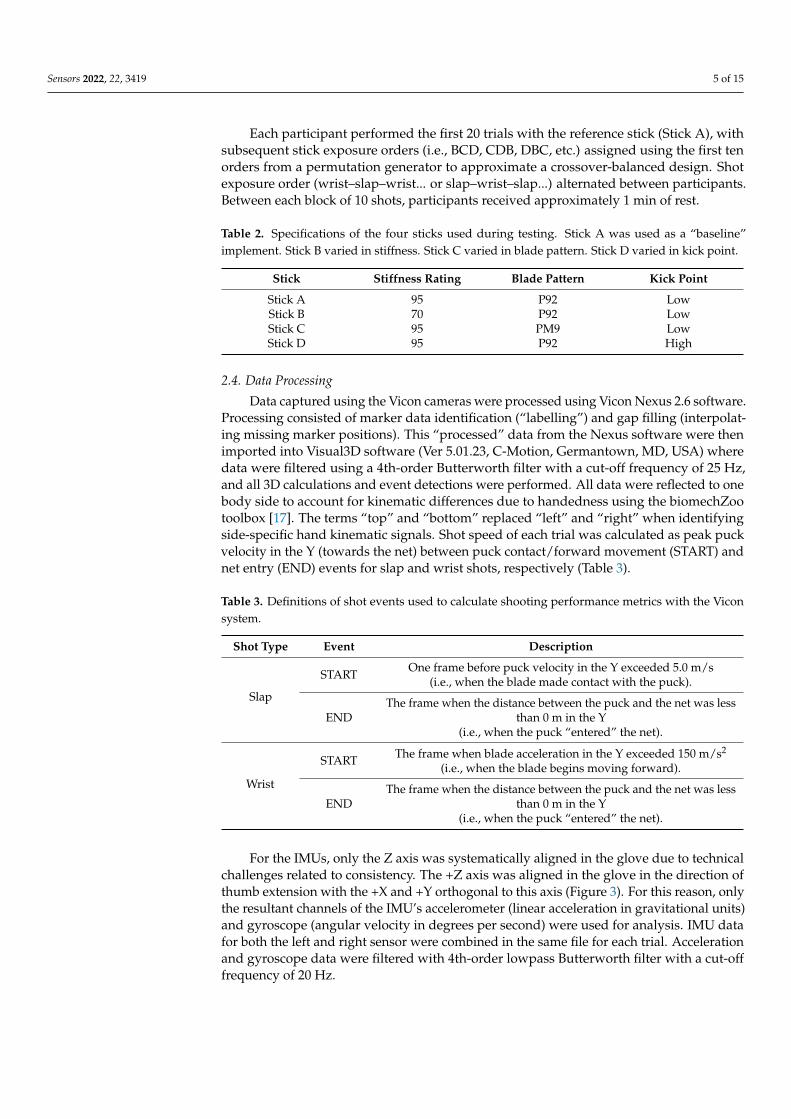
Each participant performed the first 20 trials with the reference stick (Stick A), withsubsequent stick exposure orders (i.e., BCD, CDB, DBC, etc.) assigned using the first tenorders from a permutation generator to approximate a crossover-balanced design. Shotexposure order (wrist–slap–wrist... or slap–wrist–slap...) alternated between participants.Between each block of 10 shots, participants received approximately 1 min of rest.
Table 2. Specifications of the four sticks used during testing. Stick A was used as a “baseline”implement. Stick B varied in stiffness. Stick C varied in blade pattern. Stick D varied in kick point.
Stick Stiffness Rating Blade Pattern Kick Point
Stick A 95 P92 LowStick B 70 P92 LowStick C 95 PM9 LowStick D 95 P92 High
2.4. Data Processing
Data captured using the Vicon cameras were processed using Vicon Nexus 2.6 software.Processing consisted of marker data identification (“labelling”) and gap filling (interpolat-ing missing marker positions). This “processed” data from the Nexus software were thenimported into Visual3D software (Ver 5.01.23, C-Motion, Germantown, MD, USA) wheredata were filtered using a 4th-order Butterworth filter with a cut-off frequency of 25 Hz,and all 3D calculations and event detections were performed. All data were reflected to onebody side to account for kinematic differences due to handedness using the biomechZootoolbox [17]. The terms “top” and “bottom” replaced “left” and “right” when identifyingside-specific hand kinematic signals. Shot speed of each trial was calculated as peak puckvelocity in the Y (towards the net) between puck contact/forward movement (START) andnet entry (END) events for slap and wrist shots, respectively (Table 3).
Table 3. Definitions of shot events used to calculate shooting performance metrics with the Viconsystem.
Shot Type Event Description
Slap
START One frame before puck velocity in the Y exceeded 5.0 m/s(i.e., when the blade made contact with the puck).
ENDThe frame when the distance between the puck and the net was less
than 0 m in the Y(i.e., when the puck “entered” the net).
Wrist
START The frame when blade acceleration in the Y exceeded 150 m/s2
(i.e., when the blade begins moving forward).
ENDThe frame when the distance between the puck and the net was less
than 0 m in the Y(i.e., when the puck “entered” the net).
For the IMUs, only the Z axis was systematically aligned in the glove due to technicalchallenges related to consistency. The +Z axis was aligned in the glove in the direction ofthumb extension with the +X and +Y orthogonal to this axis (Figure 3). For this reason, onlythe resultant channels of the IMU’s accelerometer (linear acceleration in gravitational units)and gyroscope (angular velocity in degrees per second) were used for analysis. IMU datafor both the left and right sensor were combined in the same file for each trial. Accelerationand gyroscope data were filtered with 4th-order lowpass Butterworth filter with a cut-offfrequency of 20 Hz.

Sensors 2022, 22, 3419 6 of 15Sensors 2022, 22, x FOR PEER REVIEW 6 of 16
(a) (b)
Figure 3. IMU axis alignment: (a) the +Z axis was orthogonal to the top surface of the IMU puck; and (b) the +Z was systematically aligned in the “thumbs up” direction of the glove; however, the direction of X and Y was not consistently maintained across testing.
All trials were inspected for completeness, data quality, and event placement prior to the statistical analysis. Vicon trials were removed if certain events were unable to be detected in Visual3D; for example, if the trial ended prematurely or stick or puck markers had fallen off or went undetected by the Vicon system (n = 43).
Since IMU trials did not have events, trials from this dataset were only omitted if they ended before the shooting motion had finished (n = 44). Due to differences in the causes of trial omission, the Vicon and IMU datasets were analyzed separately. Despite the fact they are of similar size, the datasets should not be confused as identical.
2.5. Model Training and Validation Three separate models were created for each channel to fit players for flex, blade pat-
tern, and kick point. Slap and wrist shot data were analyzed separately (3 stick parameters × 4 channels × 2 shot type = 24 models). The algorithms devised in this study were at-tempting to classify the responses of players’ shooting performance to stick flex, blade pattern, and kick point independently while each IMU channel provided different hand kinematic data throughout the shooting motion. Thus, the purpose of developing differ-ent sets of flex, blade pattern, and kick point models was to evaluate which IMU channel was best for each shot type and stick parameter combination.
Separate models were trained and tested on their ability to classify (i.e., fit) shooters using four different channels from the in-glove IMUs: 1. Top hand resultant linear acceleration (Top_A); 2. Top hand resultant angular velocity (Top_G); 3. Bottom hand resultant linear acceleration (Bottom_A); 4. Bottom hand resultant angular velocity (Bottom_G).
Three stick parameters were controlled in this study (flex, blade pattern, kick point). To determine a subject’s true class on each stick parameter, the shot speed of the stick that varied along that parameter (Stick B, Stick C, or Stick D, respectively) was compared to
Figure 3. IMU axis alignment: (a) the +Z axis was orthogonal to the top surface of the IMU puck;and (b) the +Z was systematically aligned in the “thumbs up” direction of the glove; however, thedirection of X and Y was not consistently maintained across testing.
All trials were inspected for completeness, data quality, and event placement priorto the statistical analysis. Vicon trials were removed if certain events were unable to bedetected in Visual3D; for example, if the trial ended prematurely or stick or puck markershad fallen off or went undetected by the Vicon system (n = 43).
Since IMU trials did not have events, trials from this dataset were only omitted if theyended before the shooting motion had finished (n = 44). Due to differences in the causes oftrial omission, the Vicon and IMU datasets were analyzed separately. Despite the fact theyare of similar size, the datasets should not be confused as identical.
2.5. Model Training and Validation
Three separate models were created for each channel to fit players for flex, bladepattern, and kick point. Slap and wrist shot data were analyzed separately (3 stick parame-ters × 4 channels × 2 shot type = 24 models). The algorithms devised in this study wereattempting to classify the responses of players’ shooting performance to stick flex, bladepattern, and kick point independently while each IMU channel provided different handkinematic data throughout the shooting motion. Thus, the purpose of developing differentsets of flex, blade pattern, and kick point models was to evaluate which IMU channel wasbest for each shot type and stick parameter combination.
Separate models were trained and tested on their ability to classify (i.e., fit) shootersusing four different channels from the in-glove IMUs:
1. Top hand resultant linear acceleration (Top_A);2. Top hand resultant angular velocity (Top_G);3. Bottom hand resultant linear acceleration (Bottom_A);4. Bottom hand resultant angular velocity (Bottom_G).
Three stick parameters were controlled in this study (flex, blade pattern, kick point).To determine a subject’s true class on each stick parameter, the shot speed of the stick thatvaried along that parameter (Stick B, Stick C, or Stick D, respectively) was compared to that

Sensors 2022, 22, 3419 7 of 15
of the reference stick (Stick A). True class values of stick fit—for training the algorithms andevaluating model accuracy—were based on the stick with higher mean shot speed to thenearest whole meter per second (m/s). For example, if a subject shot at least 1 m/s fasterwith Stick A (95 flex) than Stick B (70 flex), this subject would be considered a “high flexresponder”. Shot speed was chosen as the shooting performance metric to define true classbased on its prevalence in the literature [3–5,7,9,18,19] and its simplicity of measurement invarious settings (e.g., using a radar gun).
The inputs of each model were reduced from 199 data points to the 14 to 18 principalcomponents, or “features”, that explained 95% of the variability within the waveform data(Table 4). In other words, principal components—rather than complete waveforms—werethe features used to develop the algorithms. The features, in addition to true class values,were fed into MATLAB R2020a’s Machine Learning Toolbox, and prediction models werecreated using k-nearest neighbors (KNN) classification. Five-fold cross validation—such asthe principal components—was used to improve the generalizability of the models.
Table 4. Number of trials (n) and features (PC) used for each algorithm.
Shot Type Characteristic Top_A Top_G Bottom_A Bottom_G
Slap n 374 374 372 372PC 18 14 16 15
Wristn 380 380 380 380
PC 15 15 16 15
For all models, standardized data, a Euclidean distance metric, equal distance weight,and a default misclassification cost matrix were used, and hyper-parametrization wasdisabled.
Model performance was evaluated primarily on classification accuracy (high beingpreferable) and secondarily on computation time (low being preferable) after the fifth foldof cross-validation was used to compare performance between models.
3. Results3.1. Shooting Performance Variables
One-way ANOVAs revealed significant differences (α < 0.05) in slap shot blade contacttime between sticks (F(3.36) = 3.66, p = 0.021, ηp
2 = 0.234), but not for slap shot speed(F(3.36) = 0.032, p = 0.992, ηp
2 = 0.002) nor accuracy (F(3.36) = 2.33, p = 0.091, ηp2 = 0.162)
(Table 5). A Tukey–Kramer post hoc test showed contact time to be significantly shorter forStick D compared to Stick B (Figure 4).
Table 5. Ensemble average speed, accuracy, and release quickness metrics with each stick for slapand wrist shots ± SD (n = 10).
Shot Type Performance Metric Stick A Stick B Stick C Stick D
SlapSpeed (m/s) 31.7 ± 2.2 31.8 ± 1.9 31.9 ± 1.7 32.0 ± 1.8
Radial Error (m) 0.296 ± 0.166 0.282 ± 0.138 0.321 ± 0.157 0.224 ± 0.129Contact Time (ms) 51 ± 4 53 ± 5 52 ± 4 50 ± 4
WristSpeed (m/s) 27.7 ± 1.6 27.9 ± 1.4 27.6 ± 1.5 27.4 ± 1.4
Radial Error (m) 0.171 ± 0.089 0.177 ± 0.089 0.224 ± 0.138 0.159 ± 0.090Contact Time (ms) 103 ± 12 107 ± 13 104 ± 12 104 ± 13
Sensors 2022, 22, 3419 8 of 15Sensors 2022, 22, x FOR PEER REVIEW 8 of 16
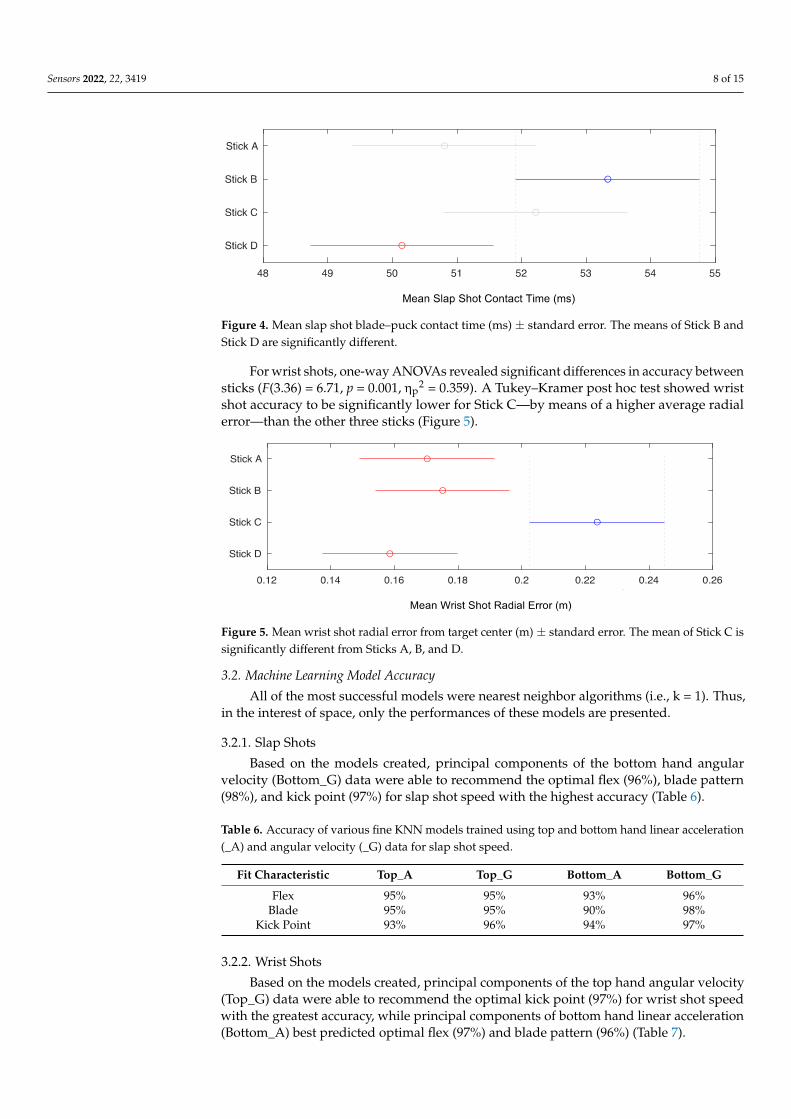
Figure 4. Mean slap shot blade–puck contact time (ms) ± standard error. The means of Stick B and Stick D are significantly different.
For wrist shots, one-way ANOVAs revealed significant differences in accuracy be-tween sticks (F(3.36) = 6.71, p = 0.001, ηp2 = 0.359). A Tukey–Kramer post hoc test showed wrist shot accuracy to be significantly lower for Stick C—by means of a higher average radial error—than the other three sticks (Figure 5).
Figure 5. Mean wrist shot radial error from target center (m) ± standard error. The mean of Stick C is significantly different from Sticks A, B, and D.
3.2. Machine Learning Model Accuracy All of the most successful models were nearest neighbor algorithms (i.e., k = 1). Thus,
in the interest of space, only the performances of these models are presented.
3.2.1. Slap Shots Based on the models created, principal components of the bottom hand angular ve-
locity (Bottom_G) data were able to recommend the optimal flex (96%), blade pattern (98%), and kick point (97%) for slap shot speed with the highest accuracy (Table 6).
Table 6. Accuracy of various fine KNN models trained using top and bottom hand linear accelera-tion (_A) and angular velocity (_G) data for slap shot speed.
Fit Characteristic Top_A Top_G Bottom_A Bottom_G Flex 95% 95% 93% 96%
Blade 95% 95% 90% 98% Kick Point 93% 96% 94% 97%
Figure 4. Mean slap shot blade–puck contact time (ms) ± standard error. The means of Stick B andStick D are significantly different.
For wrist shots, one-way ANOVAs revealed significant differences in accuracy betweensticks (F(3.36) = 6.71, p = 0.001, ηp
2 = 0.359). A Tukey–Kramer post hoc test showed wristshot accuracy to be significantly lower for Stick C—by means of a higher average radialerror—than the other three sticks (Figure 5).
Sensors 2022, 22, x FOR PEER REVIEW 8 of 16
Figure 4. Mean slap shot blade–puck contact time (ms) ± standard error. The means of Stick B and Stick D are significantly different.
For wrist shots, one-way ANOVAs revealed significant differences in accuracy be-tween sticks (F(3.36) = 6.71, p = 0.001, ηp2 = 0.359). A Tukey–Kramer post hoc test showed wrist shot accuracy to be significantly lower for Stick C—by means of a higher average radial error—than the other three sticks (Figure 5).
Figure 5. Mean wrist shot radial error from target center (m) ± standard error. The mean of Stick C is significantly different from Sticks A, B, and D.
3.2. Machine Learning Model Accuracy All of the most successful models were nearest neighbor algorithms (i.e., k = 1). Thus,
in the interest of space, only the performances of these models are presented.
3.2.1. Slap Shots Based on the models created, principal components of the bottom hand angular ve-
locity (Bottom_G) data were able to recommend the optimal flex (96%), blade pattern (98%), and kick point (97%) for slap shot speed with the highest accuracy (Table 6).
Table 6. Accuracy of various fine KNN models trained using top and bottom hand linear accelera-tion (_A) and angular velocity (_G) data for slap shot speed.
Fit Characteristic Top_A Top_G Bottom_A Bottom_G Flex 95% 95% 93% 96%
Blade 95% 95% 90% 98% Kick Point 93% 96% 94% 97%
Figure 5. Mean wrist shot radial error from target center (m) ± standard error. The mean of Stick C issignificantly different from Sticks A, B, and D.
3.2. Machine Learning Model Accuracy
All of the most successful models were nearest neighbor algorithms (i.e., k = 1). Thus,in the interest of space, only the performances of these models are presented.
3.2.1. Slap Shots
Based on the models created, principal components of the bottom hand angularvelocity (Bottom_G) data were able to recommend the optimal flex (96%), blade pattern(98%), and kick point (97%) for slap shot speed with the highest accuracy (Table 6).
Table 6. Accuracy of various fine KNN models trained using top and bottom hand linear acceleration(_A) and angular velocity (_G) data for slap shot speed.
Fit Characteristic Top_A Top_G Bottom_A Bottom_G
Flex 95% 95% 93% 96%Blade 95% 95% 90% 98%
Kick Point 93% 96% 94% 97%
3.2.2. Wrist Shots
Based on the models created, principal components of the top hand angular velocity(Top_G) data were able to recommend the optimal kick point (97%) for wrist shot speedwith the greatest accuracy, while principal components of bottom hand linear acceleration(Bottom_A) best predicted optimal flex (97%) and blade pattern (96%) (Table 7).
Sensors 2022, 22, 3419 9 of 15
Table 7. Accuracy of various fine KNN models trained using top and bottom hand linear acceleration(_A) and angular velocity (_G) data for wrist shot speed.
Fit Characteristic Top_A Top_G Bottom_A Bottom_G
Flex 93% 95% 97% 96%Blade 93% 93% 96% 95%
Kick Point 94% 97% 96% 94%
3.3. Classification Confusion Matrices3.3.1. Slap Shots
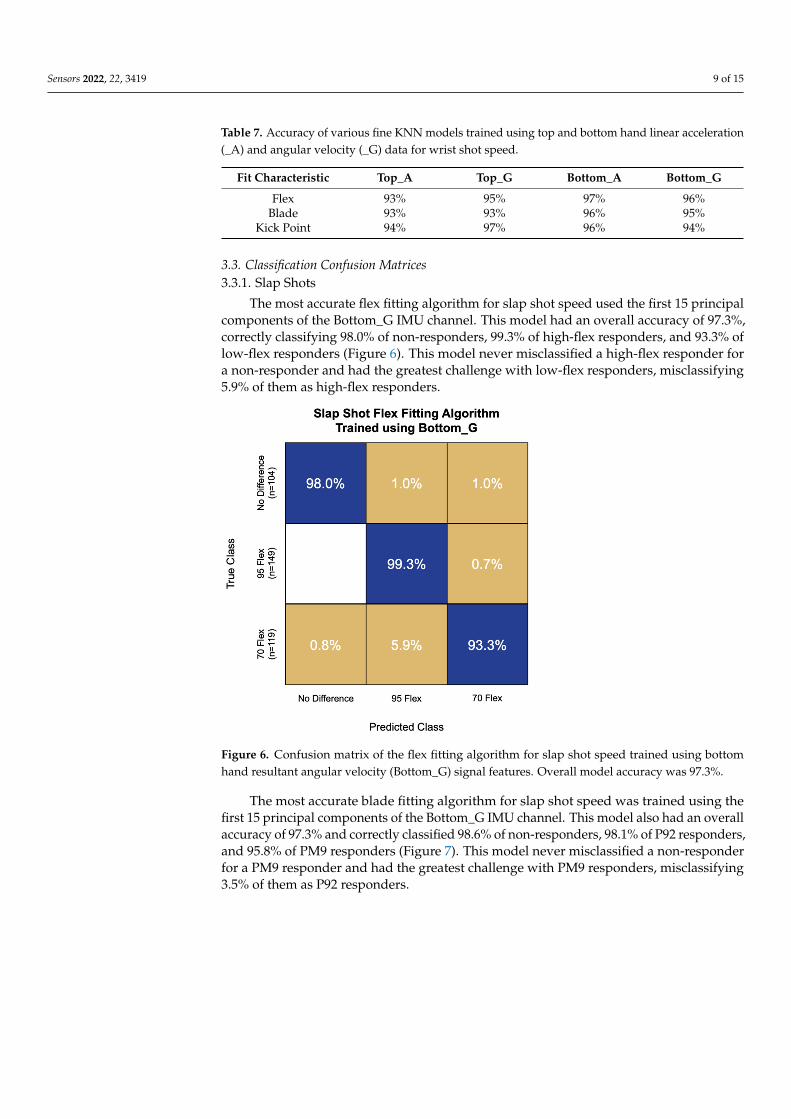
The most accurate flex fitting algorithm for slap shot speed used the first 15 principalcomponents of the Bottom_G IMU channel. This model had an overall accuracy of 97.3%,correctly classifying 98.0% of non-responders, 99.3% of high-flex responders, and 93.3% oflow-flex responders (Figure 6). This model never misclassified a high-flex responder fora non-responder and had the greatest challenge with low-flex responders, misclassifying5.9% of them as high-flex responders.
Sensors 2022, 22, x FOR PEER REVIEW 9 of 16
3.2.2. Wrist Shots Based on the models created, principal components of the top hand angular velocity
(Top_G) data were able to recommend the optimal kick point (97%) for wrist shot speed with the greatest accuracy, while principal components of bottom hand linear acceleration (Bottom_A) best predicted optimal flex (97%) and blade pattern (96%) (Table 7).
Table 7. Accuracy of various fine KNN models trained using top and bottom hand linear accelera-tion (_A) and angular velocity (_G) data for wrist shot speed.
Fit Characteristic Top_A Top_G Bottom_A Bottom_G Flex 93% 95% 97% 96%
Blade 93% 93% 96% 95% Kick Point 94% 97% 96% 94%
3.3. Classification Confusion Matrices 3.3.1. Slap Shots
The most accurate flex fitting algorithm for slap shot speed used the first 15 principal components of the Bottom_G IMU channel. This model had an overall accuracy of 97.3%, correctly classifying 98.0% of non-responders, 99.3% of high-flex responders, and 93.3% of low-flex responders (Figure 6). This model never misclassified a high-flex responder for a non-responder and had the greatest challenge with low-flex responders, misclassify-ing 5.9% of them as high-flex responders.
Figure 6. Confusion matrix of the flex fitting algorithm for slap shot speed trained using bottom hand resultant angular velocity (Bottom_G) signal features. Overall model accuracy was 97.3%.
The most accurate blade fitting algorithm for slap shot speed was trained using the first 15 principal components of the Bottom_G IMU channel. This model also had an over-all accuracy of 97.3% and correctly classified 98.6% of non-responders, 98.1% of P92 re-sponders, and 95.8% of PM9 responders (Figure 7). This model never misclassified a non-responder for a PM9 responder and had the greatest challenge with PM9 responders, mis-classifying 3.5% of them as P92 responders.
Figure 6. Confusion matrix of the flex fitting algorithm for slap shot speed trained using bottomhand resultant angular velocity (Bottom_G) signal features. Overall model accuracy was 97.3%.
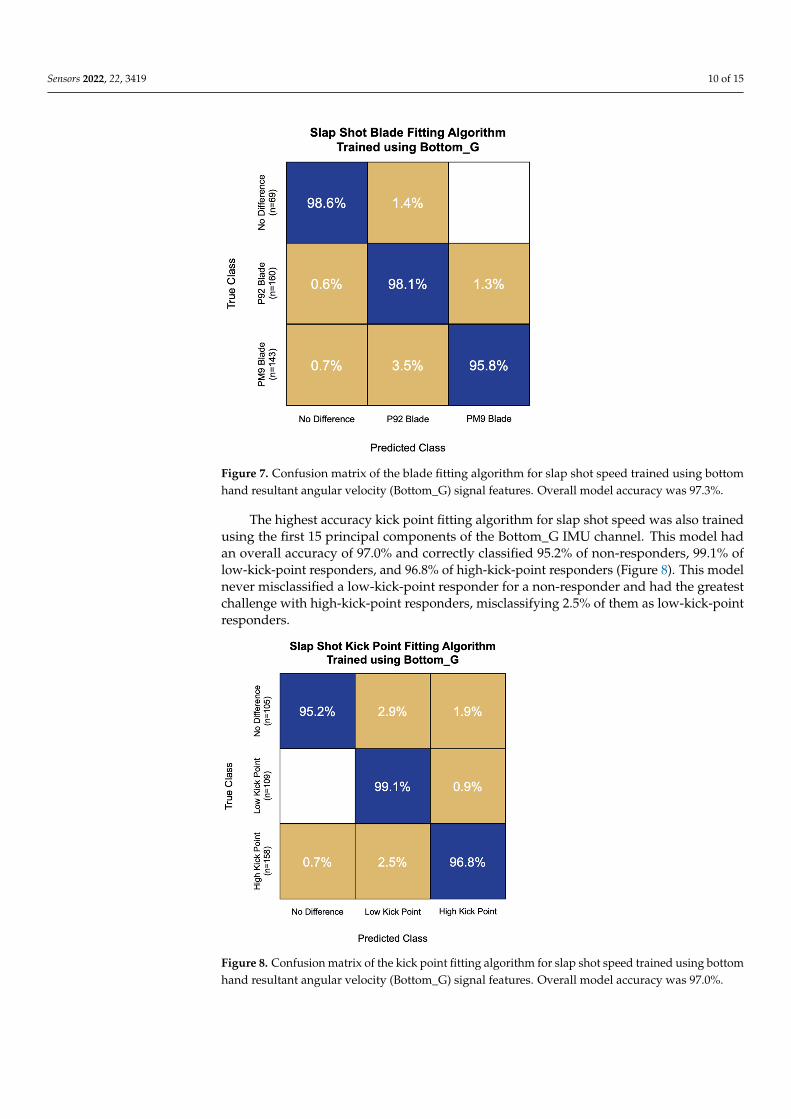
The most accurate blade fitting algorithm for slap shot speed was trained using thefirst 15 principal components of the Bottom_G IMU channel. This model also had an overallaccuracy of 97.3% and correctly classified 98.6% of non-responders, 98.1% of P92 responders,and 95.8% of PM9 responders (Figure 7). This model never misclassified a non-responderfor a PM9 responder and had the greatest challenge with PM9 responders, misclassifying3.5% of them as P92 responders.
Sensors 2022, 22, 3419 10 of 15Sensors 2022, 22, x FOR PEER REVIEW 10 of 16
Figure 7. Confusion matrix of the blade fitting algorithm for slap shot speed trained using bottom hand resultant angular velocity (Bottom_G) signal features. Overall model accuracy was 97.3%.
The highest accuracy kick point fitting algorithm for slap shot speed was also trained using the first 15 principal components of the Bottom_G IMU channel. This model had an overall accuracy of 97.0% and correctly classified 95.2% of non-responders, 99.1% of low-kick-point responders, and 96.8% of high-kick-point responders (Figure 8). This model never misclassified a low-kick-point responder for a non-responder and had the greatest challenge with high-kick-point responders, misclassifying 2.5% of them as low-kick-point responders.
Figure 7. Confusion matrix of the blade fitting algorithm for slap shot speed trained using bottomhand resultant angular velocity (Bottom_G) signal features. Overall model accuracy was 97.3%.
The highest accuracy kick point fitting algorithm for slap shot speed was also trainedusing the first 15 principal components of the Bottom_G IMU channel. This model hadan overall accuracy of 97.0% and correctly classified 95.2% of non-responders, 99.1% oflow-kick-point responders, and 96.8% of high-kick-point responders (Figure 8). This modelnever misclassified a low-kick-point responder for a non-responder and had the greatestchallenge with high-kick-point responders, misclassifying 2.5% of them as low-kick-pointresponders.
Sensors 2022, 22, x FOR PEER REVIEW 11 of 16
Figure 8. Confusion matrix of the kick point fitting algorithm for slap shot speed trained using bot-tom hand resultant angular velocity (Bottom_G) signal features. Overall model accuracy was 97.0%.
3.3.2. Wrist Shots The highest accuracy flex fitting algorithm for wrist shot speed was trained using the
first 16 principal components of the Bottom_A IMU channel. This model had an overall accuracy of 96.1% and correctly classified 97.9% of non-responders, 92.4% of high-flex re-sponders, and 95.6% of low-flex responders (Figure 9).
Figure 9. Confusion matrix of the flex fitting algorithm for wrist shot speed trained using bottom hand resultant linear acceleration (Bottom_A) signal features. Overall model accuracy was 96.1%.
In addition, the most accurate blade fitting algorithm for wrist shot speed was trained using the first 16 principal components of the Bottom_A IMU channel. This model had an
Figure 8. Confusion matrix of the kick point fitting algorithm for slap shot speed trained using bottomhand resultant angular velocity (Bottom_G) signal features. Overall model accuracy was 97.0%.

Sensors 2022, 22, 3419 11 of 15
3.3.2. Wrist Shots
The highest accuracy flex fitting algorithm for wrist shot speed was trained using thefirst 16 principal components of the Bottom_A IMU channel. This model had an overallaccuracy of 96.1% and correctly classified 97.9% of non-responders, 92.4% of high-flexresponders, and 95.6% of low-flex responders (Figure 9).
Sensors 2022, 22, x FOR PEER REVIEW 11 of 16
Figure 8. Confusion matrix of the kick point fitting algorithm for slap shot speed trained using bot-tom hand resultant angular velocity (Bottom_G) signal features. Overall model accuracy was 97.0%.
3.3.2. Wrist Shots The highest accuracy flex fitting algorithm for wrist shot speed was trained using the
first 16 principal components of the Bottom_A IMU channel. This model had an overall accuracy of 96.1% and correctly classified 97.9% of non-responders, 92.4% of high-flex re-sponders, and 95.6% of low-flex responders (Figure 9).
Figure 9. Confusion matrix of the flex fitting algorithm for wrist shot speed trained using bottom hand resultant linear acceleration (Bottom_A) signal features. Overall model accuracy was 96.1%.
In addition, the most accurate blade fitting algorithm for wrist shot speed was trained using the first 16 principal components of the Bottom_A IMU channel. This model had an
Figure 9. Confusion matrix of the flex fitting algorithm for wrist shot speed trained using bottomhand resultant linear acceleration (Bottom_A) signal features. Overall model accuracy was 96.1%.
In addition, the most accurate blade fitting algorithm for wrist shot speed was trainedusing the first 16 principal components of the Bottom_A IMU channel. This model hadan overall accuracy of 95.3% and correctly classified 97.2% of non-responders, 95.8% ofP92 responders, and 92.4% of PM9 responders (Figure 10). This model had the greatestchallenge with PM9 responders, misclassifying 5.0% of them as P92 responders.
Sensors 2022, 22, x FOR PEER REVIEW 12 of 16
overall accuracy of 95.3% and correctly classified 97.2% of non-responders, 95.8% of P92 responders, and 92.4% of PM9 responders (Figure 10). This model had the greatest chal-lenge with PM9 responders, misclassifying 5.0% of them as P92 responders.
Figure 10. Confusion matrix of the blade fitting algorithm for wrist shot speed trained using bottom hand linear acceleration (Bottom_A) signal features. Overall model accuracy was 95.3%.
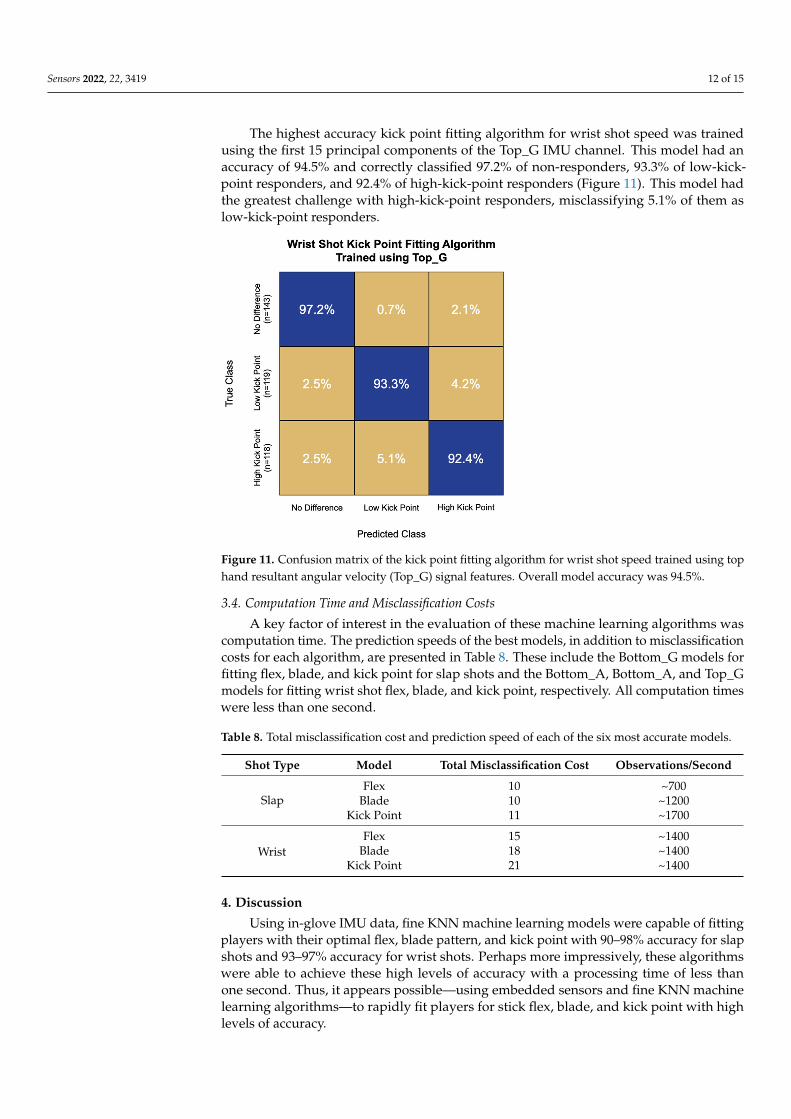
The highest accuracy kick point fitting algorithm for wrist shot speed was trained using the first 15 principal components of the Top_G IMU channel. This model had an accuracy of 94.5% and correctly classified 97.2% of non-responders, 93.3% of low-kick-point responders, and 92.4% of high-kick-point responders (Figure 11). This model had the greatest challenge with high-kick-point responders, misclassifying 5.1% of them as low-kick-point responders.
Figure 11. Confusion matrix of the kick point fitting algorithm for wrist shot speed trained using top hand resultant angular velocity (Top_G) signal features. Overall model accuracy was 94.5%.
Figure 10. Confusion matrix of the blade fitting algorithm for wrist shot speed trained using bottomhand linear acceleration (Bottom_A) signal features. Overall model accuracy was 95.3%.
Sensors 2022, 22, 3419 12 of 15
The highest accuracy kick point fitting algorithm for wrist shot speed was trainedusing the first 15 principal components of the Top_G IMU channel. This model had anaccuracy of 94.5% and correctly classified 97.2% of non-responders, 93.3% of low-kick-point responders, and 92.4% of high-kick-point responders (Figure 11). This model hadthe greatest challenge with high-kick-point responders, misclassifying 5.1% of them aslow-kick-point responders.
Sensors 2022, 22, x FOR PEER REVIEW 12 of 16
overall accuracy of 95.3% and correctly classified 97.2% of non-responders, 95.8% of P92 responders, and 92.4% of PM9 responders (Figure 10). This model had the greatest chal-lenge with PM9 responders, misclassifying 5.0% of them as P92 responders.
Figure 10. Confusion matrix of the blade fitting algorithm for wrist shot speed trained using bottom hand linear acceleration (Bottom_A) signal features. Overall model accuracy was 95.3%.
The highest accuracy kick point fitting algorithm for wrist shot speed was trained using the first 15 principal components of the Top_G IMU channel. This model had an accuracy of 94.5% and correctly classified 97.2% of non-responders, 93.3% of low-kick-point responders, and 92.4% of high-kick-point responders (Figure 11). This model had the greatest challenge with high-kick-point responders, misclassifying 5.1% of them as low-kick-point responders.
Figure 11. Confusion matrix of the kick point fitting algorithm for wrist shot speed trained using top hand resultant angular velocity (Top_G) signal features. Overall model accuracy was 94.5%. Figure 11. Confusion matrix of the kick point fitting algorithm for wrist shot speed trained using tophand resultant angular velocity (Top_G) signal features. Overall model accuracy was 94.5%.
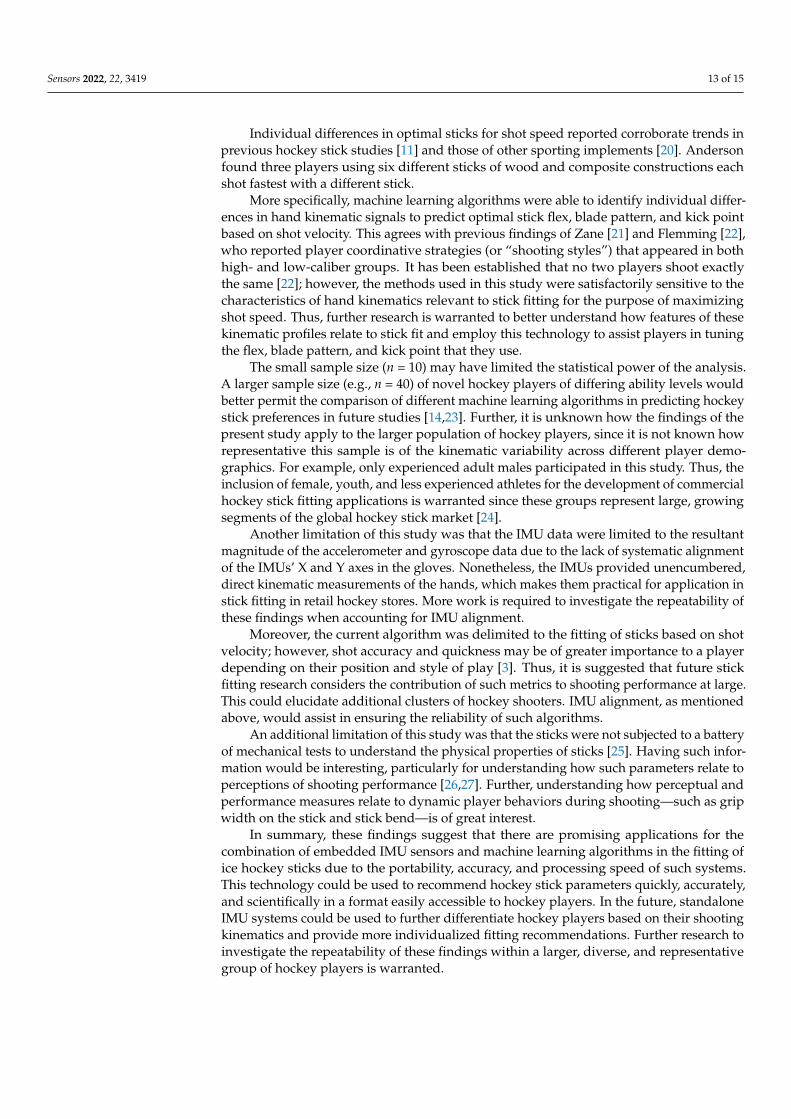
3.4. Computation Time and Misclassification Costs
A key factor of interest in the evaluation of these machine learning algorithms wascomputation time. The prediction speeds of the best models, in addition to misclassificationcosts for each algorithm, are presented in Table 8. These include the Bottom_G models forfitting flex, blade, and kick point for slap shots and the Bottom_A, Bottom_A, and Top_Gmodels for fitting wrist shot flex, blade, and kick point, respectively. All computation timeswere less than one second.
Table 8. Total misclassification cost and prediction speed of each of the six most accurate models.
Shot Type Model Total Misclassification Cost Observations/Second
SlapFlex 10 ~700
Blade 10 ~1200Kick Point 11 ~1700
WristFlex 15 ~1400
Blade 18 ~1400Kick Point 21 ~1400
4. Discussion
Using in-glove IMU data, fine KNN machine learning models were capable of fittingplayers with their optimal flex, blade pattern, and kick point with 90–98% accuracy for slapshots and 93–97% accuracy for wrist shots. Perhaps more impressively, these algorithmswere able to achieve these high levels of accuracy with a processing time of less thanone second. Thus, it appears possible—using embedded sensors and fine KNN machinelearning algorithms—to rapidly fit players for stick flex, blade, and kick point with highlevels of accuracy.
Sensors 2022, 22, 3419 13 of 15
Individual differences in optimal sticks for shot speed reported corroborate trends inprevious hockey stick studies [11] and those of other sporting implements [20]. Andersonfound three players using six different sticks of wood and composite constructions eachshot fastest with a different stick.
More specifically, machine learning algorithms were able to identify individual differ-ences in hand kinematic signals to predict optimal stick flex, blade pattern, and kick pointbased on shot velocity. This agrees with previous findings of Zane [21] and Flemming [22],who reported player coordinative strategies (or “shooting styles”) that appeared in bothhigh- and low-caliber groups. It has been established that no two players shoot exactlythe same [22]; however, the methods used in this study were satisfactorily sensitive to thecharacteristics of hand kinematics relevant to stick fitting for the purpose of maximizingshot speed. Thus, further research is warranted to better understand how features of thesekinematic profiles relate to stick fit and employ this technology to assist players in tuningthe flex, blade pattern, and kick point that they use.
The small sample size (n = 10) may have limited the statistical power of the analysis.A larger sample size (e.g., n = 40) of novel hockey players of differing ability levels wouldbetter permit the comparison of different machine learning algorithms in predicting hockeystick preferences in future studies [14,23]. Further, it is unknown how the findings of thepresent study apply to the larger population of hockey players, since it is not known howrepresentative this sample is of the kinematic variability across different player demo-graphics. For example, only experienced adult males participated in this study. Thus, theinclusion of female, youth, and less experienced athletes for the development of commercialhockey stick fitting applications is warranted since these groups represent large, growingsegments of the global hockey stick market [24].
Another limitation of this study was that the IMU data were limited to the resultantmagnitude of the accelerometer and gyroscope data due to the lack of systematic alignmentof the IMUs’ X and Y axes in the gloves. Nonetheless, the IMUs provided unencumbered,direct kinematic measurements of the hands, which makes them practical for application instick fitting in retail hockey stores. More work is required to investigate the repeatability ofthese findings when accounting for IMU alignment.
Moreover, the current algorithm was delimited to the fitting of sticks based on shotvelocity; however, shot accuracy and quickness may be of greater importance to a playerdepending on their position and style of play [3]. Thus, it is suggested that future stickfitting research considers the contribution of such metrics to shooting performance at large.This could elucidate additional clusters of hockey shooters. IMU alignment, as mentionedabove, would assist in ensuring the reliability of such algorithms.
An additional limitation of this study was that the sticks were not subjected to a batteryof mechanical tests to understand the physical properties of sticks [25]. Having such infor-mation would be interesting, particularly for understanding how such parameters relate toperceptions of shooting performance [26,27]. Further, understanding how perceptual andperformance measures relate to dynamic player behaviors during shooting—such as gripwidth on the stick and stick bend—is of great interest.
In summary, these findings suggest that there are promising applications for thecombination of embedded IMU sensors and machine learning algorithms in the fitting ofice hockey sticks due to the portability, accuracy, and processing speed of such systems.This technology could be used to recommend hockey stick parameters quickly, accurately,and scientifically in a format easily accessible to hockey players. In the future, standaloneIMU systems could be used to further differentiate hockey players based on their shootingkinematics and provide more individualized fitting recommendations. Further research toinvestigate the repeatability of these findings within a larger, diverse, and representativegroup of hockey players is warranted.
Sensors 2022, 22, 3419 14 of 15
5. Conclusions
Fine k-nearest neighbors machine learning models were capable of fitting playerswith their optimal flex, blade pattern, and kick point with 90–98% accuracy for slap shotsand 93–97% accuracy for wrist shots using select principal components of in-glove IMUdata. Perhaps more impressively, these algorithms were able to achieve these high levels ofaccuracy with a processing time of less than one second.
The above results demonstrate the potential of using embedded IMU sensors trackinghand kinematics and machine learning algorithms to accurately fit individuals for stickflex, blade pattern, and kick point. Similar research to this study should be conducted witha greater number of sticks with more subtle differences in flex, blade patterns, and kickpoints and a larger pool of hockey players of differing backgrounds to further validate thefindings of this study. This study could be further supplemented through the capture ofshooting performance and stick perception data in retail and on-ice settings using simplifiedobjective measurement instruments (i.e., a radar gun).
Although it appears that players do not change their shooting style when usingsticks of different flexes in the short run, it is not known how stable these gross kinematicpatterns are and whether they would yield consistent values under test–retest conditions.Additionally, it is not yet known how habitual exposure to sticks of different flex, blade,and kick point properties affect shooting technique. Studies aimed at the repeat exposureand measurement of kinematics in response to sticks with different properties shouldbe conducted.
Author Contributions: T.L. contributed to the formal analysis, investigation, resources, data curation,writing—original draft preparation, writing—review and editing, and visualization of the project.P.J.R. contributed to the conceptualization, methodology, software, and writing—review and editingof the project. S.M.R. contributed to the methodology, software, validation, writing—review andediting, and supervision of the project. D.J.P. contributed to the conceptualization, supervision,project administration, and funding acquisition for the project. All authors have read and agreed tothe published version of the manuscript.
Funding: This research was funded by the Bauer Hockey Ltd.; Natural Sciences and EngineeringResearch Council of Canada (CA) [CRDPJ 453725-13].
Institutional Review Board Statement: The study was conducted according to the guidelines of theDeclaration of Helsinki and approved by the Research Ethics Board (REB II) of McGill University(File #: 375-0216, Approved: 15 March 2021).
Informed Consent Statement: Informed consent was obtained from all subjects involved in the study.
Data Availability Statement: The data presented in this study are available on request from thecorresponding author. The data are not publicly available due to participant privacy.
Acknowledgments: The authors would like to acknowledge Sean Denroche and Matthew Kelly fortheir assistance with data collection.
Conflicts of Interest: The authors declare no conflict of interest. The funders had no role in theanalyses, interpretation of data, or in the writing of the manuscript.
References1. Grand View Research Ice Hockey Equipment Market Size, Share & Trends Analysis Report by Product Type (Protective Wear, Sticks), by
Distribution Channel (Online, Offline), by Region, and Segment Forecasts, 2019–2025; Grand View Research, Inc.: San Francisco, CA,USA, 2019.
2. More, A. Ice Hockey Stick Market Share, Size 2019—Global Industry Future Demand, Global Research, Top Leading Players, EmergingTrends, Region by Forecast to 2025; MarketWatch: New York, NY, USA, 2019.
3. Pearsall, D.; Robbins, S. Design and Materials in Ice Hockey. In Materials in Sports Equipment; Subic, A., Ed.; Elsevier: Amsterdam,The Netherlands, 2019; pp. 297–322. ISBN 978-0-08-102582-6.
4. Kays, B.T.; Smith, L.V. Effect of Ice Hockey Stick Stiffness on Performance. Sports Eng. 2017, 20, 245–254. [CrossRef]5. Worobets, J.T.; Fairbairn, J.C.; Stefanyshyn, D.J. The Influence of Shaft Stiffness on Potential Energy and Puck Speed during Wrist
and Slap Shots in Ice Hockey. Sports Eng. 2006, 9, 191–200. [CrossRef]

Sensors 2022, 22, 3419 15 of 15
6. Roy, B.; Doré, R. Kinematics of the Slap Shot in Ice Hockey as Executed by Players of Different Age Classifications. In BiomechanicsV-B: Proceedings of the Fifth International Congress on Biomechanics; University Park Press: Baltimore, MD, USA, 1976; pp. 287–290.
7. Gilenstam, K.; Henriksson-Larsén, K.; Thorsen, K. Influence of Stick Stiffness and Puck Weight on Puck Velocity during SlapShots in Women’s Ice Hockey. Sports Eng. 2009, 11, 103–107. [CrossRef]
8. Legault, M. Advanced Hockey Stick Design Delivers Optimal Performance. Available online: https://www.compositesworld.com/articles/advanced-hockey-stick-design-delivers-optimal-performance (accessed on 4 May 2021).
9. Gerbé, A. Analysis of Hockey Blade Dynamic Behavior Using Digital Image Correlation (DIC). Master’s Thesis, McGill University,Montreal, QC, Canada, 2016.
10. Lomond, K.V.; Turcotte, R.A.; Pearsall, D.J. Three-Dimensional Analysis of Blade Contact in an Ice Hockey Slap Shot, in Relationto Player Skill. Sports Eng. 2007, 10, 87–100. [CrossRef]
11. Anderson, R.L. Experimental Characterization of Ice Hockey Sticks and Pucks. Master’s Thesis, Washington State University,Pullman, WA, USA, 2008.
12. Mendhurwar, K.; Handa, G.; Zhu, L.; Mudur, S.; Beauchesne, E.; LeVangie, M.; Hallihan, A.; Javadtalab, A.; Popa, T. A Systemfor Acquisition and Modelling of Ice-Hockey Stick Shape Deformation from Player Shot Videos. In Proceedings of the 2020IEEE/CVF Conference on Computer Vision and Pattern Recognition Workshops (CVPRW), Seattle, WA, USA, 14–19 June 2020;pp. 3893–3900.
13. Kim, M.; Park, S. Golf Swing Segmentation from a Single IMU Using Machine Learning. Sensors 2020, 20, 4466. [CrossRef][PubMed]
14. McGrath, J.; Neville, J.; Stewart, T.; Clinning, H.; Cronin, J. Can an Inertial Measurement Unit (IMU) in Combination withMachine Learning Measure Fast Bowling Speed and Perceived Intensity in Cricket? J. Sports Sci. 2021, 39, 1402–1409. [CrossRef]
15. Gal, A.M.; Douglas, T.; Chan, A.D.C.; Hay, D.C. Potential for Autonomous Linear, Curvilinear, and Phase Detection in NaturalContext Para Skating Using IMU Sledge Motion Data. In Proceedings of the 2020 IEEE International Symposium on MedicalMeasurements and Applications (MeMeA), Bari, Italy, 1 June–1 July 2020; pp. 1–6.
16. Vleugels, R.; Van Herbruggen, B.; Fontaine, J.; De Poorter, E. Ultra-Wideband Indoor Positioning and IMU-Based ActivityRecognition for Ice Hockey Analytics. Sensors 2021, 21, 4650. [CrossRef]
17. Dixon, P.C. BiomechZoo: An Open-Source Toolbox for the Processing, Analysis, and Visualization of Biomechanical MovementData. Comput. Methods Programs Biomed. 2017, 140, 1–10. [CrossRef]
18. Alexander, J.F.; Haddow, J.B.; Schultz, G.A. Comparison of the Ice Hockey Wrist and Slap Shots for Speed and Accuracy. Res. Q.Am. Assoc. Health Phys. Educ. Recreat. 1963, 34, 259–266. [CrossRef]
19. Robbins, S.M.; Renaud, P.; MacInnis, N.; Pearsall, D. The Relationship between Trunk Rotation and Shot Speed When PerformingIce Hockey Wrist Shots. J. Sports Sci. 2021, 39, 1001–1009. [CrossRef]
20. MacKenzie, S.J.; Boucher, D.E. The Influence of Golf Shaft Stiffness on Grip and Clubhead Kinematics. J. Sports Sci. 2017, 35,105–111. [CrossRef]
21. Zane, L. Force Measures at the Hand-Stick Interface during Ice Hockey Slap and Wrist Shots. Master’s Thesis, McGill University,Montreal, QC, Canada, 2012.
22. Flemming, A. The Dynamic Interaction of Hand Grip and Ice Hockey Stick Flexion during Slap Shots and Wrist Shots. Master’sThesis, McGill University, Montreal, QC, Canada, 2014.
23. Balsalobre-Fernández, C.; Kipp, K. Use of Machine-Learning and Load–Velocity Profiling to Estimate 1-Repetition Maximums forTwo Variations of the Bench-Press Exercise. Sports 2021, 9, 39. [CrossRef]
24. Hockey Canada Annual Report: July 2019–June 2020; Hockey Canada: Calgary, AB, Canada, 2020; p. 32.25. Behrmann, L.; Litzenberger, S.; Mally, F.; Sabo, A. Evaluation of Bending and Torsional Properties of Different Ice Hockey Sticks.
Procedia Eng. 2014, 72, 332–337. [CrossRef]26. Fischer, C.; Overney, L.S.; Fauve, M.; Blanke, O.; Rhyner, H.; Herzog, M.H.; Bourban, P.-E.; Månson, J.-A.E. What Static and
Dynamic Properties Should Slalom Skis Possess? Judgements by Advanced and Expert Skiers. J. Sports Sci. 2007, 25, 1567–1576.[CrossRef] [PubMed]
27. Overney, L.S.; Michaud, V.; Fischer, C.; Heubi, J.; Veldhuis, L.; Blanke, O.; Herzog, M.H.; Månson, J.-A. Carbon Outclasses Woodin Racket Paddles: Ratings of Expert and Intermediate Tennis Players. J. Sports Sci. 2010, 28, 1451–1458. [CrossRef] [PubMed]