Leveraging the QorIQ Data Path Acceleration Architecture ...
Upload
khangminh22Category
view
1download
0
Development of Design AccelerationResponse Spectrum for Building Basedon New Indonesian Seismic HazardMaps 2017
Windu Partono, Masyhur Irsyam, I. Wayan Sengara, Asrurifak,Frida Kistiani and Undayani Cita Sari
Abstract Research and development of Indonesian Seismic Hazard Maps in 2017(IHSM-2017) have a direct impact on the development of seismic resistance codefor building design in Indonesia. The development of new Indonesian seismic codefor building and non-building design is still on-going, following the development ofASCE/SEI 7-16. This paper describes the development of design accelerationresponse spectrum (DARS) for building design. DARS-2019 is developed fol-lowing the same method describes in the Indonesian seismic code [9] and ASCE/SEI 7-16. The study for developing DARS-2019 was performed at 35 cities inCentral Java and Yogyakarta Provinces, Indonesia. A comparative study with 2012seismic code (DARS-2012) was also performed in this study to evaluate theimprovement of the DARS at those 35 cities. The analysis was performed for threedifferent site soil classes (hard soil/SC, medium soil/SD and soft soil/SE). Thepurpose of this study is to evaluate the direct impact of the new ISHM-2017 onDARS-2019. Based on the analysis conducted at 35 cities, the improvement ofDARS-2019 compared to DARS-2012 for site classes SC, SD and SE are less than0.1 g except for site class SC at five cities located close to Opak fault trace.
Keywords Hazard map � Seismic code � Acceleration spectrum � Site soil class
W. Partono (&) � F. Kistiani � U. C. SariEngineering Faculty, Civil Engineering Department, Diponegoro University,Semarang 50275, Indonesiae-mail: [email protected]
M. Irsyam � I. W. SengaraCivil Engineering Department, Faculty of Civil and Environmental Engineering,Bandung Institute of Technology, Bandung 40132, Indonesia
AsrurifakResearch Center for Disaster Mitigation, Bandung Institute of Technology,Bandung 40132, Indonesia
© Springer Nature Switzerland AG 2020F. Mohamed Nazri (ed.), Proceedings of AICCE’19, Lecture Notes in CivilEngineering 53, https://doi.org/10.1007/978-3-030-32816-0_6
91
brought to you by COREView metadata, citation and similar papers at core.ac.uk
provided by Diponegoro University Institutional Repository
1 Introduction
The development of seismic code for building design based on seismic hazard mapsresearch was already conducted in 2012. The 2012 Indonesian Seismic Code [8] forbuilding and non building design was developed based on seismic hazard mapresearch carried on 2010. The research for 2010 Indonesian Seismic Hazard Maps(ISHM) was conducted by the Team for Revision of Seismic Hazard Maps 2010.The new ISHM-2017 was developed by The National Center for EarthquakeStudies 2017 [5]. One of the most important information obtained from thisresearch related with the new seismic sources that are detected and spread at thewhole area of the country especially the additional of shallow crustal fault sources.A good example of additional shallow crustal fault sources from 5 (ISHM-2010) to33 (ISHM-2017) are detected at the Java Island. There has been no significantimprovement of 2017 subduction sources surrounding the Java Island.
SNI 1726:2012 [8] was developed based on the development of ISHM-2010.The improvement of SNI 1726 is still on-going, following the development of thenew ISHM-2017. One of the important pieces of information needed for buildingresistance design is the design acceleration response spectrum (DARS) at thebuilding location. Based on SNI 1726:2012 the DARS at the building location canbe developed by conducting three basic steps: development of the maximumconsidered risk targeted acceleration spectrum (MCER) at the bedrock position;development of the surface acceleration spectrum (SMS, SM1 and PGAM); calcu-lation of the DARS using SMS and SM1 surface spectral acceleration and followingthe same method described by SNI 1726:2012 and ASCE/SEI 7-16 [1].
The MCER spectral accelerations is divided into three: short period (Ss), longperiod (S1) and PGA (Peak Ground Acceleration) [4, 6]. All three accelerationspectra are calculated by combining Risk Targeted Ground Motion (RTGM) fora 1% probability of collapse in 50 years with 84th percentile deterministic seismichazard analysis. Following the same method proposed by ASCE/SEI 7-16 [1], thenew SS and S1 acceleration spectra are calculated by adjusting direction factors 1.1and 1.3 for short and long period respectively. The logarithmic standard deviation(b) used for the SS and S1 acceleration spectrum calculation is 0.65.
The surface acceleration SMS, SM1 and PGAM are calculated by multiplying thethree acceleration spectra Ss, S1 and PGA with site coefficients Fa, Fv andFPGA, respectively. For the new Indonesian seismic code, the three site coefficientsare developed using the same values proposed by Stewart and Seyhan [9]. Fora specific site or building location, the three site coefficients are calculated based onsite class data and following the same method described by SNI 1726:2012.
The DARS for building resistance design is developed using two SDS and SD1values which represent short and long period design spectra acceleration respec-tively. SDS and SD1 are equal to two third of SMS and SM1 values and are calculatedusing the same method described in SNI 1726:2012. The new Indonesian seismic
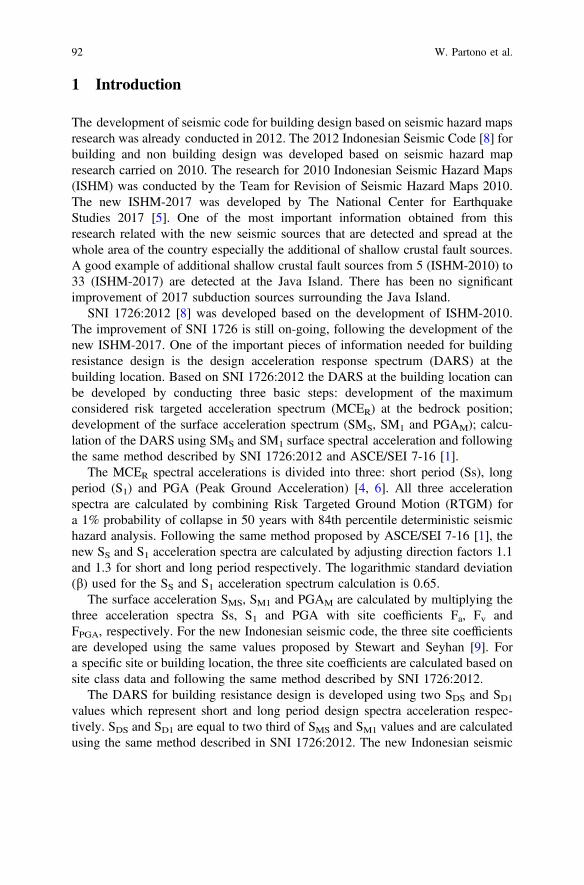
92 W. Partono et al.

code introduces a long transition period (TL) for developing the new DARS-2019.TL is a period on DARS-2019 which is separating the constant displacement andconstant velocity and usually greater than 4 s [2, 3, 7]. DARS-2019 with TL valuesis developed using the same procedure proposed by ASCE/SEI 7-16 [1].
The MCER (SS, S1 and PGA) and TL data of Indonesia (national data) aredeveloped by PUSGEN which are spread from (94° longitude, 8° latitude) through(142° longitude, −12° latitude) with a 0.1° interval (±11.05 km) in both directions.The SS, S1, PGA and TL at specific positions are usually obtained from the samevalues at the closest distance points (national data positions). Figure 1 shows the SSmap and Fig. 2 shows the S1 map and the positions of national data surroundingsthe study area.
This paper presents the development of MCER and TL values at specific location(cities) by conducting three different methods. The first method (method-1) fordeveloping MCER and TL values is conducted by calculating the average of MCER
and TL at the four closest points. The second method (method-2) is conducted byadjusting the MCER and TL values at the closest point. The final method(method-3) is conducted by using the weighting factor calculated from the fourclosest points. The weighting factor is calculated using four distance values atthe four closest points. The MCER and TL values are calculated at 35 cities inCentral Java and Yogyakarta regions. The positions of all cities can be seen inFigs. 1 and 2. The DARS-2019 for site class SC, SD and SE at specific city are thendeveloped based on the MCER (SS and S1) and TL values at the specific point andcalculated based on ASCE/SEI 7-16.
Fig. 1 MCER–SS map of Central Java and Yogyakarta Provinces
Development of Design Acceleration Response Spectrum … 93

2 Methodology
The development of DARS-2019 for site class SC, SD and SE at specific locationsor sites is carried out using the following algorithms:
1. Find the MCER acceleration spectrum (SS, S1 and PGA) and TL from nationaldata points.
2. Find all points with a maximum 15 km distance from the site position and thenfind 4 closest points to the site position.
3. Find the MCER (SS, S1 and PGA) and TL values of the four closest points.4. Sort the MCER and TL data of four points based on the distance of each point to
the site position from minimum to maximum.5. Find the average of MCER and TL values of all four points (method-1).6. Find the MCER and TL values of the closest point (method-2).7. Find the MCER and TL values of site based on the weighting factor of four
points (method-3) following “Eqs. (1)–(3)”. The “w(i)” in Eq. 1 is theweighting factor of points number “i” where i = 1–4. The d(i) value is thedistance of point no “i” to the site position. The MCER(i) and TL(i) are MCER
and TL value at point no “i”.8. Calculate the SMS, SM1 and PGAM following the same method proposed by
SNI 1726:2012 and utilizing the site factor proposed by [9].9. Calculate the SDS and SD1 using the same method proposed by SNI 1726:2012.
10. Develop the DARS-2019 based on ASCE/SEI 7-16 [1].
Fig. 2 MCER–S1 map of Central Java and Yogyakarta Provinces
94 W. Partono et al.

w(i) ¼ 1=d(i)Pi¼4
i¼1 1=d(i)ð1Þ
MCER ¼Xi¼4
i¼1
wðiÞ �MCERðiÞ ð2Þ
TL ¼Xi¼4
i¼1
wðiÞ � TLðiÞ ð3Þ
Table 1 shows an example ofMCER and TL calculation for Yogyakarta, the capitalcity of Yogyakarta Province, with coordinates (110.35, −7.8). Based on the distanceof the site to national data points there are six pointswith a distance less than 15 km toYogyakarta. Based on method-1 the SS, S1, PGA and TL values of Yogyakarta are1.2635 g, 0.54475 g, 0.53 g and 13 s respectively. By applying the second method(method-2) the SS, S1, PGA and TL values of Yogyakarta are 1.069 g (1 g = 9.81 m/s2), 0.493 g, 0.465 g and 20 s respectively. Finally by conducting method-3 the SS,S1, PGA and TL values of Yogyakarta are 1.211384 g, 0.533551 g, 0.516982 g and13 s respectively. Table 2 shows another example of MCER and TL calculation forSemarang, the capital city of Central Java Province, with coordinates (104.0, −7.0).Following the same steps conducted for Yogyakarta, there are 5 (five) closest points toSemarang. Table 3 shows three different pair of SS and S1 results calculated atSemarang using three different methods.
Table 1 MCER-SS. S1, PGA and TL example calculation for Yogyakarta
PointNo
Longitude Latitude Distance(Km)
SS(g)
S1(g)
PGA(g)
TL
(sec)
1 110.3 −7.8 5.5148 1.069 0.493 0.465 20
2 110.4 −7.8 5.5148 1.238 0.538 0.527 6
3 110.3 −7.9 12.3578 1.247 0.548 0.528 20
4 110.4 −7.9 12.3578 1.5 0.6 0.6 6
5 110.3 −7.9 12.3583 0.941 0.45 0.408 20
6 110.4 −7.9 12.3583 1.006 0.465 0.432 20
Table 2 MCER-SS. S1, PGA and TL example calculation for Semarang
PointNo
Longitude Latitude Distance(Km)
SS(g)
S1(g)
PGA(g)
TL
(sec)
1 104.0 −7.0 0 0.911 0.391 0.406 6
2 110.3 −7.0 11.05 0.936 0.395 0.419 6
3 110.5 −7.0 11.05 0.774 0.344 0.337 20
4 110.4 −6.9 11.05 0.658 0.305 0.289 20
6 110.4 −7.1 11.05 0.919 0.383 0.402 20
Development of Design Acceleration Response Spectrum … 95

By using SS and S1 values and applying site factor proposed by [9] and followingASCE/SEI 07-2016, the DARS-2019 for site class SC, SD and SE for Yogyakarta arepresented in Fig. 3. Figure 4 shows an example of DARS-2019 for site class SC, SDand SE for Semarang. All DARS-2019 as can be seen in Figs. 3 and 4 are developedfrom SS and S1 results calculated using method-3.
Table 3 SS and S1 acceleration spectrum calculated using three different methods
City Method-1 Method-2 Method- 3
SS (g) S1 (g) SS (g) S1 (g) SS (g) S1 (g)
Yogyakarta 1.264 0.555 1.069 0.493 1.221 0.534
Semarang 0.8198 0.3588 0.911 0.391 0.911 0.391
00.10.20.30.40.50.60.70.80.9
11.1
0 1 2 3 4 5 6 7 8 9 10
SA (g
)
T (second)
Design Accelera on Spectra - Yogyakarta
Hard Soil (SC)
Medium Soil (SD)
Soft Soil (SE)
Fig. 3 DARS-2019 of Yogyakarta for site class SC, SD and SE calculated based on SS and S1method-3
0
0.1
0.2
0.3
0.4
0.5
0.6
0.7
0.8
0 1 2 3 4 5 6 7 8 9 10
SA (g
)
T (second)
Design Accelera on Spectra - Semarang
Hard Soil (SC)
Medium Soil (SD)
Soft Soil (SE)
Fig. 4 DARS-2019 of Semarang for site class SC, SD and SE calculated based on SS and S1method-3
96 W. Partono et al.

3 Results and Discussion
The calculation of SDS and SD1 for the development of DARS-2019 depends notonly on the SS and S1 values but also depends on the site factor Fa and Fv values.The Fa and Fv values for specific site soil class (SC, SD and SE) are usuallydeveloped by linear interpolation and depends on the SS and S1 values. Table 4shows the SS and S1 at 35 cities in the study area. As can be seen in Table 4 thedifference of SS and S1 values are obtained due to different methods used forcalculating SS and S1. The analysis for evaluating the probability best performanceof three methods is conducted at 35 different cities. Figures 5 and 6 show the resultsof SS and S1 performance calculations using the three different methods.
Figure 5 shows the distribution of the SS difference values calculated usingmethod-1 and method-2 (DifSS-12), the difference between method-1 and
0.00
0.05
0.10
0.15
0.20
0.25
0 1 2 3 4 5 6 7 8
Diffe
renc
e S
S (g
)
Distance (km)
SS
DifSS-12
DifSS-13
DifSS-23
Fig. 5 Difference of SS values in terms of closest site distance calculated using three methods
0.00
0.01
0.02
0.03
0.04
0.05
0.06
0 1 2 3 4 5 6 7 8
Diffe
renc
e S1
(g)
Distance (km)
S1
DifS1-12
DifS1-13
DifS1-23
Fig. 6 Difference of S1 values in terms of closest site distance calculated using three methods
Development of Design Acceleration Response Spectrum … 97

Table 4 Improvement of SDS and SD1 for site class SC
City ClosestDistance(Km)
Method-1 Method-2 Method-3
SS (g) S1 (g) SS (g) S1 (g) SS (g) S1 (g)
Banjarnegara 5.2035 0.7348 0.3760 0.7070 0.3660 0.7298 0.3741
Bantul 5.2005 1.4312 0.6032 1.247 0.548 1.4034 0.5929
Batang 4.1192 0.631 0.3098 0.585 0.294 0.6212 0.3066
Blora 4.1224 0.5938 0.2812 0.608 0.288 0.598 0.2832
Boyolali 5.8286 0.8892 0.4188 0.909 0.428 0.8819 0.4169
Brebes 3.6839 0.7318 0.3335 0.716 0.327 0.7217 0.3299
Cilacap 6.6404 1.01 0.4655 1.056 0.481 1.0118 0.4662
Demak 1.8457 0.6018 0.2908 0.59 0.288 0.5951 0.2892
Jepara 5.5293 0.477 0.2425 0.46 0.236 0.4713 0.2398
Karanganyar 5.8184 0.7995 0.3845 0.816 0.391 0.8052 0.3873
Kebumen 5.5161 0.9122 0.4465 0.877 0.433 0.8986 0.4415
Kendal 5.8293 0.6948 0.321 0.799 0.357 0.7040 0.324
Klaten 4.1178 1.2648 0.537 1.126 0.501 1.2248 0.5265
Pekalongan 2.611 0.6398 0.3152 0.585 0.294 0.614 0.3052
Kudus 5.2068 0.6222 0.2925 0.548 0.269 0.6074 0.2878
Magelang 0.1562 0.8025 0.3972 0.787 0.391 0.7878 0.3913
Pati 7.1242 0.5975 0.2772 0.526 0.255 0.5935 0.2760
Pemalang 1.8468 0.6268 0.3072 0.601 0.3 0.6137 0.3036
Purbalingga 2.9347 0.7058 0.3548 0.707 0.355 0.7058 0.3549
Purwodadi 2.6081 0.7602 0.3382 0.735 0.329 0.7491 0.3342
Purwokerto 5.12 0.8142 0.394 0.842 0.399 0.8162 0.3939
Purworejo 0.4146 0.873 0.4312 0.889 0.439 0.8868 0.4379
Rembang 5.8296 0.4962 0.24 0.512 0.245 0.4942 0.2391
Salatiga 4.1185 0.9335 0.416 0.932 0.416 0.9327 0.416
Semarang 0 0.8198 0.3588 0.911 0.391 0.911 0.391
Solo 1.8469 0.8235 0.3985 0.832 0.404 0.8272 0.4011
Sragen 5.8278 0.7795 0.367 0.781 0.374 0.7789 0.3673
Sukoharjo 7.1664 0.8562 0.4122 0.821 0.397 0.855 0.4117
Tegal 3.6256 0.634 0.3042 0.674 0.316 0.6484 0.3086
Temanggung 3.2612 0.697 0.3482 0.695 0.35 0.695 0.3482
Ungaran 5.8291 0.8522 0.3715 0.853 0.378 0.8622 0.3742
Wates 5.2007 1.0385 0.49 1.067 0.503 1.0441 0.4925
Wonogiri 4.1177 0.961 0.4545 0.934 0.443 0.9556 0.4523
Wonosobo 0 0.7242 0.3708 0.71 0.366 0.71 0.366
Yogyakarta 5.5148 1.2635 0.5448 1.069 0.493 1.2214 0.5336
98 W. Partono et al.

method-3 (DifSS-13) and the difference between method-2 and method-3(DifSS-23). The SS difference distribution is developed in terms of closest sitedistance to national data positions. As can be seen in Fig. 5 when the distance ofthe site position to national data positions less than 2 km, there is no significantdifference in SS values calculated using three different methods. However, when thedistance of the site to national data greater than 2 km the SS values calculated usingmethod-1 and method-3 are almost equal while the SS values calculated usingmethod-2 is differ from the two other methods. It seems that the SS values calcu-lated using method-3 have a better performance compared to another two methods.
Figure 6 shows the distribution of S1 difference values DifS1-12, DifS1-13 andDifS1-23. In terms of site distance, the distribution of DifS1-12, DifS1-13 andDifS1-23 are almost equal with DifSS-12, DifSS-13 and DifSS-23 distributions.The performance of the S1 values calculated using mehod-3 is better than method-1or method-2.
0
0.1
0.2
0.3
0.4
0.5
0.6
0.7
0.8
0 0.5 1 1.5 2 2.5 3 3.5 4
Design Accelera on Spectra - Semarang
Hard Soil 2012 (SC)
Medium Soil 2012 (SD)
So Soil 2012 (SE)
Hard Soil 2019 (SC)
Medium Soil 2019 (SD)
So Soil 2019 (SE)
T (sceond)
SA (
g)
Fig. 7 DARS for Semarang
00.10.20.30.40.50.60.70.80.91
1.1
0 0.5 1 1.5 2 2.5 3 3.5 4
Design Accelera on Spectra - Yogyakarta
Hard Soil 2012 (SC)
Medium Soil 2012 (SD)
So Soil 2012 (SE)
Hard Soil 2019 (SC)
Medium Soil 2019 (SD)
So Soil 2019 (SE)
T (sceond)
SA (
g)
Fig. 8 DARS for Yogyakarta
Development of Design Acceleration Response Spectrum … 99

A comparative study was conducted to evaluate the improvement of DARScalculated using [8] (DARS-2012) and DARS-2019. The analysis was conductedfor 35 cities in Central Java and Yogyakarta Provinces for three different site classes(SC, SD and SE). DARS-2019 is developed using method-3. Figures 7 and 8 showthe DARS-2019 and DARS-2012 for Semarang and Yogyakarta respectively. Themaximum period of DARS-2019 display in Figs. 7 and 8 are equal to 4 s andis adjusted to the same period used by SNI 1726:2012.
Fig. 9 The study area (a) and five cities with maximum improvement of SDS and SD1 values (b)
100 W. Partono et al.

As can be seen in Fig. 7, there is no significant improvement in the DARS forSemarang for site class SC, SD and SE. For site class SC and SE the DARS-2019 isslightly bigger than the DARS-2012. However, for site class SD, the DARS-2019 isslightly lower than the DARS-2012. The maximum improvement (increasing ordecreasing) of DARS-2019 compared to DARS-2012 is less than 0.1 g. Theimprovement of DARS for Yogyakarta is slightly bigger than Semarang. As can beseen in Fig. 8, for site class SC and SD the DARS-2019 for Yogyakarta is slightlybigger than for DARS-2012. For site class SE the DARS-2019 of Yogyakarta islower than the DARS-2012. The maximum improvement of the DARS-2019compared to the DARS-2019 for site class SC is less than 0.2 g. However, themaximum improvement of DARS-2019 compared to Dars-2012 for site class SDand SE is less than 0.1 g.
Tables 5, 6 and 7 illustrate the improvement of SDS and SD1 values for siteclasses SC, SD and SE respectively and calculated for developing DARS-2019 andDARS-2012 for Semarang and Yogyakarta. Positive or negative sign (±) inside thistable represents increasing or decreasing of DARS-2019 compared to DARS-2012.Compared to SDS 2012, the SDS 2019 of Semarang city is increasing 8.32% and17.33% for site classes SC and SE respectively. However, for site class SC the SDSvalue for Semarang is decreases 6.50%. For Yogyakarta the SDS 2019 value for siteclasses SC, SD and SE are decreased 22.43%, 2.33% and 5.29% respectively.Compared to DARS-2012, the SD1 values for site class SC, SD and SE of
Table 5 Improvement of SDS and SD1 for site class SC
City Spectrum-2019 Spectrum-2012 Improvement (±)
SDS (g) SD1 (g) SDS (g) SD1 (g) SDS SD1Semarang 0.729 0.391 0.673 0.328 8.32% 19.21%
Yogyakarta 0.977 0.520 0.798 0.399 22.43% 30.33%
Table 6 Improvement of SDS and SD1 for site class SD
City Spectrum-2019 Spectrum-2012 Improvement (±)
SDS (g) SD1 (g) SDS (g) SD1 (g) SDS SD1Semarang 0.69 0.498 0.738 0.387 −6.50% 28.68%
Yogyakarta 0.834 0.627 0.815 0.458 2.33% 36.90%
Table 7 Improvement of SDS and SD1 for site class SE
City Spectrum-2019 Spectrum-2012 Improvement (±)
SDS (g) SD1 (g) SDS (g) SD1 (g) SDS SD1Semarang 0.711 0.635 0.606 0.595 17.33% 6.72%
Yogyakarta 0.756 0.757 0.718 0.705 5.29% 7.38%
Development of Design Acceleration Response Spectrum … 101

DARS-2019 for Semarang are increased 19.21%, 28.68% and 6.72% respectively.For Yogyakarta, the SD1 value for DARS-2019 increased by 30.33%, 36.90% and7.38% for site classes SC, SD and SE respectively.
Base on the analysis conducted at 35 cities the largest improvement of SDS andSD1 are detected at five cities located close to Opak Fault Trace Yogyakarta. TheSDS and SD1 of DARS-2019 at these five cities are larger than the SDS and SD1 ofDARS-2012. The SDS values are increased in between 0.144 g and 0.297 g and theSD1 values are increased in between 0.104 and 0.148 g. The most significantimprovement is detected at site class SC. However, the improvement of SDS andSD1 for site classes SD and SE at five cities are smaller than for site class SC andless than 0.1 g. Table 8 shows the improvement of SDS and SD1 values at five citiesand Fig. 9 shows the position of all five cities. All five cities are located less than25 km distance from the Opak fault trace. Klaten and Boyolali are located atCentral Java Province. However, another three cities, Bantul, Wates andYogyakarta are located at Yogyakarta Province. As can be seen in Table 8 thelargest improvement of SDS value at Klaten is close to 0.3 g (43.5%) and theimprovement of SD1 value at this city is 0.144 g (40.2%).
4 Conclusions
The development of design acceleration response spectrum (DARS) for 35 cities inthe Central Java and Yogyakarta Provinces, Indonesia, was performed in this study.The objective of this study was to evaluate the improvement of DARS-2019 com-pared to DARS-2012. The study was performed due to the improvement ofthe Seismic Hazard Maps of Indonesia 2017. The study was performed first bycalculating the MCER acceleration spectra (SS and S1) and conducting three differentmethods. The DARS-2019 for site classes SC, SD and SE were then developed usingthe same method proposed by SNI 1726:2012 and ASCE/SEI 7-16.
Based on the analysis conducted at 35 different cities in Central Java andYogyakarta Provinces, method-3 (weighting factor method) for developing of SS
Table 8 Improvement of SDS and SD1 for site class SC at five cities
City Spectrum-2019 Spectrum-2012 Improvement(±)
Improvement (±)
SDS(g)
SD1(g)
SDS(g)
SD1(g)
SDS(g)
SD1(g)
SDS(%)
SD1(%)
Bantul 1.123 0.56 0.948 0.441 0.175 0.119 18.5 27.0
Boyolali 0.706 0.417 0.562 0.313 0.144 0.104 25.6 33.2
Klaten 0.98 0.516 0.683 0.368 0.297 0.148 43.5 40.2
Wates 0.833 0.491 0.617 0.347 0.218 0.144 35.3 41.5
Yogyakarta 0.977 0.520 0.798 0.399 0.179 0.121 22.4 30.3
102 W. Partono et al.

and S1 values at specific location has a better performance compared to two dif-ferent methods (method-1 and method-2). Method-1 is developed using the aver-ages of four different values obtained from the four closest points. Method-2 isdeveloped based on the value at the closest point. All three methods are conductedin this study because the site coordinate position not always equal to the coordinatesof national data points (developed by PUSGEN).
On average the DARS-2019 developed at 35 cities in Central Java andYogyakarta Provinces are almost equal compared to the DARS-2012. Based on theanalysis conducted at 35 cities, the improvement of the DARS-2019 compared tothe DARS-2012 for site classes SC, SD and SE are less than 0.1 g except for siteclass SC at five cities located close to Opak fault trace. All five cities are locatedless than 25 km distance toward Opak fault trace. The maximum improvementvalue is detected at Klaten with SDS value close to 0.3 g (43.5%) and theimprovement of SD1 value at this city is 0.144 g (40.2%).
Acknowledgements This research was financially supported by The Faculty of Engineering,Diponegoro University, Indonesia through Strategic Research Grant 2019. The Author also wouldlike to thank to the Ministry of Public Works and Human Settlements Indonesia and NationalCenter for Earthquake Studies (PUSGEN) for providing data and technical supports during thedevelopment of this research.
References
1. ASCE/SEI 7-16 (2017) Minimum design loads and associated criteria for buildings and otherstructures. American Society of Civil Engineers (2017)
2. Fauzi UJ, Fauzi A, Ahmad F, Irsyam M, Toha FX, Hendriyawan (2011) Proposed long periodtransition map for new Indonesia earthquake resistance building code based on Indonesiaseismic hazard map 2010. In: Proceedings of annual international conference Syah KualaUniversity, Banda Aceh, Indonesia, Nov 29–30
3. Jarallah HK, Taki ZNM (2017) A comparative study on the design spectra defined by severalcodes of practice on RC building located in Bagdad city. Al-Nahrain J Eng Sci 20(2):425–435
4. Luco N, Ellingwood BR, Hamburger RO, Hooper JD, Kinball JK, Kircher CA (2007) Risktargeted versus current seismic design maps for the coterminous United Sates. In: Structuralengineers association of California 2007 convention proceedings, 163–175
5. Pusat Studi Gempa Nasional (2017) Peta Sumber dan Bahaya Gempa Indonesia Tahun 2017.Pusat Litbang Perumahan dan Pemukiman, Kementerian Pekerjaan Umum dan PerumahanRakyat (National Center for Earthquake Studies. Indonesian Seismic Sources and SeismicHazard Maps 2017. Center for Research and Development of Housing and Resettlement,Ministry of Public Works and Human Settlements). ISBN 978-602-5489-01-3, pp 1–377
6. Sengara IW, Irsyam M, Sidi ID, Mulia A, Asrurifak M, Hutabarat D (2015) Development ofrisk-targeted ground motions for indonesian earthquake resistance building code SNI1726-2012. In: 12th International conference on applications of statistics and probability incivil engineering, ICASP12, Vancouver, Canada, Juli 12–15
7. Smerzini C, Paolucii R, Galasso C, Iervolino I (2012) Engineering ground motion selectionbased on displacement-spectrum compatibility. In: Proceedings of the 15th world conferenceon earthquake engineering, Lisboa PT, paper no 2354
Development of Design Acceleration Response Spectrum … 103

8. SNI 1726:2012 (2012) Tata Cara Perencanaan Ketahanan Gempa untuk Struktural BangunanGedung dan Non Gedung (Seismic Resistance Desugn Codes for Building and OtherStructures), Jakarta, 2012, pp 1–138
9. Stewart JA, Seyhan E (2013) Semi-empirical nonlinear site amplification and its application inNEHRP site factors. In: Pasific Earthquake Engineering Research Center (PEER) report 2013/13. University of California, Berkelay, Nov 2013
104 W. Partono et al.
Copyright © 2022 FDOKUMEN


![[ITA] Acceleration methods for PageRank](https://static.fdokumen.com/doc/165x107/6321641780403fa2920cb95c/ita-acceleration-methods-for-pagerank.jpg)