
Research Article Acceleration Characteristics of a Rock Slide ...
10
Research Article Acceleration Characteristics of a Rock Slide Using the Particle Image Velocimetry Technique Guoqing Chen, Le Li, Cong Zhao, Runqiu Huang, and Fan Guo State Key Laboratory of Geohazard Prevention and Geoenvironment Protection, Chengdu University of Technology, Chengdu, Sichuan 610059, China Correspondence should be addressed to Guoqing Chen; [email protected] Received 26 December 2015; Revised 28 February 2016; Accepted 29 February 2016 Academic Editor: Fei Dai Copyright © 2016 Guoqing Chen et al. is is an open access article distributed under the Creative Commons Attribution License, which permits unrestricted use, distribution, and reproduction in any medium, provided the original work is properly cited. e Particle Image Velocimetry (PIV) technique with high precision and spatial resolution is a suitable sensor for flow field experiments. In this paper, the PIV technology was used to monitor the development of a displacement field, velocity field and acceleration field of a rock slide. It was found that the peak acceleration of the sliding surface appeared earlier than the peak acceleration of the sliding body. e characteristics of the rock slide including the short failure time, high velocities, and large accelerations indicate that the sliding forces and energy release rate of the slope are high. e deformation field showed that the sliding body was sliding outwards along the sliding surface while the sliding bed moved in an opposite direction. Moving upwards at the top of the sliding bed can be one of the warning signs for rock slide failure. 1. Introduction With an increasing number of large engineering projects such as hydropower engineering, national defense project construction and road construction are implemented in mountain areas; the change of climate and the environment pollutions cause the rock slide hazard to frequently happen. e sliding body rotating along the sliding surface with high speed and high energy [1] has been released. So the failure mechanisms of large-scale rock slides need more attention since the brittle failure time is short. e stability of rock slides was investigated through surface displacement measurements [2]. During the process of progressive failure, the cracks developing at the sliding surface can be used to reflect the stability of the slope [3–5]. Microseism [6–8] and acoustic emission techniques [9, 10] can reflect the process of rock failure and be applied for early warning techniques. Comprehensive measures such as the finite-element analysis [11, 12], reinforcement techniques [13], multivariate information [14, 15] and dynamic design methodology [16] were commonly used to deal with these slope stability problems. Laboratory tests such as shaking table tests [17], ring shear tests [18], 3D resistivity tomography [19], ground-based radar interferometry [20], fiber monitoring network [21–23], Fiber Bragg Gratings sensing bars (FBG) [24], and Particle Image Velocimetry (PIV) [25–30] were used to study the mechanism of slope instability. However, the failure form of the rock slide is brittle failure, and the failure time is short. e whole failure situation of the rock slide cannot be obtained by using the above methods, and the specific temporal deformation trend of rock slide cannot be obtained. e PIV technique was commonly applied to monitor displacement fields [17, 28–30] and strain fields [27] for the rock slope failure. However, the velocity and acceleration field of the slope body were seldom analyzed. In this paper, the PIV technique was used to study the velocity field and the acceleration field during the slope failure process. e failure pictures of rock slope were collected by using high-speed camera, and the velocity vectors were obtained by using this sensor technology. e instantaneous forces about the failure mechanism of rock slide were analyzed. 2. PIV Sensor and Experiment Preparations 2.1. e Principle of the PIV System. By using the efficient image processing technology, PIV have achieved good sensor Hindawi Publishing Corporation Journal of Sensors Volume 2016, Article ID 2650871, 9 pages http://dx.doi.org/10.1155/2016/2650871
-
Upload
khangminh22 -
Category
Documents
-
view
2 -
download
0
Transcript of Research Article Acceleration Characteristics of a Rock Slide ...
Research ArticleAcceleration Characteristics of a Rock Slide Using the ParticleImage Velocimetry Technique
Guoqing Chen, Le Li, Cong Zhao, Runqiu Huang, and Fan Guo
State Key Laboratory of Geohazard Prevention and Geoenvironment Protection, Chengdu University of Technology,Chengdu, Sichuan 610059, China
Correspondence should be addressed to Guoqing Chen; [email protected]
Received 26 December 2015; Revised 28 February 2016; Accepted 29 February 2016
Academic Editor: Fei Dai
Copyright © 2016 Guoqing Chen et al.This is an open access article distributed under the Creative Commons Attribution License,which permits unrestricted use, distribution, and reproduction in any medium, provided the original work is properly cited.
The Particle Image Velocimetry (PIV) technique with high precision and spatial resolution is a suitable sensor for flow fieldexperiments. In this paper, the PIV technology was used to monitor the development of a displacement field, velocity field andacceleration field of a rock slide. It was found that the peak acceleration of the sliding surface appeared earlier than the peakacceleration of the sliding body. The characteristics of the rock slide including the short failure time, high velocities, and largeaccelerations indicate that the sliding forces and energy release rate of the slope are high. The deformation field showed that thesliding body was sliding outwards along the sliding surface while the sliding bed moved in an opposite direction. Moving upwardsat the top of the sliding bed can be one of the warning signs for rock slide failure.
1. Introduction
With an increasing number of large engineering projectssuch as hydropower engineering, national defense projectconstruction and road construction are implemented inmountain areas; the change of climate and the environmentpollutions cause the rock slide hazard to frequently happen.The sliding body rotating along the sliding surface with highspeed and high energy [1] has been released. So the failuremechanisms of large-scale rock slides need more attentionsince the brittle failure time is short.
The stability of rock slides was investigated throughsurface displacement measurements [2]. During the processof progressive failure, the cracks developing at the slidingsurface can be used to reflect the stability of the slope [3–5].Microseism [6–8] and acoustic emission techniques [9, 10]can reflect the process of rock failure and be applied forearly warning techniques. Comprehensive measures such asthe finite-element analysis [11, 12], reinforcement techniques[13], multivariate information [14, 15] and dynamic designmethodology [16] were commonly used to deal with theseslope stability problems.
Laboratory tests such as shaking table tests [17], ringshear tests [18], 3D resistivity tomography [19], ground-based
radar interferometry [20], fiber monitoring network [21–23],Fiber Bragg Gratings sensing bars (FBG) [24], and ParticleImage Velocimetry (PIV) [25–30] were used to study themechanism of slope instability. However, the failure formof the rock slide is brittle failure, and the failure time isshort. The whole failure situation of the rock slide cannotbe obtained by using the above methods, and the specifictemporal deformation trend of rock slide cannot be obtained.
The PIV technique was commonly applied to monitordisplacement fields [17, 28–30] and strain fields [27] for therock slope failure. However, the velocity and acceleration fieldof the slope body were seldom analyzed. In this paper, thePIV technique was used to study the velocity field and theacceleration field during the slope failure process. The failurepictures of rock slope were collected by using high-speedcamera, and the velocity vectors were obtained by using thissensor technology.The instantaneous forces about the failuremechanism of rock slide were analyzed.
2. PIV Sensor and Experiment Preparations
2.1. The Principle of the PIV System. By using the efficientimage processing technology, PIV have achieved good sensor
Hindawi Publishing CorporationJournal of SensorsVolume 2016, Article ID 2650871, 9 pageshttp://dx.doi.org/10.1155/2016/2650871
2 Journal of Sensors
Table 1: Material mix ratio of each part of the slope (g).
Zone Cement Gypsum powder Quartz sand Water Mixture ratio 𝐶 (MPa) Φ (∘)I 38 95 285 66.5 0.4 : 1.3 : 0.7 2.3 30.4IIIII 21 47 146 35 0.7 : 1.3 : 0.7 4.0 38.9IV 1955 1955 5865 1368 1 : 1.3 : 0.7 4.5 48.2
results in fluidmechanics. Combining the advantages of bothsingle-point and display measurements, the PIV system notonly contains the precision and resolution of single-pointmeasurements but also obtains the overall flow field andtransient images.
The PIV system automatically distributes the tracer par-ticle in the whole sliding slope through a two-dimensionalplane. The particles move with slope collapsing, so thedisplacement and velocity are easily obtained by locating thetrajectories of all particles between two pictures. Given theparticle trajectory between two pictures, the velocities alongthe𝑋 direction and the𝑌 direction are determined accordingto
V𝑥=𝑑𝑥 (𝑡)
𝑑𝑡=𝑥 (𝑡 + Δ𝑡) − 𝑥 (𝑡)
Δ𝑡= V𝑥,
V𝑦=𝑑𝑦 (𝑡)
𝑑𝑡=𝑦 (𝑡 + Δ𝑡) − 𝑦 (𝑡)
Δ𝑡= V𝑦,
(1)
where the displacements 𝑥 and 𝑦 are a function of time 𝑡which can be expressed by the functions 𝑥(𝑡) and 𝑦(𝑡); 𝑡 isthe current time;Δ𝑡 is the time interval, which is 0.02 s in thispaper; V
𝑥and V
𝑦are the instantaneous average velocities in
the 𝑥 and 𝑦 directions over Δ𝑡.
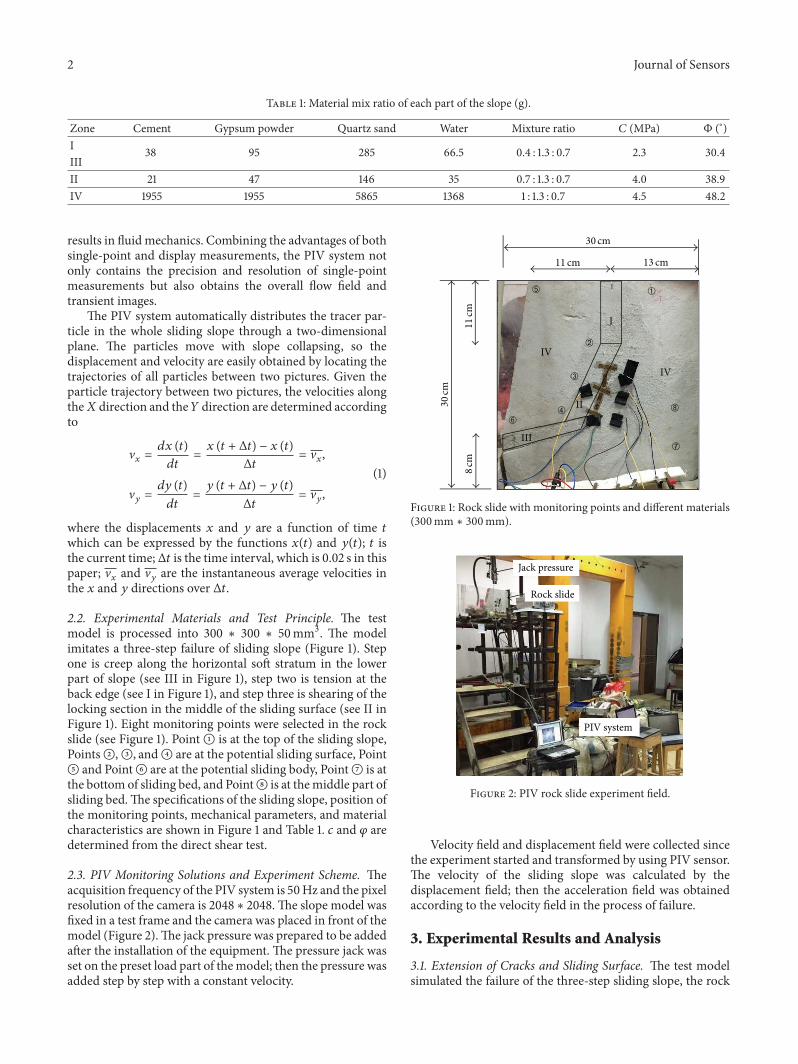
2.2. Experimental Materials and Test Principle. The testmodel is processed into 300 ∗ 300 ∗ 50mm3. The modelimitates a three-step failure of sliding slope (Figure 1). Stepone is creep along the horizontal soft stratum in the lowerpart of slope (see III in Figure 1), step two is tension at theback edge (see I in Figure 1), and step three is shearing of thelocking section in the middle of the sliding surface (see II inFigure 1). Eight monitoring points were selected in the rockslide (see Figure 1). PointA is at the top of the sliding slope,PointsB,C, andD are at the potential sliding surface, PointE and PointF are at the potential sliding body, PointG is atthe bottom of sliding bed, and PointH is at themiddle part ofsliding bed.The specifications of the sliding slope, position ofthe monitoring points, mechanical parameters, and materialcharacteristics are shown in Figure 1 and Table 1. 𝑐 and 𝜑 aredetermined from the direct shear test.
2.3. PIV Monitoring Solutions and Experiment Scheme. Theacquisition frequency of the PIV system is 50Hz and the pixelresolution of the camera is 2048 ∗ 2048. The slope model wasfixed in a test frame and the camera was placed in front of themodel (Figure 2).The jack pressure was prepared to be addedafter the installation of the equipment. The pressure jack wasset on the preset load part of themodel; then the pressure wasadded step by step with a constant velocity.
30 cm
30
cm
8cm
11 cm
11
cm
13 cm
I
II
III
IV
IV
➀
➁
➂
➃
➄
➅
➆
➇
Figure 1: Rock slide with monitoring points and different materials(300mm ∗ 300mm).
Jack pressure
Rock slide
PIV system
Figure 2: PIV rock slide experiment field.
Velocity field and displacement field were collected sincethe experiment started and transformed by using PIV sensor.The velocity of the sliding slope was calculated by thedisplacement field; then the acceleration field was obtainedaccording to the velocity field in the process of failure.
3. Experimental Results and Analysis
3.1. Extension of Cracks and Sliding Surface. The test modelsimulated the failure of the three-step sliding slope, the rock
Journal of Sensors 3
(a) 0 s before failure (b) 0.02 s crack initiation
(c) 0.04 s crack at the top (d) 0.06 s crack propagation
(e) 0.08 s crack coalescence (f) 0.1 s sliding body dumped
Figure 3: Extension of cracks during the failure process of the rock slide.
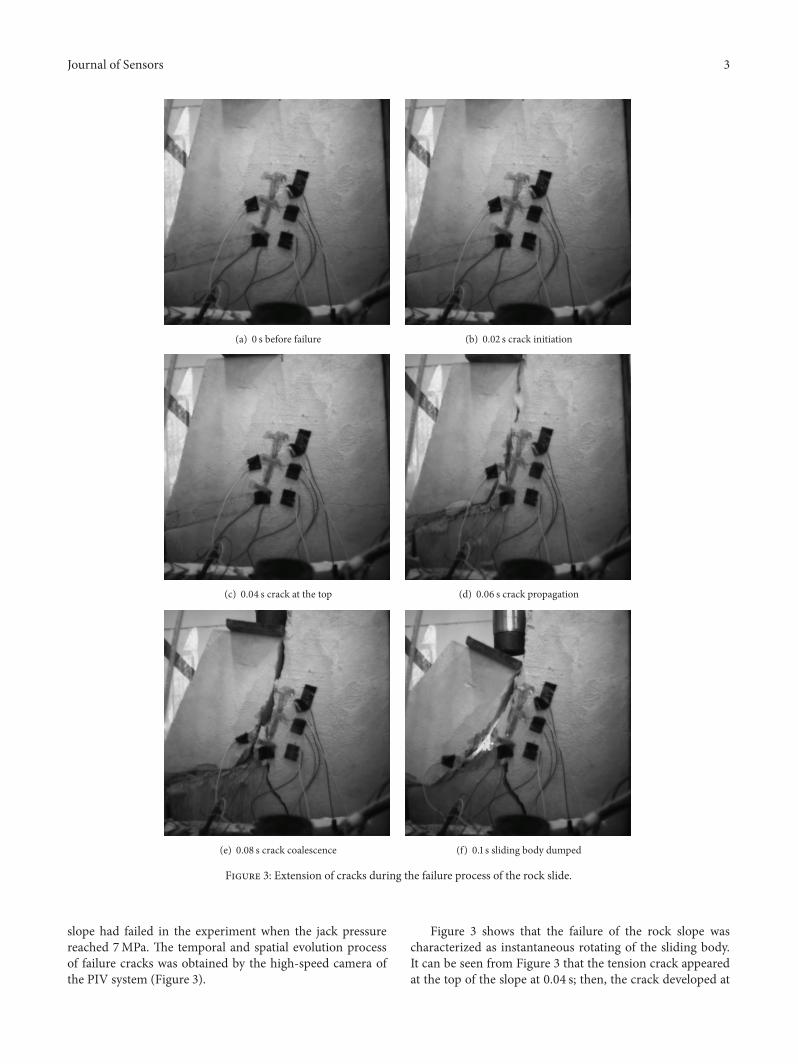
slope had failed in the experiment when the jack pressurereached 7MPa. The temporal and spatial evolution processof failure cracks was obtained by the high-speed camera ofthe PIV system (Figure 3).
Figure 3 shows that the failure of the rock slope wascharacterized as instantaneous rotating of the sliding body.It can be seen from Figure 3 that the tension crack appearedat the top of the slope at 0.04 s; then, the crack developed at
4 Journal of Sensors
Top free surface
Slidingbody
Slopefreesurface
Sliding bed
Sliding surface
0.040.030.020−0.01
➀
➁
➅
➆
V (m/s)
(a) 0.02 s
V (m/s)
−10−50510
(b) 0.04 s
−15−1001015
V (m/s)
(c) 0.06 s
−20−1001020
V (m/s)
(d) 0.08 s
Figure 4: Changes of the velocity field during rock slide failure (300mm ∗ 300mm).
0.06 s and the crack coalescence with the sliding body failureoccurred at 0.08 s. Thereafter, the sliding body rotated alongthe direction of sliding bed. The rock slide was completelydestroyed at 0.1 s and the whole sliding surface presented atrend of circular shape movement.
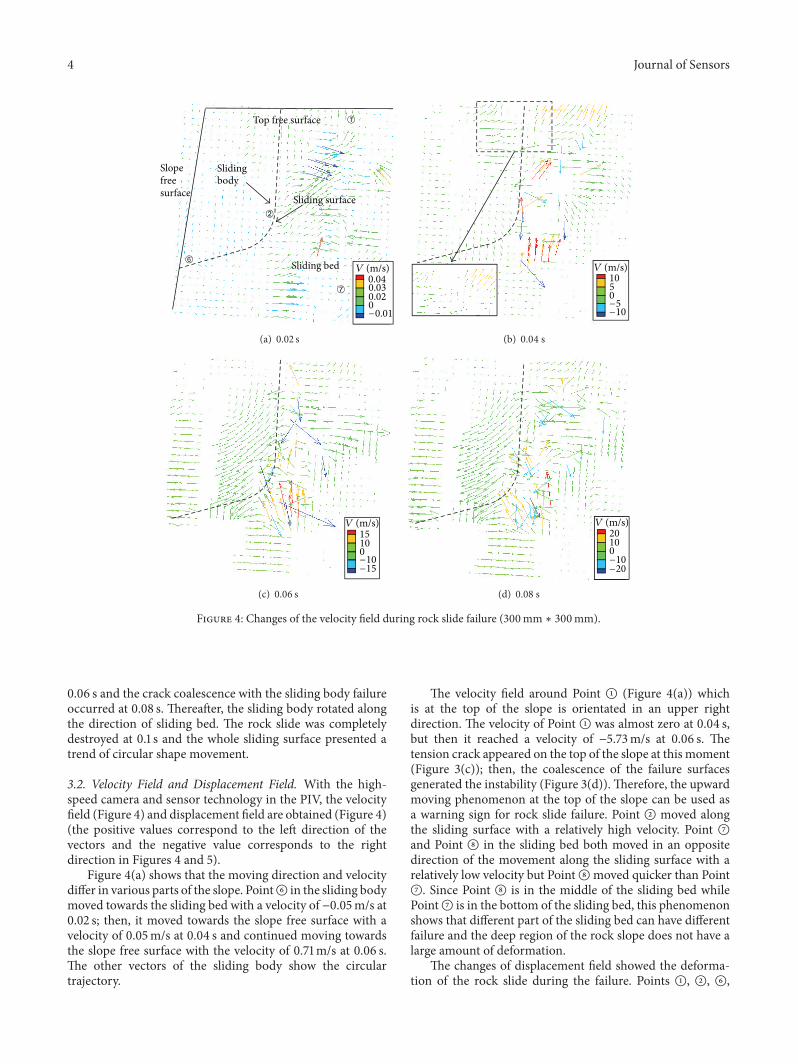
3.2. Velocity Field and Displacement Field. With the high-speed camera and sensor technology in the PIV, the velocityfield (Figure 4) and displacement field are obtained (Figure 4)(the positive values correspond to the left direction of thevectors and the negative value corresponds to the rightdirection in Figures 4 and 5).
Figure 4(a) shows that the moving direction and velocitydiffer in various parts of the slope. PointF in the sliding bodymoved towards the sliding bed with a velocity of −0.05m/s at0.02 s; then, it moved towards the slope free surface with avelocity of 0.05m/s at 0.04 s and continued moving towardsthe slope free surface with the velocity of 0.71m/s at 0.06 s.The other vectors of the sliding body show the circulartrajectory.
The velocity field around Point A (Figure 4(a)) whichis at the top of the slope is orientated in an upper rightdirection. The velocity of Point A was almost zero at 0.04 s,but then it reached a velocity of −5.73m/s at 0.06 s. Thetension crack appeared on the top of the slope at this moment(Figure 3(c)); then, the coalescence of the failure surfacesgenerated the instability (Figure 3(d)). Therefore, the upwardmoving phenomenon at the top of the slope can be used asa warning sign for rock slide failure. Point B moved alongthe sliding surface with a relatively high velocity. Point Gand Point H in the sliding bed both moved in an oppositedirection of the movement along the sliding surface with arelatively low velocity but PointHmoved quicker than PointG. Since Point H is in the middle of the sliding bed whilePointG is in the bottom of the sliding bed, this phenomenonshows that different part of the sliding bed can have differentfailure and the deep region of the rock slope does not have alarge amount of deformation.
The changes of displacement field showed the deforma-tion of the rock slide during the failure. Points A, B, F,
Journal of Sensors 5
Slopefreesurface
Top free surface
Slidingbody
Sliding bed
Sliding surface
−0.4−0.200.20.4
S (mm)
➀
➁
➅
➆
(a) 0∼0.02 s
S (mm)100500−50−100
(b) 0.02∼0.04 s
S (mm)120600−50−100
(c) 0.04∼0.06 s
S (mm)120600−50−100
(d) 0.06∼0.08 s
Figure 5: Changes of the displacement field during rock slide failure (300mm ∗ 300mm).
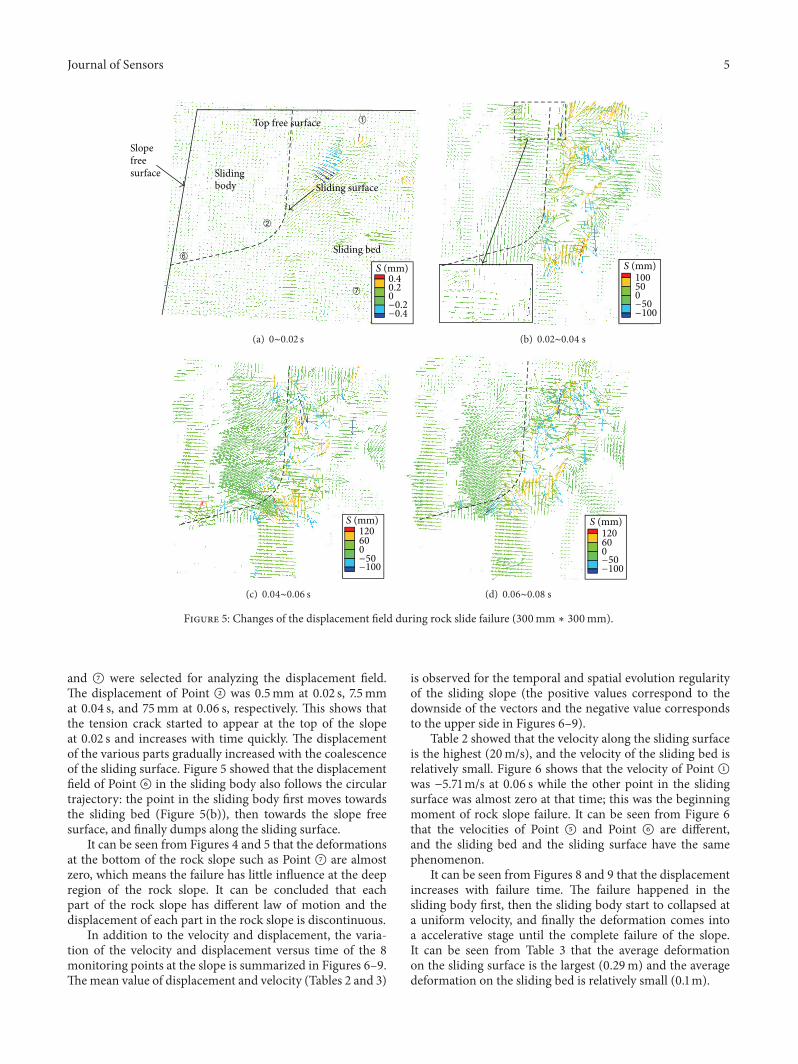
and G were selected for analyzing the displacement field.The displacement of Point B was 0.5mm at 0.02 s, 7.5mmat 0.04 s, and 75mm at 0.06 s, respectively. This shows thatthe tension crack started to appear at the top of the slopeat 0.02 s and increases with time quickly. The displacementof the various parts gradually increased with the coalescenceof the sliding surface. Figure 5 showed that the displacementfield of Point F in the sliding body also follows the circulartrajectory: the point in the sliding body first moves towardsthe sliding bed (Figure 5(b)), then towards the slope freesurface, and finally dumps along the sliding surface.
It can be seen from Figures 4 and 5 that the deformationsat the bottom of the rock slope such as Point G are almostzero, which means the failure has little influence at the deepregion of the rock slope. It can be concluded that eachpart of the rock slope has different law of motion and thedisplacement of each part in the rock slope is discontinuous.
In addition to the velocity and displacement, the varia-tion of the velocity and displacement versus time of the 8monitoring points at the slope is summarized in Figures 6–9.Themean value of displacement and velocity (Tables 2 and 3)
is observed for the temporal and spatial evolution regularityof the sliding slope (the positive values correspond to thedownside of the vectors and the negative value correspondsto the upper side in Figures 6–9).
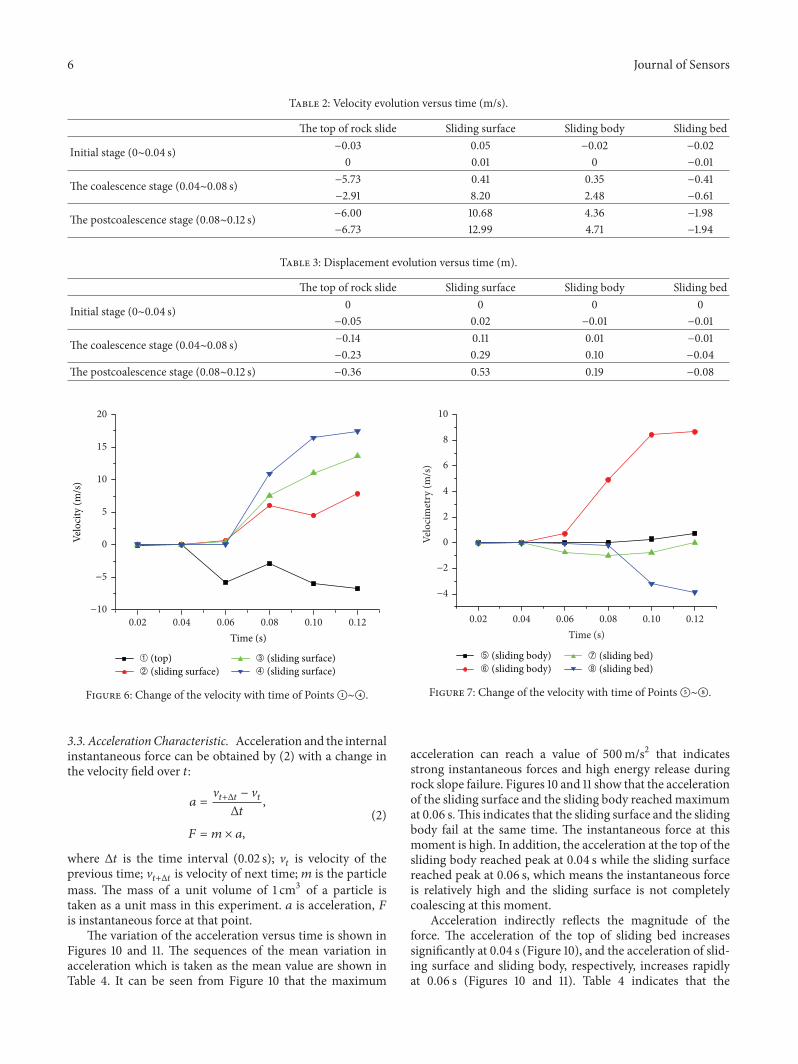
Table 2 showed that the velocity along the sliding surfaceis the highest (20m/s), and the velocity of the sliding bed isrelatively small. Figure 6 shows that the velocity of Point Awas −5.71m/s at 0.06 s while the other point in the slidingsurface was almost zero at that time; this was the beginningmoment of rock slope failure. It can be seen from Figure 6that the velocities of Point E and Point F are different,and the sliding bed and the sliding surface have the samephenomenon.
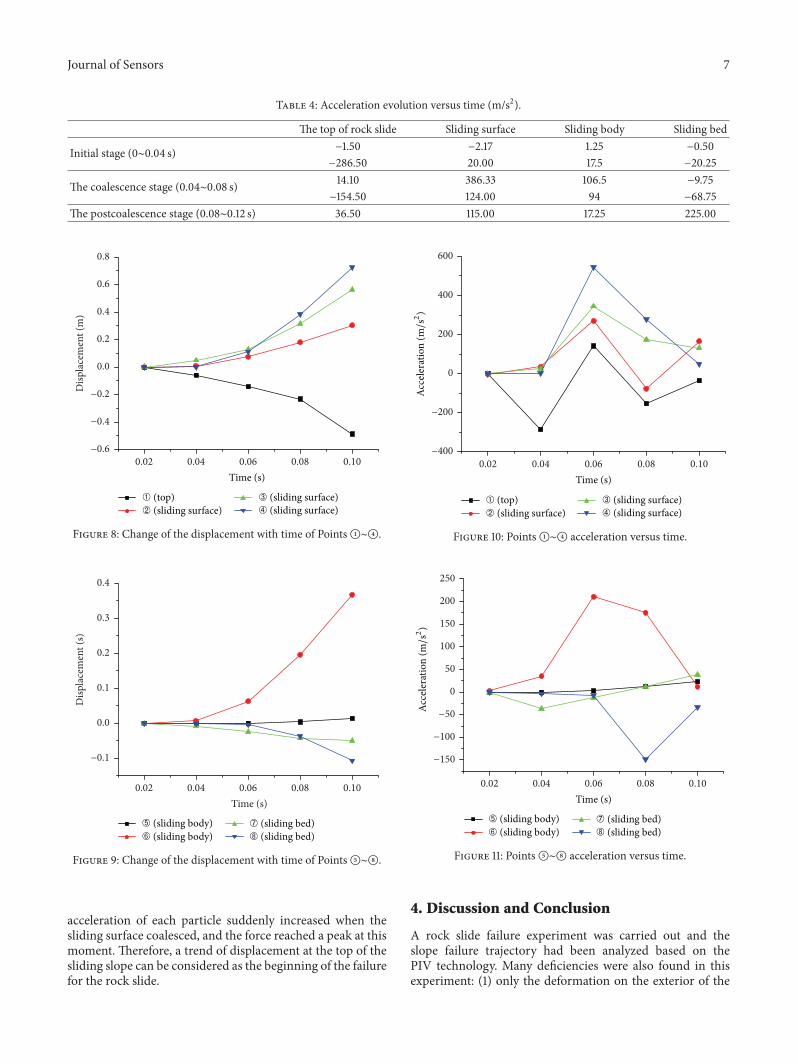
It can be seen from Figures 8 and 9 that the displacementincreases with failure time. The failure happened in thesliding body first, then the sliding body start to collapsed ata uniform velocity, and finally the deformation comes intoa accelerative stage until the complete failure of the slope.It can be seen from Table 3 that the average deformationon the sliding surface is the largest (0.29m) and the averagedeformation on the sliding bed is relatively small (0.1m).
6 Journal of Sensors
Table 2: Velocity evolution versus time (m/s).
The top of rock slide Sliding surface Sliding body Sliding bed
Initial stage (0∼0.04 s) −0.03 0.05 −0.02 −0.020 0.01 0 −0.01
The coalescence stage (0.04∼0.08 s) −5.73 0.41 0.35 −0.41−2.91 8.20 2.48 −0.61
The postcoalescence stage (0.08∼0.12 s) −6.00 10.68 4.36 −1.98−6.73 12.99 4.71 −1.94
Table 3: Displacement evolution versus time (m).
The top of rock slide Sliding surface Sliding body Sliding bed
Initial stage (0∼0.04 s) 0 0 0 0−0.05 0.02 −0.01 −0.01
The coalescence stage (0.04∼0.08 s) −0.14 0.11 0.01 −0.01−0.23 0.29 0.10 −0.04
The postcoalescence stage (0.08∼0.12 s) −0.36 0.53 0.19 −0.08
0.04 0.06 0.08 0.10 0.120.02−10
−5
0
5
10
15
20
Velo
city
(m/s
)
Time (s)
➀ (top)➁ (sliding surface)
➂ (sliding surface)➃ (sliding surface)
Figure 6: Change of the velocity with time of PointsA∼D.
3.3. AccelerationCharacteristic. Acceleration and the internalinstantaneous force can be obtained by (2) with a change inthe velocity field over 𝑡:
𝑎 =V𝑡+Δ𝑡− V𝑡
Δ𝑡,
𝐹 = 𝑚 × 𝑎,
(2)
where Δ𝑡 is the time interval (0.02 s); V𝑡is velocity of the
previous time; V𝑡+Δ𝑡
is velocity of next time; 𝑚 is the particlemass. The mass of a unit volume of 1 cm3 of a particle istaken as a unit mass in this experiment. 𝑎 is acceleration, 𝐹is instantaneous force at that point.
The variation of the acceleration versus time is shown inFigures 10 and 11. The sequences of the mean variation inacceleration which is taken as the mean value are shown inTable 4. It can be seen from Figure 10 that the maximum
−4
−2
0
2
4
6
8
10Ve
loci
met
ry (m
/s)
0.04 0.06 0.08 0.10 0.120.02Time (s)
➄ (sliding body)➅ (sliding body)
➆ (sliding bed)➇ (sliding bed)
Figure 7: Change of the velocity with time of PointsE∼H.
acceleration can reach a value of 500m/s2 that indicatesstrong instantaneous forces and high energy release duringrock slope failure. Figures 10 and 11 show that the accelerationof the sliding surface and the sliding body reachedmaximumat 0.06 s.This indicates that the sliding surface and the slidingbody fail at the same time. The instantaneous force at thismoment is high. In addition, the acceleration at the top of thesliding body reached peak at 0.04 s while the sliding surfacereached peak at 0.06 s, which means the instantaneous forceis relatively high and the sliding surface is not completelycoalescing at this moment.
Acceleration indirectly reflects the magnitude of theforce. The acceleration of the top of sliding bed increasessignificantly at 0.04 s (Figure 10), and the acceleration of slid-ing surface and sliding body, respectively, increases rapidlyat 0.06 s (Figures 10 and 11). Table 4 indicates that the
Journal of Sensors 7
Table 4: Acceleration evolution versus time (m/s2).
The top of rock slide Sliding surface Sliding body Sliding bed
Initial stage (0∼0.04 s) −1.50 −2.17 1.25 −0.50−286.50 20.00 17.5 −20.25
The coalescence stage (0.04∼0.08 s) 14.10 386.33 106.5 −9.75−154.50 124.00 94 −68.75
The postcoalescence stage (0.08∼0.12 s) 36.50 115.00 17.25 225.00
−0.6
−0.4
−0.2
0.0
0.2
0.4
0.6
0.8
Disp
lace
men
t (m
)
0.04 0.06 0.08 0.100.02
➀ (top)➁ (sliding surface)
➂ (sliding surface)➃ (sliding surface)
Time (s)
Figure 8: Change of the displacement with time of PointsA∼D.
−0.1
0.0
0.1
0.2
0.3
0.4
Disp
lace
men
t (s)
0.04 0.06 0.08 0.100.02Time (s)
➄ (sliding body)➅ (sliding body)
➆ (sliding bed)➇ (sliding bed)
Figure 9: Change of the displacement with time of PointsE∼H.
acceleration of each particle suddenly increased when thesliding surface coalesced, and the force reached a peak at thismoment. Therefore, a trend of displacement at the top of thesliding slope can be considered as the beginning of the failurefor the rock slide.
−400
−200
0
200
400
600
Acce
lera
tion
(m/s2)
0.04 0.06 0.08 0.100.02Time (s)
➀ (top)➁ (sliding surface)
➂ (sliding surface)➃ (sliding surface)
Figure 10: PointsA∼D acceleration versus time.
−150
−100
−50
0
50
100
150
200
250
Acce
lera
tion
(m/s2)
➄ (sliding body)➅ (sliding body)
➆ (sliding bed)➇ (sliding bed)
0.04 0.06 0.08 0.100.02Time (s)
Figure 11: PointsE∼H acceleration versus time.
4. Discussion and Conclusion
A rock slide failure experiment was carried out and theslope failure trajectory had been analyzed based on thePIV technology. Many deficiencies were also found in thisexperiment: (1) only the deformation on the exterior of the
8 Journal of Sensors
model in a two-dimensional plane can be monitored withthe PIV equipment. The development of the internal crackneeds to bemonitoredwith other techniques, such as acousticemission. (2) The PIV camera was placed at a long distancein order to avoid brittle failure. Additionally, other devicesplaced on the rock surface (like strain gauges) will disruptthe vector lines of the moving mass when the rock failureis completely destroyed. This leads to some disruption of thevector lines, which will have a certain impact on the accuracyof the final data (Figures 4 and 5). (3) In this experiment,the influence of model dimension was not considered; theposition of jack pressure can alsomake an influence onmodeltest. During the rock slope failure, the internal friction maybecome a factor for the upward moving phenomenon at thetop of the sliding bed, which needs further discussion andexploration.
The conclusion can be summarized as follows:
(1) PIV observes the temporal and spatial evolutionregularity of the motion parameters for the wholerock slide. By using high-speed camera and the sensortechnology, the failure pictures for rock slide aretransformed into velocity and displacement vectors.Trials found that the crack first appeared on the top ofthe slope, then the sliding surface collapsed, and thesliding body failed with a circular shape. Finally thesliding body completely dumped, and the rock slidefailure was finished.
(2) It can be concluded that the direction of the displace-ment of the sliding body is first towards the slopebed side, and then it turns to the slope free surfaceand finally continues moving towards the slope freesurface; the velocity is relatively high. The sliding bedmoves to the opposite direction and the velocity isrelatively small. It can also be found that the points inthe same part of the rock slope can also have differentlaw of motion and the deep region of the rock slopedoes not have a large amount of deformation.
(3) The acceleration of the different parts of the rock slidereaches maximum at different moments: the top ofthe sliding bed reaches the peak first, followed by thesliding surface and the sliding body. The maximumacceleration appears in the sliding surface, whichmeans a high energy release for the rock slide. Theupward movement of the top of the sliding bed canbe a warning sign for rock slide failure.
Competing Interests
The authors declare that they have no competing interests.
Acknowledgments
This work is supported by the National Basic ResearchProgram of China (973 Program, no. 2013CB733202) andthe National Natural Science Foundation of China (Grantnos. 41130745, 41572283, and 41272330). This work is alsosupported by the funding of Science and Technology Office
of Sichuan Province (Grant no. 2015JQ0020). This work issupported by the Research Fund of the State Key Labora-tory of Geohazard Prevention and Geoenvironment Protec-tion (Chengdu University of Technology) under Grant nos.SKLGP2012Z003 and SKLGP2009Z015.
References
[1] R. Q. Huang, G. Q. Chen, F. Guo, G. F. Zhang, and Y. Zhang,“Experimental study on the brittle failure of the locking sectionin a large-scale rock slide,” Landslides, 2016.
[2] G. Q. Chen, R. Q. Huang, Q. Xu, and T. B. Li, “Preventionof the natural landslide disaster based on the deformationmanagement level,” Disaster Advances, vol. 5, no. 4, pp. 1307–1312, 2012.
[3] X.-T. Feng and M. Seto, “Fractal structure of the time dis-tribution of microfracturing in rocks,” Geophysical JournalInternational, vol. 136, no. 1, pp. 275–285, 1999.
[4] C.-S. Tang, B. Shi, C. Liu, W.-B. Suo, and L. Gao, “Experimentalcharacterization of shrinkage and desiccation cracking in thinclay layer,” Applied Clay Science, vol. 52, no. 1-2, pp. 69–77, 2011.
[5] Q. Jiang, X.-T. Feng, J. Chen, K. Huang, and Y.-L. Jiang,“Estimating in-situ rock stress from spalling veins: a case study,”Engineering Geology, vol. 152, no. 1, pp. 38–47, 2013.
[6] N.-W. Xu, C.-A. Tang, H. Li et al., “Excavation-inducedmicroseismicity: microseismic monitoring and numerical sim-ulation,” Journal of Zhejiang University: Applied Physics andEngineering, vol. 13, no. 6, pp. 445–460, 2012.
[7] N. W. Xu, C. A. Tang, L. C. Li et al., “Microseismic monitoringand stability analysis of the left bank slope in Jinping firststage hydropower station in southwestern China,” InternationalJournal of Rock Mechanics & Mining Sciences, vol. 48, no. 6, pp.950–963, 2011.
[8] N. W. Xu, F. Dai, Z. Z. Liang, Z. Zhou, C. Sha, and C. A. Tang,“The dynamic evaluation of rock slope stability consideringthe effects of microseismic damage,” Rock Mechanics and RockEngineering, vol. 47, no. 2, pp. 621–642, 2014.
[9] G. Q. Chen, Y. Zhang, R. Q. Huang, F. Guo, and G. Zhang,“Failure mechanism of rock bridge based on acoustic emissiontechnique,” Journal of Sensors, vol. 2015, Article ID 964730, 11pages, 2015.
[10] D.-S. Cheon, Y.-B. Jung, E.-S. Park, W.-K. Song, and H.-I.Jang, “Evaluation of damage level for rock slopes using acousticemission technique with waveguides,” Engineering Geology, vol.121, no. 1-2, pp. 75–88, 2011.
[11] G.-Q. Chen, R.-Q. Huang, Q. Xu, T.-B. Li, and M.-L. Zhu,“Progressive modelling of the gravity-induced landslide usingthe local dynamic strength reduction method,” Journal ofMountain Science, vol. 10, no. 4, pp. 532–540, 2013.
[12] J. Shen andM.Karakus, “Three-dimensional numerical analysisfor rock slope stability using shear strength reduction method,”Canadian Geotechnical Journal, vol. 51, no. 2, pp. 164–172, 2014.
[13] C. Tang, B. Shi, W. Gao, F. Chen, and Y. Cai, “Strength andmechanical behavior of short polypropylene fiber reinforcedand cement stabilized clayey soil,” Geotextiles and Geomem-branes, vol. 25, no. 3, pp. 194–202, 2007.
[14] S. J. Li, H. Gao, D. M. Xu, and F. Meng, “Comprehensivedetermination of reinforcement parameters for high cut slopebased on intelligent optimization and numerical analysis,”Journal of Earth Science, vol. 23, no. 2, pp. 233–242, 2012.
Journal of Sensors 9
[15] X.-T. Feng and J. A. Hudson, “Specifying the informationrequired for rock mechanics modelling and rock engineeringdesign,” International Journal of Rock Mechanics and MiningSciences, vol. 47, no. 2, pp. 179–194, 2010.
[16] X. T. Feng and J. A. Hudson, Rock Engineering Design, CRCPress, Boca Raton, Fla, USA, 2011.
[17] Z.-M. Shi, Y.-Q. Wang, M. Peng, S.-G. Guan, and J.-F. Chen,“Landslide dam deformation analysis under aftershocks usinglarge-scale shaking table tests measured by videogrammetrictechnique,” Engineering Geology, vol. 186, pp. 68–78, 2015.
[18] Y. R. Li, B. P.Wen,A.Aydin, andN. P. Ju, “Ring shear tests on slipzone soils of three giant landslides in the Three Gorges Projectarea,” Engineering Geology, vol. 154, pp. 106–115, 2013.
[19] S. Friedel, A. Thielen, and S. M. Springman, “Investigation ofa slope endangered by rainfall-induced landslides using 3Dresistivity tomography and geotechnical testing,” Journal ofApplied Geophysics, vol. 60, no. 2, pp. 100–114, 2006.
[20] M. Pieraccini, N. Casagli, G. Luzi et al., “Landslide monitoringby ground-based radar interferometry: a field test in Valdarno(Italy),” International Journal of Remote Sensing, vol. 24, no. 6,pp. 1385–1391, 2003.
[21] H.-H. Zhu, B. Shi, J.-F. Yan, J. Zhang, and J.Wang, “Investigationof the evolutionary process of a reinforced model. Slope using afiber-optic monitoring network,” Engineering Geology, vol. 186,pp. 34–43, 2015.
[22] H.-H. Zhu, B. Shi, J.-F. Yan, J. Zhang, C.-C. Zhang, and B.-J. Wang, “Fiber Bragg grating-based performance monitoringof a slope model subjected to seepage,” Smart Materials andStructures, vol. 23, no. 9, Article ID 095027, 2014.
[23] H.-H. Zhu, A. N. L. Ho, J.-H. Yin, H. W. Sun, H.-F. Pei, andC.-Y. Hong, “An optical fibre monitoring system for evaluatingthe performance of a soil nailed slope,” Smart Structures andSystems, vol. 9, no. 5, pp. 393–410, 2012.
[24] H.-H. Zhu, J.-H. Yin, L. Zhang, W. Jin, and J.-H. Dong,“Monitoring internal displacements of a model dam using FBGsensing bars,” Advances in Structural Engineering, vol. 13, no. 2,pp. 249–261, 2010.
[25] H. Zheng, J. A. Dijksman, and R. P. Behringer, “Shear jammingin granular experiments without basal friction,” EurophysicsLetters, vol. 107, no. 3, Article ID 34005, 2014.
[26] H. J. Wang, D. A. Liu, W. L. Gong, and L. Y. Li, “Dynamicanalysis of granite rockburst based on the PIV technique,”International Journal of Mining Science and Technology, vol. 2,pp. 275–283, 2015.
[27] M. S. Morse, N. Lu, A. Wayllace, J. W. Godt, and W. A.Take, “Experimental test of theory for the stability of partiallysaturated vertical cut slopes,” Journal of Geotechnical andGeoen-vironmental Engineering, vol. 140, no. 9, Article ID 04014050,2014.
[28] H. O. Baba and S. Peth, “Large scale soil box test to investigatesoil deformation and creep movement on slopes by ParticleImage Velocimetry (PIV),” Soil and Tillage Research, vol. 125,pp. 38–43, 2012.
[29] R.-H. Chen, K. J. Kuo, Y.-N. Chen, and C.-W. Ku, “Model testsfor studying the failure mechanism of dry granular soil slopes,”Engineering Geology, vol. 119, no. 1-2, pp. 51–63, 2011.
[30] A. Aryal, B. A. Brooks, M. E. Reid, G. W. Bawden, and G. R.Pawlak, “Displacement fields from point cloud data: applicationof particle imaging velocimetry to landslide geodesy,” Journal ofGeophysical Research: Earth Surface, vol. 117, no. 1, Article IDF01029, 2012.

International Journal of
AerospaceEngineeringHindawi Publishing Corporationhttp://www.hindawi.com Volume 2014
RoboticsJournal of
Hindawi Publishing Corporationhttp://www.hindawi.com Volume 2014
Hindawi Publishing Corporationhttp://www.hindawi.com Volume 2014
Active and Passive Electronic Components
Control Scienceand Engineering
Journal of
Hindawi Publishing Corporationhttp://www.hindawi.com Volume 2014
International Journal of
RotatingMachinery
Hindawi Publishing Corporationhttp://www.hindawi.com Volume 2014
Hindawi Publishing Corporation http://www.hindawi.com
Journal ofEngineeringVolume 2014
Submit your manuscripts athttp://www.hindawi.com
VLSI Design
Hindawi Publishing Corporationhttp://www.hindawi.com Volume 2014
Hindawi Publishing Corporationhttp://www.hindawi.com Volume 2014
Shock and Vibration
Hindawi Publishing Corporationhttp://www.hindawi.com Volume 2014
Civil EngineeringAdvances in
Acoustics and VibrationAdvances in
Hindawi Publishing Corporationhttp://www.hindawi.com Volume 2014
Hindawi Publishing Corporationhttp://www.hindawi.com Volume 2014
Electrical and Computer Engineering
Journal of
Advances inOptoElectronics
Hindawi Publishing Corporation http://www.hindawi.com
Volume 2014
The Scientific World JournalHindawi Publishing Corporation http://www.hindawi.com Volume 2014
SensorsJournal of
Hindawi Publishing Corporationhttp://www.hindawi.com Volume 2014
Modelling & Simulation in EngineeringHindawi Publishing Corporation http://www.hindawi.com Volume 2014
Hindawi Publishing Corporationhttp://www.hindawi.com Volume 2014
Chemical EngineeringInternational Journal of Antennas and
Propagation
International Journal of
Hindawi Publishing Corporationhttp://www.hindawi.com Volume 2014
Hindawi Publishing Corporationhttp://www.hindawi.com Volume 2014
Navigation and Observation
International Journal of
Hindawi Publishing Corporationhttp://www.hindawi.com Volume 2014
DistributedSensor Networks
International Journal of


![[ITA] Acceleration methods for PageRank](https://static.fdokumen.com/doc/165x107/6321641780403fa2920cb95c/ita-acceleration-methods-for-pagerank.jpg)