3d acceleration for heat detection in dairy cows
14
3d acceleration for heat detection in dairy cows Sebastián R. Vanrell 1,2 , José O. Chelotti 1 , Julio R. Galli 3 , Hugo L. Rufiner 1,2 , and Diego H. Milone 1,2 1 sinc(i ) – Centro de Investigación en Señales, Sistemas e Inteligencia Computacional Facultad de Ingeniería y Ciencias Hídricas – Universidad Nacional del Litoral 2 CONICET – Consejo Nacional de Investigaciones Científicas y Técnicas 3 Facultad de Ciencias Agrarias – Universidad Nacional de Rosario Abstract. Accurate and reliable detection of heat in dairy cows is es- sential for a controlled reproduction and therefore, for maintaining milk production. Classical approaches like visual identification are no longer viable on large dairy herds. Several automated techniques of detection have been proposed, but expected results are only achieved by expen- sive or invasive methods, because practical methods are not reliable. We present a method that aims to be both practical and accurate. It is based on simple attributes extracted from 3D acceleration data and well known classifiers: multilayer perceptrons, support vector machines and decision trees. Results show promising detection ratios, above 90% in several configurations of the detection system. Best results are achieved with multilayer perceptrons. This information could be readily incorpo- rated to the automated system in a dairy farm and help to improve its efficiency. Keywords: estrus recognition, dairy cattle, binary classification, mul- tilayer perceptron, support vector machine, decision tree, accelerometer 1 Introduction Dairy cows must calve on intervals of 12-14 months to maximize average daily milk production on their lifetime. A deficient detection of heat (estrus) is one of the main factors that negatively affects calving intervals and reproductive management. Timely insemination is crucial for reproduction and heat detection is the key to the successful use of artificial insemination [1]. The most common cause of a poor detection of heat is failure to watch cows for long enough periods. Cows should be watched at least three times a day, for a period of 20-30 minutes. Thus, as monitoring technology progress, several systems for automated heat detection has been proposed [2]. However, current methods show satisfactory results only for expensive measurements, while simpler methods present high error rates and none of them is completely automatic. Cows go into heat with an average cycle of 21 days (normal cycle may vary from 18 to 24 days). The average duration of standing heat is 18 hours, and periods between 12 and 24 hours are considered normal. Hot and cold environ- mental temperatures tend to reduce the length of estrous periods, and increase sinc( i) Research Center for Signals, Systems and Computational Intelligence (fich.unl.edu.ar/sinc) S. R. Vanrell, J. O. Chelotti, J. Galli, H. L. Rufiner & D. H. Milone; "3D acceleration for heat detection in dairy cows" Congreso Argentino de Agroinformática (CAI 2014) - 43º JAIIO, pp. 121-134, 2014.
Transcript of 3d acceleration for heat detection in dairy cows
3d acceleration for heat detection in dairy cows
Sebastián R. Vanrell1,2, José O. Chelotti1, Julio R. Galli3, Hugo L. Rufiner1,2,and Diego H. Milone1,2
1 sinc(i) – Centro de Investigación en Señales, Sistemas e Inteligencia ComputacionalFacultad de Ingeniería y Ciencias Hídricas – Universidad Nacional del Litoral
2 CONICET – Consejo Nacional de Investigaciones Científicas y Técnicas3 Facultad de Ciencias Agrarias – Universidad Nacional de Rosario
Abstract. Accurate and reliable detection of heat in dairy cows is es-sential for a controlled reproduction and therefore, for maintaining milkproduction. Classical approaches like visual identification are no longerviable on large dairy herds. Several automated techniques of detectionhave been proposed, but expected results are only achieved by expen-sive or invasive methods, because practical methods are not reliable. Wepresent a method that aims to be both practical and accurate. It isbased on simple attributes extracted from 3D acceleration data and wellknown classifiers: multilayer perceptrons, support vector machines anddecision trees. Results show promising detection ratios, above 90% inseveral configurations of the detection system. Best results are achievedwith multilayer perceptrons. This information could be readily incorpo-rated to the automated system in a dairy farm and help to improve itsefficiency.
Keywords: estrus recognition, dairy cattle, binary classification, mul-tilayer perceptron, support vector machine, decision tree, accelerometer
1 Introduction
Dairy cows must calve on intervals of 12-14 months to maximize average dailymilk production on their lifetime. A deficient detection of heat (estrus) is oneof the main factors that negatively affects calving intervals and reproductivemanagement. Timely insemination is crucial for reproduction and heat detectionis the key to the successful use of artificial insemination [1]. The most commoncause of a poor detection of heat is failure to watch cows for long enough periods.Cows should be watched at least three times a day, for a period of 20-30 minutes.Thus, as monitoring technology progress, several systems for automated heatdetection has been proposed [2]. However, current methods show satisfactoryresults only for expensive measurements, while simpler methods present higherror rates and none of them is completely automatic.
Cows go into heat with an average cycle of 21 days (normal cycle may varyfrom 18 to 24 days). The average duration of standing heat is 18 hours, andperiods between 12 and 24 hours are considered normal. Hot and cold environ-mental temperatures tend to reduce the length of estrous periods, and increase
sinc
(i)
Res
earc
h C
ente
r fo
r Si
gnal
s, S
yste
ms
and
Com
puta
tiona
l Int
ellig
ence
(fi
ch.u
nl.e
du.a
r/si
nc)
S. R
. Van
rell,
J. O
. Che
lotti
, J. G
alli,
H. L
. Ruf
iner
& D
. H. M
ilone
; "3D
acc
eler
atio
n fo
r he
at d
etec
tion
in d
airy
cow
s"C
ongr
eso
Arg
entin
o de
Agr
oinf
orm
átic
a (C
AI
2014
) -
43º
JAII
O, p
p. 1
21-1
34, 2
014.
the difficulty in detecting heat [1]. Successful artificial insemination relies oncorrect heat identification because it is only possible in a short-time windowafter heat [3]. Missing a cycle will delay the next calving unnecessarily, causingeconomical and sustainability complications.
When a cow is in heat exhibits behavioral patterns which are distinctly dif-ferent from the rest of the estrous cycle. For example, some signs of heat are:increased nervousness and/or restlessness which result in greater physical activ-ity, cows that mount each other, and group formation of sexually active cows [1].Except for [3], no works on automatic recognition of heat behaviors has beenfound in the literature. In similar problems, identification of behaviors or ac-tivities from sensors has been tried on humans [4, 5] and animals [6–10]. Forexample, authors in [4] attempted to identify everyday human activities withwearable sensors. In [7] is presented an automatic system that decodes ingestivesounds of cattle and gives information of grazing behavior. In [10] a methodfor behavior recognition of cows using a 3D accelerometer and support vectormachine is proposed. Behaviors analyzed —such as standing, feeding, walking—were distinguishable by direct observation of a non expert. However, visual de-tection of heat behavior is possible but require an expert. Some activities last forminutes and other just for a few seconds ill conditioning the detection problem.Classification shows weak results because some behaviors were often confused.
In the past two decades several methods have been proposed for automaticheat detection [2]. Some of them have excellent accuracy but they involve mea-surements that are expensive, impractical or invasive. For example, body ormilk temperature were considered, but they are not useful for practical applica-tions, since both are highly influenced by external factors [11]. Milk progesteroneachieved good rates of detection but at the expense of high costs and extra labor.Voluntary activity of cows were considered as an important indicator of heat, butadditional observations and the use of a cow calendar are suggested as necessaryconditions for sufficiently high detection. In recent years, technological improve-ments have enabled the development of devices that combine activity sensingwith other measurements, such as lying/standing conditions. For example, in [3]a change detection algorithm was proposed by combining information from stepcount and lying time.
Acceleration signals have been found as a feasible source for automated iden-tification of behavior patterns in animals and humans [9, 8, 12], however, no at-tempts to automatically detect heat from acceleration data have been reported.In this work is presented a strategy that has shown promising results and thathas several advantages: data is collected in a simple and not invasive way, byattaching the device to the collar of the animal; recording device and data pro-cessor are not expensive; data processing is fast, results can be obtained secondsafter that data is downloaded from the device; expert can concentrate only onthose cows that show altered behaviors, a useful attribute in large herds. Acceler-ation records are filtered and segmented. After that, simple statistical attributesare extracted from each segment. Extracted features from a segment are shownto a classifier, which decides if the record belongs to a normal cow or a cow in
sinc
(i)
Res
earc
h C
ente
r fo
r Si
gnal
s, S
yste
ms
and
Com
puta
tiona
l Int
ellig
ence
(fi
ch.u
nl.e
du.a
r/si
nc)
S. R
. Van
rell,
J. O
. Che
lotti
, J. G
alli,
H. L
. Ruf
iner
& D
. H. M
ilone
; "3D
acc
eler
atio
n fo
r he
at d
etec
tion
in d
airy
cow
s"C
ongr
eso
Arg
entin
o de
Agr
oinf
orm
átic
a (C
AI
2014
) -
43º
JAII
O, p
p. 1
21-1
34, 2
014.
heat. Tested classifiers are multilayer perceptrons, support vector machines anddecision trees.
The rest of this article is organized as follows: Section 2 introduces the an-alyzed signals and gives a detailed description of the detection method, includ-ing feature extraction and classification. Section 3 describes data collection anddatasets generation. Results are presented and discussed in Section 4 and finallythe conclusions are given in Section 5.
2 Detection method
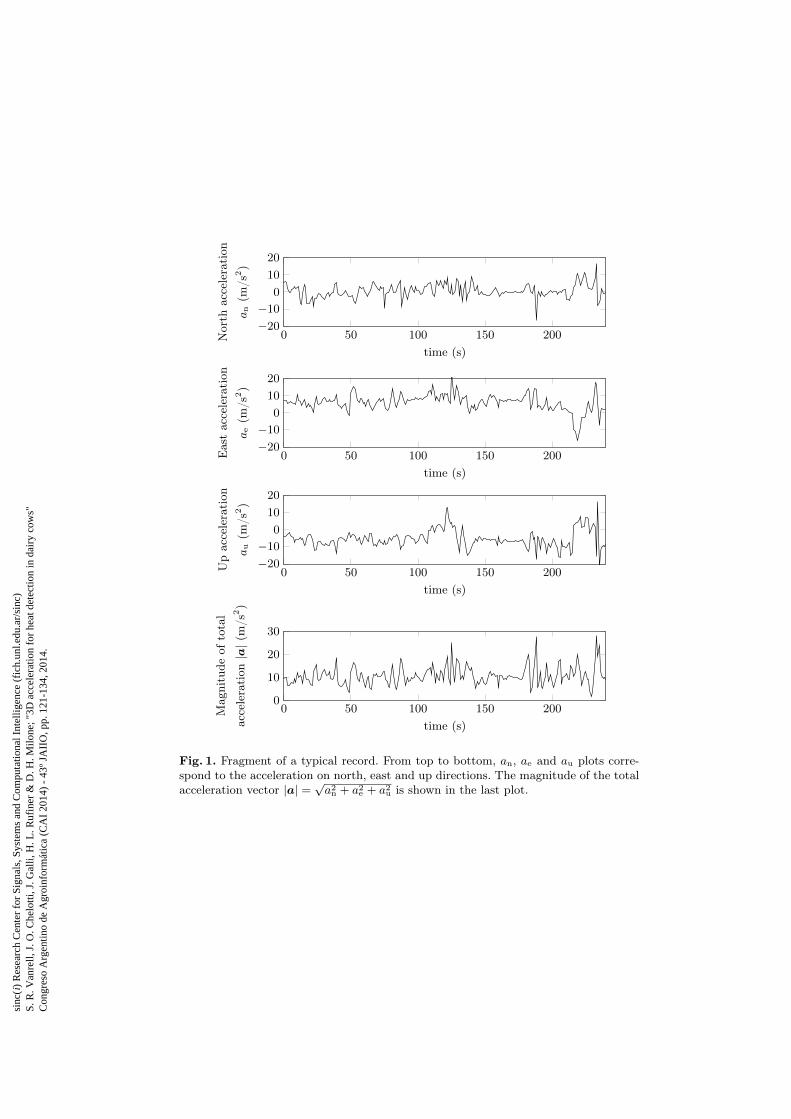
Analyzed signals consist of three-dimensional acceleration varying through time.A fragment of a typical acceleration record is shown in Fig. 1. The three upperplots correspond to the acceleration on north (an), east (ae), and up (au) direc-tions. The bottom plot represents the magnitude of the total acceleration vector|a| =
√a2n + a2e + a2u. Accelerations on vertical axes are given in m/s2. Time
on horizontal axes is given in s. Visual differences are not evident when signalsrecorded on normal cows and cows in heat are compared. Thus, a threshold, orsome other rule, can not be defined.
A pattern recognition approach where the proposed system learns from la-beled examples is applied. In a simplified scheme, the recognition system canbe seen as a pipeline with two main stages: feature extraction (Section 2.1) andclassification (Section 2.2). The feature extraction stage involves the conversionof the raw signal into a vector of attributes. In the classification stage, these fea-ture vectors are given as an input to the classifier, which estimates the class thateach vector belongs to. In the following subsections both stages will be explainedin detail.
2.1 Basic feature extraction
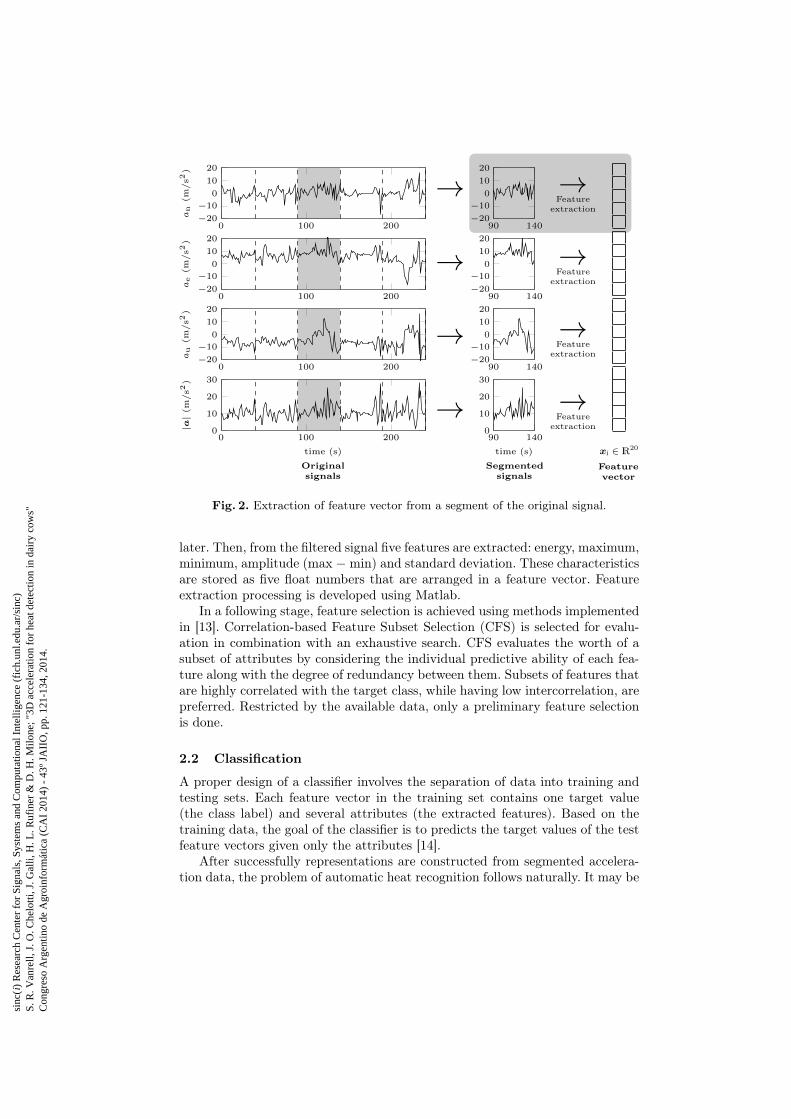
The problem of interest is the detection of discriminative changes in the dy-namic patterns contained in the records. A record could be extremely long andthe translation into only one feature vector would not be the best choice. Further-more, records of different duration are the typical situation. A common strategyin the field of signal processing involves the division of the original records intotime fixed-length segments and then the translation of each segment into a fea-ture vector. The flow of this processing strategy can be seen in Fig. 2. Each fea-ture vector xi represents a segment labeled as i and is integrated by attributesextracted from an, ae, au and |a|. Therefore, from each record a collection offeature vectors is generated. Five attributes are extracted from the accelerationsignal in each direction, which finally are organized to form a feature vector xi
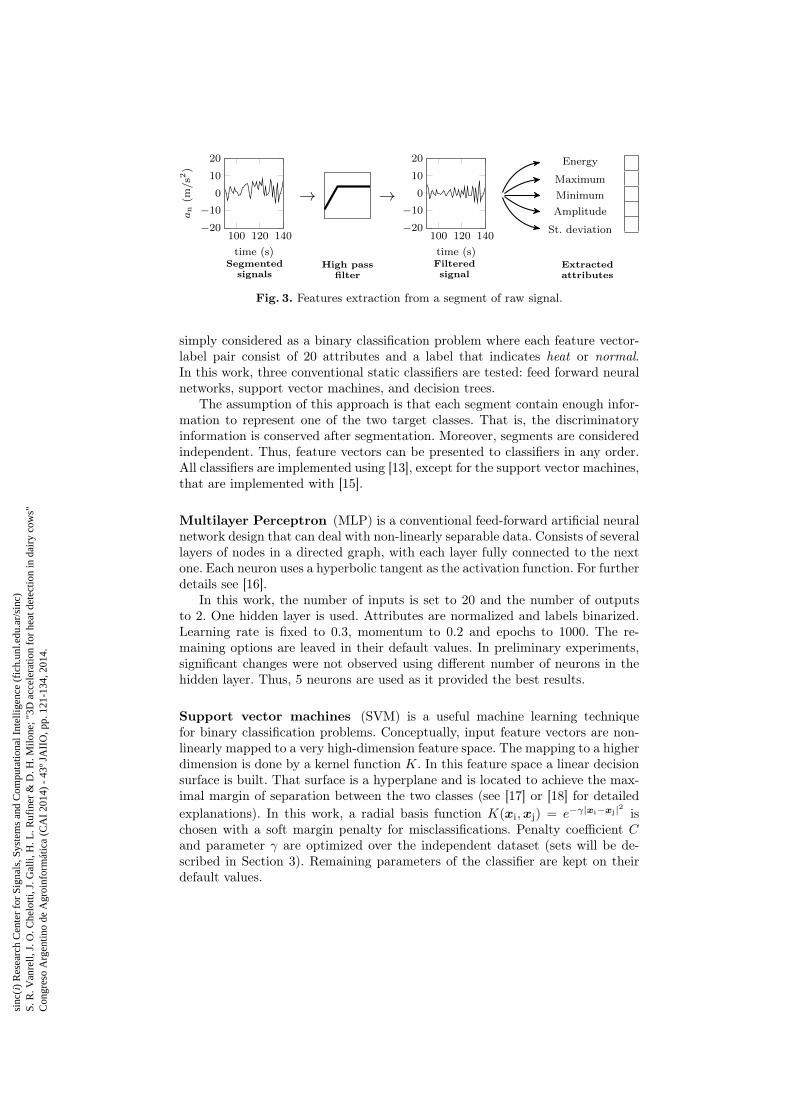
of twenty elements.The shadowed area in Fig. 2 corresponds to the feature extraction detailed
for an in Fig. 3. The same is applicable to au, ae and |a|. First, a high passfilter is applied to the an segment, thus, baseline components of the signal areseparated from those related to movements. The cutoff frequency will be defined
sinc
(i)
Res
earc
h C
ente
r fo
r Si
gnal
s, S
yste
ms
and
Com
puta
tiona
l Int
ellig
ence
(fi
ch.u
nl.e
du.a
r/si
nc)
S. R
. Van
rell,
J. O
. Che
lotti
, J. G
alli,
H. L
. Ruf
iner
& D
. H. M
ilone
; "3D
acc
eler
atio
n fo
r he
at d
etec
tion
in d
airy
cow
s"C
ongr
eso
Arg
entin
o de
Agr
oinf
orm
átic
a (C
AI
2014
) -
43º
JAII
O, p
p. 1
21-1
34, 2
014.
0 50 100 150 200−20−10
0
10
20
time (s)
Eastacceleration
ae(m
/s2)
0 50 100 150 200−20−10
0
10
20
time (s)
North
acceleration
an(m
/s2)
0 50 100 150 200−20−10
0
10
20
time (s)
Upacceleration
au(m
/s2)
0 50 100 150 2000
10
20
30
time (s)
Magnitude
oftotal
acceleration
|a|(m/s
2)
Fig. 1. Fragment of a typical record. From top to bottom, an, ae and au plots corre-spond to the acceleration on north, east and up directions. The magnitude of the totalacceleration vector |a| =
√a2n + a2
e + a2u is shown in the last plot.
sinc
(i)
Res
earc
h C
ente
r fo
r Si
gnal
s, S
yste
ms
and
Com
puta
tiona
l Int
ellig
ence
(fi
ch.u
nl.e
du.a
r/si
nc)
S. R
. Van
rell,
J. O
. Che
lotti
, J. G
alli,
H. L
. Ruf
iner
& D
. H. M
ilone
; "3D
acc
eler
atio
n fo
r he
at d
etec
tion
in d
airy
cow
s"C
ongr
eso
Arg
entin
o de
Agr
oinf
orm
átic
a (C
AI
2014
) -
43º
JAII
O, p
p. 1
21-1
34, 2
014.
0 100 200−20
−10
0
10
20
ae
(m/s2
)
0 100 200−20
−10
0
10
20
an
(m/s2
)
0 100 200−20
−10
0
10
20
au
(m/s2
)
0 100 2000
10
20
30
time (s)
|a|(m
/s2
)→
→
→
→
90 140−20
−10
0
10
20
90 140−20
−10
0
10
20
90 140−20
−10
0
10
20
90 1400
10
20
30
time (s)
→Feature
extraction
→Feature
extraction
→Feature
extraction
→Feature
extraction
xi ∈ R20
Originalsignals
Segmentedsignals
Featurevector
Fig. 2. Extraction of feature vector from a segment of the original signal.
later. Then, from the filtered signal five features are extracted: energy, maximum,minimum, amplitude (max − min) and standard deviation. These characteristicsare stored as five float numbers that are arranged in a feature vector. Featureextraction processing is developed using Matlab.
In a following stage, feature selection is achieved using methods implementedin [13]. Correlation-based Feature Subset Selection (CFS) is selected for evalu-ation in combination with an exhaustive search. CFS evaluates the worth of asubset of attributes by considering the individual predictive ability of each fea-ture along with the degree of redundancy between them. Subsets of features thatare highly correlated with the target class, while having low intercorrelation, arepreferred. Restricted by the available data, only a preliminary feature selectionis done.
2.2 Classification
A proper design of a classifier involves the separation of data into training andtesting sets. Each feature vector in the training set contains one target value(the class label) and several attributes (the extracted features). Based on thetraining data, the goal of the classifier is to predicts the target values of the testfeature vectors given only the attributes [14].
After successfully representations are constructed from segmented accelera-tion data, the problem of automatic heat recognition follows naturally. It may be
sinc
(i)
Res
earc
h C
ente
r fo
r Si
gnal
s, S
yste
ms
and
Com
puta
tiona
l Int
ellig
ence
(fi
ch.u
nl.e
du.a
r/si
nc)
S. R
. Van
rell,
J. O
. Che
lotti
, J. G
alli,
H. L
. Ruf
iner
& D
. H. M
ilone
; "3D
acc
eler
atio
n fo
r he
at d
etec
tion
in d
airy
cow
s"C
ongr
eso
Arg
entin
o de
Agr
oinf
orm
átic
a (C
AI
2014
) -
43º
JAII
O, p
p. 1
21-1
34, 2
014.
100 120 140−20
−10
0
10
20
time (s)
an(m
/s2)
→ →
100 120 140−20
−10
0
10
20
time (s)
Energy
Maximum
Minimum
Amplitude
St. deviation
Segmentedsignals
High passfilter
Filteredsignal
Extractedattributes
Fig. 3. Features extraction from a segment of raw signal.
simply considered as a binary classification problem where each feature vector-label pair consist of 20 attributes and a label that indicates heat or normal.In this work, three conventional static classifiers are tested: feed forward neuralnetworks, support vector machines, and decision trees.
The assumption of this approach is that each segment contain enough infor-mation to represent one of the two target classes. That is, the discriminatoryinformation is conserved after segmentation. Moreover, segments are consideredindependent. Thus, feature vectors can be presented to classifiers in any order.All classifiers are implemented using [13], except for the support vector machines,that are implemented with [15].
Multilayer Perceptron (MLP) is a conventional feed-forward artificial neuralnetwork design that can deal with non-linearly separable data. Consists of severallayers of nodes in a directed graph, with each layer fully connected to the nextone. Each neuron uses a hyperbolic tangent as the activation function. For furtherdetails see [16].
In this work, the number of inputs is set to 20 and the number of outputsto 2. One hidden layer is used. Attributes are normalized and labels binarized.Learning rate is fixed to 0.3, momentum to 0.2 and epochs to 1000. The re-maining options are leaved in their default values. In preliminary experiments,significant changes were not observed using different number of neurons in thehidden layer. Thus, 5 neurons are used as it provided the best results.
Support vector machines (SVM) is a useful machine learning techniquefor binary classification problems. Conceptually, input feature vectors are non-linearly mapped to a very high-dimension feature space. The mapping to a higherdimension is done by a kernel function K. In this feature space a linear decisionsurface is built. That surface is a hyperplane and is located to achieve the max-imal margin of separation between the two classes (see [17] or [18] for detailedexplanations). In this work, a radial basis function K(xi,xj) = e−γ|xi−xj|2 ischosen with a soft margin penalty for misclassifications. Penalty coefficient Cand parameter γ are optimized over the independent dataset (sets will be de-scribed in Section 3). Remaining parameters of the classifier are kept on theirdefault values.
sinc
(i)
Res
earc
h C
ente
r fo
r Si
gnal
s, S
yste
ms
and
Com
puta
tiona
l Int
ellig
ence
(fi
ch.u
nl.e
du.a
r/si
nc)
S. R
. Van
rell,
J. O
. Che
lotti
, J. G
alli,
H. L
. Ruf
iner
& D
. H. M
ilone
; "3D
acc
eler
atio
n fo
r he
at d
etec
tion
in d
airy
cow
s"C
ongr
eso
Arg
entin
o de
Agr
oinf
orm
átic
a (C
AI
2014
) -
43º
JAII
O, p
p. 1
21-1
34, 2
014.
Decision Trees (DT) are characterized by the fact that an unknown featurevector is classified into a class using one or several decision functions in a se-quential manner. In general, a decision tree consists of a root node, a numberof interior nodes, and a number of terminal nodes. The root node and interiornodes, collectively referred as non-terminal nodes, are linked into decision stages;the terminal nodes represent final classifications. Associated with the root nodeis the entire set of classes into which a feature vector may be classified. Eachnode consists of a set of classes to be discriminated, the set of features to be used,and the decision rule for performing the classification. For further details see [19,20]. In this work, a decision tree is built using the C4.5 algorithm. Changes inpruning confidence did not reflected significant differences. Thus, default settingsare used.
3 Data collection and datasets
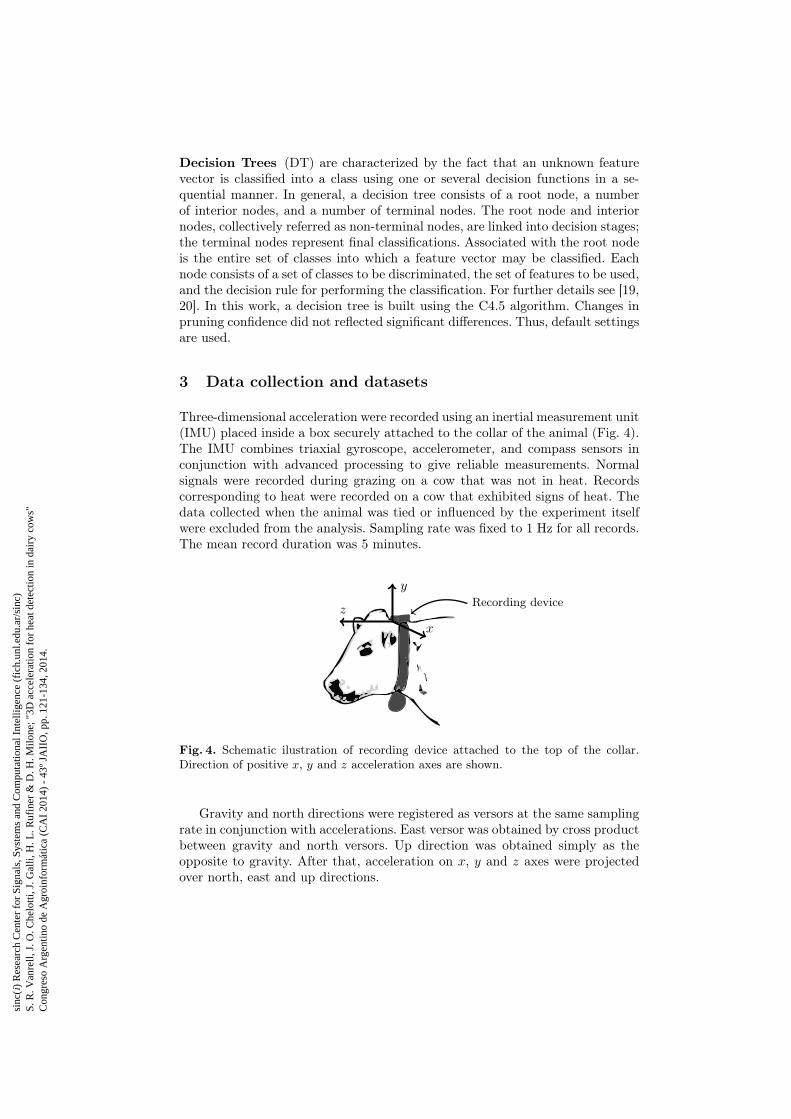
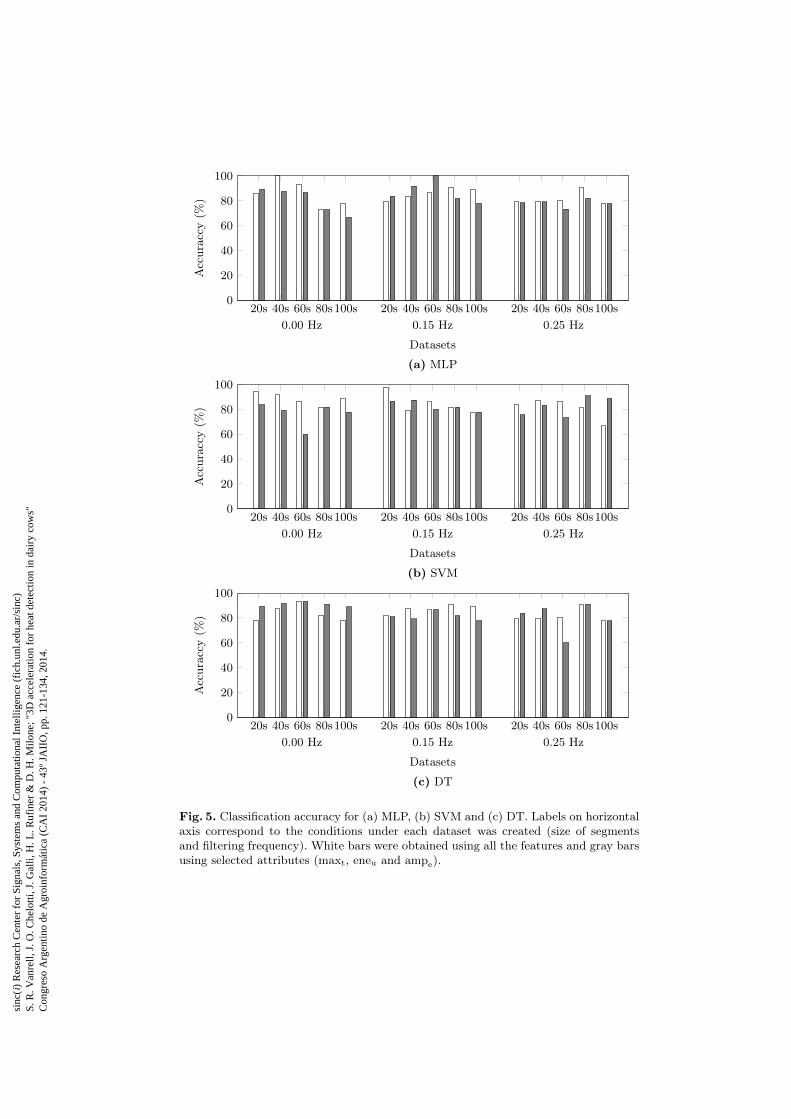
Three-dimensional acceleration were recorded using an inertial measurement unit(IMU) placed inside a box securely attached to the collar of the animal (Fig. 4).The IMU combines triaxial gyroscope, accelerometer, and compass sensors inconjunction with advanced processing to give reliable measurements. Normalsignals were recorded during grazing on a cow that was not in heat. Recordscorresponding to heat were recorded on a cow that exhibited signs of heat. Thedata collected when the animal was tied or influenced by the experiment itselfwere excluded from the analysis. Sampling rate was fixed to 1 Hz for all records.The mean record duration was 5 minutes.
x
y
zRecording device
Fig. 4. Schematic ilustration of recording device attached to the top of the collar.Direction of positive x, y and z acceleration axes are shown.
Gravity and north directions were registered as versors at the same samplingrate in conjunction with accelerations. East versor was obtained by cross productbetween gravity and north versors. Up direction was obtained simply as theopposite to gravity. After that, acceleration on x, y and z axes were projectedover north, east and up directions.
sinc
(i)
Res
earc
h C
ente
r fo
r Si
gnal
s, S
yste
ms
and
Com
puta
tiona
l Int
ellig
ence
(fi
ch.u
nl.e
du.a
r/si
nc)
S. R
. Van
rell,
J. O
. Che
lotti
, J. G
alli,
H. L
. Ruf
iner
& D
. H. M
ilone
; "3D
acc
eler
atio
n fo
r he
at d
etec
tion
in d
airy
cow
s"C
ongr
eso
Arg
entin
o de
Agr
oinf
orm
átic
a (C
AI
2014
) -
43º
JAII
O, p
p. 1
21-1
34, 2
014.
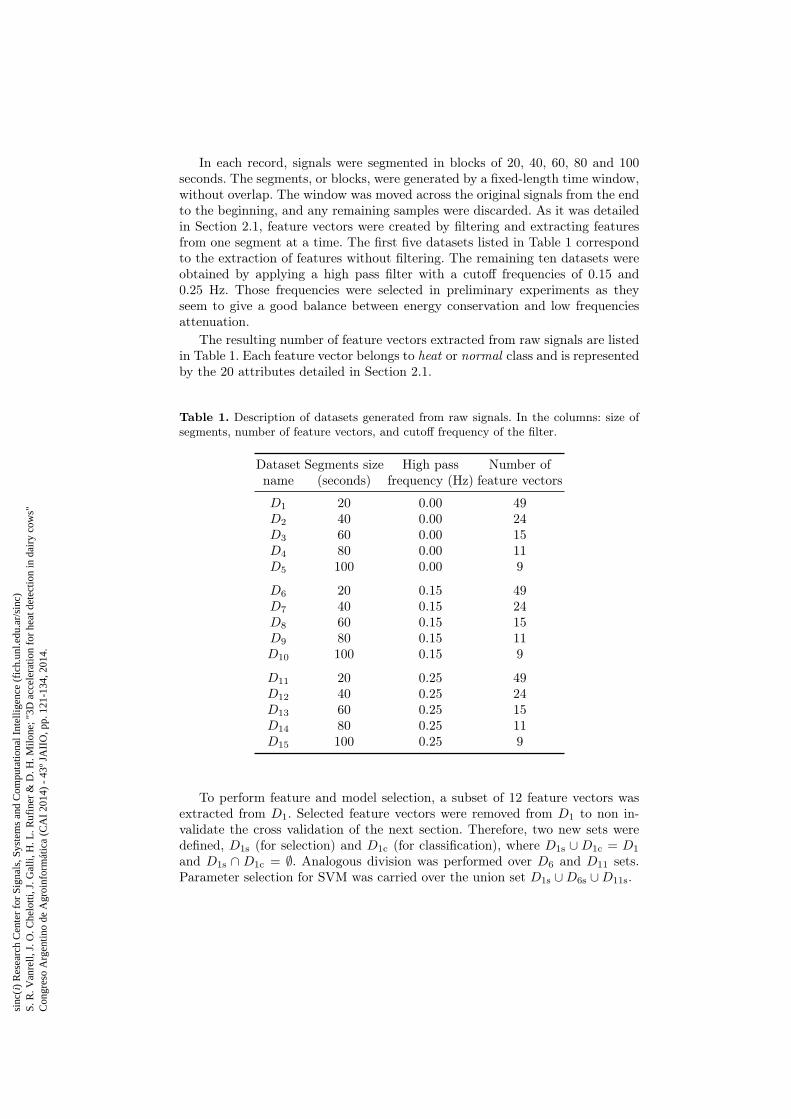
In each record, signals were segmented in blocks of 20, 40, 60, 80 and 100seconds. The segments, or blocks, were generated by a fixed-length time window,without overlap. The window was moved across the original signals from the endto the beginning, and any remaining samples were discarded. As it was detailedin Section 2.1, feature vectors were created by filtering and extracting featuresfrom one segment at a time. The first five datasets listed in Table 1 correspondto the extraction of features without filtering. The remaining ten datasets wereobtained by applying a high pass filter with a cutoff frequencies of 0.15 and0.25 Hz. Those frequencies were selected in preliminary experiments as theyseem to give a good balance between energy conservation and low frequenciesattenuation.
The resulting number of feature vectors extracted from raw signals are listedin Table 1. Each feature vector belongs to heat or normal class and is representedby the 20 attributes detailed in Section 2.1.
Table 1. Description of datasets generated from raw signals. In the columns: size ofsegments, number of feature vectors, and cutoff frequency of the filter.
Dataset Segments size High pass Number ofname (seconds) frequency (Hz) feature vectors
D1 20 0.00 49D2 40 0.00 24D3 60 0.00 15D4 80 0.00 11D5 100 0.00 9
D6 20 0.15 49D7 40 0.15 24D8 60 0.15 15D9 80 0.15 11D10 100 0.15 9
D11 20 0.25 49D12 40 0.25 24D13 60 0.25 15D14 80 0.25 11D15 100 0.25 9
To perform feature and model selection, a subset of 12 feature vectors wasextracted from D1. Selected feature vectors were removed from D1 to non in-validate the cross validation of the next section. Therefore, two new sets weredefined, D1s (for selection) and D1c (for classification), where D1s ∪D1c = D1
and D1s ∩ D1c = ∅. Analogous division was performed over D6 and D11 sets.Parameter selection for SVM was carried over the union set D1s ∪D6s ∪D11s.
sinc
(i)
Res
earc
h C
ente
r fo
r Si
gnal
s, S
yste
ms
and
Com
puta
tiona
l Int
ellig
ence
(fi
ch.u
nl.e
du.a
r/si
nc)
S. R
. Van
rell,
J. O
. Che
lotti
, J. G
alli,
H. L
. Ruf
iner
& D
. H. M
ilone
; "3D
acc
eler
atio
n fo
r he
at d
etec
tion
in d
airy
cow
s"C
ongr
eso
Arg
entin
o de
Agr
oinf
orm
átic
a (C
AI
2014
) -
43º
JAII
O, p
p. 1
21-1
34, 2
014.
4 Results and discussion
Because the number of feature vectors in each dataset were small, leave-one-out cross-validation was applied. In leave-one-out cross-validation the number offolds was fixed to the number of feature vectors in the dataset. In each iteration,one feature vector was used for testing and the remaining feature vectors wereused for training the classifier. The test results were collected and averaged overall folds [21]. Performance of classifiers was measured by counting the proportionof correctly predicted feature vectors in the unseen test dataset. That is, theclassifier accuracy.
As it was introduced at the end of Section 2.1, a feature selection was carriedon. The selected attributes were: total maximum (maxt) inD1s, up energy (eneu)in D6s and east amplitude (ampe) in D11s. During classification we comparedthe performance of using all attributes and only the 3 selected. Datasets thatcontain all features will be named as DAf , and datasets that contain only the 3selected as D3f .
4.1 Detection results
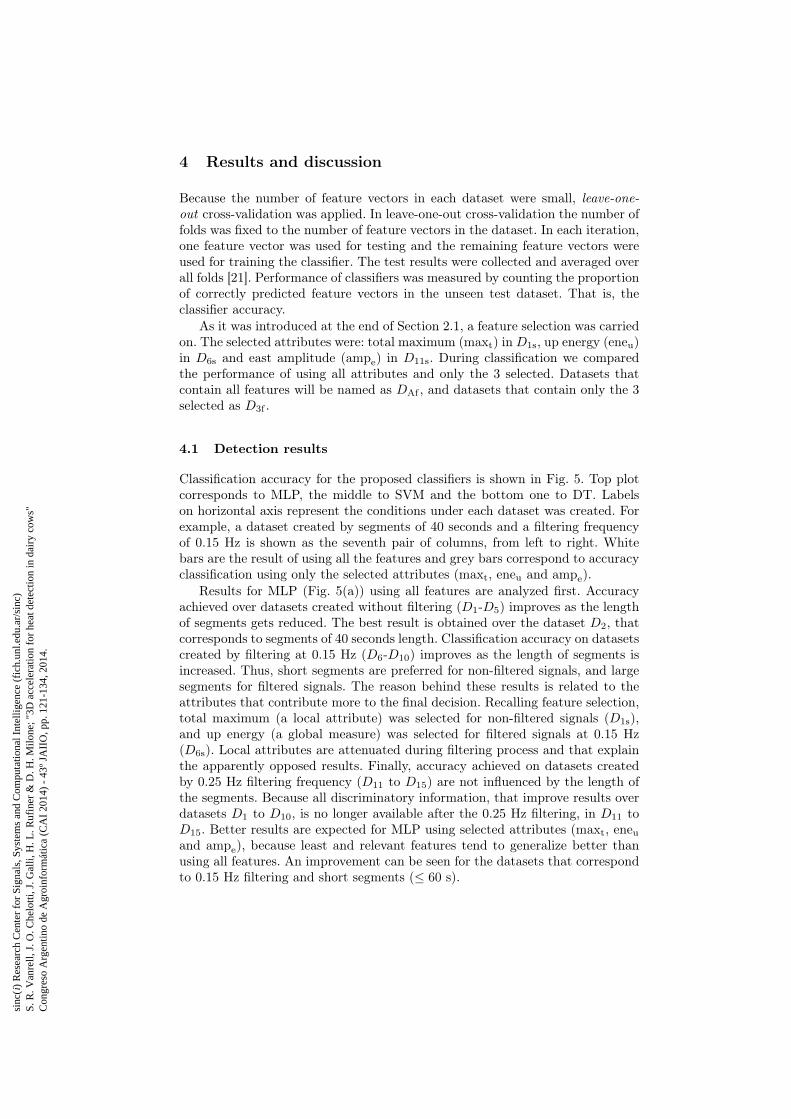
Classification accuracy for the proposed classifiers is shown in Fig. 5. Top plotcorresponds to MLP, the middle to SVM and the bottom one to DT. Labelson horizontal axis represent the conditions under each dataset was created. Forexample, a dataset created by segments of 40 seconds and a filtering frequencyof 0.15 Hz is shown as the seventh pair of columns, from left to right. Whitebars are the result of using all the features and grey bars correspond to accuracyclassification using only the selected attributes (maxt, eneu and ampe).
Results for MLP (Fig. 5(a)) using all features are analyzed first. Accuracyachieved over datasets created without filtering (D1-D5) improves as the lengthof segments gets reduced. The best result is obtained over the dataset D2, thatcorresponds to segments of 40 seconds length. Classification accuracy on datasetscreated by filtering at 0.15 Hz (D6-D10) improves as the length of segments isincreased. Thus, short segments are preferred for non-filtered signals, and largesegments for filtered signals. The reason behind these results is related to theattributes that contribute more to the final decision. Recalling feature selection,total maximum (a local attribute) was selected for non-filtered signals (D1s),and up energy (a global measure) was selected for filtered signals at 0.15 Hz(D6s). Local attributes are attenuated during filtering process and that explainthe apparently opposed results. Finally, accuracy achieved on datasets createdby 0.25 Hz filtering frequency (D11 to D15) are not influenced by the length ofthe segments. Because all discriminatory information, that improve results overdatasets D1 to D10, is no longer available after the 0.25 Hz filtering, in D11 toD15. Better results are expected for MLP using selected attributes (maxt, eneuand ampe), because least and relevant features tend to generalize better thanusing all features. An improvement can be seen for the datasets that correspondto 0.15 Hz filtering and short segments (≤ 60 s).
sinc
(i)
Res
earc
h C
ente
r fo
r Si
gnal
s, S
yste
ms
and
Com
puta
tiona
l Int
ellig
ence
(fi
ch.u
nl.e
du.a
r/si
nc)
S. R
. Van
rell,
J. O
. Che
lotti
, J. G
alli,
H. L
. Ruf
iner
& D
. H. M
ilone
; "3D
acc
eler
atio
n fo
r he
at d
etec
tion
in d
airy
cow
s"C
ongr
eso
Arg
entin
o de
Agr
oinf
orm
átic
a (C
AI
2014
) -
43º
JAII
O, p
p. 1
21-1
34, 2
014.
20s 40s 60s 80s100s 20s 40s 60s 80s100s 20s 40s 60s 80s100s0
20
40
60
80
100
0.00 Hz 0.15 Hz 0.25 Hz
Datasets
(a) MLP
Accuraccy
(%)
20s 40s 60s 80s100s 20s 40s 60s 80s100s 20s 40s 60s 80s100s0
20
40
60
80
100
0.00 Hz 0.15 Hz 0.25 Hz
Datasets
(b) SVM
Accuraccy
(%)
20s 40s 60s 80s100s 20s 40s 60s 80s100s 20s 40s 60s 80s100s0
20
40
60
80
100
0.00 Hz 0.15 Hz 0.25 Hz
Datasets
(c) DT
Accuraccy
(%)
Fig. 5. Classification accuracy for (a) MLP, (b) SVM and (c) DT. Labels on horizontalaxis correspond to the conditions under each dataset was created (size of segmentsand filtering frequency). White bars were obtained using all the features and gray barsusing selected attributes (maxt, eneu and ampe).
sinc
(i)
Res
earc
h C
ente
r fo
r Si
gnal
s, S
yste
ms
and
Com
puta
tiona
l Int
ellig
ence
(fi
ch.u
nl.e
du.a
r/si
nc)
S. R
. Van
rell,
J. O
. Che
lotti
, J. G
alli,
H. L
. Ruf
iner
& D
. H. M
ilone
; "3D
acc
eler
atio
n fo
r he
at d
etec
tion
in d
airy
cow
s"C
ongr
eso
Arg
entin
o de
Agr
oinf
orm
átic
a (C
AI
2014
) -
43º
JAII
O, p
p. 1
21-1
34, 2
014.
Obtained results using all features and SVM (Fig. 5(b)) were better for shortsegments, under any filtering condition. This tendency could be influenced by thedifficulty to generalize when just a few feature vectors are in the training dataset(the number of feature vectors decreases as length of segments increases). In gen-eral, classification using only the selected features show poorer or similar results.The SVM classifier is more immune to irrelevant features, thus, eliminating themdo not change the results. Instead, if an important feature is dropped out theperformance of the classifier will be reduced. Best result for SVM correspondsto 20 seconds segments, 0.15 Hz filter cutoff and all features.
Classification accuracy for DT (Fig. 5(c)) show results that are reasonablygood in almost all datasets, above 77% and reaching a 93% in the best situa-tion. Over datasets created without filtering, a peak is observed on 60 secondssegments and all features. Using only selected features the results improve inthe five datasets, and a unique feature is used to build the trees (maxt). Theimprovements seen on trees built after feature selection are explained by the re-duction of the number of possible architectures, a fact that simplify the search.Trees created for datasets corresponding to 0.15 and 0.25 Hz give results thatare similar or poorer than previously analyzed.
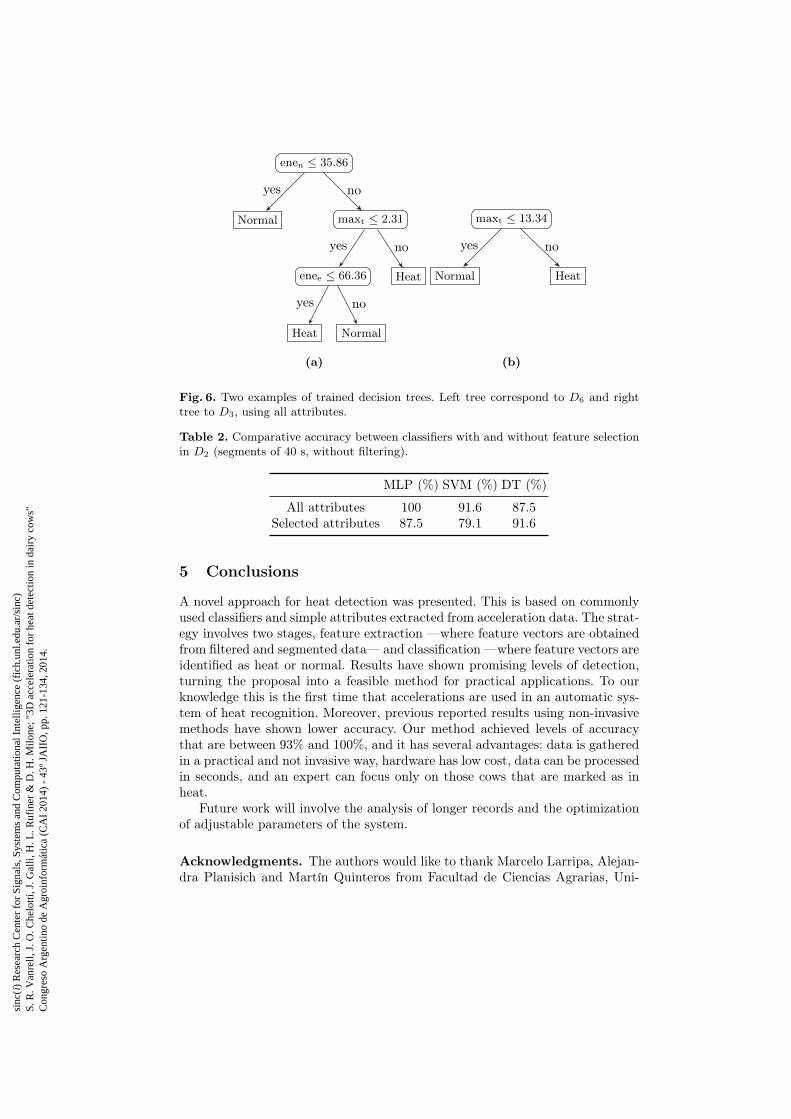
The analysis of the architecture of trees shows that, for datasets in DAf
corresponding to 20 seconds segments, trees look like the one in Fig. 6(a). It isa tree of 7 nodes, 3 non-terminal and 4 terminal (2 for heat and 2 for normal).Threshold values for decisions are given in non-terminal nodes. The remainingtrees created (over DAf and D3f) consist of the simplest tree, 1 root node and 2terminal nodes (1 for each class). An example of such trees is shown in Fig. 6(b).In these simplest trees, the selected feature was total maximum (16 of 27 times).Without feature selection (over DAf) the selected feature was north energy (5of 15 times). DT architecture is interesting as it gives some clues about theclassification problem. The classification with only one feature shows that theclasses can be distinguish in a simple way. However, it is not always the samefeature in the root node. Unexpectedly, north features get that position 10 of15 times (over DAf). Results of classification with trees reveal that minimumand standard deviation are not important attributes to discriminate betweenclasses. An unexpected situation was the absence of features that came fromvertical direction, since events with vertical acceleration like mounts are onlyseen during heat. Total and north direction result as the more relevant ones.
4.2 Best configuration
The influence of segment size was not always the same when all results arecompared. Nevertheless, segments of 40 s and without filtering have lead togood results using any classifier. The results over this dataset are summarizedin Table 2, for all classifiers, over DAf and D3f . MLP and SVM achieved betterresults without feature selection, being MLP the best. Instead, DT results wereimproved after feature selection, followed by MLP. Finally, better results underalmost any conditions were achieved with MLP, followed by the performance ofDT. SVM showed high variance results, lowering its confidence.
sinc
(i)
Res
earc
h C
ente
r fo
r Si
gnal
s, S
yste
ms
and
Com
puta
tiona
l Int
ellig
ence
(fi
ch.u
nl.e
du.a
r/si
nc)
S. R
. Van
rell,
J. O
. Che
lotti
, J. G
alli,
H. L
. Ruf
iner
& D
. H. M
ilone
; "3D
acc
eler
atio
n fo
r he
at d
etec
tion
in d
airy
cow
s"C
ongr
eso
Arg
entin
o de
Agr
oinf
orm
átic
a (C
AI
2014
) -
43º
JAII
O, p
p. 1
21-1
34, 2
014.
enen ≤ 35.86
Normal
yes
maxt ≤ 2.31
enee ≤ 66.36
Heat
yes
Normal
no
yes
Heat
no
no
(a)
maxt ≤ 13.34
Normal
yes
Heat
no
(b)
Fig. 6. Two examples of trained decision trees. Left tree correspond to D6 and righttree to D3, using all attributes.
Table 2. Comparative accuracy between classifiers with and without feature selectionin D2 (segments of 40 s, without filtering).
MLP (%) SVM (%) DT (%)
All attributes 100 91.6 87.5Selected attributes 87.5 79.1 91.6
5 Conclusions
A novel approach for heat detection was presented. This is based on commonlyused classifiers and simple attributes extracted from acceleration data. The strat-egy involves two stages, feature extraction —where feature vectors are obtainedfrom filtered and segmented data— and classification —where feature vectors areidentified as heat or normal. Results have shown promising levels of detection,turning the proposal into a feasible method for practical applications. To ourknowledge this is the first time that accelerations are used in an automatic sys-tem of heat recognition. Moreover, previous reported results using non-invasivemethods have shown lower accuracy. Our method achieved levels of accuracythat are between 93% and 100%, and it has several advantages: data is gatheredin a practical and not invasive way, hardware has low cost, data can be processedin seconds, and an expert can focus only on those cows that are marked as inheat.
Future work will involve the analysis of longer records and the optimizationof adjustable parameters of the system.
Acknowledgments. The authors would like to thank Marcelo Larripa, Alejan-dra Planisich and Martín Quinteros from Facultad de Ciencias Agrarias, Uni-
sinc
(i)
Res
earc
h C
ente
r fo
r Si
gnal
s, S
yste
ms
and
Com
puta
tiona
l Int
ellig
ence
(fi
ch.u
nl.e
du.a
r/si
nc)
S. R
. Van
rell,
J. O
. Che
lotti
, J. G
alli,
H. L
. Ruf
iner
& D
. H. M
ilone
; "3D
acc
eler
atio
n fo
r he
at d
etec
tion
in d
airy
cow
s"C
ongr
eso
Arg
entin
o de
Agr
oinf
orm
átic
a (C
AI
2014
) -
43º
JAII
O, p
p. 1
21-1
34, 2
014.
versidad Nacional de Rosario for their assistance in animal management andgathering data. This work has been funded by Agencia Nacional de PromociónCientífica y Tecnológica, Universidad Nacional del Litoral and Universidad Na-cional de Rosario, under Projects PICT 2011-2440, PACT CAID 2011 “Señales,Sistemas e Inteligencia Computacional”, CAID 2011-525 and 2013-AGR216.
References
1. Gray, H.G., Varner, M.A.: Signs of estrus and improving detection of estrus incattle. Fact Sheet IRM 6, West Virginia University (1984)
2. Firk, R., Stamer, E., Junge, W., Krieter, J.: Automation of oestrus detection indairy cows: a review. Livestock Production Science 75(3) (2002) 219–232
3. Jónsson, R., Blanke, M., Poulsen, N.K., Caponetti, F., Højsgaard, S.: Oestrusdetection in dairy cows from activity and lying data using on-line individual models.Computers and Electronics in Agriculture 76(1) (2011) 6–15
4. Parkka, J., Ermes, M., Korpipaa, P., Mantyjarvi, J., Peltola, J., Korhonen, I.: Ac-tivity classification using realistic data from wearable sensors. IEEE Transactionson Information Technology in Biomedicine 10(1) (2006) 119–128
5. Gyllensten, I., Bonomi, A.: Identifying types of physical activity with a singleaccelerometer: Evaluating laboratory-trained algorithms in daily life. IEEE Trans-actions on Biomedical Engineering 58(9) (2011) 2656–2663
6. Milone, D., Rufiner, H., Galli, J., Laca, E., Cangiano, C.: Computational methodfor segmentation and classification of ingestive sounds in sheep. Computers andElectronics in Agriculture 65(2) (2009) 228–237
7. Milone, D.H., Galli, J.R., Cangiano, C.A., Rufiner, H.L., Laca, E.A.: Automaticrecognition of ingestive sounds of cattle based on hidden markov models. Comput-ers and Electronics in Agriculture 87 (2012) 51–55
8. Hamalainen, W., Jarvinen, M., Martiskainen, P., Mononen, J.: Jerk-based fea-ture extraction for robust activity recognition from acceleration data. In: 11thInternational Conference on Intelligent Systems Design and Applications (ISDA).(November 2011) 831–836
9. Nathan, R., Spiegel, O., Fortmann-Roe, S., Harel, R., Wikelski, M., Getz, W.M.:Using tri-axial acceleration data to identify behavioral modes of free-ranging an-imals: general concepts and tools illustrated for griffon vultures. The Journal ofExperimental Biology 215(6) (2012) 986–996
10. Martiskainen, P., Järvinen, M., Skön, J.P., Tiirikainen, J., Kolehmainen, M.,Mononen, J.: Cow behaviour pattern recognition using a three-dimensional ac-celerometer and support vector machines. Applied Animal Behaviour Science119(1–2) (2009) 32–38
11. Fordham, D.P., McCarthy, T.T., Rowlinson, P.: An evaluation of milk temperaturemeasurement for detecting oestrus in dairy cattle. II variations in body and milktemperature associated with oestrus. Veterinary Research Communications 11(4)(1987) 381–391
12. Reiss, A., Hendeby, G., Stricker, D.: A competitive approach for human activityrecognition on smartphones. In: ESANN 2013, ESANN (2013) 455–460
13. Hall, M., Frank, E., Holmes, G., Pfahringer, B., Reutemann, P., Witten, I.H.: TheWEKA data mining software: An update. SIGKDD Explor. Newsl. 11(1) (2009)10–18
sinc
(i)
Res
earc
h C
ente
r fo
r Si
gnal
s, S
yste
ms
and
Com
puta
tiona
l Int
ellig
ence
(fi
ch.u
nl.e
du.a
r/si
nc)
S. R
. Van
rell,
J. O
. Che
lotti
, J. G
alli,
H. L
. Ruf
iner
& D
. H. M
ilone
; "3D
acc
eler
atio
n fo
r he
at d
etec
tion
in d
airy
cow
s"C
ongr
eso
Arg
entin
o de
Agr
oinf
orm
átic
a (C
AI
2014
) -
43º
JAII
O, p
p. 1
21-1
34, 2
014.
14. Hsu, C.W., Chang, C.C., Lin, C.J.: A practical guide to support vector classifica-tion (2003)
15. Chang, C.C., Lin, C.J.: LIBSVM: a library for support vector machines. ACMTrans. Intell. Syst. Technol. 2(3) (2011) 27:1–27:27
16. Bishop, C.M.: Pattern recognition and machine learning. Information Science andStatistics. Springer, New York (2006)
17. Cortes, C., Vapnik, V.: Support-vector networks. Machine Learning 20(3) (1995)273–297
18. Burges, C.J.C.: A tutorial on support vector machines for pattern recognition.Data Mining and Knowledge Discovery 2(2) (1998) 121–167
19. Breiman, L., Friedman, J.H., Olshen, R.A., Stone, C.J.: Classification and regres-sion trees. Chapman & Hall, New York (1993)
20. Swain, P.H., Hauska, H.: The decision tree classifier: Design and potential. IEEETransactions on Geoscience Electronics 15(3) (1977) 142–147
21. Witten, I.H., Frank, E., Hall, M.A.: Data Mining: Practical machine learning toolsand techniques. Morgan Kaufmann, Burlington, Mass. (2011)
sinc
(i)
Res
earc
h C
ente
r fo
r Si
gnal
s, S
yste
ms
and
Com
puta
tiona
l Int
ellig
ence
(fi
ch.u
nl.e
du.a
r/si
nc)
S. R
. Van
rell,
J. O
. Che
lotti
, J. G
alli,
H. L
. Ruf
iner
& D
. H. M
ilone
; "3D
acc
eler
atio
n fo
r he
at d
etec
tion
in d
airy
cow
s"C
ongr
eso
Arg
entin
o de
Agr
oinf
orm
átic
a (C
AI
2014
) -
43º
JAII
O, p
p. 1
21-1
34, 2
014.


![Relationship Between Ovarian Activity and Energy Status During the Early Postpartum Period of High Producing Dairy Cows[1] and [2](https://static.fdokumen.com/doc/165x107/631cad15665120b3330bf8e7/relationship-between-ovarian-activity-and-energy-status-during-the-early-postpartum.jpg)


![[ITA] Acceleration methods for PageRank](https://static.fdokumen.com/doc/165x107/6321641780403fa2920cb95c/ita-acceleration-methods-for-pagerank.jpg)