A Bayesian approach to analyze energy balance data from lactating dairy cows
12
2520 J. Dairy Sci. 94:2520–2531 doi:10.3168/jds.2010-3836 © American Dairy Science Association ® , 2011. ABSTRACT The objective of the present investigation was to develop a Bayesian framework for updating and inte- grating covariate information into key parameters of metabolizable energy (ME) systems for dairy cows. The study addressed specifically the effects of genetic improvements and feed quality on key parameters in current ME systems. These are net and metabolizable energy for maintenance (NE M and ME M , respectively), efficiency of utilization of ME for milk production (k L ) and growth (k G ), and efficiency of utilization of body stores for milk production (k T ). Data were collated from 38 studies, yielding 701 individual cow observations on milk energy, ME intake, and tissue gain and loss. A function based on a linear relationship between milk energy and ME intake and correcting for tissue energy loss or gain served as the basis of a full Bayesian hierar- chical model. The within-study variability was modeled by a Student t-distribution and the between-study vari- ability in the structural parameters was modeled by a multivariate normal distribution. A meaningful relation- ship between genetic improvements in milk production and the key parameters could not be established. The parameter k L was linearly related to feed metabolizabil- ity, and the slope predicted a 0.010 (−0.0004; 0.0210) change per 0.1-unit change in metabolizability. The ef- fect of metabolizability on k L was smaller than assumed in present feed evaluation systems and its significance was dependent on collection of studies included in the analysis. Three sets of population estimates (with 95% credible interval in parentheses) were generated, reflect- ing different degrees of prior belief: (1) Noninformative priors yielded 0.28 (0.23; 0.33) MJ/(kg 0.75 d), 0.55 (0.51; 0.58), 0.86 (0.81; 0.93) and 0.66 (0.58; 0.75), for NE M , k L , k G , and k T , respectively; (2) Introducing an informa- tive prior that was derived from a fasting metabolism study served to combine the most recent information on energy metabolism in modern dairy cows. The new estimates of NE M , k L , k G and k T were 0.34 (0.28; 0.39) MJ/(kg 0.75 d), 0.58 (0.54; 0.62), 0.89 (0.85; 0.95), and 0.69 (0.60; 0.79), respectively; (3) finally, all informative priors were used that were established from literature, yielding estimates for NE M , k L , k G , and k T of 0.29 (0.11; 0.46) MJ/(kg 0.75 d), 0.60 (0.54; 0.70), 0.70 (0.50; 0.88), and 0.80 (0.67; 0.97), respectively. Bayesian methods are especially applicable in meta-analytical studies as information can enter at various stages in the hierarchi- cal model. Key words: energy metabolism, modeling INTRODUCTION Key parameters of energy evaluation systems for dairy cows are net energy for maintenance (NE M ), ME for maintenance (ME M ), the efficiency of utilizing ME intake for milk production (k L ) and for growth (k G ), and the efficiency of utilizing body stores for milk pro- duction (k T ). These parameters may be constant or a function of other variables such as metabolizability [q = ME/gross energy (GE)]; that is, feed quality (Van Es, 1975; ARC, 1980; AFRC, 1993). For example, Yan et al. (1997a) observed a significant increase in ME M with an increasing proportion of grass silage and a decreasing proportion of concentrate in the diet, but k L was not affected by silage proportion. Recently, Tolkamp and Kyriazakis (2009) proposed a constant k L regardless of feed quality, but did not provide data in support of this premise. Kebreab et al. (2003) presented an analysis of a large data set on energy metabolism in lactating dairy cows and compared alternate functional forms; however, potential covariates that may affect point estimates of the key parameters were not investigated. For example, the data analyzed included more than 2 decades of en- ergy research during which progress in genetic potential of cows in their milk production attributes might have taken place. Thus, it can be hypothesized that genetic improvements have changed the levels of key param- eters; for example, increased the energy requirements A Bayesian approach to analyze energy balance data from lactating dairy cows 1 A. B. Strathe,* 2 J. Dijkstra,† J. France,‡ S. Lopez,§ T. Yan,# and E. Kebreab* *Department of Animal Science, University of California, Davis 95616 †Animal Nutrition Group, Wageningen University, PO Box 338, 6700 AH Wageningen, the Netherlands ‡Centre for Nutritional Modelling, Department of Animal and Poultry Science, University of Guelph, Canada §Instituto de Ganadería de Montaña (CSIC-ULE), Departamento de Producción Animal, Universidad de León, Spain #Agri-Food and Biosciences Institute, Hillsborough Co. Down, Northern Ireland Received September 17, 2010. Accepted January 23, 2011. 1 Supported by the Sesnon Endowed Chair Fund (UC Davis). 2 Corresponding author: [email protected]
Transcript of A Bayesian approach to analyze energy balance data from lactating dairy cows
2520
J. Dairy Sci. 94 :2520–2531doi: 10.3168/jds.2010-3836 © American Dairy Science Association®, 2011 .
ABSTRACT
The objective of the present investigation was to develop a Bayesian framework for updating and inte-grating covariate information into key parameters of metabolizable energy (ME) systems for dairy cows. The study addressed specifically the effects of genetic improvements and feed quality on key parameters in current ME systems. These are net and metabolizable energy for maintenance (NEM and MEM, respectively), efficiency of utilization of ME for milk production (kL) and growth (kG), and efficiency of utilization of body stores for milk production (kT). Data were collated from 38 studies, yielding 701 individual cow observations on milk energy, ME intake, and tissue gain and loss. A function based on a linear relationship between milk energy and ME intake and correcting for tissue energy loss or gain served as the basis of a full Bayesian hierar-chical model. The within-study variability was modeled by a Student t-distribution and the between-study vari-ability in the structural parameters was modeled by a multivariate normal distribution. A meaningful relation-ship between genetic improvements in milk production and the key parameters could not be established. The parameter kL was linearly related to feed metabolizabil-ity, and the slope predicted a 0.010 (−0.0004; 0.0210) change per 0.1-unit change in metabolizability. The ef-fect of metabolizability on kL was smaller than assumed in present feed evaluation systems and its significance was dependent on collection of studies included in the analysis. Three sets of population estimates (with 95% credible interval in parentheses) were generated, reflect-ing different degrees of prior belief: (1) Noninformative priors yielded 0.28 (0.23; 0.33) MJ/(kg0.75d), 0.55 (0.51; 0.58), 0.86 (0.81; 0.93) and 0.66 (0.58; 0.75), for NEM, kL, kG, and kT, respectively; (2) Introducing an informa-tive prior that was derived from a fasting metabolism
study served to combine the most recent information on energy metabolism in modern dairy cows. The new estimates of NEM, kL, kG and kT were 0.34 (0.28; 0.39) MJ/(kg0.75d), 0.58 (0.54; 0.62), 0.89 (0.85; 0.95), and 0.69 (0.60; 0.79), respectively; (3) finally, all informative priors were used that were established from literature, yielding estimates for NEM, kL, kG, and kT of 0.29 (0.11; 0.46) MJ/(kg0.75d), 0.60 (0.54; 0.70), 0.70 (0.50; 0.88), and 0.80 (0.67; 0.97), respectively. Bayesian methods are especially applicable in meta-analytical studies as information can enter at various stages in the hierarchi-cal model. Key words: energy metabolism , modeling
INTRODUCTION
Key parameters of energy evaluation systems for dairy cows are net energy for maintenance (NEM), ME for maintenance (MEM), the efficiency of utilizing ME intake for milk production (kL) and for growth (kG), and the efficiency of utilizing body stores for milk pro-duction (kT). These parameters may be constant or a function of other variables such as metabolizability [q = ME/gross energy (GE)]; that is, feed quality (Van Es, 1975; ARC, 1980; AFRC, 1993). For example, Yan et al. (1997a) observed a significant increase in MEM with an increasing proportion of grass silage and a decreasing proportion of concentrate in the diet, but kL was not affected by silage proportion. Recently, Tolkamp and Kyriazakis (2009) proposed a constant kL regardless of feed quality, but did not provide data in support of this premise. Kebreab et al. (2003) presented an analysis of a large data set on energy metabolism in lactating dairy cows and compared alternate functional forms; however, potential covariates that may affect point estimates of the key parameters were not investigated. For example, the data analyzed included more than 2 decades of en-ergy research during which progress in genetic potential of cows in their milk production attributes might have taken place. Thus, it can be hypothesized that genetic improvements have changed the levels of key param-eters; for example, increased the energy requirements
A Bayesian approach to analyze energy balance data from lactating dairy cows 1 A. B. Strathe ,*2 J. Dijkstra ,† J. France ,‡ S. Lopez ,§ T. Yan ,# and E. Kebreab * * Department of Animal Science, University of California, Davis 95616 † Animal Nutrition Group, Wageningen University, PO Box 338, 6700 AH Wageningen, the Netherlands ‡ Centre for Nutritional Modelling, Department of Animal and Poultry Science, University of Guelph, Canada § Instituto de Ganadería de Montaña (CSIC-ULE), Departamento de Producción Animal, Universidad de León, Spain # Agri-Food and Biosciences Institute, Hillsborough Co. Down, Northern Ireland
Received September 17, 2010. Accepted January 23, 2011. 1 Supported by the Sesnon Endowed Chair Fund (UC Davis). 2 Corresponding author: [email protected]
Journal of Dairy Science Vol. 94 No. 5, 2011
BAYESIAN ANALYSIS OF ENERGY BALANCE DATA 2521
for maintenance (Agnew and Yan, 2000). Additionally, feed quality might have an effect on key parameters of energy evaluation systems; therefore, a more rigorous covariate analysis is required.
Traditionally, energy balance data from lactating dairy cows have been analyzed using the classical mul-tiple linear regression approach of Moe et al. (1971). However, various studies from different locations were used in this study, so a meta-analytical approach (St-Pierre, 2001) is best suited to evaluate the hypothesis of a constant kL because the conclusion reached is valid across studies. Normal linear mixed models have be-come standard to conduct meta-analysis because sta-tistical procedures are available in commercial software packages. The parameters in meta-analytical models are usually estimated using REML methods; however, Bayesian methods have been suggested as a better approach, incorporating (probabilistic) constraints on model parameters (Lean et al., 2009). Those au-thors suggested that Bayesian methods are especially applicable as information from the literature can en-ter at various stages in the hierarchical model, such as the use of informative priors. Moreover, Bayesian methods allow simple fitting of models with Student t-distributed intra- and inter-study variability, provid-ing robust inference against outlying observations and outlying studies (Lunn, et al., 2000; van Houwelingen et al., 2002). Parameter estimation is based on Markov chain Monte Carlo (MCMC) methods, providing a full characterization of the parameter’s posterior densities (Gelman et al., 2004; Ntzoufras, 2009). Therefore, in-troducing Bayesian methods as a meta-analytical tool is valuable from both an informational and statistical perspective.
The objective of this study was to use Bayesian methods to investigate effects of metabolizability and genetic progress on the utilization of ME intake for milk production in modern dairy cows.
MATERIALS AND METHODS
The Database
A database containing energy balance data for 652 dairy cow observations was assembled from calorimetry studies conducted at the Centre for Dairy Research (CEDAR) at the University of Reading (Reading, UK), the Agricultural Research Institute for Northern Ireland (ARINI, Hillsborough, N. Ireland), Queens University of Belfast (N. Ireland), and the Grassland Research Institute (Hurley, UK). For full details of diet composi-tion, experimental design, and references see Kebreab et al. (2003). This data set was further updated with energy balance data from the Netherlands (van Knegsel
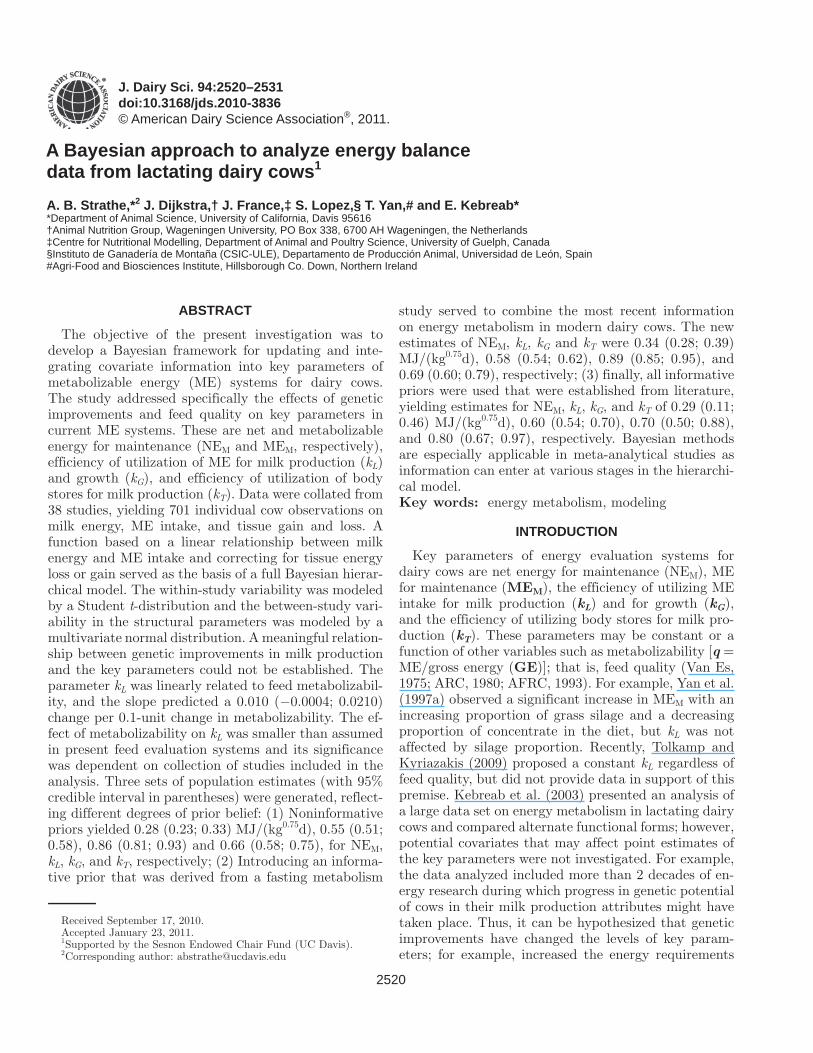
et al., 2007), yielding 701 observations from 38 studies. The data are presented in Figure 1, where milk energy was plotted against ME intake and energy balance (scaled to metabolic body size). The candidate covari-ates investigated were metabolizability (q = ME/GE) and genetic progress. Metabolizability was considered as a continuous variable with the following empirical distribution function. The data were divided into the following quantiles: 0.42, 0.60, 0.63, 0.63, 0.66, and 0.76, termed minimum, 25% quantile, median, mean, 75% quantile, and maximum, respectively. The year of experiment was used as a proxy for genetic progress in milk production. It was included as a continuous covariate centered at year 1995. Alternatively, it was included as a categorical variable with 3 arbitrary levels differentiating the cows in experiments conducted be-fore 1990, 1990 to 1995, and after 1995 with group sizes of 149, 245, and 307 observations, respectively.
Energy Balance Functions
A new definition of kL was introduced by Kebreab et al. (2003). Here, kL was expressed as the derivative of the ratio of milk energy (EL) derived from ME and directed toward milk production. Based on this defini-tion, an energy balance function was derived, which uses the straight line (or any other nonlinear function) as the functional basis and then corrects for tissue energy loss (TL) or tissue energy gain (TG) as follows. The independent variables TG and TL are constructed from the energy balance measurements. Hence, TG is set to zero when the energy balance is negative; otherwise, TG is equal to the energy balance. If the energy balance is negative, then TL is equal to the absolute value of the energy balance, else TL is set to zero (Kebreab et al., 2003). Dependent and independent variables EL, ME, TG, and TL are in units of MJ/(kg0.75·d). Although non-linear functions can also be used following the above definition, the fit statistics presented by Kebreab et al. (2003) showed that the linear model was adequate to describe the data; therefore, nonlinear functions were not considered further. Equation [1] is the general case of the equation put forward by Moe et al. (1971), relating milk energy to ME intake and tissue energy changes. A reparameterized version of the linear model was used in the current analysis because it can be fitted using a random regression approach; that is,
E NE k ME kT k TL M L G T L= − + − + . [1]
Equation [1] has 4 structural parameters, an intercept (NEM), the first slope (kL), the second slope denoted by k (kL/kG), and the third slope (kT). At unity, the ef-
2522 STRATHE ET AL.
Journal of Dairy Science Vol. 94 No. 5, 2011
ficiencies of lactation and body gain are assumed equal. Thus, the reparameterization of the linear model is use-ful from a statistical and inferential perspective. The efficiency, kG, was equated as kL/k and its uncertainty (e.g., standard error) could be quantified if a simulation-based estimation method was used (i.e., MCMC).
Many studies use metabolic BW (usually BW0.75) to standardize traits of energy metabolism. The use of 0.75 as a scalar for BW originates from the comparison of energy expenditure of different mature species of ani-mals. However, energy research in other species (e.g., pigs) has shown that the use of 0.75 as a scalar is not always appropriate and it should be estimated from the data (Kleiber, 1961). Thus, a slight modification of Eq. [1] yields the following:
E NE BW k ME kT k TL Mb
L G T L= − + − + , [2]
where b is the scaling parameter and EL, ME, TG, and TL are in units of megajoules per day. In Eq. [1] and [2], the estimate of MEM can be computed as NEM/kL, assuming that kL = kM (ARC, 1980), where kM is the efficiency of utilizing ME below MEM. Note that this is only valid if the linear function is used as a base func-tion relating EL to ME intake (Kebreab et al., 2003).
The statistical model described by Kebreab et al. (2003), which is referred to as the Kebreab model, served as a starting point for the current data analysis. It included only a single random effect, describing the heterogeneity between studies and thus treating all structural parameters in Eq. [1] as fixed effects. How-
ever, it is likely that the structural parameters will vary from one study to the next (St-Pierre, 2001). This is described in detail below.
The Full Bayesian Hierarchical Model
Bayesian meta-analysis of population data is consid-ered in terms of a 3-stage hierarchical model. Stages 1 and 2 are similar to those characterized by random ef-fects modeling with REML and the third stage refers to the prior. In the following notation, bold font indicates a vector or a matrix, and a tilde is used to indicate “distributed as.”
Stage One of the Hierarchical Model. The first stage is the model for the data; that is,
y N i jf ME T Tij ij G Li j ij~ , , ,..., , ,., , , i( )⎛⎝⎜⎜⎜
⎞⎠⎟⎟⎟ = = 1 38 1 ..., ,ni
[3]
where yij denotes the jth (1 < j < ni) observation (milk
energy) in the ith study (1 < i < 38); f ME T Tij G Li j ij, , , i( )
is the expected milk energy for the jth observation of the ith study based on either Eq. [1] or [2], is the residual precision, and θi is a vector of structural pa-rameters specific to the individual study. A more robust statistical model was also investigated, which was based on the Student t-distribution, allowing model errors to have heavier tail probabilities. This is controlled by the degrees of freedom parameter (v) because the student
Figure 1. Milk energy plotted against ME intake (left) and energy balance (right) with trend lines included. All variables are scaled to BW0.75. Color version available in the online PDF.
Journal of Dairy Science Vol. 94 No. 5, 2011
BAYESIAN ANALYSIS OF ENERGY BALANCE DATA 2523
t-distribution approaches a normal distribution as v → ∞. Hence, it provides the statistical model with robust-ness against influential observations that may have marked effects on parameter estimates in the normal model (Subtil and Rabilloud, 2010).
Stage Two of the Hierarchical Model. The sec-ond stage represents a model for between-study vari-ability; that is,
θ β Ωi1~ , ,MVN –( ) [4]
where θi is vector of parameters NE b k k kM i L i T
T
i i i, , , ,⎡
⎣⎢⎤⎦⎥
⎛
⎝⎜⎜⎜⎜
⎞
⎠⎟⎟⎟⎟
and β is vector of mean population parameters
( NE b k k kM L T
T, , , ,⎡
⎣⎢⎤⎦⎥ ) where T denotes the transpose, and
Ω is the between-study variance-covariance matrix. A robust specification toward outlying studies was also investigated, which used the multivariate t-distribution (MVT) with 5 df.
Introducing additional covariate information into the hierarchical model is done through the structural pa-rameters (second stage) in Eq. [4] as opposed to adding an additional independent variable at the first stage of hierarchy; that is, Eq. [3]. Hence, it is useful to consider the values of the parameters for the individual study to be related to the population parameters via a covariate relationship, which may be expressed as the following:
θ β Ωi1~ , , .MVN g iz–( )( ) [5]
In this notation, g(β, zi) is used to denote a func-tion (g) that describes the expectation of the ith stud-ies parameter vector θi conditional on the nutritional characteristics (zi) and population values (β). The be-tween-study variance-covariance matrix (Ω) therefore describes the random variability between studies that is not explained by covariates. For instance, the inter-est is in estimating the change in efficiency of utilizing ME intake for milk production per unit change in feed metabolizability rather than estimating the change in milk energy output per unit change in feed metaboliz-ability.
Stage Three of the Hierarchical Model. The third stage is a model for the priors; that is,
τ
β β Σ
Ω
~ , ,
~ , ,
~ , ,
Gam a b
MVN
W p
( )( )( )
–
–
1
1 R
[6]
where Gam denotes a gamma distribution with param-eters a and b (mean = a/b, variance = a/b2), is a
vector of prior population mean values of the parame-ters, and –1 is the precision matrix that describes the degree of informativeness of the prior distribution of the structural parameters. W represents a Wishart dis-tribution with parameters R and p; R is the scaled prior value of the variance covariance matrix of the between-study variability, and p is degrees of freedom in the Wishart distribution, which is fixed at 4 or 5, reflecting the number of structural parameters in Eq. [3]. Gelman et al. (2004) define 3 categories of priors: (1) prior distributions giving numerical information that is crucial to estimation of the model. This would be the traditional informative prior, which might come from earlier data analysis; (2) prior distributions that are not supplying any controversial information but that are strong enough to pull the data away from inap-propriate inferences consistent with the likelihood. This might be called a (weak) informative prior; and (3) prior distributions that are uniform, or noninformative, and basically allow the information from the likelihood to be interpreted probabilistically. The noninformative
distributions were specified as follows: = ⎡⎣⎢⎤⎦⎥0 0 0 0 0, , , , ,T
–1 I= × ×−1 10 6 , R I= ×0 001. , and a = b = 0.001.
Here, I is the identity matrix. A uniform prior [U(2, 100)] is used for v. Normal distributions are specified as priors for all parameters related to secondary covari-ates, having a mean of zero and precision 1 × 10⁻⁶.
Convergence Diagnostics and Model Selection. Three chains were run with different initial over-dis-persed values. To assess convergence, 4 formal conver-gence tests at the core of the convergence diagnostic and output analysis (CODA) package were used (Best et al., 1995). The number of iterations required as the burn-in period varied from one model to the next, but a general rule was that more complex models (i.e., mod-els with covariates) required a longer burn-in period. The Raftery and Lewis diagnostic (Raftery and Lewis, 1992) was used to determine the number of iterations needed to obtain desired precision in parameter esti-mates. After discarding the burn-in, it was decided to run the models for an additional 100,000 iterations and thinning the chains of 30, which yielded a posterior of 10,000 samples based on 3 chains. Statistics, such as the mean, median, percentiles, and 95% credible inter-val can be calculated from the samples making up the posterior distribution (Gelman et al., 2004). The results are presented as posterior mean, standard deviation, and 95% credible interval in parentheses.
In Bayesian analysis, no standard model selection criterion exists, such as the likelihood ratio test. In the current analysis, we used a variety of criteria for model selection decisions: (1) a reduction in the mean value
2524 STRATHE ET AL.
Journal of Dairy Science Vol. 94 No. 5, 2011
of the between-study variance in the parameter or a re-duction in the residual error magnitude; (2) the magni-tude of the estimated effect, which is judged by its 95% credible interval and computation of the proportion of posterior samples that are different from zero. The proportion may be interpreted similarly to a P-value of the underlying hypothesis in traditional statistics; (3) deviance information criteria (DIC) is a general tool to assess the trade-off between model fit (deviance: −2 log-likelihood) and complexity (pD = number of effective parameters). The notion that “smaller is bet-ter” is preserved in the DIC (Spiegelhalter et al., 2002). Although smaller is better, differences of 5 and 10 DIC units show a tendency or a substantive improvement of fit to data, respectively (Spiegelhalter et al., 2002). The adopted approach for incorporating covariates was con-nected to model building strategies for the nonlinear mixed effect model (Pinheiro and Bates, 2000). The questions addressed in the covariate modeling process were the determination of which variables are poten-tially useful in explaining the between-study random effects variation and which random effects may have their variability explained by covariates. If the number of covariates-random effects combinations is large, Pin-heiro and Bates (2000) suggest using a forward stepwise approach in which covariates are included one at a time and the potential importance of the remaining covari-ates is graphically assessed at each step. The decision on whether or not to include a covariate is based on the DIC of the fits with and without it.
Data analysis was performed using OpenBUGS soft-ware (Thomas et al., 2006), which was interfaced with R through the BRugs package (Thomas, 2006).
REML. A complementary data analysis was un-dertaken to demonstrate that comparable estimates of the structural parameters could be obtained using maximum likelihood methods if vague priors are used for the Bayesian analysis. The model was specified as presented in Eq. [3] and [4] and implemented in the linear mixed effects function in R (lmer(); Bates and Maechler, 2010). Furthermore, the shortcomings of maximum likelihood methods in terms of properly modeling the observed variability in the data are also demonstrated.
RESULTS AND DISCUSSION
Bayesian Analysis of Energy Balance Data
Modeling Within-Study Variability. The tra-ditional assumption in meta-analytical studies is that the errors are normally distributed; however, it was likely that combining information from multiple trials would produce outlying observations even though the
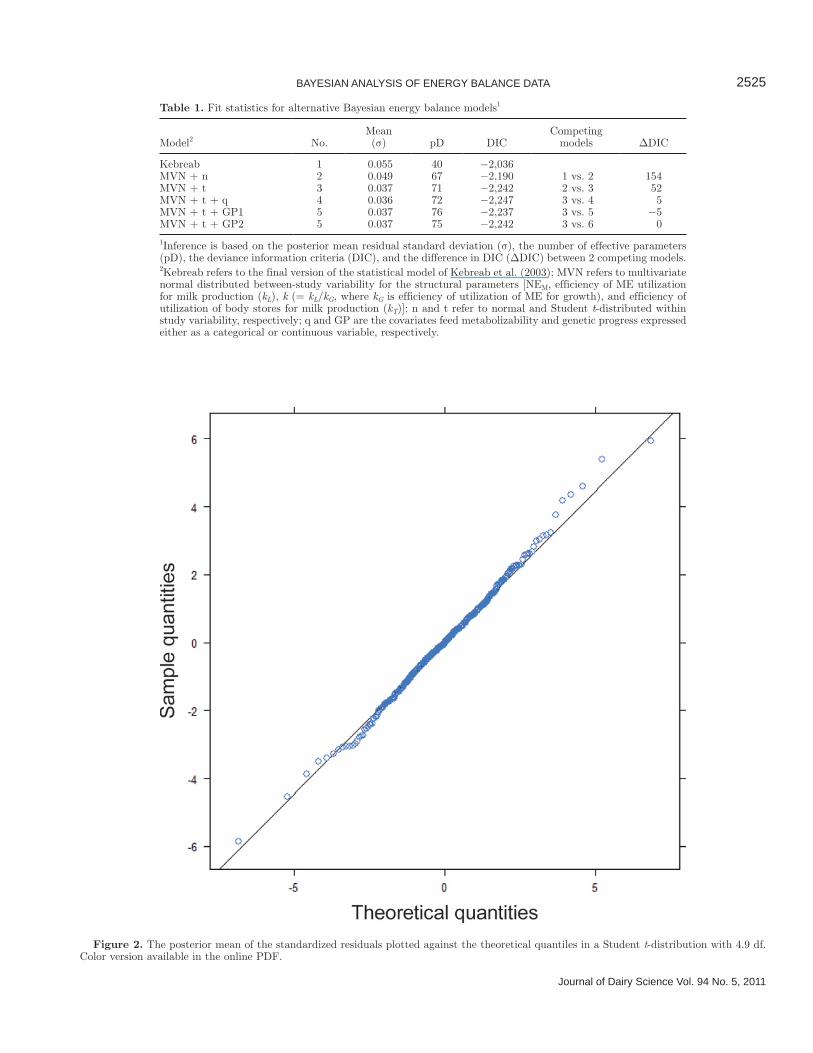
data within each study had been checked rigorously. Moreover, an observation could be an outlier within the context of the statistical model, but it may be a valid data point and thus it should not be excluded from the analysis. Instead, the statistical model should be revised to accommodate influential observations. Consequently, the Student t-distribution proved to be a better choice, which the fit statistics also demonstrated; that is, DIC values of −2,190 versus −2,242 (Table 1) for the models based on normal and t-distributed errors, respectively. Moreover, the degree of freedom parameter in the Stu-dent t-distribution was estimated to be 4.9 (3.3; 7.6), indicating a heavy tailed distribution. The standardized residuals were computed by dividing the raw residuals (observation – predicted) by residual standard devia-tion during the sampling from the posterior distribu-tion. Hence, the standardized residuals have a posterior mean and a 95% credible interval. The “goodness of fit” to a Student t-distribution may be visualized by plotting the posterior mean of the standardized re-siduals against the theoretical quantiles in a Student t-distribution with 4.9 df. This is presented in Figure 2, which shows that posterior means of the standardized residuals approximate well to the theoretical quantiles of the Student t-distribution, as the points were very close to the straight line. Thus, the Bayesian framework allows a more realistic model to fit a data set because it is not restricted to using a normal distribution.
Modeling Between-Study Variability. The start-ing point for the current analysis was the Kebreab et al. (2003) analysis, which was based on a model with a single study effect; that is, a random intercepts model. For comparison the same model was implemented in the Bayesian framework, and the population estimates for NEM, kL, kG, and kT were 0.28 (0.24; 0.32) MJ/kg0.75·d, 0.55 (0.53; 0.57), 0.83 (0.76; 0.90), and 0.65 (0.61; 0.70), respectively, which was in agreement with the parameter estimates reported by Kebreab et al. (2003). Under this model, the fit to data was expressed in the DIC value of −2,036. Introducing a model for the between-study variability in which all structural parameters vary according to a multivariate normal distribution produced a superior fit to data; that is, a DIC value of −2,190. Moreover, the posterior mean residual standard deviation decreased from 0.055 to 0.049 (MJ/kg0.75·d). Because of different experimental conditions, we expected that the structural param-eters would vary from study to study. The robustness of the multivariate normal assumption modeling the between-study variability was also explored by intro-ducing a multivariate t-distribution. The introduction of a multivariate t-distribution with 5 df into a Stu-dent t-distribution within-study variability produced a slightly (DIC: −2,244 vs. −2,242) but not significantly
Journal of Dairy Science Vol. 94 No. 5, 2011
BAYESIAN ANALYSIS OF ENERGY BALANCE DATA 2525
Table 1. Fit statistics for alternative Bayesian energy balance models1
Model2 No.Mean (σ) pD DIC
Competing models ΔDIC
Kebreab 1 0.055 40 −2,036 MVN + n 2 0.049 67 −2,190 1 vs. 2 154MVN + t 3 0.037 71 −2,242 2 vs. 3 52MVN + t + q 4 0.036 72 −2,247 3 vs. 4 5MVN + t + GP1 5 0.037 76 −2,237 3 vs. 5 −5MVN + t + GP2 5 0.037 75 −2,242 3 vs. 6 0
1Inference is based on the posterior mean residual standard deviation (σ), the number of effective parameters (pD), the deviance information criteria (DIC), and the difference in DIC (ΔDIC) between 2 competing models.2Kebreab refers to the final version of the statistical model of Kebreab et al. (2003); MVN refers to multivariate normal distributed between-study variability for the structural parameters [NEM, efficiency of ME utilization for milk production (kL), k (= kL/kG, where kG is efficiency of utilization of ME for growth), and efficiency of utilization of body stores for milk production (kT)]; n and t refer to normal and Student t-distributed within study variability, respectively; q and GP are the covariates feed metabolizability and genetic progress expressed either as a categorical or continuous variable, respectively.
Figure 2. The posterior mean of the standardized residuals plotted against the theoretical quantiles in a Student t-distribution with 4.9 df. Color version available in the online PDF.
2526 STRATHE ET AL.
Journal of Dairy Science Vol. 94 No. 5, 2011
improved fit to data compared with the multivariate normal distribution. Thus, the multivariate normal was kept for inference.
Priors. The choice of priors could have an effect on the posterior distribution of the parameters and thus the population estimates of NEM, kL, k, and kT. All priors in the current analysis were specified as vague noninformative priors; thus, the likelihood dominated the posterior. A traditional REML analysis was carried out (Table 2) to demonstrate that the Bayesian analysis provided similar answers if noninformative priors were used. The results were very comparable, indicating that the posterior distribution was dominated completely by the likelihood. Even the point estimates of the vari-ance parameters were remarkably similar. Lambert et al. (2005) investigated the choice of prior distributions for variance parameters in meta-analysis. The results of their study showed that the choice of priors was crucial when few studies (<10) were available; however, the issue became less important when a large number of studies (>30) were available. In our case, 38 studies were available for analysis and, as indicated earlier, the choice of priors was not important.
Effect of Metabolizability
The effect of metabolizability (q) was included in the model by assuming that the population trend in the structural parameters NEM, kL, and kT was a linear
function of q and hence kkk k qG L L= ⋅ + ⋅( )1
0 1(ARC,
1980). Bayesian P-values for the corresponding slopes NE k kM L T1 1 1
, ,, and incorporating the effect of q on the
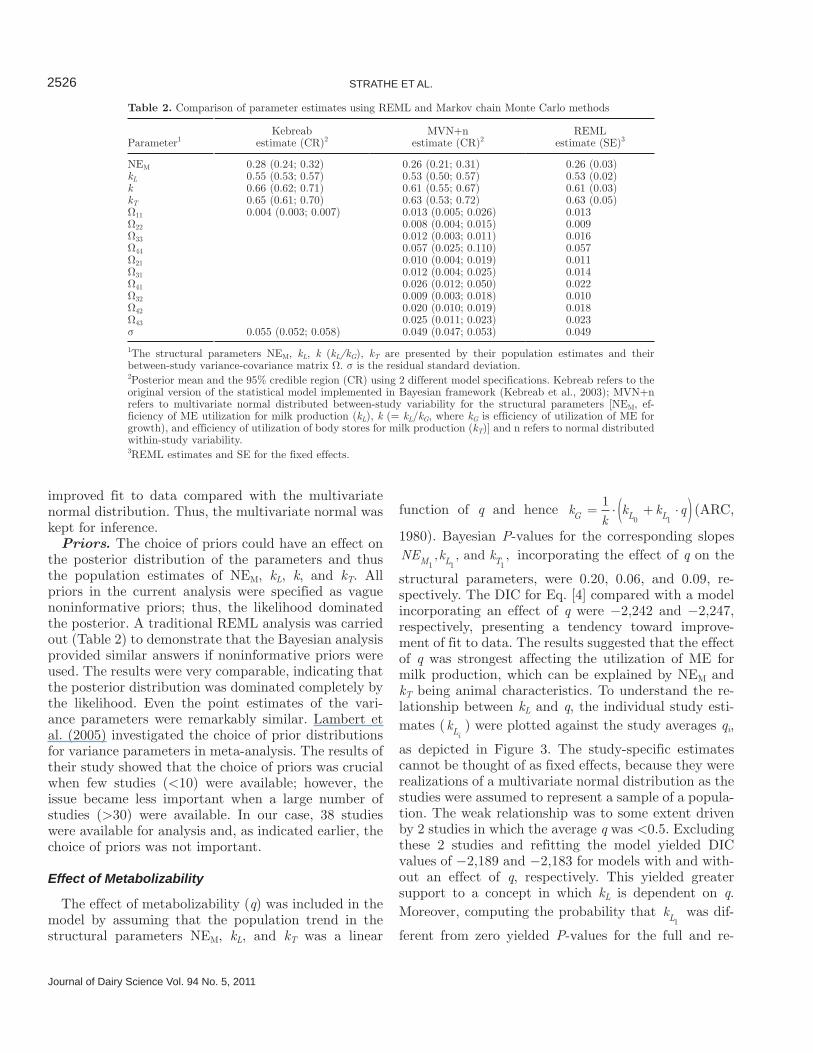
structural parameters, were 0.20, 0.06, and 0.09, re-spectively. The DIC for Eq. [4] compared with a model incorporating an effect of q were −2,242 and −2,247, respectively, presenting a tendency toward improve-ment of fit to data. The results suggested that the effect of q was strongest affecting the utilization of ME for milk production, which can be explained by NEM and kT being animal characteristics. To understand the re-lationship between kL and q, the individual study esti-mates (kLi
) were plotted against the study averages qi,
as depicted in Figure 3. The study-specific estimates cannot be thought of as fixed effects, because they were realizations of a multivariate normal distribution as the studies were assumed to represent a sample of a popula-tion. The weak relationship was to some extent driven by 2 studies in which the average q was <0.5. Excluding these 2 studies and refitting the model yielded DIC values of −2,189 and −2,183 for models with and with-out an effect of q, respectively. This yielded greater support to a concept in which kL is dependent on q. Moreover, computing the probability that kL1
was dif-
ferent from zero yielded P-values for the full and re-
Table 2. Comparison of parameter estimates using REML and Markov chain Monte Carlo methods
Parameter1Kebreab
estimate (CR)2MVN+n
estimate (CR)2REML
estimate (SE)3
NEM 0.28 (0.24; 0.32) 0.26 (0.21; 0.31) 0.26 (0.03)kL 0.55 (0.53; 0.57) 0.53 (0.50; 0.57) 0.53 (0.02)k 0.66 (0.62; 0.71) 0.61 (0.55; 0.67) 0.61 (0.03)kT 0.65 (0.61; 0.70) 0.63 (0.53; 0.72) 0.63 (0.05)Ω11 0.004 (0.003; 0.007) 0.013 (0.005; 0.026) 0.013Ω22 0.008 (0.004; 0.015) 0.009Ω33 0.012 (0.003; 0.011) 0.016Ω44 0.057 (0.025; 0.110) 0.057Ω21 0.010 (0.004; 0.019) 0.011Ω31 0.012 (0.004; 0.025) 0.014Ω41 0.026 (0.012; 0.050) 0.022Ω32 0.009 (0.003; 0.018) 0.010Ω42 0.020 (0.010; 0.019) 0.018Ω43 0.025 (0.011; 0.023) 0.023σ 0.055 (0.052; 0.058) 0.049 (0.047; 0.053) 0.049
1The structural parameters NEM, kL, k (kL/kG), kT are presented by their population estimates and their between-study variance-covariance matrix Ω. σ is the residual standard deviation.2Posterior mean and the 95% credible region (CR) using 2 different model specifications. Kebreab refers to the original version of the statistical model implemented in Bayesian framework (Kebreab et al., 2003); MVN+n refers to multivariate normal distributed between-study variability for the structural parameters [NEM, ef-ficiency of ME utilization for milk production (kL), k (= kL/kG, where kG is efficiency of utilization of ME for growth), and efficiency of utilization of body stores for milk production (kT)] and n refers to normal distributed within-study variability.3REML estimates and SE for the fixed effects.
Journal of Dairy Science Vol. 94 No. 5, 2011
BAYESIAN ANALYSIS OF ENERGY BALANCE DATA 2527
duced data sets of 0.06 and 0.02, respectively. The practical question was how much did the efficiency change per unit of q or per 0.1 unit of q, which is more appropriate as q only takes values between 0 and 1. The following estimates were obtained for the full data set: 0.010 (−0.0004; 0.0210), and the reduced data set: 0.012 (0.001; 0.024). The linear equations relating kL to q are kL = 0.46(SE = 0.04) + 0.10(SE = 0.05)·q and kL = 0.45(SE = 0.04) + 0.12(SE = 0.05)·q for the full and reduced data sets, respectively. These can be compared with the proposal of ARC (1980) where kL is equal to 0.42 + 0.35·q, or 0.46 + 0.24·q in the Van Es (1975) proposal. Hence, the recommended estimate of 0.024 or
0.035 per 0.1 unit of q, making the effect of q about 2 or 3 times greater than the estimate presented here. In other words, if q increased from 0.4 to 0.7, then kL in-creased correspondingly around 3.0% (full data set) or 3.6% (reduced data set), whereas Van Es (1975) and ARC (1980) predicted increases of around 7.2 and 10.5%, respectively. Finally, the effect of q can also be illustrated by computing milk production predictions. Assume an average cow of 600 kg, no body energy gain or loss, and consuming 250 MJ of ME/d, the predicted milk production (3.1 MJ/kg of milk) at q = 0.58 and q = 0.68 would be 32.3 (SE = 0.67) and 33.3 (SE = 0.67) kg/d, respectively.
The major difference between the current estimate and that presented by Van Es (1975) or ARC (1980) is the methodology used to estimate kL1
. Van Es (1975)
arbitrarily assigned an average correction value of 0.024 per 0.1 unit of q based on Beltsville and Wageningen data. ARC (1980) used a 2-stage approach in which kL was estimated at 2 levels of q (0.56 and 0.66), resulting in efficiencies 0.60 and 0.64, respectively. Interpolating
between the 2 levels of q leads to k kqL
L1
0 35= =ΔΔ
. .
It is likely that the estimate of 0.35 is sensitive to the small change in q; that is, Δq = 0.1. The current data set covers a much larger range of diet qualities, extend-ing from 0.52 to 0.76 (excluding 2 studies); hence, the new estimate of 0.12 (SE = 0.05) should be more robust in terms of describing effects of diet quality. However, it should be noted that the estimate might be biased toward grass-based diets as most of the diets in the database were based on grass silage. In the current analysis, the effect of q was built directly into the struc-tural parameters of the energy-partitioning model, us-ing modern statistical tools. This is preferable as infer-ence can be assessed jointly, providing more power to quantify nutritional effects (Strathe et al., 2010a).
Effect of Genetic Progress
The effect of genetic progress was modeled by incor-porating the categorical variable into the 4 structural parameters of the energy partitioning model. This in-creased the number of parameters that had to be esti-mated. A poorer fit to data was observed because a pen-alty was imposed by the DIC for models with increasing complexity. The DIC values for the 3 competing models were −2,242 and −2,237 or −2,242 for the models with-out and with the effect of genetic progress expressed as a categorical or continuous variable, respectively (Table 2). Moreover, the corresponding Bayesian P-values for the 4 slopes related the continuous covariate (year of experiment), being different than zero, were 0.45, 0.73,
Figure 3. The individual study effects kLi( ) plotted against feed
metabolizability with trend lines included. In the top plot 2 studies were excluded (metabolizability >0.5), whereas in the bottom plot all studies are included. Color version available in the online PDF.
0.66, and 0.91, respectively. Hence, a relationship could not be established when the genetic progress was based on the year of experiment. Using the genetic merit for milk production of individual cows might have been a better predictor, but it was only available for less than 20% of the observations. Various factors may explain this finding. First, most studies (30) were conducted within the same decade (i.e., from 1990 to 2000) and thus a 10-yr period might not be enough to detect a significant change in energy metabolism of dairy cows. Second, the diets varied in quality; hence, from a genetic perspective these dietary variations might have masked any genetic trend. Evidence exists that fasting heat pro-duction has changed as a consequence of selection for increased milk production (Yan et al., 1997b) although the current analysis could not confirm this finding as NEM was not significantly affected (P = 0.45). Modern cows have the capability to synthesize milk from avail-able nutrients at an exceedingly high rate because of their ability to ingest and digest large quantities of feed and thus maintain a high ME intake. However, this does not mean that they are more efficient energetically in converting ME into milk when adjusted for tissue energy changes (i.e., kL = ΔEL/ΔME = constant), but they are able to do it at a greater rate. Kebreab et al. (2003) showed that nonlinear functions do not perform well in modeling the relationship between milk energy output and ME intake, especially when all pa-rameters are unconstrained. Visual inspection of Figure 1 confirms this. Consequently, the metabolic efficiency of converting absorbed nutrients into milk may have undergone limited changes during the course of genetic selection.
Estimating Key Parameters in Energy Systems
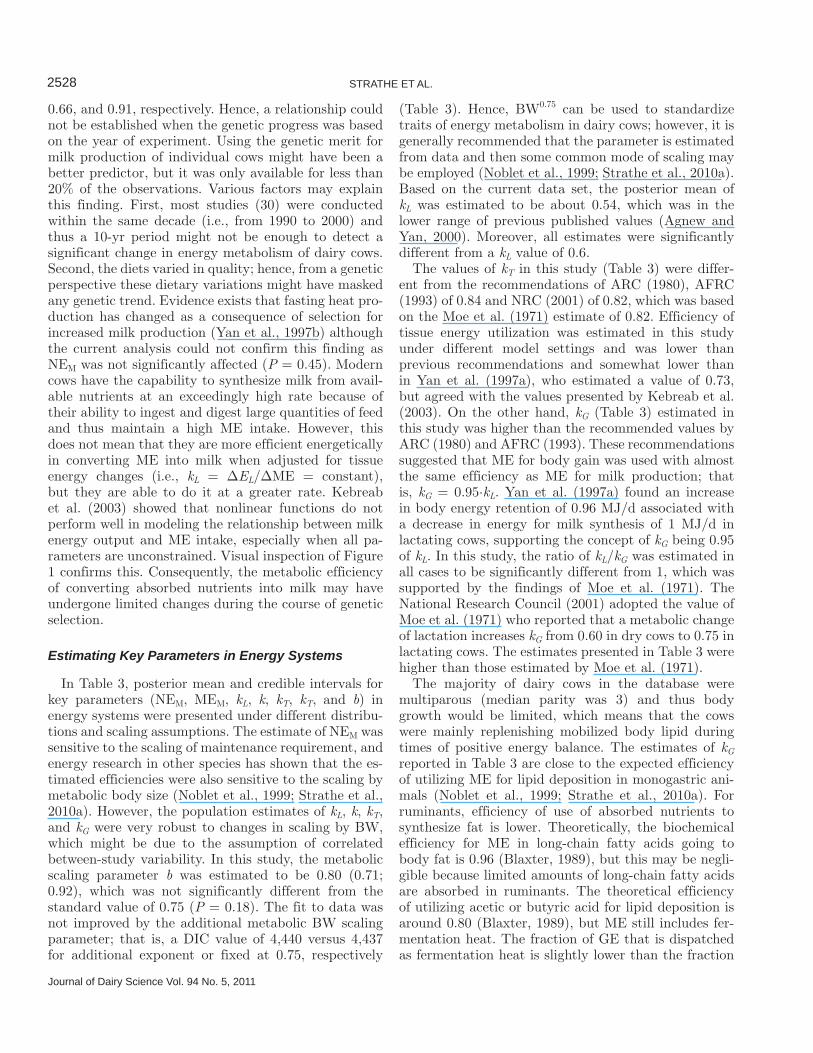
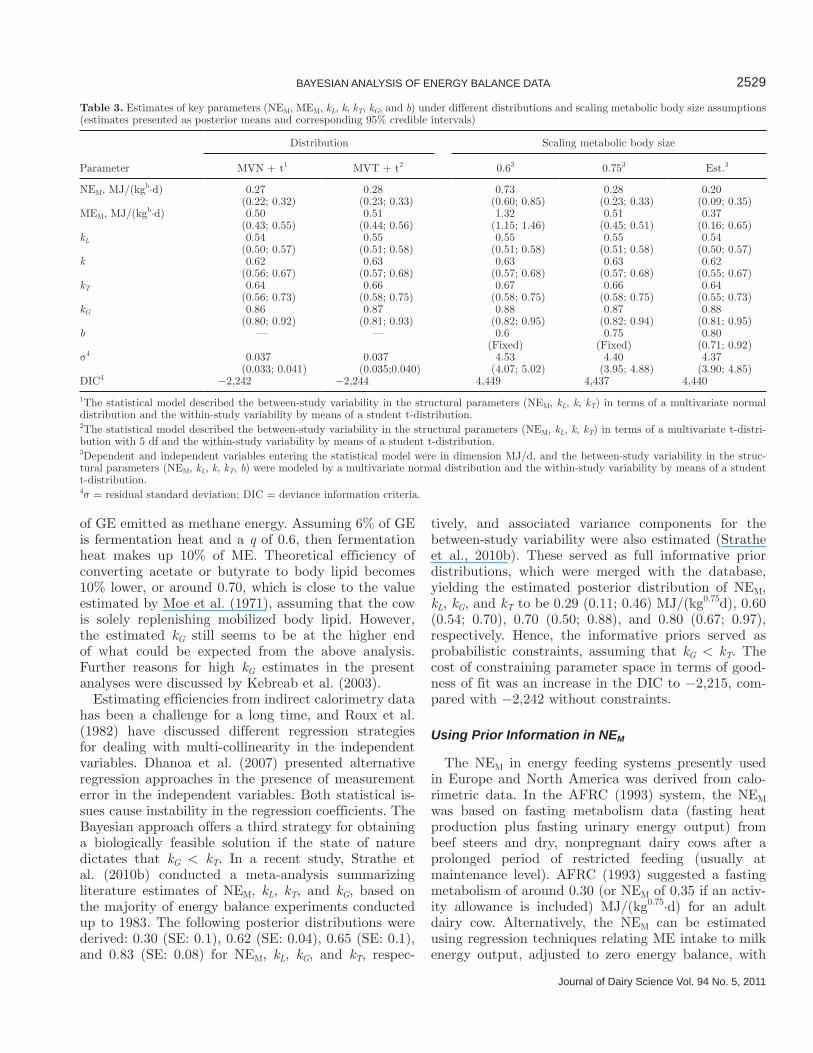
In Table 3, posterior mean and credible intervals for key parameters (NEM, MEM, kL, k, kT, kT, and b) in energy systems were presented under different distribu-tions and scaling assumptions. The estimate of NEM was sensitive to the scaling of maintenance requirement, and energy research in other species has shown that the es-timated efficiencies were also sensitive to the scaling by metabolic body size (Noblet et al., 1999; Strathe et al., 2010a). However, the population estimates of kL, k, kT, and kG were very robust to changes in scaling by BW, which might be due to the assumption of correlated between-study variability. In this study, the metabolic scaling parameter b was estimated to be 0.80 (0.71; 0.92), which was not significantly different from the standard value of 0.75 (P = 0.18). The fit to data was not improved by the additional metabolic BW scaling parameter; that is, a DIC value of 4,440 versus 4,437 for additional exponent or fixed at 0.75, respectively
(Table 3). Hence, BW0.75 can be used to standardize traits of energy metabolism in dairy cows; however, it is generally recommended that the parameter is estimated from data and then some common mode of scaling may be employed (Noblet et al., 1999; Strathe et al., 2010a). Based on the current data set, the posterior mean of kL was estimated to be about 0.54, which was in the lower range of previous published values (Agnew and Yan, 2000). Moreover, all estimates were significantly different from a kL value of 0.6.
The values of kT in this study (Table 3) were differ-ent from the recommendations of ARC (1980), AFRC (1993) of 0.84 and NRC (2001) of 0.82, which was based on the Moe et al. (1971) estimate of 0.82. Efficiency of tissue energy utilization was estimated in this study under different model settings and was lower than previous recommendations and somewhat lower than in Yan et al. (1997a), who estimated a value of 0.73, but agreed with the values presented by Kebreab et al. (2003). On the other hand, kG (Table 3) estimated in this study was higher than the recommended values by ARC (1980) and AFRC (1993). These recommendations suggested that ME for body gain was used with almost the same efficiency as ME for milk production; that is, kG = 0.95·kL. Yan et al. (1997a) found an increase in body energy retention of 0.96 MJ/d associated with a decrease in energy for milk synthesis of 1 MJ/d in lactating cows, supporting the concept of kG being 0.95 of kL. In this study, the ratio of kL/kG was estimated in all cases to be significantly different from 1, which was supported by the findings of Moe et al. (1971). The National Research Council (2001) adopted the value of Moe et al. (1971) who reported that a metabolic change of lactation increases kG from 0.60 in dry cows to 0.75 in lactating cows. The estimates presented in Table 3 were higher than those estimated by Moe et al. (1971).
The majority of dairy cows in the database were multiparous (median parity was 3) and thus body growth would be limited, which means that the cows were mainly replenishing mobilized body lipid during times of positive energy balance. The estimates of kG reported in Table 3 are close to the expected efficiency of utilizing ME for lipid deposition in monogastric ani-mals (Noblet et al., 1999; Strathe et al., 2010a). For ruminants, efficiency of use of absorbed nutrients to synthesize fat is lower. Theoretically, the biochemical efficiency for ME in long-chain fatty acids going to body fat is 0.96 (Blaxter, 1989), but this may be negli-gible because limited amounts of long-chain fatty acids are absorbed in ruminants. The theoretical efficiency of utilizing acetic or butyric acid for lipid deposition is around 0.80 (Blaxter, 1989), but ME still includes fer-mentation heat. The fraction of GE that is dispatched as fermentation heat is slightly lower than the fraction
Journal of Dairy Science Vol. 94 No. 5, 2011
STRATHE ET AL.2528
of GE emitted as methane energy. Assuming 6% of GE is fermentation heat and a q of 0.6, then fermentation heat makes up 10% of ME. Theoretical efficiency of converting acetate or butyrate to body lipid becomes 10% lower, or around 0.70, which is close to the value estimated by Moe et al. (1971), assuming that the cow is solely replenishing mobilized body lipid. However, the estimated kG still seems to be at the higher end of what could be expected from the above analysis. Further reasons for high kG estimates in the present analyses were discussed by Kebreab et al. (2003).
Estimating efficiencies from indirect calorimetry data has been a challenge for a long time, and Roux et al. (1982) have discussed different regression strategies for dealing with multi-collinearity in the independent variables. Dhanoa et al. (2007) presented alternative regression approaches in the presence of measurement error in the independent variables. Both statistical is-sues cause instability in the regression coefficients. The Bayesian approach offers a third strategy for obtaining a biologically feasible solution if the state of nature dictates that kG < kT. In a recent study, Strathe et al. (2010b) conducted a meta-analysis summarizing literature estimates of NEM, kL, kT, and kG, based on the majority of energy balance experiments conducted up to 1983. The following posterior distributions were derived: 0.30 (SE: 0.1), 0.62 (SE: 0.04), 0.65 (SE: 0.1), and 0.83 (SE: 0.08) for NEM, kL, kG, and kT, respec-
tively, and associated variance components for the between-study variability were also estimated (Strathe et al., 2010b). These served as full informative prior distributions, which were merged with the database, yielding the estimated posterior distribution of NEM, kL, kG, and kT to be 0.29 (0.11; 0.46) MJ/(kg0.75d), 0.60 (0.54; 0.70), 0.70 (0.50; 0.88), and 0.80 (0.67; 0.97), respectively. Hence, the informative priors served as probabilistic constraints, assuming that kG < kT. The cost of constraining parameter space in terms of good-ness of fit was an increase in the DIC to −2,215, com-pared with −2,242 without constraints.
Using Prior Information in NEM
The NEM in energy feeding systems presently used in Europe and North America was derived from calo-rimetric data. In the AFRC (1993) system, the NEM was based on fasting metabolism data (fasting heat production plus fasting urinary energy output) from beef steers and dry, nonpregnant dairy cows after a prolonged period of restricted feeding (usually at maintenance level). AFRC (1993) suggested a fasting metabolism of around 0.30 (or NEM of 0.35 if an activ-ity allowance is included) MJ/(kg0.75·d) for an adult dairy cow. Alternatively, the NEM can be estimated using regression techniques relating ME intake to milk energy output, adjusted to zero energy balance, with
2529BAYESIAN ANALYSIS OF ENERGY BALANCE DATA
Journal of Dairy Science Vol. 94 No. 5, 2011
Table 3. Estimates of key parameters (NEM, MEM, kL, k, kT, kG, and b) under different distributions and scaling metabolic body size assumptions (estimates presented as posterior means and corresponding 95% credible intervals)
Parameter
Distribution Scaling metabolic body size
MVN + t1 MVT + t2 0.63 0.753 Est.3
NEM, MJ/(kgb·d) 0.27 0.28 0.73 0.28 0.20(0.22; 0.32) (0.23; 0.33) (0.60; 0.85) (0.23; 0.33) (0.09; 0.35)
MEM, MJ/(kgb·d) 0.50 0.51 1.32 0.51 0.37(0.43; 0.55) (0.44; 0.56) (1.15; 1.46) (0.45; 0.51) (0.16; 0.65)
kL 0.54 0.55 0.55 0.55 0.54(0.50; 0.57) (0.51; 0.58) (0.51; 0.58) (0.51; 0.58) (0.50; 0.57)
k 0.62 0.63 0.63 0.63 0.62(0.56; 0.67) (0.57; 0.68) (0.57; 0.68) (0.57; 0.68) (0.55; 0.67)
kT 0.64 0.66 0.67 0.66 0.64 (0.56; 0.73) (0.58; 0.75) (0.58; 0.75) (0.58; 0.75) (0.55; 0.73)
kG 0.86 0.87 0.88 0.87 0.88(0.80; 0.92) (0.81; 0.93) (0.82; 0.95) (0.82; 0.94) (0.81; 0.95)
b — — 0.6 0.75 0.80(Fixed) (Fixed) (0.71; 0.92)
σ4 0.037 0.037 4.53 4.40 4.37(0.033; 0.041) (0.035;0.040) (4.07; 5.02) (3.95; 4.88) (3.90; 4.85)
DIC4 −2,242 −2,244 4,449 4,437 4,440
1The statistical model described the between-study variability in the structural parameters (NEM, kL, k, kT) in terms of a multivariate normal distribution and the within-study variability by means of a student t-distribution.2The statistical model described the between-study variability in the structural parameters (NEM, kL, k, kT) in terms of a multivariate t-distri-bution with 5 df and the within-study variability by means of a student t-distribution.3Dependent and independent variables entering the statistical model were in dimension MJ/d, and the between-study variability in the struc-tural parameters (NEM, kL, k, kT, b) were modeled by a multivariate normal distribution and the within-study variability by means of a student t-distribution.4σ = residual standard deviation; DIC = deviance information criteria.
dairy cows offered diets at production levels. Using this approach, Moe et al. (1972) and Van Es (1975) reported NEM values of 0.305 and 0.293 MJ/(kg0.75d), respectively, from large sets of calorimetric data. The estimated NEM of 0.28 (0.23; 0.33) MJ/(kg0.75d) from this study falls within the range of previous reports. However, both approaches have limitations. Fasting changes the metabolism of the animal and may induce a range of metabolic disorders such as hypoglycemia, hyperlipidemia, hyperketonemia, and hypoinsulinemia (Agnew and Yan, 2000). On the other hand, estimating NEM using regression techniques introduces a strong dependence between the estimates of NEM and kL; hence, NEM cannot be interpreted without consider-ing kL. If Bayesian methods are used, then informa-tion from both techniques can be combined because the information about NEM obtained from the fasting experiments may serve as an informative prior. Yan et al. (1997b) estimated the distribution of NEM, having a mean of 0.45 MJ/(kg0.75d) and precision of 625; that is, NEM ~N(0.45, 625). Merging this information with the current data set yielded new estimates and thus NEM, MEM, kL, kG, and kT were determined to be 0.34 (0.28; 0.39) MJ/(kg0.75d), 0.58 (0.52; 0.65) MJ/(kg0.75d), 0.58 (0.54; 0.62), 0.89 (0.85; 0.95), and 0.69 (0.60; 0.79), respectively. The point estimates of kL, kG, and kT shifted slightly upward due to the correlation between the parameters, whereas NEM changed downward and far from its specified prior distribution. If informative priors are used in the data analysis, then the posteriors should be dependent on those because these describe the state of nature before observing the data. In the current analysis, the prior distribution of NEM reflected the latest information on fasting heat production in dairy cows (Agnew and Yan, 2000), which was obtained independent of the current data set.
Finally, it has been shown that the energetic cost of maintenance per unit of BW0.75 changes as a function of body composition; that is, low maintenance for animals with a large adipose tissue mass and high maintenance for animals with proportionally large organ mass (Bir-nie et al., 2000). In the database, no direct information was available on body composition (protein and lipid mass), and BCS were only available for 40% of the observations, ranging essentially from 2 to 3 in intervals of 0.25. Thus, linking NEM to BCS was not pursued as the cows were uniform considering the inter-observer variability associated with the determination of BCS. On the other hand, we cannot reject the premise that part of the between-study variance in NEM could be explained by variations in the BCS of the individual animals used in the 38 studies.
Bayesian methods extend traditional meta-analysis because literature information can be used to specify
prior belief in the location and precision of parameters before observing the data. The approach used in this study was extended even further by constructing in-formative priors for all the parameters, including vari-ance parameters (between-study variability). Moreover, the Bayesian framework is suited for development of expert systems such as an energy system because it is straightforward to combine past and present informa-tion (Strathe et al., 2010b). A future energy system could be based on a Bayesian framework, yielding full characterization of uncertainty in the estimates of en-ergy utilization in lactating dairy cows.
CONCLUSIONS
This analysis demonstrates that Bayesian methods are especially applicable in meta-analytical studies as information can enter at various stages in the hierar-chical model and appropriate distributions can be fit-ted, which better captures the variation in the data. A covariate analysis was also undertaken, integrating the effect of metabolizability and genetic improvement into the structural parameters. The effect of metaboliz-ability on kL was smaller than assumed in present feed evaluation systems and amounted to 1.2% per 0.1-unit change in q. No relationship between genetic improve-ments in milk production and the key parameters could be established. Despite achieving an improved fit to data, the population estimates did not change much from those presented by Kebreab et al. (2003) using noninformative priors; that is, 0.28 (0.23; 0.33) MJ/(kg0.75d), 0.55 (0.51; 0.58), 0.86 (0.81; 0.93), and 0.66 (0.58; 0.75), for NEM, kL, kG, and kL, respectively. In-troducing an informative prior that was derived from a fasting metabolism study served to combine the most recent information on energy metabolism in modern dairy cows. The new estimates of NEM, kL, kG, and kT were 0.34 (0.28; 0.39) MJ/(kg0.75d), 0.58 (0.54; 0.62), 0.89 (0.85; 0.95), and 0.69 (0.60; 0.79), respectively. Finally, all informative priors that were used were established from literature, yielding the following es-timates for NEM, kL, kG, and kT: 0.29 (0.11; 0.46) MJ/(kg0.75d), 0.60 (0.54; 0.70), 0.70 (0.50; 0.88), and 0.80 (0.67; 0.97), respectively. It must be stressed that if these parameters are used for prediction of energy requirements for lactating dairy cows, they should be used simultaneously because they are correlated with each other and reflect different prior settings.
REFERENCES
Agnew, R. E., and T. Yan. 2000. Impact of recent research on energy feeding systems for dairy cattle. Livest. Prod. Sci. 66:197–215.
Agricultural and Food Research Council. 1993. Energy and Protein Re-quirements of Ruminants. CAB International, Wallingford, UK.
Journal of Dairy Science Vol. 94 No. 5, 2011
STRATHE ET AL.2530

Agricultural Research Council. 1980. The Nutrient Requirements of Ruminant Livestock, Technical Review. CABI, Farnham Royal, UK.
Bates, D., and M. Maechler. 2009. lme4: Linear mixed-effects models using S4 classes. R package version 0.999375–32. Accessed Jan. 25, 2010. http://CRAN.R-project.org/package=lme4.
Best, N. G., M. K. Cowles, and S. K. Vines. 1995. CODA Manual Ver-sion 0.30. MRC Biostatistics Unit, Cambridge, UK.
Birnie, J. W., R. E. Agnew, and F. J. Gordon. 2000. The influence of body condition on the fasting energy metabolism of nonpregnant, nonlactating dairy cows. J. Dairy Sci. 83:1217–1223.
Blaxter, K. 1989. Energy Metabolism in Animals and Man. Cambridge University Press, Cambridge, UK.
Dhanoa, M. S., R. Sanderson, S. Lopez, J. Dijkstra, E. Kebreab, and J. France. 2007. Alternative regression approaches when modeling energy components. Pages 593–594 in Energy and Protein Me-tabolism and Nutrition. Eur. Assoc. Anim. Prod. Publ. No. 124. I. Ortigues-Marty, ed. Wageningen Acad. Publ., Wageningen, the Netherlands.
Gelman, A., J. Carlin, H. Stern, and D. Rubin. 2004. Bayesian data analysis. Texts in Statistical Science. Chapman and Hall, London, UK.
Kebreab, E., J. France, R. E. Agnew, T. Yan, M. S. Dhanoa, J. Di-jkstra, D. E. Beever, and C. K. Reynolds. 2003. Alternatives to linear analysis of energy balance data from lactating cows. J. Dairy Sci. 86:2904–2913.
Kleiber, M. 1961. The Fire of Life. John Wiley, New York, NY.Lambert, P. C., A. J. Sutton, P. R. Burton, K. R. Abrams, and D. R.
Jones. 2005. How vague is vague? A simulation study of the impact of the use of vague prior distributions in MCMC using WinBUGS. Stat. Med. 24:2401–2428.
Lean, I. J., A. R. Rabiee, T. F. Duffield, and I. R. Dohoo. 2009. Invited review: Use of meta-analysis in animal health and reproduction: Methods and applications. J. Dairy Sci. 92:3545–3565.
Lunn, D. J., A. Thomas, N. Best, and D. Spiegelhalter. 2000. Win-BUGS—A Bayesian modelling framework: Concepts, structure, and extensibility. Stat. Comput. 10:325–337.
Moe, P. W., W. P. Flatt, and H. F. Tyrrell. 1972. The net energy val-ues of feeds for lactation. J. Dairy Sci. 55:945–958.
Moe, P. W., H. F. Tyrrell, and W. P. Flatt. 1971. Energetics of body tissue mobilization. J. Dairy Sci. 54:548–553.
National Research Council. 2001. Nutrient Requirements of Dairy Cattle. 7th rev. ed. Natl. Acad. Press, Washington, DC.
Noblet, J., C. Karege, S. Dubois, and J. van Milgen. 1999. Metabolic utilization of energy and maintenance requirements in growing pigs: Effects of sex and genotype. J. Anim. Sci. 77:1208–1216.
Ntzoufras, I. 2009. Bayesian Modeling using WinBUGS. John Wiley and Sons, New York, NY.
Pinheiro, J., and D. M. Bates. 2000. Mixed effects models in S and S-PLUS. Statistics and Computing. Springer, New York, NY.
Raftery, A. E., and S. M. Lewis. 1992. One long run with diagnostics: Implementation strategies for Markov chain Monte Carlo. Stat. Sci. 7:493–497.
Roux, C. Z., H. S. Hofmeyr, and E. Jordaan. 1982. The problem of multicollinearity in the estimation of partial efficiencies of protein and fat by regression methods. Pages 138–140 in Proc. 9th Symp. Energy Metabol. Farm Anim., Lillehammer, Norway. A. Ekern and F. Sundstol, ed. EAAP No 29. Agric. Univ. Norway, Ås.
Spiegelhalter, D. J., N. Best, B. P. Carlin, and A. van der Linde. 2002. Bayesian measures of model complexity and fit (with discussion). J. R. Stat. Soc. B 64:583–640.
St-Pierre, N. R. 2001. Invited review: Integrating quantitative findings from multiple studies using mixed model methodology. J. Dairy Sci. 84:741–755.
Strathe, A. B., A. Danfær, A. Chwalibog, H. Sørensen, and E. Ke-breab. 2010a. A multivariate nonlinear mixed effects method for analyzing energy partitioning in growing pigs. J. Anim. Sci. 88:2361–2372.
Strathe, A. B., J. Dijkstra, J. France, and E. Kebreab. 2010b. Bayesian analysis of energy balance data from lactating cows: Combining past and present information. Can. J. Anim. Sci. 90:603–604.
Subtil, F., and M. Rabilloud. 2010. Robust non-linear mixed modelling of longitudinal PSA levels after prostate cancer treatment. Stat. Med. 29:573–587.
Thomas, A. 2006. The BUGS language. R News 6:17–21.Thomas, A., B. O’Hara, U. Ligges, and S. Sturtz. 2006. Making BUGS
open. R News 6:12–17.Tolkamp, B. J., and I. Kyriazakis. 2009. Toward a new practical en-
ergy evaluation system for dairy cows. Animal 3:307–314.Van Es, A. J. H. 1975. Feed evaluation for dairy cows. Livest. Prod.
Sci. 2:95–107.van Houwelingen, H. C., L. R. Arends, and T. Stijnen. 2002. Tutorial
in biostatistics—Advanced methods in meta-analysis: Multivariate approach and meta-regression. Stat. Med. 21:589–624.
van Knegsel, A. T. M., H. van den Brand, J. Dijkstra, W. M. van Straalen, M. J. W. Heetkamp, S. Tamminga, and B. Kemp. 2007. Dietary energy source in dairy cows in early lactation: Energy par-titioning and milk composition. J. Dairy Sci. 90:1467–1476.
Yan, T., F. J. Gordon, R. E. Agnew, M. G. Porter, and D. C. Patter-son. 1997a. The metabolisable energy requirement for maintenance and the efficiency of utilisation of metabolisable energy for lacta-tion by dairy cows offered grass silage-based diets. Livest. Prod. Sci. 51:141–150.
Yan, T., F. J. Gordon, C. P. Ferris, R. E. Agnew, M. G. Porter, and D. C. Patterson. 1997b. The fasting heat production and effect of lactation on energy utilisation by dairy cows offered forage-based diets. Livest. Prod. Sci. 52:177–186.
2531BAYESIAN ANALYSIS OF ENERGY BALANCE DATA
Journal of Dairy Science Vol. 94 No. 5, 2011