Summer foraging areas for lactating New Zealand sea lions Phocarctos hookeri
13
MARINE ECOLOGY PROGRESS SERIES Mar Ecol Prog Ser Vol. 304: 235–247, 2005 Published December 8 INTRODUCTION Animal foraging behaviour is predicted predomi- nantly by the abundance and distribution of their food resources (Harcourt et al. 2002). However, if there are spatial or temporal external constraints on the area that can be covered for resources (i.e. the restriction of provisioning stationary offspring), or resource compe- tition or fluctuation, a change in foraging activity and efficiency may result in a decrease in individual and population fitness (McCafferty et al. 1998). Such constraints are often observed for otariid seals (fur seals and sea lions), especially breeding females. Female otariids are constrained to forage near their breeding colonies as they suckle their offspring for long periods (4 mo to 3 yr) and the pup fasts while their mother is absent (Schulz & Bowen 2004). In addition, there are many examples of otariid breeding popula- tions foraging areas that show both extensive natural fluctuations in resources, and overlap and competition with fisheries (i.e. Boyd et al. 1994, McCafferty et al. 1998, Thompson et al. 1998, Georges et al. 2000). The objective of this research was to investigate the forag- ing ranges of lactating female New Zealand sea lions Phocarctos hookeri (NZ sea lions, formally known as Hooker’s sea lions) to (1) understand individual variation and population foraging range, (2) allow comparison of foraging ranges with the New Zealand sub-Antarctic arrow squid Nototodarus sloanii fishery operation area, (3) allow comparisons with other otariid species and (4) complement current data pub- lished on energetic and diving behaviour (Costa et al. 1998, 2001, Gales & Mattlin 1998, Costa & Gales 2000). The NZ sea lion is one of the world’s rarest and most highly localised pinnipeds: classified as ‘Vulnerable’ by the International Union for Conservation of Nature © Inter-Research 2005 · www.int-res.com *Email: [email protected] Summer foraging areas for lactating New Zealand sea lions Phocarctos hookeri B. Louise Chilvers 1, 4, *, Ian S. Wilkinson 1, 2 , Padraig J. Duignan 3 , Neil J. Gemmell 4 1 Science and Research Unit, Department of Conservation, PO Box 10-420, Wellington, New Zealand 2 14 Carlisle St, Shoalwater, Western Australia 6169, Australia 3 New Zealand Wildlife Health Centre, IVABS, Massey University, Palmerston North, New Zealand 4 School of Biological Science, Canterbury University, Christchurch, New Zealand ABSTRACT: The overlap between marine mammal species and fisheries is a source of ongoing con- flict and concern. This study used satellite telemetry to examine the foraging patterns of 26 lactating female New Zealand sea lions Phocarctos hookeri from the Sandy Bay colony, Enderby Island, Auck- land Islands (50° 50’ S, 166° 28’ E), over 4 consecutive austral summers from 2001 to 2004. Animals were fitted with satellite-linked platform transmitting terminals (PTTs), which yielded 9200 filtered foraging locations at sea. Trips lasted a mean of 66.2 h (SE = 4.2, n = 183). Mean return travel distance per trip was 423 km (SE = 43.9, max. = 1087, n = 183). There was a high level of variation in individ- ual foraging parameters, and evidence of individual preference and partitioning in foraging locations among individuals within the colony. New Zealand sea lions exhibited preferential use of the conti- nental shelf and its edge and this pattern was consistent among years. Female foraging locations overlap temporally and spatially with the operation of the sub-Antarctic arrow squid trawl fishery. Here we identify the key foraging areas for female New Zealand sea lions from Sandy Bay, show how these overlap with the operational areas of the squid fishery and discuss the importance of these findings to the management of New Zealand sea lions and the sub-Antarctic squid fishery. KEY WORDS: Phocarctos hookeri · New Zealand sea lions · Foraging ecology · Fisheries interaction Resale or republication not permitted without written consent of the publisher
-
Upload
departmentconservationnewzealand -
Category
Documents
-
view
0 -
download
0
Transcript of Summer foraging areas for lactating New Zealand sea lions Phocarctos hookeri

MARINE ECOLOGY PROGRESS SERIESMar Ecol Prog Ser
Vol. 304: 235–247, 2005 Published December 8
INTRODUCTION
Animal foraging behaviour is predicted predomi-nantly by the abundance and distribution of their foodresources (Harcourt et al. 2002). However, if there arespatial or temporal external constraints on the areathat can be covered for resources (i.e. the restriction ofprovisioning stationary offspring), or resource compe-tition or fluctuation, a change in foraging activity andefficiency may result in a decrease in individual andpopulation fitness (McCafferty et al. 1998).
Such constraints are often observed for otariid seals(fur seals and sea lions), especially breeding females.Female otariids are constrained to forage near theirbreeding colonies as they suckle their offspring forlong periods (4 mo to 3 yr) and the pup fasts while theirmother is absent (Schulz & Bowen 2004). In addition,there are many examples of otariid breeding popula-
tions foraging areas that show both extensive naturalfluctuations in resources, and overlap and competitionwith fisheries (i.e. Boyd et al. 1994, McCafferty et al.1998, Thompson et al. 1998, Georges et al. 2000). Theobjective of this research was to investigate the forag-ing ranges of lactating female New Zealand sea lionsPhocarctos hookeri (NZ sea lions, formally knownas Hooker’s sea lions) to (1) understand individualvariation and population foraging range, (2) allowcomparison of foraging ranges with the New Zealandsub-Antarctic arrow squid Nototodarus sloanii fisheryoperation area, (3) allow comparisons with otherotariid species and (4) complement current data pub-lished on energetic and diving behaviour (Costa et al.1998, 2001, Gales & Mattlin 1998, Costa & Gales 2000).
The NZ sea lion is one of the world’s rarest and mosthighly localised pinnipeds: classified as ‘Vulnerable’by the International Union for Conservation of Nature
© Inter-Research 2005 · www.int-res.com*Email: [email protected]
Summer foraging areas for lactating New Zealand sea lions Phocarctos hookeri
B. Louise Chilvers1, 4,*, Ian S. Wilkinson1, 2, Padraig J. Duignan3, Neil J. Gemmell4
1Science and Research Unit, Department of Conservation, PO Box 10-420, Wellington, New Zealand 214 Carlisle St, Shoalwater, Western Australia 6169, Australia
3New Zealand Wildlife Health Centre, IVABS, Massey University, Palmerston North, New Zealand4School of Biological Science, Canterbury University, Christchurch, New Zealand
ABSTRACT: The overlap between marine mammal species and fisheries is a source of ongoing con-flict and concern. This study used satellite telemetry to examine the foraging patterns of 26 lactatingfemale New Zealand sea lions Phocarctos hookeri from the Sandy Bay colony, Enderby Island, Auck-land Islands (50°50’S, 166°28’E), over 4 consecutive austral summers from 2001 to 2004. Animalswere fitted with satellite-linked platform transmitting terminals (PTTs), which yielded 9200 filteredforaging locations at sea. Trips lasted a mean of 66.2 h (SE = 4.2, n = 183). Mean return travel distanceper trip was 423 km (SE = 43.9, max. = 1087, n = 183). There was a high level of variation in individ-ual foraging parameters, and evidence of individual preference and partitioning in foraging locationsamong individuals within the colony. New Zealand sea lions exhibited preferential use of the conti-nental shelf and its edge and this pattern was consistent among years. Female foraging locationsoverlap temporally and spatially with the operation of the sub-Antarctic arrow squid trawl fishery.Here we identify the key foraging areas for female New Zealand sea lions from Sandy Bay, show howthese overlap with the operational areas of the squid fishery and discuss the importance of thesefindings to the management of New Zealand sea lions and the sub-Antarctic squid fishery.
KEY WORDS: Phocarctos hookeri · New Zealand sea lions · Foraging ecology · Fisheries interaction
Resale or republication not permitted without written consent of the publisher
Mar Ecol Prog Ser 304: 235–247, 2005
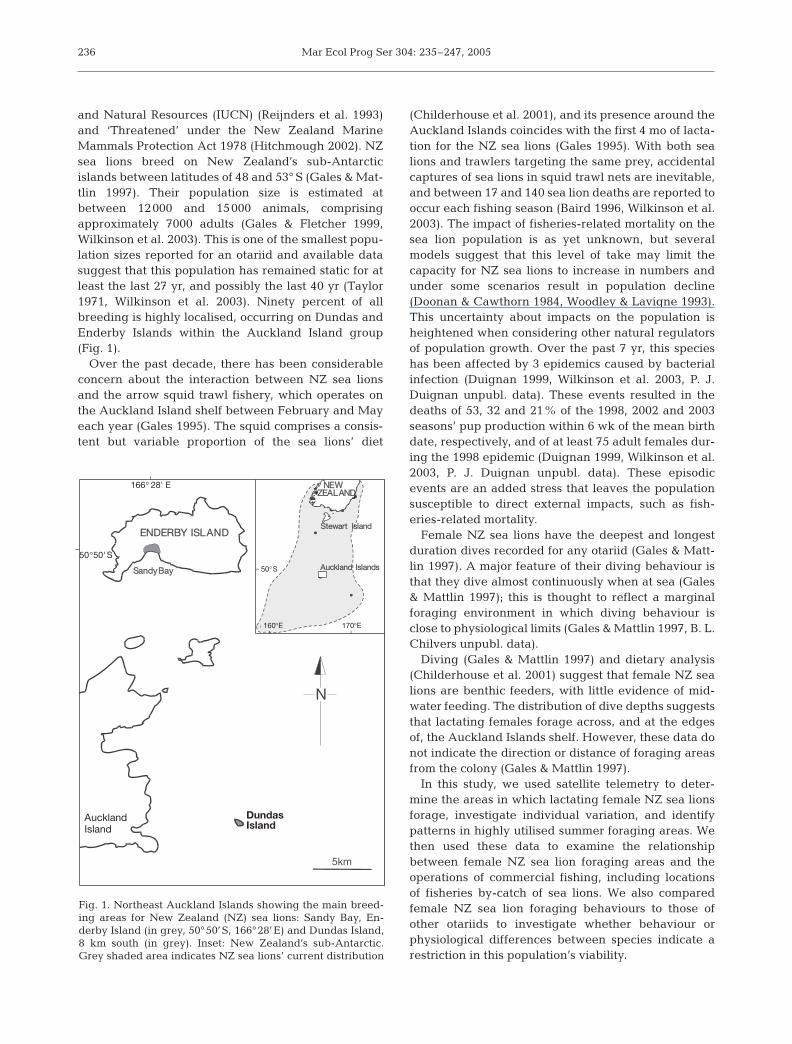
and Natural Resources (IUCN) (Reijnders et al. 1993)and ‘Threatened’ under the New Zealand MarineMammals Protection Act 1978 (Hitchmough 2002). NZsea lions breed on New Zealand’s sub-Antarcticislands between latitudes of 48 and 53° S (Gales & Mat-tlin 1997). Their population size is estimated atbetween 12000 and 15000 animals, comprisingapproximately 7000 adults (Gales & Fletcher 1999,Wilkinson et al. 2003). This is one of the smallest popu-lation sizes reported for an otariid and available datasuggest that this population has remained static for atleast the last 27 yr, and possibly the last 40 yr (Taylor1971, Wilkinson et al. 2003). Ninety percent of allbreeding is highly localised, occurring on Dundas andEnderby Islands within the Auckland Island group(Fig. 1).
Over the past decade, there has been considerableconcern about the interaction between NZ sea lionsand the arrow squid trawl fishery, which operates onthe Auckland Island shelf between February and Mayeach year (Gales 1995). The squid comprises a consis-tent but variable proportion of the sea lions’ diet
(Childerhouse et al. 2001), and its presence around theAuckland Islands coincides with the first 4 mo of lacta-tion for the NZ sea lions (Gales 1995). With both sealions and trawlers targeting the same prey, accidentalcaptures of sea lions in squid trawl nets are inevitable,and between 17 and 140 sea lion deaths are reported tooccur each fishing season (Baird 1996, Wilkinson et al.2003). The impact of fisheries-related mortality on thesea lion population is as yet unknown, but severalmodels suggest that this level of take may limit thecapacity for NZ sea lions to increase in numbers andunder some scenarios result in population decline(Doonan & Cawthorn 1984, Woodley & Lavigne 1993).This uncertainty about impacts on the population isheightened when considering other natural regulatorsof population growth. Over the past 7 yr, this specieshas been affected by 3 epidemics caused by bacterialinfection (Duignan 1999, Wilkinson et al. 2003, P. J.Duignan unpubl. data). These events resulted in thedeaths of 53, 32 and 21% of the 1998, 2002 and 2003seasons’ pup production within 6 wk of the mean birthdate, respectively, and of at least 75 adult females dur-ing the 1998 epidemic (Duignan 1999, Wilkinson et al.2003, P. J. Duignan unpubl. data). These episodicevents are an added stress that leaves the populationsusceptible to direct external impacts, such as fish-eries-related mortality.
Female NZ sea lions have the deepest and longestduration dives recorded for any otariid (Gales & Matt-lin 1997). A major feature of their diving behaviour isthat they dive almost continuously when at sea (Gales& Mattlin 1997); this is thought to reflect a marginalforaging environment in which diving behaviour isclose to physiological limits (Gales & Mattlin 1997, B. L.Chilvers unpubl. data).
Diving (Gales & Mattlin 1997) and dietary analysis(Childerhouse et al. 2001) suggest that female NZ sealions are benthic feeders, with little evidence of mid-water feeding. The distribution of dive depths suggeststhat lactating females forage across, and at the edgesof, the Auckland Islands shelf. However, these data donot indicate the direction or distance of foraging areasfrom the colony (Gales & Mattlin 1997).
In this study, we used satellite telemetry to deter-mine the areas in which lactating female NZ sea lionsforage, investigate individual variation, and identifypatterns in highly utilised summer foraging areas. Wethen used these data to examine the relationshipbetween female NZ sea lion foraging areas and theoperations of commercial fishing, including locationsof fisheries by-catch of sea lions. We also comparedfemale NZ sea lion foraging behaviours to those ofother otariids to investigate whether behaviour orphysiological differences between species indicate arestriction in this population’s viability.
236
Stewart Island
Auckland Islands
NEW ZEALAND
Sandy Bay
ENDERBY ISLAND
160∞E
5km
N
AucklandIsland
DundasIsland
50° 50'
166° 28' E
170°E
50° S
160°E
S
Fig. 1. Northeast Auckland Islands showing the main breed-ing areas for New Zealand (NZ) sea lions: Sandy Bay, En-derby Island (in grey, 50°50’S, 166°28’E) and Dundas Island,8 km south (in grey). Inset: New Zealand’s sub-Antarctic.Grey shaded area indicates NZ sea lions’ current distribution

Chilvers et al.: Foraging ecology of New Zealand sea lions
MATERIALS AND METHODS
This study was conducted at the Sandy Bay breedingcolony, Enderby Island, Auckland Islands (50°30’S,166°17’E; Fig. 1) over the 4 breeding seasons (Decem-ber to January) of 2001 to 2004. The Sandy Bay colonyis the second largest breeding colony for NZ sea lions,with approximately 400 to 500 pups born per year(Gales & Fletcher 1999). Female NZ sea lions comeashore 1 to 3 d before giving birth from early Decem-ber to early January. Mothers give birth to a single pupand remain with it for 5 to 10 d before returning to seato forage (Cawthorn et al. 1985). They then alternatebetween feeding trips at sea (1 to 5 d) and nursing ofthe pup ashore (1 to 3 d) until the pups are weaned atapproximately 9 mo of age (Cawthorn et al. 1985).
Branded female NZ sea lions observed to be sucklinga pup were captured using a specially designed hoopnet and physically restrained by 2 handlers; they werethen anaesthetised using isoflurane delivered withoxygen to a mask via a field-portable vaporiser (Gales& Mattlin 1998), which has been routinely applied topinnipeds and over 1000 NZ sea lions (Gales & Mattlin1998, Costa & Gales 2000, I. S. Wilkinson & P. J.Duignan unpubl. data). Satellite-linked platform trans-mitting terminals (PTTs) (Telonics 300 mW ST6, pottedin epoxy, 130 mm × 35 mm × 15 mm × 175 g, TelonicsMesa), VHF transmitters (70 mm × 30 mm × 15 mm,Sirtrack) and time-depth recorders (TDR) (Mk9, 40 mm× 30 mm × 22 mm and 65 mm × 8 mm × 18 mm, WildlifeComputers) were attached to the females. Prior todeployment, each instrument was glued to a piece ofneoprene material cut to the same size as the unit’sbase (Gales & Mattlin 1997). This neoprene base wasthen glued to the dorsal pelage of the sea lion using 2-part epoxy glue. When the animals were recaptured,the instruments could then be easily removed by cut-ting through the middle of the neoprene, and thereforenot cutting into the tag or sea lion hair. Once the PTTunits were adequately attached to the sea lion (8 to10 min after glue application), the flow of anaestheticwas stopped, and the animal allowed to recover andreturn to its pup. Each animal was observed afterrestraint until it was fully conscious and had returnedto the group or location where captured. All femaleswere recaptured before the end of the field season(18 February) to retrieve instruments. Satellite tagswere programmed to work continuously, but werefitted with salt-water and wet-dry switches to ensurethat transmission only occurred when animals were atsea and on the surface.
Locations. Sea lion locations were calculated byreference to 3 satellites and assigned by Argos to 6classes on the basis of their accuracy. The accuracy oflocations provided by Argos is classified as follows:
(1) Class 3, accurate to 150 m; (2) Class 2, accurate to350 m; (3) Class 1, accurate to 1 km; (4) Class 0, accu-rate to ≥1 km; and (5) Classes A and B, limited accu-racy. Only the 4 most accurate classes (0, 1, 2, 3) wereincluded in these analyses (Boyd et al. 1998, Bonadon-na et al. 2000). Locations were filtered using a max-imum swimming speed parameter of 2 m s–1 (Crockeret al. 2001). Locations with a running mean speedgreater than this value were excluded as outliers.
Filtered locations were used to estimate distancefrom Enderby Island, and distance travelled. Total dis-tance travelled resulted from the interpolation of allfiltered locations. Due to the errors related to the accu-racy of satellite locations, all distance calculations arepresented to the nearest 1 km. This error factor needsconsideration when interpreting results. The durationof trips and periods ashore were calculated from satel-lite data. Calculations of mean distance travelled pertrip, maximum distance from the breeding colony andkernel ranges (KRs) (Worton 1989) were restricted tocomplete trips (those defined by locations at the colonyor within 10 km from the colony while the sea lionswere travelling towards it). Locations from incompletetrips are represented in figures and tables but were notused in trip statistics. KRs for 50 and 65% of all loca-tions per sea lion were created using the AnimalMovement Extension of ARCVIEW (Hooge et al. 2000).KRs representing 50 and 65% of all of the locationswere thought to show representative ranges of forag-ing locations with 2 values helping to determine theconcentration of locations within foraging areas. Thesevalues were obtained using smoothing factors cal-culated via least-square cross-validation (Seaman &Powell 1996) and were averaged and used to comparerepresentative foraging area size between individuals,using 1-way ANOVAs. Weighted (by number of sight-ings) and un-weighted averages were both employedto determine whether there was any bias in KR sizesdue to differences in the number of sightings for eachindividual. KR sizes (both 50 and 65%) were plottedrelative to the number of foraging trips and comparedusing 1-way ANOVAs.
All trip variables derived from location data wereanalysed using Excel, SPSS and ARCVIEW (MicrosoftOffice Excel 2003, ARCVIEW© 1998 ESRI, SPSS 2004).Individual variations in trip variables were analysedusing 1-way ANOVAs or non-parametric Kruskal-Wal-lis tests. Pearson’s correlations were used to comparethe correlations between foraging variables andbetween female age and foraging variables. Since NZsea lions dive almost continuously while at sea (Gales& Mattlin 1997), all trips and satellite locations areassumed to be part of a foraging trip and to representforaging locations. The arrow squid fisheries opera-tional locations and sea lion bycatch data were sup-
237

Mar Ecol Prog Ser 304: 235–247, 2005
plied by the Research Data Management section of theMinistry of Fisheries, New Zealand. Fisheries data rep-resent all start/stop locations for trawl shoots under-taken each year. KRs representing 50 and 95% of alltrawler activity were created to show areas of highestactivity. These values were calculated the same way asthose for the foraging areas as outlined above.
RESULTS
New Zealand sea lion foraging trip patterns
Twenty-six females yielded 9200 filtered locations,with equipment deployed or active for between 5and 36 d for each female (Table 1, Fig. 2). The per-
centage of each Argos location quality category afterfiltering for 9200 locations was: (1) Classes 2 and 3(8%); (2) Class 1 (24%); (3) Class 0 (68%). Deploy-ment year, female identification, number of daysdeployed, total number of filtered satellite locations,numbers and duration of foraging trips, and otherforaging trip statistics are shown in Table 1. Therewere 183 complete foraging trips identified with amean of 7 trips per individual (min. = 1, max. = 15)lasting on average 66 h (Table 1). The mean maxi-mum distance travelled from breeding to foragingsites was 102 km (range = ~33 to 188 km, Table 1).Mean distance and time between interpolated loca-tions were 9 km and 2.1 h, respectively. Mean tripdistance was 423 km (range = 58 to 901 km). Themean duration ashore between foraging trips was
238
Female Age No. Total No. Mean Mean Total Mean Max. Mean travel Max.ID (yr) days no. of of time time travel trip trip speed between distance
de- loca- trips at sea ashore distance distance distance satellite from colonyployed tions (h) (h) (km) (km) (km) locations (m s–1) (km)
20011424 9 29 338 15 23.5 ± 3.0 20.6 ± 2.7 4634 305 ± 32.3 601 3.4 95.91474 8 36 588 10 65.0 ± 6.6 20.6 ± 3.3 3710 358 ± 44.4 554 1.4 69.51480 8 34 258 6 096.1 ± 15.5 14.3 ± 1.5 2152 335 ± 42.2 406 0.9 75.91438 10 34 666 12 065.1 ± 10.4 15.1 ± 1.4 5000 401 ± 69.9 924 1.4 92.120021428 11 27 396 5 83.8 ± 7.9 18.9 ± 1.4 3560 693 ± 64.4 871 2.0 145.51500 10 26 230 5 90.2 ± 5.1 16.6 ± 2.2 3567 0697 ± 104.6 895 1.8 188.01375 12 17 308 4 070.3 ± 12.9 27.8 ± 6.5 2898 0710 ± 103.5 1004 2.3 85.11422 –a 12 122 7 20.9 ± 5.6 26.2 ± 4.2 983 128 ± 65.1 251 1.7 52.31413 12 28 666 7 80.4 ± 5.8 14.1 ± 2.7 5012 672 ± 86.0 975 1.7 87.51423 10 31 366 8 66.1 ± 7.6 15.7 ± 3.1 2988 316 ± 52.8 586 1.1 85.920031433 12 33 351 6 79.6 ± 5.7 29.1 ± 5.3 1985 309 ± 29.4 407 1.1 118.81391 10 31 328 10 43.8 ± 5.6 20.3 ± 1.3 3461 323 ± 47.8 526 1.9 86.41397 11 30 463 6 096.4 ± 14.8 36.8 ± 3.1 3601 696 ± 85.5 976 1.8 162.51492 12 8 86 2 065 ± 2.9 41.6 ± na. 399 185 ± 3.90 189 0.7 58.41458 12 32 476 6 95.6 ± 9.5 23.9 ± 5.0 2918 435 ± 70.9 764 1.0 154.81409 12 31 776 8 67.4 ± 5.7 20.1 ± 2.2 3279 344 ± 51.3 563 1.0 74.920041483 10 30 72 7 48.7 ± 9.0 41.4 ± 2.1 546 058 ± 12.7 125 0.4 32.61406 15 5 66 1 126.9 na 509 na 508 0.9 69.61485 14 31 115 6 60.5 ± 4.8 32.2 ± 4.4 1141 169 ± 23.8 279 0.7 69.21385 17 28 91 4 083.7 ± 12.1 44.4 ± 1.6 1448 291 ± 18.8 342 0.7 134.51470 15 33 657 7 82.0 ± 7.3 30.1 ± 3.0 7681 901 ± 43.4 1087 2.3 110.21484 13 32 239 4 068.6 ± 15.9 34.7 ± 9.4 2251 427 ± 22.8 492 1.7 94.41443 12 31 260 8 45.5 ± 5.4 32.2 ± 2.9 2219 220 ± 41.4 439 1.1 162.71439 10 33 398 8 53.8 ± 3.0 33.3 ± 3.8 3977 489 ± 40.8 616 2.0 91.11456 13 33 374 14 35.4 ± 3.5 23.8 ± 1.9 5973 415 ± 39.4 626 3.4 145.91462 15 31 510 7 67.2 ± 4.3 36.4 ± 3.3 5662 724 ± 94.1 1038 2.8 130.7
Overall 28 ± 1.6 353 ± 40.1 7 ± 0.6 66.2 ± 4.2 26.8 ± 1.8 3127 ± 359.5 423 ± 43.9 617 ± 55.1 1.6 ± 0.2 102 ± 7.7meansaAge unknown
Table 1. Phocarctos hookeri. Deployment between 2001 and 2004 (all instruments were deployed for various time periods between12 January and 18 February within each year); number of days deployed and duration of foraging trips for 26 New Zealand sea lions from Sandy Bay breeding colony, Enderby Island, Auckland Islands, are shown. All means presented ± SE. na = not available

Chilvers et al.: Foraging ecology of New Zealand sea lions
26.8 h (range = ~14 to 44 h). There was no correla-tion between the length of time individuals spentashore and the distance or duration of the precedingor subsequent foraging trip.
There was a significant positive correlation betweenthe distance travelled on a trip and its duration, withlonger trips having longer durations (Pearson’s r =0.567, n = 182, p < 0.01, Table 1). There was also a sig-nificant positive correlation between trip distance andmean travel speed between satellite locations, withlonger trips having significantly higher travel speeds(Pearson’s r = 0.441, n = 182, p < 0.01). There was a sig-nificant negative correlation between travel speed andtrip duration, with the longer the duration of the forag-ing trip, the slower the mean travel speed (Pearson’sr = –0.353, n = 182, p < 0.01); therefore, females used acombination of travel speed and prolonged foragingtrip durations to cover longer distances. Mean travelspeed between locations for all females was 1.6 ±0.2 m s–1, with individual differences ranging from 0.7to 3.4 m s–1 (Table 1).
Examination of the tracks of foraging trips of thefemale NZ sea lions showed that they predominantlymoved north from Enderby Island and that these tripdirections were constant between foraging trips formost females (Fig. 3). In all years, the principal forag-
ing areas were both northeast and northwest ofEnderby Island at the continental shelf margins, andwithin the limits of the Auckland Rise (Fig. 2). Individ-ual NZ sea lion direction of foraging showed signifi-cant individual variation between females (Kruskal-Wallis χ2 = 177.17, df = 25, p < 0.0001, Fig. 3). Thevariation in the foraging trip direction taken by eachfemale was usually small, with 20 of the 26 femaleshaving a foraging direction range less than 20° (i.e.her foraging trips would range at angles between 4and 24° from Enderby Island). The largest variationwas 62° (n = 14) and the smallest 6° (n = 6). There are3 distinct concentrations or patterns of female forag-ing locations: (1) west and southwest of the Enderby/Auckland Islands area, mean distance to KR fromEnderby being 30 to 50 km and representing 5 of the26 females and 15% of all satellite locations within anapproximate 1000 km2 area; (2) northeast of EnderbyIsland, mean distance to KR from Enderby being 50 to100 km and representing 11 of the 26 females over adispersed area; and (3) the area directly north andwest of Enderby and Auckland Islands, and northwestof these islands surrounding the 250 m bathymetricline, where 9 of the 26 females and 18% of all satellitelocations are concentrated within an approximately2000 km2 area.
239
Fig. 2. Phocarctos hookeri. Distribution of foraging locations of 26 lactating NZ female sea lions and overlap with squid trawl fish-eries effort (50 and 95% kernel ranges represented as thick black lines) from the austral summers of 2001 to 2004. AucklandIsland is represented in black. Bathymetric contours are shown as thin black lines. Auckland Island shelf is represented by
500 m bathymetric boundary

Mar Ecol Prog Ser 304: 235–247, 2005240
Fig. 3. (Above and facing page.) Phocarctos hookeri. All filtered satellite locations from female NZ sea lions during January andFebruary of the austral summers 2001 to 2004; all sea lion bycatches reported in each year (large grey squares) and the squidtrawl fisheries effort for February and March of each year shown as 50 and 95% kernel ranges (thick black lines). Bathymetriccontours are shown as thin black lines. Insets: direction and maximum distance from pupping site of foraging trips obtained from
satellit locations and tracks for NZ sea lions from Sandy Bay in each year. See Fig. 2 for key to symbols

Chilvers et al.: Foraging ecology of New Zealand sea lions 241
Fig. 3 (continued)

Mar Ecol Prog Ser 304: 235–247, 2005
Individual variation
Individual attendance and foraging duration pat-terns showed considerable variation, with trip dura-tions ranging from 20 to 126 h and attendance patternsvarying from 14 to 44 h (1-way ANOVA: attendanceF = 7.2, p < 0.001, df = 25; trip duration F = 8.9, p <0.001, df = 25; Table 1). There was no correlationbetween the duration a female spent ashore and theduration of her previous or subsequent foraging trip.
Similarly, there were significant differences betweenindividuals in the mean distances travelled for eachforaging trip (range = 58 to 901 km, 1-way ANOVA: F =12.6, p < 0.001, df = 25) and the mean travel speedbetween satellite locations for each individual (travelspeed F = 14.1, p < 0.001, df = 25). The mean distanceindividuals travelled and the duration of their trips, tripdistance and travel speed were positively correlated,while a negative correlation existed between travelspeed and trip duration (see ‘New Zealand sea lionforaging trip patterns’ section).
KR was calculated for 50 and 65% of all locations foreach lactating female to give an indication of the areasin which females concentrated their foraging activity(Table 2). There were high levels of variability and sig-nificant differences in the sizes of the KR between indi-viduals with mean areas of 378 ± 80.5 km2 for 50% KRand 643 ± 131.1 km2 for 65% KR (1-way ANOVA: un-weighted F = 8.1, df = 25, p < 0.0001; weighted by num-ber of sightings F = 5420, df = 25, p < 0.0001). Somefemales showed concentrated use of foraging areas(n = 14, 50% KR < 200 km2; Table 2), while otherfemales had diverse foraging areas, apparently notreturning to the same locations each foraging trip (n =6, 50% KR > 500 km2, max. = 1810 km2; Table 2). Therewas no significant difference between KR and thenumber of complete foraging trips observed for eachindividual (1-way ANOVA: 50% KR, F = 1.68, df = 10,p = 0.18; 65% KR, F = 1.99, df = 10, p = 0.11), indicatingthat KR is not a function of the number of foraging tripsand that KR areas represent a clear fidelity to foragingareas. There was a significant difference in KR withage, with 12, 13, 15 and 17 yr olds (n = 13) having a sig-nificantly smaller KR than the other age classes (1-wayANOVA: F = 2.7, df = 8, p = 0.016). However, the only14 yr old female had one of the largest KR of anyfemale (Table 2). A central point was taken from withineach of these KRs and mean direct line distance to thebreeding colony calculated, indicating mean directline distance to the central foraging area for eachfemale (Table 2). The mean distance females wereforaging from the colony was 64 ± 6.5 km (n = 26). Fivefemales travelled an average of >100 km to reach theirforaging areas, while for 10 females, the mean distanceto the foraging location was ≤ 35 km.
Female age was strongly correlated with mean dura-tion ashore and the mean foraging trip distance. Olderfemales had significantly longer foraging trip distancesand significantly longer periods ashore between forag-ing trips (duration ashore: Pearson’s r = 0.463, n = 174,p < 0.001; mean trip distance: Pearson’s r = 0.278, n =174, p < 0.001). There was also a weak correlationbetween female age and duration of foraging trip, witholder females having longer foraging trip durationsthan younger females (Pearson’s r = 0.175, n = 174, p =0.02). There was no correlation between mass and anyforaging trip parameters; however, mass was signifi-cantly correlated with age, with older females beingheavier (mass range = 89 to 133 kg, 1-way ANOVA: F = 37.1, df = 8, p < 0.001).
242
Female Age Total No. 50% 65% MeanID (yr) no. of of KR KR distance
locations trips (km2) (km2) from colonyto centre
of KR (km)b
1424 9 338 15 534 883 311474 8 588 10 436 795 531480 8 258 6 241 419 351438 10 666 12 186 351 911428 11 396 5 689 1093 1131500 10 230 5 875 1893 1001375 12 308 4 152 238 281422 –a 122 7 763 1222 251413 12 666 7 398 504 591423 10 366 8 86 143 841433 12 351 6 89 264 1151391 10 328 10 1810 2786 631397 11 463 6 311 556 1031492 12 86 2 64 95 351458 12 476 6 441 903 821409 12 776 8 140 270 271483 10 72 7 362 457 321406 15 66 1 42 70 371485 14 115 6 1214 1959 621385 17 91 4 76 115 1171470 15 657 7 187 253 1031484 13 239 4 188 345 311443 12 260 8 131 194 261439 10 398 8 124 345 901456 13 374 14 159 232 291462 15 510 7 149 346 90
Overall means 378 ± 643 ± 63.9 ±80.5 131.1 6.5
aAge unknownbMean straight line distance from KR to colony taken fromthe middle of both the KRs as they are both centred on the same area
Table 2. Phocarctos hookeri. Kernel range (KR) sizes andmean straight line distances from colony to centre of KR for 26New Zealand sea lions from Sandy Bay breeding colony,
Enderby Island, Auckland Islands. All means ± SE
Chilvers et al.: Foraging ecology of New Zealand sea lions
Bathymetry
Considering all satellite locations, 92.2, 77.8 and14.4% were recorded in water of <500 , <250 and 250to 500 m water depth, respectively. The mean waterdepth recorded for all locations was 370.5 ± 3.8 m(mode = 250 m, n = 9200). Individual females showedapparent preferences for particular mean water depths(Kruskal-Wallis χ2 = 1968.8, df = 25, p < 0.0001).Twelve females were rarely recorded in water deeperthan 250 m, while 1 female (ID #1424) had a meanwater depth from satellite location of 815 ± 49.6 mbecause 48 out of 338 of her locations were recorded inwater deeper than 2000 m.
Fisheries interactions
There is extensive overlap in NZ sea lion foraginglocations and fisheries operations area. Fig. 3 showsfemale sea lion trip patterns, satellite locations, the KRareas of 95% of all squid fishery trawl operation andthe locations of sea lion captures on boats withobservers for each year. The age of sea lions capturedin the fisheries were all recorded as adult sea lionsbetween the ages of 3 and 18 yr. The sex ratio for sealion bycatch that were sexed ranged between 60%female and 40% male in 2001 to 78% female and 22%male in 2004. These values are not exact as not all sealions were sexed and some animals are known to havebeen sexed wrongly (P. J. Duignan unpubl. data). Overthe last 10 yr, the sex ratio of bycaught animals hasbeen approximately 50/50% (P. J. Duignan unpubl.data). Although the number of trawls undertaken bythe fishery varies between years, their locations aresimilar (Fig. 3). Two fishing areas predominate: onelies southeast of the Auckland Islands along the 250 mbathymetry line (44% of all tows undertaken in the last4 yr); the second north/northwest of the AucklandIslands (56% of all tows undertaken in the last 4 yr).There is little overlap between the foraging locations offemales from Enderby Island and the fishing areasoutheast of the Auckland Islands (Fig. 3). This fishingarea represents 28% of all sea lion captures in the last4 yr, and equates to approximately 44% of all towsundertaken and 39% of total catch by weight.
Of the 3 predominant female foraging location pat-terns, the first 2 (west and southwest of the Enderby/Auckland Islands and northeast of Enderby Island)have little overlap with fisheries operations (Fig. 3).However, the third, directly north and west of Enderbyand the Auckland Islands, and northwest along the250 m bathometric line, has significant overlap withfisheries operations. Here, 9 of the 26 females and 18%of all satellite locations were concentrated within a
2000 km2 area. In this same area, 56% of all trawlactivity was recorded, resulting in 61% of total catchby weight in the last 4 yr. However, it is also the area inwhich 72% of all fisheries bycatch captures of sea lionshave been reported. The reporting of bycatch is de-pendent on observers and fisheries reporting its occur-rence. This reporting system may cause bias in data ifeither observer coverage varies significantly betweenthe 2 fishing areas and/or fisheries neglect to reportcaptures.
DISCUSSION
Our study demonstrates individual variation andpreferences in foraging areas among lactating NZ sealions. It also shows the consistency in the diversity oflocations utilised across years; individual females con-sistently returning to relatively restricted foragingareas and travel direction each foraging trip (mean50% KR = 378 ± 80.5 km2, mean 65% KR = 643 ±131.1 km2). KR areas were not a function of the numberof foraging trips studied and indicate a high sitefidelity to specific foraging areas for most females. KRanalysis assumes equal probability of obtaining alocation at any given time. For marine mammals, thisassumption can sometimes be incorrect due to differ-ent behaviours (such as grooming, submerged travel-ling and dive bouts) influencing the probability of agood quality uplink to the receiver. However, whendetermining foraging locations for benthic foragers,such as NZ sea lions, this problem is lessened becausethere is a relatively long interval between benthicdives, during which animals are resting on the surface.This assumption is also supported from additional con-current dive data collected for some of these femalesusing time depth recorders (TDRs), which show divingconcentrated in areas of high satellite uplinks (B. L.Chilvers unpubl. data).
Lactating NZ sea lions from the Enderby Islandbreeding colony are central place foragers (Boyd et al.1997, 1998), principally foraging in areas north of thecolony and returning to the colony to transfer re-sources to their pups. Most locations were within thelimits and at the edges of the Auckland Rise (Fig. 2).Lactating female Antarctic, New Zealand and Aus-tralian fur seals Arctocephalus gazella, A. forsteri andA. pusillus doriferus, respectively; and Australian andCalifornia sea lions Neophoca cinerea and Zalophuscalifornianus, respectively, also forage over continen-tal shelves or in relation to the edge of the shelves,close to breeding sites (Harcourt et al. 1995, Gales &Costa 1997, Boyd et al. 1998, Arnould & Hindell 2001).The geographic preference for foraging in shallowershelf waters and at shelf edges displayed by otariids
243

Mar Ecol Prog Ser 304: 235–247, 2005
usually results in foraging occurring within 100 km ofbreeding sites (A. gazella, Boyd et al. 2002, Guinet etal. 2001; South American sea lions Otaria flavescens,Campagna et al. 2001, Thompson et al. 1998; A. for-steri, Harcourt et al. 1995, 2002; sub-Antarctic fur seal,A. tropicalis, Georges et al. 2000; A. pusillus doriferus,Arnould & Hindell 2001). NZ sea lion foraging locationdistances are within (some being at the upper end of)these observed otariid foraging limits, with mean dis-tance to KR foraging areas of between 24 and 116 kmfrom their breeding site (mean 64 ± 6.5 km), and max-imum foraging locations ranging between 32 and188 km (mean 102 ± 7.7 km; Table 1). The NZ sea lion’stotal foraging distances are, however, high (423 ±43.9 km, present study; and 321.4 ± 59.7 km, Costa &Gales 2000) relative to other otariids. For comparison,O. flavescens make foraging trips of 206 ± 117 km, yethave similar maximum foraging site to colony dis-tances (mean = 103 km, Campagna et al. 2001). Thissuggests that female NZ sea lions are covering agreater area and distance in a single foraging trip thanother otariids, which may indicate high prey hetero-geneity, patchiness and/or low prey abundance.
The mean travelling speed (1.6 ± 0.2 m s–1) recordedhere is similar to the surface swim velocity of NZ sealions previously reported (1.2 m s–1, Ponganis et al.1990; and 0.9 to 1.8 m s–1, Crocker et al. 2001).However, this value must be interpreted with cautionas it was calculated from travelling speeds that werefiltered to be no greater than 2 m s–1. The majority ofotariid swim speeds fall within a range of 0.7 to 2.7 m s–1
(Arctocephalus gazella, Boyd et al. 2002; Otariaflavescens, Thompson et al. 1998, Campagna et al.2001; Arctocephalus tropicalis, Georges et al. 2000).This suggests that NZ sea lions are restricted by physio-logical constraints for travelling speed similar to mostother otariids. This is important as it limits (constrains)the distance females can travel in a given time periodand influences energy returns for foraging trips(Crocker et al. 2001).
Individual variation in foraging patterns
To understand the foraging behaviours of a popula-tion, the differences in the behaviours of individualsmust first be recognised (Sutherland 1997). We foundsignificant individual differences in foraging trip dura-tion, time ashore, distance travelled, foraging location,water depth at satellite location and maximum dis-tance from breeding colony for NZ sea lions.
Gales & Mattlin (1997) showed similar individual dif-ferences in NZ sea lion diving behaviours, and in ananimal’s preference for different foraging depths andtrip durations. Similar individual variation was also
observed in Arctocephalus gazella (Boyd 1999, Stani-land & Boyd 2003, Staniland et al. 2004). Such individ-ual strategies may reflect long- or short-term learntforaging behaviours, such as the most recently foundfood, learnt foraging locations from maternal transfer,or learning from con-specifics. Although we foundthere is a significant relationship between bathymetryand foraging location, we suggest that bathymetry is aproximate cause of the observed foraging locations,while the ultimate cause of the observed locations willbe the distribution of food.
The relationship between age (and by correlation,higher mass at deployment) and foraging location,including KR values, suggests that older sea lionsswam further and stayed at sea longer, but foraged in amore concentrated area than younger animals. How-ever, they also spent greater time periods ashorebetween foraging trips. From a management perspec-tive, individual foraging strategies of female NZ sealions need to be related to their long-term reproductivesuccess and survival to understand how foraging para-meters, an indication of prey availability and distribu-tion, are influencing population stability and viability.
Fisheries interactions
Data on squid presence in sea lion diet (Childer-house et al. 2001), the overlapping locations of sea lionforaging areas with fisheries operations (Wilkinson etal. 2003, present study), and the fact that NZ sea lionsare caught in fishing operations (Fig. 3), all indicatethat the squid trawl fishery has considerable potentialto impact negatively upon NZ sea lions. This studyshows that the summer foraging ranges of lactating NZsea lions from the Enderby Island colony are predomi-nantly north of the island.
Of the 3 distinct female foraging location patterns,those that forage predominantly southwest or north-east of the Enderby/Auckland Islands have a low over-lap with current fisheries operations and there is nobycatch of sea lions reported in these areas. The thirdconcentration directly west of Enderby and AucklandIslands, and northwest of these islands surroundingthe 250 m bathymetric line has significant overlap, and72% of fisheries sea lion bycatch captures in the last4 yr. There maybe possible bycatch data bias betweenthe 2 identified fishing areas depending on observercoverage and fisheries reporting of bycatch.
There is currently a 12 n mile (22 km) marine reservesurrounding the Auckland Islands group in which allfishing is banned. Although this area contains 33% ofall satellite locations from this study, it does not pro-vide protection for the entire foraging area for any ofthe females tracked. If the current marine reserve were
244
Chilvers et al.: Foraging ecology of New Zealand sea lions
to be extended out to 50 km, 8 of the 26 (31%) females’foraging locations as observed within this study wouldbe entirely protected. However, it would require areserve extending to more than 100 km around theAuckland Islands to fully protect all of the foragingranges of these females from Enderby Island. An alter-native approach would be to restrict fishing operationsin the areas to the west and northwest of the AucklandIsland group. Given the observed foraging areas seenin this study, restriction of fishing effort in this areawould result in the most significant decrease in sea lionbycatch and reduce fishing operations less than if a100 km closed area were utilised as a conservationmeasure.
An interesting anomaly that the current research hasidentified is that approximately 28% of sea lionscaught in the squid fisheries in the last 4 yr werecaught southeast of the Auckland Island group, anarea in which Enderby Island breeding females do notappear to forage. This suggests that the animals beingcaught there are males, or females from other colonies,such as Dundas and Figure of Eight Islands. Depend-ing on where the animals from these colonies are for-aging, it may also indicate that the Enderby Islandfemales are being disproportionately impacted uponfrom fisheries, with 72% of bycatch coming from areaswhere they may forage exclusively.
CONCLUSIONS
Our study has concentrated on the distribution ofadult lactating females because of their importance tothe dynamics and recovery of the species. As observedin several other otariids, we found that NZ sea lions arelimited in their use of foraging locations during lacta-tion. The spatial and temporal restriction of having toreturn to the same location at the end of each foragingtrip to their dependant offspring and the apparentpreference for within-shelf and shelf edge foraginglocations restrict the distance and locations over whichthese animals can forage.
In combination with the diving data suggesting thatNZ sea lions in the Auckland Island area may be oper-ating at their physiological limits (Gales & Mattlin1997, Costa et al. 1998, Costa & Gales 2000), we haveshown that maximum female foraging trip distancesand areas for NZ sea lions are greater than thoserecorded for the other 4 extant sea lion species. Wetherefore conclude and concur with Gales & Mattlin’s(1997) suggestion that this area represents a marginalforaging environment in which diving and foragingbehaviours are close to the females’ and their pups’physiological limits. These conditions may have pre-vented population growth at this site.
Female locations at sea overlap with the operationalareas and depths of the trawling fleet (Gales & Mattlin1997, Uozumi 1998, Wilkinson et al. 2003, presentstudy). The reported broad-spectrum diet of NZ sealions (Childerhouse et al. 2001) may buffer or delay theeffects of an overlap with fisheries, with this currentlybeing seen in the form of a static population with nogrowth. However, it is predicted that changes in thedistribution and availability of preferred prey in rela-tion to colony location will affect foraging effort of cen-tral place foragers such as NZ sea lions (Boyd et al.1997, 1998). In particular, a sub-optimal foraging con-dition for a mother attempting to optimize the returntime to the pup will increase foraging costs, hinder pupprovisioning and affect species viability (Boyd et al.1997, 1998). The overlap in NZ sea lion foraging loca-tions and fisheries operations also indicates the poten-tial for ecological resource competition between thesquid fishing fleet and the sea lion population (Wilkin-son et al. 2003, present study). Results of such compe-tition may already be evident, with the mean weightsof 1 mo old pups born at Sandy Bay showing an overalldecline in the last 5 yr, particularly in males (I. S.Wilkinson pers. comm.). In addition, NZ sea lion milkfat content during early lactation is the lowest recordedfor an otariid and shows high yearly variability with anoverall trend of decline in the last 5 yr (F. Riet Saprizapers. comm.). It is possible that fishing activity forsquid in regions of the highest sea lion activity, north-west of Enderby Island, could impact food availabilityfor sea lions during lactation. The fishing season is con-centrated over only a short time period, February toMay, which coincides with the first 4 mo of a 9 mo lac-tation period, when the pups are growing most rapidlyand are totally dependent on maternal provisioning(B. L. Chilvers unpubl. data).
The consistent observations of individuals returningto the same region each trip regardless of other ani-mals’ movements suggest a short- or long-term learnedbehavioural preference by female NZ sea lions. Fur-ther research is needed to test whether this is consis-tent for individuals across seasons, which wouldstrengthen this assumption. In addition, a study on theforaging trip location patterns of lactating females fromDundas Island (8 km southeast of Enderby Island;Fig. 1), NZ sea lions’ largest breeding colony (ca. 1500breeding females), is warranted to increase our under-standing of where all lactating NZ sea lions from thenorthern Auckland Island colonies forage and allow acomparison of locations of foraging females betweenbreeding colonies. Determining whether this occurs isimportant for the management of the species, and themanagement of the sub-Antarctic squid fisheries. Ifdifferent colonies show different foraging locations,colonies would be able to be modelled separately,
245
Mar Ecol Prog Ser 304: 235–247, 2005
taking into account different prey availability andfishing pressure.
Overall, these results have important consequencesfor current management for the NZ sea lion popula-tion. First, the variation in the foraging ranges of fe-males indicates that only a large protected area wouldcover all or even the majority of the female NZ sea lionforaging range. However, there are areas where fish-ing restrictions could be extended such as the area tothe northwest of Enderby Island that could signifi-cantly decrease the sea lion bycatch numbers. Second,the known temporal and spatial overlaps in female for-aging locations and fishing operations indicate thehigh potential for ecological as well as operational re-source competition and may be a significant factor incontrolling the static sea lion numbers and viability.
Acknowledgements. This work was conducted under a per-mit from the New Zealand Department of Conservation(DOC), and was funded by DOC, Science and Research Unit(Investigation no. 1638), Canterbury University, and by theConservation Services Levy from the New Zealand SquidFishery Management Company. DOC Southland are thankedfor their logistical assistance. We also thank J. Amey, A.Castinel, S. Childerhouse, W. Hockley, F. Jonker, A. Maloney,P. McClelland, F. Riet Sapriza, M. Stratton and M. Wylie forassistance with captures in the field. Thanks also to B. Robert-son for help with the graphics. Approval for work wasobtained from DOC Animal Ethics Committee – ApprovalAEC86 (1 July 1999). B. Robertson, I. West and 2 anonymousreviewers all provided helpful, critical reviews of the manu-script. This research was conducted while B.L.C. held a Foun-dation for Research, Science and Technology Fellowship con-tract # UOCX0105. We thank the Research Data Managementsection of the Ministry of Fisheries, New Zealand, for thearrow squid fisheries operational locations data and sea lionbycatch data.
LITERATURE CITED
Arnould JPY, Hindell MA (2001) Dive, behaviour, foraginglocations, and maternal-attendance patterns of Australianfur seals (Arctocephalus pusillus doriferus). Can J Zool 79:35–48
Baird SJ (1996) Non fish species and fisheries interactionsworking groups report. May 1996. New Zealand FisheriesAssessment Working Group Report 96/1, Ministry of Fish-eries, Wellington
Bonadonna F, Lea MA, Guinet C (2000) Foraging routes ofAntarctic fur seals (Arctocephalus gazella) investigated bythe concurrent use of satellite tracking and time depthrecorders. Polar Biol 23:149–159
Boyd IL (1999) Foraging and provisioning in Antarctic furseals: inter-annual variability in time-energy budgets.Behav Ecol 10:198–208
Boyd IL, Arnould JPY, Barton T, Croxall JP (1994) Foragingbehaviour of Antarctic fur seals during periods of contrast-ing prey abundance. J Anim Ecol 63: 703–713
Boyd IL, McCafferty DJ, Walker TR (1997) Variation in forag-ing effort by lactating Antarctic fur seals: response to sim-ulated increased foraging costs. Behav Ecol Sociobiol 4:135–144
Boyd IL, McCafferty DJ, Reid K, Taylor R, Walker TR (1998)Dispersal of male and female Antarctic fur seals (Arcto-cephalus gazella). Can J Fish Aquat Sci 55:845–852
Boyd IL, Staniland IJ, Martin AR (2002) Distribution of forag-ing by female Antarctic fur seals. Mar Ecol Prog Ser 242:285–294
Campagna C, Werner R, Karesh W, Marin MR, Koontz F,Cook R, Koontz C (2001) Movements and location at sea ofSouth American sea lions (Otaria flavescens). J Zool(Lond) 257:205–220
Cawthorn MW, Crawley MC, Mattlin RH, Wilson GJ (1985)Research on pinnipeds in New Zealand. Wildlife ResearchLiaison Group Report No. 7, Wellington
Childerhouse S, Dix B, Gales NJ (2001) Diet of New Zealandsea lions (Phocarctos hookeri) at the Auckland Islands.Wildlife Res 28:291–298
Costa DP, Gales NJ (2000) Foraging energetic and divingbehaviour of lactating New Zealand sea lions, Phocarctoshookeri. J Exp Biol 203:3655–3665
Costa DP, Gales NJ, Crocker DE (1998) Blood volume anddiving ability of the New Zealand sea lions, Phocarctoshookeri. Physiol Zool 71:208–213
Costa DP, Gales NJ, Goebel ME (2001) Aerobic dive limit:How often does it occur in nature? Comp Biochem PhysiolSer A 129:771–783
Crocker DE, Gales NJ, Costa DP (2001) Swimming speed andforaging strategies of New Zealand sea lions (Phocarctoshookeri). J Zool (Lond) 254:267–277
Doonan IJ, Cawthorn MW (1984) Impacts of incidentalmortality on the Hookers sea lions. Internal Report No. 6,Fisheries Research Division, New Zealand Ministry ofFisheries, Wellington
Duignan PJ (1999) Gross pathology, histopathology, virology,serology and parasitology. In: Baker A (ed) Unusual mor-tality of the New Zealand sea lion, Phocarctos hookeri,Auckland Islands, January-February 1998: a report of aworkshop held 8-9 June 1998, Wellington, and a contin-gency plan for future events. Department of Conservation,Te Papa Atawhai, Wellington, p 29–33
Gales NJ (1995) New Zealand (Hooker’s) sea lion recoveryplan. Threatened species recovery plan series 17. Depart-ment of Conservation, Wellington
Gales NJ, Costa DP (1997) The Australian sea lion: a review ofan unusual life history. In: Hindell M, Kemper C (eds)Marine mammal research in the southern hemisphere. 1:Status, ecology and medicine. Surrey Beatty, ChippingNorton, p 78–87
Gales NJ, Fletcher DJ (1999) Abundance, distribution andstatus of the New Zealand sea lion, Phocarctos hookeri.Wildlife Res 26:35–52
Gales NJ, Mattlin RH (1997) Summer diving behaviour oflactating New Zealand sea lions, Phocarctos hookeri. CanJ Zool 75:1695–1706
Gales NJ, Mattlin RH (1998) Fast, safe, field-portable gasanesthesia for pinnipeds. Mar Mamm Sci 14:355–361
Georges JY, Bonadonna F, Guinet C (2000) Foraging habitatand diving activity of lactating sub-Antarctic fur seals inrelation to sea surface temperature at Amsterdam Island.Mar Ecol Prog Ser 196:291–304
Guinet C, Dubroca L, Lea MA, Goldsworthy S, Cherel Y,Duhamel G, Bonadonna F, Donnay JP (2001) Spatial distri-bution of foraging in female Antarctic fur seals Arcto-cephalus gazella in relation to oceanographic variables: ascale-dependent approach using geographic informationsystems. Mar Ecol Prog Ser 219:251–264
Harcourt RG, Schulman AM, Davis LS, Trillmich F (1995)Summer foraging by lactating female New Zealand fur
246

Chilvers et al.: Foraging ecology of New Zealand sea lions
seals (Arctocephalus forsteri) off Otago peninsular, NewZealand. Can J Zool 73:678–690
Harcourt RG, Bradshaw CJ, Dickson K, Davis L (2002) Forag-ing ecology of a generalist predator, the female NewZealand fur seal. Mar Ecol Prog Ser 227:11–24
Hitchmough RA (2002) New Zealand threat classification sys-tems list 2002. Department of Conservation. ThreatenedSpecies Occasional Publication 23, Wellington
Hooge PN, Eichenlaub WM, Solomon EK (2000) Using GIS toanalyse animals movements in the marine environment.Alaska Biological Science Centre. US Geological Survey,Gustavus, AK
Kirkman SP, Bester MN, Makhado AB, Pistorius PA (2003)Female attendance behaviour of Antarctic fur seals atMarion Island. Afr Zool 38:402–405
McCafferty DJ, Boyd IL, Walker TR, Taylor RI (1998) Foragingresponses of Antarctic fur seals to changes in the marineenvironment. Mar Ecol Prog Ser 166:285–299
Ponganis PJ, Ponganis EP, Ponganis KV, Kooyman GL, Gen-try RL, Trillmich F (1990) Swim velocities in otariids. CanJ Zool 68:2105–2112
Reijnders P, Brasseur S, van der Toorn J, van der Wolf P,Boyd I, Harwood J, Lavigne D, Lowry L (1993) Seals, furseals, sea lions and walrus, status survey and conser-vation plan. IUCN/SSC Seal Specialist Group. Interna-tional Union for Conservation of Nature and NaturalResources, Gland
Schulz TM, Bowen WD (2004) Pinniped lactation strategies:evaluation of data on maternal and offspring life historytraits. Mar Mamm Sci 20:86–114
Seaman DE, Powell RA (1996) An evaluation of the accuracy
of kernel density estimators for home range analysis.Ecology 77:2075–2085
Staniland IJ, Boyd IL (2003) Variation in the foraging locationof Antarctic fur seals (Arctocephalus gazella), the effectson diving behaviour. Mar Mamm Sci 19:331–343
Staniland IJ, Reid K, Boyd IL (2004) Comparing individualand spatial influences on foraging behaviour in Antarcticfur seals, Arctocephalus gazella. Mar Ecol Prog Ser 275:263–274
Sutherland WJ (1997) From individual behaviour to popula-tion ecology. Oxford University Press, Oxford
Taylor RH (1971) Influence of man on vegetation and wildlifeof Enderby and Rose Islands, Auckland Islands. NZ J Bot9:225–268
Thompson D, Duck CD, McConnell BJ, Garrett J (1998) For-aging behaviour and diet of lactating female southern sealions (Otaria flavescens) in the Falkland Islands. J Zool(Lond) 246:1975–1982
Uozumi Y (1998) Fishery biology of arrow squids, Nototo-darus gouldi, and N. sloanii, in New Zealand waters. BullNatl Res Inst Far Seas Fish 35:1–111
Wilkinson IS, Burgess J, Cawthorn MW (2003) New Zealandsea lions and squid — managing fisheries impacts on athreatened marine mammal. In: Gales N, Hindell M, Kirk-wood R (eds) Marine mammals: fisheries, tourism and man-agement issues. CSIRO Publishing, Melbourne, p 192–207
Woodley TH, Lavigne DM (1993) Potential effects of inciden-tal mortalities on the Hooker’s sea lions (Phocarctos hook-eri) population. Aquat Conserv 3:139–148
Worton BJ (1989) Kernel methods for estimating the utilizationdistribution in home-range studies. Ecology 70:164–168
247
Editorial responsibility: Otto Kinne (Editor-in-Chief),Oldendorf/Luhe, Germany
Submitted: December 3, 2004; Accepted: March 22, 2005Proofs received from author(s): November 23, 2005