Carbohydrate Nutrition for Lactating Dairy Cattle - Penn State ...
10
Carbohydrate Nutrition for Lactating Dairy Cattle Carbohydrates are essential for maintenance and milk production. Photo Credit Penn State Extension Introduction Carbohydrates (CHO) are the major source of energy for rumen microorganisms and the single largest component (60-70%) of a dairy cow's diet. They represent the major component of net energy for support of maintenance and milk production. Diet carbohydrate concentration influences the composition of milk as precursors for lactose, fat, and protein. There are two broad classifications of CHO: structural and nonstructural. The structural CHO consist of elements found in the plant cell wall. The nonstructural CHO are located inside the cells of plants and are usually more digestible than the structural CHO. Plant Carbohydrates Figure 1 illustrates the organic composition of plant CHO. The structural or cell wall material contains cellulose, hemicellulose, lignin, pectic substances and Beta-glucans. The cell contents contain starches, sugars, and fructans and for ensiled feeds, organic acids. The most common measures of fiber analysis are acid detergent fiber (ADF) and neutral detergent fiber (NDF). The structural components in the plant like cellulose, hemicellulose and lignin are measured by NDF. Acid detergent fiber measures lignin and cellulose. Figure 1. Structural and nonstructural carbohydrates of plants. Source: Mary Bell Hall, 2000.
-
Upload
khangminh22 -
Category
Documents
-
view
2 -
download
0
Transcript of Carbohydrate Nutrition for Lactating Dairy Cattle - Penn State ...
Carbohydrate Nutrition for Lactating DairyCattle
Carbohydrates are essential for maintenance and milk production.
Photo Credit Penn State Extension
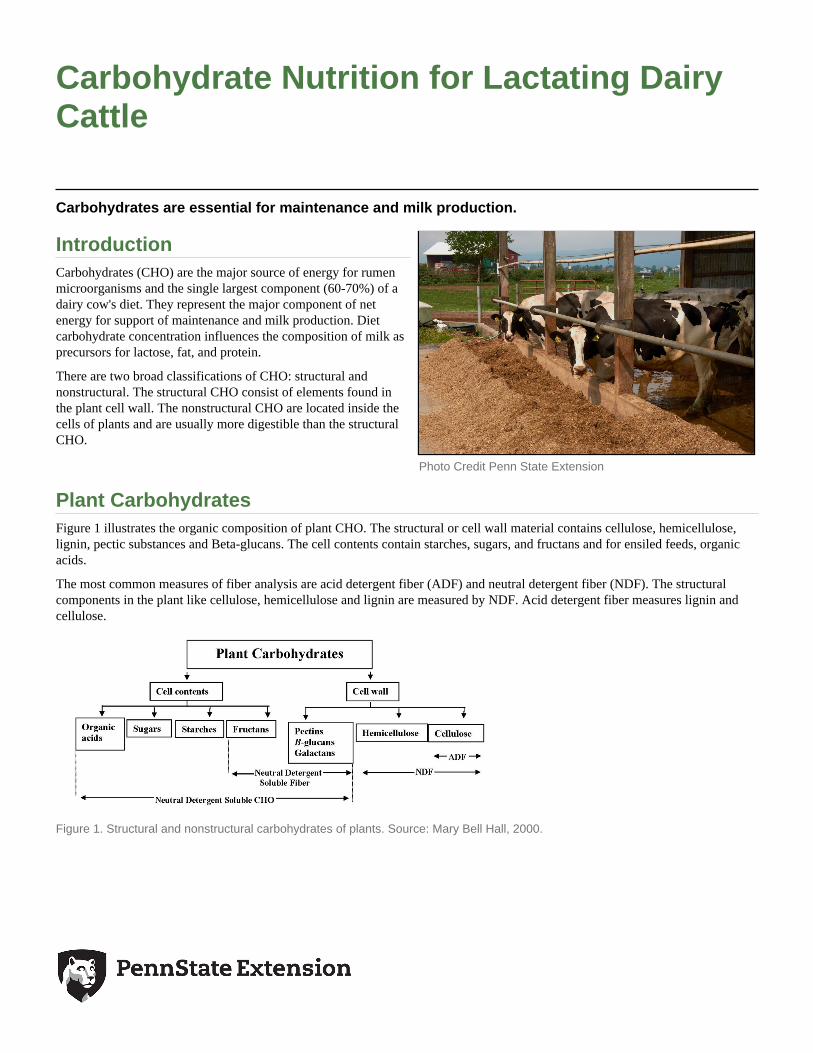
IntroductionCarbohydrates (CHO) are the major source of energy for rumenmicroorganisms and the single largest component (60-70%) of adairy cow's diet. They represent the major component of netenergy for support of maintenance and milk production. Dietcarbohydrate concentration influences the composition of milk asprecursors for lactose, fat, and protein.
There are two broad classifications of CHO: structural andnonstructural. The structural CHO consist of elements found inthe plant cell wall. The nonstructural CHO are located inside thecells of plants and are usually more digestible than the structuralCHO.
Plant CarbohydratesFigure 1 illustrates the organic composition of plant CHO. The structural or cell wall material contains cellulose, hemicellulose,lignin, pectic substances and Beta-glucans. The cell contents contain starches, sugars, and fructans and for ensiled feeds, organicacids.
The most common measures of fiber analysis are acid detergent fiber (ADF) and neutral detergent fiber (NDF). The structuralcomponents in the plant like cellulose, hemicellulose and lignin are measured by NDF. Acid detergent fiber measures lignin andcellulose.
Figure 1. Structural and nonstructural carbohydrates of plants. Source: Mary Bell Hall, 2000.
Page 2 Carbohydrate Nutrition for Lactating Dairy Cattle
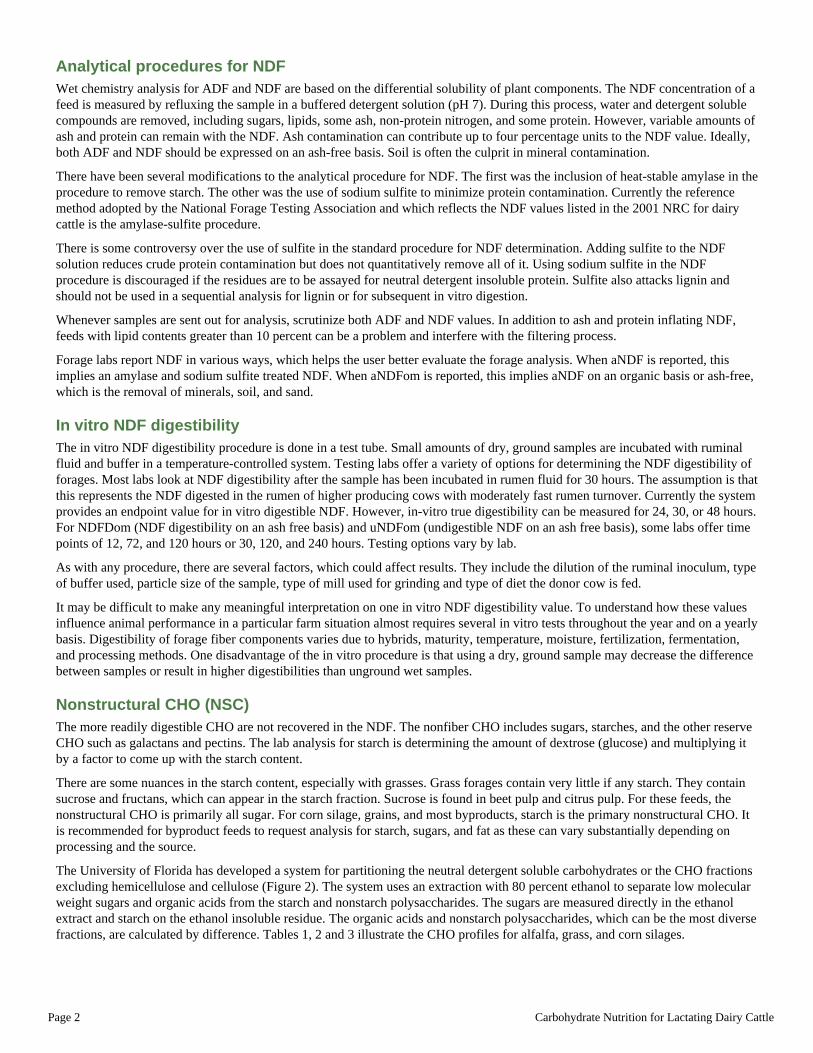
Analytical procedures for NDFWet chemistry analysis for ADF and NDF are based on the differential solubility of plant components. The NDF concentration of afeed is measured by refluxing the sample in a buffered detergent solution (pH 7). During this process, water and detergent solublecompounds are removed, including sugars, lipids, some ash, non-protein nitrogen, and some protein. However, variable amounts ofash and protein can remain with the NDF. Ash contamination can contribute up to four percentage units to the NDF value. Ideally,both ADF and NDF should be expressed on an ash-free basis. Soil is often the culprit in mineral contamination.
There have been several modifications to the analytical procedure for NDF. The first was the inclusion of heat-stable amylase in theprocedure to remove starch. The other was the use of sodium sulfite to minimize protein contamination. Currently the referencemethod adopted by the National Forage Testing Association and which reflects the NDF values listed in the 2001 NRC for dairycattle is the amylase-sulfite procedure.
There is some controversy over the use of sulfite in the standard procedure for NDF determination. Adding sulfite to the NDFsolution reduces crude protein contamination but does not quantitatively remove all of it. Using sodium sulfite in the NDFprocedure is discouraged if the residues are to be assayed for neutral detergent insoluble protein. Sulfite also attacks lignin andshould not be used in a sequential analysis for lignin or for subsequent in vitro digestion.
Whenever samples are sent out for analysis, scrutinize both ADF and NDF values. In addition to ash and protein inflating NDF,feeds with lipid contents greater than 10 percent can be a problem and interfere with the filtering process.
Forage labs report NDF in various ways, which helps the user better evaluate the forage analysis. When aNDF is reported, thisimplies an amylase and sodium sulfite treated NDF. When aNDFom is reported, this implies aNDF on an organic basis or ash-free,which is the removal of minerals, soil, and sand.
In vitro NDF digestibilityThe in vitro NDF digestibility procedure is done in a test tube. Small amounts of dry, ground samples are incubated with ruminalfluid and buffer in a temperature-controlled system. Testing labs offer a variety of options for determining the NDF digestibility offorages. Most labs look at NDF digestibility after the sample has been incubated in rumen fluid for 30 hours. The assumption is thatthis represents the NDF digested in the rumen of higher producing cows with moderately fast rumen turnover. Currently the systemprovides an endpoint value for in vitro digestible NDF. However, in-vitro true digestibility can be measured for 24, 30, or 48 hours.For NDFDom (NDF digestibility on an ash free basis) and uNDFom (undigestible NDF on an ash free basis), some labs offer timepoints of 12, 72, and 120 hours or 30, 120, and 240 hours. Testing options vary by lab.
As with any procedure, there are several factors, which could affect results. They include the dilution of the ruminal inoculum, typeof buffer used, particle size of the sample, type of mill used for grinding and type of diet the donor cow is fed.
It may be difficult to make any meaningful interpretation on one in vitro NDF digestibility value. To understand how these valuesinfluence animal performance in a particular farm situation almost requires several in vitro tests throughout the year and on a yearlybasis. Digestibility of forage fiber components varies due to hybrids, maturity, temperature, moisture, fertilization, fermentation,and processing methods. One disadvantage of the in vitro procedure is that using a dry, ground sample may decrease the differencebetween samples or result in higher digestibilities than unground wet samples.
Nonstructural CHO (NSC)The more readily digestible CHO are not recovered in the NDF. The nonfiber CHO includes sugars, starches, and the other reserveCHO such as galactans and pectins. The lab analysis for starch is determining the amount of dextrose (glucose) and multiplying itby a factor to come up with the starch content.
There are some nuances in the starch content, especially with grasses. Grass forages contain very little if any starch. They containsucrose and fructans, which can appear in the starch fraction. Sucrose is found in beet pulp and citrus pulp. For these feeds, thenonstructural CHO is primarily all sugar. For corn silage, grains, and most byproducts, starch is the primary nonstructural CHO. Itis recommended for byproduct feeds to request analysis for starch, sugars, and fat as these can vary substantially depending onprocessing and the source.
The University of Florida has developed a system for partitioning the neutral detergent soluble carbohydrates or the CHO fractionsexcluding hemicellulose and cellulose (Figure 2). The system uses an extraction with 80 percent ethanol to separate low molecularweight sugars and organic acids from the starch and nonstarch polysaccharides. The sugars are measured directly in the ethanolextract and starch on the ethanol insoluble residue. The organic acids and nonstarch polysaccharides, which can be the most diversefractions, are calculated by difference. Tables 1, 2 and 3 illustrate the CHO profiles for alfalfa, grass, and corn silages.

Page 3 Carbohydrate Nutrition for Lactating Dairy Cattle
Figure 2. Partitioning neutral detergent soluble carbohydrate with 80 percent ethanol, direct analysis, and calculated estimates.
NDF DigestibilityFiber digestibility is usually defined as the proportion of consumed fiber that is not excreted in the feces. Fiber contains anindigestible fraction and one or more potentially digestible fractions, each of which is degraded at its own rate. The extent of fiberdigestion depends on the size of the indigestible fraction and the competition between the rates of degradation and passage out ofthe rumen.
Ruminal fiber digestibility is affected by the passage rate of particulate matter out of the rumen. Rate of passage is affectedprimarily by intake. However, feed particle size, particle buoyancy, concentrations of dietary fiber and nonstructural CHO, and rateof digestion of the potentially digestible fiber fraction may affect passage rate.
There is a vast range in ruminal fiber digestibility between and among forage and non forage sources. Although fiber digestibilityof forages is not constant for all animals and feeding conditions, much of the variation is due to composition and structuraldifferences of the forage, harvest date, and height at harvest. The indigestible fraction of NDF is a major factor affecting theutilization of fiber CHO sources as it varies greatly and may exceed more than one half of the total NDF in the rumen.
As forages mature, the indigestible fraction of fiber increases and the rate of digestion of the potentially fermentable fractiondecreases. In addition, environmental factors such as light intensity, day length, temperature, and soil moisture affect therelationship between fiber digestibility and maturity.
Particle buoyancy in the rumen may be another factor affecting digestibility. Particles are buoyant when they are activelyfermenting. Carbon dioxide and methane gas produced during fermentation and associated with feed particles, make them float inthe rumen. Buoyant particles become suspended in the fiber mat. As the fermentable fiber fraction of feed particles decreases, lessgas is produced, and particles may become less buoyant and sink. Particles that have low concentrations of fermentable fiber thatferment quickly, such as alfalfa, might pass more quickly than particles that have more fermentable fiber, which ferment slowly,such as grasses.
Grasses generally have a lower indigestible NDF fraction than do legumes, which may give grass NDF higher digestibilities atlonger ruminal retention times. Longer ruminal retention times of grasses due to greater buoyancy over time will tend to increasethe digestibility of grass NDF, compared with legume NDF. Although grass NDF is generally more digestible than legume NDF, itmay also be more filling and reduce intake because of an increased ruminal retention time. When intake is limited by ruminal fill ofundigested feeds, legumes may allow higher intake than grasses as legume NDF ferments faster and probably sinks and passesfrom the rumen faster than grass NDF.
A practical feeding strategy can be applied from this information. Assuming a rumen retention time for NDF of 30 hours for earlylactation cows and 48 hours for late lactation cows, the potential digestible NDF fraction of alfalfa may be nearly completelydigested in the rumen of early lactation cows while that of grass is not. At shorter ruminal retention times, legumes may havegreater dry matter digestibility because of their lower NDF contents and similar NDF digestibility compared with grasses.
Grass forages may have greater NDF digestibility when fed to cows managed for longer ruminal retention times. Mid to latelactation cows, because of their longer ruminal retention times, can utilize grass forages which may ferment more slowly, but havea higher potential digestibility.
Dry matter intake in early lactation cows can be limited by physical fill. Offering fiber sources that digest and pass from the rumenmore quickly and decrease the ruminal fill appetite cessation effect may increase energy intake.
Corn silage is considered a grass, however, there is a narrower range of maturity when it is harvested and stored compared to grasshay-crop forage. This results in a tighter range in NDF digestibility and less variability. When corn silage is harvested at an overmature stage NDF digestibility will be lower. The greatest influence over fiber digestibility is the growing environment and climateduring the vegetative growth stage. Oba et. al (1999) observed that a one unit increase in NDF digestibility was associated with a0.37-pound increase in dry matter intake and a 0.55-pound increase in 4 percent fat corrected milk.

Page 4 Carbohydrate Nutrition for Lactating Dairy Cattle
A dairy cow needs rumen fiber to contribute to the fiber mat, but that fiber mat also needs to be digested to provide energy for milkproduction and allow the cow to consume more feed. The goal is to produce forages that are highly digestible. However, a rationthat is too digestible can create problems. If rate of passage through the rumen is too fast, then cows may not be meeting theirenergy requirement. If forages are low in digestible NDF then dry matter intake may be compromised and energy needs not met.Digestibility coupled with the physical form of the ration and feeding management practices can either be assets or liabilitiesdepending on the situation.
NSC DigestibilityStarch and sugar make up the NSC component. Soluble sugars ferment very quickly in the rumen. When sugars are containedwithin plant cell walls, they must be retained in the rumen a sufficient length of time to be extensively fermented.
Starch digestibility has the largest impact on the rumen and the dairy cow production. Starch comprises the majority of the NSC inmany feedstuffs. The rate and extent of starch digestibility and fermentation are influenced by several factors such as type of grainand processing method. Starch digestibility can be ranked from fastest to slowest as follows: oats> wheat> barley> corn> milo.Processing methods such as fine grinding, steam flaking, and ensiling can alter ruminal availability of starch. Most grain processingmethods increase both rate and extent of starch fermentation and ruminal digestibility. Decreasing the particle size of a starchsource, e.g., ground corn, increases both rate of digestion and rate of passage. These can have counteractive effects on ruminaldigestion.
Ensiling time for corn silage can influence starch digestibility. Starch digestibility can increase seven percent on average when cornis ensiled for 30 or 45 days with a continued gradual increase in digestibility as ensiling time increases past 45 days. Starchdigestibility can vary widely depending on the corn hybrid. It is recommended to test starch digestibility routinely and whenfeeding out from different storage structures.
An animal's physiological state and level of intake affect rate of passage. Fine grinding may have less effect on ruminal starchdigestibility at higher levels of intake, such as early to mid-lactation cows, compared to animals in late lactation. There are severalreasons why animal performance may vary due to NSC levels in dairy cattle diets. Rapidly digestible starch may affect ruminalfiber digestion, which can decrease the differences between diets relative to total CHO digestions. The level in which byproductsreplaces forage fiber in the diet can affect rumination and saliva production. Other factors include the starch digestion site and theprocessing method used to alter the rate and extent of starch digestion.
Formulating rations for NDF successfully means adjusting levels on a herd-to-herd basis and not using one constant value for allprograms. Some of the problems of extrapolating research data and applying it to real world experience are that research studiesvary in many factors, such as stage of lactation, fiber sources, and manner of data expression. It makes it difficult to determine atrue relationship between NDF, dry matter intake, and milk production to make any consistent recommendations.
Some other reasons for the variability in NDF requirement include:
• Digesta kinetics related to stage of lactation.
• Fiber source (e.g., nonforage fiber sources versus forage fiber sources).
• NDF chemical entity (not uniform).
• NDF variability with ruminal availability (NDF content and digestibility).
More research is needed to understand the carbohydrate requirements of the dairy cow. Rations improperly balanced or managedfor CHO can have profound effects on rumen health and animal performance. Not only is the chemical nature of the fiberimportant, but also the physical form of the fiber is just as critical.
Feeding management in respect to how a ration is implemented can substantially impact rumen function and animal performance.Improper particle length in the diet (e.g., sorting), inappropriate mixing procedures, inadequate housing facilities (e.g., cow comfortissues), management practices that decrease feeding time, and feeding inconsistent forage and grain quality are just a few problemsthat can affect CHO digestibility.
Formulating Rations for CarbohydratesNumerous factors influence the amount of forage NDF and total NDF that is formulated in rations. CHO nutrition requires morethan meeting a certain NDF or starch value. Other considerations include starch source, processing methods, particle size, physicaland effective fiber, buffer inclusion levels, and feeding management practices.
Page 5 Carbohydrate Nutrition for Lactating Dairy Cattle
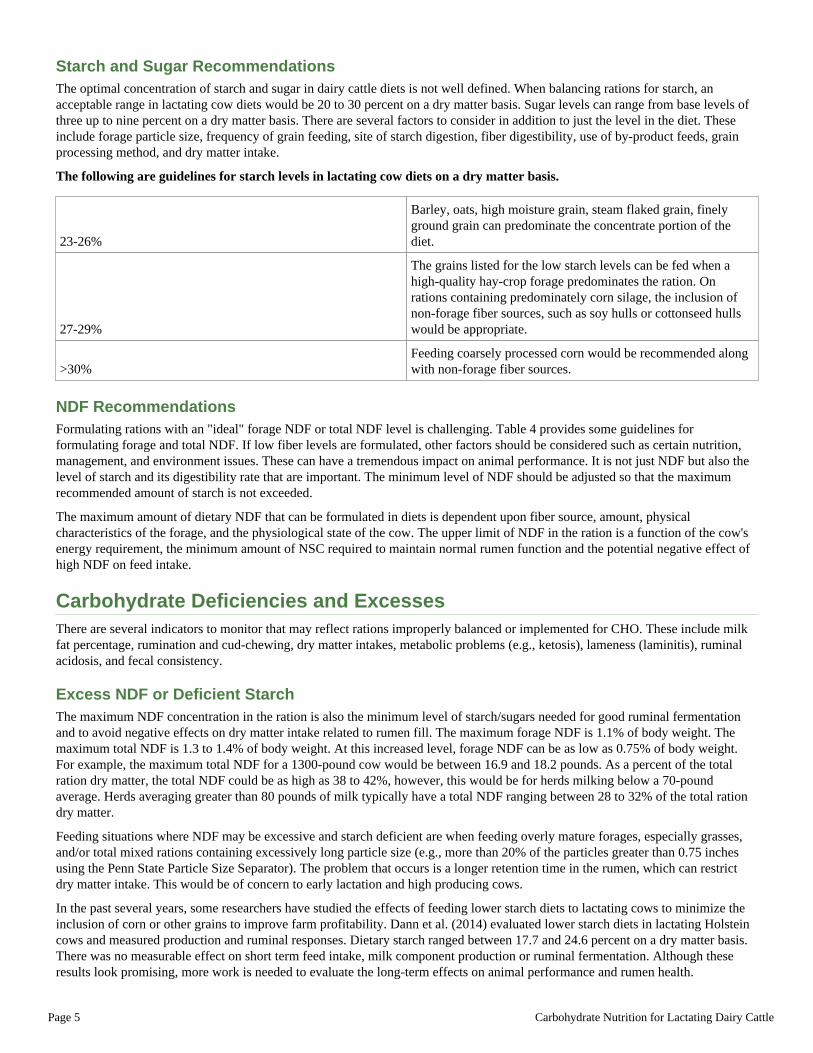
Starch and Sugar RecommendationsThe optimal concentration of starch and sugar in dairy cattle diets is not well defined. When balancing rations for starch, anacceptable range in lactating cow diets would be 20 to 30 percent on a dry matter basis. Sugar levels can range from base levels ofthree up to nine percent on a dry matter basis. There are several factors to consider in addition to just the level in the diet. Theseinclude forage particle size, frequency of grain feeding, site of starch digestion, fiber digestibility, use of by-product feeds, grainprocessing method, and dry matter intake.
The following are guidelines for starch levels in lactating cow diets on a dry matter basis.
23-26%
Barley, oats, high moisture grain, steam flaked grain, finelyground grain can predominate the concentrate portion of thediet.
27-29%
The grains listed for the low starch levels can be fed when ahigh-quality hay-crop forage predominates the ration. Onrations containing predominately corn silage, the inclusion ofnon-forage fiber sources, such as soy hulls or cottonseed hullswould be appropriate.
>30%Feeding coarsely processed corn would be recommended alongwith non-forage fiber sources.
NDF RecommendationsFormulating rations with an "ideal" forage NDF or total NDF level is challenging. Table 4 provides some guidelines forformulating forage and total NDF. If low fiber levels are formulated, other factors should be considered such as certain nutrition,management, and environment issues. These can have a tremendous impact on animal performance. It is not just NDF but also thelevel of starch and its digestibility rate that are important. The minimum level of NDF should be adjusted so that the maximumrecommended amount of starch is not exceeded.
The maximum amount of dietary NDF that can be formulated in diets is dependent upon fiber source, amount, physicalcharacteristics of the forage, and the physiological state of the cow. The upper limit of NDF in the ration is a function of the cow'senergy requirement, the minimum amount of NSC required to maintain normal rumen function and the potential negative effect ofhigh NDF on feed intake.
Carbohydrate Deficiencies and ExcessesThere are several indicators to monitor that may reflect rations improperly balanced or implemented for CHO. These include milkfat percentage, rumination and cud-chewing, dry matter intakes, metabolic problems (e.g., ketosis), lameness (laminitis), ruminalacidosis, and fecal consistency.
Excess NDF or Deficient StarchThe maximum NDF concentration in the ration is also the minimum level of starch/sugars needed for good ruminal fermentationand to avoid negative effects on dry matter intake related to rumen fill. The maximum forage NDF is 1.1% of body weight. Themaximum total NDF is 1.3 to 1.4% of body weight. At this increased level, forage NDF can be as low as 0.75% of body weight.For example, the maximum total NDF for a 1300-pound cow would be between 16.9 and 18.2 pounds. As a percent of the totalration dry matter, the total NDF could be as high as 38 to 42%, however, this would be for herds milking below a 70-poundaverage. Herds averaging greater than 80 pounds of milk typically have a total NDF ranging between 28 to 32% of the total rationdry matter.
Feeding situations where NDF may be excessive and starch deficient are when feeding overly mature forages, especially grasses,and/or total mixed rations containing excessively long particle size (e.g., more than 20% of the particles greater than 0.75 inchesusing the Penn State Particle Size Separator). The problem that occurs is a longer retention time in the rumen, which can restrictdry matter intake. This would be of concern to early lactation and high producing cows.
In the past several years, some researchers have studied the effects of feeding lower starch diets to lactating cows to minimize theinclusion of corn or other grains to improve farm profitability. Dann et al. (2014) evaluated lower starch diets in lactating Holsteincows and measured production and ruminal responses. Dietary starch ranged between 17.7 and 24.6 percent on a dry matter basis.There was no measurable effect on short term feed intake, milk component production or ruminal fermentation. Although theseresults look promising, more work is needed to evaluate the long-term effects on animal performance and rumen health.

Page 6 Carbohydrate Nutrition for Lactating Dairy Cattle
Feeding situations that can confound low starch diets are corn grain coarsely processed and/or the inclusion of a lot of high-fiberbyproduct feeds. These scenarios illustrate the importance of evaluating both the chemical and physical properties of the ration.
Deficient NDF and Excess StarchCow health is negatively affected by low NDF and high starch rations. A general term used to describe this scenario is ruminalacidosis. Indicators that respond quickly to this feeding scenario are ruminal pH, milk fat percent, and chewing activity. Long-termeffects include laminitis, ketosis, abomasal displacement, and liver abscesses.
Stauder et al. (2020) evaluated the effect of decreasing the forages in the diet on chewing activity, sorting, and rumen health. Cowswere started on a 60 percent forage and 40 percent concentrate total mixed ration for 2 weeks and then were switched to a 40percent forage and 60 percent concentrate ration for 4 weeks. Time spent eating and rumination decreased when cows wereswitched to the low forage ration. First lactation cows selected for more for longer particles compared to older cows. Even with thegreater rumination time and sorting for longer particles, first lactation animals had a greater subacute ruminal acidosis index (spenton average 4.6 hours/day longer below a pH of 5.8 compared to older cows). First lactation cows may be more susceptible toruminal acidosis than older cows fed the same diets and feeding management strategies geared specifically to those animals may bewarranted.
Milk fat percentage There is a strong positive relationship between the fat content of milk and ruminal pH. A sudden drop in milkfat percent may indicate low ruminal pH. High producing cows milking over 80 pounds and early lactation cows are sensitive torumen acidosis. However, their milk fat percent is less sensitive to changes in ruminal pH because they may be also mobilizingbody fat, especially during the early lactation period. Due to an energy deficit diet or other improper management practices (e.g.,overstocking pens) during early stages of lactation, body fat mobilization can lead to increases in milk fat. The milk fat to milkprotein ratio can be used as an indicator for energy deficiency, subclinical ketosis, and ruminal pH. Using the Dairy HerdImprovement Association 202 Summary Report (stage of lactation profile table), some metrics for determining if a herd problem isoccurring using the first 40 days in milk and all lactation groups include a milk fat test less than 3.4% or greater than 4.6% and a fatto protein ratio less than 1.35. Other nutritionally related reasons for low fat tests include the amount and type of fat being fed andcows freshening at a low body condition (body condition score less than 3 on a 5-point scale).
Chewing activity Rumen acidosis decreases the frequency of rumination so observing cows for chewing activity is often used as anindicator. The amount of time an animal spends ruminating can be affected by species, breed, physical and chemical characteristicsof the diet, health condition, feed intake, and production level. About a third of the variation in rumination time in dairy cattle hasbeen shown to be related to feed intake, more specifically intake of NDF and starch. The variation observed among healthy cowsand the poor relationship between chewing time and ruminal pH, limits the usefulness of this indicator. However, a noticeablereduction in the number of cows ruminating one to two hours after consuming a meal can be used jointly with other indicators thata rumen acidosis problem exists. When visually observing rumination on a dairy farm, 60 percent or more of the herd at any timeshould be ruminating (chewing cud) and is considered a healthy rumen function. This information can be used at the population orindividual level to monitor abrupt changes in animal rumination behavior related to their health or improper management practices.
Changes in dry matter intake Historical information on feed intakes is necessary to use this indicator effectively. Feed intake isfarm specific and it is influenced by numerous factors including environmental temperature and humidity, stocking density, bottomsurface of the feed bunks, cow comfort (e.g., improper stall size or inadequate bedding), feeding times, ration consistency, foragequality, TMR moisture, palatability of ration, particle size of the diet, milk production, cow physiological stage, cow nutritionalstatus, cow lactation number, and body weight. Therefore, to distinguish between explainable drops in feed intake and those relatedto rumen acidosis, routine and continuous monitoring of dry matter intake is important. Implementing good feeding managementpractices and keeping records can minimize drastic changes in dry matter intake.
Fecal consistency Manure consistency may increase in fluidity during periods of acidosis. This occurs when an increased amount ofreadily fermentable starch is consumed resulting in lactic acid passing to the lower digestive tract. Also, some starch may escapethe rumen and get fermented to volatile fatty acids in the large intestine. When either of these scenarios occurs, osmolarityincreases in the digestive tract causing an influx of water from the blood. However, there are other nutritional reasons why fecalconsistency may change. The degree of change in consistency needs to be evaluated and determined if it is severe enough to be aproblem. This metric should be used along with other indicators to determine if acidosis is a problem.
Laminitis Laminitis is an aseptic inflammation of the dermal layers inside the foot. There is usually inflammation, which causespain above the hoof and around the coronary band. A typical sign of an animal with laminitis is a slight lameness characterized bythe animal shifting weight while walking or standing. Cows standing on toes on the edge of their stall are very typical of a stance toalleviate pain.
Rumen acidosis has been shown to be a key factor leading to laminitis. As the rumen pH decreases below 5, acid production iselevated in the rumen. Endotoxins release due to the microbes killed by the low ruminal pH, which is absorbed and can triggerhistamine release. Histamine causes vasoconstriction at the hoof level, which in turn causes laminar destruction and hoofdeterioration.

Page 7 Carbohydrate Nutrition for Lactating Dairy Cattle
The main problem with using laminitis as an indicator of ruminal acidosis is the interval between the occurrence and the onset ofvisible signs (e.g., sole hemorrhaging, sole ulcers, or lesions) as it is related to the hoof growth rate, which is 0.20 inches permonth. The thickness of the normal sole is about 0.40 inches. Therefore, the visible insults to the hoof or claw might be observedabout two to three months after the internal insult occurred. In chronic and subclinical cases, observing hoof health and laminitis istypically a distant historical indicator of the nutrition program. It may have little relevance to the current feeding program or recentration changes.
SummaryCarbohydrate nutrition is complex and requires a balanced approach between the structural and non-structural components whenfeeding dairy cattle. Both the chemical analysis and the physical form of the carbohydrate must be considered in ration formulation.Every farm will require a different approach based on forage quality, cereal grains fed, and the various by-product feeds used tocomplement the diet. Feeding management practices can greatly affect how CHOs will be utilized by the cow. Herd dynamicsregarding days in milk, cow physiological stage, cow lactation must be considered when formulating the fiber and starch aspects ofthe ration. Imbalances of these diet critical components can result in negative impacts on animal performance and health that canhave both short-term and long-term implications. Occasional testing of the total mixed ration coupled with a particle sizeassessment is recommended to check that CHO levels are close to the formulated ration. Checking milk production, componentsand dry matter intake at time of sampling is beneficial to ensure CHO levels are in line with animal performance.
Table 1. Dairy One Forage Testing Lab, Composition Library for Accumulated Crop Years: 5/1/2004 - 4/30/2020 – Legume Silage
Item Samples Average Normal Range Normal RangeStandardDeviation
% Dry Matter 36,692 40.236 29.572 50.899 10.663
% Lignin 34,342 7.494 6.199 8.789 1.295
% Acid DetergentFiber 37,311 33.78 29.715 37.845 4.065
% NeutralDetergent Fiber 36,088 43.704 38.115 49.292 5.588
% WSC (Water Sol.Carbs.) 33,702 6.132 1.122 11.141 5.01
% ESC (SimpleSugars) 25,731 4.577 2.018 7.135 2.558
% Starch 34,118 1.984 0.788 3.18 1.196
NDFD 30hr, % ofNDF 9,501 51.503 45.368 57.638 6.135
NDFD 48hr, % ofNDF 4,808 53.554 48.143 58.965 5.411
aNDFom 1,496 40.395 34.834 45.955 5.56
% Lactic Acid 3,099 5.091 1.833 8.349 3.258
% Acetic Acid 3,099 2.803 0.799 4.806 2.003
% Propionic Acid 3,099 0.128 0 0.397 0.269
% Butyric Acid 3,099 0.387 0 1.728 1.341
% Total Acids 3,099 8.477 4.168 12.786 4.309
Note: WSC or water-soluble carbohydrates are simple sugars and fructans; ESC or ethanol simple carbohydrates are the simplesugars; NDFD or neutral detergent fiber digestibility; aNDFom is amylase and sodium sulfite treated NDF on an ash-free basis.
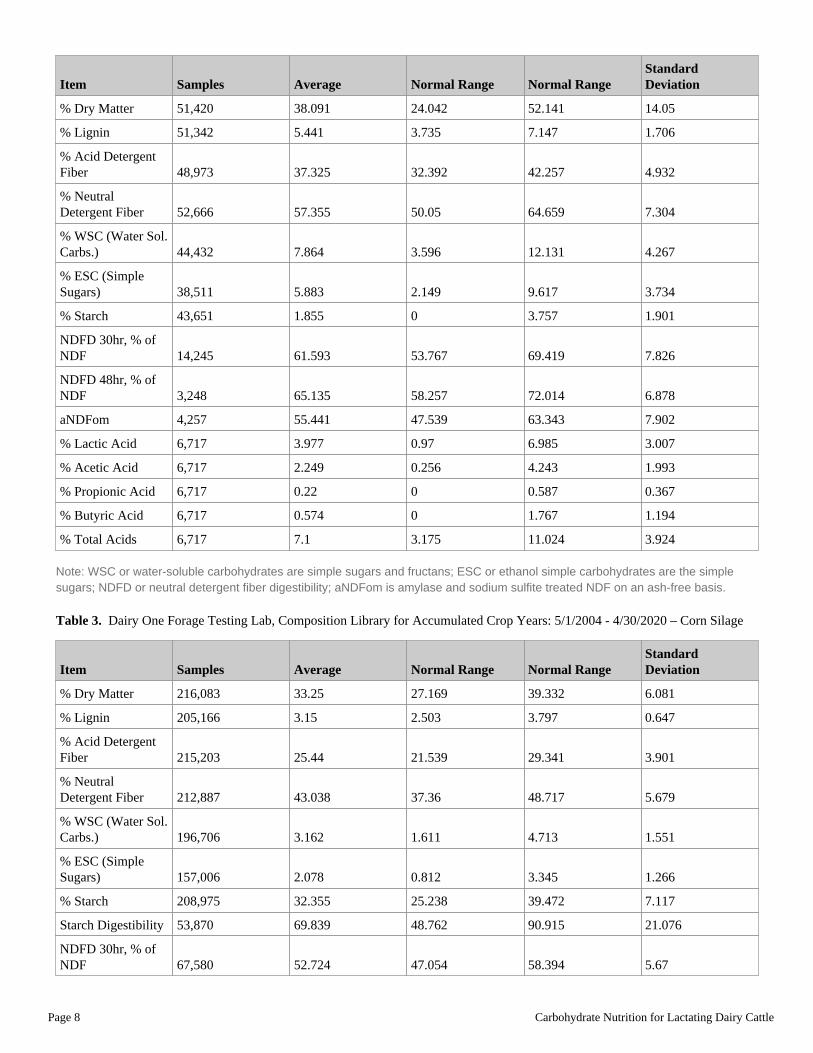
Table 2. Dairy One Forage Testing Lab, Composition Library for Accumulated Crop Years: 5/1/2004 - 4/30/2020 – Grass Silage
Page 8 Carbohydrate Nutrition for Lactating Dairy Cattle
Item Samples Average Normal Range Normal RangeStandardDeviation
% Dry Matter 51,420 38.091 24.042 52.141 14.05
% Lignin 51,342 5.441 3.735 7.147 1.706
% Acid DetergentFiber 48,973 37.325 32.392 42.257 4.932
% NeutralDetergent Fiber 52,666 57.355 50.05 64.659 7.304
% WSC (Water Sol.Carbs.) 44,432 7.864 3.596 12.131 4.267
% ESC (SimpleSugars) 38,511 5.883 2.149 9.617 3.734
% Starch 43,651 1.855 0 3.757 1.901
NDFD 30hr, % ofNDF 14,245 61.593 53.767 69.419 7.826
NDFD 48hr, % ofNDF 3,248 65.135 58.257 72.014 6.878
aNDFom 4,257 55.441 47.539 63.343 7.902
% Lactic Acid 6,717 3.977 0.97 6.985 3.007
% Acetic Acid 6,717 2.249 0.256 4.243 1.993
% Propionic Acid 6,717 0.22 0 0.587 0.367
% Butyric Acid 6,717 0.574 0 1.767 1.194
% Total Acids 6,717 7.1 3.175 11.024 3.924
Note: WSC or water-soluble carbohydrates are simple sugars and fructans; ESC or ethanol simple carbohydrates are the simplesugars; NDFD or neutral detergent fiber digestibility; aNDFom is amylase and sodium sulfite treated NDF on an ash-free basis.
Table 3. Dairy One Forage Testing Lab, Composition Library for Accumulated Crop Years: 5/1/2004 - 4/30/2020 – Corn Silage
Item Samples Average Normal Range Normal RangeStandardDeviation
% Dry Matter 216,083 33.25 27.169 39.332 6.081
% Lignin 205,166 3.15 2.503 3.797 0.647
% Acid DetergentFiber 215,203 25.44 21.539 29.341 3.901
% NeutralDetergent Fiber 212,887 43.038 37.36 48.717 5.679
% WSC (Water Sol.Carbs.) 196,706 3.162 1.611 4.713 1.551
% ESC (SimpleSugars) 157,006 2.078 0.812 3.345 1.266
% Starch 208,975 32.355 25.238 39.472 7.117
Starch Digestibility 53,870 69.839 48.762 90.915 21.076
NDFD 30hr, % ofNDF 67,580 52.724 47.054 58.394 5.67

Page 9 Carbohydrate Nutrition for Lactating Dairy Cattle
NDFD 48hr, % ofNDF 15,490 62.003 56.535 67.472 5.468
aNDFom 10,237 40.458 35.49 45.427 4.968
% Lactic Acid 15,540 4.829 2.72 6.939 2.109
% Acetic Acid 15,540 2.845 1.027 4.663 1.818
% Propionic Acid 15,540 0.26 0 0.667 0.406
% Butyric Acid 15,540 0.035 0 0.197 0.162
% Total Acids 15,540 8.013 5.024 11.003 2.99
Note: WSC or water-soluble carbohydrates are simple sugars and fructans; ESC or ethanol simple carbohydrates are the simplesugars; NDFD or neutral detergent fiber digestibility; aNDFom is amylase and sodium sulfite treated NDF on an ash-free basis.
Table 4. Guide for forage and total NDF intakes
Forage NDF as a percent of body weight Intake Level
0.75%*Minimum if ration provides 1.3 to 1.4% total NDF by use ofbyproduct feeds.
0.85%*Minimum if ration provides 1.1 to 1.2% total NDF by highinclusion levels of grains or starchy ingredients.
0.90% Moderately low
0.95% Average – Example: 1350 lbs. cow x.0095 = 12.83 lbs. FNDF
1.00% Moderately high
1.10% Maximum
*Higher minimum may be necessary if forage or ration is chopped very fine.
ReferencesDann, H. M., H.A. Tucker, K.W. Cotanch, P.D. Krawczel, C.S. Mooney, R.J. Grant, T. Eguchi, 2014. Evaluation of lower-starchdiets for lactating Holstein dairy cows. J. Dairy Sci. 97(11): 7151-7161.
Oba, M. and M.S. Allen. 1999. Evaluation of the importance of digestibility of neutral detergent fiber from forage: Effects on drymatter intake and milk yield of dairy cows. J. Dairy Sci., 82: 589-596.
Stauder, A, E. Humer, V. Neubauer, N. Reisinger, A. Kaltenegger, Q. Zebeli. 2020. Distinct responses in feed sorting, chewingbehavior, and ruminal acidosis risk between primiparous and multiparous Simmental cows fed diets differing in forage and starchlevels. J. Dairy Sci. 103(9): 8467-8481.
ReviewersAdrian Barragan, DVM, MS, PhD, Assistant Research Professor Extension Veterinarian Gabriella Varga, PhD, Penn StateUniversity Distinguished Professor Emeritus of Animal Science
AuthorsVirginia A. IshlerExtension Dairy [email protected]
Carly BeckerExtension Educator, [email protected]
Page 10 Carbohydrate Nutrition for Lactating Dairy Cattle
Penn State College of Agricultural Sciences research and extension programs are funded in part by Pennsylvania counties, the Commonwealth of Pennsylvania, andthe U.S. Department of Agriculture.
Where trade names appear, no discrimination is intended, and no endorsement by Penn State Extension is implied.
This publication is available in alternative media on request.
Penn State is an equal opportunity, affirmative action employer, and is committed to providing employment opportunities to all qualified applicants without regardto race, color, religion, age, sex, sexual orientation, gender identity, national origin, disability, or protected veteran status.
This article, including its text, graphics, and images ("Content"), is for educational purposes only; it is not intended to be a substitute for veterinary medical advice,diagnosis, or treatment. Always seek the advice of a licensed doctor of veterinary medicine or other licensed or certified veterinary medical professional with anyquestions you may have regarding a veterinary medical condition or symptom.
© The Pennsylvania State University 2022
Code: ART-2387