Optimum control of multilevel inverters using Artificial Neural Networks

International Journal of Advanced Biotechnology and Research ISSN 0976-2612, Online ISSN 2278–599X,
Vol5, Issue1, 2014, pp 43-53 http://www.bipublication.com
DEVELOPMENT OF ARTIFICIAL NEURAL NETWORK MODELING O F p-cresol BIODEGRADATION
Ravi Kant Singh* and Priya Ranjan Kumar
Department of Biotechnology, IMS Engineering College, Ghaziabad 201009, Uttar Pradesh, India * Corresponding Author: Email id: [email protected], Mobile No.: 09718515328
[Received-05/01/2014, Accepted-23/02/2014]
ABSTRACT
In this study, an effective microbial consortium for the biodegradation of p-cresol was grown under different operational conditions, and the effects glucose, K2HPO4, NH4NO3 and pH of solution on biodegradation of p-cresol has been investigated and an Artificial Neural Network (ANN) Model has been developed to predict degradation. Also the learning, recall and generalization characteristic of neural networks has been studied using p-cresol degradation system data. The network model was then compared with a Multiple Regression Analysis model (MRA) arrived from the same training data. Further, these two models were used to predict the percentage degradation of p-cresol for a blind test data. Though both the models perform equally well ANN is found to be better than MRA due to its slightly higher coefficient of correlation, lower RMS error value and lower average absolute error value during prediction. In both cases, the results corroborate the idea that the concentration of glucose, K2HPO4 & NH4NO3 are crucial to increasing the efficiency of p-cresol biodegradation. Keywords: Biodegradation; ANN-Modeling, p-Cresol, Microbial Consortium, MRA Model
1. INTRODUCTION
Many organic compounds enter into the environment through various industries. p-Cresol is very common constituent of the industrial effluents come from oil refineries, coking, petrochemicals, metallurgical, pharmaceutical, paint, varnish & textile industries [1]. It is also a naturally occurring metabolic product that is formed from tyrosine by bacteria under anaerobic conditions [2]. This organic pollutant discharges from various industries have
been reported by many researchers like Gonzalez-Munoz et al. [3], Gonzalez et al. [4], Kira et al. [5], Phutdhawong et al. [6], Kumara & Paruchuri [7], Babich and Davis [8]. Environment Protection Agency (EPA) of United States has classified p-cresol a pollutant of group C; a possible human carcinogens and listed as priority pollutant [9]. In addition to being highly toxic and potential carcinogen, p-cresol causes adverse effects on central nervous system, lungs, kidney,
DEVELOPMENT OF ARTIFICIAL NEURAL NETWORK MODELING OF p-cresol BIODEGRADATION
Ravi Kant Singh and Priya Ranjan Kumar 44
liver and cardiovascular system [10]. The WHO recommends the permissible p-cresol concentration of 0.3 mg/l in the water lakes & streams to protect human health from the possible harmful effects [11]. Due to the toxic properties, the removal of p-cresol by using microorganism is of great importance as it has efficiency to detoxify the toxic compounds completely at very low cost. Recently many microorganisms are being investigated for higher degradation of p-cresol [12-26]. Biodegradation of p-cresol is studied using specifically adapted microbial cultures under laboratory conditions. The acclimatization of the specific culture to degrade a single toxic organic compound in a laboratory may choose to degrade other more easily degradable substrates when faced with the mixture of compounds present in the waste water stream [27]. The objectives of the present work are to find out the effect of parameters like glucose, K2HPO4, NH4NO3 & pH of solution on the biodegradation process using microbial consortium. In the present study, an attempt has been made to apply an Artificial Neural Network (ANN) model to predict the biodegradation rate of p-cresol in synthetic wastewater by varying parameters like glucose, K2HPO4, NH4NO3 & pH of solution. The efficiency of ANN model was demonstrated by comparing with a Multiple Regression Analysis (MRA) model [28, 29]. The model is expected to predict the degradation studies with minimum error, thereby making the degradation of organic pollutants at small & large scale. 2. MATHEMATIC MODEL 2.1 Artificial neural networks A network is a collection of nodes and their connections. A node represents a computational unit which receives input and process to get an output. The connections between nodes determine the flow of information. They can be
unidirectional or bidirectional. The concept of artificial neural network is inspired from physiology of biological neurons. It basically has three main tasks: multiplication, addition, and activation. The inputs (signal) received are multiplied with their corresponding weights (strength of signal) and then computed by a mathematical function for the activation of neuron. Another function determines the output of the artificial neuron. The artificial neural network combines these artificial neurons for information processing. Figure 1 represents the information processing by a single neuron in ANN system. This process of adjusting the weights is called learning or training. ANN has been used to solve large number of problems in different field [30]. Most of them are layered feed-forward ANN, with back propagation learning algorithms [31]. A variety of applications of ANNs using back propagation learning algorithm have been reported in the literature [32-37]. 2.2 Backpropagation learning algorithms for layered feed-forward ANN In layered feed-forward ANNs the artificial neurons are organized in layers, which are input, hidden and output layer. The signals are sent in forward direction, and then the errors are propagated backwards. The input layer neurons receive inputs, and send the output to the output layer neuron. There may be one or more intermediate hidden layers of artificial neurons present in between input and output layer. The backpropagation algorithm uses supervised mode of learning, in which we provide the algorithm set of inputs and outputs which we want the network to compute, and then the error is calculated [38]. The minimization of the error between actual and expected output is the main technique used in the back propagation algorithm. The training begins with random weights, and the goal is to adjust them so that the error will be minimal [37].
DEVELOPMENT OF ARTIFICIAL NEURAL NETWORK MODELING OF p-cresol BIODEGRADATION
Ravi Kant Singh and Priya Ranjan Kumar 45
2.3. Training Initially data needed to be preprocessed before using for training the network using backpropagation algorithm. The preprocessing steps required:
1. Eliminating correlated input variables 2. Transformation 3. Scale and Biasing
Since the variable used in the p. cresol degradation experiments are independent of each other as well as the data range is also not too big or too small, hence first and second steps have not been used. Along with these, the data is also evenly distributed so the biasing was also not needed. The data have been scaled down between 0 and 1 by normalizing them by using normalization function as given below:
(1) Where, i is the input value, low is the minimum possible value and high is the maximum possible value. From the whole dataset 90% of data used for training the algorithm and rest were used for testing. Figure 2 represents the multi layer feed forward neural network system for the p. cresol degradation. Neurons are arranged in three layers which are input, hidden and output. In order to process the information in ANN system, first the weighted sums of input signal is taken and further the output is produced using a transfer function, usually a sigmoid function which is represented as:
(2) Where, A is the activation function which is represented as:
(3) Where, xi is the input signal of ith neuron and wji is the weight corresponding to the connection between ith and jth neurons [39]. The learning rule
used in backpropagation algorithm is the Generalized Delta Rule (GDR) which is a generalization of the steepest descent learning algorithm presented by Widrow [40]. The training process is needed to obtain a desired output when certain inputs are given. The error (difference between the actual and the desired output) depends on the weights; hence the adjustment of weights is needed for error minimization. An iterative gradient descent algorithm with the minimization of the mean square error E is used in the GDR which is represented as:
(4) Where M denotes the number of training patterns available in input layer and N is the number of units in the output layer. represents the
calculated desired output value of the ith neuron for given mth pattern, and is the actual output
of the same element. Now the weight can be adjusted using the method of gradient descendent:
(5)
Where denotes the weight of the connection
between the jth element of the upper layer and the i th element of the lower layer, in the mth learning
iteration. The weight change in Eq. (5) is
calculated as follows:
(6) Where η is the learning rate and α denote the
coefficient of the momentum. is the output
of the ith element in the previous layer. The momentum term prevents divergent oscillations.
is the error signal of the jth element in the

DEVELOPMENT OF ARTIFICIAL NEURAL NETWORK MODELING OF p-cresol BIODEGRADATION
Ravi Kant Singh and Priya Ranjan Kumar 46
mth learning iteration which is determined as follows: If j belongs to the output layer:
(7)
If j belongs to the hidden layer(s):
(8)
Where f’ is the derivative of the transfer function stated before. Hence, the Generalized Delta Rule (GDR) of back propagation algorithm calculate error for each element in the output and hidden layers and recursively updates the weights of all the artificial neurons in backward direction [33]. 2.4 Prediction phase The prediction of p. cresol degradation can be done using following set of equations:
(9) J=1, 2, 3, 4…
Where , , are the
normalized values of corresponding input signals. Zj is the weighted sum of all inputs to the hidden layer. Now the final signal of the hidden layer will be calculated by the transfer function discussed above.
(10)
Now the output of the hidden layer is passed on to the next output layer using following equations:
(11)
Where Zoutput is the weighted sum of the inputs from the hidden layer to the output neuron. Hence, the final output of the network for p. cresol degradation (Y) will be:
(12)
Now with the help of above equations the ANN model was trained using the training data set and further tested using test data [41]. 2.5 Multiple regression analysis To identify the relationship between the input variables and output of p. cresol degradation the multiple regression models was also developed and compared with the ANN model. The behavior of the system is approximated to the following multiple linear regression equation.
(13)
Where Y is the predicted p. cresol degradation percentage, β0 is constant, X1 is pH value, X2 is glucose concentration, X3 is K2HPO4
concentration and X4 is NH4NO3 concentration
used. β1, β2, β3, and β4 are linear coefficients of regression equation. The experiment was designed with low medium and high concentration of each of the four variables. The low, medium and high concentrations were represented as L, M and H respectively and shown in table 1. The actual design of experiment is given in table 2. Ordinary least square technique has been used to find out the estimate of the coefficients in the model equation. RMS error (%), average absolute (%) error, and correlation coefficient were calculated to study the performance of the model.
3. MATERIAL & METHODS 3.1 Chemicals All the chemicals including p-cresol used in the experimentation were of AR grade with more than 99% purity. These chemicals were purchased from HiMedia laboratories Pvt. Ltd., Mumbai. The stock solution of 1% p-cresol was prepared & stored in air tight brown glass bottle to avoid photo-oxidation. 3.2 Microorganism The microbial consortium degrading p-cresol was isolated from soil sample. This enrichment culture was maintained on the potato dextrose
DEVELOPMENT OF ARTIFICIAL NEURAL NETWORK MODELING OF p-cresol BIODEGRADATION
Ravi Kant Singh and Priya Ranjan Kumar 47
agar (PDA) media containing potatoes (200 g/l), dextrose (20 g/l) & agar (15 g/l). The medium was adjusted to pH = 7 by adding 1N NaOH. It was incubated at 280C for the growth of microorganism and stored at 6 ±10C. The mineral medium composition is as follows: The composition of first medium was K2HPO4 (1 g/l), FeSO4·7H2O (0.01 g/l), and the composition of second medium was NH4NO3 (3 g/l), MgSO4·7H2O (0.5 g/l), KCl (0.5 g/l), glucose (20 g/l). Both mediums were added at room temperature. 3.3 Design of experiments An experimental design as shown in table 2 was drawn up to study the effect of glucose, K2HPO4, NH4NO3 & pH of solution on biodegradation of p-cresol. The experimental studies were carried out in conical flasks containing mineral medium & inoculated with microbial consortium at 28 0C & 150 rpm in BOD incubator cum orbital shaker for 54 hrs and at same time, the biodegradation rate of p-cresol was estimated. 3.4 Estimation of p-cresol The concentration of p-cresol in culture medium was measured by the same UV/visible spectrophotometer at 277 nm wavelength. First of all, the calibration curve for p-cresol (1–10 mg/l) was drawn by plotting a curve between OD at 277 nm versus concentration of p-cresol, mg/l. The curve was found linear up to 10 mg/l with R2 = 0.99 [12, 17].
4. RESULT & DISCUSSION In the previous studies phenol, p-cresol and resorcinol have been degraded [12,17]. Biological treatment using microbial consortium has been identified as most effective strain for biodegradation of phenol and its derivatives. Fundamental studies on the kinetics of biodegradation of p-cresol under controlled conditions cannot be stressed enough. The mechanisms responsible for the successful
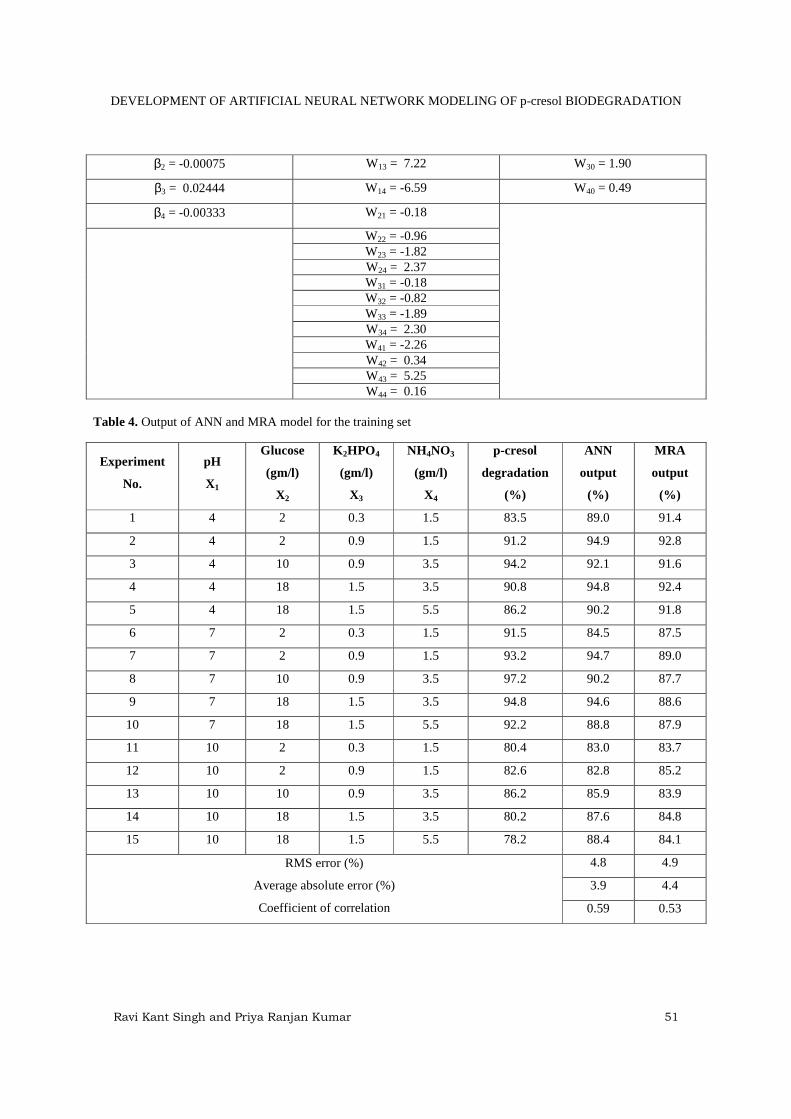
degradation of hazardous compounds are not understood completely and only a few degradation pathways have been unraveled. So there is a need for more studies at the bench scale examining the effects of multiple nutrients on biodegradation of p-cresol. The mathematical models which explain the effect of various nutrients on the biodegradation of p-cresol mainly rely on its correlation coefficient, RMS error (%) and average absolute error (%). The total numbers of experimental runs was 18 and are shown in Table 2. 15 experimental data were used to train the network and to fit the MRA model. The remaining 10% (3 data points) unused data was used to predict the % dye degradation. The error associated with this blind set is characteristic of the networks ability to generalize. The lower absolute average error shows that the network has a good ability to generalize. The coefficients associated with the MRA and weights associated with ANN model are shown in Table 3. All calculations were performed using PYTHIA and MS Excel. Table 4 and 5 suggest that both ANN and MRA perform equally well. Though the difference in the correlation coefficient is very low as shown in Figs. 3 and 4. ANN is better and is recommended due to its low RMS error (%) and average absolute error (4.8 %, 3.9%) than that of MRA (4.9%, 4.4%) while back testing with the data used for training. Also ANN shows further less absolute average error (3.4%) than that of MRA (6.5%), while testing with the blind set. Minimal medium with glucose, K2HPO4, NH4NO3 and pH of solution influenced degradation of p-cresol. The maximum degradation of p-cresol of 500 mg/l concentration was found to be 94.7 % in 54 hrs and the corresponding optimum level was Glucose: 2 g/l; K2HPO4: 0.9 g/l; NH4NO3: 1.5 g/l and at pH of solution 7.

DEVELOPMENT OF ARTIFICIAL NEURAL NETWORK MODELING OF p-cresol BIODEGRADATION
Ravi Kant Singh and Priya Ranjan Kumar 48
5. CONCLUSION Degradation of p-cresol by using microbial consortium with the addition of varying levels of Glucose, K2HPO4, NH4NO3 and pH of solution was modeled using ANN and MRA design experiment of the experimental data collected. An ANN model and MRA model has been developed to obviate the necessities of a laboratory experiment. A simple ANN model with 4 neurons in input and hidden layer and one neuron in output layer performed better than the MRA model owing to its lesser RMS error % and average absolute error % associated with the predicted values. This leads to the recommendation of the ANN model for further investigation of p-cresol degradation systems with larger number of independent input variable. The additional carbon, nitrogen and phosphorous source play a key role in determining the rate constant of biological degradation. 6. REFERENCE 1. Bandyopadhyay, K., Das, D., Maiti, B.R., 1997.
Some studies on phenol degradation kinetics using Pseudomonas putida MTCC 1194, Proceeding of IICHE Golden Jubliee Congress, IIT Delhi 16017, 231-238.
2. Ari, L.D’, Barker, H.A., 1985. p-Cresol formation by cell free extracts of Clostridium difficile, Arch. Microbiol. 143, 311–312.
3. Gonzalez-Munoz, M.J., Luque, S., Alvarez, J.R., Coca, J., 2003. Recovery of phenol from aqueous solutions using hollow fibre contactors, J. Membr. Sci. 213, 181–193.
4. Gonzalez, G., Herrere, M.T., Pena Garcia, M., 2001. Biodegradation of phenolic industrial waste water in a fluidized bed bioreactor with immobilized cells of Pseudomonas putida, Bioresour. Technol. 80, 137–142.
5. Kira, A.O., Hector, M.B., Campbell, W.R., 2000. Effect of temperature o the inhibition kinetics of phenol biodegradation by Pseudomonas putida Q5, Biotechnol. Bioeng. 70, 291–299.
6. Phutdhawong, W., Chowwanapoonpohn, S., Buddhasukh, D., 2000. Electrocoagulation and subsequent recovery of phenolic compound, Anal. Sci. 16, 1083–1084.
7. Kumaran, P., Paruchuri, Y.L., 1997. Kinetics of phenol biotransformation, Water Res. 31, 11–22.
8. Babich, H., Davis, D.L., 1981. Phenol a review of environmental and health risks, Regul. Toxicol. Pharm. 1, 90–109.
9. Fawell, J.K., Hunt, S., 1988. Environmental Toxicology Organic pollutants, Halsted Press, John Wiley and sons, New York, p. 398.
10. Buckman, N.G., Hill, J.O., Magee, R.J., Mc Cormick, M.J., 1984. Separation of substituted phenols, including eleven priority pollutants using high performance liquid chromatography, J. Chromatogr. A 284, 441–446.
11. International Standards for Drinking water, World Health Organization, Geneva, 1963.
12. Singh, R.K., Kumar, S., Kumar, S., Kumar, A., 2008. Biodegradation Kinetic Studies for the removal of p-cresol from Wastewater using Gliomastix indicus MTCC 3869, Biochem. Eng. J. 40 (2), 293-303.
13. Kumar, A., Kumar, S., Kumar, S., 2005. Biodegradation kinetics of phenol and catechol using Pseudomonas putida MTCC 1194, Biochem. Eng. J. 22, 151–159.
14. Kar, S., Swaminathan, T., Baradarajan, A., 1997. Biodegradation of phenol and cresol isomer mixtures by Arthrobacter, World J. Microbiol. Biotechnol. 13, 659–663.
15. Hutchinson, D.H., Robinson, C.W., 1988 Kinetics of simultaneous batch degradation of pcresol and phenol by Pseudomonas putida, Appl. Microbiol. Biotechnol. 29, 599–604.
16. Saravanan, P., Pakshirajan, K., Saha, P.K., 2008. Biodegradation of phenol and m-cresol in a batch and fed batch operated internal loop air lift bioreactor by indigenous mixed microbial culture predominantly Pseudomonas sp, Bioresour. Technol. 99, 8553–8558.
17. Arya, D. Kumar, S. Kumar, S., 2011. Biodegradation dynamics and cell maintenance for the treatment of resorcinol and p-cresol by

DEVELOPMENT OF ARTIFICIAL NEURAL NETWORK MODELING OF p-cresol BIODEGRADATION
Ravi Kant Singh and Priya Ranjan Kumar 49
filamentous fungus Gliomastix indicus, J. Hazard. Mater. 198, 49–56
18. Wang, G., Wen, J.P., Li, H., Qiu, C., 2009. Biodegradation of phenol and m-cresol by Candida albicans PDY-07 under anaerobic condition, J. Ind. Microbiol. Biotechnol. 36, 809–814.
19. Yan, J., Jianping, W., Jing, B., Daoquan,W., Zongding, H., 2006. Phenol biodegradation by the yeast Candida tropicalis in the presence of m-cresol, Biochem. Eng. J. 29, 227–234.
20. Alexieva, Z., Yemendzhiev, H., Zlateva, P., 2010. Cresols utilization by Trametes versicolor and substrate interactions in the mixture with phenol, Biodegradation 21, 625–635.
21. Alexieva, Z., Gerginova, M., Manasiev, J., Zlateva, P., Shivarova, N., Krastanov, A., 2008. Phenol and cresol mixture degradation by the yeast Trichosporon cutaneum, J. Ind. Microbiol. Biotechnol. 35, 1297–1301.
22. Yemendzhiev, H., Gerginova, M., Zlateva, P., Stoilova, I., Krastanov, A., Alexieva, Z., 2008. Phenol and cresol mixture degradation by Aspergillus awamori strain: biochemical and kinetic substrate interactions, Proceedings of ECO pole 2 (1), 153–159.
23. Kennes, C., Lema, J.M., 1994. Simultaneous biodegradation of p-cresol and phenol by the basidiomycete Phanerochaete chrysosporium, J. Ind. Microbiol. 13, 311–314.
24. Claussen, M., Schmidt, S., 1998. Biodegradation of phenol and p-cresol by the hyphomycete Scedosporium apiospermum, Res. Microbiol. 149, 399–406.
25. Yu, Y., Loh, K., 2002. Inhibition of p-cresol on aerobic biodegradation of carbazole and sodium salicylate by Pseudomonas putida,Water Res. 36, 1794–1802.
26. Goswami, M., Shivaraman, N., Singh, R.P., 2005. Microbial metabolism of 2- chlorophenol, phenol and p-cresol by Rhodococcus erythropolis M1 in co-culture with Pseudomonas fluorescens P1, Res. Microbiol. 160, 101–109.
27. Grtiaga, A.M., Ortiz, M.L., Salazar, E., Irabien, J.A., 1992. Supported liquid membranes for the separation concentration of phenol2, Mass
transfer evolution according to fundamental equations, Ind. Eng. Chem. Res. 31, 1745-1753.
28. Ravi, V., Reddy, P.J., Reddy, R.C., 1985. Multiple regression analysis applied to defluoridation, Indian J. Environ. Prot. 16, 528-532.
29. Hopfield, J.J., 1982. Neural networks and physical systems with emergent collective computational abilities, Proc. Natl. Acad. Sci. U.S.A. 79, 2554-2558.
30. Rumelhert, D.E., Mcclelland, J.C., 1986a. Parallel distributed processing: Explorations in the microstructure of cognition. Vol. I: Foundations. MIT Press, Cambridge, Mass.
31. Rumelhert, D.E., Hinton, G.E., Williams, R.J., 1986b. Learning internal representations by error propagation parallel distributed processing: Explorations in the microstructure of cognition, Vol. I: Foundations (D.E. Rumelhert and J.C. McClellord, Eds). MIT Press, Cambridge, Mass.
32. Prevost, P.H., Isambert, A., Depeyre, D., Donadille, C., Peribbe, R., 1994. Some practical insights into neural network implementation in the metallurgical industry. Computers. Chem. Engg. 18, 1157-1170
33. Venkatasubramanian, V., Vaidyanathan, R., Yamamoto, Y., 1990. Process fault detection and diagnosis using neural network- I. Steady State Processes. Computer Chem. Engg. 14, 666-712
34. Bhet, N.V., Peter, A., Mindermen, J.T., Nam, S.H., 1990. Modeling chemical process system via neutral computation. IEEEB Control System. 10, 24-30
35. Polland, J.F., Brouhsord, M.R., Garrison, D.B., San, K.Y., 1992. Process identification using neural networks. Computers. Chem. Engg. 16(4), 253-270
36. Yang, Y., Nikolaou, M., 1993. Dynamic process modeling with recurrent neural networks. AICHE J. 38(10), 1654-1667
37. Murty, S.S.N., Ravi, V., Reddy, P.J., Reddy, R.C., 1997. Artificial neural networks applied to defluoridation. Poll. Res. 16 (1), 177-182
38. Rumelhart, D. and McClelland J., 1986. Parallel Distributed Processing. MIT Press, Cambridge, Mass.
DEVELOPMENT OF ARTIFICIAL NEURAL NETWORK MODELING OF p-cresol BIODEGRADATION
Ravi Kant Singh and Priya Ranjan Kumar 50
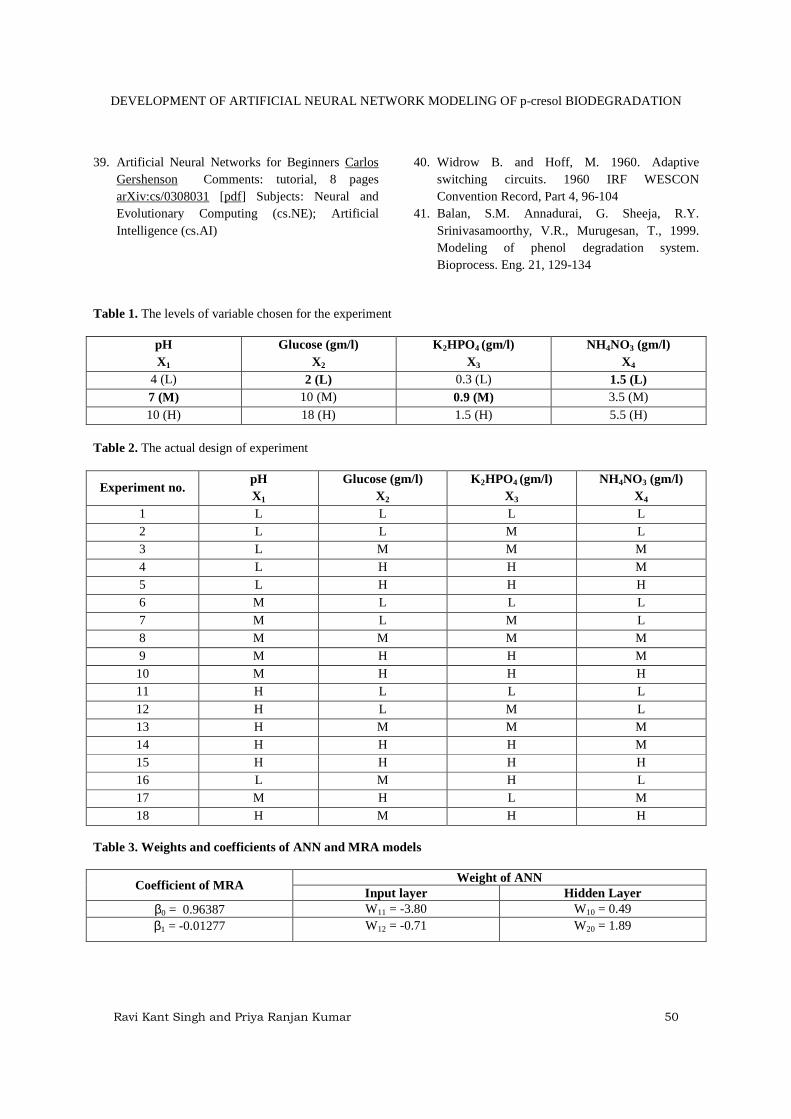
39. Artificial Neural Networks for Beginners Carlos Gershenson Comments: tutorial, 8 pages arXiv:cs/0308031 [pdf] Subjects: Neural and Evolutionary Computing (cs.NE); Artificial Intelligence (cs.AI)
40. Widrow B. and Hoff, M. 1960. Adaptive switching circuits. 1960 IRF WESCON Convention Record, Part 4, 96-104
41. Balan, S.M. Annadurai, G. Sheeja, R.Y. Srinivasamoorthy, V.R., Murugesan, T., 1999. Modeling of phenol degradation system. Bioprocess. Eng. 21, 129-134
Table 1. The levels of variable chosen for the experiment
pH X1
Glucose (gm/l) X2
K 2HPO4 (gm/l) X3
NH4NO3 (gm/l) X4
4 (L) 2 (L) 0.3 (L) 1.5 (L) 7 (M) 10 (M) 0.9 (M) 3.5 (M) 10 (H) 18 (H) 1.5 (H) 5.5 (H)
Table 2. The actual design of experiment
Experiment no. pH X1
Glucose (gm/l) X2
K 2HPO4 (gm/l) X3
NH4NO3 (gm/l) X4
1 L L L L 2 L L M L 3 L M M M 4 L H H M 5 L H H H 6 M L L L 7 M L M L 8 M M M M 9 M H H M 10 M H H H 11 H L L L 12 H L M L 13 H M M M 14 H H H M 15 H H H H 16 L M H L 17 M H L M 18 H M H H
Table 3. Weights and coefficients of ANN and MRA models
Coefficient of MRA Weight of ANN
Input layer Hidden Layer β0 = 0.96387 W11 = -3.80 W10 = 0.49 β1 = -0.01277 W12 = -0.71 W20 = 1.89
DEVELOPMENT OF ARTIFICIAL NEURAL NETWORK MODELING OF p-cresol BIODEGRADATION
Ravi Kant Singh and Priya Ranjan Kumar 51
β2 = -0.00075 W13 = 7.22 W30 = 1.90
β3 = 0.02444 W14 = -6.59 W40 = 0.49
β4 = -0.00333 W21 = -0.18
W22 = -0.96 W23 = -1.82 W24 = 2.37 W31 = -0.18 W32 = -0.82 W33 = -1.89 W34 = 2.30 W41 = -2.26 W42 = 0.34 W43 = 5.25 W44 = 0.16
Table 4. Output of ANN and MRA model for the training set
Experiment
No.
pH
X1
Glucose
(gm/l)
X2
K 2HPO4
(gm/l)
X3
NH4NO3
(gm/l)
X4
p-cresol
degradation
(%)
ANN
output
(%)
MRA
output
(%)
1 4 2 0.3 1.5 83.5 89.0 91.4
2 4 2 0.9 1.5 91.2 94.9 92.8
3 4 10 0.9 3.5 94.2 92.1 91.6
4 4 18 1.5 3.5 90.8 94.8 92.4
5 4 18 1.5 5.5 86.2 90.2 91.8
6 7 2 0.3 1.5 91.5 84.5 87.5
7 7 2 0.9 1.5 93.2 94.7 89.0
8 7 10 0.9 3.5 97.2 90.2 87.7
9 7 18 1.5 3.5 94.8 94.6 88.6
10 7 18 1.5 5.5 92.2 88.8 87.9
11 10 2 0.3 1.5 80.4 83.0 83.7
12 10 2 0.9 1.5 82.6 82.8 85.2
13 10 10 0.9 3.5 86.2 85.9 83.9
14 10 18 1.5 3.5 80.2 87.6 84.8
15 10 18 1.5 5.5 78.2 88.4 84.1
RMS error (%)
Average absolute error (%)
Coefficient of correlation
4.8 4.9
3.9 4.4
0.59 0.53

DEVELOPMENT OF ARTIFICIAL NEURAL NETWORK MODELING OF p-cresol BIODEGRADATION
Ravi Kant Singh and Priya Ranjan Kumar 52
Table 5. Output of ANN and MRA model for test data set
Experiment
No.
pH
X1
Glucose
(gm/l)
X2
K 2HPO4
(gm/l)
X3
NH4NO3
(gm/l)
X4
P. cresol
degradation
(%)
ANN
output
(%)
MRA
output
(%)
1 4 10 1.5 1.5 83.4 87.2 93.7
2 7 18 .3 3.5 82.9 80.8 85.6
3 10 10 1.5 5.5 78.3 73.9 84.7
Average Absolute Error % 3.4 6.5
Figure 1. An artificial neuron
Figure 2. Neural network of p. cresol degradation system
Figure 3: Graph between experimental and predicted degradation value of ANN model

DEVELOPMENT OF ARTIFICIAL NEURAL NETWORK MODELING OF p-cresol BIODEGRADATION
Ravi Kant Singh and Priya Ranjan Kumar 53
Figure 4: Graph between experimental and predicted degradation value of MRA model
Copyright © 2022 FDOKUMEN