
Prediction of GFP spectral properties using artificial neural network
Upload
khangminh22Category
view
1download
0
Pertanika J. Sci. & Technol. 27 (S1): 179 - 188 (2019)
ISSN: 0128-7680e-ISSN: 2231-8526
SCIENCE & TECHNOLOGYJournal homepage: http://www.pertanika.upm.edu.my/
Article history:Received: 24 October 2018Accepted: 15 February 2019Published: 21 June 2019
ARTICLE INFO
E-mail addresses:[email protected] (Nova Anika)[email protected] (Tasuku Kato)* Corresponding author
© Universiti Putra Malaysia Press
Modeling River Flow using Artificial Neural Networks: A Case Study on Sumani Watershed
Nova Anika1* and Tasuku Kato2
1Agricultural and Environmental Engineering, Tokyo University of Agriculture and Technology, Japan2International Environmental and Agricultural Science, Tokyo University of Agriculture and Technology, Japan
ABSTRACT
The Sumani River is an important water resource used for agriculture and domestic purposes. The river is also the main water supply for Lake Singkarak and used for a power plant. Proper water resource management is required for sustainable water availability for all water users. A hydrological model is a necessary tool to assess water management in the watershed. However, most models require several data sources not readily available in developing countries that describe the internal structure of the watershed. Artificial neural networks (ANN) are biologically inspired computer programs designed to simulate the way in which the human brain processes information and are capable of modeling a nonlinear system. River flow is an indicator of water availability in the watershed. It is greatly influenced by rain, so it has a pattern for its intensity. The objective of this study was to develop an artificial network model to predict river discharge in the Sumani River from rainfall and discharge patterns. Multiple Layer Perceptron with the backpropagation algorithm was applied to predict river flow. Data on rainfall and
discharge from the preceding day from 2008 to 2012 were used to train the model, and data from 2013 to 2014 were used to test the model. The Sumani River ANN scheme can be used to predict river flow with correlation coefficients of 0.95 and 0.92 in the training and testing stages.
Keywords: Artificial neural networks, Indonesia,
river flow
Nova Anika and Tasuku Kato
180 Pertanika J. Sci. & Technol. 27 (S1): 179 - 188 (2019)
INTRODUCTION
By the year 2050, the world population is projected to grow to nine billion people, with six billion of these people living in developing countries (Roson & van der Mensbrugghe, 2010). This condition leads to an increased demand for food and water, with supply needing to increase around 60% (FAO, 2014). In addition, population growth decreases the available land, water, and labor resources, which threatens sustainability of rice production (Molden, 2007). The agricultural sector already draws around 70% of freshwater (Bates et al., 2008), but this will increase another 10% by 2050 (Dubois, 2011). This condition will threaten rice production, especially in the developing countries, such as Indonesia, which is the third largest producer of rice worldwide and one of the world’s largest rice consumers (GRiSP, 2013).
Proper water resources management strategies are required for sustainable water availability. It is a prerequisite to have a clear understanding of the watershed hydrological processes, manageable water flows, interactions with land use, and opportunities to mitigate the negative effects and increased benefits of water depletion on society (Karimi et al., 2013). Such an assessment on water resources is required to address future concerns. Therefore, watershed models have important roles as tools to evaluate sustainable water resources.
Hydrological models are necessary to address water resource management in the watershed. They have been applied mainly to estimate water availability and to estimate the water regime of the watershed in a fast, economical, and safe (Pereira et al., 2016). However, most of hydrological model required several data that described the watershed condition where the limited data tend to be found in the developing country that affect the performance of model.
Artificial neural networks (ANN) are biologically inspired computer programs designed to simulate the way in which the human brain processes information (Agatonovic-Kustrin & Beresford, 2000). They are used increasingly in the analysis of hydrology and water resources, because ANN models do not require the internal structure of a watershed. ANNs are trained through experience with appropriate learning exemplars and gather their knowledge by detecting the patterns and relationships in data (Agatonovic-Kustrin & Beresford, 2000). The advantage of neural networks is their capability to model a nonlinear system (Aichouri et al., 2015).
River discharge, classified as blue water, is used typically as an indicator to analyze water availability in the watershed. It is influenced greatly by rain, which influences its intensity. Hence, the primary objective of this study is to develop an artificial network model to analyze hydrological conditions by predicting river discharge using rainfall and river discharge patterns.
Modeling River Flow Using Artificial Neural Networks
181Pertanika J. Sci. & Technol. 27 (S1): 179 - 188 (2019)
MATERIALS AND METHODS
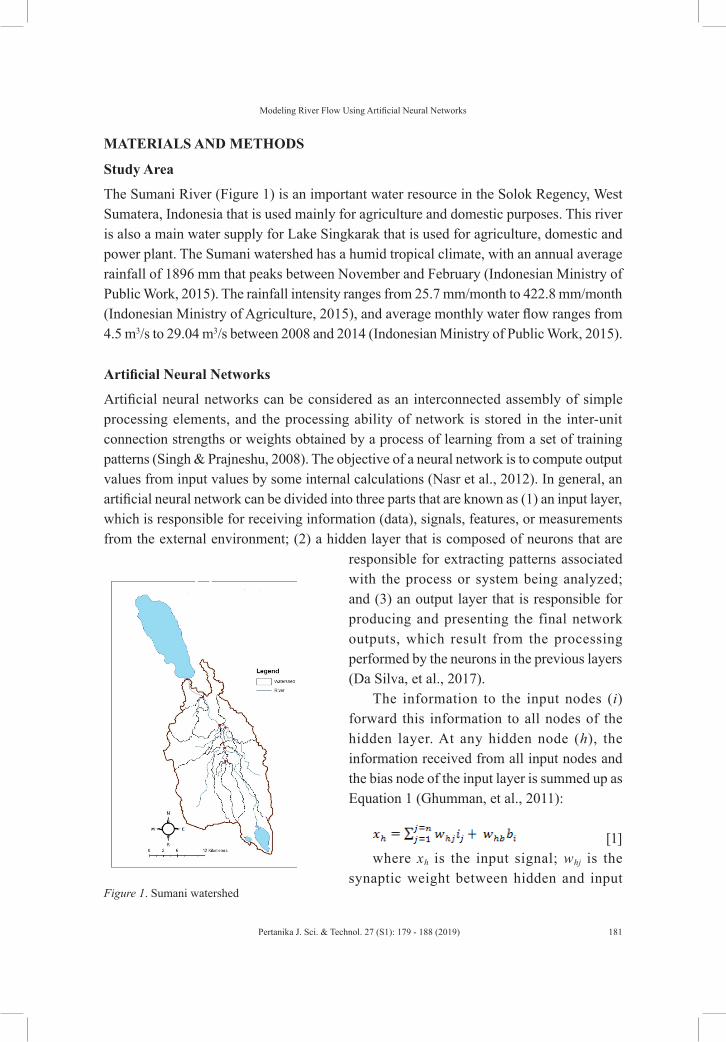
Study Area
The Sumani River (Figure 1) is an important water resource in the Solok Regency, West Sumatera, Indonesia that is used mainly for agriculture and domestic purposes. This river is also a main water supply for Lake Singkarak that is used for agriculture, domestic and power plant. The Sumani watershed has a humid tropical climate, with an annual average rainfall of 1896 mm that peaks between November and February (Indonesian Ministry of Public Work, 2015). The rainfall intensity ranges from 25.7 mm/month to 422.8 mm/month (Indonesian Ministry of Agriculture, 2015), and average monthly water flow ranges from 4.5 m3/s to 29.04 m3/s between 2008 and 2014 (Indonesian Ministry of Public Work, 2015).
Artificial Neural Networks
Artificial neural networks can be considered as an interconnected assembly of simple processing elements, and the processing ability of network is stored in the inter-unit connection strengths or weights obtained by a process of learning from a set of training patterns (Singh & Prajneshu, 2008). The objective of a neural network is to compute output values from input values by some internal calculations (Nasr et al., 2012). In general, an artificial neural network can be divided into three parts that are known as (1) an input layer, which is responsible for receiving information (data), signals, features, or measurements from the external environment; (2) a hidden layer that is composed of neurons that are
Figure 1. Sumani watershed
responsible for extracting patterns associated with the process or system being analyzed; and (3) an output layer that is responsible for producing and presenting the final network outputs, which result from the processing performed by the neurons in the previous layers (Da Silva, et al., 2017).
The information to the input nodes (i) forward this information to all nodes of the hidden layer. At any hidden node (h), the information received from all input nodes and the bias node of the input layer is summed up as Equation 1 (Ghumman, et al., 2011):
[1] where xh is the input signal; whj is the
synaptic weight between hidden and input
Nova Anika and Tasuku Kato
182 Pertanika J. Sci. & Technol. 27 (S1): 179 - 188 (2019)
layers; whb is the synaptic weight between the hidden and bias node of the input layer; ‘i’ is the input node and ‘bi’ is the bias node of the input layer.
The input signal is passed through a nonlinear activation function to produce the output signal of the node. The logistic sigmoid function is used for the networks, as it is continuously differentiable, monotonic, symmetric, and bounded between 0 and 1 (Equation 2) (Aichouri et al., 2015; Lee & Kang, 2016):
[2]
where f (xh) is transfer function and xh is the input signal.
Artificial Neural Networks (ANN) Schemes of the Study Area
In this study, the Multiple Layer Perceptron (MLP) algorithm was applied to predict river discharge. The input data is the preceding day’s rainfall (Pt-n) and discharge (Qt-n) data, including the rainfall data for the expected day (Pt). The output data was the discharge data for the expected day (Qt). Rainfall and discharge data from 2008 to 2012 were used to train the model, while the data from 2013 to 2014 was used for model testing. The ANN model was developed using the Stuttgart Neural Network Simulator (SNNS) written in the R programming code.
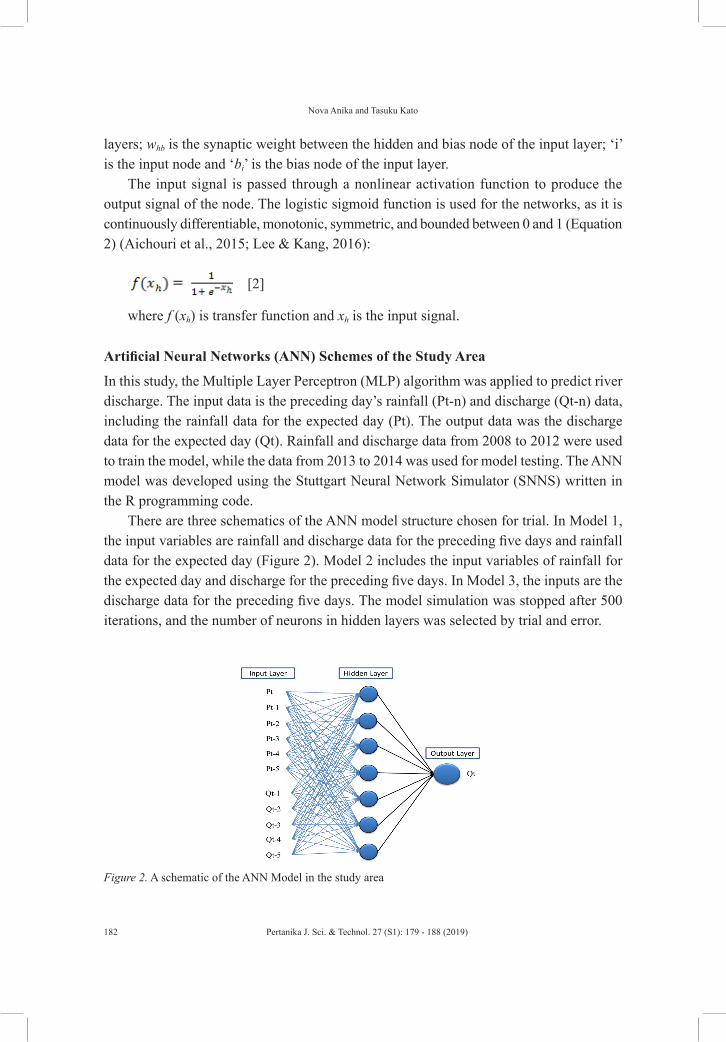
There are three schematics of the ANN model structure chosen for trial. In Model 1, the input variables are rainfall and discharge data for the preceding five days and rainfall data for the expected day (Figure 2). Model 2 includes the input variables of rainfall for the expected day and discharge for the preceding five days. In Model 3, the inputs are the discharge data for the preceding five days. The model simulation was stopped after 500 iterations, and the number of neurons in hidden layers was selected by trial and error.
Figure 2. A schematic of the ANN Model in the study area
Modeling River Flow Using Artificial Neural Networks
183Pertanika J. Sci. & Technol. 27 (S1): 179 - 188 (2019)
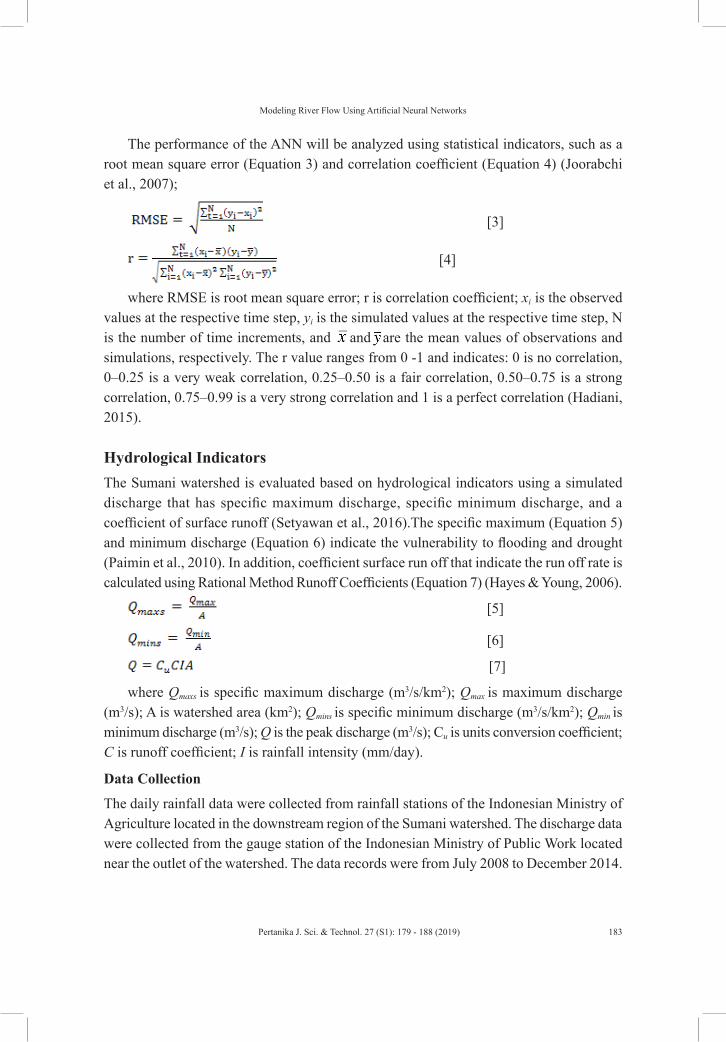
The performance of the ANN will be analyzed using statistical indicators, such as a root mean square error (Equation 3) and correlation coefficient (Equation 4) (Joorabchi et al., 2007);
[3]
[4]
where RMSE is root mean square error; r is correlation coefficient; xi is the observed values at the respective time step, yi is the simulated values at the respective time step, N is the number of time increments, and and are the mean values of observations and simulations, respectively. The r value ranges from 0 -1 and indicates: 0 is no correlation, 0–0.25 is a very weak correlation, 0.25–0.50 is a fair correlation, 0.50–0.75 is a strong correlation, 0.75–0.99 is a very strong correlation and 1 is a perfect correlation (Hadiani, 2015).
Hydrological IndicatorsThe Sumani watershed is evaluated based on hydrological indicators using a simulated discharge that has specific maximum discharge, specific minimum discharge, and a coefficient of surface runoff (Setyawan et al., 2016).The specific maximum (Equation 5) and minimum discharge (Equation 6) indicate the vulnerability to flooding and drought (Paimin et al., 2010). In addition, coefficient surface run off that indicate the run off rate is calculated using Rational Method Runoff Coefficients (Equation 7) (Hayes & Young, 2006).
[5]
[6]
[7]
where Qmaxs is specific maximum discharge (m3/s/km2); Qmax is maximum discharge (m3/s); A is watershed area (km2); Qmins is specific minimum discharge (m3/s/km2); Qmin is minimum discharge (m3/s); Q is the peak discharge (m3/s); Cu is units conversion coefficient; C is runoff coefficient; I is rainfall intensity (mm/day).
Data Collection
The daily rainfall data were collected from rainfall stations of the Indonesian Ministry of Agriculture located in the downstream region of the Sumani watershed. The discharge data were collected from the gauge station of the Indonesian Ministry of Public Work located near the outlet of the watershed. The data records were from July 2008 to December 2014.
Nova Anika and Tasuku Kato
184 Pertanika J. Sci. & Technol. 27 (S1): 179 - 188 (2019)
RESULTS AND DISCUSSION
Model Performance
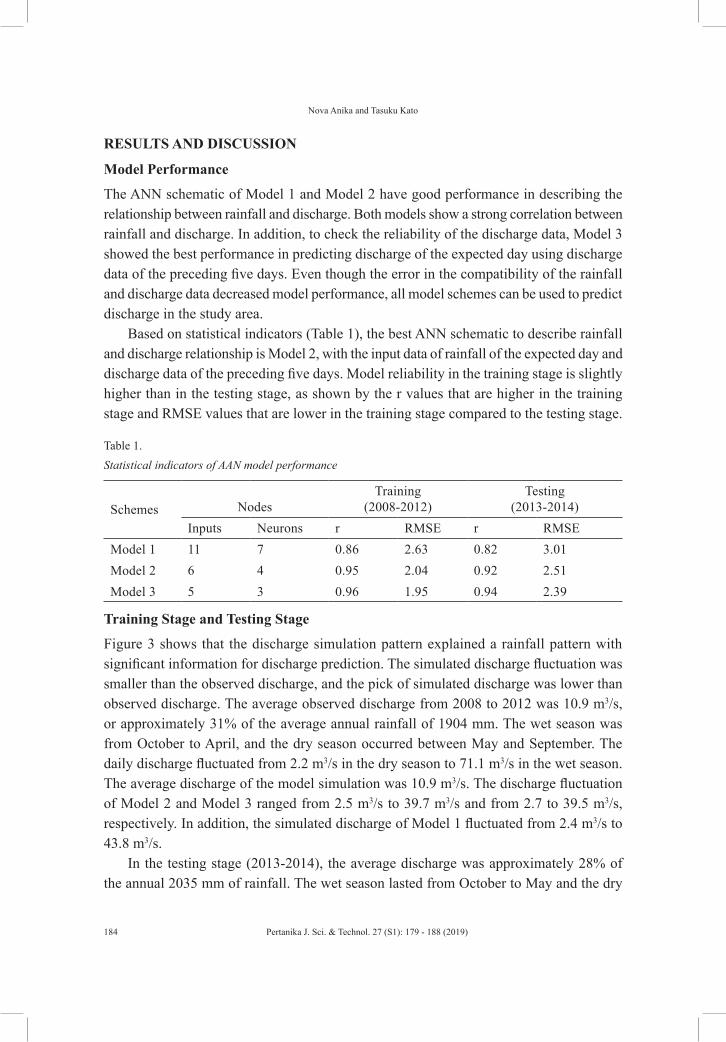
The ANN schematic of Model 1 and Model 2 have good performance in describing the relationship between rainfall and discharge. Both models show a strong correlation between rainfall and discharge. In addition, to check the reliability of the discharge data, Model 3 showed the best performance in predicting discharge of the expected day using discharge data of the preceding five days. Even though the error in the compatibility of the rainfall and discharge data decreased model performance, all model schemes can be used to predict discharge in the study area.
Based on statistical indicators (Table 1), the best ANN schematic to describe rainfall and discharge relationship is Model 2, with the input data of rainfall of the expected day and discharge data of the preceding five days. Model reliability in the training stage is slightly higher than in the testing stage, as shown by the r values that are higher in the training stage and RMSE values that are lower in the training stage compared to the testing stage.
Table 1. Statistical indicators of AAN model performance
Schemes NodesTraining
(2008-2012)Testing
(2013-2014)Inputs Neurons r RMSE r RMSE
Model 1 11 7 0.86 2.63 0.82 3.01Model 2 6 4 0.95 2.04 0.92 2.51Model 3 5 3 0.96 1.95 0.94 2.39
Training Stage and Testing Stage
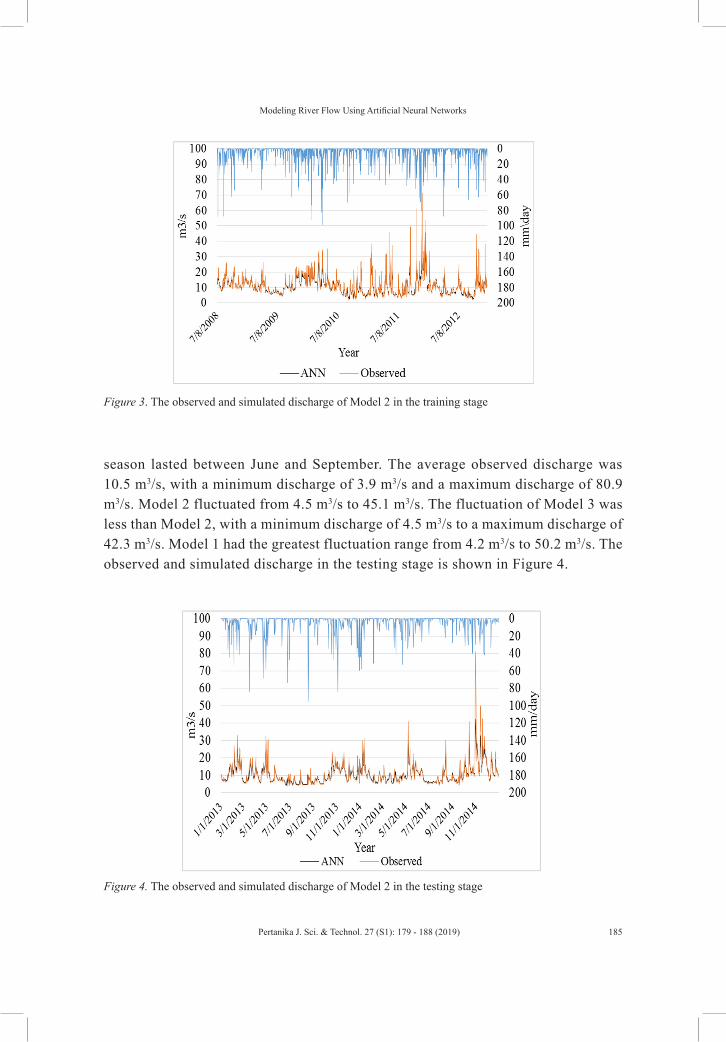
Figure 3 shows that the discharge simulation pattern explained a rainfall pattern with significant information for discharge prediction. The simulated discharge fluctuation was smaller than the observed discharge, and the pick of simulated discharge was lower than observed discharge. The average observed discharge from 2008 to 2012 was 10.9 m3/s, or approximately 31% of the average annual rainfall of 1904 mm. The wet season was from October to April, and the dry season occurred between May and September. The daily discharge fluctuated from 2.2 m3/s in the dry season to 71.1 m3/s in the wet season. The average discharge of the model simulation was 10.9 m3/s. The discharge fluctuation of Model 2 and Model 3 ranged from 2.5 m3/s to 39.7 m3/s and from 2.7 to 39.5 m3/s, respectively. In addition, the simulated discharge of Model 1 fluctuated from 2.4 m3/s to 43.8 m3/s.
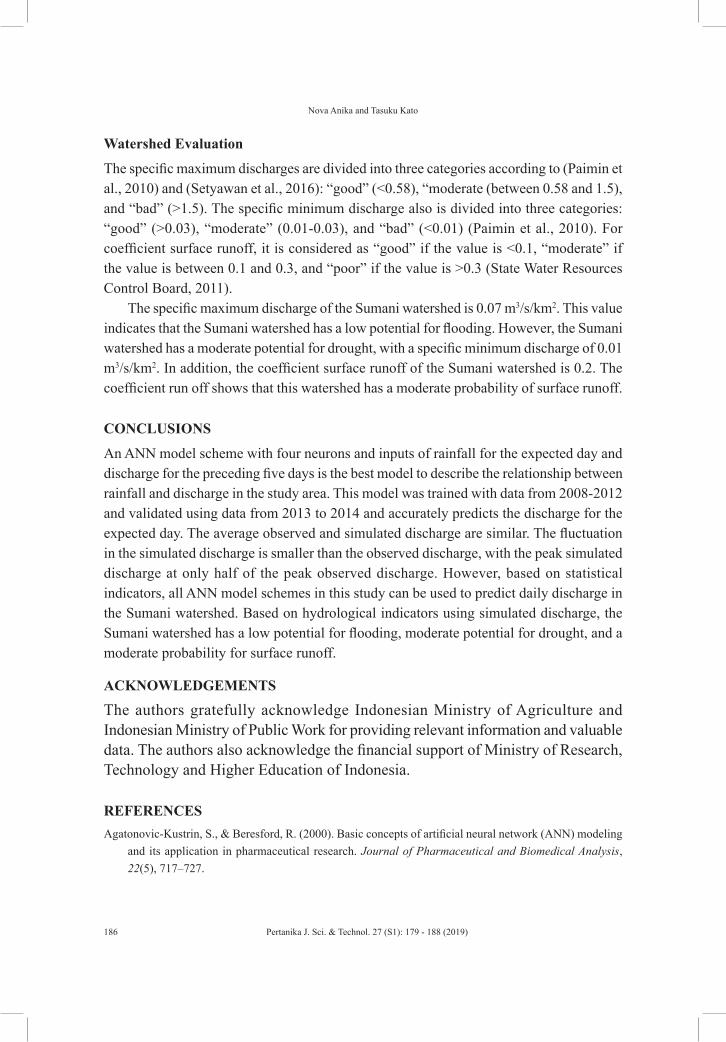
In the testing stage (2013-2014), the average discharge was approximately 28% of the annual 2035 mm of rainfall. The wet season lasted from October to May and the dry
Modeling River Flow Using Artificial Neural Networks
185Pertanika J. Sci. & Technol. 27 (S1): 179 - 188 (2019)
season lasted between June and September. The average observed discharge was 10.5 m3/s, with a minimum discharge of 3.9 m3/s and a maximum discharge of 80.9 m3/s. Model 2 fluctuated from 4.5 m3/s to 45.1 m3/s. The fluctuation of Model 3 was less than Model 2, with a minimum discharge of 4.5 m3/s to a maximum discharge of 42.3 m3/s. Model 1 had the greatest fluctuation range from 4.2 m3/s to 50.2 m3/s. The observed and simulated discharge in the testing stage is shown in Figure 4.
Figure 3. The observed and simulated discharge of Model 2 in the training stage
Figure 4. The observed and simulated discharge of Model 2 in the testing stage
Nova Anika and Tasuku Kato
186 Pertanika J. Sci. & Technol. 27 (S1): 179 - 188 (2019)
Watershed Evaluation
The specific maximum discharges are divided into three categories according to (Paimin et al., 2010) and (Setyawan et al., 2016): “good” (<0.58), “moderate (between 0.58 and 1.5), and “bad” (>1.5). The specific minimum discharge also is divided into three categories: “good” (>0.03), “moderate” (0.01-0.03), and “bad” (<0.01) (Paimin et al., 2010). For coefficient surface runoff, it is considered as “good” if the value is <0.1, “moderate” if the value is between 0.1 and 0.3, and “poor” if the value is >0.3 (State Water Resources Control Board, 2011).
The specific maximum discharge of the Sumani watershed is 0.07 m3/s/km2. This value indicates that the Sumani watershed has a low potential for flooding. However, the Sumani watershed has a moderate potential for drought, with a specific minimum discharge of 0.01 m3/s/km2. In addition, the coefficient surface runoff of the Sumani watershed is 0.2. The coefficient run off shows that this watershed has a moderate probability of surface runoff.
CONCLUSIONS
An ANN model scheme with four neurons and inputs of rainfall for the expected day and discharge for the preceding five days is the best model to describe the relationship between rainfall and discharge in the study area. This model was trained with data from 2008-2012 and validated using data from 2013 to 2014 and accurately predicts the discharge for the expected day. The average observed and simulated discharge are similar. The fluctuation in the simulated discharge is smaller than the observed discharge, with the peak simulated discharge at only half of the peak observed discharge. However, based on statistical indicators, all ANN model schemes in this study can be used to predict daily discharge in the Sumani watershed. Based on hydrological indicators using simulated discharge, the Sumani watershed has a low potential for flooding, moderate potential for drought, and a moderate probability for surface runoff.
ACKNOWLEDGEMENTS
The authors gratefully acknowledge Indonesian Ministry of Agriculture and Indonesian Ministry of Public Work for providing relevant information and valuable data. The authors also acknowledge the financial support of Ministry of Research, Technology and Higher Education of Indonesia.
REFERENCESAgatonovic-Kustrin, S., & Beresford, R. (2000). Basic concepts of artificial neural network (ANN) modeling
and its application in pharmaceutical research. Journal of Pharmaceutical and Biomedical Analysis, 22(5), 717–727.
Modeling River Flow Using Artificial Neural Networks
187Pertanika J. Sci. & Technol. 27 (S1): 179 - 188 (2019)
Aichouri, I., Hani, A., Bougherira, N., Djabri, L., Chaffai, H., & Lallahem, S. (2015). River flow model using Artificial Neural Networks. Energy Procedia, 74, 1007–1014.
Bates, B., Kundzewicz, Z. W., Wu, S., & Palutikof, J. (Eds.). (2008). Climate change and water. Geneva, Switzerland: Intergovernmental Panel on Climate Change.
Da Silva, I. N., Spatti, D. H., Flauzino, R. A., Liboni, L. H. B., & dos Reis Alves, S. F. (2017). Artificial Neural Networks : A practical course. Springer International Publishing. Retrieved May 24, 2018, from //www.springer.com/la/book/9783319431611
Dubois, O. (2011). The state of the world’s land and water resources for food and agriculture: Managing systems at risk. New York, USA: The Food and Agriculture Organization of the United Nations.
FAO. (2014). The water-energy-food nexus: A new approach in support of food security and sustainable agriculture. Food and Agriculture Organization of the United Nations. Retrieved May 24, 2018, from http://www.fao.org/3/a-bl496e.pdf
Ghumman, A. R., Ghazaw, Y. M., Sohail, A. R., & Watanabe, K. (2011). Runoff forecasting by artificial neural network and conventional model. Alexandria Engineering Journal, 50(4), 345–350.
GRiSP. (2013). Rice almanac (4th Ed.). Global Rice Science Partnership. Retrieved May 24, 2018, from http://books.irri.org/9789712203008_content.pdf.
Hayes, D. C., & Young, R. L. (2006). Comparison of peak discharge and runoff characteristic estimates from the rational method to field observations for small basins in central Virginia (USGS Numbered Series No. 2005–5254). Retrieved May, 24 2018, from http://pubs.er.usgs.gov/publication/sir20055254
Indonesian Ministry of Agriculture. (2015). Rainfall data of Saniang Baka climatological station 2008-2014 (pp. 1-84). West Sumatra, Indonesia: Ministry of Public Work.
Indonesian Ministry of Public Work. (2015). Discharge data of Sumani river gauge station 2008-2014 (pp. 1-84). West Sumatra, Indonesia: Ministry of Public Work.
Joorabchi, A., Zhang, H., & Blumenstein, M. (2007). Application of artificial neural networks in flow discharge prediction for the Fitzroy River, Australia. Journal of Coastal Research, 50, 287-291.
Karimi, P., Bastiaanssen, W. G. M., & Molden, D. (2013). Water Accounting Plus (WA+); a water accounting procedure for complex river basins based on satellite measurements. Hydrology and Earth System Sciences, 17(7), 2459–2472.
Lee, D. H., & Kang, D. S. (2016). The application of the artificial neural network ensemble model for simulating streamflow. Procedia Engineering, 154, 1217–1224.
Molden, D. (Ed.). (2007). Water for food, water for life: A comprehensive assessment of water management in agriculture. London, UK: Earthscan.
Nasr, M. S., Moustafa, M. A. E., Seif, H. A. E., & El Kobrosy, G. (2012). Application of Artificial Neural Network (ANN) for the prediction of EL-AGAMY wastewater treatment plant performance-EGYPT. Alexandria Engineering Journal, 51(1), 37–43.
Paimin, Sukresno, & Purwanto. (2010). Prompt investigation on sub-watershed degradation. Retrieved May 28, 2018, from http://www.forda-mof.org/files/Sidik_Cepat_Degradasi_SubDAS.pdf

Nova Anika and Tasuku Kato
188 Pertanika J. Sci. & Technol. 27 (S1): 179 - 188 (2019)
Pereira, D. D. R., Martinez, M. A., Pruski, F. F., & da Silva, D. D. (2016). Hydrological simulation in a basin of typical tropical climate and soil using the SWAT model part I: Calibration and validation tests. Journal of Hydrology: Regional Studies, 7, 14–37.
Roson, R., & van der Mensbrugghe, D. (2010). Climate change and economic growth: Impacts and interactions. Retrieved May 24, 2018, from file:///C:/Users/SuiriNEC/Favorites/Downloads/SSRN-id1594708.pdf
Setyawan, C., Lee, C. Y., & Prawitasari, M. (2016). Hydrologic modeling for tropical watershed monitoring and evaluation. American Journal of Engineering Research (AJER), 5(11), 36-42.
Singh, R. K., & Prajneshu. (2008). Artificial Neural Network methodology for modelling and forecasting Maize crop yield. Agriculture Economics Research Review, 21, 5-10.
State Water Resources Control Board. (2011). The clean water team guidance compendium for watershed monitoring. Retrieved May 28, 2018, from https://www.coursehero.com/file/p6c13pd/The-Clean-Water-Team-Guidance-Compendium-for-Watershed-Monitoring-and/
Copyright © 2022 FDOKUMEN