Infectious vaccine-derived rubella viruses emerge ... - PLOS
Upload
independentCategory
view
0download
0
10.1128/AEM.71.9.5244-5253.2005.
2005, 71(9):5244. DOI:Appl. Environ. Microbiol. Allard and Apostolos VantarakisSrinivasa Lingireddy, Rosina Girones, David Lees, Annika Gail Brion, Chandramouli Viswanathan, T. R. Neelakantan, Viruses in ShellfishArtificial Neural Network Prediction of
http://aem.asm.org/content/71/9/5244Updated information and services can be found at:
These include:
REFERENCEShttp://aem.asm.org/content/71/9/5244#ref-list-1This article cites 15 articles, 7 of which can be accessed free at:
CONTENT ALERTS more»articles cite this article),
Receive: RSS Feeds, eTOCs, free email alerts (when new
http://journals.asm.org/site/misc/reprints.xhtmlInformation about commercial reprint orders: http://journals.asm.org/site/subscriptions/To subscribe to to another ASM Journal go to:
on April 15, 2014 by guest
http://aem.asm
.org/D
ownloaded from
on A
pril 15, 2014 by guesthttp://aem
.asm.org/
Dow
nloaded from
APPLIED AND ENVIRONMENTAL MICROBIOLOGY, Sept. 2005, p. 5244–5253 Vol. 71, No. 90099-2240/05/$08.00�0 doi:10.1128/AEM.71.9.5244–5253.2005Copyright © 2005, American Society for Microbiology. All Rights Reserved.
Artificial Neural Network Prediction of Viruses in ShellfishGail Brion,1* Chandramouli Viswanathan,2 T. R. Neelakantan,3 Srinivasa Lingireddy,1
Rosina Girones,4 David Lees,5 Annika Allard,6 and Apostolos Vantarakis7
Department of Civil Engineering, University of Kentucky, Lexington, Kentucky 405061; Indian Institute of Technology,Guwahati, Assam, India2; School of Civil Engineering, SASTRA Deemed University, Thanjavur 613402, India3;
Biology School, University of Barcelona, Barcelona, Spain4; Centre for Environment, Fisheries andAquaculture Science, Weymouth, United Kingdom5; Umeå University Hospital,Umeå, Sweden6; and School of Medicine, University of Patras, Patras, Greece7
Received 7 August 2004/Accepted 30 March 2005
A database was probed with artificial neural network (ANN) and multivariate logistic regression (MLR)models to investigate the efficacy of predicting PCR-identified human adenovirus (ADV), Norwalk-like virus(NLV), and enterovirus (EV) presence or absence in shellfish harvested from diverse countries in Europe(Spain, Sweden, Greece, and the United Kingdom). The relative importance of numerical and heuristic inputvariables to the ANN model for each country and for the combined data was analyzed with a newly definedrelative strength effect, which illuminated the importance of bacteriophages as potential viral indicators. Theresults of this analysis showed that ANN models predicted all types of viral presence and absence in shellfishwith better precision than MLR models for a multicountry database. For overall presence/absence classifica-tion accuracy, ANN modeling had a performance rate of 95.9%, 98.9%, and 95.7% versus 60.5%, 75.0%, and64.6% for the MLR for ADV, NLV, and EV, respectively. The selectivity (prediction of viral negatives) wasgreater than the sensitivity (prediction of viral positives) for both models and with all virus types, with the ANNmodel performing with greater sensitivity than the MLR. ANN models were able to illuminate site-specificrelationships between microbial indicators chosen as model inputs and human virus presence. A validationstudy on ADV demonstrated that the MLR and ANN models differed in sensitivity and selectivity, with the ANNmodel correctly identifying ADV presence with greater precision.
Health risks associated with the consumption of virally con-taminated shellfish are well documented, as is the need for amore reliable viral indicator system by the industry (14, 17).Interdisciplinary studies are needed to define the underlyingrelationships between harvest area water quality, shellfish type,treatment processes, and viral presence, particularly with theadvent of advanced detection and modeling methods. Newunderstandings can be obtained with the application of newdata-driven, fuzzy-logic-based models that can handle multi-ple, interrelated inputs and learn complex relationships. How-ever, for the application of these new models, large, robust,multivariable, complete, and well-controlled datasets need tobe created. A multicountry study in Europe has collected vitaldata in an effort to relate the viral contamination of shellfishwith potential indicators. Analysis of these results has beenreported earlier by Formiga-Cruz et al. (6, 7), and the databaseconsisted of 468 individual observations from geographicallydiverse areas collected over 18 months. The resultant databasewas provided to a team of engineers and modeling experts forfurther probing with new artificial neural network (ANN)modeling tools under the hypothesis that these new modelingtools would be able to better define the relationships betweenviral presence/absence and potential water quality indicatorsthan multivariate logistic regression (MLR) and provide moreprecise predictions with ANN models.
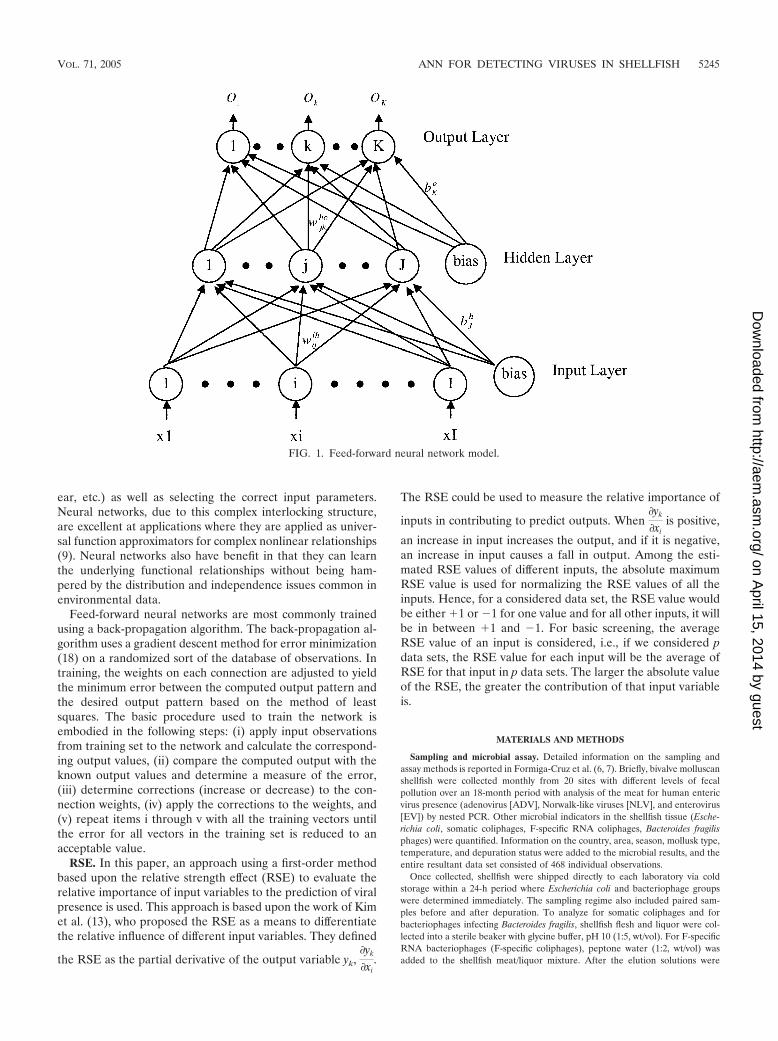
Neural network models. Multilayered feed-forward net-works have proven to be very powerful computational toolsthat excel in pattern recognition and function approximation.The general structure of a feed-forward neural network isshown in Fig. 1. Neurons, which are activation functions, arearranged in different horizontal layers, with multiple verticallayers possible. The nodes in the input layer receive the inputsof the model, and they flow through the hidden layer(s) inter-nal to the network and produce outputs at nodes in the outputlayer. The working principle of feed-forward neural network isavailable elsewhere (15). Mathematically, a three-layer neuralnetwork with I input nodes, J hidden nodes in a hidden layer,and K output nodes, can be expressed as follows:
Ok � f1��j�1
J
wjkho f2��
i�1
I
wijih xi � bj
h� � bko�
where Ok is the output from the kth node of the output layer,xi is the input to the network at node i of the input layer, wij
ih isthe weight between the ith node of the input layer and the jthnode of the hidden layer, bj
h is the bias term added to the jthhidden node, wjk
ho is the weight between the jth node of thehidden layer and kth node of the output layer, and bk
o is the biasterm added to the kth output node. The architecture of thenetwork shown in Fig. 1 can be summarized as 3:3:1 for threeinput nodes, three hidden nodes in a single hidden layer, andone output node. Each node has a function assigned to it, andthe optimization of an ANN model often involves selecting theoptimal combination of architecture (number of input andhidden nodes) and node functions (sigmoidal, hyperbolic, lin-
* Corresponding author. Mailing address: Dept. of Civil Engineer-ing, University of Kentucky, 161 Raymond Bldg., Lexington, KY40506-0281. Phone: (859) 257-4467. Fax: (859) 257-4404. E-mail:[email protected].
5244
on April 15, 2014 by guest
http://aem.asm
.org/D
ownloaded from
ear, etc.) as well as selecting the correct input parameters.Neural networks, due to this complex interlocking structure,are excellent at applications where they are applied as univer-sal function approximators for complex nonlinear relationships(9). Neural networks also have benefit in that they can learnthe underlying functional relationships without being ham-pered by the distribution and independence issues common inenvironmental data.
Feed-forward neural networks are most commonly trainedusing a back-propagation algorithm. The back-propagation al-gorithm uses a gradient descent method for error minimization(18) on a randomized sort of the database of observations. Intraining, the weights on each connection are adjusted to yieldthe minimum error between the computed output pattern andthe desired output pattern based on the method of leastsquares. The basic procedure used to train the network isembodied in the following steps: (i) apply input observationsfrom training set to the network and calculate the correspond-ing output values, (ii) compare the computed output with theknown output values and determine a measure of the error,(iii) determine corrections (increase or decrease) to the con-nection weights, (iv) apply the corrections to the weights, and(v) repeat items i through v with all the training vectors untilthe error for all vectors in the training set is reduced to anacceptable value.
RSE. In this paper, an approach using a first-order methodbased upon the relative strength effect (RSE) to evaluate therelative importance of input variables to the prediction of viralpresence is used. This approach is based upon the work of Kimet al. (13), who proposed the RSE as a means to differentiatethe relative influence of different input variables. They defined
the RSE as the partial derivative of the output variable yk,�yk
�xi.
The RSE could be used to measure the relative importance of
inputs in contributing to predict outputs. When�yk
�xiis positive,
an increase in input increases the output, and if it is negative,an increase in input causes a fall in output. Among the esti-mated RSE values of different inputs, the absolute maximumRSE value is used for normalizing the RSE values of all theinputs. Hence, for a considered data set, the RSE value wouldbe either �1 or �1 for one value and for all other inputs, it willbe in between �1 and �1. For basic screening, the averageRSE value of an input is considered, i.e., if we considered pdata sets, the RSE value for each input will be the average ofRSE for that input in p data sets. The larger the absolute valueof the RSE, the greater the contribution of that input variableis.
MATERIALS AND METHODS
Sampling and microbial assay. Detailed information on the sampling andassay methods is reported in Formiga-Cruz et al. (6, 7). Briefly, bivalve molluscanshellfish were collected monthly from 20 sites with different levels of fecalpollution over an 18-month period with analysis of the meat for human entericvirus presence (adenovirus [ADV], Norwalk-like viruses [NLV], and enterovirus[EV]) by nested PCR. Other microbial indicators in the shellfish tissue (Esche-richia coli, somatic coliphages, F-specific RNA coliphages, Bacteroides fragilisphages) were quantified. Information on the country, area, season, mollusk type,temperature, and depuration status were added to the microbial results, and theentire resultant data set consisted of 468 individual observations.
Once collected, shellfish were shipped directly to each laboratory via coldstorage within a 24-h period where Escherichia coli and bacteriophage groupswere determined immediately. The sampling regime also included paired sam-ples before and after depuration. To analyze for somatic coliphages and forbacteriophages infecting Bacteroides fragilis, shellfish flesh and liquor were col-lected into a sterile beaker with glycine buffer, pH 10 (1:5, wt/vol). For F-specificRNA bacteriophages (F-specific coliphages), peptone water (1:2, wt/vol) wasadded to the shellfish meat/liquor mixture. After the elution solutions were
FIG. 1. Feed-forward neural network model.
VOL. 71, 2005 ANN FOR DETECTING VIRUSES IN SHELLFISH 5245
on April 15, 2014 by guest
http://aem.asm
.org/D
ownloaded from
added, the shellfish was homogenized with a blender and stirred for a 15-mincontact time and then pH adjusted to 7.2 � 0.2. The homogenate was thencentrifuged at 2,170 � g for 15 min at 4°C. Phages contained in the supernatantwere quantified by the double-agar-layer method with appropriate hosts (E. coliWG5-SP, Salmonella enterica serovar Typhimurium WG49, B. fragilis RYC2056-BP). Standardized protocol for all phage assays was used (10–12). E. coli was,with little modification, assayed by most probable number (MPN) as described byDonovan et al. (4), which consisted of a two-stage, five-tube, three-dilution MPNmethod. In brief, it required initial inoculation in mineral-modified glutamatebroth and further confirmation by subculturing positive tubes onto a chromo-genic agar to detect �-glucuronidase activity. A program for quality assuranceand control for all phage types and E. coli was followed to ensure interlaboratoryconsistency. Human enteric viruses (ADV, NLV, EV) were detected by nestedPCR after elution from tissue and liquor with glycine buffer 0.25 N at pH 10 (1:5,wt/vol) as described by Formiga-Cruz et al. (7) and then stored at �70 � 10°Cuntil the detection assay.
MLR modeling. Details of the prior regressions between indicators and viralpresence/absence can be found in the work by Formiga-Cruz et al. (6). Microbialconcentration values for E. coli, F-specific coliphages, somatic coliphages, and B.fragilis phages were transformed by the log10(x � 1) function before fitting for thepresence/absence of individual virus types by MLR run on the statistical softwareSPSS 10.0.7. The six input parameters used for the MLRs included E. coli,somatic coliphages, F-specific coliphages, B. fragilis phages, mollusk type, andcountry. An additional MLR run on Excel with all nine input parameters, bututilizing only a subset of the data to fit the model, was run for the purpose ofverifying ADV presence.
Artificial neural network modeling. The same database used by the MLR doneby Formiga-Cruz et al. (6) was used for ANN modeling efforts. Before applyingthe ANN model, the microbial input data were transformed using the log10(x �1) and then normalized by dividing the actual data value by 1.2 times themaximum value found in the input field. The microbial data for predicting NLVpresence underwent a second transformation by the square root before normal-ization. The normalization was done to provide an equivalent numerical basis forjudging the RSE of the numerical, microbial input parameters (E. coli, F-specificcoliphages, somatic coliphages, and B. fragilis phages). In addition to these fourmicrobially based numerical inputs, five heuristic knowledge inputs of mollusktype, area, month, and depuration status were used. In total, there were as manyas nine and as few as six inputs for the models, each model using some combi-nation of these inputs found to be optimal by initial ANN training attempts.
The heuristic input variable area was modified from the one reported byFormiga-Cruz et al. (6) that referred to areas classified as A or B relative to theability to consume shellfish directly or after depuration. The variable area as usedin this study reflected the relative level of fecal contamination at the samplingsite on the day of observation rather than an average classification. The variablearea was defined as one of four classifications corresponding to the value of thesum of the E. coli and somatic coliphages concentrations for the individualobservation. If the E. coli and somatic coliphages concentration sum was �1,200,then the area coding was 1 for that observation. If the sum was between 1,201 and12,000, then the area coding was 2. If the sum was between 12,001 and 60,000,then the area was coded as 3. If the sum was 60,000, then the area coding was4. This classification scheme captured the relationship between somatic bacte-riophage and potential host bacteria. The classification scheme created a way torelate diverse geographic sites based upon indicator-estimated fecal loadingswithin the shellfish. In addition, the input parameter date was split into 12classifications, with January assigned a value of 1 and December a value of 12.
Separate ANN models were built to predict ADV, NLV, and EV presence/absence with Norwalk-like viruses of genogroups I and II lumped together intoa single presence signal for NLV. Lumping the two groups of NLV together wasdone to provide more NLV-positive results for the purposes of training the ANNto avoid the phenomenon of memorization (overfitting) that can occur withlimited observation and complex model structures. From prior experience, da-tabases used for ANN classification modeling should contain more than 100observations split evenly between outcomes to minimize memorization and em-phasize generalization. There are several theory-based approaches outlined bySarle (19) that provide guidelines for avoiding overfitting. One of the simplest isto maximize the number of data observations used, using between 30 and 5 timesas many training cases as there are weights in the network, with fewer observa-tions required as noise in the data decreases. The output of the ANN model wascoded 0 for virus presence and 1 for virus absence, with 0.5 serving as thebreakpoint between classifications per convention. The ANN model used foreach individual type of human virus presence/absence prediction was a feed-forward ANN model with back propagation training developed using the soft-ware Neurosort VerII (16) created by some of the authors (3) and recently
modified to contain a new calculation of the RSE. Modeling was done first for allcountries’ data combined to establish the optimum model architecture and nodefunctions for each virus type, and then the established ANN model for each virustype was applied on a country-by-country data split basis to examine geographicaldifferences in the relationships between indicators and the specified viral pres-ence by RSE. The input variables for each of these individual models arepresented in Table 1. The architecture and node functions for the combined datamodels are presented in Table 2. For direct comparison, RSE values werenormalized by division with the sum of the absolute value of all input RSE valuescalculated for the trained ANN model.
For the comparison results presented in this paper, all of the data observationswere used to train the ANN models. The MLR models constructed by theauthors (for selected viral groups and input parameter selections not addressedby Formiga-Cruz et al. (6) also used all of the observations for performancetesting. This was done so that direct comparisons of accuracy and generalizationbetween the models could be made on equal datasets handled similarly. Accuracywas computed by dividing the number of correct predictions in a classification bythe total number of observations available in that classification for viral presence(sensitivity), viral absence (selectivity), and combined accuracy [(number of viralpresence correct � number of viral absence correct)/total number of observa-tions)]. With the limited number of virus-positive samples in the groups identi-fied, only the combined ADV data set was able to support ANN modeling andvalidation with split datasets, where the model was verified on data observationsnot used for training.
RESULTS
Modeling of the combined database. As can be seen in Table3, The most frequently identified virus group in shellfish wasadenovirus (39.1%). ADV was found at twice the frequency ofNLV and EV groups. Yet the overall prevalence of isolatingviruses from the shellfish was low, resulting in a smaller pres-ence training, or fitting for MLR data set for the models ratherthan for the absence of viruses. The smallest number of posi-tive samples was shown for NLV, with only 69 positive eventsfrom 468 observations for the ANN and MLR models to trainand fit upon. As noted by Formiga-Cruz et al. (7), the greater
TABLE 1. Input parameters used for viral presence modelingby ANN
Type and inputparameter
Allcountriescombined
Spain Sweden Greece UnitedKingdom
Heuristic knowledgeCountry XMonth X X X X XArea X X X X XMollusk X X XDepuration X X X
Numerical knowledgeE. coli X X X X XSomatic coliphages X X X X XF-specific coliphages X X X X XB. fragilis phages X X X X X
TABLE 2. Architecture and node functions for ANN modeling ofvirus presence on combined country dataset
Virus type Optimalarchitecture
Node function
Hidden layer Output layer
Adenovirus 9:20:1 Sigmoidal SigmoidalNorwalk-like viruses 9:16:1 Hyperbolic SigmoidalEnterovirus 9:20:1 Sigmoidal Sigmoidal
5246 BRION ET AL. APPL. ENVIRON. MICROBIOL.
on April 15, 2014 by guest
http://aem.asm
.org/D
ownloaded from
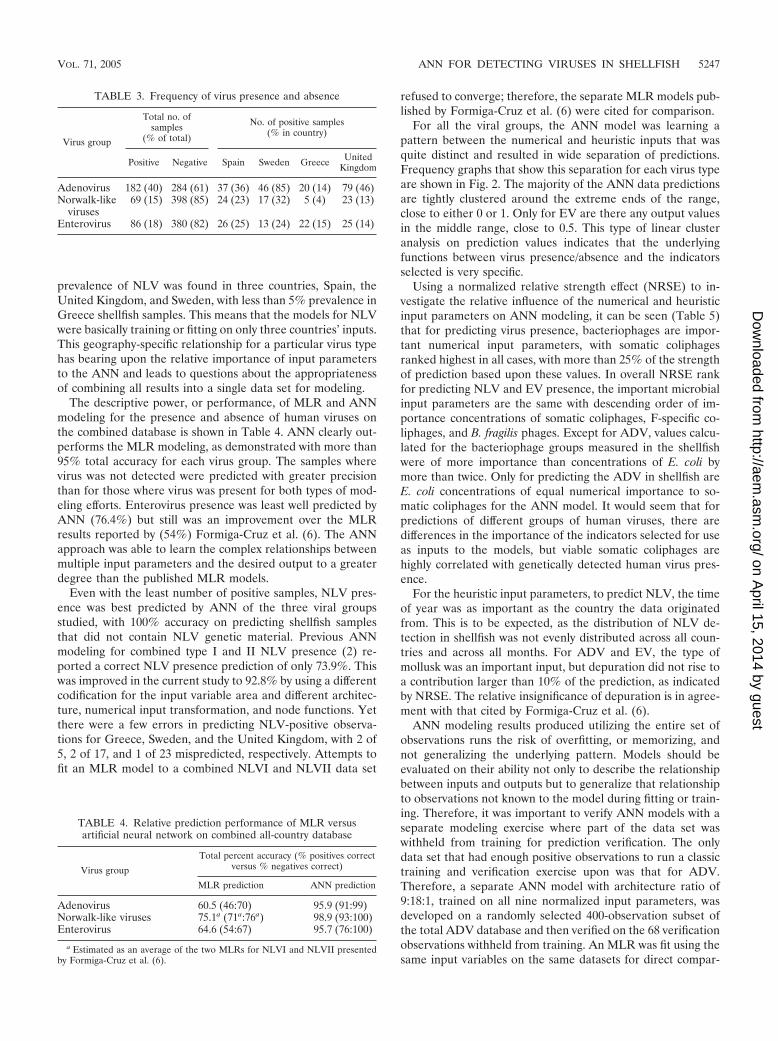
prevalence of NLV was found in three countries, Spain, theUnited Kingdom, and Sweden, with less than 5% prevalence inGreece shellfish samples. This means that the models for NLVwere basically training or fitting on only three countries’ inputs.This geography-specific relationship for a particular virus typehas bearing upon the relative importance of input parametersto the ANN and leads to questions about the appropriatenessof combining all results into a single data set for modeling.
The descriptive power, or performance, of MLR and ANNmodeling for the presence and absence of human viruses onthe combined database is shown in Table 4. ANN clearly out-performs the MLR modeling, as demonstrated with more than95% total accuracy for each virus group. The samples wherevirus was not detected were predicted with greater precisionthan for those where virus was present for both types of mod-eling efforts. Enterovirus presence was least well predicted byANN (76.4%) but still was an improvement over the MLRresults reported by (54%) Formiga-Cruz et al. (6). The ANNapproach was able to learn the complex relationships betweenmultiple input parameters and the desired output to a greaterdegree than the published MLR models.
Even with the least number of positive samples, NLV pres-ence was best predicted by ANN of the three viral groupsstudied, with 100% accuracy on predicting shellfish samplesthat did not contain NLV genetic material. Previous ANNmodeling for combined type I and II NLV presence (2) re-ported a correct NLV presence prediction of only 73.9%. Thiswas improved in the current study to 92.8% by using a differentcodification for the input variable area and different architec-ture, numerical input transformation, and node functions. Yetthere were a few errors in predicting NLV-positive observa-tions for Greece, Sweden, and the United Kingdom, with 2 of5, 2 of 17, and 1 of 23 mispredicted, respectively. Attempts tofit an MLR model to a combined NLVI and NLVII data set
refused to converge; therefore, the separate MLR models pub-lished by Formiga-Cruz et al. (6) were cited for comparison.
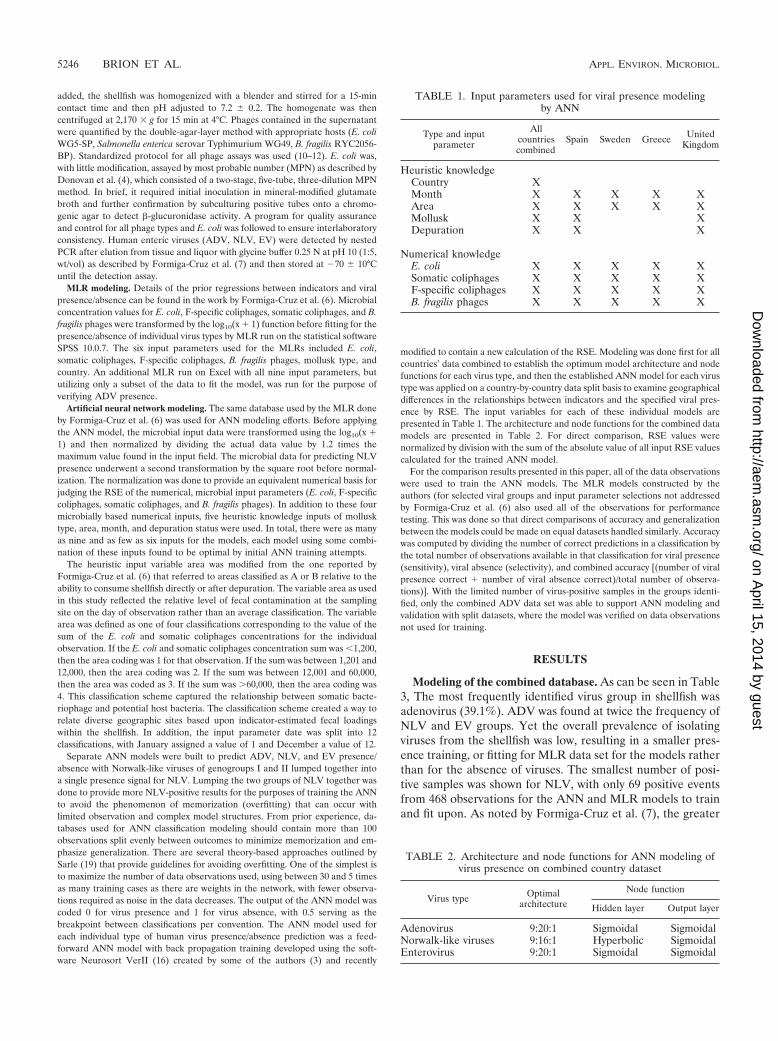
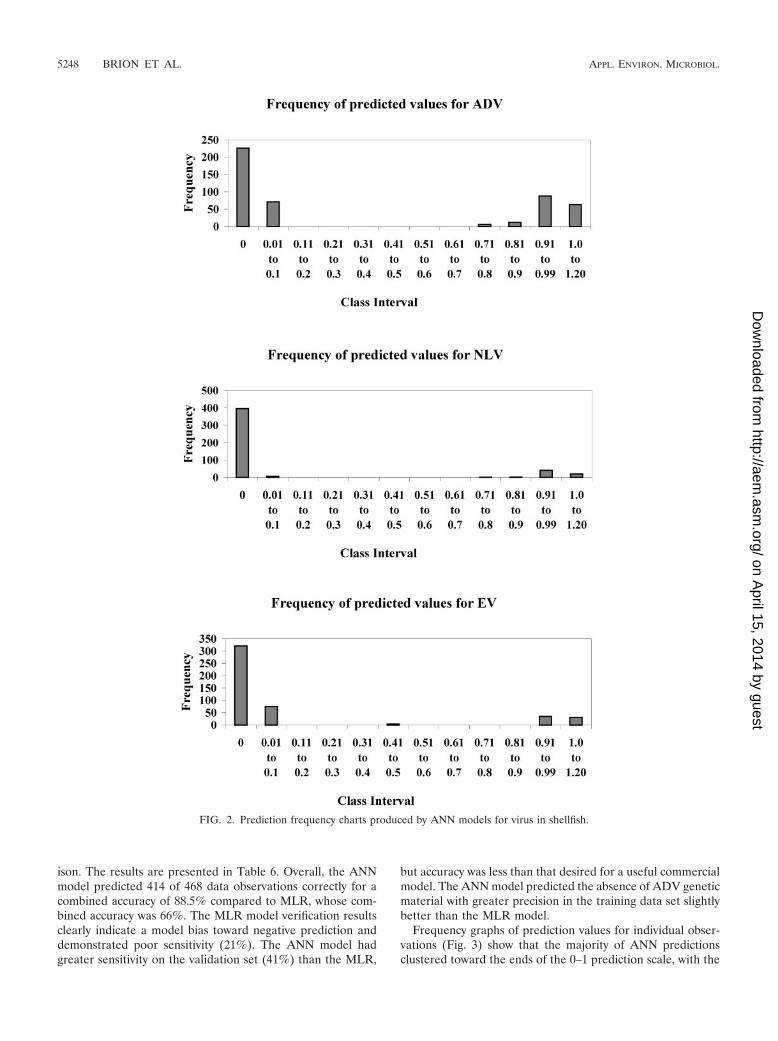
For all the viral groups, the ANN model was learning apattern between the numerical and heuristic inputs that wasquite distinct and resulted in wide separation of predictions.Frequency graphs that show this separation for each virus typeare shown in Fig. 2. The majority of the ANN data predictionsare tightly clustered around the extreme ends of the range,close to either 0 or 1. Only for EV are there any output valuesin the middle range, close to 0.5. This type of linear clusteranalysis on prediction values indicates that the underlyingfunctions between virus presence/absence and the indicatorsselected is very specific.
Using a normalized relative strength effect (NRSE) to in-vestigate the relative influence of the numerical and heuristicinput parameters on ANN modeling, it can be seen (Table 5)that for predicting virus presence, bacteriophages are impor-tant numerical input parameters, with somatic coliphagesranked highest in all cases, with more than 25% of the strengthof prediction based upon these values. In overall NRSE rankfor predicting NLV and EV presence, the important microbialinput parameters are the same with descending order of im-portance concentrations of somatic coliphages, F-specific co-liphages, and B. fragilis phages. Except for ADV, values calcu-lated for the bacteriophage groups measured in the shellfishwere of more importance than concentrations of E. coli bymore than twice. Only for predicting the ADV in shellfish areE. coli concentrations of equal numerical importance to so-matic coliphages for the ANN model. It would seem that forpredictions of different groups of human viruses, there aredifferences in the importance of the indicators selected for useas inputs to the models, but viable somatic coliphages arehighly correlated with genetically detected human virus pres-ence.
For the heuristic input parameters, to predict NLV, the timeof year was as important as the country the data originatedfrom. This is to be expected, as the distribution of NLV de-tection in shellfish was not evenly distributed across all coun-tries and across all months. For ADV and EV, the type ofmollusk was an important input, but depuration did not rise toa contribution larger than 10% of the prediction, as indicatedby NRSE. The relative insignificance of depuration is in agree-ment with that cited by Formiga-Cruz et al. (6).
ANN modeling results produced utilizing the entire set ofobservations runs the risk of overfitting, or memorizing, andnot generalizing the underlying pattern. Models should beevaluated on their ability not only to describe the relationshipbetween inputs and outputs but to generalize that relationshipto observations not known to the model during fitting or train-ing. Therefore, it was important to verify ANN models with aseparate modeling exercise where part of the data set waswithheld from training for prediction verification. The onlydata set that had enough positive observations to run a classictraining and verification exercise upon was that for ADV.Therefore, a separate ANN model with architecture ratio of9:18:1, trained on all nine normalized input parameters, wasdeveloped on a randomly selected 400-observation subset ofthe total ADV database and then verified on the 68 verificationobservations withheld from training. An MLR was fit using thesame input variables on the same datasets for direct compar-
TABLE 3. Frequency of virus presence and absence
Virus group
Total no. ofsamples
(% of total)
No. of positive samples(% in country)
Positive Negative Spain Sweden Greece UnitedKingdom
Adenovirus 182 (40) 284 (61) 37 (36) 46 (85) 20 (14) 79 (46)Norwalk-like
viruses69 (15) 398 (85) 24 (23) 17 (32) 5 (4) 23 (13)
Enterovirus 86 (18) 380 (82) 26 (25) 13 (24) 22 (15) 25 (14)
TABLE 4. Relative prediction performance of MLR versusartificial neural network on combined all-country database
Virus group
Total percent accuracy (% positives correctversus % negatives correct)
MLR prediction ANN prediction
Adenovirus 60.5 (46:70) 95.9 (91:99)Norwalk-like viruses 75.1a (71a:76a) 98.9 (93:100)Enterovirus 64.6 (54:67) 95.7 (76:100)
a Estimated as an average of the two MLRs for NLVI and NLVII presentedby Formiga-Cruz et al. (6).
VOL. 71, 2005 ANN FOR DETECTING VIRUSES IN SHELLFISH 5247
on April 15, 2014 by guest
http://aem.asm
.org/D
ownloaded from
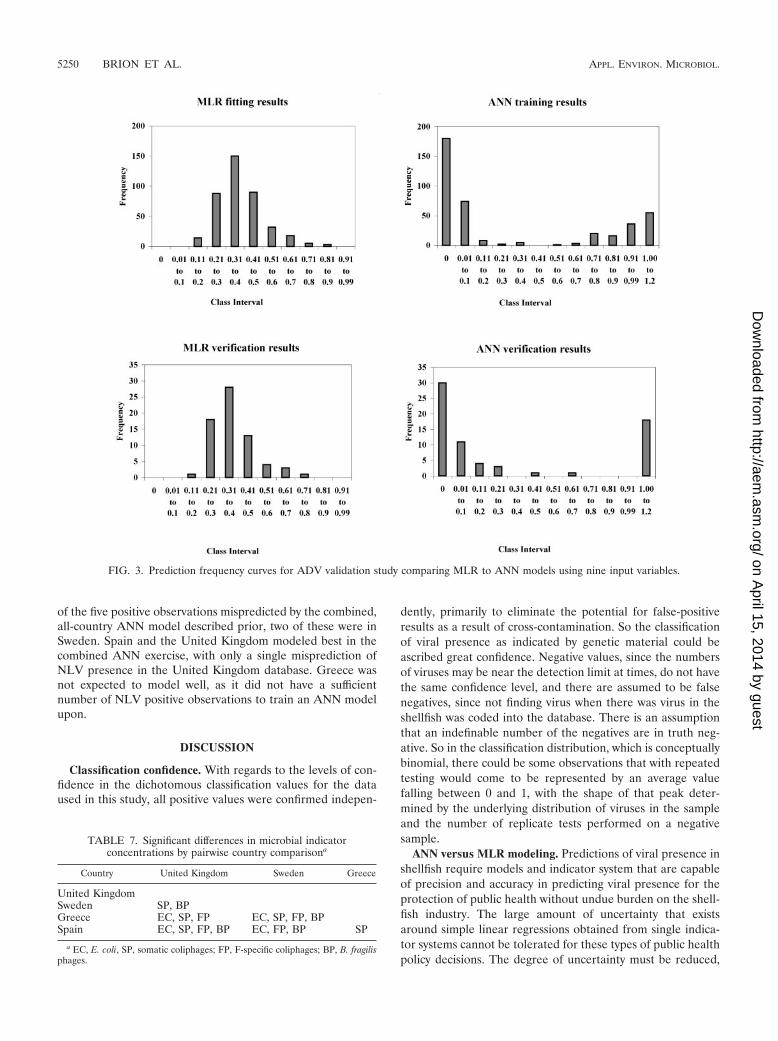
ison. The results are presented in Table 6. Overall, the ANNmodel predicted 414 of 468 data observations correctly for acombined accuracy of 88.5% compared to MLR, whose com-bined accuracy was 66%. The MLR model verification resultsclearly indicate a model bias toward negative prediction anddemonstrated poor sensitivity (21%). The ANN model hadgreater sensitivity on the validation set (41%) than the MLR,
but accuracy was less than that desired for a useful commercialmodel. The ANN model predicted the absence of ADV geneticmaterial with greater precision in the training data set slightlybetter than the MLR model.
Frequency graphs of prediction values for individual obser-vations (Fig. 3) show that the majority of ANN predictionsclustered toward the ends of the 0–1 prediction scale, with the
FIG. 2. Prediction frequency charts produced by ANN models for virus in shellfish.
5248 BRION ET AL. APPL. ENVIRON. MICROBIOL.
on April 15, 2014 by guest
http://aem.asm
.org/D
ownloaded from
majority of predictions less than 0.2 units from either extreme.This is in contrast to the frequency graphs for the MLR (Fig.3) that show the majority of predictions for both testing andfitting to be clustered in the center of the range, with nopredictions observed at the extremes of 0 or 1. It is clear bycomparing the graphs that the ANN is providing more predic-tion separation for the presence or absence of ADV whentrained on the same input variables than the MLR model.
Two-country comparison modeling. Applying a Kruskal-Wallis one-way analysis of variance on Ranks-log-transformedmicrobial data from each country provides information on thepattern of differences in the average microbial concentrationsin shellfish between countries (Table 7). Spain and Greecehave the least number of differences in average microbial in-dicator concentration, while the concentrations from theUnited Kingdom and Spain, and Sweden and Greece, were themost different from each other in pairwise analysis of variancecomparisons (P � 0.05). Spain and Sweden had different av-erage indicator concentrations in shellfish, with the exceptionof somatic coliphages. Spain and United Kingdom had signif-icant differences in all of the average indicator concentrations.Sweden and United Kingdom had similar average concentra-tions for E. coli and F-specific coliphages but different concen-trations for B. fragilis phages and somatic coliphages. Notingthese differences led to questions about geographically induceddifferences in the underlying patterns between indicator con-centration and viral presence/absence.
In general, United Kingdom shellfish had higher coliformand bacteriophage concentrations than all other countriesstudied by Formiga-Cruz et al. (6, 7), with the exception of B.fragilis phages in Sweden. However, this observation was influ-enced by sampling site coverage. Sites were selected to cover arange of all the fecal contamination levels found in the diversecountries. The United Kingdom sampling plan included bothmoderately polluted EU class C (shellfish must have less than46,000 E. coli cells per 100 g of mollusk flesh and intravalvularliquid and are subject to treatment before consumption) andprohibited shellfish harvesting sites in order to investigate virusoccurrence in polluted sites restricted or prohibited for com-mercial exploitation. Spain ranked lowest in shellfish coliformand bacteriophage concentrations with the exception of so-matic coliphages in Greece. This is to be expected, as thesampling sites selected for Greece and Spain were reported tohave the highest incidence of sampling days where the poten-tial E. coli host concentration was �230 MPN/100 g. It wasquestioned if statistical differences in the input indicator con-centrations would result in differences in the underlying pat-terns between human virus and those indicators.
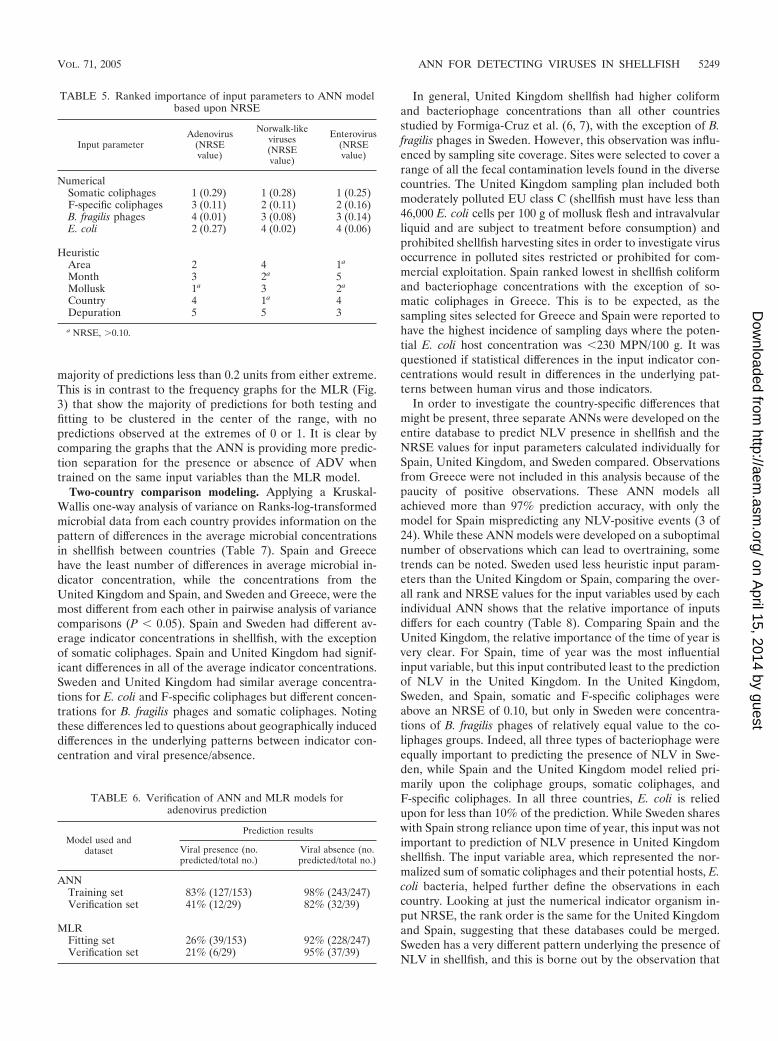
In order to investigate the country-specific differences thatmight be present, three separate ANNs were developed on theentire database to predict NLV presence in shellfish and theNRSE values for input parameters calculated individually forSpain, United Kingdom, and Sweden compared. Observationsfrom Greece were not included in this analysis because of thepaucity of positive observations. These ANN models allachieved more than 97% prediction accuracy, with only themodel for Spain mispredicting any NLV-positive events (3 of24). While these ANN models were developed on a suboptimalnumber of observations which can lead to overtraining, sometrends can be noted. Sweden used less heuristic input param-eters than the United Kingdom or Spain, comparing the over-all rank and NRSE values for the input variables used by eachindividual ANN shows that the relative importance of inputsdiffers for each country (Table 8). Comparing Spain and theUnited Kingdom, the relative importance of the time of year isvery clear. For Spain, time of year was the most influentialinput variable, but this input contributed least to the predictionof NLV in the United Kingdom. In the United Kingdom,Sweden, and Spain, somatic and F-specific coliphages wereabove an NRSE of 0.10, but only in Sweden were concentra-tions of B. fragilis phages of relatively equal value to the co-liphages groups. Indeed, all three types of bacteriophage wereequally important to predicting the presence of NLV in Swe-den, while Spain and the United Kingdom model relied pri-marily upon the coliphage groups, somatic coliphages, andF-specific coliphages. In all three countries, E. coli is reliedupon for less than 10% of the prediction. While Sweden shareswith Spain strong reliance upon time of year, this input was notimportant to prediction of NLV presence in United Kingdomshellfish. The input variable area, which represented the nor-malized sum of somatic coliphages and their potential hosts, E.coli bacteria, helped further define the observations in eachcountry. Looking at just the numerical indicator organism in-put NRSE, the rank order is the same for the United Kingdomand Spain, suggesting that these databases could be merged.Sweden has a very different pattern underlying the presence ofNLV in shellfish, and this is borne out by the observation that
TABLE 5. Ranked importance of input parameters to ANN modelbased upon NRSE
Input parameterAdenovirus
(NRSEvalue)
Norwalk-likeviruses(NRSEvalue)
Enterovirus(NRSEvalue)
NumericalSomatic coliphages 1 (0.29) 1 (0.28) 1 (0.25)F-specific coliphages 3 (0.11) 2 (0.11) 2 (0.16)B. fragilis phages 4 (0.01) 3 (0.08) 3 (0.14)E. coli 2 (0.27) 4 (0.02) 4 (0.06)
HeuristicArea 2 4 1a
Month 3 2a 5Mollusk 1a 3 2a
Country 4 1a 4Depuration 5 5 3
a NRSE, 0.10.
TABLE 6. Verification of ANN and MLR models foradenovirus prediction
Model used anddataset
Prediction results
Viral presence (no.predicted/total no.)
Viral absence (no.predicted/total no.)
ANNTraining set 83% (127/153) 98% (243/247)Verification set 41% (12/29) 82% (32/39)
MLRFitting set 26% (39/153) 92% (228/247)Verification set 21% (6/29) 95% (37/39)
VOL. 71, 2005 ANN FOR DETECTING VIRUSES IN SHELLFISH 5249
on April 15, 2014 by guest
http://aem.asm
.org/D
ownloaded from
of the five positive observations mispredicted by the combined,all-country ANN model described prior, two of these were inSweden. Spain and the United Kingdom modeled best in thecombined ANN exercise, with only a single misprediction ofNLV presence in the United Kingdom database. Greece wasnot expected to model well, as it did not have a sufficientnumber of NLV positive observations to train an ANN modelupon.
DISCUSSION
Classification confidence. With regards to the levels of con-fidence in the dichotomous classification values for the dataused in this study, all positive values were confirmed indepen-
dently, primarily to eliminate the potential for false-positiveresults as a result of cross-contamination. So the classificationof viral presence as indicated by genetic material could beascribed great confidence. Negative values, since the numbersof viruses may be near the detection limit at times, do not havethe same confidence level, and there are assumed to be falsenegatives, since not finding virus when there was virus in theshellfish was coded into the database. There is an assumptionthat an indefinable number of the negatives are in truth neg-ative. So in the classification distribution, which is conceptuallybinomial, there could be some observations that with repeatedtesting would come to be represented by an average valuefalling between 0 and 1, with the shape of that peak deter-mined by the underlying distribution of viruses in the sampleand the number of replicate tests performed on a negativesample.
ANN versus MLR modeling. Predictions of viral presence inshellfish require models and indicator system that are capableof precision and accuracy in predicting viral presence for theprotection of public health without undue burden on the shell-fish industry. The large amount of uncertainty that existsaround simple linear regressions obtained from single indica-tor systems cannot be tolerated for these types of public healthpolicy decisions. The degree of uncertainty must be reduced,
FIG. 3. Prediction frequency curves for ADV validation study comparing MLR to ANN models using nine input variables.
TABLE 7. Significant differences in microbial indicatorconcentrations by pairwise country comparisona
Country United Kingdom Sweden Greece
United KingdomSweden SP, BPGreece EC, SP, FP EC, SP, FP, BPSpain EC, SP, FP, BP EC, FP, BP SP
a EC, E. coli, SP, somatic coliphages; FP, F-specific coliphages; BP, B. fragilisphages.
5250 BRION ET AL. APPL. ENVIRON. MICROBIOL.
on April 15, 2014 by guest
http://aem.asm
.org/D
ownloaded from

and MLR modeling has been a large step forward in this goal.However, the underlying patterns between multiple, often in-terrelated indicators and pathogen risk are very complex andrequire a modeling system that can correctly capture this com-plexity without losing precision, precisely the attributes ANNmodels have been designed for. In this study, ANN modelingwas clearly superior to MLR modeling, capturing the patternbetween multiple indicators and genetic viral presence withgreater precision and accuracy. The performance of the logisticfunction for modeling a nonlinear relationship is amplified bythe additional dimensionality introduced by the additionalstructure of the ANN architecture. The fault does not lie withthe logistic regression function as the majority of ANN modelsused for this study had in their hidden inner nodes, an MLRcalculating a result that is passed on to the next node with aweighting factor for further processing. The ability of the ANNto accurately describe convoluted functional surfaces that existbetween the input parameters and the output variable is due toa matrix of weighted MLR equations all feeding into a finalMLR model. This interlocking complexity allows for the ANNmodel to learn multiple paths to the same answer and createdifferent paths for shifts in input conditions that may occurwithout negatively impacting the accuracy of output classifica-tions.
There are several things to consider when comparing con-ceptually dichotomous classification models. One is perfor-mance (correct prediction) that demonstrates how the model iscapturing the description of the relationship between the in-puts and the defined output. The other is generalization (val-idation), which measures the strength of the descriptive modelto accurately predict a known outcome for an observation notseen during the fitting or training processes. Both of these mustbe evaluated with respects to the overall correct predictionsand correct predictions within a class (sensitivity and selectiv-ity) and with an understanding of the confidence one has in thecorrectness of the data classifications. Overall performanceand total numbers of correct prediction may be misleading, asa correctly performing model should strike a balance betweensensitivity (correctly identifying a positive response) and selec-tivity (correctly predicting a negative response). With unequalnumbers of positive and negative observations, it is possible tohave a high overall correct percentage but very poor perfor-mance for one of the classifications. In the data provided, ADVhad a good split between the proportion of positive and neg-ative samples (40:60) while NLV and EV were skewed withmore negative findings than positive (85% and 82%, respec-
tively). Therefore, for these virus types, it was important toevaluate not only the overall correct classification but the se-lectivity and sensitivity when evaluating performance.
The ANN models demonstrated superior performance incomparison to the MLR models repeatedly. In total, therewere nine performance comparisons that could be made be-tween the MLR and ANN models (Table 4) where the com-bined database and all data were used to fit or train the re-spective models for three different virus groups. Whenmeasuring the sensitivity (number of observations where viruspresence was correctly predicted) and the selectivity (numberof observations where virus absence was correctly predicted),the ANN model was superior to the MLR six of six times.When looking at the total number of correct predictions foreach model per virus group, regardless of classification class,the ANN model was superior three of three times. ANN clearlyoutperformed the MLR modeling with more than 95% totalaccuracy for each virus group. The samples where virus was notdetected were predicted with greater precision than for wherevirus was present for both modeling efforts. Enterovirus pres-ence was least well predicted by ANN (76.4%) but still was animprovement over the MLR results reported by (54%) For-miga-Cruz et al. (6). The ANN approach was able to learn thecomplex relationships to a greater degree than MLR.
With regards to comparing generalization between the mod-els, the validation study provided an opportunity to evaluate ifthe fit or trained model could accurately predict the classifica-tion of observations not known to the model. There are sixways to compare the MLR to the ANN model results for ADVclassification presented in Table 6, and the ANN model wassuperior in terms of absolute accuracy for five of those six.First, the results of the fitting and training sets show that theANN model was more accurate in prediction in terms of sen-sitivity, selectivity, and total correct predictions than the MLRmodel. Of note is the fact that the MLR model was unable toidentify the most confident classification type, ADV presence,with much greater accuracy (83% versus 26%). This was notdue to the phenomenon of classification skew that has beenobserved by us to occur in MLR models, as there were 40% ofthe total observations that were positive, and then confirmed aspositive. The MLR model was unable to pick up this verystrong signal in the fitting of the model, and this was repeatedin the accuracy results for the validation set where only 26% ofthe confirmed positives are correctly identified. If one evalu-ated only the overall accuracy of the validation set, with the
TABLE 8. Country-specific differences in RSE values for ANN prediction of NLVa
RSE rankfor input Spain (NRSE) United Kingdom (NRSE) Sweden (NRSE)
1 Month (0.24) F-specific coliphages (0.29) Month (0.30)2 Mollusk (0.15) Somatic coliphages (0.19) B. fragilis phages (0.17)3 Somatic coliphages (0.15) Area (0.12) F-specific coliphages (0.17)4 Depuration (0.14) Mollusk (0.12) Somatic coliphages (0.17)5 Area (0.14) Depuration (0.11) E. coli (0.10)6 F-specific coliphages (0.10) E. coli (0.06) Area (0.08)7 E. coli (0.05) B. fragilis phages (0.06)8 B. fragilis phages (0.02) Month (0.05)
a NRSE is the normalized input of the absolute RSE value.
VOL. 71, 2005 ANN FOR DETECTING VIRUSES IN SHELLFISH 5251
on April 15, 2014 by guest
http://aem.asm
.org/D
ownloaded from

ANN model providing 65% accuracy compared to the MLRmodel’s 63%, this distinction would be lost.
The expanded dimensionality of the ANN model allows theuse of inputs that might not appear significant to simpler mod-els and provides a basis to recommend multiphage assay. TheANN modeling found value in input parameters that MLRneglected to find of significance. Of particular interest are thedifferences, and similarities, in the importance each modelingapproach assigned to the three phage groups. The MLRs re-ported by Formiga-Cruz et al. (6) did not find somatic coliph-ages to be significant for ADV or NLV type I prediction, butANN found the somatic coliphages to be the most significantinput parameter for all virus groups with the largest numericalimpact upon the output prediction. F-specific coliphages werefound by both ANN and MLR models to be linked to humanvirus presence, but the B. fragilis phages were more importantto the ANN model than to the MLR models. For predictingNLV, the B. fragilis phages were significant for the ANN, assignificant numerically as concentrations of F-specific coliph-ages, but B. fragilis phages were not found to be significant forthe NLVI and NLVII MLR models. Of the human viruses,only ADV was not significantly related to B. fragilis phages byANN modeling, a finding that was in agreement with the priorMLR modeling results. The phages that infect B. fragilis havebeen promoted by other researchers (21) as reliable indicatorsfor human wastes, and our results show a strong tie betweentheir presence and NLV and EV presence. It appears that onecannot choose between these indicator phage groups whendesigning a shellfish study, as they appear to be related differ-ently to the human viruses of concern.
Of as large an import as the differences between the relativesignificance of the input parameters are the similarities thatwere found between the modeling studies with regards to thesignificance of depuration to predicting viral presence. Theinsignificance of depuration as an input parameter is supportedby the study by Formiga-Cruz et al. (6) that found that depu-ration as currently commercially practiced was shown not toappreciably reduce either the levels of F-RNA bacteriophages,phages of B. fragilis, and somatic coliphages or the occurrenceof human pathogenic viruses in any of the countries shellfish.The insignificance of depuration to the modeling efforts issupported by the very low NRSE values and low ranking fordepuration as an input parameter for the ANN modeling donein this study. Clearly, it made little difference to the ANNmodel if depuration was practiced, and this agrees with thelack of phage and viral clearing found by Formiga-Cruz et al.(6) and by other researchers (1, 5, 20). The relative unimpor-tance of E. coli as an input parameter adds strength to theargument that reductions of E. coli cannot be relied upon todetermine the duration or effectiveness of depuration.
The application of ANN modeling for pathogen predictioncan provide a larger margin of safety around risk classificationsand can allow researchers to see if a strong pattern underliesthe data. The predictions produced by the ANN model sepa-rate the acceptance range for prediction values with greaterdistance than that found for MLR producing clusters of ob-servations at the ends of the 0–1 range. This type of linearcluster analysis on the prediction frequencies is one way that aresearcher can verify the existence of a strong pattern betweenthe inputs and desired output classification. It is a visual tool
that provides a means to check the strength of a model fordichotomous output classification by ANN or MLR modelingtechniques.
It has been said that ANN models are relatively insensitiveto the underlying distribution of the data, and often predictionefficiencies cannot be improved by additional data transforma-tion. However, in this study the prediction values for previouslyreported ANN modeling of NLV (2) were improved by apply-ing a second transformation by square root before normaliza-tion and by modifying the node activation function from thesigmoidal to the hyperbolic in the hidden layer (Table 2). TheANN model was improved to the point where prediction of allknown observations was nearly perfect, and the tendency is todrive the fit toward perfection. However, care should be ap-plied to prevent overtraining when applying ANN models anda balance must be struck between obtaining a perfect fit bymemorizing specific paths to the established outputs and gen-eralizing the underlying pattern between the inputs and theoutputs with acceptable precision. Because of the ability ofANN models to memorize, it is imperative that models be fit tosubsets of the data, and then their performance verified ondata not seen during training, when adequate numbers of ob-servations are available.
Because ANN models are data dependent, requiring moreindividual observations than normally required by simplermodeling and statistical methods, research projects that chooseto apply this technique, or those that may provide a databasefor future mining should be designed appropriately and thepotential impact of additional input parameters carefully con-sidered. The creation of an ANN database for modeling canget expensive, especially if a number of different potentialinput parameters are being measured. However, the ability ofANN models to capture changes in complex environmentalsystems between a few strongly related inputs and the modeledoutput that may be significantly modified by parameters thatother modeling techniques find insignificant, or worse thatintroduce lack of discrimination, has the potential to deepenour understanding of the relationships between pathogens andtheir indicators. Funding agencies need to be aware of theneed to provide long-term support to build the potentiallyexpensive databases that will be useful to applications of su-perior ANN modeling techniques.
Individual country ANN comparisons. The presence of NLVin mussels from Sweden appears to rely more heavily upontemporally associated input parameters than for shellfish fromSpain and the United Kingdom, with the B. fragilis phagesserving as a significant input for NLV presence prediction byANN models. The reliance upon time of year is in agreementwith Hernroth et al. (8) who noted the effect of spring thawingand runoff on the prevalence of human viruses from all Swed-ish harvesting areas tested. Comparing the MLR for Swedendone by Hernroth et al. (8) to that of Formiga-Cruz et al. (6)on the combined country data set, the relative importance of B.fragilis phages is reduced, with only F-specific coliphage show-ing significance in the combined regression results. The floodand thaw event that happened in Sweden during the time ofstudy had a unique influence on the underlying pattern be-tween indicators and this human virus that does not appearwhen the data from multiple countries are combined.
Differences between the underlying patterns between indi-
5252 BRION ET AL. APPL. ENVIRON. MICROBIOL.
on April 15, 2014 by guest
http://aem.asm
.org/D
ownloaded from
cators and pathogens between different countries support theidea that there is no ideal model that can be exported blindlyfrom one area to another, but that a localized approach beproposed and verified. There are many factors that may indi-vidualize the underlying patterns between the pathogen re-sponse to be modeled and the input variables. Some countriesmay wish to include variables that are of local import. In theoriginal database from the study by Formiga-Cruz et al. (6),there was information gathered on other potential input pa-rameters (pH, water temperature, salinity, oxygen content, andturbidity), which while not found to be useful for prediction ofviral presence in their study, may be significant locally. Theimpact of the aforementioned flood event in Sweden is a goodexample of the potential of some of these parameters to impactprediction models and river flow, or changes in river flow,could have been a valuable input parameter for the harvestbeds under study. The inclusion of the input variable month inthe ANN that resulted in improved prediction of NLV pres-ence supports this idea. Individual countries should developmonitoring based ANN models that utilize the indicators mostlinked to the pathogens in their environments, and that re-quires funding of intense localized study as well as large-scalecollaborations so discoveries can be made, and compared, onboth scales. Since larger databases, obtained by combiningdata from multiple areas, allow researchers and policy analyststo expand their understanding of general indicator pathogenrelationships, ANN modeling could be applied as a new way toevaluate if databases from geographically separate areasshould be combined, rather than relying upon statistical meth-ods that are very sensitive to the underlying data distribution.
Conclusions. ANN modeling can provide insight into therelationships between viral pathogens and their indicators.Analysis of different groups of bacteriophage and the bacteriathey infect may yet provide the basis for viral shellfish qualitycontrol, especially when used in a combined indicator systemthat is attuned to unique geographic and temporal character-istics through the application of ANN and other advancedmodeling techniques. The ideal set of indicators and inputparameters for modeling has yet to be defined, and is likelysubject to some geographical differences, but this study showsthat ANN models can provide improved description and moreaccurate prediction of viral presence than MLR models on thesame set of input parameters where the number of data ob-servations is adequate for their training. In the same way thatthe number of samples are built into the sampling scheme forresearch utilizing traditional statistical methods, studies plan-ning on applying ANN models must assure that enough obser-vations are obtained to support training and validation studiesso that model performance is evaluated on generalization aswell as overall accuracy, sensitivity, and selectivity. The find-ings of this study, and our experience with other studies utiliz-ing microbial databases, suggest that the utility of ANNs bemore widely explored, in concert with traditional statisticalmethods, to obtain the most benefit from environmental stud-ies.
ACKNOWLEDGMENTS
This research was supported by Commission of the European Com-munities, Agriculture and Fisheries (FAIR) project CT98-4039, and
United States Environmental Protection Agency (STAR) projectR830376.
REFERENCES
1. Abad, F. X., R. M. Pinto, R. Gajardo, and A. Bosch. 1997. Viruses in mussels:public health implications and depuration. J. Food Prot. 60:677–681.
2. Brion, G. M., S. Lingireddy, T. R. Neelakantan, M. Wang, R. Girones, D.Lees, A. Allard, and A. Vantarakis. 2004. Probing Norwalk-like virus pres-ence in shellfish with artificial neural networks. Water Sci. Technol. 50(1):125–129.
3. Brion, G. M., T. R. Neelakantan, and S. Lingireddy. 2002. A neural networkbased classification scheme for sorting sources and ages of fecal contamina-tion in water. Water Res. 36:3765–3774.
4. Donovan, T. J., S. Gallacher, N. J. Andrews, M. H. Greenwod, J. Graham,J. E. Russell, D. Roberts, and R. Lee. 1998. Modification of the standardmethod used in the United Kingdom for counting Escherichia coli in livebivalve molluscs. Commun. Dis. Public Health 1:188–196.
5. Dore, W. J., and D. Lees. 1995. Behavior of Escherichia coli and male-specificbacteriophage in environmentally contaminated bivalve molluscs before andafter depuration. Appl. Environ. Microbiol. 61:2830–2834.
6. Formiga-Cruz, M., A. K. Allard, A. C. Conden-Hansson, K. Henshilwood,B. E. Hernroth, J. Jofre, D. N. Lees, F. Lucena, M. Papapetropoulou, R. E.Rangdale, A. Tsibouxi, A. Vantarakis, and R. Girones. 2003. Evaluation ofpotential indicators of viral contamination in shellfish and their applicabilityto diverse geographical areas. Appl. Environ. Microbiol. 69:1556–1563.
7. Formiga-Cruz, M., G. Tofino-Quesada, S. Bofill-Mas, D. N. Lees, K. Hen-shilwood, A. K. Allard, A. C. Conden-Hansson, B. E. Hernroth, A. Vantara-kis, A. Tsibouxi, M. Papapetropoulou, M. D. Furones, and R. Girones. 2002.Distribution of human viral contamination in shellfish from different growingareas in Greece, Spain, Sweden, and the United Kingdom. Appl. Environ.Microbiol. 68:5990–5998.
8. Hernroth, B. E., A.-C. Conden-Hansson, A.-S. Rehnstam-Holm, R. Girones,and A. K. Allard. 2002. Environmental factors influencing human viralpathogens and their potential indicator organisms in the blue mussel, Mytilusedulis: the first Scandiavian report. Appl. Environ. Microbiol. 68:4523–4533.
9. Hopfield, J. J. 1982. Neural networks and physical systems with emergentcollective computational abilities. Proc. Natl. Acad. Sci. USA 79:2554–2558.
10. International Organization for Standardization. 1996. Water quality. De-tection and enumeration of bacteriophages, part 1: enumeration of F-specificRNA bacteriophages. ISO 10705-1. International Organization for Stan-dardization, Geneva, Switzerland.
11. International Organization for Standardization. 1999. Water quality. De-tection and enumeration of bacteriophages, part 2: enumeration of somaticcoliphages. ISO/FDIS 10705-2. International Organization for Standardiza-tion, Geneva, Switzerland.
12. International Organization for Standardization. 1999. Water quality. De-tection and enumeration of bacteriophages, part 4: enumeration of bacte-riophages infecting Bacteroides fragilis. ISO/DIS 10705-4. International Or-ganization for Standardization, Geneva, Switzerland.
13. Kim, C. Y., G. J. Bae, S. W. Hong, C. H. Park, H. K. Moon, and H. S. Shin.2001. Neural network based prediction of ground surface settlements due totunneling. Comput. Geotechnics 28:517–547.
14. Lee, R. J., and O. C. Morgan. 2003. Environmental factors influencing themicrobiological contamination of commercially harvested shellfish. WaterSci. Technol. 47(3):65–70.
15. Masters, T. 1993. Practical neural network recipes in C��. Academic Press,Boston, Mass.
16. Neurosort Ver II. 2004. Department of Civil Engineering, University ofKentucky, Lexington.
17. Rippey, S. R. 1994. Infectious diseases associated with molluscan shellfishconsumption. Clin. Microbiol. Rev. 7:419–425.
18. Rumelhart, D. E., G. E. Hinton, and R. J. Williams. 1986. Learning internalrepresentation by error propagation, p. 318–362. In D. E. Rumelhart andJ. L. McClelland (ed.), Parallel distributed processing: explorations in themicrostructure of cognition, vol. 1. MIT Press, Cambridge, Mass.
19. Sarle, W. S. (ed.). 1997. Neural Network FAQ, part 3 of 7: generalization.Periodic posting to the Usenet newsgroup comp.ai.neural-nets, ftp://ftp.sas.com/pub/neural/FAQ3.html#questions.
20. Schwab K. J., F. H. Neill, M. K. Estes, T. G. Metcalf, and R. L. Atmar. 1998.Distribution of Norwalk virus within shellfish following bioaccumulation andsubsequent depuration by detection using RT-PCR. J. Food Prot. 61:1674–1680.
21. Scott, T. M., J. B. Rose, T. M. Jenkins, S. R. Farrah, and J. Lukasik. 2002.Microbial source tracking: current methodology and future directions. Appl.Environ. Microbiol. 68:5796–5803.
VOL. 71, 2005 ANN FOR DETECTING VIRUSES IN SHELLFISH 5253
on April 15, 2014 by guest
http://aem.asm
.org/D
ownloaded from
Copyright © 2022 FDOKUMEN