Determination of paralytic shellfish toxins in shellfish by receptor binding assay: Collaborative...
18
V an Dolah et al.: Journal of aoaC InternatIonal Vol. 95, no. 3, 2012 795 Determination of Paralytic Shellfish Toxins in Shellfish by Receptor Binding Assay: Collaborative Study Frances M. V an Dolah, spencer e. Fire, T oD a. leighFielD, chrisTina M. Mikulski, and gregory J. DouceTTe Center for Coastal Environmental Health and Biomolecular Research, NOAA Marine Biotoxins Program, 219 Fort Johnson Rd, Charleston, SC 29412 Collaborators: Å. Andersson; L. Bean; D. Couture; S. DeGrasse; A. DeLeon; V. Dell’Ovo; L. Flewelling; P. Holland; G. Langlois; R. Lewis; M. Masuda; P. McNabb; C. Mikulski; B. Niedzwiadek; B. Porntepkasemsan; D. Rawn; E. Sombrito; K. Srisuksawad; B. Suarez; S. Subsinserm; A. Tubaro Submitted for publication December 3, 2011. The recommendation was approved by the Method Committee on Paralytic Shellfish Toxins as First Action. See “Methods News,” (2011) Inside Laboratory Management, January/February issue. This publication does not constitute an endorsement of any commercial product or intend to be an opinion beyond scientific or other results obtained by the National Oceanic and Atmospheric Administration (NOAA). No reference shall be made to NOAA, or this publication furnished by NOAA, to any advertising or sales promotion which would indicate or imply that NOAA recommends or endorses any proprietary product mentioned herein, or which has as its purpose an interest to cause the advertised product to be used or purchased because of this publication. Corresponding author’s e-mail: [email protected] DOI: 10.5740/jaoacint.CS2011_27 FOOD CHEMICAL CONTAMINANTS A collaborative study was conducted on a microplate format receptor binding assay (RBA) for paralytic shellfish toxins (PST). The assay quantifies the composite PST toxicity in shellfish samples based on the ability of sample extracts to compete with 3 H saxitoxin (STX) diHCl for binding to voltage- gated sodium channels in a rat brain membrane preparation. Quantification of binding can be carried out using either a microplate or traditional scintillation counter; both end points were included in this study. Nine laboratories from six countries completed the study. One laboratory analyzed the samples using the precolumn oxidation HPLC method (AOAC Method 2005.06) to determine the STX congener composition. Three laboratories performed the mouse bioassay (AOAC Method 959.08). The study focused on the ability of the assay to measure the PST toxicity of samples below, near, or slightly above the regulatory limit of 800 (µg STX diHCl equiv./kg). A total of 21 shellfish homogenates were extracted in 0.1 M HCl, and the extracts were analyzed by RBA in three assays on separate days. Samples included naturally contaminated shellfish samples of different species collected from several geographic regions, which contained varying STX congener profiles due to their exposure to different PST-producing dinoflagellate species or differences in toxin metabolism: blue mussel (Mytilus edulis) from the U.S. east and west coasts, California mussel (Mytilus californianus) from the U.S. west coast, chorito mussel (Mytilus chiliensis) from Chile, green mussel (Perna canaliculus) from New Zealand, Atlantic surf clam (Spisula solidissima) from the U.S. east coast, butter clam (Saxidomus gigantea) from the west coast of the United States, almeja clam (Venus antiqua) from Chile, and Atlantic sea scallop (Plactopecten magellanicus) from the U.S. east coast. All samples were provided as whole animal homogenates, except Atlantic sea scallop and green mussel, from which only the hepatopancreas was homogenized. Among the naturally contaminated samples, five were blind duplicates used for calculation of RSD r . The interlaboratory RSD R of the assay for 21 samples tested in nine laboratories was 33.1%, yielding a HorRat value of 2.0. Removal of results for one laboratory that reported systematically low values resulted in an average RSD R of 28.7% and average HorRat value of 1.8. Intralaboratory RSD r , based on five blind duplicate samples tested in separate assays, was 25.1%. RSD r obtained by individual laboratories ranged from 11.8 to 34.9%. Laboratories that are routine users of the assay performed better than nonroutine users, with an average RSD r of 17.1%. Recovery of STX from spiked shellfish homogenates was 88.1–93.3%. Correlation with the mouse bioassay yielded a slope of 1.64 and correlation coefficient (r 2 ) of 0.84, while correlation with the precolumn oxidation HPLC method yielded a slope of 1.20 and an r 2 of 0.92. When samples were sorted according to increasing toxin concentration (µg STX diHCl equiv./kg) as assessed by the mouse bioassay, the RBA returned no false negatives relative to the 800 µg STX diHCl equiv./kg regulatory limit for shellfish. Currently, no validated methods other than the mouse bioassay directly measure a composite toxic potency for PST in shellfish. The results of this interlaboratory study demonstrate that the RBA is suitable for the routine determination of PST in shellfish in appropriately equipped laboratories. P aralytic shellfish poisoning (PSP) is caused by a suite of heterocyclic guanidinium toxins collectively called saxitoxins (STXs). Currently more than 21 congeners of STX are known; they occur in varying proportions in the dinoflagellates that produce them and may be further
-
Upload
independent -
Category
Documents
-
view
5 -
download
0
Transcript of Determination of paralytic shellfish toxins in shellfish by receptor binding assay: Collaborative...

Van Dolah et al.: Journal of aoaC InternatIonal Vol. 95, no. 3, 2012 795
Determination of Paralytic Shellfish Toxins in Shellfish by Receptor Binding Assay: Collaborative StudyFrances M. Van Dolah, spencer e. Fire, ToD a. leighFielD, chrisTina M. Mikulski, and gregory J. DouceTTeCenter for Coastal Environmental Health and Biomolecular Research, NOAA Marine Biotoxins Program, 219 Fort Johnson Rd, Charleston, SC 29412
Collaborators: Å. Andersson; L. Bean; D. Couture; S. DeGrasse; A. DeLeon; V. Dell’Ovo; L. Flewelling; P. Holland; G. Langlois; R. Lewis; M. Masuda; P. McNabb; C. Mikulski; B. Niedzwiadek; B. Porntepkasemsan; D. Rawn; E. Sombrito; K. Srisuksawad; B. Suarez; S. Subsinserm; A. Tubaro
Submitted for publication December 3, 2011.The recommendation was approved by the Method Committee on
Paralytic Shellfish Toxins as First Action. See “Methods News,” (2011) Inside Laboratory Management, January/February issue.
This publication does not constitute an endorsement of any commercial product or intend to be an opinion beyond scientific or other results obtained by the National Oceanic and Atmospheric Administration (NOAA). No reference shall be made to NOAA, or this publication furnished by NOAA, to any advertising or sales promotion which would indicate or imply that NOAA recommends or endorses any proprietary product mentioned herein, or which has as its purpose an interest to cause the advertised product to be used or purchased because of this publication.
Corresponding author’s e-mail: [email protected]: 10.5740/jaoacint.CS2011_27
FOOD CHEMICAL CONTAMINANTS
A collaborative study was conducted on a microplate format receptor binding assay (RBA) for paralytic shellfish toxins (PST). The assay quantifies the composite PST toxicity in shellfish samples based on the ability of sample extracts to compete with 3H saxitoxin (STX) diHCl for binding to voltage-gated sodium channels in a rat brain membrane preparation. Quantification of binding can be carried out using either a microplate or traditional scintillation counter; both end points were included in this study. Nine laboratories from six countries completed the study. One laboratory analyzed the samples using the precolumn oxidation HPLC method (AOAC Method 2005.06) to determine the STX congener composition. Three laboratories performed the mouse bioassay (AOAC Method 959.08). The study focused on the ability of the assay to measure the PST toxicity of samples below, near, or slightly above the regulatory limit of 800 (µg STX diHCl equiv./kg). A total of 21 shellfish homogenates were extracted in 0.1 M HCl, and the extracts were analyzed by RBA in three assays on separate days. Samples included naturally contaminated shellfish samples of different species collected from several geographic regions, which contained varying STX congener profiles due to their exposure to different PST-producing dinoflagellate species or differences in toxin metabolism: blue mussel (Mytilus edulis) from the U.S. east and west coasts, California mussel (Mytilus californianus) from the U.S. west coast, chorito mussel (Mytilus chiliensis) from Chile, green mussel (Perna canaliculus) from New Zealand,
Atlantic surf clam (Spisula solidissima) from the U.S. east coast, butter clam (Saxidomus gigantea) from the west coast of the United States, almeja clam (Venus antiqua) from Chile, and Atlantic sea scallop (Plactopecten magellanicus) from the U.S. east coast. All samples were provided as whole animal homogenates, except Atlantic sea scallop and green mussel, from which only the hepatopancreas was homogenized. Among the naturally contaminated samples, five were blind duplicates used for calculation of RSDr. The interlaboratory RSDR of the assay for 21 samples tested in nine laboratories was 33.1%, yielding a HorRat value of 2.0. Removal of results for one laboratory that reported systematically low values resulted in an average RSDR of 28.7% and average HorRat value of 1.8. Intralaboratory RSDr, based on five blind duplicate samples tested in separate assays, was 25.1%. RSDr obtained by individual laboratories ranged from 11.8 to 34.9%. Laboratories that are routine users of the assay performed better than nonroutine users, with an average RSDr of 17.1%. Recovery of STX from spiked shellfish homogenates was 88.1–93.3%. Correlation with the mouse bioassay yielded a slope of 1.64 and correlation coefficient (r2) of 0.84, while correlation with the precolumn oxidation HPLC method yielded a slope of 1.20 and an r2 of 0.92. When samples were sorted according to increasing toxin concentration (µg STX diHCl equiv./kg) as assessed by the mouse bioassay, the RBA returned no false negatives relative to the 800 µg STX diHCl equiv./kg regulatory limit for shellfish. Currently, no validated methods other than the mouse bioassay directly measure a composite toxic potency for PST in shellfish. The results of this interlaboratory study demonstrate that the RBA is suitable for the routine determination of PST in shellfish in appropriately equipped laboratories.
Paralytic shellfish poisoning (PSP) is caused by a suite of heterocyclic guanidinium toxins collectively called saxitoxins (STXs). Currently more than 21 congeners
of STX are known; they occur in varying proportions in the dinoflagellates that produce them and may be further

796 Van Dolah et al.: Journal of aoaC InternatIonal Vol. 95, no. 3, 2012
metabolized in shellfish that accumulate them, making analytical determination of paralytic shellfish toxins (PST) in shellfish complex. The long-standing regulatory method for PST is the AOAC mouse bioassay (1; AOAC Method 959.08), with a regulatory limit of 800 µg STX di HCl equiv./kg shellfish generally applied, but established at 400 µg STX diHCl equiv./kg in certain countries (e.g., the Philippines). However, at concentrations near the regulatory limit, the mouse bioassay can significantly underestimate PST in shellfish (2). This, in addition to increasing resistance to live animal testing in both the United States and the European Union (EU), has increased the need to develop alternative methods suitable for use in a high-throughput monitoring or regulatory setting.
In the past decade, several alternatives to the mouse bioassay have been developed. In the EU, the mouse bioassay remains the reference method for PST in shellfish, but European Commission (EC) Regulation 1664/2006 specifies that other internationally recognized methods may be used. Two HPLC methods, a precolumn oxidation method (3, 4; AOAC Method 2005.06) and a postcolumn oxidation method (5; AOAC Method 2011.02), have been approved by AOAC as Official MethodsSM
for PSP toxin analysis. The EC directive recognizes the precolumn oxidation HPLC method (AOAC Method 2005.06) as an alternative to the mouse bioassay, but retains the mouse bioassay as the reference method in instances where results are challenged. HPLC methods separate and quantify individual
STX congeners, which are then recombined according to their toxic equivalencies to yield a composite PST toxicity value. Although the HPLC methods perform well quantitatively, a high-throughput screening method capable of reporting toxic potency directly is still desirable for monitoring programs that often screen large numbers of negative samples. A qualitative lateral flow antibody test for PST with a reported detection limit of 400 µg STX equiv./kg was developed by Jellett Rapid Testing Ltd (Chester Basin, NS, Canada) and approved by the U.S. Interstate Shellfish Sanitation Conference and the U.S. Food and Drug Administration as a screening method in specific circumstances. This method performed well in a comparison study with the mouse bioassay (6), but is not fully quantitative and has not been subjected to a full AOAC collaborative trial. To date, a suitable quantitative, high-throughput alternative to the mouse bioassay has not been validated through the AOAC Official Methods Program. The receptor binding assay (RBA) for PST is an excellent candidate for fulfilling the requirements of a high-throughput, quantitative assay that directly reports a composite toxic potency.
The basis of the RBA is the interaction between the toxins and their pharmacological target. All STX congeners bind to site 1 on the alpha subunit of the voltage-gated sodium channel with binding affinities proportional to their toxic potency (7). Therefore, an RBA can quantitatively measure the combined toxic potency of mixtures of STX congeners in a sample,
Table 1. Shellfish homogenate samples analyzed for PSTs in the collaborative studya
Sample No. Sample ID Shellfish species and origin Blind duplicate
1 MLV05 Atlantic sea scallop (Plactopecten magellanicus) from the U.S. east coast x
2 MLV06 California mussel (Mytilus californianus) from the U.S. west coast x
3 MLV08 Green mussel (Perna canaliculus) from New Zealand
4 MLV09 Blue mussel (M. edulis) from the U.S. west coast x
5 MLV12 Blue mussel (M. edulis) east coast U.S., spiked with 200 µg/kg STX diHCl
6 MLV14 Blue mussel (M. edulis) east coast U.S., spiked with 1200 µg/kg STX diHCl
7 MLV16 Almeja clam (Venus antique) from Chile
8 MLV01 Surf clam (Spisula solidissima) from the U.S. east coast
9 MLV02 Chorito mussel (M. chiliensis) from Chile
10 MLV04 Scallop (Plactopecten magellanicus) from the U.S. east coast
11 MLV07 Blue mussel (M. edulis) east coast U.S. x
12 MLV09 Blue mussel (M. edulis) from the U.S. west coast x
13 MLV11 Almeja clam (Venus antique) from Chile clam x
14 MLV13 Blue mussel (M. edulis) east coast U.S., spiked with 500 µg/kg STX diHCl
15 MLV03 Chorito mussel (M. chiliensis) from Chile
16 MLV05 Atlantic sea scallop (Plactopecten magellanicus) from the U.S. east coast x
17 MLV06 California mussel (M. californianus) from the U.S. west coast x
18 MLV07 Blue mussel (M. edulis) east coast U.S. x
19 MLV10 Butterclam (Saxidomus gigantea) from the U.S. west coast
20 MLV11 Almeja clam (Venus antique) from Chile clam x
21 MLV15 Blue mussel (M. edulis) negative control, east coast U.S. a Sample number identifies the individual samples analyzed in the assays, with 1–7 analyzed in assay 1, 8–14 in assay 2, and
15–21 in assay 3. Sample identification (MLV for multilaboratory validation) describes the 16 unique samples, among which five were assayed as blind duplicates, to make a total of 21 samples. Blind duplicates, run in different assays, are identified by an “x.”

Van Dolah et al.: Journal of aoaC InternatIonal Vol. 95, no. 3, 2012 797
independent of the toxin congeners present (8). In the RBA for PST, tritiated STX ([3H] STX) competes with unlabeled STX and/or its congeners for a finite number of available receptor sites in a rat brain membrane preparation. Following establishment of binding equilibrium, unbound [3H] STX is removed by filtration and receptor bound [3H] STX quantified by liquid scintillation counting. The reduction in [3H] STX binding is directly proportional to the amount of unlabeled toxin present. A standard curve is generated using increasing concentrations of nonradiolabeled STX standard from 10–10 to 10–6 M STX. The concentration of toxin in samples is determined in reference to the standard curve.
The assay being tested in this collaborative trial is a modification of the method of Doucette et al. (9) to incorporate a 96-well microtiter plate format, which increases sample throughput and minimizes error by reducing sample handling and pipetting steps. This microplate PST RBA was evaluated in a single-laboratory validation (SLV) study (10), which established an interassay repeatability (RSDr) of 17.7% and good correlation with the mouse bioassay and precolumn oxidation HPLC methods. The toxin concentrations in shellfish tested in the SLV study ranged from near to well above the regulatory limit (approximately 900–15 000 µg STX diHCl equiv./kg). The current study focuses more specifically on the performance of the RBA in the critical range of shellfish toxicities below, near, and slightly above the regulatory limit (approximately 150–2400 µg STX diHCl equiv./kg).
The results of the collaborative study suggest that the RBA for PST is a suitable high-throughput screen for PST in shellfish. Although HPLC methods offer quantitative information on congener composition of samples, often the desired information is composite toxic potency, which requires the summation of individual congeners, corrected for their individual toxic equivalencies. The RBA provides a single integrated toxic potency value that reflects activity of all known and potential unknown congeners present in the sample. Use of the microtiter plate format, in conjunction with microplate scintillation counting, provides the ability to screen multiple samples simultaneously in a total assay time of less than 3 h. The assay format described in the current study provides for the quantitative determination of composite PST toxicity in seven shellfish extracts per 96-well microplate, each run in triplicate at three dilutions, covering toxicity ranges of approximately 35–6000 µg STX diHCl equiv./kg. In a high-throughput assay setting, multiple plates can be set up simultaneously, so that six assay plates can easily be accommodated each day by a single analyst, for a throughput of 42 samples/day. This compares favorably to an estimated throughput of 20–25 samples a day by the precolumn HPLC method (B. Niedzwiadek, Health Canada, personal communication) or 30–35 by mouse bioassay (B. Suarez, University of Chile, personal communication).
Collaborative Study
The focus of this study was to assess the performance of the RBA to determine PST toxicity in samples of commercially important shellfish at a range of concentrations below and above the regulatory limit. Twenty-one shellfish homogenates were included in the study, which represented 16 unique samples (Table 1). The homogenates included 12 naturally contaminated shellfish samples of different species collected from several
geographic regions: blue mussel (M. edulis) from the U.S. east and west coasts, California mussel (M. californianus) from the U.S. west coast, chorito mussel (M. chiliensis) from Chile, green mussel (Perna canaliculus) from New Zealand, Atlantic surf clam (Spisula solidissima) from the U.S. east coast, butter clam (Saxidomus gigantea) from U.S. west coast, almeja clam (Venus antiqua) from Chile, and Atlantic sea scallop (Plactopecten magellanicus) from the U.S. east coast. All samples were provided as whole animal homogenates, except Atlantic sea scallop and green mussel, which included hepatopancreas only. Among the naturally contaminated samples, five were blind duplicates tested on separate days that were used for calculation of RSDr. Samples run as duplicates are indicated in Table 1. Three samples consisting of STX-spiked mussel homogenate (M. edulis) at levels that bracketed the regulatory limits of 800 µg/kg (500 and 1200 µg/kg spike) and 400 µg/kg (200 µg/kg spike) were included to calculate recovery. One sample was the negative control homogenate of M. edulis to which the STX spikes were added. All homogenates were extracted by the study participants and the extracts analyzed by RBA in three assays on separate days.
Study Participants
Ten laboratories from seven countries agreed to carry out RBAs for this study, including the United States, Italy, Australia, New Zealand, Thailand, the Philippines, and South Africa. Participants included laboratories from regulatory authorities, as well as government and academic laboratories with monitoring needs. Five of the participating laboratories (Laboratories 1–5) have this method well established and may be considered routine users. Two laboratories had previous experience running this format of the PST RBA, but have not implemented it routinely. One laboratory had previous experience with receptor assays, but had not used the microplate filtration format of the assay. One laboratory had no previous experience with RBAs. Three laboratories from different countries, United States, Chile, and Thailand, carried out the AOAC official mouse bioassay method (AOAC Method 959.08) on the same set of samples. All mouse bioassay laboratories were experienced regulatory authorities with monitoring responsibilities. One laboratory (Health Canada) performed the precolumn oxidation HPLC method for PST (AOAC Method 2005.06).
Preparation of Homogenates
All shellfish samples were thoroughly homogenized using a polytron blender. For spiked samples, saxitoxin standard reference material (STX diHCl) was added to the specified concentration, and the sample was thoroughly rehomogenized to ensure homogeneity. The toxin congener profiles and concentrations of all samples were determined by the precolumn oxidation HPLC method (performed by Health Canada). STX equivalents were determined by mouse bioassay (performed by Maine Department of Marine Resources). Subsamples of each homogenate (12 g) were packaged in polycarbonate tubes and stored at –80°C until shipment to collaborating laboratories by courier. All samples were coded prior to distributing to collaborating laboratories, with the codes to each laboratory being unique, and provided blind. Coding consisted of two letters followed by a number in the form X A1-7, X B1-7, and

798 Van Dolah et al.: Journal of aoaC InternatIonal Vol. 95, no. 3, 2012
X C1-7, where the X indicated the laboratory, the second letter indicated the three assays to be conducted, and the numerical code indicated sample number within that assay. Three practice homogenates were similarly produced.
Shipment of Study Material
The following reagents were provided to the collaborating laboratories in a single shipment containing enough dry ice to keep the contents frozen for 5 days: [3H] STX; STX diHCl standard; rat brain membrane preparation; 21 coded shellfish homogenates; three practice homogenates; and a QC check sample consisting of 18 nM STX diHCl. Sufficient homogenate (12 g) was provided to ensure an accurate weight of material could be removed from the storage vial if an additional extraction were necessary due to unexpected circumstances. The identity of the samples was not released to collaborators. All reagents were received frozen and in good condition. Each participant received electronically a detailed assay protocol, comprehensive instructions for conducting the study and data reporting, and data reporting forms.
Analysis
Participants extracted all homogenates using a modification of the 0.1 M HCl extraction method used in the AOAC standard mouse bioassay protocol (modified only by scale). They were asked to perform three RBAs, each on separate days. Each assay consisted of one 96-well plate that included a standard curve, QC check sample, and seven shellfish extracts. All samples and standards were tested in triplicate wells. All shellfish extracts were run at three dilutions (1/10, 1/50, and 1/200), which ensured that at least one dilution would fall on the linear part of the standard curve. Participants were instructed to analyze samples coded A, B, or C in the first, second, or third assay, respectively, in numerical order. The five blind duplicate samples were coded so that they were tested in two independent assays, with the combination of assays differing between duplicates. Before performing the official study, participants were asked to run a practice assay that included three shellfish homogenates in the same format to ensure that any unexpected problems were encountered and addressed prior to the official study. The practice samples consisted of a negative control mussel homogenate (MLV15), and two naturally contaminated samples that were also included in the full study (MLV05 and MLV11). The identity of the practice samples was not made known to participants. Results of the practice run were submitted by e-mail to the coordinating laboratory for review before proceeding with the full study.
For the mouse bioassay, participants followed the AOAC official mouse bioassay method (AOAC Method 959.08), with the exception of a modified 0.1 M HCl extraction protocol used in the RBA protocol, which was modified only by scale so that 5 mL 0.1 M HCl was added to 5 g of shellfish homogenate, with all other aspects of the extraction protocol being identical. The HPLC laboratory followed the precolumn oxidation HPLC method for PST (AOAC Method 2005.06); however, final concentrations in µg/kg and µg STX equiv./kg were calculated using the formula weight of STX diHCl [372 daltons (da)], as opposed to the free base (299.3 da) in the standard HPLC protocol, to more directly compare with the RBA.
Data Analysis and Reporting
Participants were asked to report whether they used a standard or microplate scintillation counter for the study and, if a microplate counter was used, which model, because of differences in inherent counting efficiency between current commercially available counters. For data analysis, participants were instructed to use GraphPad Prism software (La Jolla, CA) or the on-board curve-fitting software provided with their microplate scintillation counter e.g., PerkinElmer Wallac MultiCalc (Gaithersburg, MD) or Packard Top Count software (Packard Instrument Co., Meriden, CT), and to report what software was used. For analysis, a four parameter logistic fit, also known as a sigmoidal dose response with variable slope, or Hill equation, was prescribed. Participants presented their analyzed data on the spreadsheet template provided, including assay quality parameters (slope, IC50, and quantification of the QC check sample), between-well CVs for each sample dilution that fell within the linear part of the standard curve (0.2–0.7 B/Bo), and calculated values for these samples in the well (nM), in the extract (µg STX equiv./mL), and in the shellfish tissue (µg STX equiv./kg). Participants were also asked to report all raw count data so that all results could be analyzed by the coordinating laboratory using identical software (GraphPad Prism 4.0) to assess whether systematic differences in quantification arose from using different curve-fitting software. All data were reported via e-mail to the coordinating laboratory.
The calculated results sheets were reviewed by the coordinating laboratory for obvious errors in dilutions and calculations and for use of the prescribed curve-fitting model. Obvious errors were corrected and the participant laboratory was consulted for concurrence. The reviewed results were then used for evaluation in the collaborative study.
Statistical Evaluation of the Collaborative Study
For each sample analyzed, outliers were first determined using the Grubbs test at a probability value of 1% (www.graphpad.com), with no more than one outlier removed, so that valid data remained from a minimum of eight laboratories. The mean, SR, and RSDR, and HorRat values were then calculated for each sample. For blind duplicates, the AOAC INTERNATIONAL Interlaboratory Study Workbook for Blind Duplicates, v2.0, was used to further evaluate for outliers and determine Sr and RSDr. GraphPad Prism was used to determine correlation among the RBA, mouse bioassay, and HPLC results.
AOAC Official Method 2011.27 Paralytic Shellfish Toxins (PSTs) in Shellfish
Receptor Binding Assay First Action 2011
[Applicable to the determination of paralytic shellfish toxins (PSTs), as µg STX diHCl equiv./kg, in shellfish (mussels, clams, scallops) at levels >149 µg STX diHCl equiv./kg, with a limit of detection (LOD) of 45 STX diHCl equiv./kg shellfish and a limit of quantification (LOQ) of 126 µg STX diHCl equiv./kg shellfish.]Caution: Wear disposable gloves and protective laboratory coat
while performing the assay. PSTs are neurotoxins that are harmful if ingested. The assay uses a tritium labeled tracer, [3H] STX, at low concentration.

Van Dolah et al.: Journal of aoaC InternatIonal Vol. 95, no. 3, 2012 799
All laboratories performing the assay must have approved radiation laboratory space and must follow procedures prescribed by their nuclear regulatory agency for receipt, use, and disposal of isotopes.
See Tables 2011.27A–E for results of the interlaboratory study supporting acceptance of the method.A. Principle
Test portions of shellfish homogenates are extracted using the AOAC mouse bioassay extraction protocol (959.08), modified by scale. The PST receptor assay is a competitive binding assay in which [3H] STX competes with unlabeled STX in standards or mixtures of PST in samples for a finite number of available receptor sites (site 1 on the voltage gated sodium channel) in a rat brain membrane preparation. Following establishment of binding equilibrium at 4°C, unbound [3H] STX is removed by filtration and bound [3H] STX is quantified by liquid scintillation counting. A standard curve is generated using increasing concentrations of STX standard from 10–10 to 10–6 M STX, which results in a reduction in bound [3H] STX that is directly proportional to the amount of unlabeled toxin present. The concentration of toxin in samples is determined in reference to the standard curve. Incubation is carried out in a microplate format to minimize sample handling and the amount of radioactivity used. Bound [3H] STX (as counts per minute; CPM) can be determined either by conventional or by microplate scintillation counting. Both methods are included in this protocol.B. Apparatus and Supplies
(a) Traditional or microplate scintillation counter.(b) Micropipettors.—1–1000 µL variable volumes and
disposable tips.(c) Eight channel pipettor.—5–200 µL variable volume and
disposable tips.(d) 96-Well microtiter filter plate.—With 1.0 µm pore size
type GF/B glass fiber filter/0.65 µm pore size Durapore support membrane (Millipore, Bedford, MA; Cat. No. MSFB N6B 50).
(e) MultiScreen vacuum manifold.—Millipore; Cat. No. NSVMHTS00.
(f) Vacuum pump.(g) Centrifuge tubes.—15 and 50 mL, conical, plastic.(h) Mini dilution tubes in 96-tube array.(i) Reagent reservoirs.(j) Ice bucket and ice.(k) Vortex mixer.(l) Sealing tape.—Millipore; Cat. No. MATA HCL00.(m) Volumetric flask.—1 L.(n) –80°C freezer.(o) Refrigerator.For traditional scintillation counter only:(p) MultiScreen punch device.—Millipore; Cat No. MAMP
096 08.(q) MultiScreen disposable punch tips.—Millipore; Cat. No.
MADP 196 10.(r) MultiScreen punch kit B for 4 mL vials.—Millipore; Cat.
No. MAPK 896 0B.(s) Scintillation vials.—4 mL.For sample extraction:(t) Pipets.(u) Centrifuge tubes.—15 mL, conical, plastic.
(v) Vacuum pump or house vacuum.(w) pH meter or pH paper.(x) Hot plate.(y) Graduated centrifuge tubes.—15 mL.(z) Centrifuge and rotor for 15 mL tubes.
C. Reagents
(a) [3H] STX.—0.1 mCi/mL, ≥10 Ci/mmol, ≥90% radiochemical purity (American Radiolabeled Chemicals, St. Louis, MO, or International Isotopes Clearinghouse, Leawood, KS).
(b) STX diHCl.—NIST RM 8642 (www.nist.gov).(c) 3-Morpholinopropanesulfonic acid (MOPS).—Sigma
(St. Louis, MO; Cat. No. M3183-500G), or equivalent.(d) Choline chloride.—Sigma (Cat. No. C7527-500G), or
equivalent.(e) Rat brain membrane preparation.—See Appendix.For traditional counter:(f) Scintiverse BD liquid scintillation cocktail.—Fisher
Scientific (Waltham, MA; Cat. No. SX-18), or equivalent.For microplate counter:(g) Optiphase liquid scintillation cocktail.—PerkinElmer
Life Sciences (Downers Grove, IL; Cat. No. 1200-139), or equivalent.
For sample extraction:(h) Hydrochloric acid (HCl).—1.0 and 0.1 M.(i) Sodium hydroxide.—0.1 M.(j) Water.—Distilled or deionized (18 µΩ).
D. Sample Extraction
Accurately weigh 5.0 g tissue homogenate into a tared 15 mL conical tube. Add 5.0 mL of 0.1 M HCl, vortex, and check pH. If necessary, adjust pH to 3.0–4.0 as determined by a pH meter or pH paper. To lower pH, add 1 M HCl dropwise with mixing; to raise pH, add 0.1 M NaOH dropwise with mixing to prevent local alkalinization and consequent destruction of toxin. Place the tube in a beaker of boiling water on a hot plate for 5 min with the caps loosened. Remove and cool to room temperature. Check pH and adjust cooled mixture to pH 3.0–4.0 as described above. Transfer entire contents to graduated centrifuge tube and dilute volumetrically to 10 mL. Gently stir contents to homogeneity and allow to settle until portion of supernatant is translucent and can be decanted free of solid particles. Pour approximately 5 to 7 mL of the translucent supernatant into a centrifuge tube. Centrifuge at 3000 × g for 10 min. Retain clarified supernatant and transfer to a clean centrifuge tube. Store extracts at –20°C until tested in receptor assay.
E. Preparation of Stock Solutions and Standards
(a) Assay buffer.—100 mM MOPS/100 mM choline chloride, pH 7.4. Weigh out 20.9 g MOPS and 13.96 g choline chloride and add to 900 mL dH2O. Adjust pH to 7.4 with NaOH while stirring and bring to a final volume of 1 L with dH2O. Store at 4°C.
(b) Radioligand solution.—Calculate the concentration of [3H] STX stock provided by the supplier, which may vary between lots. Suppliers generally provide the specific activity in Ci/mmol (generally 10–30 Ci/mmol) and activity in mCi/mL (0.05–0.1 mCi/mL), from which the molar concentration can be calculated. Prepare 4 mL of a 15 nM working stock of [3H] STX fresh daily in 100 mM MOPS/100 mM choline chloride

800 V
an D
ola
h et al.: Jo
ur
na
l of a
oa
C In
tern
atIo
na
l Vo
l. 95, no. 3, 2012
Table 2011.27A. Receptor binding assay results on individual samples (values are in μg STX diHCl equiv./kg shellfish tissue); summary statistics on all samples; summary statistics excluding Laboratory 9
Sample Lab All labs Labs 1–8
Assay No. ID 1 2 3 4 5 6 7 8 9 Mean SR RSDR, % HorRat Mean SR RSDR, % HorRat
Day 1 1 MLV05 370 610 620 410 690 1070 630 660 330 599 222 37.1 2.2 633 212 33.5 2.0
2 MLV06 1100 1340 1320 1440 1260 1720 2080 2130 890 1476 422 28.6 1.9 1549 386 24.9 1.7
3 MLV08 80 190 140 90 130 160 230 220 100 149 55 37.2 1.8 155 56 36.0 1.7
4 MLV09 860 680 950 870 980 1120 1460 820 590 926 255 27.5 1.7 968 237 24.5 1.5
5 MLV12 180a 200 200 150 150 100 150 290 100 168 62 37.2 1.8 177 60 34.1 1.7
6 MLV14 950 940 1060 1130 1040 750 1460 1320 810 1051 228 21.7 1.4 1081 224 20.7 1.3
7 MLV16 660 930 1080 870 840 1320 1490 2420b 490 960 329 34.3 2.1 1027 291 28.3 1.8
Day 2 8 MLV01 1360 1520 1580 1110 1700 3180 1400 2780 520 1683 818 48.6 3.3 1829 739 40.4 2.8
9 MVL02 830 1180 1130 1150 1130 1780 1340 980 690 1134 311 27.4 1.8 1190 281 23.6 1.5
10 MLV04 2440 2840 2910 1740 2150 1810 2690 2490 1210 2253 572 25.4 1.8 2384 446 18.7 1.3
11 MLV07 1260 1540 1220 1980 1760 1530 1660 1210 840 1444 345 23.9 1.6 1520 279 18.3 1.2
12 MLV09 810 1190 1130 810 1630 1390 1880 1120 870 1203 372 30.9 2.0 1245 375 30.1 2.0
13 MLV11 270 370 480 340 640 490 240 600 110 393 174 44.3 2.4 429 148 34.4 1.9
14 MLV13 400 1240b 560 450 650 530 500 440 200 466 133 28.5 1.6 504 85 16.8 1.0
Day 3 15 MLV03 330 270 410 180 590 680 370 1570b 90 365 197 54.0 2.9 404 176 43.5 2.4
16 MLV05 580 670 250 430 910 700 860 940 300 627 257 41.1 2.4 668 242 36.2 2.1
17 MLV06 1290 1520 1460 970 1800 2520 1470 870 1250 1461 488 33.4 2.2 1488 515 34.6 2.3
18 MLV07 1010 1600 1390 1000 1720 1860 1520 2150 890 1460 429 29.4 2.0 1531 397 26.0 1.7
19 MLV10 1640 2130 2800 2660 2330 1850 3390 2740 1830 2374 570 24.0 1.7 2443 569 23.3 1.7
20 MLV11 430 350 460 280 550 620 1149b 410 250 419 127 30.2 1.7 443 115 26.0 1.4
21 MLV15 NDc ND ND ND ND ND ND 180 ND — — — — — —
Avg. RSDR 33.2 28.7
Avg. HorRat 2.0 1.8a CV 41%; not used in calculations.b Outlier; not used in calculations.c ND = Not detected.

Van Dolah et al.: Journal of aoaC InternatIonal Vol. 95, no. 3, 2012 801
buffer. This will provide sufficient volume for one 96-well plate at an in-well concentration of 2.5 nM. Measure total counts of each working stock prior to running an assay: add 35 µL of the working stock [3H] STX in buffer to a liquid scintillation vial with 4 mL scintillant and count on a traditional liquid scintillation counter. This is done to confirm correct dilution prior to running the assay. Depending on the efficiency of the scintillation counter used, the corresponding CPM will vary, but should be consistent day-to-day and within 15% of the expected value.
(c) Unlabeled STX standard working solution.—The STX diHCl standard is provided at a concentration of 268.8 µM (100 µg/mL). A “bulk” standard curve can be made up in advance and stored at 4°C for up to 1 month. The use of a bulk standard curve minimizes the pipetting needed for setting up an assay routinely and improves day-to-day repeatability. Make up 3 mM HCl (e.g., from a 3 M stock, 50 µL in 50 mL), then perform the serial dilutions (see Table 2011.27F) of NIST RM 8642 STX diHCl (100 µg/mL = 268.8 µM) to make up the standard curve in 3 mM HCl. These standard stock solutions will be diluted 1/6 in the assay to yield the designated in-assay concentrations (see Table 2011.27F).
(d) Interassay calibration standard (QC check).—Prepare a reference standard containing 1.8 × 10⁻⁸ M STX standard (3.0 × 10⁻⁹ M STX in assay) in advance in 3 mM HCl and keep frozen (–80°C) in 1 mL aliquots for long-term storage. Aliquots should be thawed and stored at 4°C for routine use (stable up to 1 month) and analyzed in each assay. This serves as a QC check and confirms day-to-day performance of the assay.
(e) Rat brain membrane preparation.—Prepare rat brain membrane preparation in bulk (see Appendix: Rat Brain Membrane Preparation) and store at –80°C until used in the assay. Thaw an aliquot of rat brain membrane preparation on ice. Dilute membrane preparation with cold (4°C) 100 mM
MOPS/100 mM choline chloride, pH 7.4, to yield a working stock with a protein concentration of 1.0 mg/mL (this will be diluted in the assay plate to 0.5 mg/mL in-well concentration). Vortex vigorously to achieve a visibly homogeneous suspension. Keep the diluted membrane preparation on ice until ready to use.
F. Performing the Assay
(a) Plate setup.—When possible, use a multichannel pipet to minimize pipetting effort and increase consistency. Standard curve, QC check, and sample extracts are run in triplicate wells. Multiple dilutions of sample extracts should be analyzed in order to obtain a value that falls between 0.2–0.7 B/Bo on the standard curve for quantification. For ease of analysis, it is convenient to use a standard plate layout that maximizes the number of samples and standards that can be analyzed on one plate. For shellfish extracts, a minimum dilution of 1:10 is used, which minimizes potential matrix effects, while still providing an LOQ of approximately 126 µg/kg shellfish (see Table 2011.27G).
(b) Addition of samples and standards.—Add in the following order to each of the 96 wells: 35 μL assay buffer; 35 μL STX standard, QC check, or sample extract; 35 μL [3H] STX; 105 μL membrane preparation. The assay buffer is added first in order to wet the filter membrane. It is critical to continuously mix the membrane preparation by careful up-and-down pipetting immediately prior to dispensing into the 96-well plate to maintain an even suspension across the entire plate. Cover and incubate plate at 4°C for 1 h.
(c) Assay filtration.—Attach the vacuum manifold to the vacuum pump with an in-line side arm flask to catch filtrate from the plate filtration process. Set the vacuum pressure gauge on the pump or vacuum manifold to 4–8″ Hg (135–270 millibar), as specified in the instructions provided with the filtration plates. Place the 96-well plate on the vacuum manifold. Fill empty wells with 200 µL MOPS/choline chloride buffer to
Table 2011.27B. Summary statistics on blind duplicates, run in separate assays (values are in μg STX diHCl equiv./kg)
MLV05 MLV06 MLV07 MLV09 MLV11
Avg.Lab Assay 1 Assay 2 Assay 1 Assay 2 Assay 1 Assay 2 Assay 1 Assay 2 Assay 1 Assay 2
1 370 580 1100 1290 1260 1010 860 810 270 430
2 610 670 1340 1520 1540 1530 680 1190 370 350
3 620 250 1320 1460 1220 1390 950 1130 480 401
4 410 430 1440 970 1980 1000 870 810 340 280
5 690 910 1260 1790 1760 1720 980 1630 640 550
6 1070 700 1720 2520 1530 1860 1120 1390 490 620
7 630 880 2090 1240 1750 1150 1460 1830 230a 1149a
8 660 940 2130 870 1210 2150 820 1120 600 410
9 330 300 890 1250 840 890 590 870 110 250
Avg. 614 1453 1433 1062 416
Sr 169 432 366 247 83
SR 239 444 387 338 152
RSDr, % 27.5 29.4 25.5 23.3 20.0 25.1
RSDR,% 38.9 30.2 27.0 31.9 36.5 32.9
HorRat 2.3 2.0 1.8 2.0 2.0 2.0a Outlier; not used in calculation.

802 Van Dolah et al.: Journal of aoaC InternatIonal Vol. 95, no. 3, 2012
ensure even vacuum pressure and filtration across the plate. Turn on vacuum. Optimum vacuum will pull the wells to dryness in 2–5 s. Pull contents of all wells through until all liquid is removed. (Note: Too low a vacuum will result in slow well clearance, but too high will result in an airlock and no well clearance.) With vacuum pump running, quickly rinse each well twice with 200 μL ice cold MOPS/choline chloride buffer using multichannel pipet. Maintain vacuum until liquid is removed.
(d) Preparation of the assay for counting.—Remove the plastic bottom from the plate. Blot the bottom once on absorbent toweling.
(1) For counting in microplate scintillation counter.—Place the microplate in a counting cassette. Seal the bottom of the 96-well plate with sealing tape. Add 50 μL Optiphase scintillation cocktail per well using multichannel pipet. Seal the top of the plate with sealing tape. Allow to incubate 30 min at room temperature. Place the plate in a counting cassette and count in a microplate scintillation counter for 1 min/well.
(2) For counting in traditional scintillation counter.—Place the microplate in the MultiScreen punch system apparatus. Place the disposable punch tips on top of the microplate. Punch the filters from the wells into scintillation vials and fill with 4 mL scintillation cocktail (Scintiverse or equivalent). Place caps on the vials and vortex. Allow vials to sit overnight in the dark, then count using a tritium window in a traditional scintillation counter.G. Analysis of Data
For assays performed using the traditional counter, curve fitting is performed using a four-parameter logistic fit, also known as a sigmoidal dose response curve (variable slope; see Figure 2011.27), or Hill equation:
y = min +max − min
1 + 10(x−log∙EC50 Hill slope)
where max is the top plateau representing maximum binding in CPM in the absence of competing nonradiolabeled STX, also known as Bo; min is the bottom plateau, equal to nonspecific binding (in CPM) in the presence of saturating nonradiolabeled toxin; IC50 is the inhibitory concentration at which CPM are 50% of max-min (dashed lines; Figure 2011.27); Hill slope is the slope of the curve; x axis is the log concentration of STX; and y axis is total ligand binding in CPM (here represented as B/Bo, or bound/max bound). A curve fitting package such as Prism (GraphPad Software, Inc.) is recommended. For the microplate counter users, receptor
Table 2011.27C. Performance of individual laboratories on blind duplicates (values are in μg STX diHCl equiv./kg)
Lab ID Day 1 Day 2 Mean sr RSDr, %
1 MLV05 370 580 475 148 31.3
MLV06 1100 1290 1195 134 11.2
MLV07 1260 1010 1135 177 15.6
MLV09 860 810 835 35 4.2
MLV11 270 430 350 113 32.3
Avg. 18.9
2 MLV05 605 670 638 46 7.2
MLV06 1340 1520 1430 127 8.9
MLV07 1540 1530 1535 7 0.5
MLV09 680 1190 935 361 38.6
MLV11 370 350 360 14 3.9
Avg. 11.8
3 MLV05 620 250 435 262 60.1
MLV06 1320 1460 1390 99 7.1
MLV07 1220 1303 1262 59 4.7
MLV09 950 1130 1040 127 12.2
MLV11 480 460 470 14 3.0
Avg. 17.4
4 MLV05 410 430 420 14 3.4
MLV06 1440 970 1205 332 27.6
MLV07 1980 1000 1490 693 46.5
MLV09 870 810 840 42 5.1
MLV11 340 280 310 42 13.7
Avg. 19.2
5 MLV05 690 910 800 156 19.4
MLV06 1260 1790 1525 375 24.6
MLV07 1760 1720 1740 28 1.6
MLV09 980 1630 1305 460 35.2
MLV11 640 550 595 64 10.7
Avg. 18.3
6 MLV05 1070 700 885 262 29.6
MLV06 1720 2520 2120 566 26.7
MLV07 1530 1860 1695 233 13.8
MLV09 1120 1390 1255 191 15.2
MLV11 490 620 555 92 16.6
Avg. 20.4
7 MLV05 630 880 755 177 23.4
MLV06 2090 1240 1665 601 36.1
MLV07 1750 1150 1450 424 29.3
MLV09 1460 1830 1645 262 15.9
MLV11 230a 1150a
Avg. 26.2
8 MLV05 660 940 800 198 24.7
MLV06 2130 870 1500 891 59.4
MLV07 1210 2150 1680 665 39.6
MLV09 820 1120 970 212 21.9
MLV11 600 410 505 134 26.6
Avg. 34.4
Table 2011.27C. (continued)
Lab ID Day 1 Day 2 Mean sr RSDr, %
9 MLV05 330 300 315 21 6.7
MLV06 890 1250 1070 255 23.8
MLV07 840 890 865 35 4.1
MLV09 590 870 730 198 27.1
MLV11 110 250 180 99 55.0
Avg. 23.3
Overall avg. 22.2
a Outlier; not used in calculations.

Van Dolah et al.: Journal of aoaC InternatIonal Vol. 95, no. 3, 2012 803
assay applications provided by the manufacturer may be used (e.g., MultiCalc; PerkinElmer Wallac, Gaithersburg, MD).
(a) Sample quantification.—Sample quantification is carried out only on dilutions that fall within B/Bo of 0.2–0.7, where B represents the bound [3H]STX (in CPM) in the sample and Bo represents the max bound [3H]STX (in CPM). Where more than one dilution falls within B/Bo of 0.2–0.7 on the curve, all sample wells corresponding to these dilutions are used to calculate sample concentration. Sample concentration is calculated in μg STX diHCl equiv./kg shellfish, from the in-well nM concentration obtained from the curve fitting software using the following formulas:
(nM STX equiv) × (sample dilution) ×(210 μL total volume)
35 μL sample
= nM STX equiv in extract
(nM STX diHCl equiv. in extract) ×1 L
1000 mL ×372 ngnmol ×
1 μg1000 ng
= μg STX diHCl equiv./mL
1
μg STX diHCl equiv./mL × mL extractg shell�ish
× 1000 gkg
= μg STX diHCL equiv./kg
H. Assay Performance Standards
The following criteria must be met for assay acceptance:
Table 2011.27D. Calibration curve and QC check parameters in three receptor binding assays performed in nine participant laboratories
LabAssay day Slope
IC50,nM
QC, nM
Reference, CPM
IC70,nM
Standards where RSD >30%; action
Curve fitting software
Scintillation counter
Manual/microplate
1 1 –0.9 1.9 2.4 720 0.90 None Prism v 3.02 Packard Top Count
Microplate
2 –1.0 2.0 2.6 733 0.96 None
3 –1.1 2.1 3.2 1038 0.92 None
2 1 –1.1 1.8 3.8 1160 0.66 3 nM; 1 well removed Prism v 5.0 Packard Top Count
Microplate
2 –1.2 2.2 3.9 1260 0.85 None
3 –1.0 1.6 3.2 1262 0.46 3 nM, 1 nM removed
3 1 –1.0 2.0 2.3 2529 0.41 First column removed Prism v 5.0 Wallac Microbeta Microplate
2 –0.9 2.0 2.5 1463 0.92 1000 nM; 1 well removed
3 1.0 1.6 2.8 2088 0.80 None
4 1 –0.9 1.7 3.4 1125 0.61 None Prism v 3.03 PerkinElmer Tricarb
Manual
2 –1.2 1.7 3.2a 1611 0.77 None
3 –0.9 1.2 2.9 1324 0.45 30 nM 35%; 1 well removed
5 1 –0.9 1.4 3.3 1566 0.64 1.0 nM; 1 well removed MultiCalc Wallac Microbeta Microplate
2 –1.2 1.8 3.6 1528 1.05 0.1 nM and 30 nM; 1 well removed
3 –1.2 1.8 2.9 1052 0.67 None
6 1 –1.1 2.6 3.0 670 1.15 None Prism v 4.0 Wallac Microbeta Microplate
2 –1.0 2.0 4.0b 1124 1.08 None
3 –1.1 3.4 6.5b 1030 2.04c None
7 1 –0.8 1.0 2.8a 919 0.33 None Prism Wallac Microbeta Micropolate
2 –1.0 1.6 2.7 619 0.70 None
3 –0.9 2.1 3.2a 693 0.82 None
8 1 –1.2 1.7 3.7 1146 0.86 None Prism Wallac Microbeta Microplate
2 –1.1 1.4 1.5b 1095 0.78 None
3 –1.1 2.4 2.3 886 1.04 None
9 1 –1.0 2.2 4.0b 1363 0.97 None Prism Wallac Microbeta Microplate
2 –1.0 2.0 3.2 1380 0.85 100 nM 33%; left in
3 –1.0 2.1 3.7 1532 0.92 None a One well removed.b Outside of specifications.c Outlier by Grubbs test.

804 Van Dolah et al.: Journal of aoaC InternatIonal Vol. 95, no. 3, 2012
(a) For a ligand that specifically binds at one receptor site, the slope of the resulting competition curve should theoretically be –1.0. If the slope of the curve for a given assay is outside of the acceptable range of –0.8 to –1.2, linearity of the assay will be compromised and quantification of the unknowns will be incorrect.
(b) RSDs of triplicate CPMs for standards should be below 30% as variability may affect the slope calculation and thereby quantification of samples.
(c) If the IC50 is out of the acceptable range (2.0 nM ± 30%) then the assay should be considered suspect and rerun, as a shift in the curve will result in over- or underestimation of sample concentrations.
(d) QC check should be 3 nM STX ± 30% (in-well concentration). Assays with a QC check sample out of specifications should trigger a check of the IC50 value.
The following criteria must be met for acceptability of a sample measurement:
(a) Sample quantification should be done only on dilutions that fall within B/Bo of 0.2–0.7. In the event that all sample dilutions fall below B/Bo 0.2 (i.e., concentration is too high), further dilutions must be made and the sample reanalyzed. In the event that the sample concentration is too low to be quantified (i.e., B/Bo > 0.7), the sample is reported as below LOD. If more
Table 2011.27E. Results of the receptor binding assay (RBA), mouse bioassay (MBA), and HPLC analyses of 21 shellfish extracts, sorted by mouse bioassay value (all values are in μg STX diHCl equiv./kg shellfish tissue; results in bold indicate toxicity above the 800 μg STX diHCl equiv./kg regulatory limit; all other results indicate toxicity below the regulatory limit)
Sample Lab 1 Lab 2 Lab 3 Lab 4 Lab 5 Lab 6 Lab 7 Lab 8 Lab 9 RBA, avg. HPLC MBA
21 NDa ND ND ND ND ND ND ND ND ND ND ND
5 180 200 200 150 150 100 150 290 100 168 108 ND
15 330 270 410 180 590 680 370 1570b 90 365 196 182
13 270 370 480 340 640 290 240 600 110 371 236 299
20 430 350 460 280 550 490 1150b 410 250 403 236 299
14 400 1240b 560 450 650 530 500 440 200 466 625 343
1 370 610 620 410 690 1070b 630b 660 330 599 413 387
16 580 670 250 430 910 700 860b 940b 300 627 413 387
3 80 190 140 90 130 160 230 220 100 149 341 405
6 950 940 1060 1130 1040 750 1460 1320 810 1051 618 485
7 660 930 1080 870 840 1320 1490 2420 490 960 685 528
2 1100 1340 1320 1440 1260 1720 2080 2130 890 1476 931 595
17 1290 1520 1460 970 1800 2520 1470 870 1250 1460 931 595
4 860 680 950 870 980 1120 1460 820 590 926 1070 653
12 810 1190 1130 810 1630 1390 1880 1120 870 1203 1070 653
11 1260 1540 1220 1980 1760 1530 1660 1210 840 1444 965 714
18 1010 1600 1390 1000 1720 1860 1520 2150 890 1452 965 714
8 1360 1520 1580 1110 1700 3180 1400 2780 520 1683 894 752
9 830 1180 1130 1150 1130 1780 1340 980 690 1134 802 792
19 1640 2130 2800 2660 2330 1850 3390 2740 1830 2374 2000 102710 2440 2840 2910 1740 2150 1800 2690 2490 1210 2252 1890 1080a ND = Not detected.b Outlier; not used in average calculation.
Table 2011.27F. Dilution series to prepare bulk solutions for standard curve
Stock, M In-assay, M
100 µL 268.8 µM STX + 4.38 mL 0.003 M HCl
6 × 10⁻⁶ 1 × 10⁻⁶
500 µL 6 × 10⁻⁶ M + 4.5 mL 0.003 M HCl
6 × 10⁻⁷ 1 × 10⁻⁷
1.5 mL 6 × 10⁻⁷ M + 3.5 mL 0.003 M HCl
1.8 × 10⁻⁷ 3 × 10⁻⁸
500 µL 6 × 10⁻⁷ M + 4.5 mL 0.003 M HCl
6 × 10⁻⁸ 1 × 10⁻⁸
500 µL 1.8 × 10⁻⁷ M + 4.5 mL 0.003 M HCl
1.8 × 10⁻⁸ 3 × 10⁻⁹
500 µL 6 × 10⁻⁸ M + 4.5 mL 0.003 M HCl
6 × 10⁻⁹ 1 × 10⁻⁹
500 µL 6 × 10⁻⁹ M + 4.5 mL 0.003 M HCl
6 × 10⁻¹⁰ 1 × 10⁻¹⁰
5 mL 0.003 M HCl 0 Reference

Van Dolah et al.: Journal of aoaC InternatIonal Vol. 95, no. 3, 2012 805
than one dilution falls on the linear part of the curve, an average value calculated from all dilutions should be used. If there is disagreement between different dilutions in final concentration reported, check for error in the sample dilution process.
(b) RSD of the sample CPMs should be ≤30%.
Reference: J. AOAC Int. 95, 795(2012)
Results and Discussion
Sample Characterization
All shellfish homogenates (MLV1–16) were analyzed by
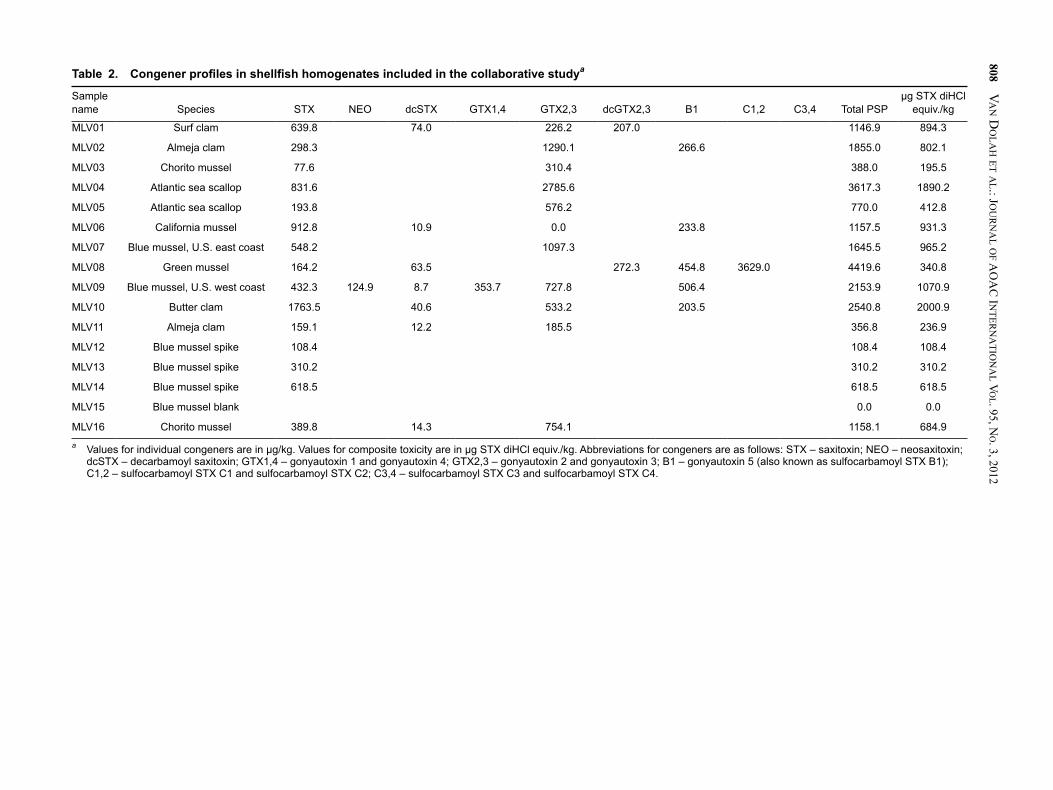
HPLC using the precolumn oxidation method (AOAC Method 2005.06) to determine toxin congener profiles and quantify total PST as µg STX diHCl equiv./kg prior to initiation of the study (Table 2). It is noteworthy that the clear majority of samples, irrespective of shellfish species and location, were dominated largely by STX and GTX2,3 whereas the N1-hydroxylated congeners NEO and GTX1,4 were virtually absent, except in blue mussel from the U.S. west coast. The most unusual profile was observed in green mussel, which was dominated by the weakly toxic N-sulfo-carbamoyl congeners C1,2. The samples were analyzed by the AOAC mouse bioassay (AOAC Method 959.08) by three laboratories that routinely perform the mouse bioassay for regulatory purposes (Table 3). The mouse bioassay detection limit is approximately 400 µg STX diHCl equiv./kg (one laboratory reported values as low as 290 µg STX equiv./kg). Because the study design included samples that bracketed the lower regulatory limit of 400 µg STX diHCl equiv./kg, several samples were reported as being below the mouse bioassay detection limit. For samples in which all values were above the detection threshold, the between-laboratory RSDR of the mouse bioassay was 18.9%.
Data Reporting and Initial RBA Data Review
Nine of the 10 laboratories that received the study materials completed the study and reported results. All nine carried out the practice assay and reported results to the coordinating laboratory, which evaluated the results and provided feedback to the participating laboratories before initiating the full study. Following completion of the full study, the participating laboratories provided all raw and calculated data for each of
Figure 2011.27. Sigmoidal dose response curve. Dashed lines indicate log IC50.
Table 2011.27G. Recommended microplate layout for ease of handling triplicate wells of standard curve, QC check sample, and unknown samples; each sample is run at three dilutions (1:10, 1:50, 1:200); standard curve is run in columns 1–3 (values are in M STX)a
Microplate column
Microplate row 1 2 3 4 5 6 7 8 9 10 11 12
A 10–6 10–6 10–6 QC QC QC U31:50
U31:50
U31:50
U61:10
U61:10
U61:10
B 10–7 10–7 10–7 U11:10
U11:10
U11:10
U31:200
U31:200
U31:200
U61:50
U61:50
U61:50
C 3 × 10⁻⁸ 3 × 10⁻⁸ 3 × 10⁻⁸ U11:50
U11:50
U11:50
U41:10
U41:10
U41:10
U61:200
U61:200
U61:200
D 10–8 10–8 10–8 U11:200
U11:200
U11:200
U41:50
U41:50
U41:50
U71:10
U71:10
U71:10
E 3 × 10⁻⁹ 3 × 10⁻⁹ 3 × 10⁻⁹ U21:10
U21:10
U21:10
U41:200
U41:200
U1:200
U71:50
U71:50
U71:50
F 10–9 10–9 10–9 U21:50
U21:50
U21:50
U51:10
U51:10
U51:10
U71:200
U71:200
U71:200
G 10–10 10–10 10–10 U21:200
U21:200
U21:200
U51:50
U51:50
U51:50
H REF REF REF U3 1:10
U3 1:10
U3 1:10
U5 1:200
U5 1:200
U5 1:200
a REF = Reference; QC = quality control check; U = unknown sample. [Note: The same standard curve may be used for multiple plates (i.e., 11 samples can be run on subsequent plates in a series if the standard curve is not included).]
806 Van Dolah et al.: Journal of aoaC InternatIonal Vol. 95, no. 3, 2012
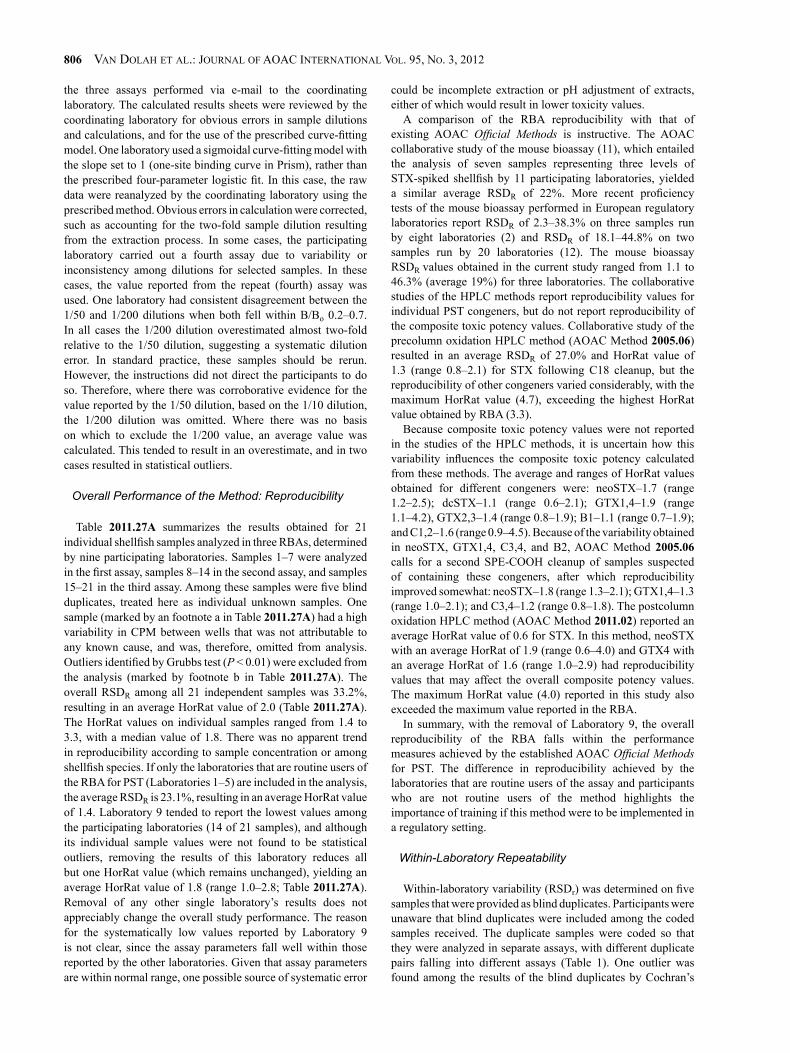
the three assays performed via e-mail to the coordinating laboratory. The calculated results sheets were reviewed by the coordinating laboratory for obvious errors in sample dilutions and calculations, and for the use of the prescribed curve-fitting model. One laboratory used a sigmoidal curve-fitting model with the slope set to 1 (one-site binding curve in Prism), rather than the prescribed four-parameter logistic fit. In this case, the raw data were reanalyzed by the coordinating laboratory using the prescribed method. Obvious errors in calculation were corrected, such as accounting for the two-fold sample dilution resulting from the extraction process. In some cases, the participating laboratory carried out a fourth assay due to variability or inconsistency among dilutions for selected samples. In these cases, the value reported from the repeat (fourth) assay was used. One laboratory had consistent disagreement between the 1/50 and 1/200 dilutions when both fell within B/Bo 0.2–0.7. In all cases the 1/200 dilution overestimated almost two-fold relative to the 1/50 dilution, suggesting a systematic dilution error. In standard practice, these samples should be rerun. However, the instructions did not direct the participants to do so. Therefore, where there was corroborative evidence for the value reported by the 1/50 dilution, based on the 1/10 dilution, the 1/200 dilution was omitted. Where there was no basis on which to exclude the 1/200 value, an average value was calculated. This tended to result in an overestimate, and in two cases resulted in statistical outliers.
Overall Performance of the Method: Reproducibility
Table 2011.27A summarizes the results obtained for 21 individual shellfish samples analyzed in three RBAs, determined by nine participating laboratories. Samples 1–7 were analyzed in the first assay, samples 8–14 in the second assay, and samples 15–21 in the third assay. Among these samples were five blind duplicates, treated here as individual unknown samples. One sample (marked by an footnote a in Table 2011.27A) had a high variability in CPM between wells that was not attributable to any known cause, and was, therefore, omitted from analysis. Outliers identified by Grubbs test (P < 0.01) were excluded from the analysis (marked by footnote b in Table 2011.27A). The overall RSDR among all 21 independent samples was 33.2%, resulting in an average HorRat value of 2.0 (Table 2011.27A). The HorRat values on individual samples ranged from 1.4 to 3.3, with a median value of 1.8. There was no apparent trend in reproducibility according to sample concentration or among shellfish species. If only the laboratories that are routine users of the RBA for PST (Laboratories 1–5) are included in the analysis, the average RSDR is 23.1%, resulting in an average HorRat value of 1.4. Laboratory 9 tended to report the lowest values among the participating laboratories (14 of 21 samples), and although its individual sample values were not found to be statistical outliers, removing the results of this laboratory reduces all but one HorRat value (which remains unchanged), yielding an average HorRat value of 1.8 (range 1.0–2.8; Table 2011.27A). Removal of any other single laboratory’s results does not appreciably change the overall study performance. The reason for the systematically low values reported by Laboratory 9 is not clear, since the assay parameters fall well within those reported by the other laboratories. Given that assay parameters are within normal range, one possible source of systematic error
could be incomplete extraction or pH adjustment of extracts, either of which would result in lower toxicity values.
A comparison of the RBA reproducibility with that of existing AOAC Official Methods is instructive. The AOAC collaborative study of the mouse bioassay (11), which entailed the analysis of seven samples representing three levels of STX-spiked shellfish by 11 participating laboratories, yielded a similar average RSDR of 22%. More recent proficiency tests of the mouse bioassay performed in European regulatory laboratories report RSDR of 2.3–38.3% on three samples run by eight laboratories (2) and RSDR of 18.1–44.8% on two samples run by 20 laboratories (12). The mouse bioassay RSDR values obtained in the current study ranged from 1.1 to 46.3% (average 19%) for three laboratories. The collaborative studies of the HPLC methods report reproducibility values for individual PST congeners, but do not report reproducibility of the composite toxic potency values. Collaborative study of the precolumn oxidation HPLC method (AOAC Method 2005.06) resulted in an average RSDR of 27.0% and HorRat value of 1.3 (range 0.8–2.1) for STX following C18 cleanup, but the reproducibility of other congeners varied considerably, with the maximum HorRat value (4.7), exceeding the highest HorRat value obtained by RBA (3.3).
Because composite toxic potency values were not reported in the studies of the HPLC methods, it is uncertain how this variability influences the composite toxic potency calculated from these methods. The average and ranges of HorRat values obtained for different congeners were: neoSTX–1.7 (range 1.2–2.5); dcSTX–1.1 (range 0.6–2.1); GTX1,4–1.9 (range 1.1–4.2), GTX2,3–1.4 (range 0.8–1.9); B1–1.1 (range 0.7–1.9); and C1,2–1.6 (range 0.9–4.5). Because of the variability obtained in neoSTX, GTX1,4, C3,4, and B2, AOAC Method 2005.06 calls for a second SPE-COOH cleanup of samples suspected of containing these congeners, after which reproducibility improved somewhat: neoSTX–1.8 (range 1.3–2.1); GTX1,4–1.3 (range 1.0–2.1); and C3,4–1.2 (range 0.8–1.8). The postcolumn oxidation HPLC method (AOAC Method 2011.02) reported an average HorRat value of 0.6 for STX. In this method, neoSTX with an average HorRat of 1.9 (range 0.6–4.0) and GTX4 with an average HorRat of 1.6 (range 1.0–2.9) had reproducibility values that may affect the overall composite potency values. The maximum HorRat value (4.0) reported in this study also exceeded the maximum value reported in the RBA.
In summary, with the removal of Laboratory 9, the overall reproducibility of the RBA falls within the performance measures achieved by the established AOAC Official Methods for PST. The difference in reproducibility achieved by the laboratories that are routine users of the assay and participants who are not routine users of the method highlights the importance of training if this method were to be implemented in a regulatory setting.
Within-Laboratory Repeatability
Within-laboratory variability (RSDr) was determined on five samples that were provided as blind duplicates. Participants were unaware that blind duplicates were included among the coded samples received. The duplicate samples were coded so that they were analyzed in separate assays, with different duplicate pairs falling into different assays (Table 1). One outlier was found among the results of the blind duplicates by Cochran’s

Van Dolah et al.: Journal of aoaC InternatIonal Vol. 95, no. 3, 2012 807
test, P < 0.025 (Laboratory 7, sample MLV11) using the AOAC INTERNATIONAL Interlaboratory Study Workbook for Blind Duplicates, v2.0. An overall RSDr of 25.1% was observed, with an RSDR of 32.9%, yielding a HorRat value of 2.0, similar to that of the overall study (Table 2011.27B). When the performance of individual laboratories was evaluated separately, the average RSDr was 22.2%, with individual laboratories varying from 11.8 to 34.4% (Table 2011.27C). Routine users of the microplate format of the PST RBA (Laboratories 1–5) obtained an average RSDr of 17.1%, which is similar to that obtained in the SLV study (10), and lower than that obtained by nonroutine users (Laboratories 6–9), which averaged 26.1% and ranged as high as 34.4%. The AOAC collaborative study of the mouse bioassay (11) did not report RSDr; however, analysis of the data from that study using AOAC INTERNATIONAL’s Interlaboratory Study Workbook for Blind Duplicates results in an average RSDr of 16.5% for three STX-spiked samples. Proficiency testing of the mouse bioassay performed in eight French laboratories reported an average RSDr of 8.3% on three samples (2). The analysis of blind duplicates in the collaborative study of the precolumn oxidation HPLC method (AOAC Method 2005.06) resulted in an RSDr of 15.2% for STX following SPE C18 cleanup and an average RSDr of 16.4% across all congeners, which ranged from 6.0 to 31.7%. Following SPE–COOH cleanup, repeatability was similar, with RSDr of 17.2% across all congeners. The intralaboratory repeatability values obtained in the postcolumn oxidation HPLC method (AOAC Method 2011.02) averaged 6.4% for STX; most other congeners were similar, with neoSTX being the only congener that showed a somewhat higher RSDr of 23.3%.
In summary, the within-laboratory repeatability of the RBA was found to be acceptable, with all but two laboratories achieving an RSDr of 23.3% or less, and the routine users of the assay achieving an average RSDr of 17.1%.
Spike Recovery
Three samples included in the study were homogenates of blue mussel spiked with STX diHCl at concentrations intended to bracket the regulatory limits of 800 µg STX equiv./kg used by most countries and 400 µg STX equiv./kg imposed in the Philippines. Nominal concentrations in the spiked samples were 200, 500, and 1200 µg STX equiv./kg. Also included in the study was the blue mussel homogenate to which the STX spikes had been added, which was determined to be negative for STX by the precolumn oxidation HPLC method. The negative control homogenate was reported as nondetectable by eight of nine laboratories. Recovery of spiked STX by the RBA was 84.4, 93.3, and 88.1%, respectively, for the 200, 500, and 1200 µg STX diHCl equiv./kg spike levels, and yielded a slope of 0.87 and r2 of 0.86 (Figure 2). In the current study, the mouse bioassay reported < detection limit, and 68.6 and 40.5% recovery for the 200, 500, and 1200 µg STX diHCl equiv./kg spike levels. The AOAC collaborative study of the mouse bioassay (11) reported recoveries of 62.3% at spike levels similar to those in the current study (equivalent to 1000 µg STX diHCl equiv./kg) but higher recoveries of 81.5 and 96.0% were achieved at higher spike levels equivalent to 4000 and 8000 µg STX diHCl equiv./kg.
The observed poor recovery in the mouse bioassay at concentrations near and below the regulatory limit has been observed in other studies (2), and has been attributed to a
salt or protective effect of the shellfish matrix, which, for concentrations at or below the regulatory limit of 800 µg/kg, is injected undiluted into the mouse. The spike recovery observed in the precolumn HPLC method in this study is also somewhat low, with 54.0, 62, and 51.5% recovery at the 200, 500, and 1200 µg STX diHCl equiv./kg spike levels, respectively. The AOAC collaborative study of the precolumn HPLC method reported 74.4–76.8% at similar spike levels following SPE C18 cleanup and 63.7–68.2% following SPE-COOH cleanup (3, 4). In comparison, the postcolumn HPLC method reported 88–104% recovery of STX spiked at levels somewhat lower than the current study. The higher recovery of the RBA than the HPLC method in the current study may reflect the use of the 0.1 M HCl extraction method in the RBA as compared to the acetic acid extraction used in the HPLC methods.
We previously established in the SLV study that the RBA performs well with shellfish extracted using either method (10). In that study, the RBA reported slightly higher toxicity values for shellfish extracts made using the 0.1 M HCl method than the acetic acid extraction, yielding a correlation of 0.99 with a slope of 1.23 (10). The higher toxicity reported by the RBA in 0.1 M HCl extracts may reflect the hydrolysis of less toxic congeners to more toxic congeners.
Assay Parameters and Quality Metrics
Table 2011.27D summarizes the assay parameters and quality metrics for all laboratories. Eight of nine laboratories used microplate scintillation counters. Laboratory 4 used the manual counting method in which the microplate well filters are punched out, using an eight-place punch system, into traditional 4 mL scintillation vials and counted. Its performance using the manual counting method (RSDr 17.4%) was similar to or better than that of the laboratories using the microplate method, indicating that using the manual counting method does not affect the performance of the assay. Similarly, there was no apparent difference in assay parameters when the Packard Top Count (single detector) was used, compared to the Wallac Microbeta (coincidence detector), although the reference CPM values obtained on the Top Count generally were somewhat lower due to differences in counting efficiency inherent in the differences in detector geometry. Eight of nine laboratories used GraphPad Prism for curve-fitting, while only Laboratory 5 used Wallac MultiCalc software. Values reported by Laboratory 5 fell well within the range of values reported by laboratories using Prism.
All assays resulted in slopes between –0.8 and –1.2, as specified in the protocol. This specification reflects the fact that in a competitive binding assay for a ligand that interacts specifically at a single receptor site, the slope of the resulting standard curve should theoretically be 1.0. Although curve-fitting software packages often include a one-site binding curve that fixes the slope at 1.0, we specified in the protocol the use of the four-parameter logistic fit (also known as sigmoidal dose-response with variable slope), because it more readily identifies problems with the standard curve that may skew results. Laboratory 9 reported results using a one-site binding curve fit; in this case, the coordinating laboratory recalculated their raw data using the four-parameter logistic fit. The protocol also calls for RSD% < 30 on all standards. Most analysts did not experience variability problems in the standard wells. Infrequent high RSDs were most often associated with the well
808 V
an D
ola
h et al.: Jo
ur
na
l of a
oa
C In
tern
atIo
na
l Vo
l. 95, no. 3, 2012
Table 2. Congener profiles in shellfish homogenates included in the collaborative studya
Sample name Species STX NEO dcSTX GTX1,4 GTX2,3 dcGTX2,3 B1 C1,2 C3,4 Total PSP
μg STX diHCl equiv./kg
MLV01 Surf clam 639.8 74.0 226.2 207.0 1146.9 894.3
MLV02 Almeja clam 298.3 1290.1 266.6 1855.0 802.1
MLV03 Chorito mussel 77.6 310.4 388.0 195.5
MLV04 Atlantic sea scallop 831.6 2785.6 3617.3 1890.2
MLV05 Atlantic sea scallop 193.8 576.2 770.0 412.8
MLV06 California mussel 912.8 10.9 0.0 233.8 1157.5 931.3
MLV07 Blue mussel, U.S. east coast 548.2 1097.3 1645.5 965.2
MLV08 Green mussel 164.2 63.5 272.3 454.8 3629.0 4419.6 340.8
MLV09 Blue mussel, U.S. west coast 432.3 124.9 8.7 353.7 727.8 506.4 2153.9 1070.9
MLV10 Butter clam 1763.5 40.6 533.2 203.5 2540.8 2000.9
MLV11 Almeja clam 159.1 12.2 185.5 356.8 236.9
MLV12 Blue mussel spike 108.4 108.4 108.4
MLV13 Blue mussel spike 310.2 310.2 310.2
MLV14 Blue mussel spike 618.5 618.5 618.5
MLV15 Blue mussel blank 0.0 0.0
MLV16 Chorito mussel 389.8 14.3 754.1 1158.1 684.9a Values for individual congeners are in µg/kg. Values for composite toxicity are in µg STX diHCl equiv./kg. Abbreviations for congeners are as follows: STX – saxitoxin; NEO – neosaxitoxin;
dcSTX – decarbamoyl saxitoxin; GTX1,4 – gonyautoxin 1 and gonyautoxin 4; GTX2,3 – gonyautoxin 2 and gonyautoxin 3; B1 – gonyautoxin 5 (also known as sulfocarbamoyl STX B1); C1,2 – sulfocarbamoyl STX C1 and sulfocarbamoyl STX C2; C3,4 – sulfocarbamoyl STX C3 and sulfocarbamoyl STX C4.

Van Dolah et al.: Journal of aoaC InternatIonal Vol. 95, no. 3, 2012 809
in column 1 of the 96-well plate. Most analysts removed the suspect well from the curve-fitting process. When the RSD for a given standard was near the stated cutoff (e.g., 31–33%), and left in the curve-fitting process, there was no apparent effect on the curve parameters listed as criteria for assay acceptance.
The average IC50 among all 27 assays was 1.9 + 0.45 nM (RSDR 23.5%). The other assay quality metric called for by the protocol is the analysis of the QC check sample, which should be 3 ± 0.9 nM STX (30% RSD, in-well concentration). Four of the 27 assays had QC values outside the stated limits, with no obvious error responsible for the variability. Among these, Laboratory 7 reported 6.5 nM for the QC check in assay 3 and an IC50 of 3.4 nM, which was outside the norm. Similarly, Laboratory 8 reported a QC of 1.5 nM in assay 2 and a low IC50 of 1.4 nM, which is at the lower edge of acceptability. In general practice, these values would trigger repeating the assay. However, because of the minimal number of laboratories participating in the study, both of these assays were retained in the study. In neither case were the reported sample values systematically higher or lower than those reported in the other assays.
LOD and LOQ
The LOD was calculated based on the measurement of the negative control shellfish matrix (MLV15) using the blank + 3 × SD approach according to Eurachem guidelines (13), as
recently applied to AOAC Method 2006.02, an ELISA for domoic acid in shellfish using a similar four-parameter logistic curve (14). All laboratories reported <dl for this sample using the prescribed cutoff of B/B0 <0.7 for quantification, with the exception of Laboratory 8, which was removed as an outlier as determined by Grubbs test (P < 0.01). If these samples are instead quantified using the B/B0 values obtained, a mean of 5.5 ng/mL is obtained with an SD of 5.7 ng/mL, resulting in an LOD of 45 µg STX diHCl equiv./kg. Using the blank + 10 × SD definition, an LOQ of 126 µg STX di HCl equiv./kg is thus obtained. We previously established empirically that a 1/10 dilution of shellfish extracts is sufficient to remove matrix effects in the RBA (10), when a quantification cutoff of B/B0 <0.7 is used. This is the basis for the ten-fold minimum sample dilution used in the current study. The IC70 values (B/B0 0.7) for all standard curves run in the study are presented in Table 2011.27D. An average of 0.80 ± 0.188 nM STX diHCl was obtained across all assays, following the removal of one outlier based on the Grubbs test (P < 0.01). Applying the blank + 3 × SD to this value, an LOD of 64 µg STX diHCl equiv./kg is obtained; applying the blank + 10 × SD to this value results in an LOQ of 131 µg STX diHCl equiv./kg for a sample diluted 1/10 and extracted as indicated in the study, in fair agreement with the value calculated above.
Correlation with HPLC and Mouse Bioassay
Comparison of the RBA results with the mouse bioassay
Table 3. Mouse bioassay results on collaborative study samples from three laboratoriesa
Sample No. Sample ID MBA Lab A MBA Lab B MBA Lab C MBA Avg. MBA sR MBA RSDR, %
1 MLV05 400 415 340 385 39.7 10.3
2 MLV06 550 597 540 562 30.4 5.4
3 MLV08 440 <dlb 370 405 49.5 12.2
4 MLV09 670 612 760 681 74.6 11.0
5 MLV12 <dl <dl <dl — — —
6 MLV14 489 489 480 486 5.2 1.1
7 MLV16 585 585 470 547 66.4 12.1
8 MLV01 750 716 600 689 78.6 11.4
9 MLV02 670 1115 590 792 282.9 35.7
10 MLV04 2040 <dl 1080 1560 678.8 43.5
11 MLV07 1480 748 670 966 446.8 46.3
12 MLV09 — 594 670 602 11.3 1.9
13 MLV11 380 379 <dl 380 — —
14 MLV13 <dl 343 <dl 343 — —
15 MLV03 400 364 <dl 382 — —
16 MLV05 — 396 370 383 18.4 4.8
17 MLV06 — 702 630 666 50.9 7.6
18 MLV07 — <dl 690 690 — —
19 MLV10 1320 890 870 1027 254.2 24.8
20 MLV11 — 364 290 327 52.3 16.0
21 MLV15 <dl <dl <dl — — —a Values are in µg STX diHCl equiv./kg.b dl = Detection limit.

810 Van Dolah et al.: Journal of aoaC InternatIonal Vol. 95, no. 3, 2012
results yielded an r2 of 0.84 and a slope of 1.64, indicating that the RBA reports somewhat higher STX equivalents in shellfish, relative to the mouse bioassay (Figure 3). This overestimate has been previously reported for both RBA and HPLC methods (2, 9) at the STX levels near or below the regulatory limit, which are the focus of the current study. Consistent with these findings, the HPLC method also reported higher values than the mouse bioassay in this study, with a slope of 1.33 and an r2 of 0.84. RBA results correlated better with the precolumn oxidation HPLC method, with a slope of 1.20 and an r2 of 0.92.
RBA Yielded No False Negatives Relative to the Regulatory Limit
When the data from the three methods were sorted by increasing µg STX diHCl equiv./kg as reported by the mouse bioassay, the RBA did not report any false negatives when compared to the regulatory limit of 800 µg STX equiv./kg (Table 2011.27E). When compared with the precolumn oxidation HPLC method, only Laboratory 9 reported values lower than the HPLC method. The fact that the RBA reports somewhat higher toxicity than the mouse bioassay or HPLC at levels near or below the regulatory limit is beneficial from a food safety standpoint. The higher values reported presumably arise from better recoveries, as demonstrated above. From a shellfish producer’s perspective, the improved detection limits relative to the mouse bioassay and better recovery of low toxin levels compared to the HPLC can help to provide advance warning of developing toxicity, allowing producers to harvest early, delay harvest, or move cultures, as appropriate.
Participants’ Comments
Laboratory 6 participated in the study without previous
experience running receptor assays, and in doing so, identified several points needing clarification that have since been added to the proposed Official Method as enumerated in this report: (1) The vacuum required for filtration was not specified at 4–8˝ Hg, which is critical because insufficient vacuum pressure results in too slow a clearance of the wells, whereas too much pressure results in an airlock and no filtration at all. (2) Scintillation counting time for the microplates is 1 min/well. (3) Instructions have been added regarding how to calculate sample concentration if more than one dilution falls within B/Bo 0.2–0.7; specifically, an average value should be calculated from all sample dilutions falling within B/Bo 0.2–0.7. When corrected for dilution, serial sample dilutions should yield similar quantification. The absence of linearity between sample dilutions indicates either error in dilution or sample matrix interference; however, at the minimum sample dilutions recommended in the proposed Official Method, matrix effects from shellfish homogenates have not been encountered (10). In the current study, the nonlinearity of dilutions experienced in several samples by Laboratory 8 was not observed by the other laboratories, suggesting a systematic sample dilution issue rather than a sample matrix problem. Although experienced in RBAs in general, Laboratory 8 had not previously run the microplate filtration format of the assay for PST.
Laboratory 9, which reported generally lower values than the other laboratories, although familiar with the assay, had not performed it in more than a year. The lower values reported do not appear to be associated with conduct of the assay, or scintillation conduct of the assay, or scintillation counting, since the assay metrics are well within the averages reported by the other laboratories. Insufficient boiling or pH adjustment of sample extracts are a possible explanation. These points identified by the study participants should be added to the critical steps identified in the SLV study (10) that can affect precision and accuracy of the assay results, including: (1) ensure that the water is strongly boiling during extraction; (2) carefully adjust pH of extracts; (3) ensure even distribution of the membrane preparation across the microplate by frequent vortex-mixing or pipetting before and during its addition to the plate; (4) the wells must clear within 2–5 s during filtration; (5) the wash buffer should be ice-cold to minimize the rate of toxin release from the receptor; and (6) following addition of scintillant to the wells, incubate a minimum of 30 min to ensure that the scintillant fully penetrates the filters before counting.
Recommendations
The collaborative study of the RBA for PST was completed by nine laboratories representing six countries. Collaborators quantified PST as a composite toxicity value reported in µg STX di HCl equiv./kg in a variety of shellfish species from different regions of the world, containing varied toxin congener profiles. The study included laboratories with extensive experience as well as others with little or no previous experience. The study also included both microplate and scintillation counters as end points, because either instrument type could potentially be used by test laboratories. The study demonstrates that the RBA yields adequate repeatability, reproducibility, and recovery for routine determination and monitoring of PST in shellfish. The greater precision attained by laboratories that received prior training on the RBA and routinely implement this assay suggests that
Nominal Avg SR RSDR,% Recovery, %200 169 58 34.6 84.4500 466 133 28.5 93.31200 1057 228 21.7 88.1
slope = 0.87, r2 = 0.86
0 200 400 600 800 1000 1200 14000
250
500
750
1000
Expected, µg equiv./kg
Mea
sure
d,µ
g eq
uiv.
/kg
Figure 2. Recovery of spiked STX diHCl in homogenates of blue mussel. Values are in μg STX diHCl equiv./kg.

Van Dolah et al.: Journal of aoaC InternatIonal Vol. 95, no. 3, 2012 811
the overall interlaboratory reproducibility can be further improved. It is recommended that this method be accepted by AOAC INTERNATIONAL as Official First Action for the determination of PST in shellfish.
Acknowledgments
We would like to thank Laurie Bean (Maine Department of Marine Resources), Stacey DeGrasse (U.S. Food and Drug Administration), Patrick Holland (Cawthron Institute), Gregg Langlois (California Department of Health Services), Bob Lona (Washington State Department of Health), and Benjamin
Suarez (University of Chile) for providing the shellfish material used in the study. We are grateful to Barbara Niedzwiadek and Dorothea Rawn (Health Canada) for HPLC analyses and to Laurie Bean and Darcie Couture (Maine Department of Marine Resources), Benjamin Saurez, and Supanoi Subsinserm (Thailand Department of Fisheries) for performing mouse bioassays. We are indebted to the following collaborators for their dedication and perseverance in carrying out the RBAs for this study:
Leanne Flewelling, Florida Wildlife and Marine Research Institute, St. Petersburg, FL
Stacey DeGrasse, U.S. Food and Drug Administration, Center for Food Safety and Applied Nutrition, College Park, MD
Patrick Holland and Paul McNabb, Cawthron Institute, Nelson, New Zealand
Gregg Langlois and Melisa Masuda, California Department of Public Health, Richmond, CA
Richard Lewis and Åsa Andersson, University of Queensland, Queensland, Australia
Christina Mikulski, NOAA Marine Biotoxins Program, Charleston, SC
Elvira Sombrito and Aileen DeLeon (Philippine Nuclear Research Institute, Manila, the Philippines
Kanitha Srisuksawad and Boonsom Porntepkasemsan, Thailand Nuclear Research Institute, Bangkok, Thailand
Aurelia Tubaro and Valeria Dell’Ovo, Dipartimento dei Materiali e Risorse Naturali, Trieste, Italy
This project was funded by the International Atomic Energy Agency Interregional Project INT7017 9001 and NOAA Marine Biotoxins Program Project 02E0017. FDA saxitoxin diHCl used for tritiation by IICH and STX diHCl reference standard (NIST RM 8642) were provided by Sherwood Hall, FDA Office of Seafoods.
References
(1) Official Methods of Analysis (1999) 17th Ed., AOAC INTERNATIONAL, Gaithersburg, MD, Method 959.08
(2) LeDoux, M., & Hall, S. (2000) J. AOAC Int. 83, 305–310 (3) Lawrence, J.F., Niedzwiadek, B., & Menard, C. (2005) J. AOAC
Int. 88, 1714–1732 (4) Official Methods of Analysis (2005) 18th Ed., AOAC
INTERNATIONAL, Gaithersburg, MD, Method 2005.06 (5) Official Methods of Analysis (2011) AOAC INTERNATIONAL,
Gaithersburg, MD, Method 2011.02 (6) Jellett, J.F., Robert, R.L., Laycock, M.V., Quilliam, M.A., &
Barrett, R.E. (2002) Toxicon 40, 1407–1425. http://dx.doi.org/10.1016/S0041-0101(02)00153-8
(7) Hall, S., Strichartz, G., Moczydlowski, E., Ravindran, A., & Reichardt, P.B. (1990) in Marine Toxins: Origin, Structure and Molecular Pharmacology, S. Hall & G. Strichartz (Eds), ACS Symposium Series No. 418, American Chemical Society, Washington, DC, pp 29–65
(8) Llewellyn, L.E. (2006) Chem. Res. Toxicol. 19, 661–667. http://dx.doi.org/10.1021/tx050277i
(9) Doucette, G.J., Logan, M.L., Ramsdell, J.S., & Van Dolah, F.M. (1997) Toxicon 35, 625–636. http://dx.doi.org/10.1016/S0041-0101(96)00189-4
(10) Van Dolah, F.M., Leighfield, T.A., Doucette, G.J., Bean, L., Niedzwiadek, B., & Rawn, D.F.K. (2009) J. AOAC Int. 92, 1705–1713
(11) McFarran, E.F. (1959) J. AOAC Int. 42, 263–271(12) EU Reference Laboratory for Marine Biotoxins (2010) Report
Figure 2. Correlation of the RBA results on PSP toxins shellfish homogenates with mouse bioassay (A) and HPLC (B). Correlation between the current AOAC official methods, mouse bioassay and HPLC (C).
A.
B.
C. Slope = 1.33; r2 = 0.84
0 250 500 750 1000 1250 1500 17500
500
1000
1500
2000
2500
MBA, µg STX diHCl equiv./kg
HPL
C, µ
g ST
X di
HC
leq
uiv.
/kg
slope = 1.64, r2 = 0.84
0 250 500 750 1000 1250 1500 17500
500
1000
1500
2000
2500
MBA, µg STX diHCl equiv./kg
RB
A, µ
g ST
X di
HC
leq
uiv.
/kg
slope = 1.20, r2 = 0.92
0 250 500 750 1000 1250 1500 1750 20000
1000
2000
3000
HPLC, µg STX diHCl equiv./kg
RB
A u
g ST
X di
HC
l equ
iv.
/kg
Figure 3. Correlation of the RBA results on PSP toxins in shellfish homogenates with mouse bioassay (A) and HPLC (B). Correlation between the current AOAC Official Methods, mouse bioassay, and HPLC (C).

812 Van Dolah et al.: Journal of aoaC InternatIonal Vol. 95, no. 3, 2012
on the EURLMB 2010 proficiency testing on saxitoxin group (PSP) toxins determination, Vigo, Spain
(13) Eurachem Guide (1998) The Fitness for Purpose of Analytical Methods: A Laboratory Guide to Method Validation and Related Topics, http://www.eurachem.org/index.php/publications/guides/mv
(14) Kleivdahl, H., Kristiansen, S.-I., Nilson, M.A., Goksoyr, A., Briggs, L., Holland, P., & McNabb, P. (2007) J. AOAC Int. 90, 1011–1027
Appendix: Rat Brain Membrane Preparation
The rat brain membrane preparation used in this assay can be produced in bulk, aliquotted, and stored at –80°C until use. Under this storage condition, the preparation is stable for a minimum of 6 months. The following protocol provides sufficient membrane preparation for a minimum of 125 plates and can be scaled up or down as needed.A. Apparatus
(a) Teflon/glass homogenizer.—Motorized tapered Teflon pestle and glass tube, 15 mL.
(b) Motorized tissue homogenizer.—Polytron or small hand-held blender.
(c) High-speed centrifuge and fixed angle rotor.—Capable of 20 000 × g (rcf).
(d) Centrifuge tubes.—12–15 mL rated for >20 000 × g (rcf).(e) Plastic cryovials.—2 mL.(f) Graduated beaker.—300 or 500 mL.(g) Pipets.—Disposable 5 and 10 mL.(h) Forceps.
B. Reagents
(a) 20 Rat brains.—Male, 6-week-old Sprague-Dawley (Hilltop Lab Animals, Inc., Scottdale, PA; http://hilltoplabs.com) or equivalent.
(b) MOPS.—pH 7.4 (Sigma, St. Louis, MO; Cat. No. M3183-500G).
(c) Choline chloride.—100 mM (Sigma; Cat. No. C7527-500G).
(d) Phenyl methylsulfonyl fluoride (PMSF).—Sigma; Cat. No. P7626.
(e) Isopropanol.C. Procedure
(1) Prepare 1 L 100 mM MOPS buffer, pH 7.4, containing 100 mM choline chloride (detailed protocol in E, above) and 0.1 mM PMSF. PMSF must first be dissolved in isopropanol; dissolve 0.174 g PMSF in 10 mL isopropanol to make 100 mM stock. Aliquot and store at –20°C. Add PMSF (1/1000, 0.1 mM final concentration) to the MOPS/choline chloride buffer fresh on the day of use.
(2) Remove medulla and cerebellum from each brain using forceps and discard. Place the cerebral cortex (see Figure 1) in a small amount of ice-cold buffer and place on ice.
(3) Place one cerebral cortex in 12.5 mL MOPS/choline Cl/PMSF, pH 7.4, in glass/teflon homogenizer (two brains in 25 mL buffer will fit into 30 mL homogenizer tube). Homogenize at 70% full speed (385 rpm) with at least 10 up and down strokes (more if necessary to homogenize brain; there should be no visible chunks remaining in the homogenate). Keep tube in ice at all times. Pour homogenized tissue into 250 mL beaker on ice and repeat procedure with remaining cortices.
(4) Transfer pooled homogenized tissue to centrifuge tubes, balance the tubes (pairwise; use ice-cold buffer to balance), and centrifuge at 20 000 × g for 15 min at 4°C.
(5) Aspirate the supernatant and resuspend the pellets in ice-cold MOPS/choline Cl/PMSF buffer, using an adequate amount (~5 mL) to fully resuspend the pellet (can use clean glass stir rod to break up pellet), not exceeding 10 mL per brain.
(6) Pool resuspended membrane preparation in a small beaker. Rinse centrifuge tubes with a small amount of ice-cold buffer to recover all of the membrane preparation. Bring total volume to 200 mL total (keep on ice).
(7) Keeping the beaker on ice, Polytron (or use a small hand-held blender at low speed) at 70% full speed for 20 s to obtain a consistent homogenate.
(8) Aliquot 2 mL/tube into cryovials. It is critical to keep the preparation well mixed while dispensing, e.g., prior to each aliquot to ensure equal allocation of protein/receptors to each vial. Keep cryotubes on ice.
(9) Freeze and store at –80°C. This preparation is stable for at least 6 months. Use a permanent marker to label the preparation date on the storage container.
D. Protein Assay
(a) Determine protein concentration of membrane preparation using Pierce Micro BCA Protein Assay Reagent Kit No. 23235 (microplate method) or No. 23225 (tube method) protein assay kit or equivalent protein assay (Thermo Fisher, Rockford, IL). The above protocol should yield 6–8 mg protein/mL of rat membrane preparation.
(b) Determine membrane dilution needed for the assay. The protein concentration in the daily working stock for the assay should be 1 mg/mL (this is diluted in the assay to yield 0.5 mg/mL in-assay concentration). Based on the protein concentration determined in the protein assay, determine the dilution needed to achieve 1 mg/mL. This is the dilution used in section E(e) above for all assays using this lot of membrane preparation. The protocol above typically yields a protein concentration that requires a dilution of 1/6–1/8. (Do not use less than 1/4 dilution or filtration wells may become clogged.) Protein concentration will need to be determined for each new batch of membrane preparation.
cerebral cortex
cerebellum
medulla
cerebral cortex
cerebellum
medulla
Figure 1. Rat brain.