Development of an LC-MS/MS Method for ARV-110, a ... - MDPI
15
Citation: Nguyen, T.-T.-L.; Kim, J.W.; Choi, H.-I.; Maeng, H.-J.; Koo, T.-S. Development of an LC-MS/MS Method for ARV-110, a PROTAC Molecule, and Applications to Pharmacokinetic Studies. Molecules 2022, 27, 1977. https://doi.org/ 10.3390/molecules27061977 Academic Editor: Simona Goliˇ c Grdadolnik Received: 14 February 2022 Accepted: 17 March 2022 Published: 18 March 2022 Publisher’s Note: MDPI stays neutral with regard to jurisdictional claims in published maps and institutional affil- iations. Copyright: © 2022 by the authors. Licensee MDPI, Basel, Switzerland. This article is an open access article distributed under the terms and conditions of the Creative Commons Attribution (CC BY) license (https:// creativecommons.org/licenses/by/ 4.0/). molecules Article Development of an LC-MS/MS Method for ARV-110, a PROTAC Molecule, and Applications to Pharmacokinetic Studies Thi-Thao-Linh Nguyen 1,† , Jin Woo Kim 2,† , Hae-In Choi 2 , Han-Joo Maeng 1, * and Tae-Sung Koo 2, * 1 College of Pharmacy, Gachon University, 191 Hambakmoe-ro, Yeonsu-gu, Incheon 21936, Korea; [email protected] 2 Graduate School of New Drug Discovery and Development, Chungnam National University, Daejeon 34134, Korea; [email protected] (J.W.K.); [email protected] (H.-I.C.) * Correspondence: [email protected] (H.-J.M.); [email protected] (T.-S.K.); Tel.: +82-32-820-4935 (H.-J.M.); +82-42-821-8628 (T.-S.K.) † These authors contributed equally to this work. Abstract: ARV-110, a novel proteolysis-targeting chimera (PROTAC), has been reported to show satisfactory safety and tolerability for prostate cancer therapy in phase I clinical trials. However, there is a lack of bioanalytical assays for ARV-110 determination in biological samples. In this study, we developed and validated an LC-MS/MS method for the quantitation of ARV-110 in rat and mouse plasma and applied it to pharmacokinetic studies. ARV-110 and pomalidomide (internal standard) were extracted from the plasma samples using the protein precipitation method. Sample separation was performed using a C18 column and a mobile phase of 0.1% formic acid in distilled water–0.1% formic acid in acetonitrile (30:70, v/v). Multiple reaction monitoring was used to quantify ARV-110 and pomalidomide with ion transitions at m/z 813.4 → 452.2 and 273.8 → 201.0, respectively. The developed method showed good linearity in the concentration range of 2–3000 ng/mL with acceptable accuracy, precision, matrix effect, process efficiency, and recovery. ARV-110 was stable in rat and mouse plasma under long-term storage, three freeze-thaw cycles, and in an autosampler, but unstable at room temperature and 37 ◦ C. Furthermore, the elimination of ARV-110 via phase 1 metabolism in rat, mouse, and human hepatic microsomes was shown to be unlikely. Application of the developed method to pharmacokinetic studies revealed that the oral bioavailability of ARV-110 in rats and mice was moderate (23.83% and 37.89%, respectively). These pharmacokinetic findings are beneficial for future preclinical and clinical studies of ARV-110 and/or other PROTACs. Keywords: ARV-110; proteolysis-targeting chimera; LC-MS/MS; validation; stability; pharmacokinetics 1. Introduction As a promising and appealing technology for targeted protein degradation, proteolysis- targeting chimeras (PROTACs) offer a chemical knockdown strategy for a protein of interest (POI). The PROTAC approach was first proposed in 2001 by Sakamoto et al. [1] and re- markable developments have been made over the last 20 years [2,3]. Because PROTAC technology enables the elimination of the entire POI, it can potentially overcome the resis- tance to current treatments. In addition, as PROTACs act catalytically, the required doses of these compounds are much lower than those of conventional small molecules. Owing to their low susceptibility to the increased expression of POIs, PROTACs show impressive inhibition activity against some drug-resistant targets such as the androgen receptor (AR), the estrogen receptor, and Bruton’s tyrosine kinase [4]. Other advantages of PROTACs include the potential to target undruggable targets, such as the signal transducer and activator of transcription 3 (STAT-3), and the ability to influence non-enzymatic functions by degrading entire proteins [5]. PROTACs are heterobifunctional compounds consisting of a ligand of POI connected to a ligand of an E3 ubiquitin ligase through a linker. This molecular structure promotes Molecules 2022, 27, 1977. https://doi.org/10.3390/molecules27061977 https://www.mdpi.com/journal/molecules
-
Upload
khangminh22 -
Category
Documents
-
view
4 -
download
0
Transcript of Development of an LC-MS/MS Method for ARV-110, a ... - MDPI
�����������������
Citation: Nguyen, T.-T.-L.; Kim, J.W.;
Choi, H.-I.; Maeng, H.-J.; Koo, T.-S.
Development of an LC-MS/MS
Method for ARV-110, a PROTAC
Molecule, and Applications to
Pharmacokinetic Studies. Molecules
2022, 27, 1977. https://doi.org/
10.3390/molecules27061977
Academic Editor: Simona Golic
Grdadolnik
Received: 14 February 2022
Accepted: 17 March 2022
Published: 18 March 2022
Publisher’s Note: MDPI stays neutral
with regard to jurisdictional claims in
published maps and institutional affil-
iations.
Copyright: © 2022 by the authors.
Licensee MDPI, Basel, Switzerland.
This article is an open access article
distributed under the terms and
conditions of the Creative Commons
Attribution (CC BY) license (https://
creativecommons.org/licenses/by/
4.0/).
molecules
Article
Development of an LC-MS/MS Method for ARV-110, a PROTACMolecule, and Applications to Pharmacokinetic StudiesThi-Thao-Linh Nguyen 1,† , Jin Woo Kim 2,† , Hae-In Choi 2, Han-Joo Maeng 1,* and Tae-Sung Koo 2,*
1 College of Pharmacy, Gachon University, 191 Hambakmoe-ro, Yeonsu-gu, Incheon 21936, Korea;[email protected]
2 Graduate School of New Drug Discovery and Development, Chungnam National University,Daejeon 34134, Korea; [email protected] (J.W.K.); [email protected] (H.-I.C.)
* Correspondence: [email protected] (H.-J.M.); [email protected] (T.-S.K.); Tel.: +82-32-820-4935 (H.-J.M.);+82-42-821-8628 (T.-S.K.)
† These authors contributed equally to this work.
Abstract: ARV-110, a novel proteolysis-targeting chimera (PROTAC), has been reported to showsatisfactory safety and tolerability for prostate cancer therapy in phase I clinical trials. However,there is a lack of bioanalytical assays for ARV-110 determination in biological samples. In this study,we developed and validated an LC-MS/MS method for the quantitation of ARV-110 in rat andmouse plasma and applied it to pharmacokinetic studies. ARV-110 and pomalidomide (internalstandard) were extracted from the plasma samples using the protein precipitation method. Sampleseparation was performed using a C18 column and a mobile phase of 0.1% formic acid in distilledwater–0.1% formic acid in acetonitrile (30:70, v/v). Multiple reaction monitoring was used to quantifyARV-110 and pomalidomide with ion transitions at m/z 813.4→ 452.2 and 273.8→ 201.0, respectively.The developed method showed good linearity in the concentration range of 2–3000 ng/mL withacceptable accuracy, precision, matrix effect, process efficiency, and recovery. ARV-110 was stablein rat and mouse plasma under long-term storage, three freeze-thaw cycles, and in an autosampler,but unstable at room temperature and 37 ◦C. Furthermore, the elimination of ARV-110 via phase 1metabolism in rat, mouse, and human hepatic microsomes was shown to be unlikely. Application ofthe developed method to pharmacokinetic studies revealed that the oral bioavailability of ARV-110 inrats and mice was moderate (23.83% and 37.89%, respectively). These pharmacokinetic findings arebeneficial for future preclinical and clinical studies of ARV-110 and/or other PROTACs.
Keywords: ARV-110; proteolysis-targeting chimera; LC-MS/MS; validation; stability; pharmacokinetics
1. Introduction
As a promising and appealing technology for targeted protein degradation, proteolysis-targeting chimeras (PROTACs) offer a chemical knockdown strategy for a protein of interest(POI). The PROTAC approach was first proposed in 2001 by Sakamoto et al. [1] and re-markable developments have been made over the last 20 years [2,3]. Because PROTACtechnology enables the elimination of the entire POI, it can potentially overcome the resis-tance to current treatments. In addition, as PROTACs act catalytically, the required doses ofthese compounds are much lower than those of conventional small molecules. Owing totheir low susceptibility to the increased expression of POIs, PROTACs show impressiveinhibition activity against some drug-resistant targets such as the androgen receptor (AR),the estrogen receptor, and Bruton’s tyrosine kinase [4]. Other advantages of PROTACsinclude the potential to target undruggable targets, such as the signal transducer andactivator of transcription 3 (STAT-3), and the ability to influence non-enzymatic functionsby degrading entire proteins [5].
PROTACs are heterobifunctional compounds consisting of a ligand of POI connectedto a ligand of an E3 ubiquitin ligase through a linker. This molecular structure promotes
Molecules 2022, 27, 1977. https://doi.org/10.3390/molecules27061977 https://www.mdpi.com/journal/molecules
Molecules 2022, 27, 1977 2 of 15
the formation of a ternary complex of the POI, PROTAC, and E3, followed by an ubiq-uitination of POI. Subsequently, the ubiquitinated POI is recognized and degraded byendogenous 26S proteasome in eukaryotic cells [6]. There are more than 600 E3 ubiquitinligases. However, only several E3 ligases with small-molecule ligands have been used todevelop PROTACs, including the Von Hippel–Lindau disease tumor suppressor protein(VHL), cereblon (CRBN), the mouse double minute 2 homologue (MDM2), the inhibitor ofapoptosis proteins, and the Skp1-Cullin-F box complex containing Hrt1 [7].
Many PROTACs have been validated in preclinical stages [2]. ARV-110 (bavdegalu-tamide), was the first PROTAC to enter clinical trials in 2019, which targets AR for thetreatment of metastatic castration-resistant prostate cancer (mCRPC) [7]. Initially, the struc-ture of ARV-110 was speculated to contain an enzalutamide ligand and a VHL E3 ligaseligand [6]. However, the structure of ARV-110 was subsequently revealed to consist of aspecific AR ligand and a CRBN E3 ligand [8]. ARV-110 effectively degrades both wild-typeAR and anti-androgen-therapy-induced AR mutants after oral administration. In variousprostate cancer cell lines, ARV-110 degrades 95–98% of AR. Furthermore, compared withenzalutamide, ARV-110 exhibits similar efficacy at lower doses in wild-type AR models. Inresistance models, ARV-110 reduces tumor growth by 70–100% [6,9]. Preliminary data froma phase I clinical trial indicated that ARV-110 showed satisfactory safety and tolerability inpatients [10]. ARV-110 is currently in a phase II clinical trial (NCT03888612).
As ARV-110 is a potential candidate for mCRPC treatment, various clinical studiesshould be conducted, including dose-dependent pharmacokinetic and bioequivalencestudies. However, as no quantitative bioanalytical assays are currently available for ARV-110 determination in biological samples such as plasma, it is necessary to develop rapidand sensitive methods for ARV-110 quantitation. In the present study, we developed andvalidated a bioanalytical method for the determination of ARV-110 levels in mouse andrat plasma using LC-MS/MS. A protein precipitation method was employed to prepareplasma samples for analysis due to its advantages of simplicity, cost-effectiveness, minimalsamples loss, and feasibility of automation [11]. In addition, we applied the developedmethod to evaluate the in vitro metabolic stability of ARV-110 and the pharmacokineticprofiles of ARV-110 following oral (PO) and intravenous (IV) administration to mice andrats.
2. Results and Discussion2.1. LC-MS/MS Method Development
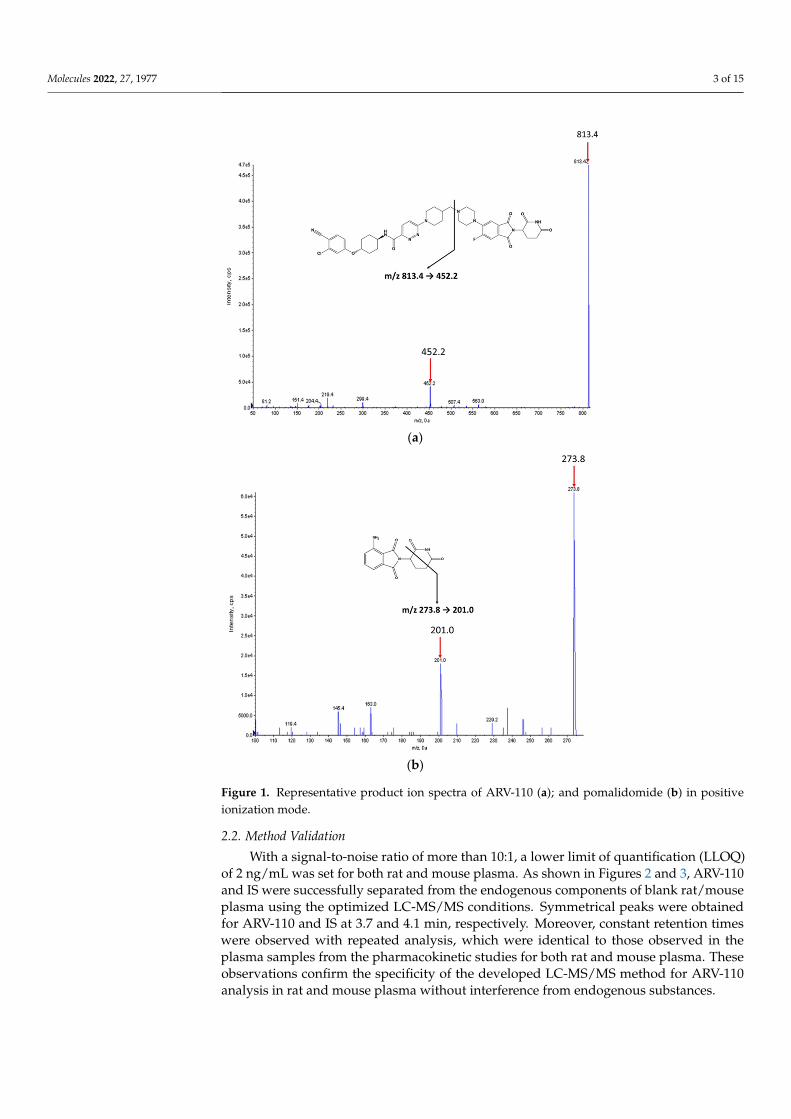
The chemical structures of ARV-110 and pomalidomide (internal standard, IS) areshown in Figure 1. ARV-110 and IS were protonated in positive ESI mode, and [M + H]+ atm/z 813.4 and 273.8 were selected as the precursor ions of ARV-110 and IS, respectively.The most prominent fragment ions of ARV-110 and IS in the product ion spectra wereat m/z 452.2 and 201.0, respectively (Figure 1). The product ion of ARV-110 was formedby breakage of the C–N linkage (Figure 1a). The product ion of IS was attributed to thebreakdown of the piperidine-2,6-dione ring (Figure 1b), similar to a previous report [12].Therefore, the multiple reaction monitoring (MRM) transitions of 813.4 → 452.2 and273.8→ 201.0 were selected for ARV-110 and IS, respectively.
For ARV-110, the optimized declustering potential, collision energy, and collision cellexit potential were 151, 55, and 8 V, respectively, whereas those for IS were 71, 29, and14 V, respectively. Various LC conditions were tested to obtain ARV-110 and IS peaks withadequate retention times and separation. Under the optimized conditions, ARV-110 and ISwere separated on an Agilent Zorbax C18 column (5 µm, 4.6 × 150 mm) eluted with 0.1%formic acid in water–0.1% formic acid in acetonitrile (30:70, v/v)–under isocratic conditions(5 min) at a flow rate of 0.35 mL/min. These conditions resulted in good chromatographicresolution with sharp ARV-110 and IS peaks at 3.7 and 4.1 min, respectively.
Molecules 2022, 27, 1977 3 of 15Molecules 2022, 27, x FOR PEER REVIEW 3 of 15
(a)
(b)
Figure 1. Representative product ion spectra of ARV-110 (a); and pomalidomide (b) in positive ion-ization mode.
For ARV-110, the optimized declustering potential, collision energy, and collision cell exit potential were 151, 55, and 8 V, respectively, whereas those for IS were 71, 29, and 14 V, respectively. Various LC conditions were tested to obtain ARV-110 and IS peaks with adequate retention times and separation. Under the optimized conditions, ARV-110 and IS were separated on an Agilent Zorbax C18 column (5 µm, 4.6 × 150 mm) eluted with 0.1% formic acid in water–0.1% formic acid in acetonitrile (30:70, v/v)–under isocratic con-ditions (5 min) at a flow rate of 0.35 mL/min. These conditions resulted in good chroma-tographic resolution with sharp ARV-110 and IS peaks at 3.7 and 4.1 min, respectively.
2.2. Method Validation With a signal-to-noise ratio of more than 10:1, a lower limit of quantification (LLOQ)
of 2 ng/mL was set for both rat and mouse plasma. As shown in Figures 2 and 3, ARV-110
Figure 1. Representative product ion spectra of ARV-110 (a); and pomalidomide (b) in positiveionization mode.
2.2. Method Validation
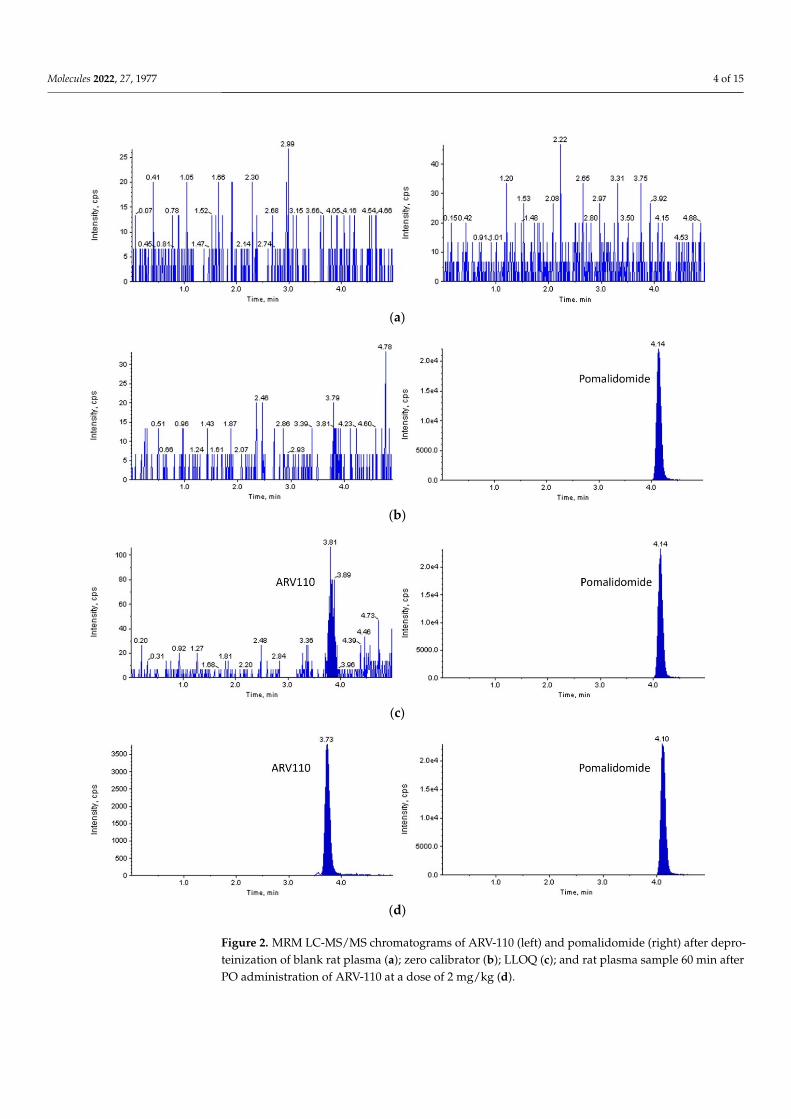
With a signal-to-noise ratio of more than 10:1, a lower limit of quantification (LLOQ)of 2 ng/mL was set for both rat and mouse plasma. As shown in Figures 2 and 3, ARV-110and IS were successfully separated from the endogenous components of blank rat/mouseplasma using the optimized LC-MS/MS conditions. Symmetrical peaks were obtainedfor ARV-110 and IS at 3.7 and 4.1 min, respectively. Moreover, constant retention timeswere observed with repeated analysis, which were identical to those observed in theplasma samples from the pharmacokinetic studies for both rat and mouse plasma. Theseobservations confirm the specificity of the developed LC-MS/MS method for ARV-110analysis in rat and mouse plasma without interference from endogenous substances.
Molecules 2022, 27, 1977 4 of 15
Molecules 2022, 27, x FOR PEER REVIEW 4 of 15
and IS were successfully separated from the endogenous components of blank rat/mouse plasma using the optimized LC-MS/MS conditions. Symmetrical peaks were obtained for ARV-110 and IS at 3.7 and 4.1 min, respectively. Moreover, constant retention times were observed with repeated analysis, which were identical to those observed in the plasma samples from the pharmacokinetic studies for both rat and mouse plasma. These obser-vations confirm the specificity of the developed LC-MS/MS method for ARV-110 analysis in rat and mouse plasma without interference from endogenous substances.
(a)
(b)
(c)
(d)
Figure 2. MRM LC-MS/MS chromatograms of ARV-110 (left) and pomalidomide (right) after depro-teinization of blank rat plasma (a); zero calibrator (b); LLOQ (c); and rat plasma sample 60 min afterPO administration of ARV-110 at a dose of 2 mg/kg (d).
Molecules 2022, 27, 1977 5 of 15
Molecules 2022, 27, x FOR PEER REVIEW 5 of 15
Figure 2. MRM LC-MS/MS chromatograms of ARV-110 (left) and pomalidomide (right) after depro-teinization of blank rat plasma (a); zero calibrator (b); LLOQ (c); and rat plasma sample 60 min after PO administration of ARV-110 at a dose of 2 mg/kg (d).
(a)
(b)
(c)
(d)
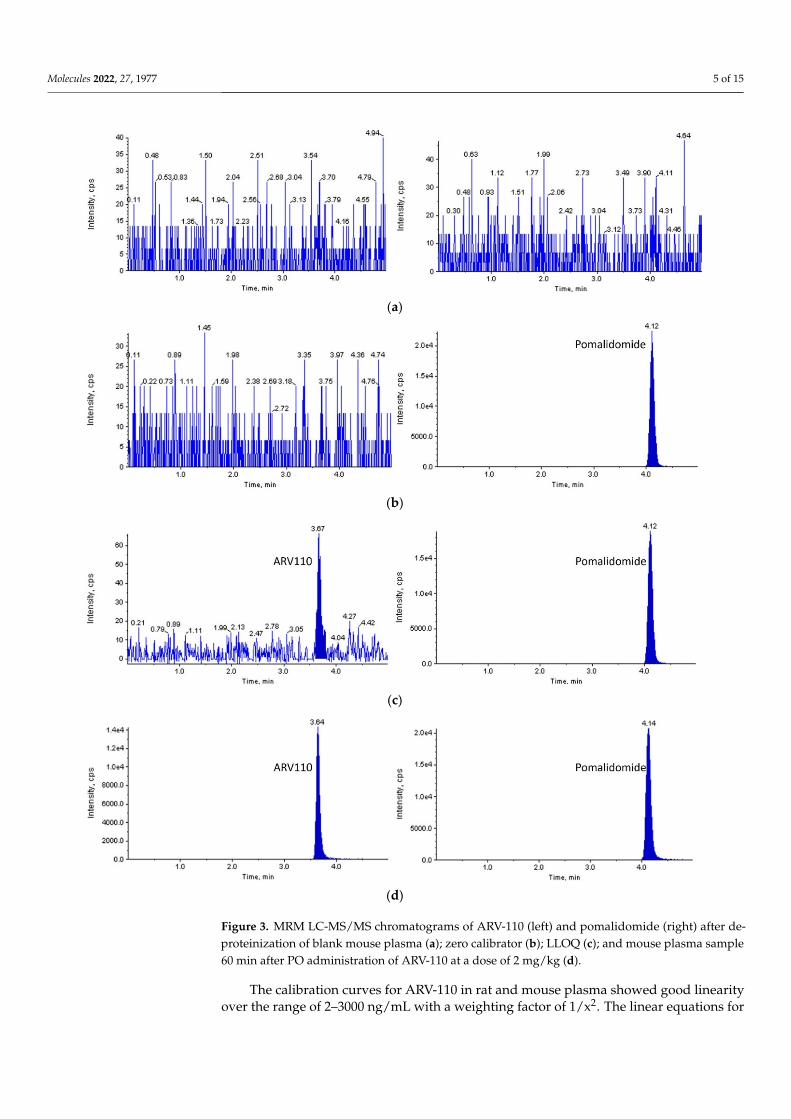
Figure 3. MRM LC-MS/MS chromatograms of ARV-110 (left) and pomalidomide (right) after depro-teinization of blank mouse plasma (a); zero calibrator (b); LLOQ (c); and mouse plasma sample 60 min after PO administration of ARV-110 at a dose of 2 mg/kg (d).
Figure 3. MRM LC-MS/MS chromatograms of ARV-110 (left) and pomalidomide (right) after de-proteinization of blank mouse plasma (a); zero calibrator (b); LLOQ (c); and mouse plasma sample60 min after PO administration of ARV-110 at a dose of 2 mg/kg (d).
The calibration curves for ARV-110 in rat and mouse plasma showed good linearityover the range of 2–3000 ng/mL with a weighting factor of 1/x2. The linear equations for
Molecules 2022, 27, 1977 6 of 15
rat and mouse plasma were y = 0.001310x + 0.000042 (r = 0.9921) and y = 0.00124x + 0.00017(r = 0.9912), respectively.
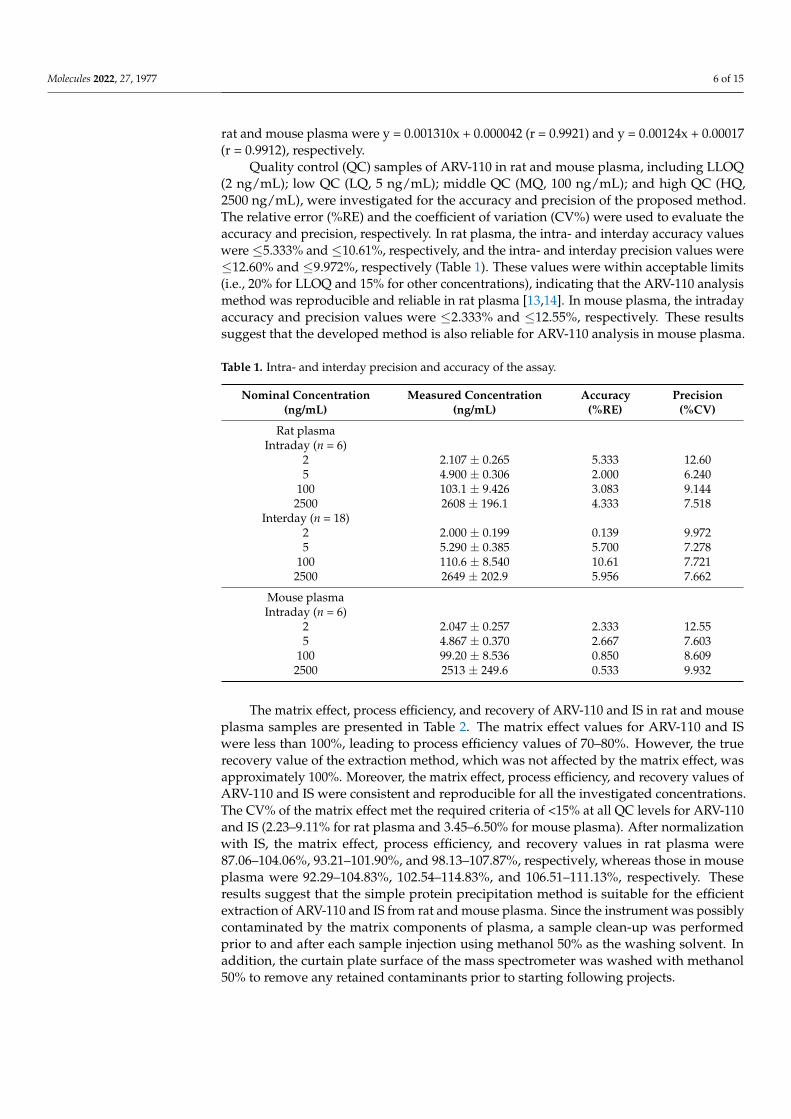
Quality control (QC) samples of ARV-110 in rat and mouse plasma, including LLOQ(2 ng/mL); low QC (LQ, 5 ng/mL); middle QC (MQ, 100 ng/mL); and high QC (HQ,2500 ng/mL), were investigated for the accuracy and precision of the proposed method.The relative error (%RE) and the coefficient of variation (CV%) were used to evaluate theaccuracy and precision, respectively. In rat plasma, the intra- and interday accuracy valueswere ≤5.333% and ≤10.61%, respectively, and the intra- and interday precision values were≤12.60% and ≤9.972%, respectively (Table 1). These values were within acceptable limits(i.e., 20% for LLOQ and 15% for other concentrations), indicating that the ARV-110 analysismethod was reproducible and reliable in rat plasma [13,14]. In mouse plasma, the intradayaccuracy and precision values were ≤2.333% and ≤12.55%, respectively. These resultssuggest that the developed method is also reliable for ARV-110 analysis in mouse plasma.
Table 1. Intra- and interday precision and accuracy of the assay.
Nominal Concentration(ng/mL)
Measured Concentration(ng/mL)
Accuracy(%RE)
Precision(%CV)
Rat plasmaIntraday (n = 6)
2 2.107 ± 0.265 5.333 12.605 4.900 ± 0.306 2.000 6.240
100 103.1 ± 9.426 3.083 9.1442500 2608 ± 196.1 4.333 7.518
Interday (n = 18)2 2.000 ± 0.199 0.139 9.9725 5.290 ± 0.385 5.700 7.278
100 110.6 ± 8.540 10.61 7.7212500 2649 ± 202.9 5.956 7.662
Mouse plasmaIntraday (n = 6)
2 2.047 ± 0.257 2.333 12.555 4.867 ± 0.370 2.667 7.603
100 99.20 ± 8.536 0.850 8.6092500 2513 ± 249.6 0.533 9.932
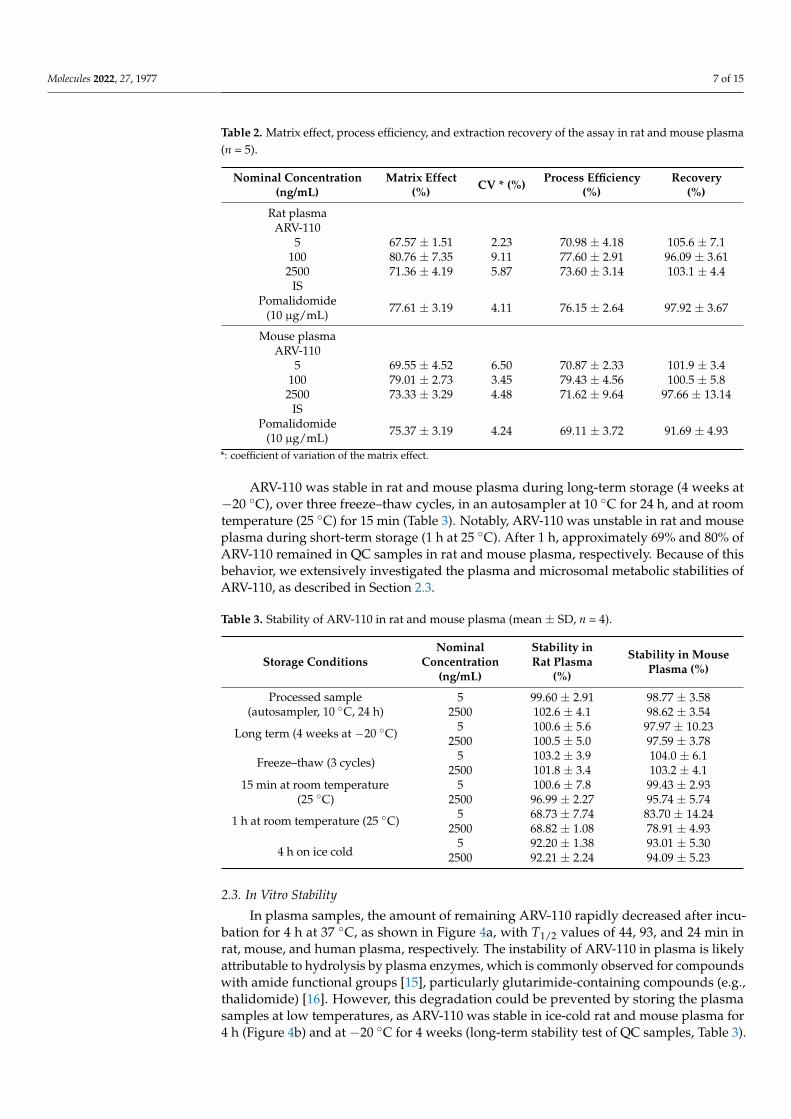
The matrix effect, process efficiency, and recovery of ARV-110 and IS in rat and mouseplasma samples are presented in Table 2. The matrix effect values for ARV-110 and ISwere less than 100%, leading to process efficiency values of 70–80%. However, the truerecovery value of the extraction method, which was not affected by the matrix effect, wasapproximately 100%. Moreover, the matrix effect, process efficiency, and recovery values ofARV-110 and IS were consistent and reproducible for all the investigated concentrations.The CV% of the matrix effect met the required criteria of <15% at all QC levels for ARV-110and IS (2.23–9.11% for rat plasma and 3.45–6.50% for mouse plasma). After normalizationwith IS, the matrix effect, process efficiency, and recovery values in rat plasma were87.06–104.06%, 93.21–101.90%, and 98.13–107.87%, respectively, whereas those in mouseplasma were 92.29–104.83%, 102.54–114.83%, and 106.51–111.13%, respectively. Theseresults suggest that the simple protein precipitation method is suitable for the efficientextraction of ARV-110 and IS from rat and mouse plasma. Since the instrument was possiblycontaminated by the matrix components of plasma, a sample clean-up was performedprior to and after each sample injection using methanol 50% as the washing solvent. Inaddition, the curtain plate surface of the mass spectrometer was washed with methanol50% to remove any retained contaminants prior to starting following projects.
Molecules 2022, 27, 1977 7 of 15
Table 2. Matrix effect, process efficiency, and extraction recovery of the assay in rat and mouse plasma(n = 5).
Nominal Concentration(ng/mL)
Matrix Effect(%) CV * (%) Process Efficiency
(%)Recovery
(%)
Rat plasmaARV-110
5 67.57 ± 1.51 2.23 70.98 ± 4.18 105.6 ± 7.1100 80.76 ± 7.35 9.11 77.60 ± 2.91 96.09 ± 3.61
2500 71.36 ± 4.19 5.87 73.60 ± 3.14 103.1 ± 4.4IS
Pomalidomide(10 µg/mL) 77.61 ± 3.19 4.11 76.15 ± 2.64 97.92 ± 3.67
Mouse plasmaARV-110
5 69.55 ± 4.52 6.50 70.87 ± 2.33 101.9 ± 3.4100 79.01 ± 2.73 3.45 79.43 ± 4.56 100.5 ± 5.8
2500 73.33 ± 3.29 4.48 71.62 ± 9.64 97.66 ± 13.14IS
Pomalidomide(10 µg/mL) 75.37 ± 3.19 4.24 69.11 ± 3.72 91.69 ± 4.93
*: coefficient of variation of the matrix effect.
ARV-110 was stable in rat and mouse plasma during long-term storage (4 weeks at−20 ◦C), over three freeze–thaw cycles, in an autosampler at 10 ◦C for 24 h, and at roomtemperature (25 ◦C) for 15 min (Table 3). Notably, ARV-110 was unstable in rat and mouseplasma during short-term storage (1 h at 25 ◦C). After 1 h, approximately 69% and 80% ofARV-110 remained in QC samples in rat and mouse plasma, respectively. Because of thisbehavior, we extensively investigated the plasma and microsomal metabolic stabilities ofARV-110, as described in Section 2.3.
Table 3. Stability of ARV-110 in rat and mouse plasma (mean ± SD, n = 4).
Storage ConditionsNominal
Concentration(ng/mL)
Stability inRat Plasma
(%)
Stability in MousePlasma (%)
Processed sample(autosampler, 10 ◦C, 24 h)
5 99.60 ± 2.91 98.77 ± 3.582500 102.6 ± 4.1 98.62 ± 3.54
Long term (4 weeks at −20 ◦C) 5 100.6 ± 5.6 97.97 ± 10.232500 100.5 ± 5.0 97.59 ± 3.78
Freeze–thaw (3 cycles) 5 103.2 ± 3.9 104.0 ± 6.12500 101.8 ± 3.4 103.2 ± 4.1
15 min at room temperature(25 ◦C)
5 100.6 ± 7.8 99.43 ± 2.932500 96.99 ± 2.27 95.74 ± 5.74
1 h at room temperature (25 ◦C) 5 68.73 ± 7.74 83.70 ± 14.242500 68.82 ± 1.08 78.91 ± 4.93
4 h on ice cold5 92.20 ± 1.38 93.01 ± 5.30
2500 92.21 ± 2.24 94.09 ± 5.23
2.3. In Vitro Stability
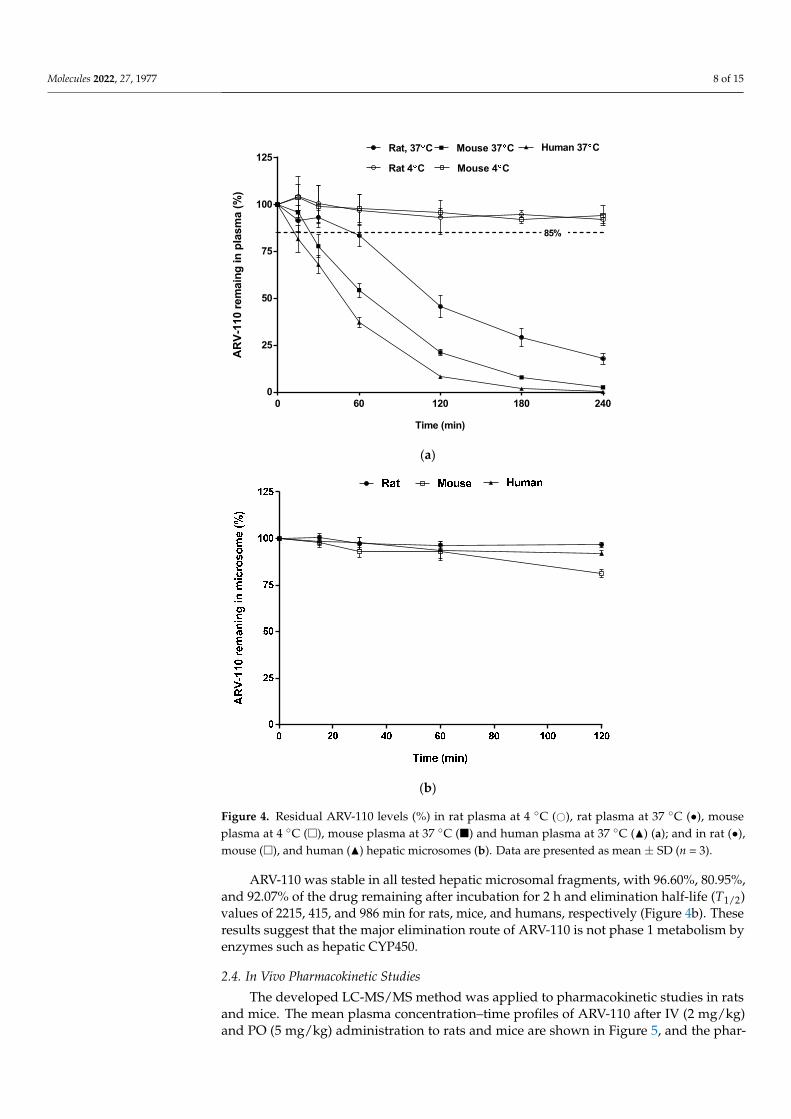
In plasma samples, the amount of remaining ARV-110 rapidly decreased after incu-bation for 4 h at 37 ◦C, as shown in Figure 4a, with T1/2 values of 44, 93, and 24 min inrat, mouse, and human plasma, respectively. The instability of ARV-110 in plasma is likelyattributable to hydrolysis by plasma enzymes, which is commonly observed for compoundswith amide functional groups [15], particularly glutarimide-containing compounds (e.g.,thalidomide) [16]. However, this degradation could be prevented by storing the plasmasamples at low temperatures, as ARV-110 was stable in ice-cold rat and mouse plasma for4 h (Figure 4b) and at −20 ◦C for 4 weeks (long-term stability test of QC samples, Table 3).
Molecules 2022, 27, 1977 8 of 15
Molecules 2022, 27, x FOR PEER REVIEW 8 of 15
2.3. In Vitro Stability In plasma samples, the amount of remaining ARV-110 rapidly decreased after incu-
bation for 4 h at 37 °C, as shown in Figure 4a, with T1/2 values of 44, 93, and 24 min in rat, mouse, and human plasma, respectively. The instability of ARV-110 in plasma is likely attributable to hydrolysis by plasma enzymes, which is commonly observed for com-pounds with amide functional groups [15], particularly glutarimide-containing com-pounds (e.g., thalidomide) [16]. However, this degradation could be prevented by storing the plasma samples at low temperatures, as ARV-110 was stable in ice-cold rat and mouse plasma for 4 h (Figure 4b) and at −20 °C for 4 weeks (long-term stability test of QC sam-ples, Table 3).
0 60 120 180 2400
25
50
75
100
125
Time (min)
AR
V-11
0 re
mai
ng in
pla
sma
(%)
Rat, 37 C Mouse 37 C Human 37 C
Rat 4 C Mouse 4 C
85%
(a)
(b)
Figure 4. Residual ARV-110 levels (%) in rat plasma at 4 °C (○), rat plasma at 37 °C (●), mouse plasma at 4 °C (□), mouse plasma at 37 °C (■) and human plasma at 37 °C (▲) (a); and in rat (●), mouse (□), and human (▲) hepatic microsomes (b). Data are presented as mean ± SD (n = 3).
Figure 4. Residual ARV-110 levels (%) in rat plasma at 4 ◦C (#), rat plasma at 37 ◦C (•), mouseplasma at 4 ◦C (�), mouse plasma at 37 ◦C (�) and human plasma at 37 ◦C (N) (a); and in rat (•),mouse (�), and human (N) hepatic microsomes (b). Data are presented as mean ± SD (n = 3).
ARV-110 was stable in all tested hepatic microsomal fragments, with 96.60%, 80.95%,and 92.07% of the drug remaining after incubation for 2 h and elimination half-life (T1/2)values of 2215, 415, and 986 min for rats, mice, and humans, respectively (Figure 4b). Theseresults suggest that the major elimination route of ARV-110 is not phase 1 metabolism byenzymes such as hepatic CYP450.
2.4. In Vivo Pharmacokinetic Studies
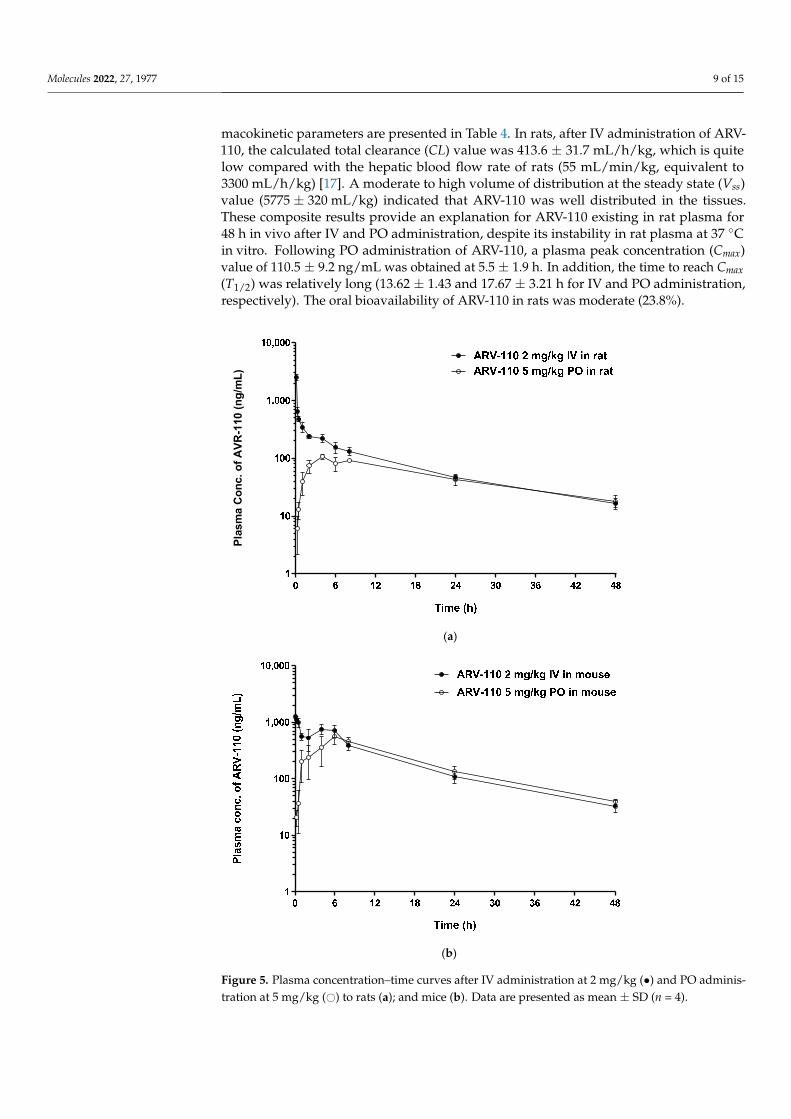
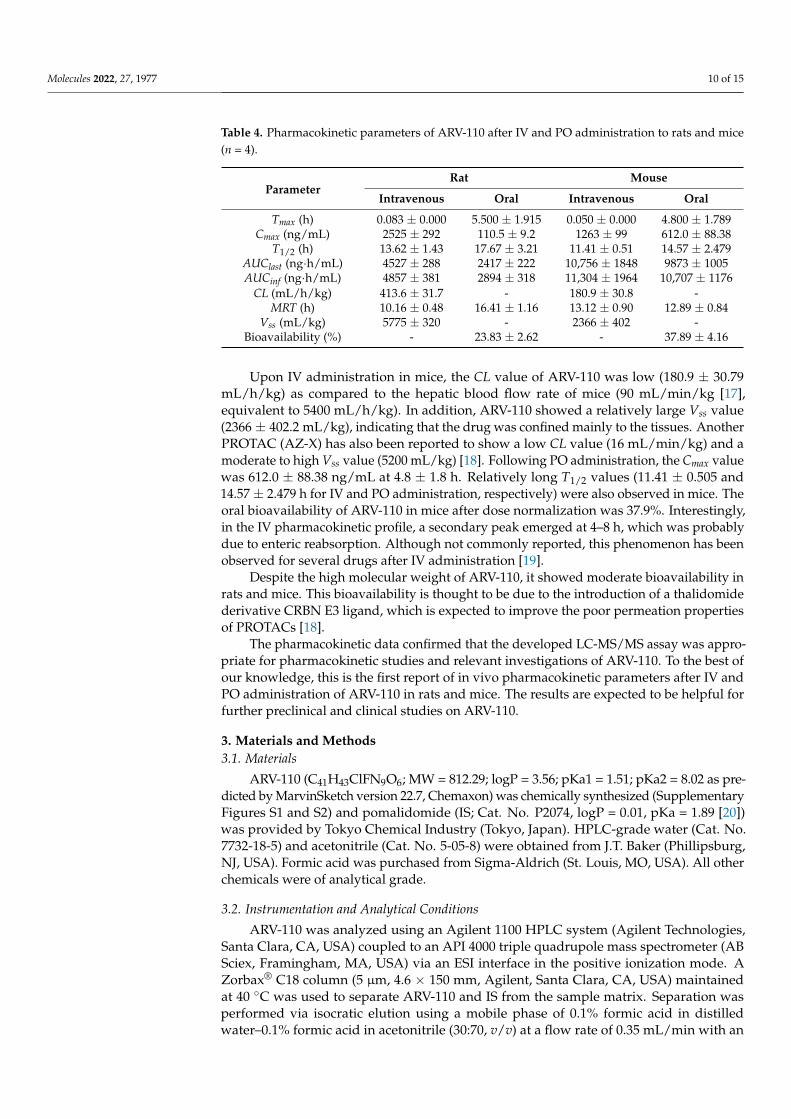
The developed LC-MS/MS method was applied to pharmacokinetic studies in ratsand mice. The mean plasma concentration–time profiles of ARV-110 after IV (2 mg/kg)and PO (5 mg/kg) administration to rats and mice are shown in Figure 5, and the phar-
Molecules 2022, 27, 1977 9 of 15
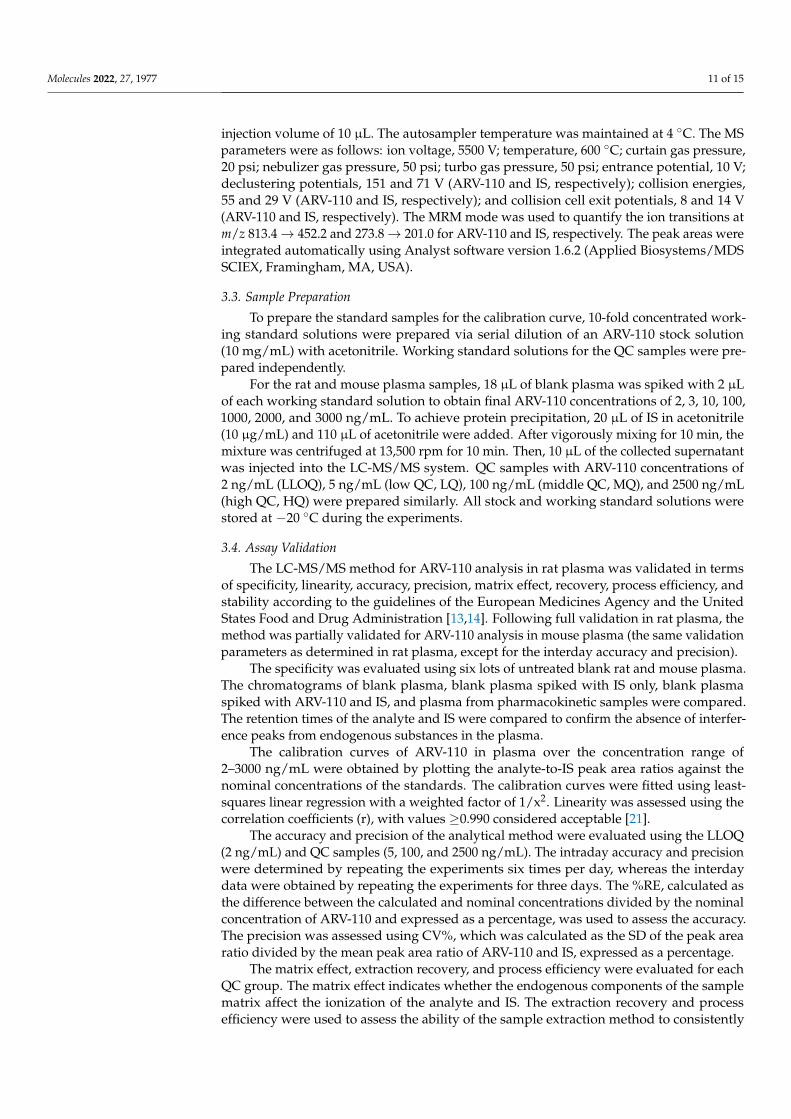
macokinetic parameters are presented in Table 4. In rats, after IV administration of ARV-110, the calculated total clearance (CL) value was 413.6 ± 31.7 mL/h/kg, which is quitelow compared with the hepatic blood flow rate of rats (55 mL/min/kg, equivalent to3300 mL/h/kg) [17]. A moderate to high volume of distribution at the steady state (Vss)value (5775 ± 320 mL/kg) indicated that ARV-110 was well distributed in the tissues.These composite results provide an explanation for ARV-110 existing in rat plasma for48 h in vivo after IV and PO administration, despite its instability in rat plasma at 37 ◦Cin vitro. Following PO administration of ARV-110, a plasma peak concentration (Cmax)value of 110.5 ± 9.2 ng/mL was obtained at 5.5 ± 1.9 h. In addition, the time to reach Cmax(T1/2) was relatively long (13.62 ± 1.43 and 17.67 ± 3.21 h for IV and PO administration,respectively). The oral bioavailability of ARV-110 in rats was moderate (23.8%).
Molecules 2022, 27, x FOR PEER REVIEW 9 of 15
ARV-110 was stable in all tested hepatic microsomal fragments, with 96.60%, 80.95%, and 92.07% of the drug remaining after incubation for 2 h and elimination half-life (T1/2) values of 2215, 415, and 986 min for rats, mice, and humans, respectively (Figure 4b). These results suggest that the major elimination route of ARV-110 is not phase 1 metabo-lism by enzymes such as hepatic CYP450.
2.4. In Vivo Pharmacokinetic Studies The developed LC-MS/MS method was applied to pharmacokinetic studies in rats
and mice. The mean plasma concentration–time profiles of ARV-110 after IV (2 mg/kg) and PO (5 mg/kg) administration to rats and mice are shown in Figure 5, and the pharma-cokinetic parameters are presented in Table 4. In rats, after IV administration of ARV-110, the calculated total clearance (CL) value was 413.6 ± 31.7 mL/h/kg, which is quite low com-pared with the hepatic blood flow rate of rats (55 mL/min/kg, equivalent to 3300 mL/h/kg) [17]. A moderate to high volume of distribution at the steady state (Vss) value (5775 ± 320 mL/kg) indicated that ARV-110 was well distributed in the tissues. These composite re-sults provide an explanation for ARV-110 existing in rat plasma for 48 h in vivo after IV and PO administration, despite its instability in rat plasma at 37 °C in vitro. Following PO administration of ARV-110, a plasma peak concentration (Cmax) value of 110.5 ± 9.2 ng/mL was obtained at 5.5 ± 1.9 h. In addition, the time to reach Cmax (T1/2) was relatively long (13.62 ± 1.43 and 17.67 ± 3.21 h for IV and PO administration, respectively). The oral bioa-vailability of ARV-110 in rats was moderate (23.8%).
Plas
ma
Conc
. of A
VR-1
10 (n
g/m
L)
(a)
Molecules 2022, 27, x FOR PEER REVIEW 10 of 15
(b)
Figure 5. Plasma concentration–time curves after IV administration at 2 mg/kg (●) and PO admin-istration at 5 mg/kg (○) to rats (a); and mice (b). Data are presented as mean ± SD (n = 4).
Table 4. Pharmacokinetic parameters of ARV-110 after IV and PO administration to rats and mice (n = 4).
Parameter Rat Mouse
Intravenous Oral Intravenous Oral Tmax (h) 0.083 ± 0.000 5.500 ± 1.915 0.050 ± 0.000 4.800 ± 1.789
Cmax (ng/mL) 2525 ± 292 110.5 ± 9.2 1263 ± 99 612.0 ± 88.38 T1/2 (h) 13.62 ± 1.43 17.67 ± 3.21 11.41 ± 0.51 14.57 ± 2.479
AUClast (ng∙h/mL) 4527 ± 288 2417 ± 222 10,756 ± 1848 9873 ± 1005
AUCinf (ng∙h/mL) 4857 ± 381 2894 ± 318 11,304 ± 1964 10,707 ± 1176 CL (mL/h/kg) 413.6 ± 31.7 - 180.9 ± 30.8 -
MRT (h) 10.16 ± 0.48 16.41 ± 1.16 13.12 ± 0.90 12.89 ± 0.84 Vss (mL/kg) 5775 ± 320 - 2366 ± 402 -
Bioavailability (%) - 23.83 ± 2.62 - 37.89 ± 4.16
Upon IV administration in mice, the CL value of ARV-110 was low (180.9 ± 30.79 mL/h/kg) as compared to the hepatic blood flow rate of mice (90 mL/min/kg [17], equiva-lent to 5400 mL/h/kg). In addition, ARV-110 showed a relatively large Vss value (2366 ± 402.2 mL/kg), indicating that the drug was confined mainly to the tissues. Another PROTAC (AZ-X) has also been reported to show a low CL value (16 mL/min/kg) and a moderate to high Vss value (5200 mL/kg) [18]. Following PO administration, the Cmax value was 612.0 ± 88.38 ng/mL at 4.8 ± 1.8 h. Relatively long T1/2 values (11.41 ± 0.505 and 14.57 ± 2.479 h for IV and PO administration, respectively) were also observed in mice. The oral bioavailability of ARV-110 in mice after dose normalization was 37.9%. Interestingly, in the IV pharmacokinetic profile, a secondary peak emerged at 4–8 h, which was probably due to enteric reabsorption. Although not commonly reported, this phenomenon has been observed for several drugs after IV administration [19].
Figure 5. Plasma concentration–time curves after IV administration at 2 mg/kg (•) and PO adminis-tration at 5 mg/kg (#) to rats (a); and mice (b). Data are presented as mean ± SD (n = 4).
Molecules 2022, 27, 1977 10 of 15
Table 4. Pharmacokinetic parameters of ARV-110 after IV and PO administration to rats and mice(n = 4).
ParameterRat Mouse
Intravenous Oral Intravenous Oral
Tmax (h) 0.083 ± 0.000 5.500 ± 1.915 0.050 ± 0.000 4.800 ± 1.789Cmax (ng/mL) 2525 ± 292 110.5 ± 9.2 1263 ± 99 612.0 ± 88.38
T1/2 (h) 13.62 ± 1.43 17.67 ± 3.21 11.41 ± 0.51 14.57 ± 2.479AUClast (ng·h/mL) 4527 ± 288 2417 ± 222 10,756 ± 1848 9873 ± 1005AUCinf (ng·h/mL) 4857 ± 381 2894 ± 318 11,304 ± 1964 10,707 ± 1176
CL (mL/h/kg) 413.6 ± 31.7 - 180.9 ± 30.8 -MRT (h) 10.16 ± 0.48 16.41 ± 1.16 13.12 ± 0.90 12.89 ± 0.84
Vss (mL/kg) 5775 ± 320 - 2366 ± 402 -Bioavailability (%) - 23.83 ± 2.62 - 37.89 ± 4.16
Upon IV administration in mice, the CL value of ARV-110 was low (180.9 ± 30.79mL/h/kg) as compared to the hepatic blood flow rate of mice (90 mL/min/kg [17],equivalent to 5400 mL/h/kg). In addition, ARV-110 showed a relatively large Vss value(2366 ± 402.2 mL/kg), indicating that the drug was confined mainly to the tissues. AnotherPROTAC (AZ-X) has also been reported to show a low CL value (16 mL/min/kg) and amoderate to high Vss value (5200 mL/kg) [18]. Following PO administration, the Cmax valuewas 612.0 ± 88.38 ng/mL at 4.8 ± 1.8 h. Relatively long T1/2 values (11.41 ± 0.505 and14.57 ± 2.479 h for IV and PO administration, respectively) were also observed in mice. Theoral bioavailability of ARV-110 in mice after dose normalization was 37.9%. Interestingly,in the IV pharmacokinetic profile, a secondary peak emerged at 4–8 h, which was probablydue to enteric reabsorption. Although not commonly reported, this phenomenon has beenobserved for several drugs after IV administration [19].
Despite the high molecular weight of ARV-110, it showed moderate bioavailability inrats and mice. This bioavailability is thought to be due to the introduction of a thalidomidederivative CRBN E3 ligand, which is expected to improve the poor permeation propertiesof PROTACs [18].
The pharmacokinetic data confirmed that the developed LC-MS/MS assay was appro-priate for pharmacokinetic studies and relevant investigations of ARV-110. To the best ofour knowledge, this is the first report of in vivo pharmacokinetic parameters after IV andPO administration of ARV-110 in rats and mice. The results are expected to be helpful forfurther preclinical and clinical studies on ARV-110.
3. Materials and Methods3.1. Materials
ARV-110 (C41H43ClFN9O6; MW = 812.29; logP = 3.56; pKa1 = 1.51; pKa2 = 8.02 as pre-dicted by MarvinSketch version 22.7, Chemaxon) was chemically synthesized (SupplementaryFigures S1 and S2) and pomalidomide (IS; Cat. No. P2074, logP = 0.01, pKa = 1.89 [20])was provided by Tokyo Chemical Industry (Tokyo, Japan). HPLC-grade water (Cat. No.7732-18-5) and acetonitrile (Cat. No. 5-05-8) were obtained from J.T. Baker (Phillipsburg,NJ, USA). Formic acid was purchased from Sigma-Aldrich (St. Louis, MO, USA). All otherchemicals were of analytical grade.
3.2. Instrumentation and Analytical Conditions
ARV-110 was analyzed using an Agilent 1100 HPLC system (Agilent Technologies,Santa Clara, CA, USA) coupled to an API 4000 triple quadrupole mass spectrometer (ABSciex, Framingham, MA, USA) via an ESI interface in the positive ionization mode. AZorbax® C18 column (5 µm, 4.6 × 150 mm, Agilent, Santa Clara, CA, USA) maintainedat 40 ◦C was used to separate ARV-110 and IS from the sample matrix. Separation wasperformed via isocratic elution using a mobile phase of 0.1% formic acid in distilledwater–0.1% formic acid in acetonitrile (30:70, v/v) at a flow rate of 0.35 mL/min with an
Molecules 2022, 27, 1977 11 of 15
injection volume of 10 µL. The autosampler temperature was maintained at 4 ◦C. The MSparameters were as follows: ion voltage, 5500 V; temperature, 600 ◦C; curtain gas pressure,20 psi; nebulizer gas pressure, 50 psi; turbo gas pressure, 50 psi; entrance potential, 10 V;declustering potentials, 151 and 71 V (ARV-110 and IS, respectively); collision energies,55 and 29 V (ARV-110 and IS, respectively); and collision cell exit potentials, 8 and 14 V(ARV-110 and IS, respectively). The MRM mode was used to quantify the ion transitions atm/z 813.4→ 452.2 and 273.8→ 201.0 for ARV-110 and IS, respectively. The peak areas wereintegrated automatically using Analyst software version 1.6.2 (Applied Biosystems/MDSSCIEX, Framingham, MA, USA).
3.3. Sample Preparation
To prepare the standard samples for the calibration curve, 10-fold concentrated work-ing standard solutions were prepared via serial dilution of an ARV-110 stock solution(10 mg/mL) with acetonitrile. Working standard solutions for the QC samples were pre-pared independently.
For the rat and mouse plasma samples, 18 µL of blank plasma was spiked with 2 µLof each working standard solution to obtain final ARV-110 concentrations of 2, 3, 10, 100,1000, 2000, and 3000 ng/mL. To achieve protein precipitation, 20 µL of IS in acetonitrile(10 µg/mL) and 110 µL of acetonitrile were added. After vigorously mixing for 10 min, themixture was centrifuged at 13,500 rpm for 10 min. Then, 10 µL of the collected supernatantwas injected into the LC-MS/MS system. QC samples with ARV-110 concentrations of2 ng/mL (LLOQ), 5 ng/mL (low QC, LQ), 100 ng/mL (middle QC, MQ), and 2500 ng/mL(high QC, HQ) were prepared similarly. All stock and working standard solutions werestored at −20 ◦C during the experiments.
3.4. Assay Validation
The LC-MS/MS method for ARV-110 analysis in rat plasma was validated in termsof specificity, linearity, accuracy, precision, matrix effect, recovery, process efficiency, andstability according to the guidelines of the European Medicines Agency and the UnitedStates Food and Drug Administration [13,14]. Following full validation in rat plasma, themethod was partially validated for ARV-110 analysis in mouse plasma (the same validationparameters as determined in rat plasma, except for the interday accuracy and precision).
The specificity was evaluated using six lots of untreated blank rat and mouse plasma.The chromatograms of blank plasma, blank plasma spiked with IS only, blank plasmaspiked with ARV-110 and IS, and plasma from pharmacokinetic samples were compared.The retention times of the analyte and IS were compared to confirm the absence of interfer-ence peaks from endogenous substances in the plasma.
The calibration curves of ARV-110 in plasma over the concentration range of2–3000 ng/mL were obtained by plotting the analyte-to-IS peak area ratios against thenominal concentrations of the standards. The calibration curves were fitted using least-squares linear regression with a weighted factor of 1/x2. Linearity was assessed using thecorrelation coefficients (r), with values ≥0.990 considered acceptable [21].
The accuracy and precision of the analytical method were evaluated using the LLOQ(2 ng/mL) and QC samples (5, 100, and 2500 ng/mL). The intraday accuracy and precisionwere determined by repeating the experiments six times per day, whereas the interdaydata were obtained by repeating the experiments for three days. The %RE, calculated asthe difference between the calculated and nominal concentrations divided by the nominalconcentration of ARV-110 and expressed as a percentage, was used to assess the accuracy.The precision was assessed using CV%, which was calculated as the SD of the peak arearatio divided by the mean peak area ratio of ARV-110 and IS, expressed as a percentage.
The matrix effect, extraction recovery, and process efficiency were evaluated for eachQC group. The matrix effect indicates whether the endogenous components of the samplematrix affect the ionization of the analyte and IS. The extraction recovery and processefficiency were used to assess the ability of the sample extraction method to consistently
Molecules 2022, 27, 1977 12 of 15
recover the analyte and IS. The former represents the true recovery value, which is notaffected by the matrix effect, whereas the latter shows the overall process efficacy [22].The matrix effect was calculated by dividing the mean peak areas of ARV-110 spiked inthe extracted blank plasma (set 2) by the peak area of the analyte in acetonitrile (set 1).The recovery was evaluated by comparing the mean peak areas of ARV-110 in the sampleextracts (set 3) with those of the set 2 samples. The process efficiency was calculated bycomparing the data in sets 3 and 1 [23,24].
The sample stability in rat and mouse plasma was evaluated at low and high QCconcentrations. The short-term stability was evaluated at room temperature for 1 h, whereasthe long-term stability was determined by assaying samples stored at −20 ◦C for 4 weeks.The processed sample stability was evaluated using samples prepared and kept in anautosampler at 4 ◦C for 24 h before analysis. The freeze–thaw stability was tested bysubjecting samples to three freeze–thaw cycles.
3.5. In Vitro Metabolic Stability
The stabilities of ARV-110 in the hepatic microsomal fraction and plasma were in-vestigated for three species (human, rat, and mouse). For the microsomal stability study,a reaction mixture containing hepatic microsomes (protein concentration, 0.5 mg/mL)and 1 mM NADPH in phosphate buffer (pH 7.4) was pre-incubated in a thermomixer(5 min, 37 ◦C, 200 rpm). To initiate the metabolic reaction, 5 µL of ARV-110 in methanol(100 µM) was added to the pre-incubated mixture to obtain a final ARV-110 concentration of1 µM. The metabolic reactions of buspirone and verapamil were conducted simultaneouslyas positive controls. For plasma stability measurements, 5 µL of ARV-110 in methanol(100 µM) was added to pre-warmed blank plasma to obtain a final ARV-110 concentrationof 1 µM. Procaine was used to control plasma stability. The temperature was maintainedand agitation was continued throughout the reaction, and sampling was conducted atpredetermined time points (0 (beginning of the reaction), 15; 30; 60; 120; 360; and 480 min).For the microsomal and plasma stability measurements, the reaction was conducted for120 and 240 min, respectively. At each sampling point, 50 µL of the reaction mixture wastransferred to a 1.5 mL microtube containing 100 µL of ice-cold IS in methanol, followed byvortex mixing to terminate the reaction. The mixture was then centrifuged at 16,000 rpm for15 min at 4 ◦C, and the supernatant was injected into the LC-MS/MS system to determinethe amount of analyte remaining. The elimination rate constant (ke) was determined as theslope of the linear regression between the log of the percentage of analyte remaining andthe incubation time. The T1/2 value was estimated using the following equation [25,26]:T1/2 = ln2/ke. The experiments were conducted in triplicate, and data are presented asmean ± SD.
3.6. Application in Pharmacokinetics Studies
The validated LC-MS/MS method was applied to determine ARV-110 in pharmacoki-netic studies in rats and mice. Animal studies were approved in advance by the InstitutionalAnimal Care and Use Committee of Chungnam National University (202103A-CNU-053;Daejeon, Republic of Korea). Male Sprague Dawley (SD) rats (7 weeks old, 210–251 g) andmale ICR mice (6 weeks old, 25–32 g) were purchased from Orient Bio Inc. (Seongnam,Republic of Korea). Their habitat was maintained under a 12 h light–dark cycle at a roomtemperature of 20–25 ◦C and a relative humidity of 40–60%. The animals had free access tofood and water. Food fasting was started 14 or 4 h prior to drug administration to rats andmice, respectively. After drug administration, the animals were not given food or water foranother 4 h.
The drug solution for the pharmacokinetic study in rats was prepared by dissolv-ing ARV-110 in a dimethyl sulfoxide (DMSO)–PEG400–Cremophor EL–saline (5:40:5:50,v/v/v/v). The drug solution was administered to the rats via a single IV bolus into thetail vein at a dose of 2 mg/kg or PO using a gavage needle at a dose of 5 mg/kg. Bloodsamples (100 µL) were collected from the jugular vein using heparinized syringes at 0.083
Molecules 2022, 27, 1977 13 of 15
(IV only), 0.25, 0.5, 1, 2, 4, 6, 8, 24, and 48 h after ARV-110 administration. Plasma wascollected from the blood by centrifugation, and a 20 µL aliquot of plasma was stored at−20 ◦C until analysis.
The drug solution for the pharmacokinetic study in mice was prepared by dissolvingARV-110 in DMSO–PEG400–Cremophor EL–saline (5:30:2.5:62.5, v/v/v/v). The drugsolution was administered via an IV bolus into the tail vein at a dose of 2 mg/kg or PO at adose of 5 mg/kg. Blood samples (50 µL) were alternatively collected from the right retro-orbital plexus at 0.05 (IV only), 0.12, 0.5, 1, 2, 4, 8, 24, and 48 h after ARV-110 administration.Plasma was obtained by centrifuging the blood at 17,600× g for 5 min, and a 20 µL aliquotof plasma was stored at −20 ◦C until analysis.
For plasma sample preparation, 20 µL of rat or mouse plasma was added to 20 µLof IS solution (10 µg/mL) and 110 µL of acetonitrile. After vigorous mixing for 10 min,the mixture was centrifuged at 13,500 rpm for 10 min. An aliquot of the supernatant(100 µL) was collected for analysis. Cmax and Tmax were determined directly from theplasma concentration–time profile of each animal. To determine other pharmacokineticparameters, the experimental data were analyzed using Phoenix® 8.2 software (Certara L.P.,Princeton, NJ, USA), as described previously [23,27]. All data are presented as mean ± SD.
4. Conclusions
In this study, an LC-MS/MS method for the quantitation of ARV-110 in rat and mouseplasma was developed and validated according to the guidelines of the European MedicinesAgency and the United States Food and Drug Administration. The developed bioanalyticalmethod showed good reproducibility and reliability. This method was successfully appliedto the pharmacokinetic study of ARV-110 in both rats and mice, revealing a moderate oralbioavailability for this drug. In addition, ARV-110 showed good metabolic stability in rat,mouse, and human hepatic microsomal fractions. In contrast, the drug was unstable in rat,mouse, and human plasma at room temperature and 37 ◦C, although it was stable undercold conditions. The developed analysis method and the findings of this study will behelpful for further investigations and clinical studies of ARV-110.
Supplementary Materials: The following supporting information can be downloaded at: https://www.mdpi.com/article/10.3390/molecules27061977/s1, Figure S1: 1H-NMR (400 MHz, CDCl3)spectra of ARV-110; Figure S2: QDa-MS profile of ARV-110 (a); and high-performance liquidchromatography-single quadrupole mass spectrometry (HPLC-UV-QDa) chromatograms for ARV-110 (b).
Author Contributions: Conceptualization, H.-J.M. and T.-S.K.; methodology, T.-T.-L.N. and J.W.K.;software, J.W.K. and H.-I.C.; validation, J.W.K. and H.-I.C.; formal analysis, T.-T.-L.N. and J.W.K.;resources, T.-S.K.; data curation, T.-T.-L.N. and J.W.K.; writing—original draft preparation, T.-T.-L.N.;writing—review and editing, J.W.K.; visualization, T.-T.-L.N. and J.W.K.; supervision, H.-J.M. andT.-S.K.; project administration, H.-J.M. and T.-S.K.; funding acquisition, H.-J.M. and T.-S.K. All authorshave read and agreed to the published version of the manuscript.
Funding: This research was supported by a grant from Chungnam National University and NationalResearch Foundation of Korea (NRF) funded by the Ministry of Science, ICT & Future Planning(NRF-2021R1F1A1062551) and by the Ministry of Education (NRF-2020R1A6A1A03043708).
Institutional Review Board Statement: The study was conducted according to the Guide for theCare and Use of Laboratory Animals issued by the National Institute of Health, and approved by theInstitutional Animal Care and Use Committee of Chungnam National University (202103A-CNU-053;Daejeon, Republic of Korea).
Informed Consent Statement: Not applicable.
Data Availability Statement: The data presented in this study are available in the article.
Conflicts of Interest: The authors declare that they have no known competing financial interests orpersonal relationships that could have appeared to influence the work reported in this paper.

Molecules 2022, 27, 1977 14 of 15
Sample Availability: Samples of ARV-110 and pomalidomide are available from the authors.
References1. Sakamoto, K.M.; Kim, K.B.; Kumagai, A.; Mercurio, F.; Crews, C.M.; Deshaies, R.J. Protacs: Chimeric molecules that target
proteins to the Skp1–Cullin–F box complex for ubiquitination and degradation. Proc. Natl. Acad. Sci. USA 2001, 98, 8554–8559.[CrossRef] [PubMed]
2. Békés, M.; Langley, D.R.; Crews, C.M. PROTAC targeted protein degraders: The past is prologue. Nat. Rev. Drug Discov. 2022, 21,181–200. [CrossRef] [PubMed]
3. Zhong, Y.; Chi, F.; Wu, H.; Liu, Y.; Xie, Z.; Huang, W.; Shi, W.; Qian, H. Emerging targeted protein degradation tools for innovativedrug discovery: From classical PROTACs to the novel and beyond. Eur. J. Med. Chem. 2022, 231, 114142. [CrossRef]
4. Pettersson, M.; Crews, C.M. PROteolysis TArgeting Chimeras (PROTACs)—Past, present and future. Drug Discov. Today Technol.2019, 31, 15–27. [CrossRef]
5. Chamberlain, P.P.; Hamann, L.G. Development of targeted protein degradation therapeutics. Nat. Chem. Biol. 2019, 15, 937–944.[CrossRef] [PubMed]
6. Sun, X.; Gao, H.; Yang, Y.; He, M.; Wu, Y.; Song, Y.; Tong, Y.; Rao, Y. PROTACs: Great opportunities for academia and industry.Signal Transduct. Target. Ther. 2019, 4, 64. [CrossRef] [PubMed]
7. Li, X.; Song, Y. Proteolysis-targeting chimera (PROTAC) for targeted protein degradation and cancer therapy. J. Hematol. Oncol.2020, 13, 50. [CrossRef] [PubMed]
8. Snyder, L.B.; Neklesa, T.K.; Chen, X.; Dong, H.; Ferraro, C.; Gordon, D.A.; Macaluso, J.; Pizzano, J.; Wang, J.; Willard, R.R.Discovery of Arv-110, a First in Class Androgen Receptor Degrading Protac® for the Treatment of Men with Metastatic Castration ResistantProstate Cancer; American Association for Cancer Research: Philadelphia, PA, USA, 2021.
9. Salami, J.; Alabi, S.; Willard, R.R.; Vitale, N.J.; Wang, J.; Dong, H.; Jin, M.; McDonnell, D.P.; Crew, A.P.; Neklesa, T.K.; et al.Androgen receptor degradation by the proteolysis-targeting chimera ARCC-4 outperforms enzalutamide in cellular models ofprostate cancer drug resistance. Commun. Biol. 2018, 1, 100. [CrossRef] [PubMed]
10. Petrylak, D.P.; Gao, X.; Vogelzang, N.J.; Garfield, M.H.; Taylor, I.; Moore, M.D.; Peck, R.A.; Burris, H.A., III. First-in-human phaseI study of ARV-110, an androgen receptor (AR) PROTAC degrader in patients (pts) with metastatic castrate-resistant prostatecancer (mCRPC) following enzalutamide (ENZ) and/or abiraterone (ABI). J. Clin. Oncol. 2020, 38, 3500-3500. [CrossRef]
11. Stone, J. Chapter 3—Sample preparation techniques for mass spectrometry in the clinical laboratory. In Mass Spectrometry for theClinical Laboratory; Nair, H., Clarke, W., Eds.; Academic Press: San Diego, CA, USA, 2017; pp. 37–62. [CrossRef]
12. Jiang, Y.; Wang, J.; Rozewski, D.M.; Kolli, S.; Wu, C.-H.; Chen, C.-S.; Yang, X.; Hofmeister, C.C.; Byrd, J.C.; Johnson, A.J.; et al.Sensitive liquid chromatography/mass spectrometry methods for quantification of pomalidomide in mouse plasma and braintissue. J. Pharm. Biomed. Anal. 2014, 88, 262–268. [CrossRef]
13. Agency, E.M. Guideline on Bioanalytical Method Validation; EMEA/CHMP/EWP/192217/2009; EMEA: London, UK, 2011.14. US-FDA. FDA Guidance for Industry: Bioanalytical Method Validation; US Department of Health and Human Services, FDA, Center
for Drug Evaluation and Research: Rockville, MD, USA, 2018. Available online: https://www.fda.gov/downloads/drugs/guidances/ucm070107.Pdf (accessed on 10 February 2022).
15. Konsoula, R.; Jung, M. In vitro plasma stability, permeability and solubility of mercaptoacetamide histone deacetylase inhibitors.Int. J. Pharm. 2008, 361, 19–25. [CrossRef] [PubMed]
16. Schumacher, H.; Smith, R.L.; Williams, R.T. The metabolism of thalidomide: The spontaneous hydrolysis of thalidomide insolution. Br. J. Pharm. Chemother. 1965, 25, 324–337. [CrossRef]
17. El-Kattan, A.F. Drug Pharmacokinetics and Toxicokinetics. In Oral Bioavailability Assessment; El-Kattan, A.F., Ed.; John Wiley &Sons: Hoboken, NJ, USA, 2017; pp. 1–34. [CrossRef]
18. Pike, A.; Williamson, B.; Harlfinger, S.; Martin, S.; McGinnity, D.F. Optimising proteolysis-targeting chimeras (PROTACs) fororal drug delivery: A drug metabolism and pharmacokinetics perspective. Drug Discov. Today 2020, 25, 1793–1800. [CrossRef][PubMed]
19. Ibarra, M.; Trocóniz, I.F.; Fagiolino, P. Enteric reabsorption processes and their impact on drug pharmacokinetics. Sci. Rep. 2021,11, 5794. [CrossRef] [PubMed]
20. Szabó, Z.-I.; Orbán, G.; Borbás, E.; Csicsák, D.; Kádár, S.; Fiser, B.; Dobó, M.; Horváth, P.; Kiss, E.; Budai, L.; et al. Inclusioncomplexation of the anticancer drug pomalidomide with cyclodextrins: Fast dissolution and improved solubility. Heliyon 2021, 7,e07581. [CrossRef]
21. Yoon, J.-H.; Nguyen, T.-T.-L.; Duong, V.-A.; Chun, K.-H.; Maeng, H.-J. Determination of KD025 (SLx-2119), a Selective ROCK2Inhibitor, in Rat Plasma by High-Performance Liquid Chromatography-Tandem Mass Spectrometry and Its PharmacokineticApplication. Molecules 2020, 25, 1369. [CrossRef]
22. Nouman, E.G.; Al-Ghobashy, M.A.; Lotfy, H.M. Development and validation of LC-MS/MS assay for the determination ofButoconazole in human plasma: Evaluation of systemic absorption following topical application in healthy volunteers. Bull. Fac.Pharm. Cairo Univ. 2017, 55, 303–310. [CrossRef]
23. Choi, H.-I.; Kim, T.; Lee, S.-W.; Woo Kim, J.; Ju Noh, Y.; Kim, G.-Y.; Jin Park, H.; Chae, Y.-J.; Lee, K.-R.; Kim, S.-J.; et al. Bioanalysisof niclosamide in plasma using liquid chromatography-tandem mass and application to pharmacokinetics in rats and dogs. J.Chromatogr. B 2021, 1179, 122862. [CrossRef]
Molecules 2022, 27, 1977 15 of 15
24. Nguyen, T.-T.-L.; Duong, V.-A.; Vo, D.-K.; Jo, J.; Maeng, H.-J. Development and Validation of a Bioanalytical LC-MS/MS Methodfor Simultaneous Determination of Sirolimus in Porcine Whole Blood and Lung Tissue and Pharmacokinetic Application withCoronary Stents. Molecules 2021, 26, 425. [CrossRef]
25. Ji, Y.-G.; Shin, Y.-M.; Jeong, J.-W.; Choi, H.-I.; Lee, S.-W.; Lee, J.-H.; Lee, K.-R.; Koo, T.-S. Determination of motolimod concentrationin rat plasma by liquid chromatography-tandem mass spectrometry and its application in a pharmacokinetic study. J. Pharm.Biomed. Anal. 2020, 179, 112987. [CrossRef]
26. Maeng, H.-J.; Doan, T.N.K.; Yoon, I.-S. Differential regulation of intestinal and hepatic CYP3A by 1α,25-dihydroxyvitamin D3:Effects on in vivo oral absorption and disposition of buspirone in rats. Drug Dev. Res. 2019, 80, 333–342. [CrossRef] [PubMed]
27. Jeong, J.-W.; Oh, J.-H.; Ji, Y.-G.; Shin, Y.-M.; Lee, M.H.; Kang, N.S.; Lee, W.; Kim, S.-S.; Kim, T.-Y.; Koo, T.-S. Liquid chromatography–tandem mass spectrometry of recombinant human extracellular superoxide dismutase (rhSOD3) in mouse plasma and itsapplication to pharmacokinetic study. J. Pharm. Biomed. Anal. 2019, 164, 590–597. [CrossRef] [PubMed]