The herbicide safener cloquintocet-mexyl reduces rye-grass ...
Upload
independentCategory
view
3download
0
Journal of Cereal Science 29 (1999) 139–152
Article No. jcrs.1998.0229, available online at http://www.idealibrary.com on
Development of an In Vitro Enzymic DigestionMethod for Removal of Starch and Protein andAssessment of its Performance Using Rye and
Wheat Breads
A.-M. Aura∗, H. Harkonen†, M. Fabritius∗ and K. Poutanen∗
∗VTT Biotechnology and Food Research, P.O. BOX 1500, FIN-02044 VTT, Finland;†Vaasanmylly Oy, Kotka Factory, P.O. BOX 222, FIN-48101 Kotka, Finland
ABSTRACTThe development of an in vitro enzymic batch method for pretreatment of cereal samples prior to invitro fermentation is presented. A statistical experimental design is described and the importance ofbile and pepsin for the digestibility of starch was investigated. Day-to-day variation was studied bymeasuring glucose released and total starch in the digestion residue of rye flour. Four samples,wholemeal rye flour and bread, wholemeal and white wheat breads, were tested to evaluate theperformance of the digestion procedure. Pepsin and bile enhanced the hydrolysis of slowly digestiblestarch. The extent of starch hydrolysis in rye and wheat breads (93–95%) was reproducible andabout the same as using thermostable alpha-amylase. More soluble fibres were released from thewholemeal rye bread than from the wholemeal wheat bread.
The procedure is an efficient method for the removal of starch and protein under physiologicalconditions prior to in vitro fermentation. The method can also be used as a tool for studying thesolubility of dietary fibre (DF). 1999 Academic Press
Keywords: digestibility, in vitro, enzymic, cereals.
saccharides (NSP), such as cellulose and the non-INTRODUCTIONcellulosic polysaccharides of plant cell walls, which
In nutritional terms, plant polysaccharides can be resist digestion by the enzymes secreted into thedivided into two broad categories: starch, com- small intestine of man. These NSP make up theposed of a-linked glucans susceptible to hydrolysis major part of dietary fibre (DF). Starch may beby pancreatic alpha-amylase, and non-starch poly- classified into rapidly digestible starch (RDS),
slowly digestible starch (SDS) and resistant starch(RS)1.
Several methods have been developed using pan- : DF=dietary fibre; ES=enzymicstarch; NSP=non-starch polysaccharide; RDS=rap- creatic enzymes to study the in vitro digestion ofidly digestible starch; SDS=slowly digestible starch; polysaccharide-containing foods1–6,9. MeasurementRS=resistant starch; GI=glycemic index; HPLC= of the rate of starch hydrolysis has been provenhigh pressure liquid chromatography; Mw=weight-av- successful for prediction of the glycemic index (GI)erage molecular weight; R2=fit of the model; Q2= in food and for comparing the effects of processingpredictivity of the model; RSD=standard deviation on the nutritional properties of starch with in vivobetween predicted and measured values of the model; GI data2–5. The maximal extent of starch hydrolysisSEC-HPLC=size exclusion chromatography-high
has been used to measure RS1,6,7. In addition, ex-pressure liquid chromatography.tensive enzymic starch removal has been attemptedCorresponding author: A.-M. Aura. Tel: +358 9 4561. Fax:
+358 9 455 2103 (VTT). in pretreatments of cereal samples prior to sim-
0733–5210/99/020139+14 $30.00/0 1999 Academic Press
A.-M. Aura et al.140
Table I Composition of digestion mixtures used in theulated in vitro fermentations8,9. Hoebler et al.8 re-statistical design experimentsported a complete removal of starch from wheat
bran, beet pulp, corn germ meal and pea fibre using Sample 1·5 g sample+15 mL distilled waterVtot=15 mLthermostable alpha-amylase pretreatment at 100 °C
Mouth +10 mL 0·85 w% NaCl solutionas shown by the absence of the iodine reaction, but+salivary alpha-amylase (Sigma A-0521,to our knowledge such a high degree of removal has 50U)
not been even closely approached in vitro at physio- pH 6·5 5 min 37 °C 250 rpmlogical temperatures. There has been little study on Vtot=25 mL
Stomach +4·5 mL 150 m HClthe role of bile salts in starch removal, although+ 1·5 mL pepsin (Sigma P-7012,Minekus et al.10 described a multicompartmental0·6–2·0 mg) )continuous computer-controlled in vitro model sim- pH below 2·5
ulating the stomach and small intestine, in which 2 h 37 °C 250 rpmthe porcine bile salt concentration varied. Vtot=31 mL
Duodenum +4 mL bovine bile (Sigma B-8381,Traditionally, rye bread produced from whole-0·4–0·7 g)meal flour is widely consumed in Finland. It has
+ +4 mL pancreatin (Sigma P-1750,a high dietary fibre content. Consumption of such 10–75 mg)fibre rich foods can substantially reduce the risk of Jejunum +1 mL mucin (Sigma M-2378, 75 mg)coronary heart disease, and particularly coronary pH 6·9
3 h 37 °C 250 rpmdeath11. It is also suggested that phytoestrogensVtot=40 mL(lignans) present in rye might act as natural cancer-
preventive compounds12. However, more in-formation is needed about the influence of pro-cessing on the digestibility and bioavailability ofthe dietary fibre in rye and other dietary sources. MethodsFor such studies, in vitro enzymic methods re-
Development of the in vitro enzymic procedureproducing, as far as possible, physiological con-The batch method tested was based on the multi-ditions are needed to prepare fibre residues withchamber reactor system described by Molly et al.9.minimal amount of starch for in vitro fermentationThe composition of the digestion mixtures usedstudies to provide further information on the useto simulate the successive stages of alimentaryof dietary fibre by human faecal bacteria. Thisdigestion are shown in Table I. Experimentalwas the aim of the present study.designs were developed with Modde for WindowsHere we describe the development of an in vitrosoftware (Umetri AB, Umea, Sweden). In addition,enzymic batch method using a statistical ex-the fit (R2) and the predictivity (Q2), of the modelperimental design, and evaluate the importancewere calculated using cross-validation, in whichof pepsin and bile for the digestibility of starcheach predicted point was calculated using theand protein. Four flour and bread samples weremeasured values of the other points of the model.digested with varying combinations of alpha-amyl-Standard deviations of the models (RSD) werease, pancreatin and bile and the residues char-calculated from the difference between the pre-acterised to evaluate the performance of thedicted and measured values. Two experimentalmethod. The types of starch and DF componentsdesigns were created to study the possible syner-in the residues were also characterised.gistic effects of pepsin and pancreatin, or pan-creatin and bile (Table II) and to adjust the final
EXPERIMENTAL enzyme and bile concentrations (Table III) to alevel which allowed maximal starch hydrolysis asCereal substrates measured by glucose release.
Wholemeal rye flour (cv. ‘Anna’) was used in thedevelopment of the in vitro method. The rye bread Enzymic digestion procedure
The cereal sample was weighed (1500±2 mg) intoused was a commercial soft, wholemeal sour breadcontaining 20% wheat flour. Wholemeal wheat a 100 mL beaker. Distilled water (15 mL) and
0·85 wt% saline solution (10 mL) were added tobread and white wheat bread were baked at theVTT test bakery. The breads were freeze-dried the samples and blanks. The samples were brought
to 37 °C with stirring at 250 rev/min. All theand milled to pass an 800-lm sieve before testing.

In vitro enzymic method 141
Table II Variables used in the first statistical experimental design using cooked rye flour, andthe glucose responses
Experiment Salivary Pepsin Pancreatin Bile Glucoseamylase(U) (mg) (mg) (g) (mg)
1 10 (−) 0·6 (−) 10 (−) 0·4 (−) 7852 40 (+) 0·6 (−) 10 (−) 0·4 (−) 8023 10 (−) 1·4 (+) 10 (−) 0·4 (−) 8184 40 (+) 0·6 (−) 40 (+) 0·4 (−) 7535 10 (−) 1·4 (+) 40 (+) 0·4 (−) 8346 40 (+) 1·4 (+) 40 (+) 0·4 (−) 8347 10 (−) 0·6 (−) 10 (−) 0·6 (+) 8248 10 (−) 1·4 (+) 10 (−) 0·6 (+) 8569 40 (+) 1·4 (+) 10 (−) 0·6 (+) 856
10 10 (−) 0·6 (−) 40 (+) 0·6 (+) 84011 40 (+) 0·6 (−) 40 (+) 0·6 (+) 88912 40 (+) 1·4 (+) 40 (+) 0·6 (+) 93713 10 (−) 1 (0) 25 (0) 0·5 (0) 83014 40 (+) 1 (0) 25 (0) 0·5 (0) 79815 25 (0) 0·6 (−) 25 (0) 0·5 (0) 78216 25 (0) 1·4 (+) 25 (0) 0·5 (0) 83017 25 (0) 1 (0) 10 (−) 0·5 (0) 76618 25 (0) 1 (0) 40 (+) 0·5 (0) 78219 25 (0) 1 (0) 25 (0) 0·4 (−) 79820 25 (0) 1 (0) 25 (0) 0·6 (+) 83021 25 (0) 1 (0) 25 (0) 0·5 (0) 81422 25 (0) 1 (0) 25 (0) 0·5 (0) 81423 25 (0) 1 (0) 25 (0) 0·5 (0) 79824 25 (0) 1 (0) 25 (0) 0·5 (0) 814
Variables: Salivary alpha-amylase, pepsin, pancreatin and bile concentrations in 1500 mgsample.
Response: Glucose released to the supernatants after trifluoroacetic acid hydrolysis.
incubations were performed under the same con- At the end of the incubation the samples werecentrifuged and the amount of glucose release wasditions. Salivary alpha-amylase (Sigma A-0521) di-
luted to 1000 U/mL with 1 m calcium chloride measured after acid hydrolysis. In the procedurefinally adopted (Fig. 1) the volume of the digestcontaining sodium phosphate buffer (20 m, pH
6·9) was added (10–40 or 50 U/sample). The was adjusted to 45 mL in a centrifugation tube,centrifuged at 6900 g for 5 min, the supernatantssamples were incubated for 5 min13. Hydrochloric
acid solution (150 m, 4·5 mL) was added and the filtered (Whatman 41), and samples of supernatantwere frozen for further analysis. The residues werepH was maintained below 2·5. Pepsin (Sigma P-
7012, 0·6–2·0 mg) dissolved in 1 mL of 20 m washed with 25 mL of distilled water, centrifugedat 10 800 g for 10 min and freeze-dried beforehydrochloride acid per sample was added14. Hy-
drochloric acid (20 m, 1 mL) was added to the analysis.blanks and the samples were incubated for 2 h.Bovine bile (Sigma B-8381, 0·4–0·6 g) dissolved in HPLC analysis of glucose in digests
Glucose was analysed by HPLC after tri-4 mL of 150 m sodium bicarbonate solution persample was added to the digest followed by pan- fluoroacetic acid hydrolysis of the enzymic digests
as follows. Filtered supernatant (0·5 mL) was madecreatin (Sigma P-1750, 10–75 mg, 163·5 U/mg)dissolved in 4 mL of 150 m sodium bicarbonate 2 with trifluoroacetic acid (Fluka 91700) and
incubated for 2 h at 95 °C. The glucose was meas-solution per sample. Sodium bicarbonate solution(150 m, 8 mL) was added to the blanks. Mucin ured using a Hewlett-Packard 1090 LC-system
with HP 1037A refractive index detector operating(Sigma M-2378, 75 mg) dissolved in 1 mL of dis-tilled water per sample was added to all samples9. at 40 °C, with a precolumn (Bio-Rad Deashing
Cartridge) and a ligand-exchange column in leadThe samples were incubated for 3 h.
A.-M. Aura et al.142
Table III Variables used in the second statistical experimental design usingraw rye flour, and the glucose responses
Experiment Pepsin Pancreatin Bile Glucose(mg) (mg) (g) (mg)
1 1 (−) 25 (−) 0·5 (−) 5282 2 (+) 25 (−) 0·5 (−) 6403 1 (−) 75 (+) 0·5 (−) 7684 2 (+) 75 (+) 0·5 (−) 7845 1 (−) 25 (−) 0·7 (+) 5446 2 (+) 25 (−) 0·7 (+) 6567 1 (−) 75 (+) 0·7 (+) 7688 2 (+) 75 (+) 0·7 (+) 7689 1 (−) 50 (0) 0·6 (0) 720
10 2 (+) 50 (0) 0·6 (0) 78411 1·5 (0) 25 (−) 0·6 (0) 62412 1·5 (0) 75 (+) 0·6 (0) 75213 1·5 (0) 50 (0) 0·5 (−) 73614 1·5 (0) 50 (0) 0·7 (+) 75215 1·5 (0) 50 (0) 0·6 (0) 70416 1·5 (0) 50 (0) 0·6 (0) 75217 1·5 (0) 50 (0) 0·6 (0) 73618 1·5 (0) 50 (0) 0·6 (0) 720
Variables: Pepsin, pancreatin and bile concentrations in 1500 mg sample.Response: Glucose released to the supernatant after trifluoroacetic acid
hydrolysis.
form (Shodex SP0810, 300×8 mm, Showa Denko, Analyses were conducted as previously describedfor rye flour.Japan). The flow rate with HPLC-grade water was
0·6 mL/min and the column temperature was80 °C. Data were collected with a Millennium Characterisation of the residues2010 Chromatography Workstation. The amount Total and enzymically available starch contentsof glucan was calculated as 0·9 times the amount (±2%) were determined using an AA/AMG 6/of released glucose. 95 kit (Megazyme, Australia). Samples were sus-
pended in 4 KOH, incubated for 30 min at roomEstimation of day-to-day variation temperature and the pH adjusted to 7·0 with 2 The day-to-day variation of the final procedure and 0·5 HCl prior to total starch analysis, or(Fig. 1) was studied using raw wholemeal rye flour. suspended in buffer (pH 7·0) to the analysis ofTwelve individual samples were treated on six enzymic available starch (ES). Starch was hy-different days, the 12 batches produced on each drolysed using thermostable alpha-amylase atday were combined and the dry residues analysed 95 °C.for total and enzymically available starch, protein, Soluble and insoluble DF (±0·3–0·5%) wereash, insoluble dietary fibre, soluble dietary fibre, measured according to the method of Asp et al.15,pentosans and b-glucan. Averages and standard in which insoluble DF was separated by filtrationdeviations were calculated using Microsoft Excel and soluble DF precipitated from the filtrate using5.0. ethanol. Total DF content was calculated as the
sum of insoluble and soluble fibre contents ofbreads and in vitro residues. In comparison ofAssessment of the procedure
Washed and freeze-dried insoluble residues of wholemeal rye and wheat breads, the yields of DFcomponents were calculated from the differencesbreads after the in vitro digestion were prepared
according to the procedure finally adopted (Fig. between total, insoluble and soluble DF, pentosansand b-glucans of the samples and their in vitro1). Twelve samples, produced on four different
days, were combined and divided into four in- residues. Protein content (±0·4%) was determinedby the Kjeldahl method (6·25×nitrogen). Ashdividual samples to avoid day-to-day variation.

In vitro enzymic method 143
Bread
Freeze-drying
Milling (Sieve 800 µm)
Sample (1500 mg as is)
pH 6.55 min, 37°C, 250 rpm
pH 2.52 h, 37°C, 250 rpm
pH 6.5–7.53 h, 37°C, 250 rpm
Centrifugation 6900 g, 5 min
Insoluble residueFiltration
Whatman 41
Solubles
Centrifugation10 800 g, 10 min
Insoluble residue
Freeze-drying
Dry residue (~300 mg)
Supernatant discarded
+15 mL distilled water+10 mL 0.85 w-% NaCl solution+50 U Salivary amylase Sigma A-0521
Mouth
+4.5 mL 150 mM HCl+1 mL Pepsin Sigma (P-7012) 2 mg/mL
Stomach
+ 4 mL Bile Sigma B-8381 (150 mg/mL)+4 mL Pancreatin Sigma P-1750 (18.75 g/mL)+1mL Mucin Sigma M-2378 (75 mg/mL)
Duodenum + Jejunum
+Distilled water up to 45 mL
Ileum
Vtot = 25 mL
Vtot = 31 mL
Vtot = 40 mL
Vtot = 45 mL
+25 mL distilled water
Figure 1 Protocol for the final in vitro enzymic method.
content (±0·1%) was determined as the residue (DL 18; Mettler, Zurich, Switzerland). The ana-lyses for rye flour and bread samples were con-after ashing at 550 °C in a temperature pro-
grammed, muffle oven. Total pentosan content ducted in duplicate for soluble and insoluble fibreand in triplicate for other components.(±0·5%) was analysed according to the colori-
metric, phloroglucinol method of Douglas16. Theamount of b-glucan (±0·5%) was determined by Alpha-amylase activity of pancreatin
The alpha-amylase activity of pancreatin was meas-a specific, enzymic BBG 6/93 kit (Megazyme,Australia). The moisture content (±0·3%) of the ured using the Ceralpha method (Megazyme, Aus-
tralia). The pancreatin was extracted at roomresidues was measured with a Karl-Fischer titrator

A.-M. Aura et al.144
temperature at pH 5·2 and the activity was meas- RESULTSured at 40 °C for 10 min using BPNPG7 (Mega-
Development of the in vitro enzymic procedurezyme, Australia) as substrate.The experimental design was studied using themethod described in Table I. The first ex-Microstructureperimental design (Table II) was performed usingFreeze-dried and ground samples were moistened cooked rye flour and low enzyme and bile con-with water and embedded in 2 wt% agar. Agar centrations to determine the cross-effects of thecubes were fixed in 1 wt% glutaraldehyde in 0·1 enzymes and bile. Salivary alpha-amylase con-phosphate buffer (pH 7·0), washed with water, centration was included as a variable. The secondand dehydrated with ethanol and acetone. Samples experimental design (Table III) was applied to raw
were infiltrated and polymerised with the Histo- rye flour using higher enzyme and bile con-resin Embedding Kit ( Jung, Germany). Sections, centrations to determine the maximum effective4-lm thick, were cut with a microtome (Leica Jung enzyme and bile dosages. The amounts of pepsin,RM2055, Germany). The sections were stained for pancreatin and bile were varied, and the glucansstarch with Lugol’s solution, and for proteins with released to the supernatant were analysed as gluc-0·1 wt% Light Green. In bright-field microscopy, ose in both trials. Minor amounts of b-glucan wereamylose stained dark blue and amylopectin brown, also solubilised since the acid hydrolysis was notnative starch granules appeared black, aleurone selective for starch digestion products and areprotein yellow and endosperm green. The samples included in the glucose values. In analysis of thewere examined and photographed with an Olym- data the contribution of b-glucan was consideredpus BX-50 microscope ( Japan). to be constant. The variables, their levels and
glucose responses are shown in Tables II and IIIfor the first and second designs, respectively.Determination of weight average molecular
The extent of glucose released in the first designweight (Mw) of b-glucan(Table II) was best described by this equation:The sample was dissolved in 0·1 sodium hy-
droxide to achieve a b-glucan concentration of Glucose (mg)=1498·9+18·5 X−7·1 Y20–200 mg/L. The samples were loaded in +2956·2Z+2977·1 Z2
100 lL. For the determination of weight average +1·9 XY+12·1 YZ, (1)molecular weight Mw a size-exclusion (SEC) cal-ibration curve was constructed from narrow mo- where X=pepsin level (mg), Y=pancreatin levellecular weight b-glucan standards (Mw (mg) and Z=bile level (g). According to equation300 000–30 000), which were separated from bar- (1) bile concentration had the strongest positiveley b-glucan fractions (Biocon, Australia) and cal- effect on the response, i.e., glucose liberated, butibrated with right angle laser light scattering. For pancreatin concentration had a slightly negativethe determination of b-glucan concentration, bar- effect on the response. Synergistic effects of pepsinley b-glucan (Lot 40305, Mw 190 000, Biocon, and pancreatin or pancreatin and bile were posi-Australia) was used as a standard, Calcofluor (Al- tive, but not very strong.drich 29,418-7, 30 mg/L in 0·1 NaOH) was The results of the first experimental designadded as a post-column reagent at a flow-rate of showed that salivary alpha-amylase (10–40 U/0·3 mL/min and b-glucan was detected using a sample) had little effect on the overall digestibilityfluorescence detector. The SEC-HPLC equipment of starch in the range of enzyme concentration(Waters Corp., Milford, MA, U.S.A.) consisted of tested, as compared with the other alimentarya M-590 pump, M-715 automatic injector, M- enzymes. When comparison was made between474 fluorescence detector (kem.=410 nm, kex.= experiments 1 (10 U/1500 mg) and 2 (40 U/440 nm) and nitrogen driven, reagent delivery 1500 mg) (Table II), with low amounts of othermodule. The columns were lHydrogel 2000, 500 alimentary enzymes and bile, the amount of gluc-and 250 columns at 70 °C. The eluent was 50 m ose liberated was increased only by 2%. Whensodium hydroxide at a flow-rate of 0·5 mL/min. salivary alpha-amylase was one of the variables inThe system was controlled and data were pro- the first design, the fit (R2) and the predictivitycessed with a Millennium Workstation (Waters (Q2) of the first model were poor (results not
shown). On this basis, salivary alpha-amylase wasCorp., Milford, MA, U.S.A.).
In vitro enzymic method 145
850
Glu
cose
(m
g)
(a)
840
830
820
810
800
790
78010 15
2025
3035
40 0.6
0.8
1.0
1.21.4
Pancreatin (mg)
Pepsin
(g)
Bi = 0.500
Glu
cose
(m
g)
(b)
2.01.81.6
1.41.2
1.0
706050
30 40
550
600
650
700
Pancreatin (mg)
Bi = 0.600
Pepsin (m
g)
750
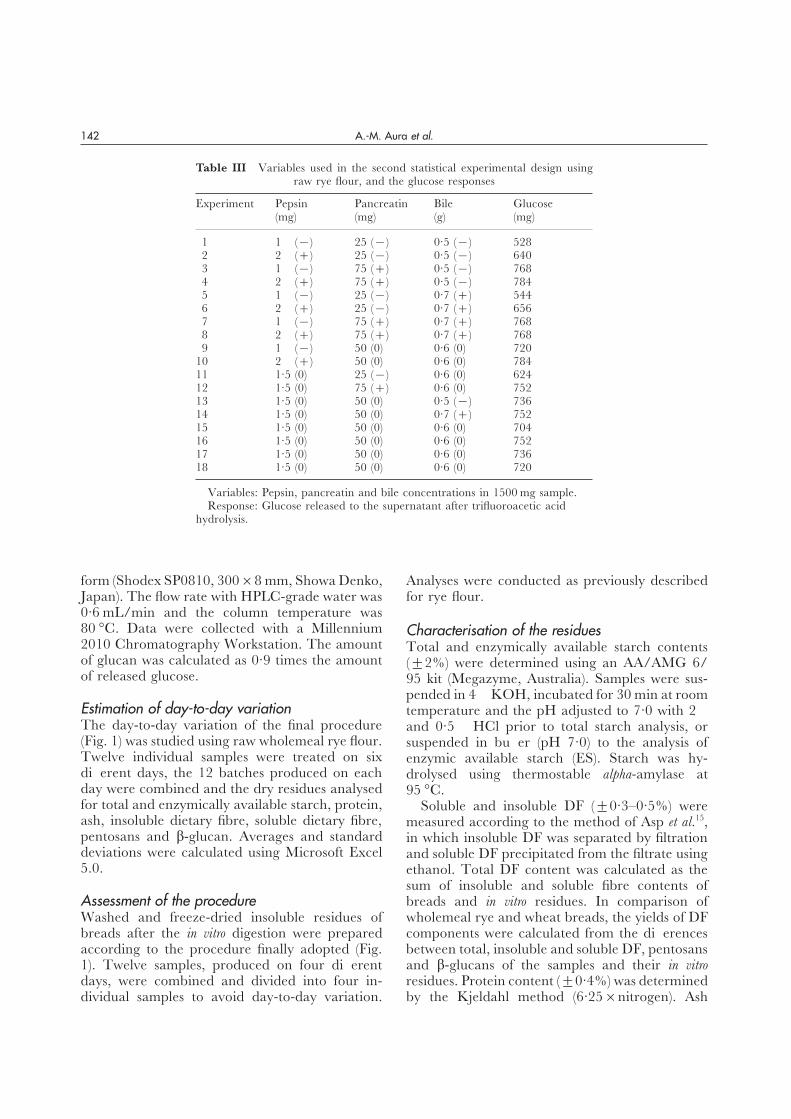
Figure 2 Influence of pepsin on the effectiveness of pancreatin in starch digestion (% of glucose derived from all glucans).Variables in 1500 mg of sample: (a) Sample: Cooked wholemeal rye flour. Pepsin: 0·6–1·4 mg; Pancreatin: 10–40 mg; Constantbile concentration: 0·5 g (R2: 0·84; Q2: 0·72). (b) Sample: Raw wholemeal flour. Pepsin: 1–2 mg; Pancreatin: 25–75 mg;Constant bile concentration: 0·6 g (R2: 0·96; Q2: 0·93).
excluded from the list of variables used in the of the pancreatin concentration at low pepsin con-centrations [Fig. 2(a)]. As the pepsin concentrationmodelling. On re-calculation the R2 and Q2 were
0·84 and 0·72, respectively, for the first model. was increased, the extent of starch hydrolysis wasincreased, until it reached a plateau at a pepsin levelThe standard deviation between predicted and
measured values (RSD) was 18·3 mg glucose. The of 1·5 mg [Fig. 2(b)]. In the method finally adopted(Fig. 1) the amount of pepsin was fixed at 2 mg/dosage of salivary alpha-amylase was adjusted to
50 U/1500 mg sample from there on. Figures 2(a) 1500 mg sample to give a pepsin concentrationslightly above the plateau value.and 3(a) show the response surfaces in the first
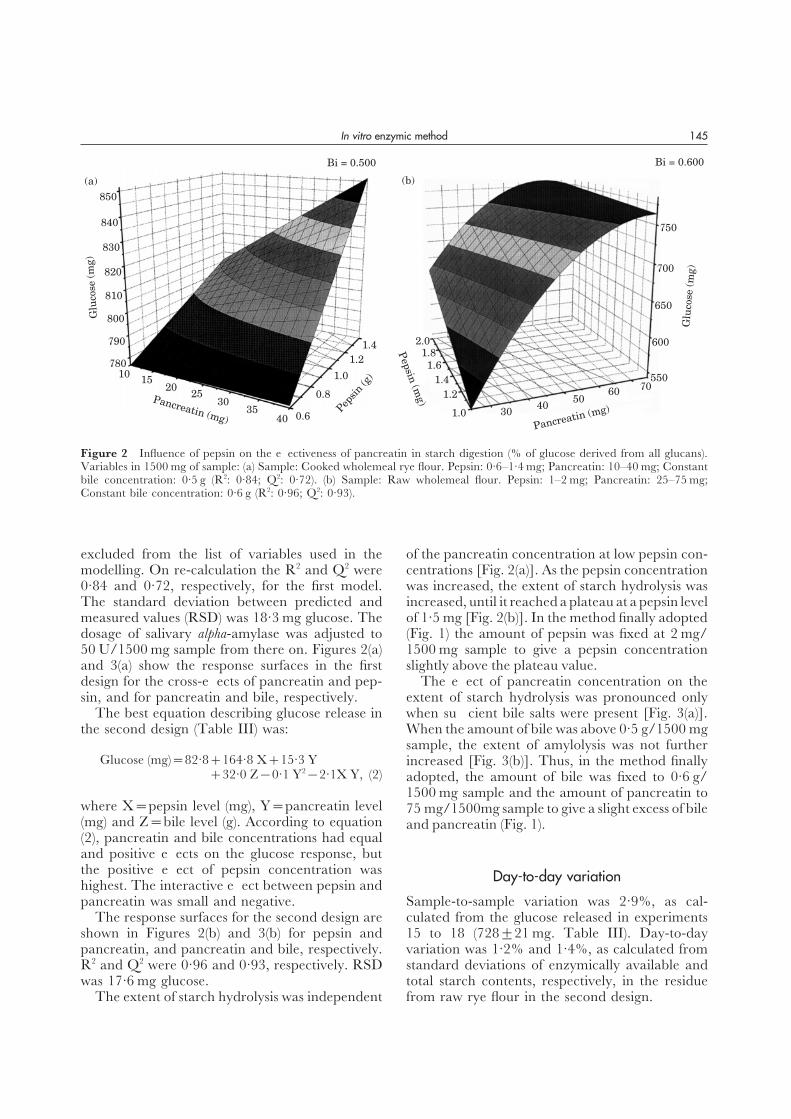
design for the cross-effects of pancreatin and pep- The effect of pancreatin concentration on theextent of starch hydrolysis was pronounced onlysin, and for pancreatin and bile, respectively.
The best equation describing glucose release in when sufficient bile salts were present [Fig. 3(a)].When the amount of bile was above 0·5 g/1500 mgthe second design (Table III) was:sample, the extent of amylolysis was not further
Glucose (mg)=82·8+164·8 X+15·3 Y increased [Fig. 3(b)]. Thus, in the method finally+32·0 Z−0·1 Y2−2·1X Y, (2) adopted, the amount of bile was fixed to 0·6 g/
1500 mg sample and the amount of pancreatin towhere X=pepsin level (mg), Y=pancreatin level 75 mg/1500mg sample to give a slight excess of bile(mg) and Z=bile level (g). According to equation and pancreatin (Fig. 1).(2), pancreatin and bile concentrations had equaland positive effects on the glucose response, butthe positive effect of pepsin concentration was Day-to-day variationhighest. The interactive effect between pepsin andpancreatin was small and negative. Sample-to-sample variation was 2·9%, as cal-
culated from the glucose released in experimentsThe response surfaces for the second design areshown in Figures 2(b) and 3(b) for pepsin and 15 to 18 (728±21 mg. Table III). Day-to-day
variation was 1·2% and 1·4%, as calculated frompancreatin, and pancreatin and bile, respectively.R2 and Q2 were 0·96 and 0·93, respectively. RSD standard deviations of enzymically available and
total starch contents, respectively, in the residuewas 17·6 mg glucose.The extent of starch hydrolysis was independent from raw rye flour in the second design.
A.-M. Aura et al.146
Glu
cose
(m
g)
(a)
880
860
840
820
800
10 1520
2530
3540 0.40
0.45
0.50
0.550.60
Pancreatin (mg)
Bile (g
)
Pe = 1.000
Glu
cose
(m
g)
(b)
0.700.65
0.60
0.55
0.50
706050
3040
600
650
700
Pancreatin (mg)
Pe = 1.500
Bile (g)
750
Figure 3 Effects of bile salts on the effectiveness of pancreatin in starch digestion (% of glucose derived from all glucans).Variables per 1500 mg of sample: (a) Sample: Cooked wholemeal rye flour. Pancreatin: 10–40 mg; Bile: 0·4–0·6 g; Constantpepsin concentration: 1·0 mg (R2: 0·84; Q2: 0·72). (b) Sample: Raw wholemeal flour. Pancreatin: 25–75 mg; Bile: 0·5–0·7 g;Constant pepsin concentration: 1·5 mg (R2: 0·96; Q2: 0·93).
Table IV Amounts and compositions of substrates used in the in vitro method (n=3)
Wholemeal Wholemeal Wholemeal Whiterye flour rye bread wheat bread wheat bread
Average .. Average .. Average .. Average ..
Dry weight amount (mg) 1350 2 1416 2 1473 2 1406 2Dry weight content (%) 90·0 94·4 98·2 93·7Total starch (%) 59·6 1·0 58·9 0·5 64·1 0·6 71·9 0·4
of which ES (%) 100 96 100 99aTotal DF (%) 16·5 15·3 14·0 5·0
Insoluble DF (%) 12·5 0·7 11 0·1 12·8 0·1 3·0 0·4Soluble DF (%) 4·0 0·4 4·3 0·4 1·2 0·4 1·0 0·1
Pentosan (%) 8·5 0·7 7·1 0·1 6·3 0·3 2·1 0·1b-Glucan (%) 1·20 0·08 1·4 0·02 0·57 0·05 0·20 0·02Protein (%) 12·3 0·1 12·7 0·1 13·3 0·1 14·1 0·1Ash (%) 2·0 0·1 3·0 0·1 2·3 0·1 1·6 0·1
a Total DF=Insoluble DF+Soluble DF (n=2).
IV. The dry weight of the residue was largest inAssessment of the performance of the methodrye flour and smallest in white wheat bread.
Yields of the DF components from wholemealThe success of the in vitro method was studiedrye and wheat breads were compared after di-using wholemeal rye flour and bread, and whole-gestion. Rye flour and white wheat bread weremeal and white wheat breads. The chemical com-excluded from the comparison, because rye flourposition of the flour and bread samples is shownwas unprocessed and white wheat bread containedin Table IV. The residual dry weights, total starchonly small amounts of DF components (Table IV).and protein contents after in vitro enzymic di-
The starch in wholemeal wheat bread, whitegestion, as a percentage of those originally presentin the flour and bread samples, are shown in Table wheat bread and rye bread was digested to about
In vitro enzymic method 147
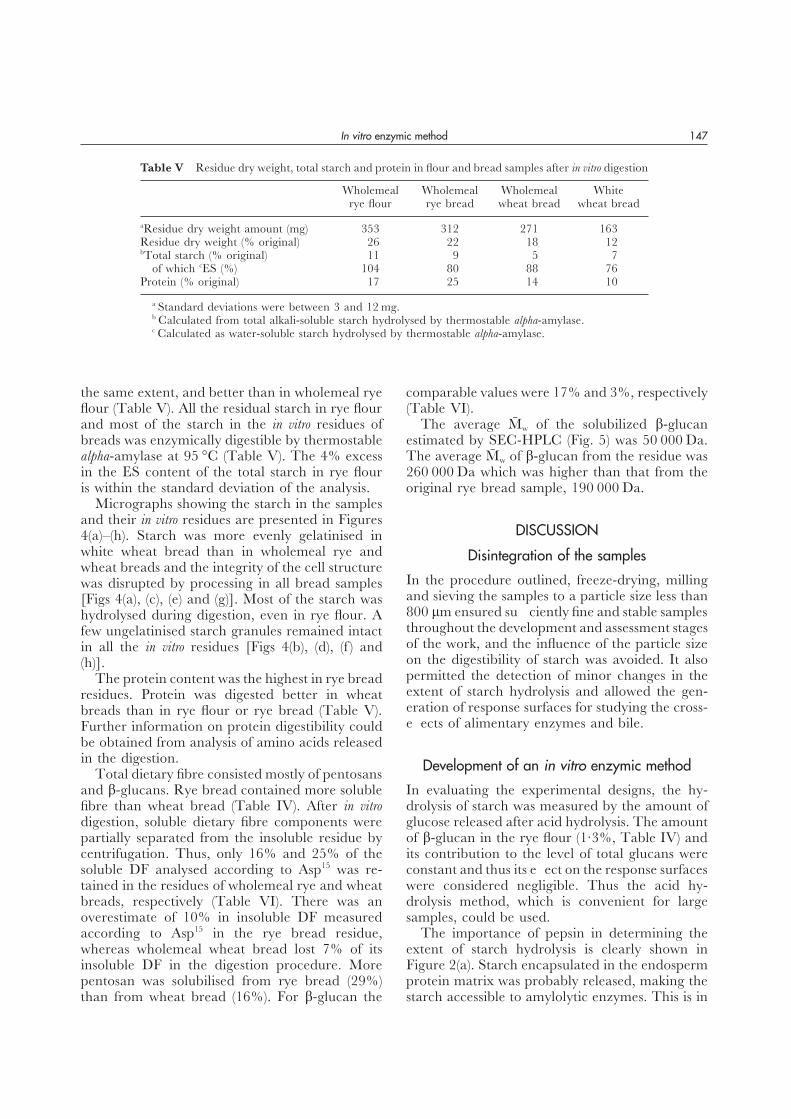
Table V Residue dry weight, total starch and protein in flour and bread samples after in vitro digestion
Wholemeal Wholemeal Wholemeal Whiterye flour rye bread wheat bread wheat bread
aResidue dry weight amount (mg) 353 312 271 163Residue dry weight (% original) 26 22 18 12bTotal starch (% original) 11 9 5 7
of which cES (%) 104 80 88 76Protein (% original) 17 25 14 10
a Standard deviations were between 3 and 12 mg.b Calculated from total alkali-soluble starch hydrolysed by thermostable alpha-amylase.c Calculated as water-soluble starch hydrolysed by thermostable alpha-amylase.
the same extent, and better than in wholemeal rye comparable values were 17% and 3%, respectively(Table VI).flour (Table V). All the residual starch in rye flour
and most of the starch in the in vitro residues of The average Mw of the solubilized b-glucanestimated by SEC-HPLC (Fig. 5) was 50 000 Da.breads was enzymically digestible by thermostable
alpha-amylase at 95 °C (Table V). The 4% excess The average Mw of b-glucan from the residue was260 000 Da which was higher than that from thein the ES content of the total starch in rye flour
is within the standard deviation of the analysis. original rye bread sample, 190 000 Da.Micrographs showing the starch in the samples
and their in vitro residues are presented in FiguresDISCUSSION4(a)–(h). Starch was more evenly gelatinised in
white wheat bread than in wholemeal rye and Disintegration of the sampleswheat breads and the integrity of the cell structure
In the procedure outlined, freeze-drying, millingwas disrupted by processing in all bread samplesand sieving the samples to a particle size less than[Figs 4(a), (c), (e) and (g)]. Most of the starch was800 lm ensured sufficiently fine and stable sampleshydrolysed during digestion, even in rye flour. Athroughout the development and assessment stagesfew ungelatinised starch granules remained intactof the work, and the influence of the particle sizein all the in vitro residues [Figs 4(b), (d), (f ) andon the digestibility of starch was avoided. It also(h)].permitted the detection of minor changes in theThe protein content was the highest in rye breadextent of starch hydrolysis and allowed the gen-residues. Protein was digested better in wheateration of response surfaces for studying the cross-breads than in rye flour or rye bread (Table V).effects of alimentary enzymes and bile.Further information on protein digestibility could
be obtained from analysis of amino acids releasedin the digestion. Development of an in vitro enzymic methodTotal dietary fibre consisted mostly of pentosansand b-glucans. Rye bread contained more soluble In evaluating the experimental designs, the hy-
drolysis of starch was measured by the amount offibre than wheat bread (Table IV). After in vitrodigestion, soluble dietary fibre components were glucose released after acid hydrolysis. The amount
of b-glucan in the rye flour (1·3%, Table IV) andpartially separated from the insoluble residue bycentrifugation. Thus, only 16% and 25% of the its contribution to the level of total glucans were
constant and thus its effect on the response surfacessoluble DF analysed according to Asp15 was re-tained in the residues of wholemeal rye and wheat were considered negligible. Thus the acid hy-
drolysis method, which is convenient for largebreads, respectively (Table VI). There was anoverestimate of 10% in insoluble DF measured samples, could be used.
The importance of pepsin in determining theaccording to Asp15 in the rye bread residue,whereas wholemeal wheat bread lost 7% of its extent of starch hydrolysis is clearly shown in
Figure 2(a). Starch encapsulated in the endosperminsoluble DF in the digestion procedure. Morepentosan was solubilised from rye bread (29%) protein matrix was probably released, making the
starch accessible to amylolytic enzymes. This is inthan from wheat bread (16%). For b-glucan the

A.-M. Aura et al.148
Figure 4 Light micrographs of rye flour and rye and wheat breads. (a) ‘Anna’ wholemeal rye flour before and (b) after invitro digestion; (c) wholemeal rye bread before and (d) after in vitro digestion; (e) wholemeal wheat bread before and (f ) after invitro digestion; and (g) white wheat bread before and (h) after in vitro digestion with alimentary enzymes. Starch granules appearblack, amylose blue and amylopectin brown, proteins green and yellow. Bar=50 lm.

In vitro enzymic method 149
Table VI Comparison of yields of DF components in the drolysis, because the starch had been gelatinised.in vitro residues from wholemeal rye and wheat breads Thus, unprocessed wholemeal rye flour was used
to fix the final enzyme concentrations of the pro-Wholemeal Wholemealrye bread wheat bread cedure.
In model calculations using values of 2 mg pep-aTotal DF (% original substrate) 84 87 sin, 75 mg pancreatin and 0·6 g bile, the predictedInsoluble DF (% original 110 93maximum value for glucose release was 767 mg.substrate)
Soluble DF (% original substrate) 16 25 The corresponding measured maximum value ofPentosan (% original substrate) 71 84 glucose release was 784 mg. Thus, the predictedb-Glucan (% original substrate) 83 97 value was acceptable. The difference between pre-
dicted and measured values was within the limitsa Total DF=Insoluble DF+Soluble DF.of ±2× RSD (±35·1 mg) with 95% probability.Because the fit (R2=0·96) and the predictivity(Q2=0·93) were at acceptable levels in the secondmodel and the RSD (17·6 mg) was lower thanthe sample-to-sample variation (21 mg), the modelgave a good prediction of the hydrolysis of starch.The responses to the variables were in quite asmall range, because the model operated at theupper limit of starch hydrolysis and glucose release.Thus, it was decided that the measurement ofstarch digestibility should be based on the starchcontent of the insoluble residue.
Digestibility of starch
The content of alkali-soluble starch in the whole-meal rye flour was 59·6% (Table IV). The meas-ured maximum values of glucose release (784 mg;Table III, Experiment 10, and 937 mg; TableII, Experiment 12) corresponded to 706 mg and
Figure 5 SEC-HPLC chromatogram of wholemeal rye 843 mg starch in the raw and cooked wholemealbread b-glucans before and after in vitro digestion with al-rye flour, respectively, i.e., 88% and 105% ofimentary enzymes: bread (A: Mw=190 000); insoluble residuethe alkali-soluble starch was digested. The high(B: Mw=260 000) and supernatant (C: Mw=50 000). b-
glucans were detected with a fluorescent detector after post- hydrolysis level of cooked flour was probably duecolumn staining with Calcofluor. to a very small particle size of the sample, good
gelatinisation during cooking and release of glu-cans other than starch. The digestibilities of starchmeasured from the alkali-soluble starch content ofaccordance with the result of Holm et al.17 whothe residues were 89% and 91% for wholemealfound that the susceptibility of starch to hydrolysisraw rye flour and rye bread, respectively. Theby alpha-amylase in raw and boiled wheat samplesmeasurement of starch digestibility based on ana-was substantially enhanced by pepsin. In additionlysis of glucose release agreed fairly well withto pepsin, bile salts had a marked effect on thethe digestibility measured from the alkali-solubleextent of starch hydrolysis [Fig. 3(a)]. Since bilestarch content of the residue.salts act as emulsifying agents, they may have
Measurements of the rate of starch hydrolysisenhanced the interactions between starch and pan-provides a tool for studying the effects of processingcreatin.on the nutritional properties of starch in com-The higher enzyme concentrations used in theparison with the glycemic index values in vivo5,18,19.second experimental design led to such extensiveWhen the hydrolysis rate of starch was measured indigestion of starch in cooked rye flour that noan in vitro procedure using alpha-amylase digestion,response surfaces could be accessed. The cooked
rye flour was more susceptible to enzymic hy- an 80% final extent of starch hydrolysis was found

A.-M. Aura et al.150
for wheat starch18 and 69% for cooked rolled oats19. reproduce the degree of starch hydrolysis foundin the ileostomy model23. However, the end of theThe extent of starch hydrolysis for boiled potatoes
was 75·2% and for white wheat bread 74·9% in the small intestine of ileostomy patients is not sterileand some deterioration of readily fermentableexperiments of Goni et al.5. These procedures used
lower dosages of alpha-amylase than in the method starch might occur before analysis. Cummings andEnglyst24 evaluated the amount of starch fromintroduced here, and the food samples were pre-
sented as eaten. various foods entering the colon using hydrogenbreath tests and compared the data with that fromHoebler et al.20 reported amylolysis efficiencies
of 83·6% and 91·2% for wheat bran and corn ileostomy patients. In wholemeal and white breadabout 8·3% and 10·7% of starch, respectively, wasgerm meal, respectively, using thermostable alpha-
amylase at 100 °C. In the in vitro method described undigested, as measured by hydrogen excretion inbreath, compared with 10·0% and 12·4%, re-here the extent of starch hydrolysis in bread
samples at physiological pHs and temperatures spectively, in the ileostomy patients. Overall onWestern diets, it was estimated that 10% of allwas increased to 93–95% by including pepsin and
bile and a high dosage of pancreatin. The small starch is probably resistant starch24. Thus, the invitro method described here achieves levels of starchparticle size (less than 800 lm) also contributed to
the high degree of starch hydrolysis. hydrolysis similar to those found prior to colonThe starch in the in vitro residue (ES) was resistant fermentation in vivo.
to treatment with pancreatin at 37 °C, but washydrolysed with thermostable alpha-amylase at95 °C. This moiety of starch could be an amor- Changes in DF componentsphous fraction of resistant starch21, or from un-
The wheat and rye high-fibre samples containedgelatinised starch granules, which are difficult toabout equal amounts of insoluble dietary fibre,hydrolyse at lower temperatures. Hydrolysis ofbut the amount of soluble fibre was about fourstarch granules started from specific susceptibletimes higher in rye samples than in wheat samples.zones in the centre of starch granules [Figs 4(b)
Estimates of the amounts of insoluble and sol-and (f )] as previously described by Galant et al.22.uble fibre are method dependent. Some soluble DFThis component of starch is likely to be digestedmeasured according to Asp15 was still ‘insoluble’ inby thermostable alpha-amylase at 95 °C.the rye and wheat bread samples after starchMicroscopy [Figs 4(a)–(h)] showed that part ofdigestion. There was a 10% over-estimate of in-the starch was enclosed in the cell wall matrix and,soluble DF of the rye bread residue. The over-thus, rendered physically inaccessible to enzymeestimate could be due to the added mucin. Theaction under physiological conditions. This com-slight loss of insoluble DF (7%) from the wholemealponent in rye flour was totally hydrolysed bywheat bread could be even larger, if the con-thermostable alpha-amylase, but in residues fromtribution of the added mucin were taken intorye bread, wholemeal wheat and white wheat,account. The solubility of DF in the procedure20%, 12% and 24%, respectively, of the totalintroduced here appears to be dependent on thestarch was resistant to both pancreatin and ther-source and the nature of the fibres.mostable alpha-amylase (Table V). Only half of
Contribution of mucin to the analysis of pen-the resistant starch in the original rye bread sampletosans cannot be ruled out, because the de-(30 mg) was accounted for in the rye bread in vitrotermination was colorimetric and non-specific.digestion residue. It is possible that during the inChanges in pH in the in vitro procedure (below 2·5vitro method cell wall structures are modified byin the ‘gastric’ phase and 6·5–7·5 in the ‘duodenal’changes in pH and are more susceptible to alkali-phase) were quite severe and could have affectedtreatment prior to starch analysis, so that en-the solubility of pentosans, which has been showncapsulated starch is liberated for amylolysis. Re-to be influenced by pH25. Some soluble pentosanscent work with ileostomy patients showed that inand b-glucans remaining after in vitro digestionhigh-fibre rye diets, starch escaping digestion waswere lost, since they were separated from thearound 1·3–1·7% of the intake23. The starch con-insoluble residue by centrifugation. Since the sol-tent of the residue in this study was 9·0%, 5·4%ubility of dietary fibre affects its degree of fer-and 7·3% for rye, wholemeal and white wheatmentability26, the residue from enzymic digestionbreads, respectively.
The in vitro method introduced here does not for use in fermentation studies should be collected

In vitro enzymic method 151
of dietary fibre. European Journal of Clinical Nutrition 49,by dialysis. This should result in a residue thatsuppl. 2 (1995) S81–88.more closely mimics the digesta in the human
5. Goni, I., Garcia-Alonso, A. and Saura-Galixto, F. Agastrointestinal tract. starch hydrolysis procedure to estimate glycemic index.The analysis by SEC-HPLC verified that sol- Nutrition Research 17 (1997) 427–437.
ubilised b-glucans in the wholemeal rye bread 6. Berry, C.S. Resistant starch: Formation and measure-ment of starch that survives exhaustive digestion withsample had a low average of molecular weight,amylolytic enzymes during the determination of dietaryMw=50 000 Da (Fig. 5). The dissolution of thefibre. Journal of Cereal Science 4 (1986) 301–314.low Mw b-glucan fraction increased the average 7. Bjorck, I., Nyman, M., Pedersen, B., Siljestrom, M., Asp,
Mw of the b-glucan in the insoluble residue. N.-G. and Eggum, B.O. On the digestibility of starch inwheat bread—Studies in vitro and in vivo. Journal of CerealScience 4 (1986) 1–11.
8. Hoebler, C., Barry, J.L., Kozlowski, F. and David, A.CONCLUSIONSStudy of enzymic preparation of cell wall residue. Sciencesdes Aliments 10 (1990) 255–263.Pepsin and bile enhanced the hydrolysis of slowly
9. Molly, K., Woestyne, M.V. and Verstraete, W. De-digestible starch by pancreatic amylase in an invelopment of a 5-step multi-chamber reactor as a sim-vitro treatment of cereals and breads. The extentulation of the human intestinal microbial ecosystem.of starch hydrolysis was reproducible and reachedApplied Microbiology and Biotechnology 39 (1993) 254–258.
a level comparable with starch hydrolysis in vivo 10. Minekus, M., Marteau, P., Havenaar, R. and Huis in’t(i.e., 91–93%). The method is suitable as a pre- Veld, J.H.J. A multicompartmental dynamic computer-
controlled model simulating the stomach and small in-treatment of cereal samples at physiological tem-testine. ATLA 23 (1995) 197–209.perature and pH prior to in vitro fermentation,
11. Pietinen P., Rimm, E.B., Korhonen, P., Hartman, A.M.,and/or characterisation of the DF components of Willet, W.C., Albanes, D. and Virtamo, J. Intake oftheir residues. The method may be applied to the dietary fibre and risk of coronary heart disease in a cohortevaluation of the effect of the digestion procedure of Finnish men. Circulation 94 (1996) 2720–2727.
12. Adlercreutz, H., Phytoestrogens: Epidemiology and aon the behaviour of DF components, i.e., theirpossible role in cancer protection. Environmental Healthsolubility and microstructure.Perspective 103, suppl. 7 (1995) 103–112.
13. Casiraghi, M.C., Brighenti, F., Pellegrini, N., Leopardi,E. and Testolin, G. Effect of processing on rice starch
Acknowledgements digestibility evaluated by in vivo and in vitro methods.Journal of Cereal Science 17 (1993) 147–156.We wish to thank Elisa Martinez de Maranon for
14. Muir, J.G. and O’Dea, K. Measurement of resistantrunning the experimental designs, Arvo Kinnunen for starch: factors affecting the amount of starch escapingthe data handling and Dr Tapani Suortti for performing digestion in vitro. The American Journal of Clinical Nutritionthe SEC-HPLC analyses. We also thank Marjukka 56 (1992) 123–127.Perttula for running the glucose analysis. In addition, 15. Asp, N.-G., Johansson, C.-G., Hallmer, H. and Sil-we are grateful to Teija Jokila, Siv Matomaa-Nyman, jestrom, M. Rapid enzymic assay of insoluble and solubleEeva Manninen and Leena Ohrnberg for expert tech- dietary fiber. Journal of Agricultural and Food Chemistry 31
(1983) 476–482.nical assistance.16. Douglas, S.G. A rapid method for the determination of
pentosans in wheat flour. Food Chemistry 7 (1981) 139–145.17. Holm, J., Bjorck, I., Asp, N.-G., Sjoberg, L.-B. andREFERENCES Lundquist, I. Starch availability in vitro and in vivo after
falking, steam-cooking and popping of wheat. Journal of1. Englyst H.N., Kingman, S.M. and Cummings, J.H. Clas-Cereal Science 3 (1985) 193–206.sification and measurement of nutritionally important
18. Bjorck, I., Asp, N.-G., Birkhed, D. and Lundquist, I.starch fractions. European Journal of Clinical Nutrition 46,Effects of processing on availability of starch for digestionsuppl. 2 (1992) S33–S50.in vitro and in vivo; I Extrusion cooking of wheat flours2. Bornet, F.R.J., Fontvieille, A.-M., Rizkalla, S., Colonna,and starch. Journal of Cereal Science 2 (1984) 91–103.P., Blayo, A., Mercier, C. and Slama, G. Insulin and
19. Snow, P. and O’Dea, K. Factors affecting the rate ofglycine responses in healthy humans to native starcheshydrolysis of starch in food. The American Journal of Clinicalprocessed in different ways: correlation with in vitroNutrition 34 (1981) 2721–2727.alpha-amylase hydrolysis. The American Journal of Clinical
20. Hoebler, C., Barry, J.-L., David, A. and Kozolowski, F.Nutrition 50 (1989) 315–323.Enzymic preparation and analysis of dietary fibre res-3. Granfeldt, Y., Bjorck, I., Drews, A. and Tovar J. An inidues, suitable for in vitro fermentation studies. Food Hydro-vitro procedure based on chewing to predict metaboliccolloids 5 (1991) 35–40.response to starch and legume products. European Journal
21. Wursch, P. and Koellreutter, B. Susceptibility of resistantof Clinical Nutrition 46 (1992) 649–660.starch to alpha-amylase. European Journal of Clinical Nutrition4. Brighenti, F., Pellegrini, N., Casiraghi, M.C. and Te-
stolin, G. In vitro studies to predict physiological effects 46, suppl. 2 (1992) S113–S115.

A.-M. Aura et al.152
22. Gallant, D.J., Bouchet, B., Buleon, A. and Perez, S. starch fermentation in the human large intestine. CanadianJournal of Physiology and Pharmacology 69 (1991) 121–129.Physical characteristics of starch granules and sus-
ceptibility to enzymic degradation. European Journal of 25. Harkonen, H., Lehtinen, P., Suortti, T., Parkkonen, T.,Siika-aho, M. and Poutanen, K. The effects of xylanaseClinical Nutrition 46, suppl. 2 (1992) S3–S16.
23. Pettersson, D., Aman, P., Bach Knudsen, K.E., Lundin, and b-glucanase from Trichoderma reesei on the non-starchpolysaccharides of whole meal rye slurry. Journal of CerealE., Zhang, J.-X., Hallmans, G., Harkonen, H. and Adler-
creutz, H. Intake of rye bread by ileostomists increase Science 21 (1995) 173–183.26. Brøbech Mortensen, P. and Nordgaard-Andersen, I. Theileal excretion of fiber polysaccharide components and
organic acids does not increase plasma or urine lignans dependence of the in vitro fermentation of dietary fibreto short-chain fatty acids on the contents of soluble non-and isoflavonoids. Journal of Nutrition 126 (1996) 1594–
1600. starch polysaccharides. Scandinavian Journal of Gastro-enterology 28 (1993) 418–422.24. Cummings, J.H. and Englyst, H.N. Measurement of
Copyright © 2022 FDOKUMEN