Development of an Improved Manual Assembly Concept for ...
113
Development of an Improved Manual Assembly Concept for Industrial Carts Master’s thesis in Industrial and Material Science JOHAN SKOG TOMMY SÜLD Department of Industrial and Materials Science CHALMERS UNIVERSITY OF TECHNOLOGY Gothenburg, Sweden 2018
-
Upload
khangminh22 -
Category
Documents
-
view
1 -
download
0
Transcript of Development of an Improved Manual Assembly Concept for ...
Development of an Improved ManualAssembly Concept for Industrial CartsMaster’s thesis in Industrial and Material Science
JOHAN SKOGTOMMY SÜLD
Department of Industrial and Materials ScienceCHALMERS UNIVERSITY OF TECHNOLOGYGothenburg, Sweden 2018

Master’s thesis 2018
Development of an Improved Manual AssemblyConcept for Industrial Carts
JOHAN SKOGTOMMY SÜLD
Department of Industrial and Materials ScienceDivision of Product Development
Chalmers University of TechnologyGothenburg, Sweden 2018
Development of an Improved Manual Assembly Concept for Industrial CartsJOHAN SKOGTOMMY SÜLD
© JOHAN SKOG & TOMMY SÜLD, 2018.
Supervisor & Examiner:Johan Malmqvist, Department of Industrial and Materials Science
Master’s Thesis 2018Department of Industrial and Materials ScienceDivision of Product DevelopmentChalmers University of TechnologySE-412 96 GothenburgTelephone +46 31 772 1000
Cover: New Flexqube Assembly Concept
Printed by ReproserviceGothenburg, Sweden 2018
iv
Development of an Improved Manual Assembly Concept for Industrial CartsJOHAN SKOG & TOMMY SÜLDDepartment of Industrial and Materials ScienceChalmers University of Technology
AbstractFlexqube is a fast growing company which develops and offers flexible industrialcarts for material handling applications using standardised building blocks. Due tothe fast growing number of customers, Flexqube has identified the need to stream-line their assembly process in order to meet the demand and to lower costs. Thepurpose of this thesis is, therefore, to identify shortcomings in the current assemblyprocess and to develop a new near-future system level assembly concept which willincrease the productivity of the assembly process.
The thesis started with an exploratory literature study and an empirical study whichincluded interviews, study visits and test assembling at both of Flexqube’s currentassembly plants. The data that was collected and analysed during these stages laidthe foundation for the solution development and evaluation. These solutions werethen evaluated in a proof of concept, to see whether the concept was an improvementor not. The result is an improved system level assembly concept along with newlydeveloped assembly stations and material presentation carts. Improvements havebeen made to productivity as well as ergonomics. The proof of concept showed a 34percent decrease in total assembly time compared to recorded videos of the currentassembly process. A comparison with solely isolated assembly operations was alsomade through the use of standard work sheets. This comparison showed 23 percentdecrease in assembly time. In addition to the improved productivity, the gain inimproved ergonomics was also a success. The concept eliminated many of the poorassembly operations seen from an ergonomic point of view.
Keywords: Flexqube, assembly, process, concept, lean, flexible, streamline, cart
v

AcknowledgementsFirst of all, we want to express our sincere thankfulness to Per Augustsson andFlexqube who believed in us and offered us the opportunity to write this thesis.Even though Per is very busy he always takes time to help and his experience andguidance have been a great contribution to this thesis. Also, a great thank you tothe rest of the team at Flexqube for answering our questions and helping us towardsa better result.
We also want to thank professor Johan Malmqvist who has been our supervisorand examiner during this thesis project. Johan has been available and supportiveat all times and has helped us by answering our questions with his objective andfact-based approach.
A special thanks to the employees at AMC in Georgia, USA, that showed us greathospitality and collaboration which facilitated the test assembling. A special thankyou to Wesley Worthen and Jeff Watson who made our stay the best possible. Alsoa special thanks to Åsa Engström and the rest of the employees at WTAB for agood reception and cooperation during our test assembling.
Johan Skog & Tommy Süld, Gothenburg, June 2018
vii

3.3.3 Value Adding Work Analysis . . . . . . . . . . . . . . . . . . . . . . 24
3.3.4 Standard Work Sheets . . . . . . . . . . . . . . . . . . . . . . . . . 24
3.4 Solution Development . . . . . . . . . . . . . . . . . . . . . . . . . . . . . 25
3.4.1 Paper-based Physical Mock-ups of the Assembly Layout . . . . . . 25
3.5 Solution Evaluation . . . . . . . . . . . . . . . . . . . . . . . . . . . . . . . 25
3.5.1 Decision Matrices . . . . . . . . . . . . . . . . . . . . . . . . . . . . 25
3.5.2 Evaluation of Assembly Layout . . . . . . . . . . . . . . . . . . . . 27
3.6 Evaluation of Result . . . . . . . . . . . . . . . . . . . . . . . . . . . . . . 27
4 Current Assembly Process 29
4.1 Assembly Guidelines . . . . . . . . . . . . . . . . . . . . . . . . . . . . . . 29
4.2 Working Stations . . . . . . . . . . . . . . . . . . . . . . . . . . . . . . . . 29
4.3 Assembly Layout . . . . . . . . . . . . . . . . . . . . . . . . . . . . . . . . 30
4.4 Tool Presentation . . . . . . . . . . . . . . . . . . . . . . . . . . . . . . . . 31
4.5 Material Presentation . . . . . . . . . . . . . . . . . . . . . . . . . . . . . . 31
4.6 Ergonomics in the Current Assembly . . . . . . . . . . . . . . . . . . . . . 32
5 Empirical Research 33
5.1 Interviews and Study Visits . . . . . . . . . . . . . . . . . . . . . . . . . . 33
5.2 Test Assembling . . . . . . . . . . . . . . . . . . . . . . . . . . . . . . . . . 34
5.2.1 Test Assembling in Georgia, USA . . . . . . . . . . . . . . . . . . . 34
5.2.2 Test Assembling in Torsby, Sweden . . . . . . . . . . . . . . . . . . 34
6 Data Analysis 37
6.1 Identification of Common Carts and Parts . . . . . . . . . . . . . . . . . . 37
6.2 Standard Work Sheets . . . . . . . . . . . . . . . . . . . . . . . . . . . . . 39
6.3 Value Adding Work Analysis . . . . . . . . . . . . . . . . . . . . . . . . . . 40
6.4 Analysis of Current Assembly Process . . . . . . . . . . . . . . . . . . . . . 42
6.4.1 Pro’s and Con’s of Current Assembly Process . . . . . . . . . . . . 42
6.4.2 Identification of the Eight Wastes . . . . . . . . . . . . . . . . . . . 42
6.4.3 Fishbone Diagram . . . . . . . . . . . . . . . . . . . . . . . . . . . 43
7 Solution Development 45
7.1 System Level Assembly Concept . . . . . . . . . . . . . . . . . . . . . . . . 46
7.1.1 Workshop . . . . . . . . . . . . . . . . . . . . . . . . . . . . . . . . 46
7.1.2 Paper-based Mock-ups . . . . . . . . . . . . . . . . . . . . . . . . . 46
7.1.3 Brainstorming . . . . . . . . . . . . . . . . . . . . . . . . . . . . . . 46
7.2 Assembly Station Concept . . . . . . . . . . . . . . . . . . . . . . . . . . . 46
7.2.1 Brainstorming . . . . . . . . . . . . . . . . . . . . . . . . . . . . . . 46
8 Solution Evaluation 47
8.1 Concept Combination Matrix . . . . . . . . . . . . . . . . . . . . . . . . . 47
8.2 Elimination Matrix . . . . . . . . . . . . . . . . . . . . . . . . . . . . . . . 48
8.2.1 Concepts Remaining After Initial Elimination . . . . . . . . . . . . 48
8.3 Criteria for the Concept Screening Matrices . . . . . . . . . . . . . . . . . 49
x

List of Figures
1.1 Two of the most popular cart variants sold in 2017 (Flexqube, 2017) . . . . 1
1.2 Examples of standard Flexqube components from the top left corner: FlexbeamTM,
FlextubeTM, FlexplateTM and FlexqubeTM . . . . . . . . . . . . . . . . . . 2
1.3 Examples of Flexqube components, from top left corner: handlebar, t-joint,
shelf, floor brake, wheel attachment box and caster . . . . . . . . . . . . . 3
1.4 Differences in carts . . . . . . . . . . . . . . . . . . . . . . . . . . . . . . . 6
1.5 Generic product development process Ulrich and Eppinger (2012) . . . . . 6
1.6 Illustration and description of the report disposition . . . . . . . . . . . . . 7
2.1 Diagrams to determine the orientation penalties Po (Swift and Booker, 2003) 12
2.2 Component insertion penalties Pfi (Swift and Booker, 2003) . . . . . . . . 14
2.3 The cube model, illustrating risk level depending on combinations of force,
posture and time (Berlin and Adams, 2017). . . . . . . . . . . . . . . . . . 18
3.1 Process outline including the different phases and their outcomes . . . . . . 19
3.2 An overview of the conducted interviews . . . . . . . . . . . . . . . . . . . 21
4.1 From the left: station 1 (red) and 2 (green), station 1 and station 2 . . . . 29
4.2 2D-overview of the current assembly layout . . . . . . . . . . . . . . . . . . 30
4.3 The current assembly layout in action, picture taken from short shelf . . . 30
4.4 A selection of material presentation in the current assembly . . . . . . . . 31
4.5 Figure illustrating assembling from underneath causing a poor posture
while attaching FlexplatesTM . . . . . . . . . . . . . . . . . . . . . . . . . . 32
6.1 Distribution of carts sold during the trailing twelve months . . . . . . . . . 37
6.2 Distribution between the 18 most used components (quantity) . . . . . . . 38
6.3 Distribution between the most 18 sold components . . . . . . . . . . . . . 39
6.4 Pie chart illustrating the distribution between work content . . . . . . . . . 41
6.6 Assembly process divided in to eight stages . . . . . . . . . . . . . . . . . . 42
6.7 Fishbone diagram based on current assembly process . . . . . . . . . . . . 44
7.1 Visualisation of the solution development . . . . . . . . . . . . . . . . . . . 45
8.1 Sketches of the six remaining concepts. From the top left corner: Jib Crane,
Flexrail, Dock & Lift, Flaps, Piston Lift and Drop-flap . . . . . . . . . . . 48
8.2 The ”Fork on wheels” concept which was eliminated due to lack of uniqueness 53
xiii
9.1 Overview of the rotation dolly . . . . . . . . . . . . . . . . . . . . . . . . . 55
9.2 Detailed picture of the prototype . . . . . . . . . . . . . . . . . . . . . . . 56
9.3 The completed cart in the rotation dollies . . . . . . . . . . . . . . . . . . 57
9.4 Six steps showing the assembly concept . . . . . . . . . . . . . . . . . . . . 58
9.5 Figure demonstrating the rotation of the cart . . . . . . . . . . . . . . . . 59
9.6 Figure showing an assembled towbar . . . . . . . . . . . . . . . . . . . . . 59
10.1 3D overview of the assembly (left angle) . . . . . . . . . . . . . . . . . . . 63
10.2 3D overview of the assembly (right angle) . . . . . . . . . . . . . . . . . . . 64
10.3 2D-layout of the system level assembly concept . . . . . . . . . . . . . . . 65
10.4 Rendering of the area surrounding assembly station 1 . . . . . . . . . . . . 66
10.5 Rendering of the area surrounding assembly station 2 . . . . . . . . . . . . 67
10.6 Rendering of the stacked carts behind the AGV . . . . . . . . . . . . . . . 67
10.7 The dedicated towbar assembly station . . . . . . . . . . . . . . . . . . . . 69
10.8 A close up of the ball joint vice . . . . . . . . . . . . . . . . . . . . . . . . 69
xiv
List of Tables
2.1 Selection of the basic handling indices Ah (Swift and Booker, 2003) . . . . 12
2.2 Selection of the handling sensitivity index Pg (Swift and Booker, 2003) . . 13
2.3 Selection of the basic handling indices Ah (Swift and Booker, 2003) . . . . 13
2.4 Selection of the additional assembly index Pa (Swift and Booker, 2003) . . 14
3.1 Keywords used for literature search . . . . . . . . . . . . . . . . . . . . . . 20
6.1 Standard worksheet before the improvements . . . . . . . . . . . . . . . . . 40
6.2 Table showing the distribution of working time . . . . . . . . . . . . . . . . 41
8.1 The concept combination matrix used to combine generated concepts . . . 47
8.2 The first concept screening matrix . . . . . . . . . . . . . . . . . . . . . . . 51
8.3 The second concept screening matrix . . . . . . . . . . . . . . . . . . . . . 51
8.4 The weighting matrix . . . . . . . . . . . . . . . . . . . . . . . . . . . . . . 52
8.5 The concept scoring matrix . . . . . . . . . . . . . . . . . . . . . . . . . . 52
9.1 Standard worksheet after the improvements . . . . . . . . . . . . . . . . . 60
10.1 SWS including time save for each working sequence . . . . . . . . . . . . . 70
10.2 SWS including total time save and time save from each working station . . 70
10.3 Time saved compared with the value adding work analysis . . . . . . . . . 71
xv

xvi
1
Introduction
The following chapter is structured as follows: first, a background that describes the
situation of the company and the problem analysis. Secondly, the aim of the thesis
is clarified followed by the intended deliverables and delimitations within the project.
Finally, the outline of the report is reviewed.
1.1 Background
Flexqube is an international supplier of modular and robust carts for material handling.
The company was established in 2010 with the ambition to create a competitive and
flexible alternative to the traditional welded material handling carts. Their business aim
is to facilitate the internal logistics and material handling for companies. This is performed
by modular carts and building blocks, an innovative design process and high competence
within internal logistics. Flexqube often refers to Lego or Mechano in order to describe
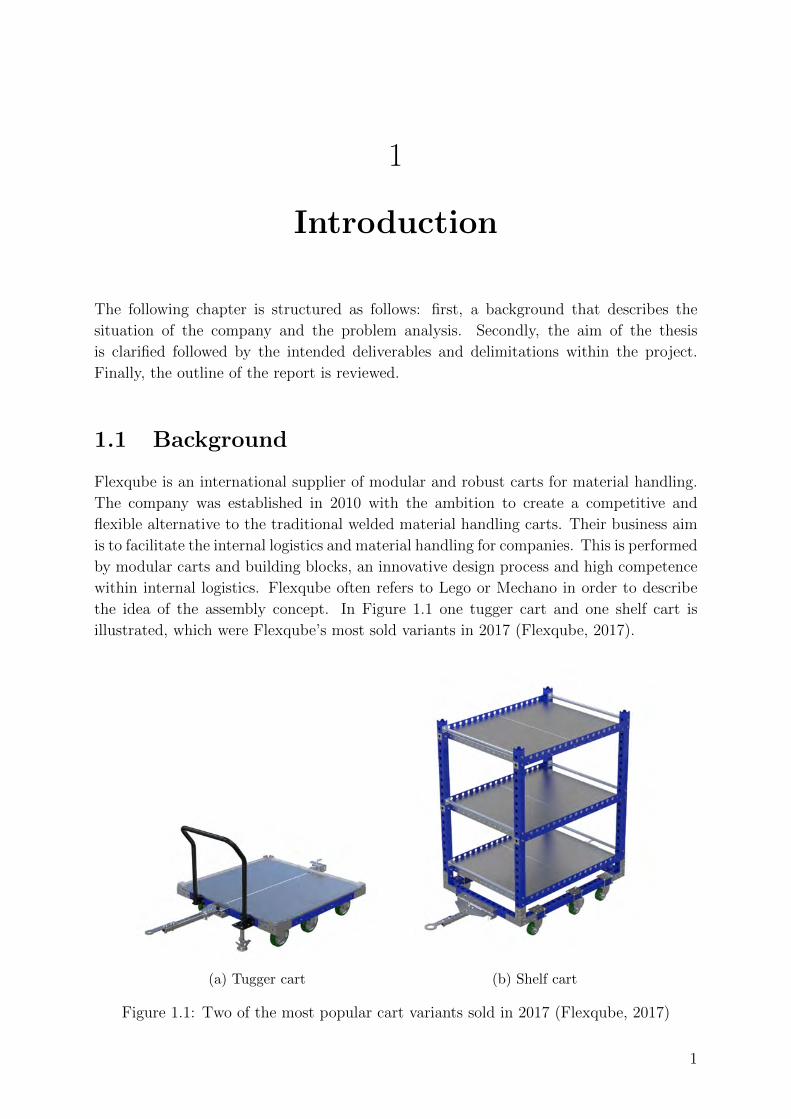
the idea of the assembly concept. In Figure 1.1 one tugger cart and one shelf cart is
illustrated, which were Flexqube’s most sold variants in 2017 (Flexqube, 2017).
(a) Tugger cart (b) Shelf cart
Figure 1.1: Two of the most popular cart variants sold in 2017 (Flexqube, 2017)
1
Flexqube has developed a base of modular and smart building blocks which can be com-
bined to create a customised cart for the customer. Flexqube is the only actor on the
market offering this type of modular concept for heavy duty carts.
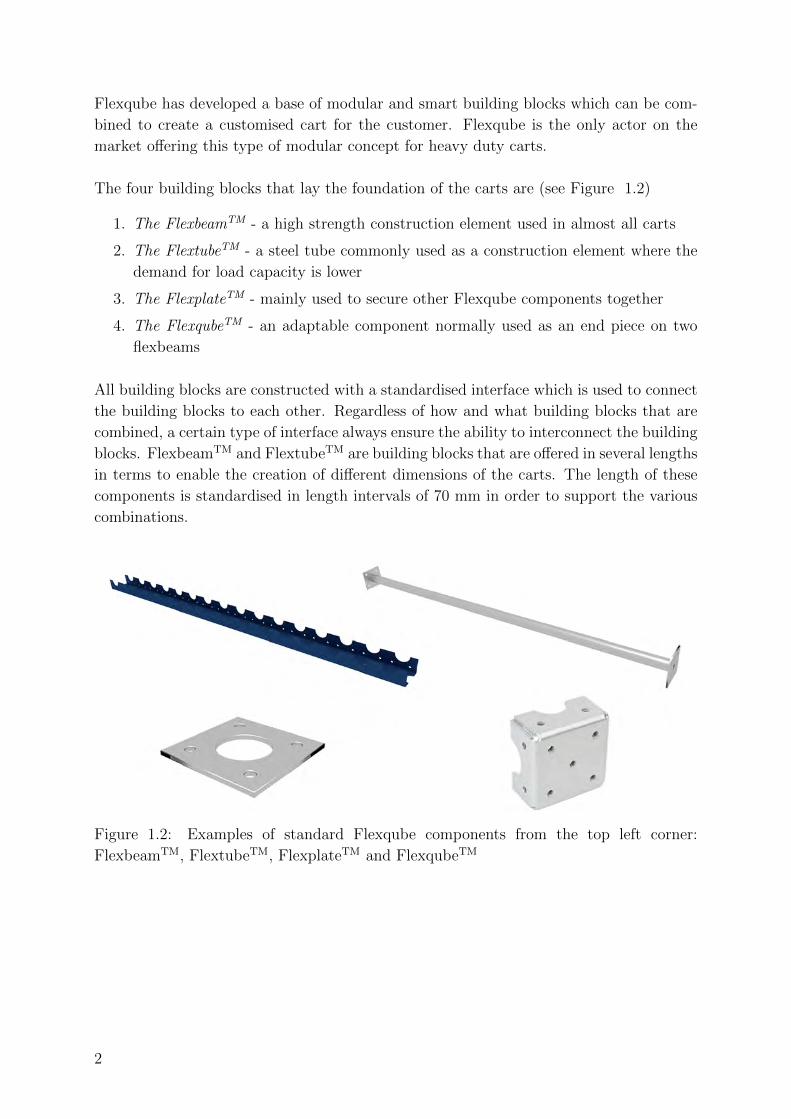
The four building blocks that lay the foundation of the carts are (see Figure 1.2)
1. The FlexbeamTM - a high strength construction element used in almost all carts
2. The FlextubeTM - a steel tube commonly used as a construction element where the
demand for load capacity is lower
3. The FlexplateTM - mainly used to secure other Flexqube components together
4. The FlexqubeTM - an adaptable component normally used as an end piece on two
flexbeams
All building blocks are constructed with a standardised interface which is used to connect
the building blocks to each other. Regardless of how and what building blocks that are
combined, a certain type of interface always ensure the ability to interconnect the building
blocks. FlexbeamTM and FlextubeTM are building blocks that are offered in several lengths
in terms to enable the creation of different dimensions of the carts. The length of these
components is standardised in length intervals of 70 mm in order to support the various
combinations.
Figure 1.2: Examples of standard Flexqube components from the top left corner:
FlexbeamTM, FlextubeTM, FlexplateTM and FlexqubeTM
2
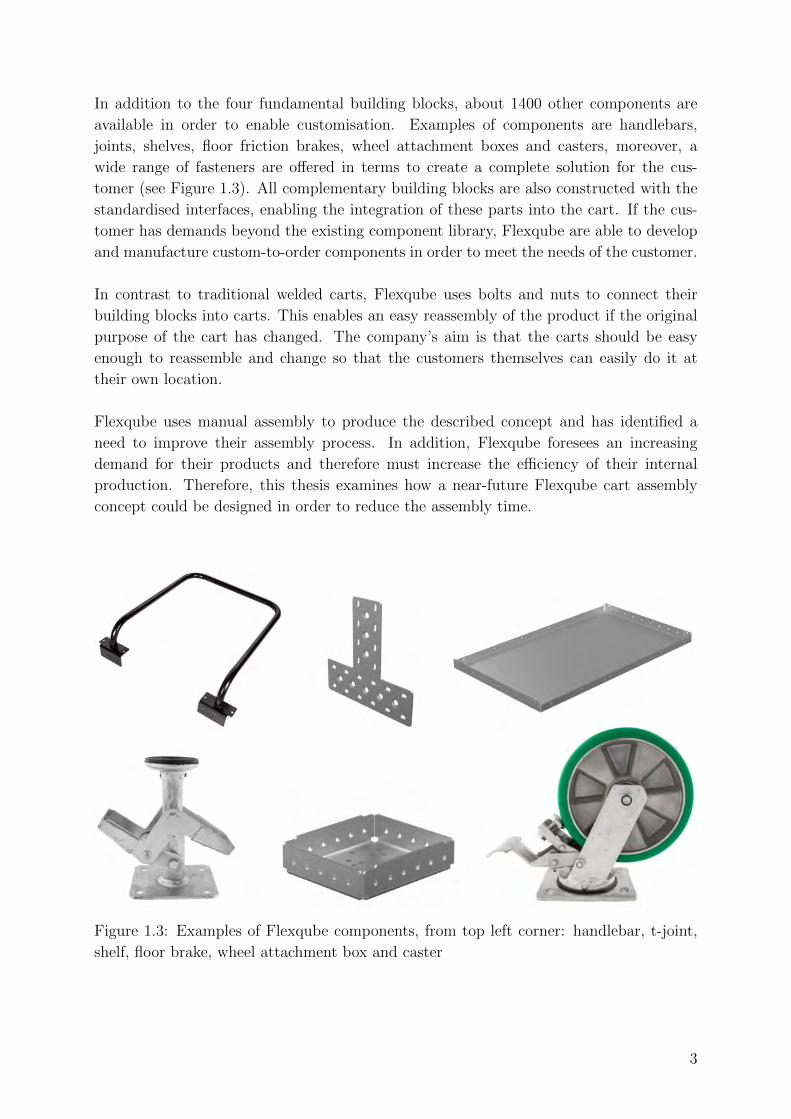
In addition to the four fundamental building blocks, about 1400 other components are
available in order to enable customisation. Examples of components are handlebars,
joints, shelves, floor friction brakes, wheel attachment boxes and casters, moreover, a
wide range of fasteners are offered in terms to create a complete solution for the cus-
tomer (see Figure 1.3). All complementary building blocks are also constructed with the
standardised interfaces, enabling the integration of these parts into the cart. If the cus-
tomer has demands beyond the existing component library, Flexqube are able to develop
and manufacture custom-to-order components in order to meet the needs of the customer.
In contrast to traditional welded carts, Flexqube uses bolts and nuts to connect their
building blocks into carts. This enables an easy reassembly of the product if the original
purpose of the cart has changed. The company’s aim is that the carts should be easy
enough to reassemble and change so that the customers themselves can easily do it at
their own location.
Flexqube uses manual assembly to produce the described concept and has identified a
need to improve their assembly process. In addition, Flexqube foresees an increasing
demand for their products and therefore must increase the efficiency of their internal
production. Therefore, this thesis examines how a near-future Flexqube cart assembly
concept could be designed in order to reduce the assembly time.
Figure 1.3: Examples of Flexqube components, from top left corner: handlebar, t-joint,
shelf, floor brake, wheel attachment box and caster
3
1.2 Aim and Goals
The assembly in general accounts for approximately 50 percent or more of the manufac-
turing costs, as well as it has a direct impact on the product quality (Zhaa et al., 2001).
Swift and Booker (2003) states that “about 50 percent of all labour in the mechanical and
electrical industries are involved in assembly”. The aim of this thesis is to come up with
a near-future assembly concept that would increase the productivity of the assembly pro-
cess, which would lead to reduced costs. In order to do so, the current assembly process
will be investigated to identify what the current shortcomings are. From that starting
point, improvements of existing faults and new ideas will be presented.
The goals of this thesis are to:
1. Identify and describe the shortcomings in the current assembly process
2. Shorten the assembly time of a chosen reference cart with at least 25 percent
3. Develop a flexible assembly concept which is insensitive for variation in carts, as-
sembly location and takt time
4. Demonstrate a proof of concept of the improved assembly concept in order to mea-
sure if improvements have been made
5. Improve the overall ergonomics in the assembly and eliminate assembly operations
with a high risk of musculoskeletal disorders
1.3 Deliverables
This master thesis will include several deliverables which are divided into two stakehold-
ers, Chalmers and Flexqube. At Chalmers, the deliverable consists of the report in hand.
In addition to this deliverable, the company also expects a mapping of the current assem-
bly process, an assembly concept on a system level and a proof of concept (PoC), further
described below.
Mapping of Current Assembly Process
An overview of the current assembly process that illustrates problems and opportunities
in the current assembly process. The mapping will consist of one or several flowcharts,
fishbone diagrams and lists of where improvements can be made for each step in the as-
sembly process.
Assembly Concept on a System Level
A concept on a system level, meaning the inclusion of the assembly station where the
carts are assembled together and the surrounding including a presentation of both tools
and parts. The concept will be presented through the use of overview drawings and CAD
renderings.
4
Prototype of Assembly Station
In order to evaluate the result of the assembly station, a prototype will be built made
out of Flexqube components. The prototype will be built for the purpose of evaluating
whether the ability of rotation will facilitate the assembling or not.
Report
The report in hand according to Chalmers guidelines. The report is the main deliverable
to Chalmers.
1.4 Delimitations
Flexqube offers the customer the possibility to both assemble the solutions themselves or
to buy preassembled solutions. When the customer assembles the product themselves, all
components are sent along with instruction manuals. If the customer wants the product
preassembled, the carts are sent fully assembled. Therefore, depending on how the cus-
tomer prefers to purchase the solution, the assembly process may differ. The final result
will not be focused on the assembly process from the customer’s point of view, but rather
the assembly process as performed by Flexqube (even though this might affect on-site
assembling as well).
The prototype of the assembly station used in the PoC will be a simplification of the
final assembly station. The prototype is only evaluated for its ability to rotate the cart
during assembling and does not contain all necessary features to be used in the assembly
concept.
The prototyping and testing of the new assembly concept could not be carried out in
the real assembly line area, therefore a mock-up assembly line was created next to the
real one with near to real resemblance.
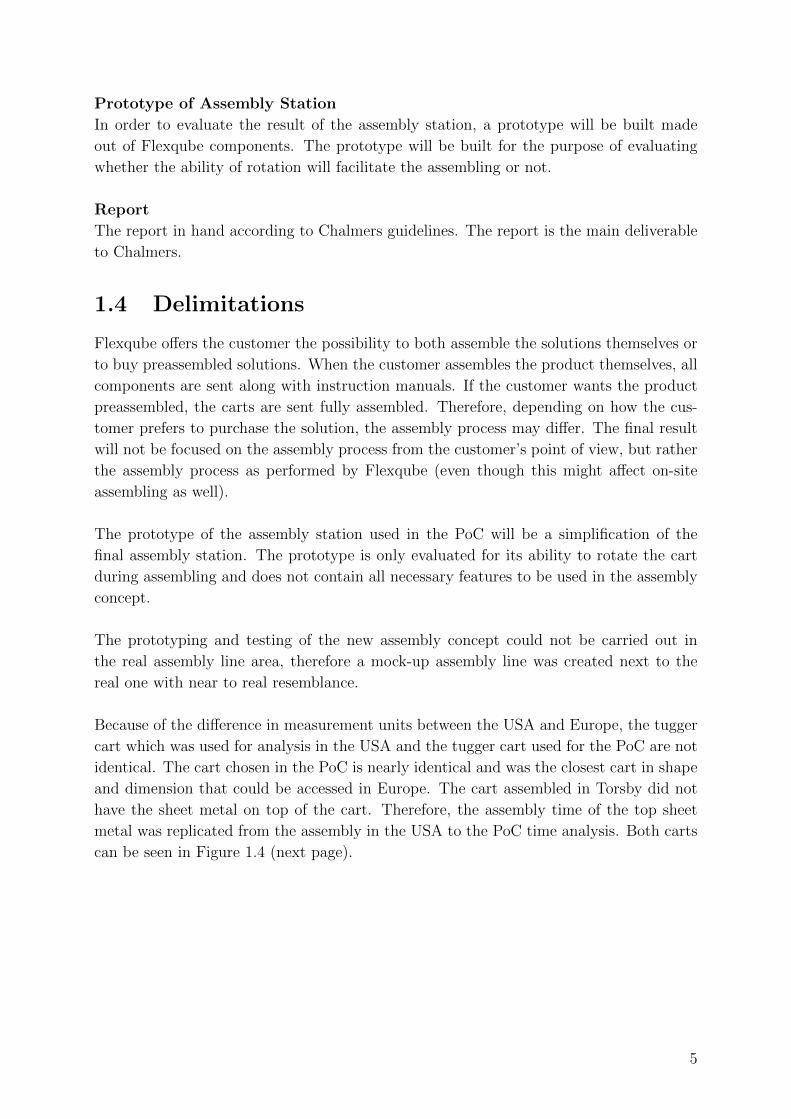
Because of the difference in measurement units between the USA and Europe, the tugger
cart which was used for analysis in the USA and the tugger cart used for the PoC are not
identical. The cart chosen in the PoC is nearly identical and was the closest cart in shape
and dimension that could be accessed in Europe. The cart assembled in Torsby did not
have the sheet metal on top of the cart. Therefore, the assembly time of the top sheet
metal was replicated from the assembly in the USA to the PoC time analysis. Both carts
can be seen in Figure 1.4 (next page).
5
(a) Cart assembled in the USA during empirics (b) Cart assembled in Torsby during PoC
Figure 1.4: Differences in carts
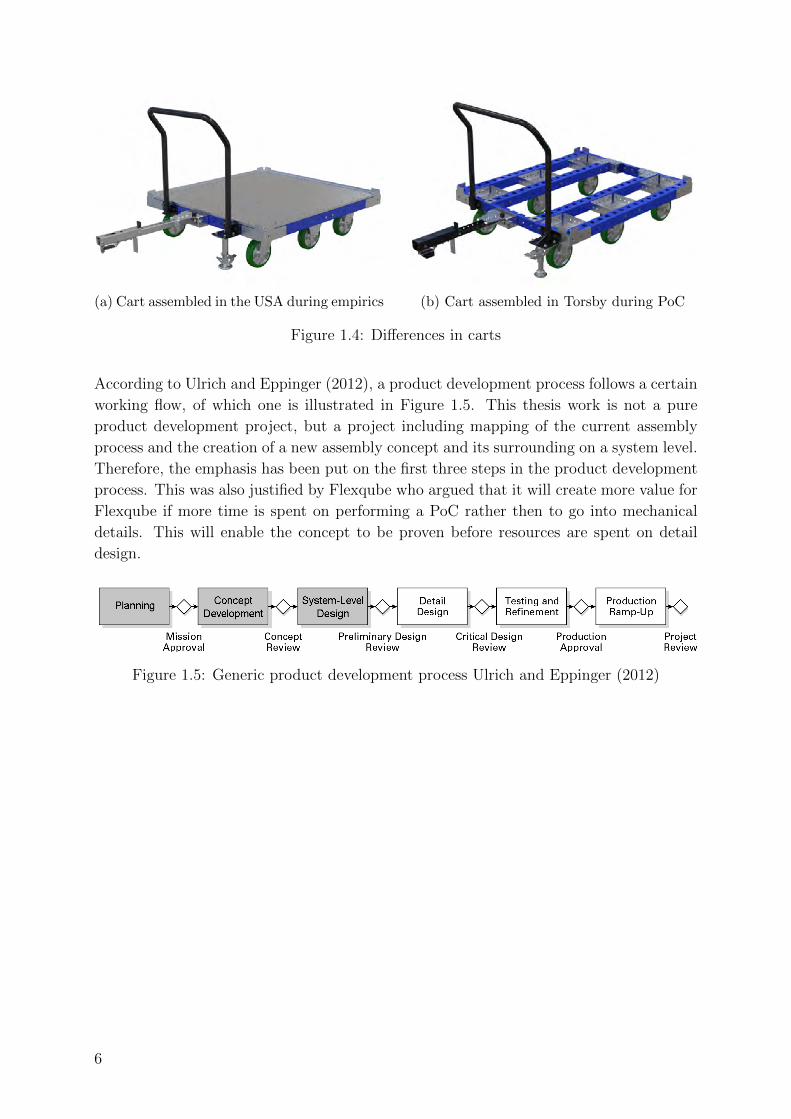
According to Ulrich and Eppinger (2012), a product development process follows a certain
working flow, of which one is illustrated in Figure 1.5. This thesis work is not a pure
product development project, but a project including mapping of the current assembly
process and the creation of a new assembly concept and its surrounding on a system level.
Therefore, the emphasis has been put on the first three steps in the product development
process. This was also justified by Flexqube who argued that it will create more value for
Flexqube if more time is spent on performing a PoC rather then to go into mechanical
details. This will enable the concept to be proven before resources are spent on detail
design.
Figure 1.5: Generic product development process Ulrich and Eppinger (2012)
6
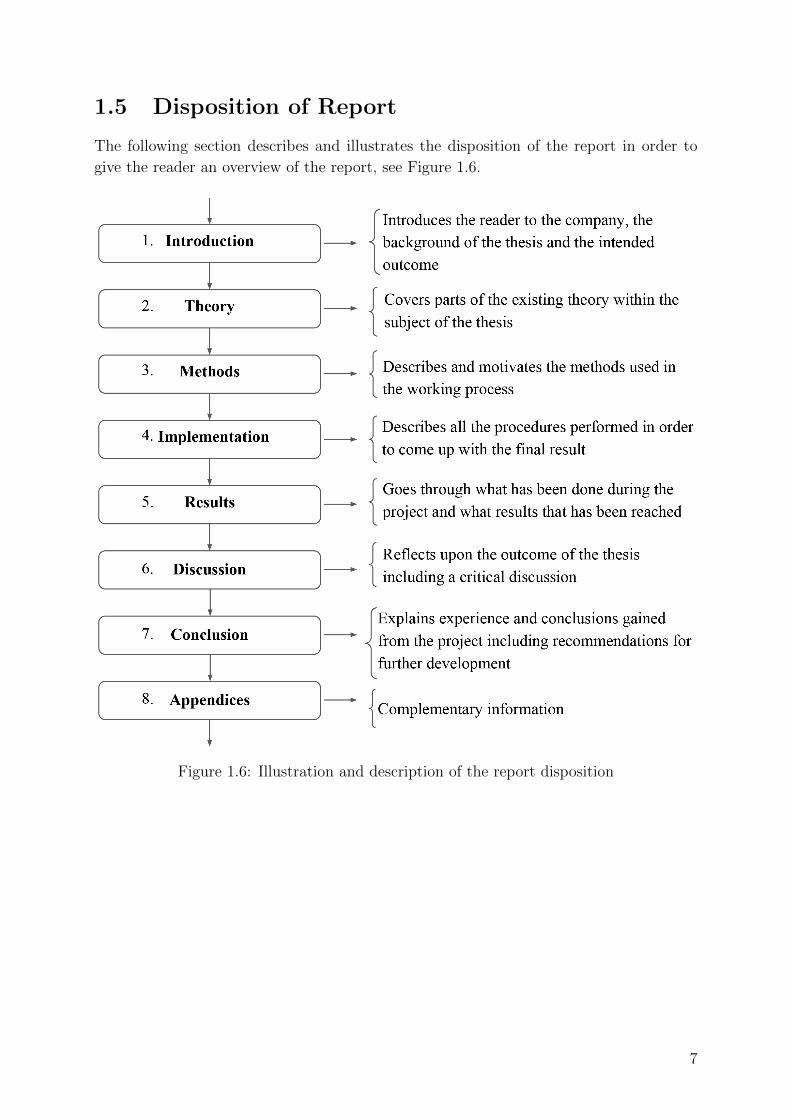
1.5 Disposition of Report
The following section describes and illustrates the disposition of the report in order to
give the reader an overview of the report, see Figure 1.6.
Figure 1.6: Illustration and description of the report disposition
7

8
2
Pre-study and Theory
During the theoretical study, the focus was to gain as much knowledge as possible in the
theoretical field of assembly since it would enable a better understanding of the upcoming
phases of the project. The theory mainly included books and papers connected to the
following topics: design for assembly (DFA), design for manufacturability (DFM), lean
manufacturing, lean six sigma, fastening methods, process selection, product development
and production strategies. The following chapter will bring up existing theory within the
most important fields of this thesis.
2.1 Manual Assembly Configurations
Swift and Booker (2003) describe manual assembly as “composing of previously man-
ufactured components and/or subassemblies into a complete product...”. Further, it is
described as a process which is normally performed by humans, but might be supported
by automated systems. Swift and Booker (2003) suggest three common manual assembly
configurations, namely the following:
1. Single-station - one fixed assembly station that is dedicated to a certain task or a
variation of tasks.
2. Continuous - several assembly stations are dedicated to a specific task where the
working task is moved between the assembly stations without stopping (e.g convey-
ors).
3. Intermittent - several assembly stations are dedicated to a specific task where the
working task is moved between the assembly stations based on a fixed cycle time or
operation time.
Even though several assembly stations might be needed, Ortiz (2006) argues that in order
to reduce movement waste, the travel distance should always be minimised (distance from
start to end in the assembly). This allows for a more efficient usage of the space which can
be adapted for e.g in-house machines or even be leased to third parties. Ortiz (2006) fur-
ther states that a reduction of assembly stations is another approach to reduce movement
waste and cost due to fewer workbenches, tools and space. On the other hand, Baudin
(2002) claims that if a product can fit on a pushcart, the assembly work is possible to be
split up into smaller sequences and pushed through several assembly stations. Leskova
9
(2013) says that an assembly line must be flexible and easy to reconfigure to quickly en-
able for new product variants in order not to lose production time. According to Baudin
(2002), an ideal assembly fixture should allow the assembler to access all assembly work
in an ergonomically correct posture, use both hands for work, be able to support bins for
parts and fit several products.
The theory concerning manual assembly configurations helped to gain knowledge in stan-
dard manual assembly set-ups. This was considered as valuable knowledge since it is a
prerequisite for all companies working with manual assembly.
2.2 Assembly Operations
Swift and Booker (2003) discuss several assembly operations. Below, a selection of these
are described.
1. Feeding - is a synonym for what will be referred to as material presentation in this
thesis. In other words, how a component is presented to the assembler. Com-
mon examples are regular storage bins, organised parts in pallets or magazines and
automatic part-feeding
2. Handling - the actual handling of the material and the assembling of it. Normally
hands, lifting aids and fixtures are used
3. Fitting - includes the fitting of components. This means both the parts that will
constitute the assembled product and fastening components such as bolts and nuts.
Fastening methods as screwing, electric tools and riveting are mentioned
4. Transfer - if the assembly requires several stations, the transportation in between
the stations are referred to as transfer
Priest and Sanchez (2001) states that the fewer components within a product the better.
Fewer parts mean a more reliable product since it will reduce the risk of failure in both
manufacturing and assembly, it will also reduce the risks of e.g. late delivery and damages
in shipping. In addition, it will lead to a reduced cost of inventory, material handling
and other support areas. By this argument, Priest and Sanchez (2001) means that the
optimal part count for a product would be one. Daetz (1987) came up with the following
conclusions regarding adding parts:
1. The time and cost of assembly are about proportional to the number of parts being
assembled
2. The cost of storing a part in a manufacturing system may range from $500 to $2000
annually, adjusted for inflation this sum is approximately doubled
3. The cost of finding a qualified vendor for a new part may cost up to $5000, doubled
if adjusted for inflation
10
Priest and Sanchez (2001) do not only challenge the usage of components, but also the
usage of fasteners. They argue that fasteners increase the risk of poor quality and exem-
plify a computer where 10 percent of all repair cost was related to fasteners. Priest and
Sanchez (2001) further question the use of fasteners due to its cost and gives an example
of five computers where the attachment of fasteners average a total cost of 10 - 27 percent
of the assembly labour cost.
Through studies of assembly operations and configurations, a foundation of knowledge
was laid which contribute to a greater understanding of the following studies and the
overall methodology concerning assembly.
2.3 Material and Tool Presentation
In order for the assembler to maximise their efficiency, Leskova (2013) argues that all
components should be delivered from the outside of the assembly area when re-supplying
is done. Leskova (2013) recommends the usage of gravity feed bins, in order for the ma-
terial to always be as close to the assembler as possible. Baudin (2002) says that other
people than the assembler must make sure that all material is delivered to the assembly
station, unpacked. Baudin (2002) further states that all material should if possible be
presented to the assembler within arm’s reach and oriented in such way that it is easy
for the assembler to grab and place the component. Lastly, Baudin (2002) describes an
actual example where a 30 percent net productivity was achieved by having a full-time
picker serve two assembly lines with parts. The lines went from five assemblers on each
to three assemblers on each.
When it comes to tool presentation, Leskova (2013) states that all tools should be placed
in their own designated compartment, which should allow for easy access and insertion.
This in order to reduce misplacement of tools. Both Leskova (2013) and Baudin (2002)
argue that the tools should belong to the station and not the user. Also, they argue for
storing tools which are used together next to each other.
By studying literature regarding material and tool presentation before implementing a
new assembly concept, the new concept has been created to support the best possible
presentation of tools and material, in order to streamline the process.
11
2.4 Cost of Assembly
Swift and Booker (2003) have come up with a model that calculates the cost of the
assembly, see Equation 2.1.
Cma = C1(H + F ) (2.1)
Cma = Cost of manual assembly
C1 = Cost of labour
H = Handling time (seconds), see Equation 2.2
F = Fitting time (seconds), see Equation 2.3
In order to calculate the handling time (H), Equation 2.2 is used (next page).
H = Ah +
[n∑
i=1
Poi +n∑
i=1
Pgi
](2.2)
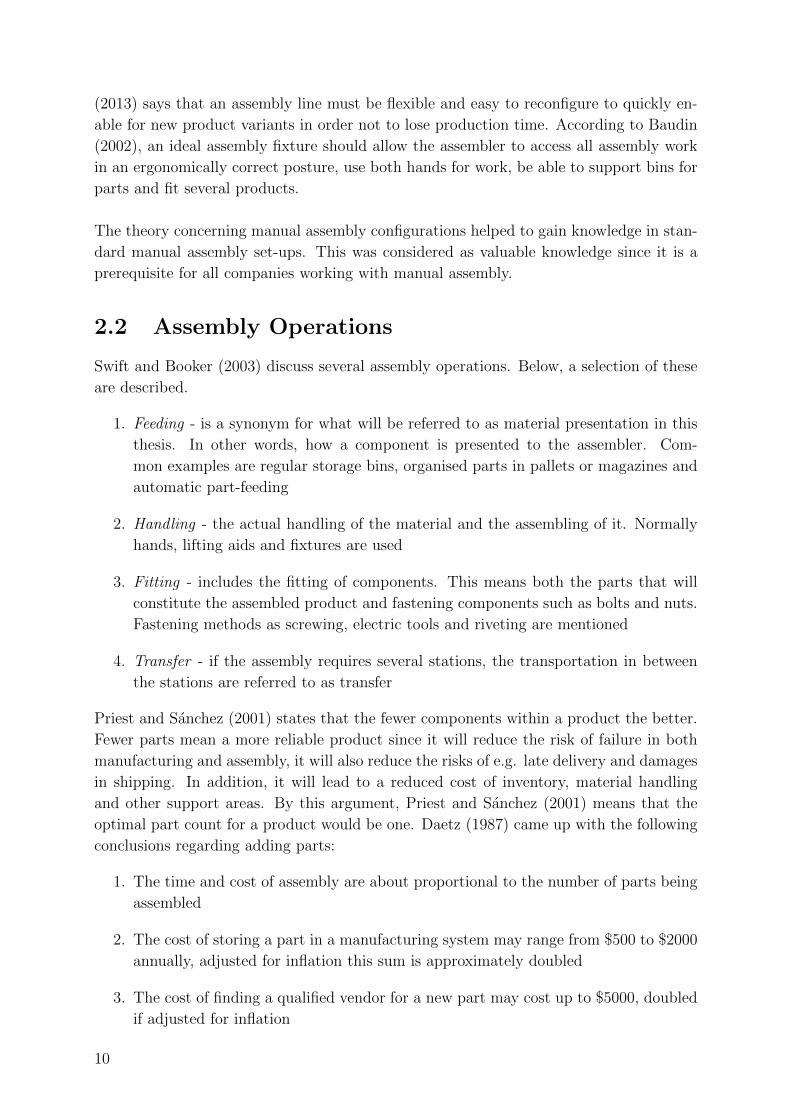
Ah = Basic handling index, see Table 2.1
Poi = Penalties for orientation, see Figure 2.1
Pgi = Penalties for general handling, see Table 2.2 (next page)
Handling of component Basic handling index (Ah)
One hand 1
Easy, e.g. one hand tool 1.5
Two hands required, heavy 1.5
Two people required, very heavy 3
Table 2.1: Selection of the basic handling indices Ah (Swift and Booker, 2003)
(a) End to end orientation (b) Rotational orientation
Figure 2.1: Diagrams to determine the orientation penalties Po (Swift and Booker, 2003)
12
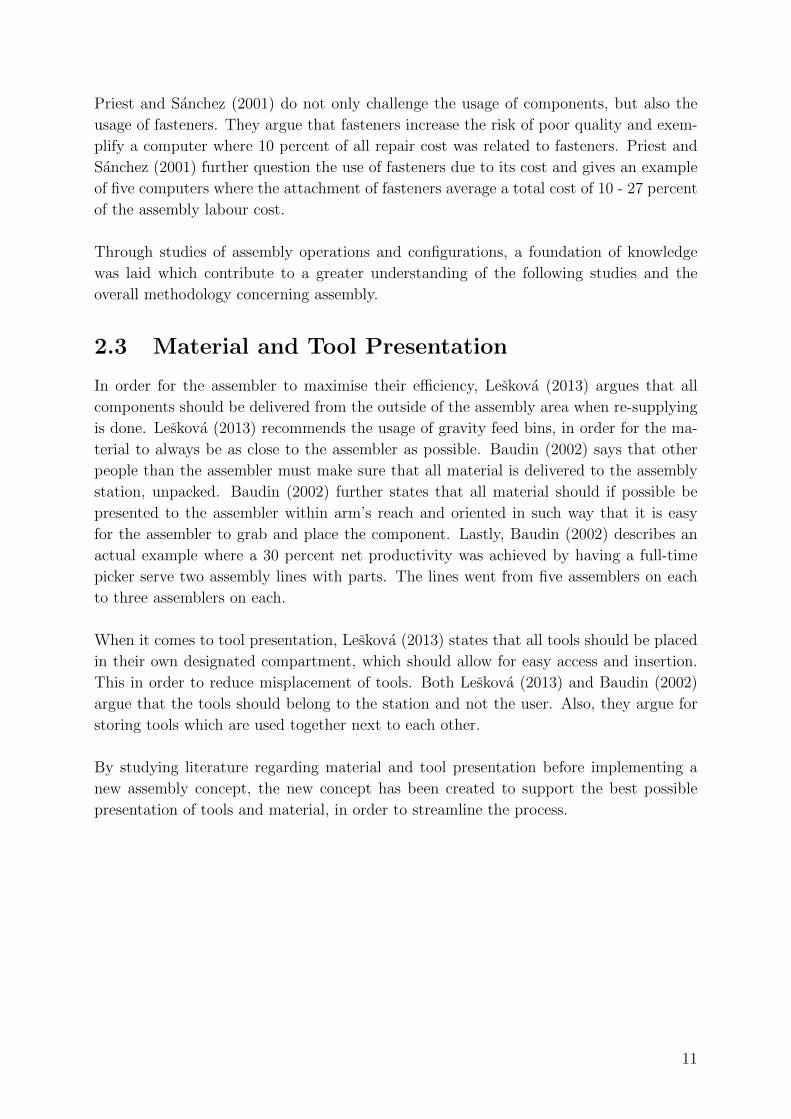
Component handling sensitivity Handling sensitivity index (Pg)
Fragile 0.4
Flexible 0.6
Adherent 0.5
Tangle/severely tangle 0.8/1.5
Severely nest 0.7
Sharp/abrasive 0.3
Hot/contaminated 0.5
Thin (gripping problem) 0.2
None of the above 0
Table 2.2: Selection of the handling sensitivity index Pg (Swift and Booker, 2003)
In order to calculate the fitting time (F), Equation 2.3 are used.
F = Af +
[n∑
i=1
Pfi +n∑
i=1
Pai
](2.3)
Af = Fitting index, see Table 2.3
Pfi = Insertion penalties, see Figure 2.2 (next page)
Pai = Additional assembly index, see Table 2.4 (next page)
Assembly process Index (Af )
Insertion only 1
Snap fit 1.3
Screw fastener 4
Rivet fastener 2.5
Clip fastener (plastic bending) 3
Placement in work holder (Pf and Pa usually not required) 1
Table 2.3: Selection of the basic handling indices Ah (Swift and Booker, 2003)
13
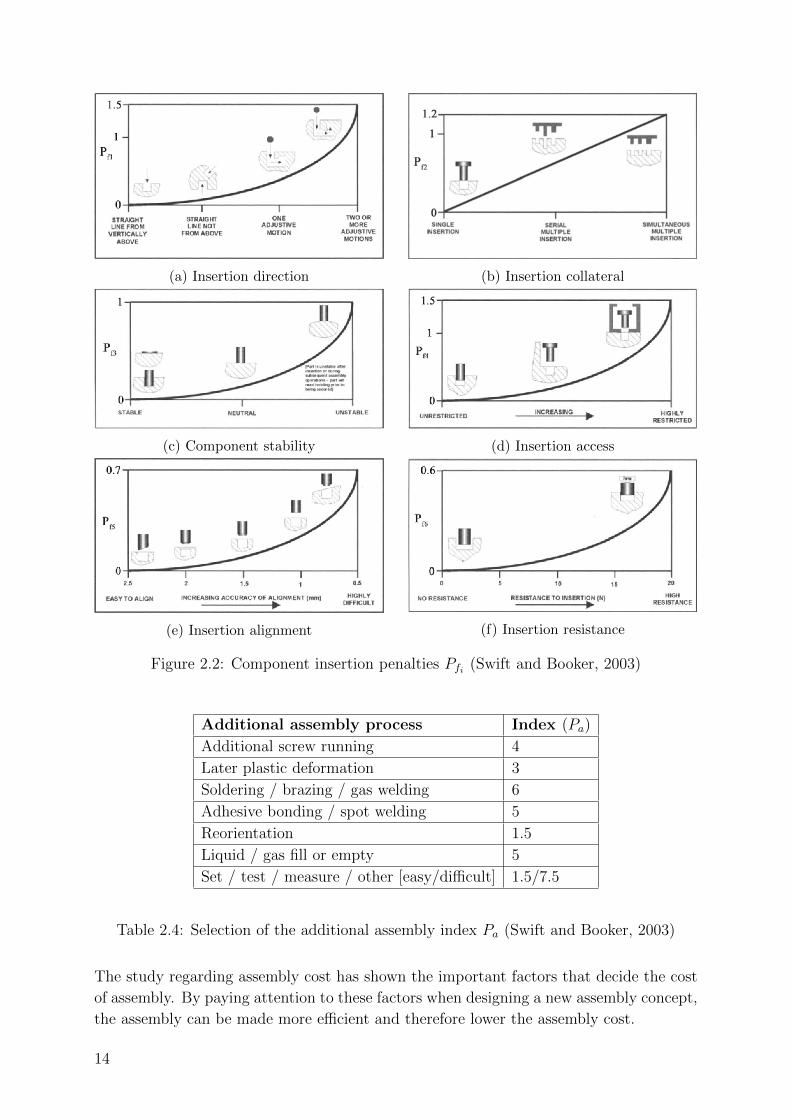
(a) Insertion direction (b) Insertion collateral
(c) Component stability (d) Insertion access
(e) Insertion alignment (f) Insertion resistance
Figure 2.2: Component insertion penalties Pfi (Swift and Booker, 2003)
Additional assembly process Index (Pa)
Additional screw running 4
Later plastic deformation 3
Soldering / brazing / gas welding 6
Adhesive bonding / spot welding 5
Reorientation 1.5
Liquid / gas fill or empty 5
Set / test / measure / other [easy/difficult] 1.5/7.5
Table 2.4: Selection of the additional assembly index Pa (Swift and Booker, 2003)
The study regarding assembly cost has shown the important factors that decide the cost
of assembly. By paying attention to these factors when designing a new assembly concept,
the assembly can be made more efficient and therefore lower the assembly cost.
14
2.5 Lean Assembly
A definition of lean is according to Bicheno (2004) “..to do more with less”. It builds
upon the Toyota Production System (TPS) which was developed during many years in
the mid-1900’s at Toyota, in order to competitively produce cars in large variation but in
small quantities at manageable cost (Bicheno, 2004). This section contains some methods
to find and eliminate waste.
2.5.1 The Eight Wastes
During his time as Chief Engineer at Toyota during the mid-1900’s, Taiichi Ohno identified
seven different wastes within production which exists in every level of a company (Ortiz,
2006; Bicheno, 2004). Waste is everything that does not add value to the customer and
which the customer thereby is not paying for (Liker, 2004). According to Ortiz (2006);
Bicheno (2004), one additional waste is commonly used today, the eight wastes are:
1. Overproduction - meaning that production is being made faster and in more quan-
tities than needed. Overproduction can result in products with a higher level of
defects, stress on workers and more material handling in inventory.
2. Wait time - is when an operator is inactive and can not proceed with their work
activities. Examples of causes can be waiting for material, faulty machinery, waiting
for another operator or poor communication.
3. Transportation - is the waste of material being handled ineffectively. For exam-
ple being handled several times, unnecessary long distance to pick up material or
through poor planning.
4. Overprocessing - are processes connected to the product which does not add value
to the product. For instance, parts that are painted even though they are not visible
to the customer or unnecessary part protection between stations.
5. Inventory - all inventory is a waste in theory, but in practice it is necessary. Parts
in inventory increase cost, lead time and occupies space.
6. Motion - is a waste emerging at the workstation while assembling. Motion waste can
be caused by misplaced tools, long distance to retrieve components or unergonomic
assembly operations.
7. Defects - are waste connected to faulty components or products. The earlier a defect
is detected the better. If a defect is found in a complete product in the hands of
the customer the cost can increase several times and goodwill can be affected.
8. Skills - is the under-utilising of capabilities or lack of proper training.
15
2.5.2 Standardised Work
Moore (2006); Ortiz (2006) states that, standard work “reflects the current best, easiest
and safest way to do a job”. Ortiz (2006) states that standardised work is the process of
finding the best procedure to accomplish a task, and then make sure that this procedure is
used at all times, by all workers. Standardised work decreases variation within the process,
facilitates performance measurements and provides training material (Ortiz, 2006; Moore,
2006).
2.5.3 Takt Time and Cycle Time
According to Bicheno (2004), a delegation from Toyota visited the Focke-Wulff airplane
factory in Germany before the outbreak of World War II. They observed a concept where
the planes were made according to a set production rate. This was later developed into
takt time. Ortiz (2006) defines takt time as “..the time to complete a unit in order to
meet the designed output of the process”, where the output can be customer demand.
Bicheno (2004) describes the takt time as “..the available working hours during a time
period divided with the average customer demand during the same time period”. Bicheno
(2004) further states that the takt time is what decides the speed and rhythm of the
production. According to Baudin (2002), the customer is not directly affected if the
product is produced to takt time or not, although, it affects them indirectly by improving
quality and delivery performance as well as lowering costs. Baudin (2002) further states
that an assembly line should be designed for the minimum takt time (highest estimated
demand), but is usually operated at a longer takt time, which is why the assembly line
should be flexible in order to respond to large changes in demand. As can be seen in
Equation 2.4, the takt time changes if either the customer demand changes or if the
net available assembly time changes through e.g. the addition of more assembly workers
(Baudin, 2002).
Takt time =Net available assembly time
Customerdemand(2.4)
In addition to takt time, there is also a cycle time. Cycle time is the actual time it takes
to assemble one complete product or sub-assembly and varies between assembly stations
and variants of products (Ortiz, 2006).
2.5.4 Increased Productivity
According to Almstrom (2015) who has been conducting studies concerning productiv-
ity within Swedish industry, there are three important factors to consider to increase
productivity:
• Method - designing the workplace and its activities in an appropriate way from the
start
16
• Performance - how long time assembly tasks actually take, in relation to how long
they should take
• Utilisation - how large share of the working time that is strictly value-adding activ-
ities
Measurements made show that a 50 percent gain in productivity can be made by focus-
ing on the utilisation factor alone. Working with all three, the gain can be even greater
(Almstrom, 2015).
Knowledge gained regarding lean assembly has been of great importance to eliminate
the presence of waste in the assembly process. Furthermore, literature concerning stan-
dardised work, takt time and increased productivity contributed to valuable knowledge
when designing the overall assembly concept.
2.6 Ergonomics
IEA (2017) defines ergonomics as “scientific discipline concerned with the understanding
of interactions among humans and other elements of a system, and the profession that
applies theory, principles, data and methods to design in order to optimise human well-
being and overall system performance”. IEA (2017) further argues that ergonomics affect
jobs, products and environments and its connection to humans. Below, physical and
cognitive ergonomics aspects connected to this thesis are brought up.
2.6.1 Physical Ergonomics
According to a study performed by Falck et al. (2014), there is a strong correlation be-
tween quality errors and poor ergonomics in the assembly. The same study concludes
that there are “..huge savings and increased profit margins to make..” and also good
chances of increasing overall productivity by removing unergonomical work. This link be-
tween increased productivity and improved ergonomics in the assembly is also confirmed
by Battini et al. (2016); Zare (2016). Battini et al. (2016) calls this link a “..win–win
approach” as it also improves operational safety. Zare (2016) argues that many compa-
nies only see ergonomics as a tool to prevent injuries and not the potential productivity
win and decreased cost. The most occurring injury among manual assembly is work-
related musculoskeletal injuries (Battini et al., 2016). Berlin and Adams (2017) describe
musculoskeletal disorders, or MSDs, as a disorder which can be caused by a variety of
physical factors, and where the first signs are commonly pain, fatigue or discomfort.
The consequences for the assembly worker is obvious, but for the company, a sick leave
is equal to high costs. Berlin and Adams (2017) further states that the risk of MSDs
can be avoided if workplaces are designed in the correct way by minimising e.g. incorrect
working posture, heavy lifting and work which causes continuous load on tissue structures.
A cube model, first developed by Sperling et al. (1993), can be used to show the connec-
tion between force, posture and time. As can be seen in Figure 2.3, the risk of injury
17
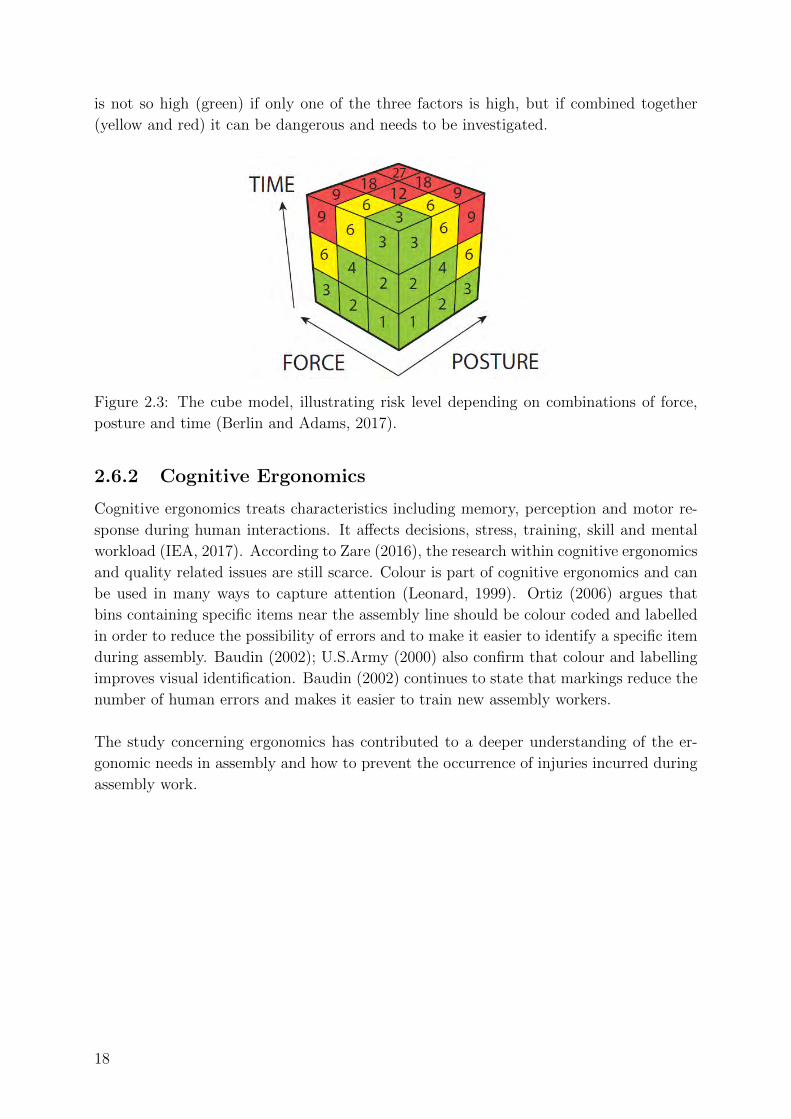
is not so high (green) if only one of the three factors is high, but if combined together
(yellow and red) it can be dangerous and needs to be investigated.
Figure 2.3: The cube model, illustrating risk level depending on combinations of force,
posture and time (Berlin and Adams, 2017).
2.6.2 Cognitive Ergonomics
Cognitive ergonomics treats characteristics including memory, perception and motor re-
sponse during human interactions. It affects decisions, stress, training, skill and mental
workload (IEA, 2017). According to Zare (2016), the research within cognitive ergonomics
and quality related issues are still scarce. Colour is part of cognitive ergonomics and can
be used in many ways to capture attention (Leonard, 1999). Ortiz (2006) argues that
bins containing specific items near the assembly line should be colour coded and labelled
in order to reduce the possibility of errors and to make it easier to identify a specific item
during assembly. Baudin (2002); U.S.Army (2000) also confirm that colour and labelling
improves visual identification. Baudin (2002) continues to state that markings reduce the
number of human errors and makes it easier to train new assembly workers.
The study concerning ergonomics has contributed to a deeper understanding of the er-
gonomic needs in assembly and how to prevent the occurrence of injuries incurred during
assembly work.
18
3
Methods
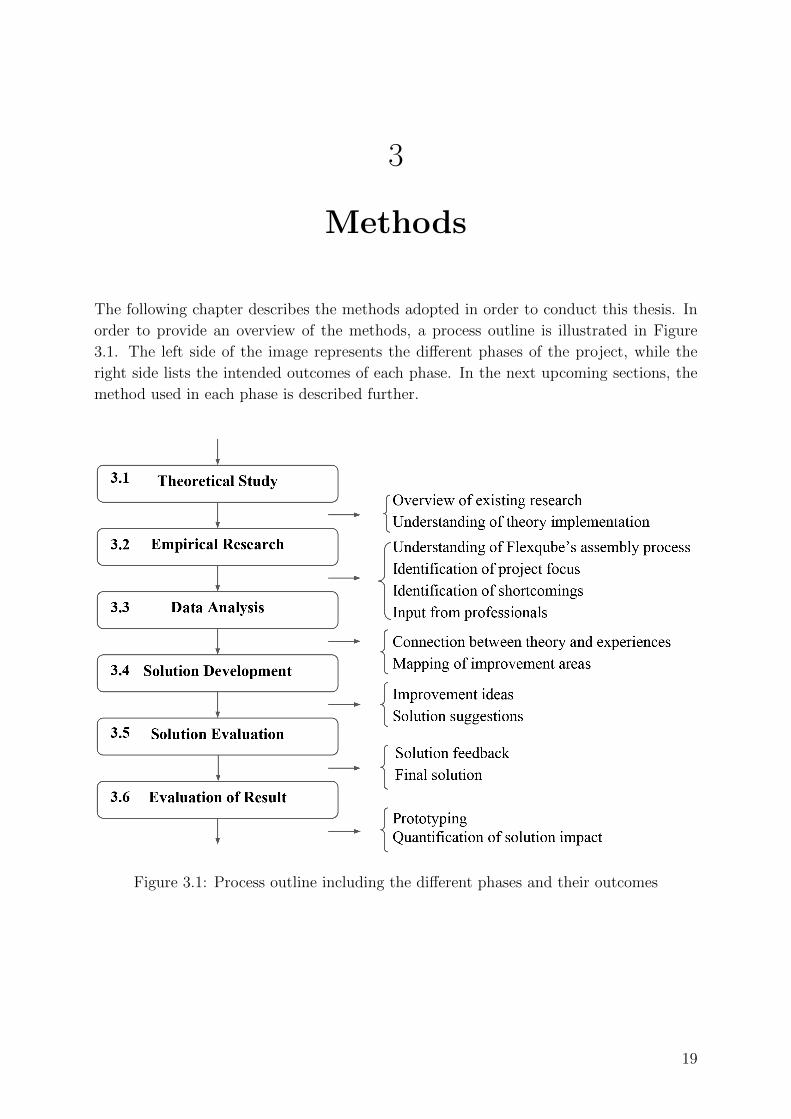
The following chapter describes the methods adopted in order to conduct this thesis. In
order to provide an overview of the methods, a process outline is illustrated in Figure
3.1. The left side of the image represents the different phases of the project, while the
right side lists the intended outcomes of each phase. In the next upcoming sections, the
method used in each phase is described further.
Figure 3.1: Process outline including the different phases and their outcomes
19
3.1 Theoretical Study
The initial phase of the project consisted of a study of state of the art literature on how to
improve assembly processes generally. Denscombe (2014) defines the aim of a literature
study as “...to arrive at a conclusion about the state of knowledge on a topic based on a
rigorous and unbiased overview of all the research that has been undertaken on that topic”.
The process of the literature study was performed according to Kaya (2016), who suggests
to the following outline: find papers, organise the papers, screen the papers and classify
the papers. The literature that was investigated in order to reach an objective conclusion
included books and papers. The databases Chalmers library, Proquest and Google scholar
were used in order to find relevant literature. Also, experts from Chalmers were contacted
for literature recommendations. The keywords used in the literature searches can be seen
in Table 3.1
Assembly Beams Components Design Disassembly Effective
Fastening Ikea Improve Kaizen Lean Manual
Manufacturing Mechanisms Modular Optimization Process Production
Reduce Scania Standard Streamline Time Toyota
Table 3.1: Keywords used for literature search
3.2 Empirical Research
Gaskell (2011) defines an empirical research as acquired knowledge gained from own ex-
perience, observations and qualitative research such as in-depth interviews. In addition,
an empirical study may also include measured data (PSU, 2018). This in contrast to a
theoretical study which is based on just theory. The approach of the empirical research
was mostly focused on Flexqube’s in-house competence, data and experience. This in-
cluded hands-on assembling of carts complemented with observations and interviews with
personnel within the company. The purpose of the empirical research was to acquire an
understanding of how the internal processes are designed as well as identify current short-
comings in the assembly process. Furthermore, the empirical research also consisted of a
wider knowledge scan for assembly improvement strategies through the use of interviews
and study visits outside Flexqube.
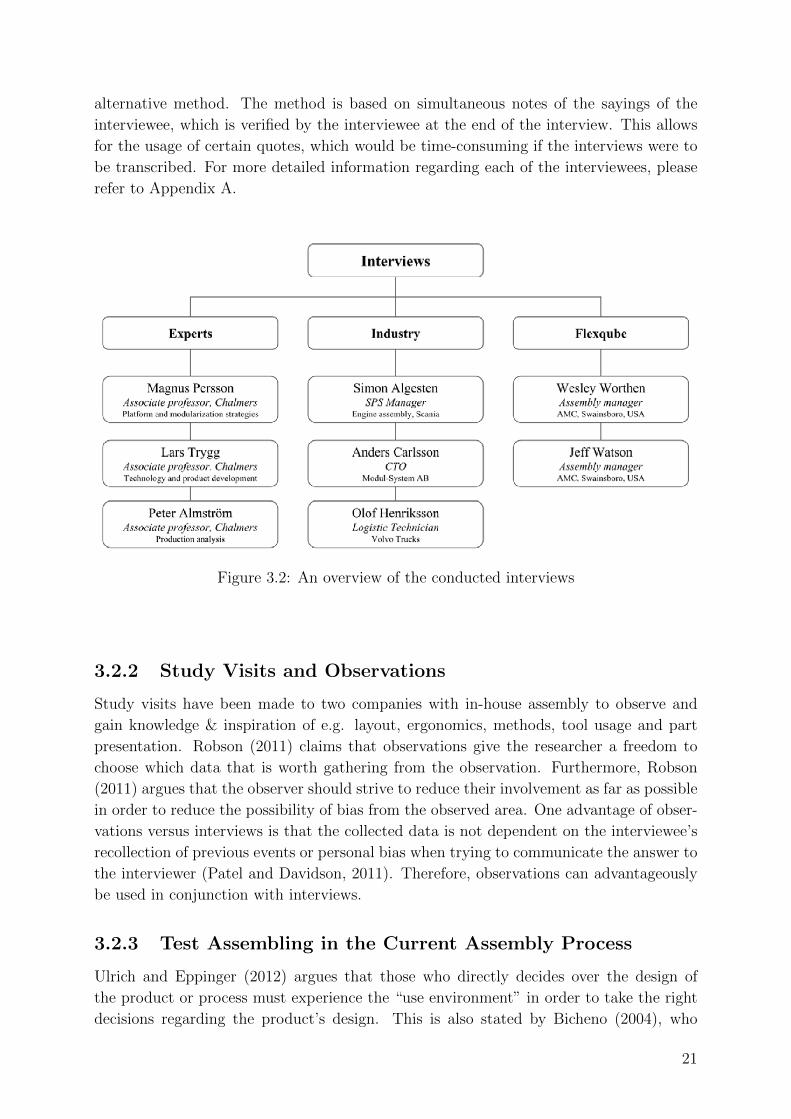
3.2.1 Interviews
Three different types of interviewee groups have been interviewed during the empirical
research, see Figure 3.2. All interviews have been conducted through the semi-structured
interview approach, which is both flexible and versatile (Kallio et al., 2016). Kallio et al.
(2016) and Strande et al. (2014) further states that qualitative semi-structured interviews
increases the validity and flexibility and makes the results more plausible. Due to low
efficiency when transcribing interviews, Bryman and Bell (2011) have come up with an
20
alternative method. The method is based on simultaneous notes of the sayings of the
interviewee, which is verified by the interviewee at the end of the interview. This allows
for the usage of certain quotes, which would be time-consuming if the interviews were to
be transcribed. For more detailed information regarding each of the interviewees, please
refer to Appendix A.
Figure 3.2: An overview of the conducted interviews
3.2.2 Study Visits and Observations
Study visits have been made to two companies with in-house assembly to observe and
gain knowledge & inspiration of e.g. layout, ergonomics, methods, tool usage and part
presentation. Robson (2011) claims that observations give the researcher a freedom to
choose which data that is worth gathering from the observation. Furthermore, Robson
(2011) argues that the observer should strive to reduce their involvement as far as possible
in order to reduce the possibility of bias from the observed area. One advantage of obser-
vations versus interviews is that the collected data is not dependent on the interviewee’s
recollection of previous events or personal bias when trying to communicate the answer to
the interviewer (Patel and Davidson, 2011). Therefore, observations can advantageously
be used in conjunction with interviews.
3.2.3 Test Assembling in the Current Assembly Process
Ulrich and Eppinger (2012) argues that those who directly decides over the design of
the product or process must experience the “use environment” in order to take the right
decisions regarding the product’s design. This is also stated by Bicheno (2004), who
21
claims that according to the TPS, there is a word called Gemba. Gemba means “the
place where activities take place”, and refers to the fact that data should be collected
where the process is located. The test assembling will constitute such an understanding
and overview in order to evaluate where the project work should be focused to maximise
the outcome.
3.2.4 Data Collection
During the test assembling, several methods to collect data were used. The data was cap-
tured in order to analyse the discoveries made at a later stage. Before the test assembling,
an evaluation was made to find the most recurring cart types and components because
that was where improvements were expected to benefit Flexqube the most.
Collection of Data From Sold Carts
In order to find the most sold carts and components, a data collection was made. The
data was partly gathered from the Flexqube website where the latest sold carts are added
continuously, but also from the inventory statistics shared by the supply chain manager
at Flexqube. The data from the website consisted of the bill of materials (BOM) from the
last 200 sold carts and were retrieved manually. The data from the inventory statistics
consisted of all parts and carts sold throughout the year. The inventory statistics were
then categorised using Excel. This data collection was later used to analyse where an
improvement had the largest impact.
Video Recording
Videos are a great tool to capture data for the analysis due to the ability to relive past
experiences (Bicheno, 2004). Partly to bring certain events back to memory but also to
find new possibilities which might not have been taken into consideration before. Accord-
ing to Baudin (2002), video recording has many advantages over just using a stopwatch,
although demanding some more equipment. Baudin (2002) further argues that using
video to capture the current state in an assembly improvement concept is “..a powerful
analytical tool”. The video recording will provide the foundation for the standard work
sheets (SWS) which are further described later. Bicheno (2004) argues that for such a
purpose as the SWS, video recording is preferred compared to a live scenario since you
are able to rewind and play in slow motion.
Notes of Shortcomings
During the visits of the assembly plants in Georgia, USA and Torsby a notebook were kept
at close hand at all times. This, in order to capture all small and large shortcomings in
the assembly plant during the days we were present. The notes were a great compliment
to the video recordings since the notes could contain situations that the camera could not
capture and also situations unfolded in the past which co-workers witnessed about.
22
3.3 Data Analysis
Mertens et al. (2017) define data analysis as a method where optimally all data that
may influence the outcome is identified and measured. The collected data has been used
to map the current assembly process, find opportunities where to improve the process,
find the waste during assembly work and to find components and carts which are over-
represented. This since improvements there might have the largest impact on the overall
assembly process.
3.3.1 Evaluation to Find the Most Common Parts and Carts
The first part of the evaluation built upon the inventory statistics, obtained from the
supply chain manager at Flexqube. By knowing the most common components, attention
could be focused on those components during test assembly, observations and interviews.
Since they are highly represented in the carts, any inefficient assembly operations con-
taining these components might have a high impact on the overall assembly process. The
data extracted were:
• Most common cart types
• Most commonly used parts
The second part of the evaluation used a formula designed in Excel that calculates how
large share of the carts that contains a specific component, regardless of the number of
parts per cart, and visualises this data in percent. This calculation was used as a cross-
reference towards the inventory statistics in order to make sure that not a small quantity
of sold carts contained a large number of a specific component. The following information
was compiled:
• Most commonly used bolts and nuts
• Most commonly used parts
3.3.2 Mapping of Current Assembly Process
To map the current assembly process and make it easier to analyse, the assembly pro-
cess, from the inventory to the shipping of carts, was divided into eight sub-processes.
A flowchart was made, which according to Damelio (2011) is a graphic illustration of
sequences needed to produce a specific output. Other methods used were brainstorming,
fishbone diagram and workshops, which are further described below.
Individual Brainstorming
Ulrich and Eppinger (2012) defines brainstorming as an approach where ideas are gen-
erated from already known knowledge within the team. The first brainstorming session
included only the group members and a blank sheet of paper which was used for every
single process stage. All possible pro’s and con’s that could be encountered were listed.
23
Workshops
According to Ulrich and Eppinger (2012), a workshop is defined as a group of people
with relevant expertise where individual evaluations are performed. Further, Ulrich and
Eppinger (2012) argues that a workshop may be used in order to screen opportunities.
The topic of the workshop was “evaluation of the assembly process” and the purpose of
the workshop was to list all possible pro’s and con’s for each process step. These will
constitute as an internal wish and demand list, where all the positive sides of each step
are considered a demand for the new concept and the negative aspects are considered
wishes, or things to improve.
Fishbone Diagram
A fishbone (or Ishikawa diagram) is used to identify both categories and its underlying
causes to a certain problem, often within quality improvement processes (Law, 2016).
There are several variants of fishbone diagrams, one of which is named the 5-M method
(Mania, 2016). In this project, the fishbone diagram has been used to find all possible
causes to why the current assembly process is ineffective and inefficient. The 5-M method
has also been extended to a 7-M method in order to adapt the method to the assembly
process. The 7-M’s consists of: method, manpower, management, machine, measure,
milieu and material.
3.3.3 Value Adding Work Analysis
According to George et al. (2005) a value adding analysis identifies which activities in a
work process that adds value to the customer. The first step conducted in analysing the
videos was to time different steps of the assembly process. All actions made by assembly
personnel were named, timed and later placed in a category. The categories were, “fetch
components”, “place components”, “tighten bolts”, “waste” and lastly “other”. The
categories were chosen with regard to Boothroyd et al. (2011), who claims that manual
assembly is mainly divided into two categories. First, handling, which is described as
“acquiring, orienting and moving the parts”. Second is the insertion and fastening, which
includes grouping the components together. This was made in order to find out how much
of the actual assembly time that was value-adding but also to see the distribution of the
above-mentioned categories.
3.3.4 Standard Work Sheets
Ortiz (2006) suggests a method called standard work sheets (SWS) for setting up each
workstation, where e.g. work content, sequence time, cycle time, part quantity, part
description and tools are listed. This data was used as a guideline in order to compare
and analyse the differences in time between the existing assembly process and the new
assembly concept.
24
3.4 Solution Development
In the following section, the methods applied in order to come up with the solution is
described. To generate ideas, brainstorming and paper-based mock-ups have mainly been
used.
Brainstorming
According to Ulrich and Eppinger (2012), idea generation is a relatively inexpensive and
can be done rather quick in comparison to other parts of the development process. The
process starts with a selection of needs and targets and ends in a range of concepts from
which the team can make a final selection. To generate ideas, several methods exist
to support the idea generation. One method used is brainstorming and is described by
Ulrich and Eppinger (2012) as an internal search where all ideas come from the team’s
personal experience and can be performed individually or in a group. According to Milton
and Rodgers (2011), brainstorming is a rapid and highly effective method to generate
innovative and surprising concept proposals and is best used in a group, but can be
used individually as well. The brainstorming was conducted in order to quickly capture
quantitative ideas rather than qualitative ideas. The reason for this was, as described by
Ulrich and Eppinger (2012), that the more ideas a team generates, the more likely they
are to fully explore the different solutions.
3.4.1 Paper-based Physical Mock-ups of the Assembly Layout
In order to generate ideas related to the layout of the assembly process, paper-based phys-
ical mock-ups were cut out. This method is suggested by Baudin (2002) who exemplifies
visualisations on paper as a method to design assembly processes. The mock-ups were
then disposed on a range of different layouts, ranging from u-shaped assembly layouts
(Baudin, 2002) to straight assembly lines (Gurevsky et al., 2013). Common for all layouts
were the demand for flexibility suggested by Simon Algesten (2018). Boothroyd et al.
(2011) refers to this as a “flexible assembly layout”, which makes the usage of storage
carts more efficient due to its increased proximity.
3.5 Solution Evaluation
The solution evaluation was used as a method in order to reduce the number of ideas gen-
erated from the brainstorming. In order to come up with the best solution, Johannesson
et al. (2013) suggest a solution evaluation where apparent unfeasible solutions should be
eliminated.
3.5.1 Decision Matrices
According to Johannesson et al. (2013), decision matrices are good tools to further elim-
inate the worst solutions but also to possibly find new solutions that are combinations
25
of already existing solutions. The matrices have been used to analytically screen out the
best alternatives and to come up with new solution combinations. The matrices used in
this project are further described below.
Concept Combination Matrix
With inspiration from the morphological matrix, a concept combination matrix was cre-
ated. Instead of combining functions with part solutions, the matrix combined part
solutions with each other. This due to the fact that generated ideas already contained
total solutions with different part solutions. The matrix was used to cross-fertilise the
generated solutions and to make forced connections between existing solutions in order
to find new possible solutions.
Elimination Matrix
The elimination matrix is used to screen out all solutions that do not solve the task, fail
to meet the demands or are unfeasible (Johannesson et al., 2013). That way, only the
most potent solutions can continue into the next phase of the evaluation, and no waste is
made evaluating unfeasible solutions.
Concept Screening Matrix
According to Ulrich and Eppinger (2012), the purpose of the concept screening matrix
is to narrow down the number of concepts quickly and to improve the concepts. Ayag
(2014) further argues that the Pugh matrix, as it is also commonly called, is a simple and
fast matrix which makes it perfect to screen out unfeasible options quickly and early on.
However, it does not take into account the importance of each criterion.
Weighting Matrix
Since not all criteria have the same degree of importance for the final solution, a weighting
matrix was created. The criteria were evaluated one versus one, whether they were more
or less important or if they were equally important. If one were more important then they
were assigned one point whereas the other got zero points, if equally important, both were
given a half point. Lastly, the points were summarised. This is proposed by Johannesson
et al. (2013) as an optional method to use.
Concept Scoring Matrix
The concept scoring matrix, or Kesselring matrix, has been used and is described by Ulrich
and Eppinger (2012) as a method to use to better distinguish between the remaining
solutions. In the concept scoring matrix, all solutions are graded with respect to the
weighted criteria from the weighting matrix. The concepts were graded between one and
five on how well they fulfilled the criteria in the matrix.
26
3.5.2 Evaluation of Assembly Layout
Frequent communication and discussions have been held with Per Augustsson, CTO,
Flexqube, in order to evaluate the assembly layout. Requirements that supported the
evaluation were e.g. size of the factory, efficiency and flexibility.
3.6 Evaluation of Result
In order to evaluate whether the final concept is an improvement or not, prototyping has
been used to compare the new concept with the current assembly process. Ulrich and
Eppinger (2012) describes PoC as a prototype to quickly test ideas in order to confirm the
functionality of the product. This is also confirmed by Ullman (2010) who describes PoC
as a model to develop the functionality of the product and to verify that the customer
needs are satisfied. Otto and Wood (2001); Ullman (2010) argues that a PoC does not
need to fulfil the products exact properties, but only focus on some key components or
sub-systems of the product. Also that it is not important which materials are used only
that they are cheap and easy to come by. Baudin (2002) states that computer simulation
of assembly concepts are unnecessary unless it is a highly complex assembly line, and that
using mock-up assembly equipment is sufficient for testing a new concept. This was also
confirmed by Simon Algesten (2018) who argued in favour for simplicity by saying “hold
things in the right place” and “fold things in cardboard, be very pragmatic and simple
and take advantage of the fact that there is a result - what actually happens”.
27

28
4
Current Assembly Process
In order to help the reader to understand the upcoming chapters, this chapter goes through
the assembly process as it is today. The chapter explains the assembly guidelines and the
current working stations where the actual carts are assembled together. This is followed
by the assembly layout which includes the overall layout of the assembly process and its
surrounding. Finally, the tool presentation and material presentation are described.
4.1 Assembly Guidelines
When designing the carts for the customers, a 3D-pdf is generated from the CAD software
where the cart is designed. The 3D-pdf is used in the assembly process as a guide to
assemble the cart. Once several carts of the same type have been built in the assembly,
the need for the 3D-pdf is reduced since the assembler learns how to build the cart. An
example of a 3D-pdf can be seen in Appendix B.
4.2 Working Stations
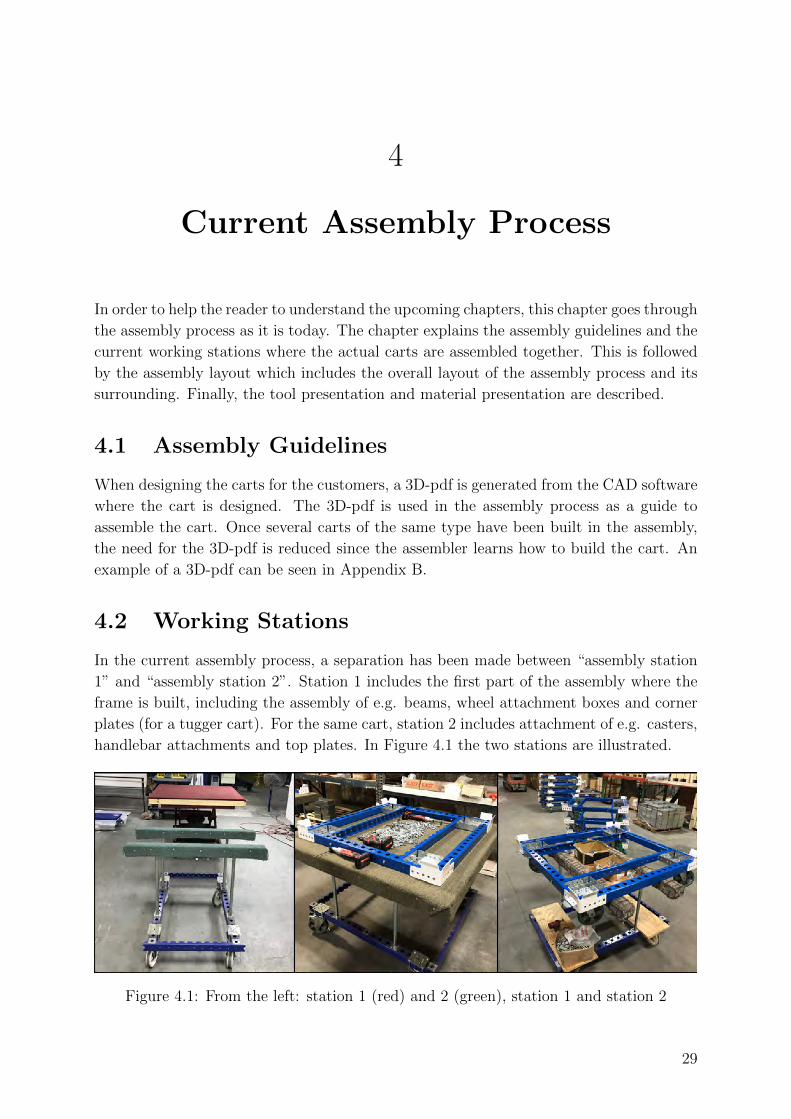
In the current assembly process, a separation has been made between “assembly station
1” and “assembly station 2”. Station 1 includes the first part of the assembly where the
frame is built, including the assembly of e.g. beams, wheel attachment boxes and corner
plates (for a tugger cart). For the same cart, station 2 includes attachment of e.g. casters,
handlebar attachments and top plates. In Figure 4.1 the two stations are illustrated.
Figure 4.1: From the left: station 1 (red) and 2 (green), station 1 and station 2
29
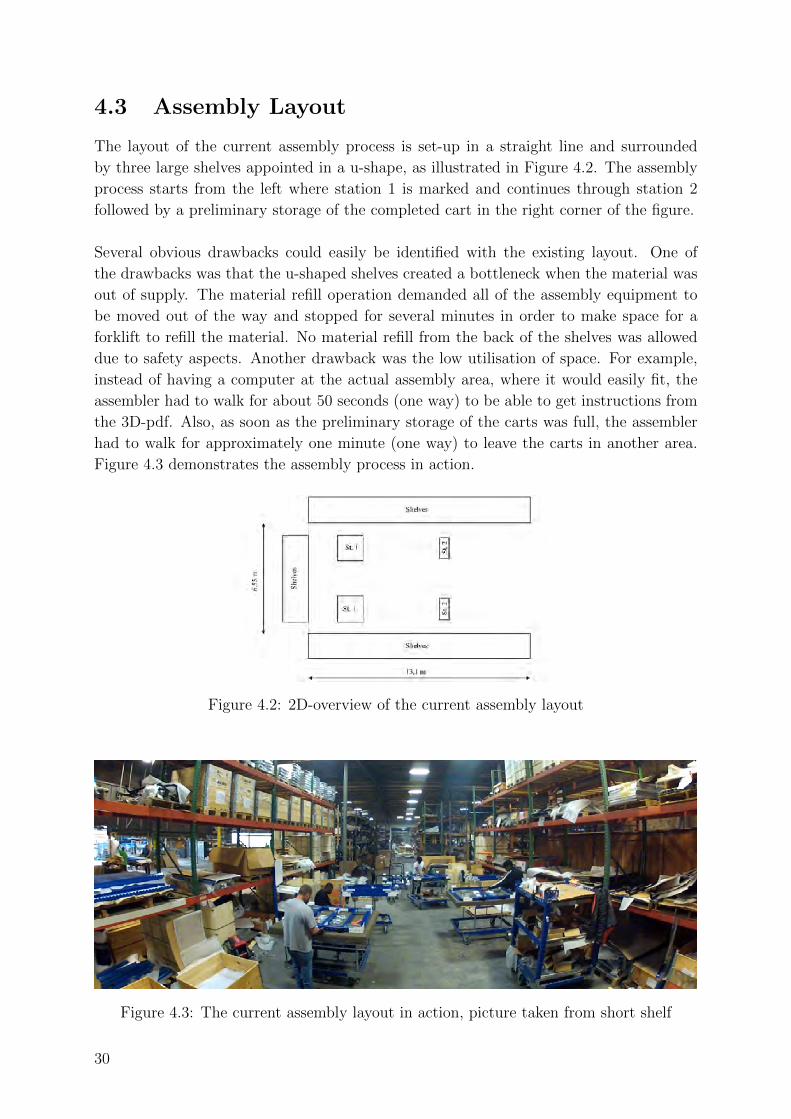
4.3 Assembly Layout
The layout of the current assembly process is set-up in a straight line and surrounded
by three large shelves appointed in a u-shape, as illustrated in Figure 4.2. The assembly
process starts from the left where station 1 is marked and continues through station 2
followed by a preliminary storage of the completed cart in the right corner of the figure.
Several obvious drawbacks could easily be identified with the existing layout. One of
the drawbacks was that the u-shaped shelves created a bottleneck when the material was
out of supply. The material refill operation demanded all of the assembly equipment to
be moved out of the way and stopped for several minutes in order to make space for a
forklift to refill the material. No material refill from the back of the shelves was allowed
due to safety aspects. Another drawback was the low utilisation of space. For example,
instead of having a computer at the actual assembly area, where it would easily fit, the
assembler had to walk for about 50 seconds (one way) to be able to get instructions from
the 3D-pdf. Also, as soon as the preliminary storage of the carts was full, the assembler
had to walk for approximately one minute (one way) to leave the carts in another area.
Figure 4.3 demonstrates the assembly process in action.
Figure 4.2: 2D-overview of the current assembly layout
Figure 4.3: The current assembly layout in action, picture taken from short shelf
30
4.4 Tool Presentation
When the working shift ends, all tools are collected and gathered in certain positions
in order to facilitate the upcoming shift. However, no guidelines for the tool handling
are implemented during the working shift. Instead, the tools are placed wherever the
assembly worker is performing the task, meaning that tools can easily be misplaced. This
may lead to waste since assemblers occasionally have to search for tools.
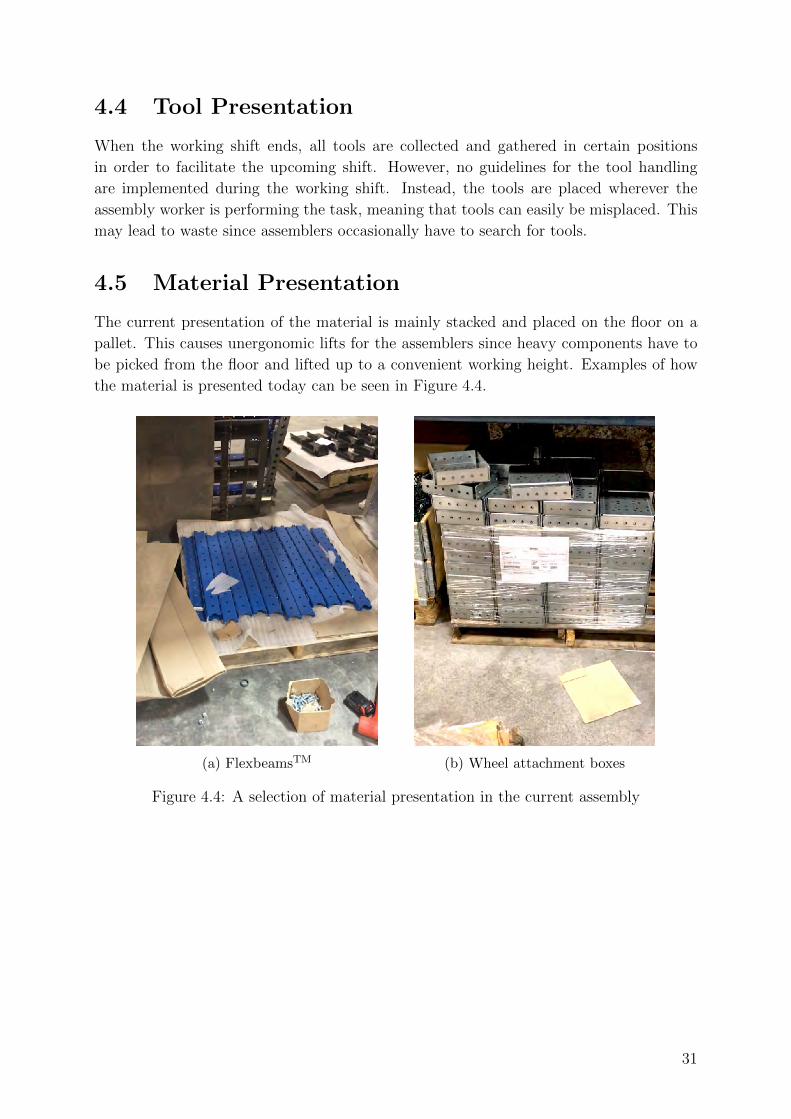
4.5 Material Presentation
The current presentation of the material is mainly stacked and placed on the floor on a
pallet. This causes unergonomic lifts for the assemblers since heavy components have to
be picked from the floor and lifted up to a convenient working height. Examples of how
the material is presented today can be seen in Figure 4.4.
(a) FlexbeamsTM (b) Wheel attachment boxes
Figure 4.4: A selection of material presentation in the current assembly
31
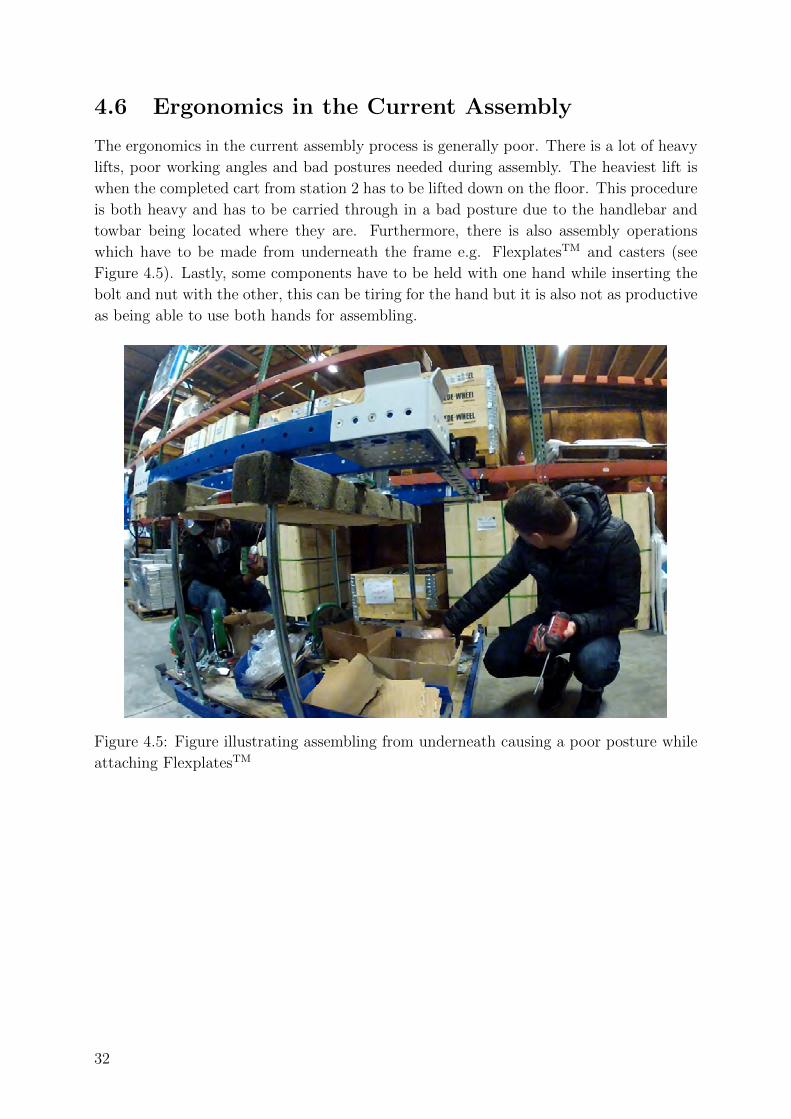
4.6 Ergonomics in the Current Assembly
The ergonomics in the current assembly process is generally poor. There is a lot of heavy
lifts, poor working angles and bad postures needed during assembly. The heaviest lift is
when the completed cart from station 2 has to be lifted down on the floor. This procedure
is both heavy and has to be carried through in a bad posture due to the handlebar and
towbar being located where they are. Furthermore, there is also assembly operations
which have to be made from underneath the frame e.g. FlexplatesTM and casters (see
Figure 4.5). Lastly, some components have to be held with one hand while inserting the
bolt and nut with the other, this can be tiring for the hand but it is also not as productive
as being able to use both hands for assembling.
Figure 4.5: Figure illustrating assembling from underneath causing a poor posture while
attaching FlexplatesTM
32
5
Empirical Research
The following chapter concerns the knowledge gained from real life experiences. These
experiences include interviews made with people from the theoretical field, the industry
and assembly personnel. Also, study visits to companies that share some of the assembly
challenges with Flexqube have been made. Lastly, test assembling of Flexqube’s various
carts has been performed which has been a big contributor to the understanding of the
assembly process. Below, the procedures performed in order to reach these experiences
are explained.
5.1 Interviews and Study Visits
In total, eight different persons have been interviewed. These eight persons have been
divided into three groups, namely ”experts”, ”industry” and ”Flexqube”. The first group
included three professors from Chalmers. Subjects concerning modularity, product devel-
opment and production analysis were discussed. Takeaways from these interviews were
e.g. various techniques which can be used in order to reach improvements in the assembly
process on a more theoretical level, literature recommendations and factors to consider
before planning the actual assembly layout.
Next, three people from the manufacturing industry (Volvo trucks, Scania and Modul-
system) were interviewed in order to discuss how they use certain techniques and methods
and what their experiences were. Takeaways from these interviews were among others how
they work to improve the assembly, the importance of a flexible and ergonomic assembly
and recommendations for setting up a new assembly concept.
The third group consisted of two interviews which were held with the assembly man-
agers, Jeff and Wesley, at Flexqube’s assembly plant in Georgia, USA. The intention of
these two interviews was to contribute to a deeper understanding of needs in the current
assembly process. The result of these interviews consisted of a lot of information regarding
the shortcomings in the current assembly process and also several ideas where and how
improvements could be made to facilitate a more streamlined assembly process, further
explained later.
During the interviews at Modul-system and Volvo trucks, a guided study visit was also
made to their respective assembly lines. The guided study visit made it possible to con-
33
tinuously ask questions regarding the assembly process during the tour. The study visits
contributed with knowledge and inspiration of e.g. layout, ergonomics, methods, tool
usage and part presentation. Furthermore, due to the fact that Volvo trucks partly use
Flexqube’s carts for internal logistics, the visit was even more rewarding since feedback
from the use of the carts could be obtained.
5.2 Test Assembling
The empirical research phase main part was the test assembling of carts at Flexqube’s two
assembly plants. Five days were spent at a company named Advanced Metal Components
(AMC) in the USA, and two days were spent at Wermlands Tunnplat AB (WTAB) in
Torsby, Sweden. Flexqube has outsourced their assembly to both of these companies
and place of assembly are dependent on the geographical location of the end customer.
During the visits, a total of seven different carts variants were assembled. Also, video was
recorded during the different conducted activities throughout the visits.
5.2.1 Test Assembling in Georgia, USA
During the visit, Flexqube’s assembly plant in Swainsboro, GA consisted of two assembly
lines, one for lower volumes with higher variation and complexity and one with higher
volume and lower variation and complexity. The first day was spent at the high volume
line, helping with the assembly of tugger carts and also included a guided tour of the
plant. The next day was spent observing different activities in the plant. First observa-
tions were made at the low volume line, where the operators assembled another type of
tugger cart, and secondly in the inventory where the picking method was observed. The
following days were mostly spent on assembling carts, both on the low and high volume
line. Additional activities included palletising and wrapping of carts for shipping.
Assembling the carts provided unique knowledge that can not be taught or learned from
second-hand sources. The test assembling affected the idea generation and solution devel-
opment immensely because of the insight gained from the current assembly process. The
test assembling contributed further with a deeper understanding of where shortcomings
are present in the current process, and these shortcomings were written down as they were
discovered. Furthermore, the knowledge gained from the assembly supported the creation
of interviews meant for the assembly personnel. A holistic picture of the whole assem-
bly process was gained which facilitated to more qualitative questions for the interviews,
which in turn will contribute to a better data collection.
5.2.2 Test Assembling in Torsby, Sweden
The visit to Flexqube’s other assembly plant in Torsby was made in order to see the dif-
ferences from AMC, to get more inspiration where improvements could be made and also
to test the assembling of a few more different cart types. The test assembling consisted
of five different carts that Flexqube was going to use for exhibitions in Europe during the
34

spring. For example, a shelf cart which represents approximately 20 percent of all sold
carts. This visit mostly concentrated on test assembling but minor observations were also
made covering e.g. the inventory and assembly layout.
Apart from what was concluded from the test assembling in Georgia, USA, the test
assembling in Torsby gave some new experiences. These experiences included assembling
of other types of carts, but the visit also confirmed some of the drawbacks in the assembly
from the USA, mainly the need for a more ergonomic assembly station.
35

36
6
Data Analysis
The following chapter concerns the analysis of the captured data. In this case, the data
is not just defined as raw data, but also data in terms of knowledge gained from the
experience in the empirical research.
6.1 Identification of Common Carts and Parts
Since Flexqube’s carts vary greatly between almost every project and may consist of a wide
array of components, an analysis was made in order to find which carts and components
that were the most recurring ones. In order to do so, a list of all sold components and carts
during the twelve trailing months (TTM) was provided by the supply chain manager.
Carts
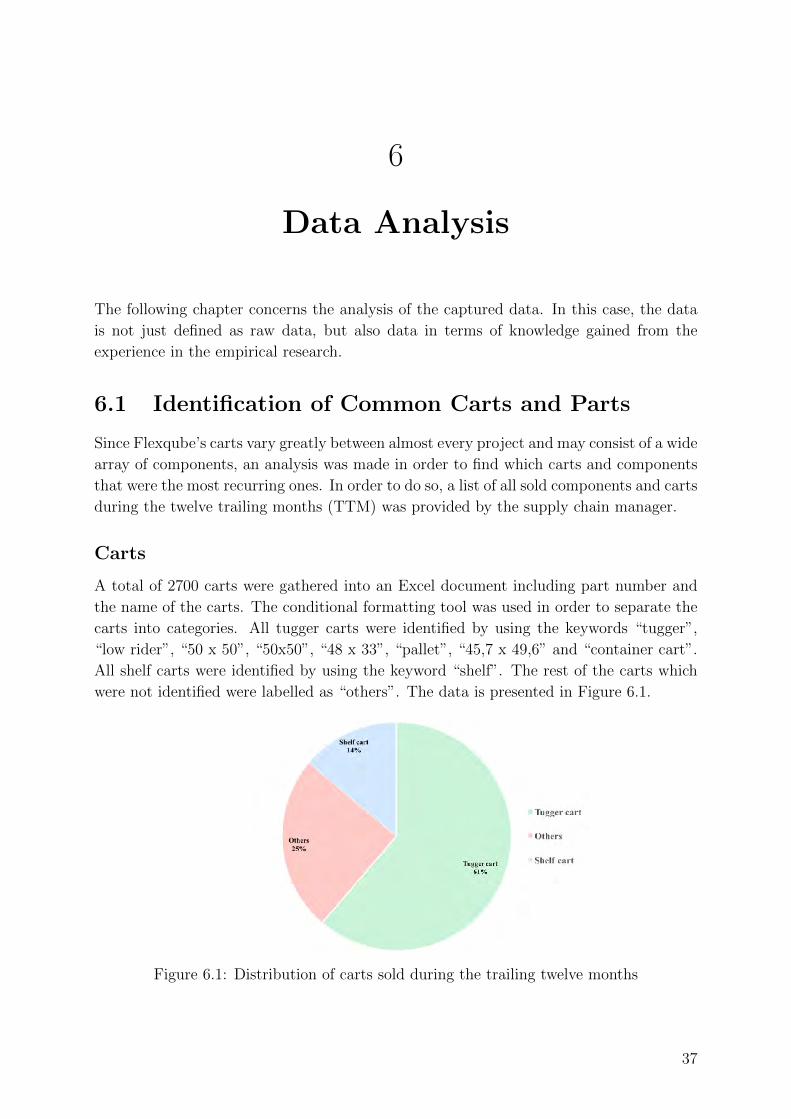
A total of 2700 carts were gathered into an Excel document including part number and
the name of the carts. The conditional formatting tool was used in order to separate the
carts into categories. All tugger carts were identified by using the keywords “tugger”,
“low rider”, “50 x 50”, “50x50”, “48 x 33”, “pallet”, “45,7 x 49,6” and “container cart”.
All shelf carts were identified by using the keyword “shelf”. The rest of the carts which
were not identified were labelled as “others”. The data is presented in Figure 6.1.
Figure 6.1: Distribution of carts sold during the trailing twelve months
37

Components
The first data analysis of the components was based on the supply to the customers. The
components were ordered based on “used parts” to identify what components that are
used to the greatest extent. All screws, bolts and nuts were excluded due to its already
known over-representation (confirmed in Figure 6.3). In addition, a screening was made
to eliminate components that were used in a smaller quantity. Therefore, this data only
contains the 18 most used components. This enabled for a visualisation of the distribution
in between the most expended components. The keywords that the formula used to find
the components were made so that all variation of one component was calculated, even
if it was a different length or material. The distribution of the components was based on
both the assembly in Sweden and USA (TTM). The data is illustrated in Figure 6.2. The
content of “Other” is presented in Appendix C and the most common FlexbeamsTM are
presented in Appendix D.
Figure 6.2: Distribution between the 18 most used components (quantity)
The second data analysis of the components included another approach in order to get a
different perspective of the analysis. Instead of measuring the expended components in
terms of sold quantity, the components were measured based on how many carts they were
included in, measured in percent. This was performed by using a formula in Excel which
calculated whether a certain component was included in the cart or not. The numbers
are presented in Figure 6.3 and additional information regarding the usage of bolts can be
found in Appendix E and Appendix F. This data is based on the last 200 sold variants.
38
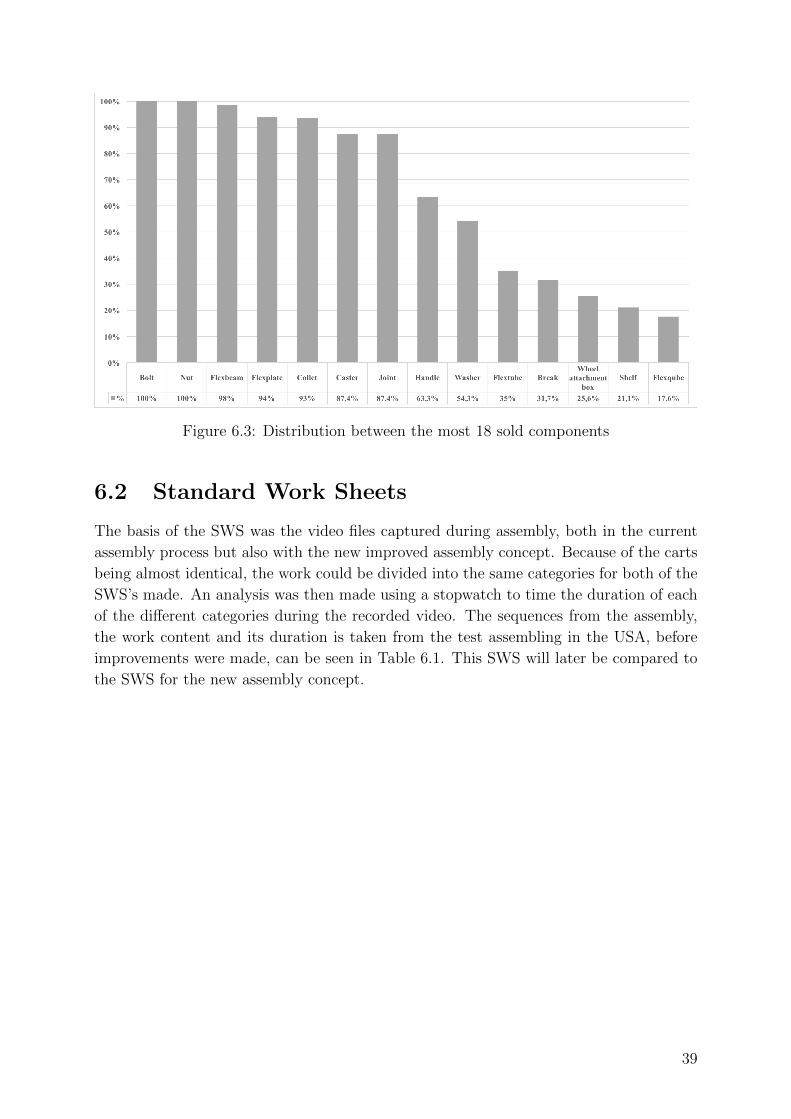
Figure 6.3: Distribution between the most 18 sold components
6.2 Standard Work Sheets
The basis of the SWS was the video files captured during assembly, both in the current
assembly process but also with the new improved assembly concept. Because of the carts
being almost identical, the work could be divided into the same categories for both of the
SWS’s made. An analysis was then made using a stopwatch to time the duration of each
of the different categories during the recorded video. The sequences from the assembly,
the work content and its duration is taken from the test assembling in the USA, before
improvements were made, can be seen in Table 6.1. This SWS will later be compared to
the SWS for the new assembly concept.
39
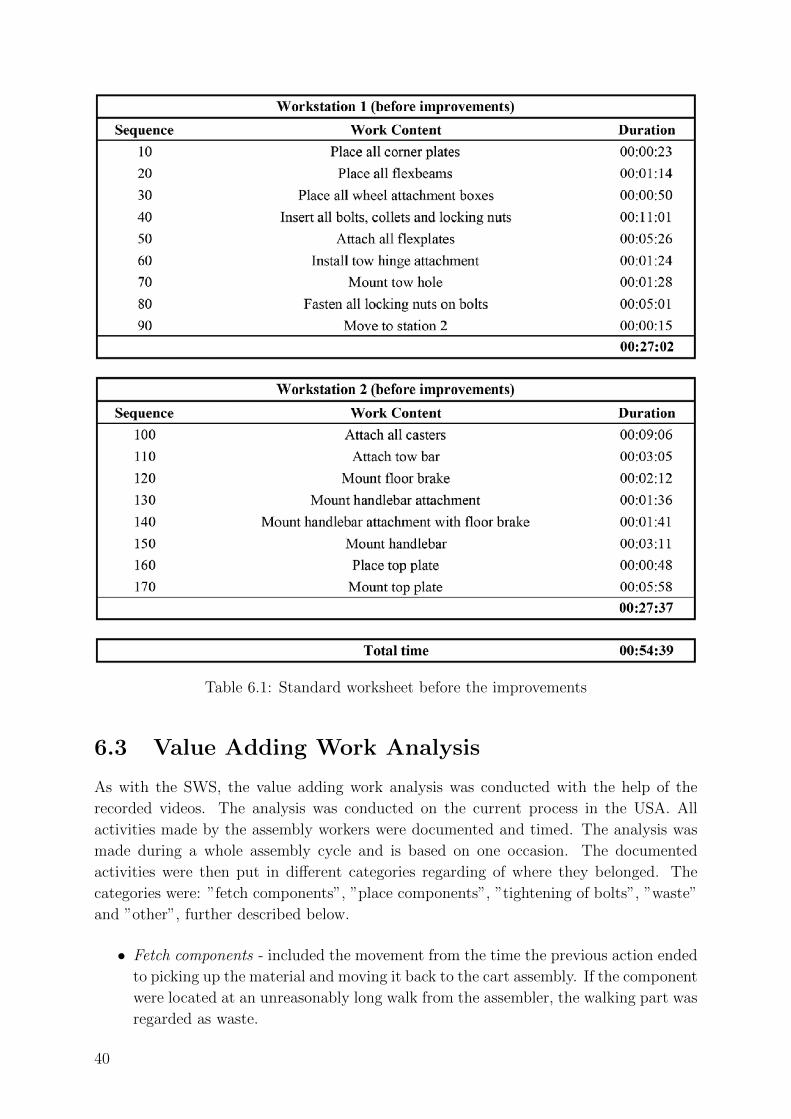
Table 6.1: Standard worksheet before the improvements
6.3 Value Adding Work Analysis
As with the SWS, the value adding work analysis was conducted with the help of the
recorded videos. The analysis was conducted on the current process in the USA. All
activities made by the assembly workers were documented and timed. The analysis was
made during a whole assembly cycle and is based on one occasion. The documented
activities were then put in different categories regarding of where they belonged. The
categories were: ”fetch components”, ”place components”, ”tightening of bolts”, ”waste”
and ”other”, further described below.
• Fetch components - included the movement from the time the previous action ended
to picking up the material and moving it back to the cart assembly. If the component
were located at an unreasonably long walk from the assembler, the walking part was
regarded as waste.
40
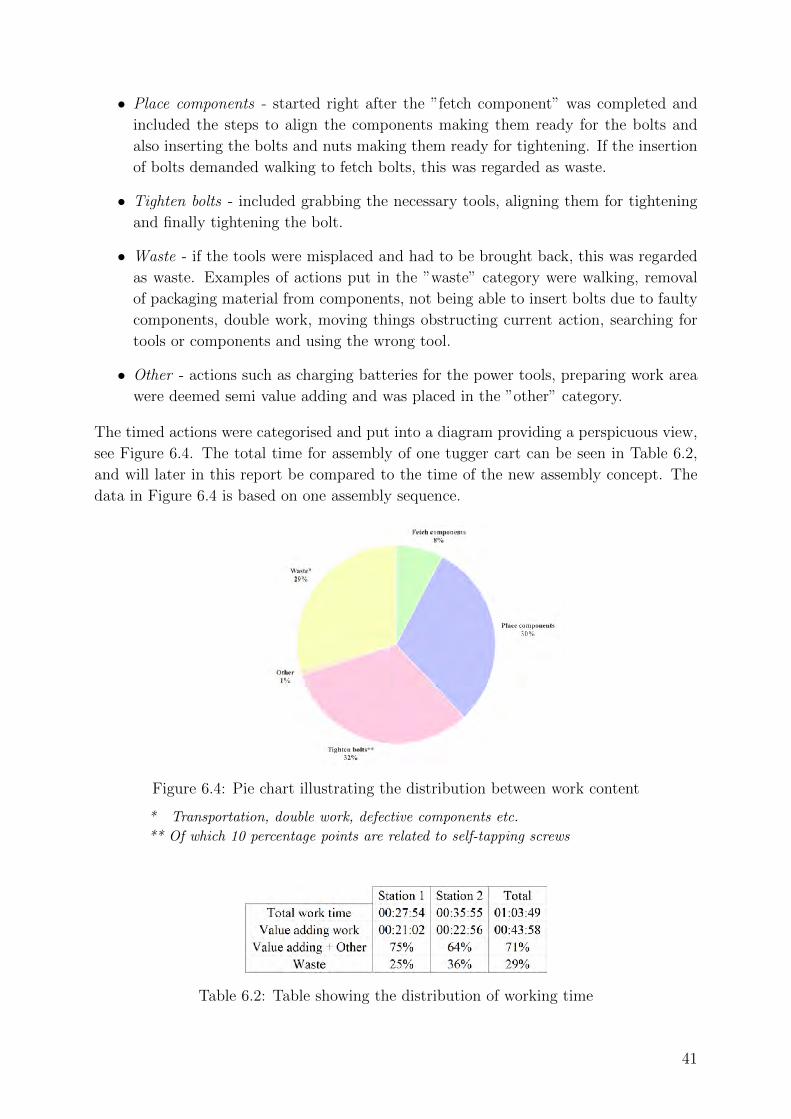
• Place components - started right after the ”fetch component” was completed and
included the steps to align the components making them ready for the bolts and
also inserting the bolts and nuts making them ready for tightening. If the insertion
of bolts demanded walking to fetch bolts, this was regarded as waste.
• Tighten bolts - included grabbing the necessary tools, aligning them for tightening
and finally tightening the bolt.
• Waste - if the tools were misplaced and had to be brought back, this was regarded
as waste. Examples of actions put in the ”waste” category were walking, removal
of packaging material from components, not being able to insert bolts due to faulty
components, double work, moving things obstructing current action, searching for
tools or components and using the wrong tool.
• Other - actions such as charging batteries for the power tools, preparing work area
were deemed semi value adding and was placed in the ”other” category.
The timed actions were categorised and put into a diagram providing a perspicuous view,
see Figure 6.4. The total time for assembly of one tugger cart can be seen in Table 6.2,
and will later in this report be compared to the time of the new assembly concept. The
data in Figure 6.4 is based on one assembly sequence.
Figure 6.4: Pie chart illustrating the distribution between work content
* Transportation, double work, defective components etc.
** Of which 10 percentage points are related to self-tapping screws
Table 6.2: Table showing the distribution of working time
41
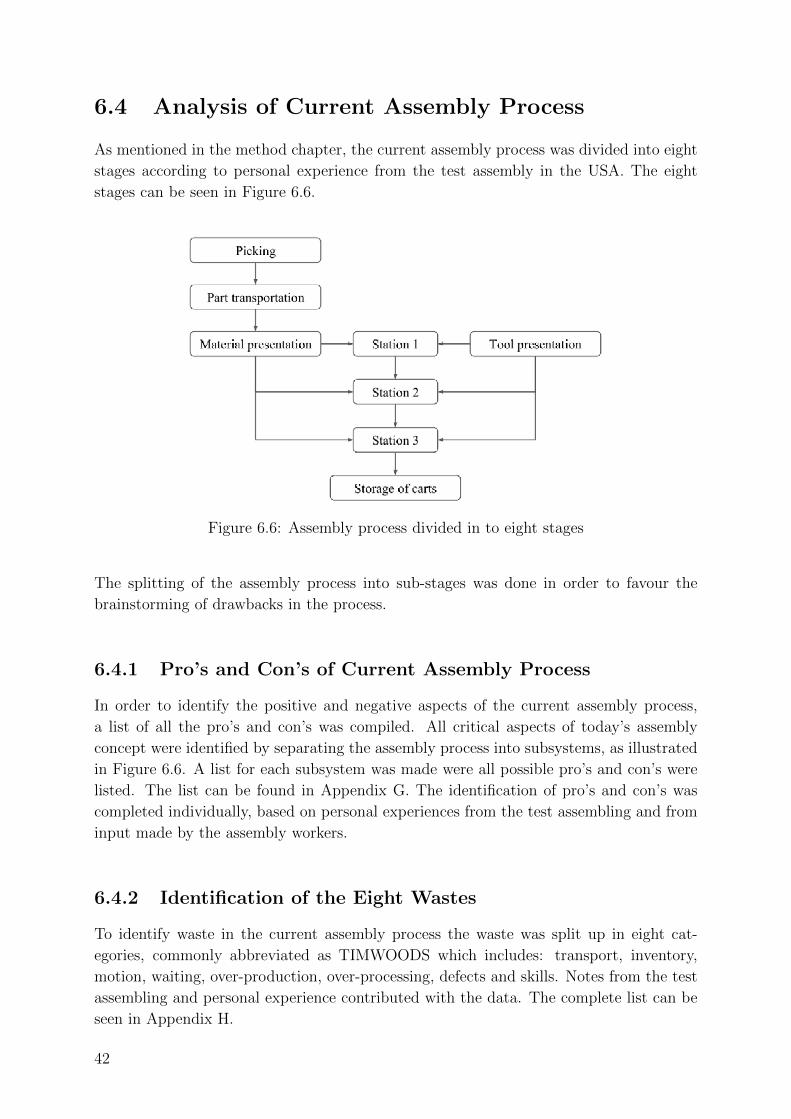
6.4 Analysis of Current Assembly Process
As mentioned in the method chapter, the current assembly process was divided into eight
stages according to personal experience from the test assembly in the USA. The eight
stages can be seen in Figure 6.6.
Figure 6.6: Assembly process divided in to eight stages
The splitting of the assembly process into sub-stages was done in order to favour the
brainstorming of drawbacks in the process.
6.4.1 Pro’s and Con’s of Current Assembly Process
In order to identify the positive and negative aspects of the current assembly process,
a list of all the pro’s and con’s was compiled. All critical aspects of today’s assembly
concept were identified by separating the assembly process into subsystems, as illustrated
in Figure 6.6. A list for each subsystem was made were all possible pro’s and con’s were
listed. The list can be found in Appendix G. The identification of pro’s and con’s was
completed individually, based on personal experiences from the test assembling and from
input made by the assembly workers.
6.4.2 Identification of the Eight Wastes
To identify waste in the current assembly process the waste was split up in eight cat-
egories, commonly abbreviated as TIMWOODS which includes: transport, inventory,
motion, waiting, over-production, over-processing, defects and skills. Notes from the test
assembling and personal experience contributed with the data. The complete list can be
seen in Appendix H.
42
6.4.3 Fishbone Diagram
As mentioned in the method chapter, the 7-M method was used in the fishbone diagram.
There, everything that could impact why the assembly process is inefficient and ineffective
was listed under the categories method, manpower, management, machine, measure, mi-
lieu and material. The fishbone diagram is based on the impressions from the study visits
during the empirical study. These impressions have been obtained from both observing
and own experience. The root cause of the fishbone diagram is defined as ”the assembly
process is ineffective and inefficient”. A simplification of ”effective” is ”to do the right
things” (Wheelwright, 1992) while the corresponding definition of ”efficient” is ”doing
things the right way” (Roghaniana et al., 2012). Each category of the fishbone diagram
is further described below and a Figure of the fishbone diagram in a whole can be seen in
Figure 6.7.
1. Method - the working procedure of the assemblers and their environment.
2. Manpower - factors related to the actual workers.
3. Management - content which are based on the leadership of the assembly.
4. Machine - the usage and faults related to machines or tools.
5. Measure - quantitative and qualitative aspects of the assembly.
6. Mileu - the surrounding and its impact on the assembly
7. Material - the components and its affection on the assembly.
43
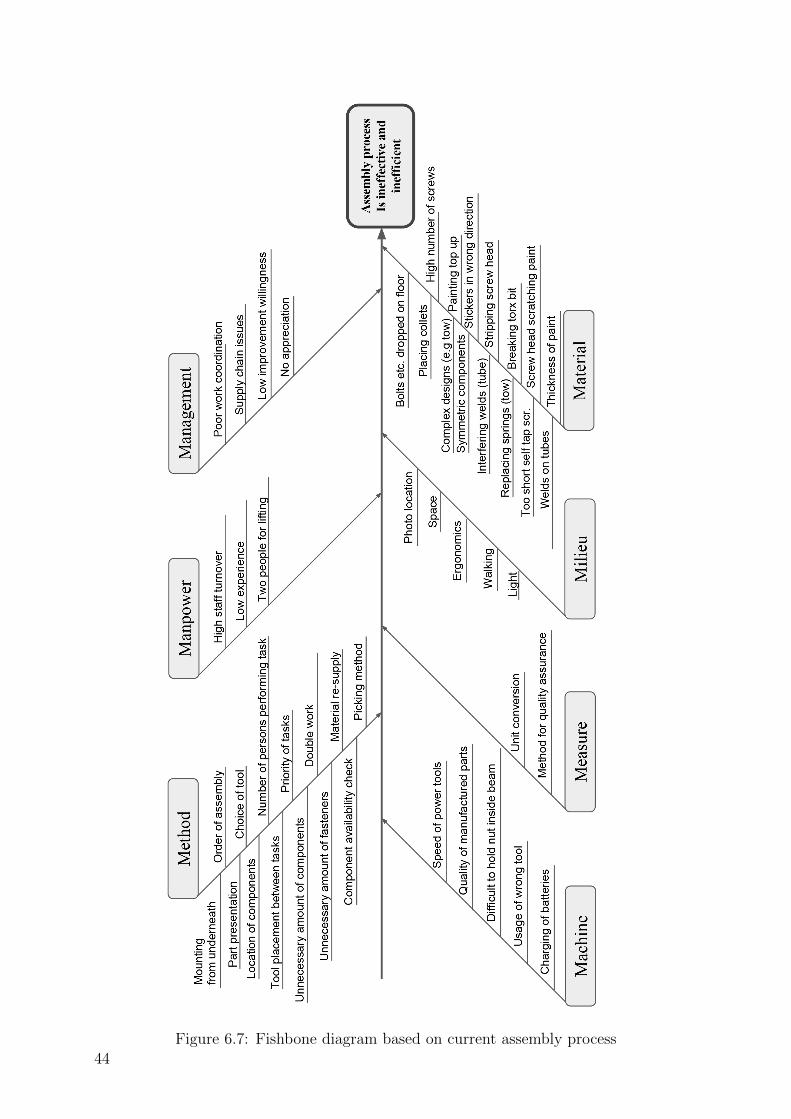
Figure 6.7: Fishbone diagram based on current assembly process44
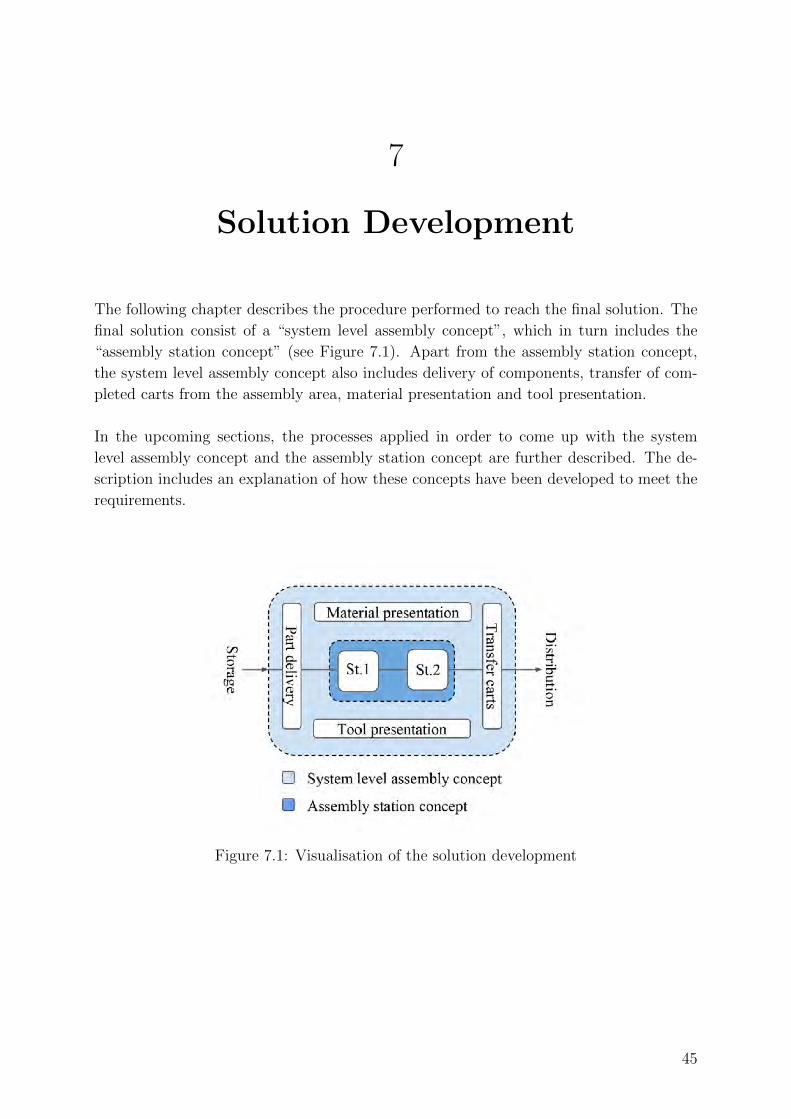
7
Solution Development
The following chapter describes the procedure performed to reach the final solution. The
final solution consist of a “system level assembly concept”, which in turn includes the
“assembly station concept” (see Figure 7.1). Apart from the assembly station concept,
the system level assembly concept also includes delivery of components, transfer of com-
pleted carts from the assembly area, material presentation and tool presentation.
In the upcoming sections, the processes applied in order to come up with the system
level assembly concept and the assembly station concept are further described. The de-
scription includes an explanation of how these concepts have been developed to meet the
requirements.
Figure 7.1: Visualisation of the solution development
45
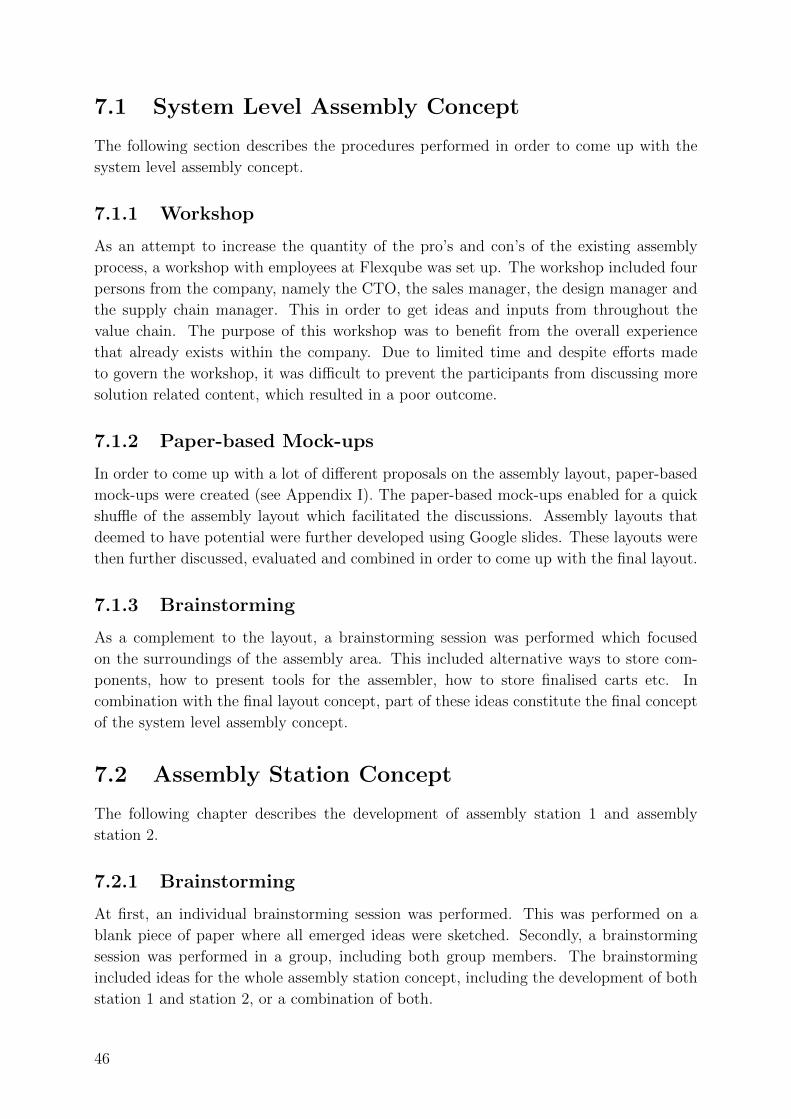
7.1 System Level Assembly Concept
The following section describes the procedures performed in order to come up with the
system level assembly concept.
7.1.1 Workshop
As an attempt to increase the quantity of the pro’s and con’s of the existing assembly
process, a workshop with employees at Flexqube was set up. The workshop included four
persons from the company, namely the CTO, the sales manager, the design manager and
the supply chain manager. This in order to get ideas and inputs from throughout the
value chain. The purpose of this workshop was to benefit from the overall experience
that already exists within the company. Due to limited time and despite efforts made
to govern the workshop, it was difficult to prevent the participants from discussing more
solution related content, which resulted in a poor outcome.
7.1.2 Paper-based Mock-ups
In order to come up with a lot of different proposals on the assembly layout, paper-based
mock-ups were created (see Appendix I). The paper-based mock-ups enabled for a quick
shuffle of the assembly layout which facilitated the discussions. Assembly layouts that
deemed to have potential were further developed using Google slides. These layouts were
then further discussed, evaluated and combined in order to come up with the final layout.
7.1.3 Brainstorming
As a complement to the layout, a brainstorming session was performed which focused
on the surroundings of the assembly area. This included alternative ways to store com-
ponents, how to present tools for the assembler, how to store finalised carts etc. In
combination with the final layout concept, part of these ideas constitute the final concept
of the system level assembly concept.
7.2 Assembly Station Concept
The following chapter describes the development of assembly station 1 and assembly
station 2.
7.2.1 Brainstorming
At first, an individual brainstorming session was performed. This was performed on a
blank piece of paper where all emerged ideas were sketched. Secondly, a brainstorming
session was performed in a group, including both group members. The brainstorming
included ideas for the whole assembly station concept, including the development of both
station 1 and station 2, or a combination of both.
46
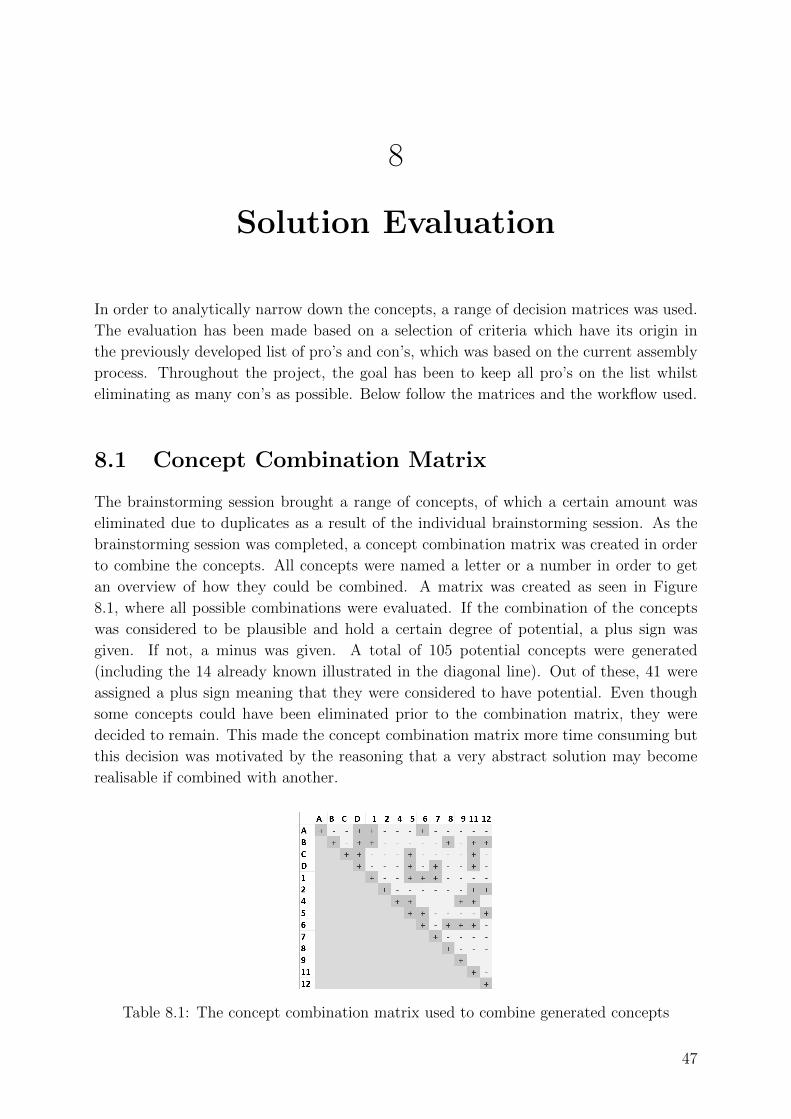
8
Solution Evaluation
In order to analytically narrow down the concepts, a range of decision matrices was used.
The evaluation has been made based on a selection of criteria which have its origin in
the previously developed list of pro’s and con’s, which was based on the current assembly
process. Throughout the project, the goal has been to keep all pro’s on the list whilst
eliminating as many con’s as possible. Below follow the matrices and the workflow used.
8.1 Concept Combination Matrix
The brainstorming session brought a range of concepts, of which a certain amount was
eliminated due to duplicates as a result of the individual brainstorming session. As the
brainstorming session was completed, a concept combination matrix was created in order
to combine the concepts. All concepts were named a letter or a number in order to get
an overview of how they could be combined. A matrix was created as seen in Figure
8.1, where all possible combinations were evaluated. If the combination of the concepts
was considered to be plausible and hold a certain degree of potential, a plus sign was
given. If not, a minus was given. A total of 105 potential concepts were generated
(including the 14 already known illustrated in the diagonal line). Out of these, 41 were
assigned a plus sign meaning that they were considered to have potential. Even though
some concepts could have been eliminated prior to the combination matrix, they were
decided to remain. This made the concept combination matrix more time consuming but
this decision was motivated by the reasoning that a very abstract solution may become
realisable if combined with another.
Table 8.1: The concept combination matrix used to combine generated concepts
47
8.2 Elimination Matrix
After the concept combination matrix, a total of 41 concepts were compiled. In order to
reduce the number of concepts, an elimination matrix was used. The elimination matrix
made 41 concepts into 6 by challenging each concept for certain criteria, as can be seen in
Appendix J. Due to the high number of concepts generated from the concept combination
matrix, of which a lot were quite abstract, the elimination of the concepts went all the
way from 41 to 6.
8.2.1 Concepts Remaining After Initial Elimination
The remaining six concepts are illustrated in Figure 8.1. In the upcoming subsection,
each concept is further described in detail.
Figure 8.1: Sketches of the six remaining concepts. From the top left corner: Jib Crane,
Flexrail, Dock & Lift, Flaps, Piston Lift and Drop-flap
Concept 2, ”Jib Crane”
The jib crane uses a crane or a beam in the ceiling to allow a hanging jig. The jig
connects to the frame from two sides and then lifts the frame from station 1. The rest of
the assembly is done while the frame is hanging. The frame can be rotated around the
axis where it is connected to the jig as well as adjusted in height inside the jig.
Concept 9, ”Flexrail”
Flexrail is an adaptable table consisting of adjustable support rails. As seen in Figure 8.1,
the two long rails can move horizontally while the four shorter rails can move vertically so
48
that they support the assembly of the frame. Due to the thin profile of the support rails,
the assembly operations performed at station two can be performed in the same station.
If the frame is secured, it can also be rotated and later lowered to the ground. Before
production starts, the rails are set to fit that specific cart, meaning there is no need to
move the support rails more than at the beginning of a new cart variant.
Concept 6-11, ”Dock & Lift”
This concept consists of a flat assembly table to facilitate the assembly of the frame. Two
parts of the assembly area is a movable cart. When the frame is completed, the cart is
slightly lifted which allows the cart to be rolled away and can be used as station 2.
Concept 5, ”Flaps”
Flaps is a transformable assembly station. At first, it acts as station 1 providing a full
table top. When the frame has been assembled, three flaps are folded through the use
of hinges which allow the assembly operations normally occurring at station 2 to be
performed without the need for a lift. Although eliminated in the concept screening
matrix, inspiration was taken into the final assembly concept where two flaps are being
used on station 1 to facilitate the docking of the rotating assembly station.
Concept BD, ”Piston Lift”
The piston lift has a flat table top to support the assembly of the frame. When the frame
is complete, four pistons raise the frame from the table top to facilitate the mounting of
remaining components which requires access to the bottom of the frame.
Concept 5-6, ”Drop-Flap”
The drop flap is similar to concept 5, ”flaps” but has the ability to lower the cart to the
ground.
8.3 Criteria for the Concept Screening Matrices
The different criteria used for evaluation of the concepts in the matrices were chosen in
order to reach the best possible solution. The criteria and why they are important can
be read below.
Efficiency
Increased efficiency is a key goal of this project and is a measurement of how well resources
can be transformed into products. The efficiency criteria were split up into sub-categories
to make it easier to grade concepts and to give each concept a fair assessment. The
subcategories are explained more in detail below and were as follows:
49
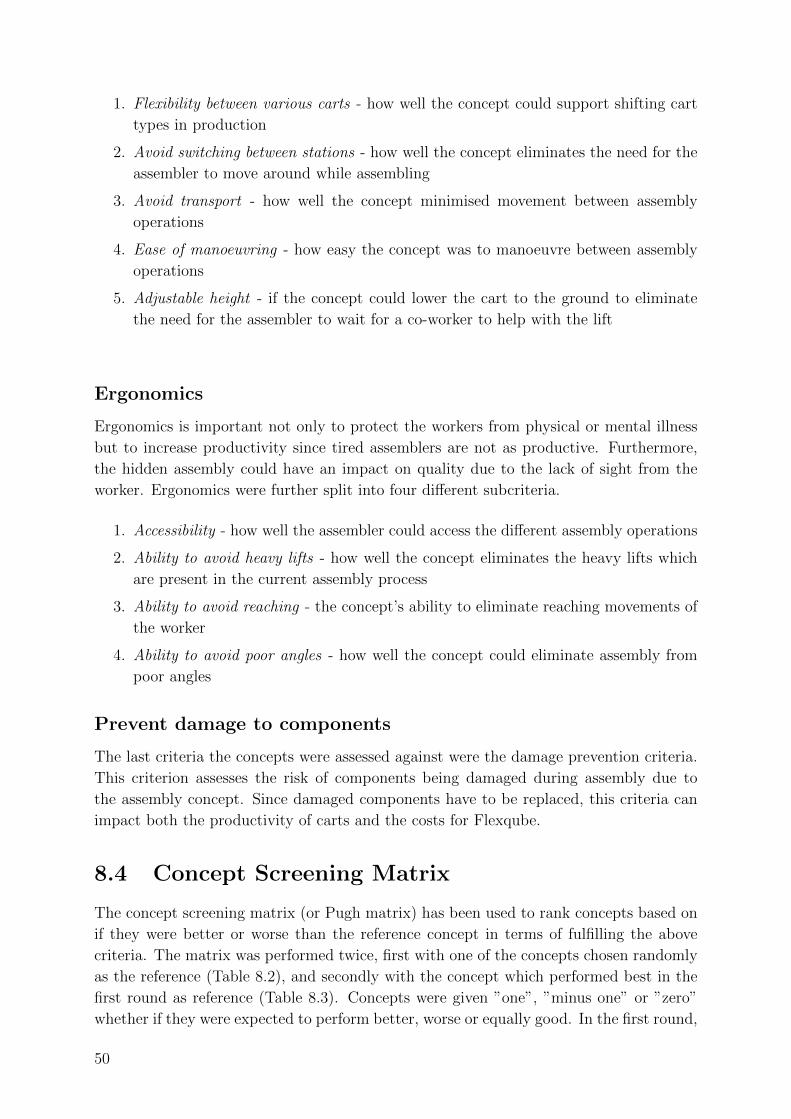
1. Flexibility between various carts - how well the concept could support shifting cart
types in production
2. Avoid switching between stations - how well the concept eliminates the need for the
assembler to move around while assembling
3. Avoid transport - how well the concept minimised movement between assembly
operations
4. Ease of manoeuvring - how easy the concept was to manoeuvre between assembly
operations
5. Adjustable height - if the concept could lower the cart to the ground to eliminate
the need for the assembler to wait for a co-worker to help with the lift
Ergonomics
Ergonomics is important not only to protect the workers from physical or mental illness
but to increase productivity since tired assemblers are not as productive. Furthermore,
the hidden assembly could have an impact on quality due to the lack of sight from the
worker. Ergonomics were further split into four different subcriteria.
1. Accessibility - how well the assembler could access the different assembly operations
2. Ability to avoid heavy lifts - how well the concept eliminates the heavy lifts which
are present in the current assembly process
3. Ability to avoid reaching - the concept’s ability to eliminate reaching movements of
the worker
4. Ability to avoid poor angles - how well the concept could eliminate assembly from
poor angles
Prevent damage to components
The last criteria the concepts were assessed against were the damage prevention criteria.
This criterion assesses the risk of components being damaged during assembly due to
the assembly concept. Since damaged components have to be replaced, this criteria can
impact both the productivity of carts and the costs for Flexqube.
8.4 Concept Screening Matrix
The concept screening matrix (or Pugh matrix) has been used to rank concepts based on
if they were better or worse than the reference concept in terms of fulfilling the above
criteria. The matrix was performed twice, first with one of the concepts chosen randomly
as the reference (Table 8.2), and secondly with the concept which performed best in the
first round as reference (Table 8.3). Concepts were given ”one”, ”minus one” or ”zero”
whether if they were expected to perform better, worse or equally good. In the first round,
50
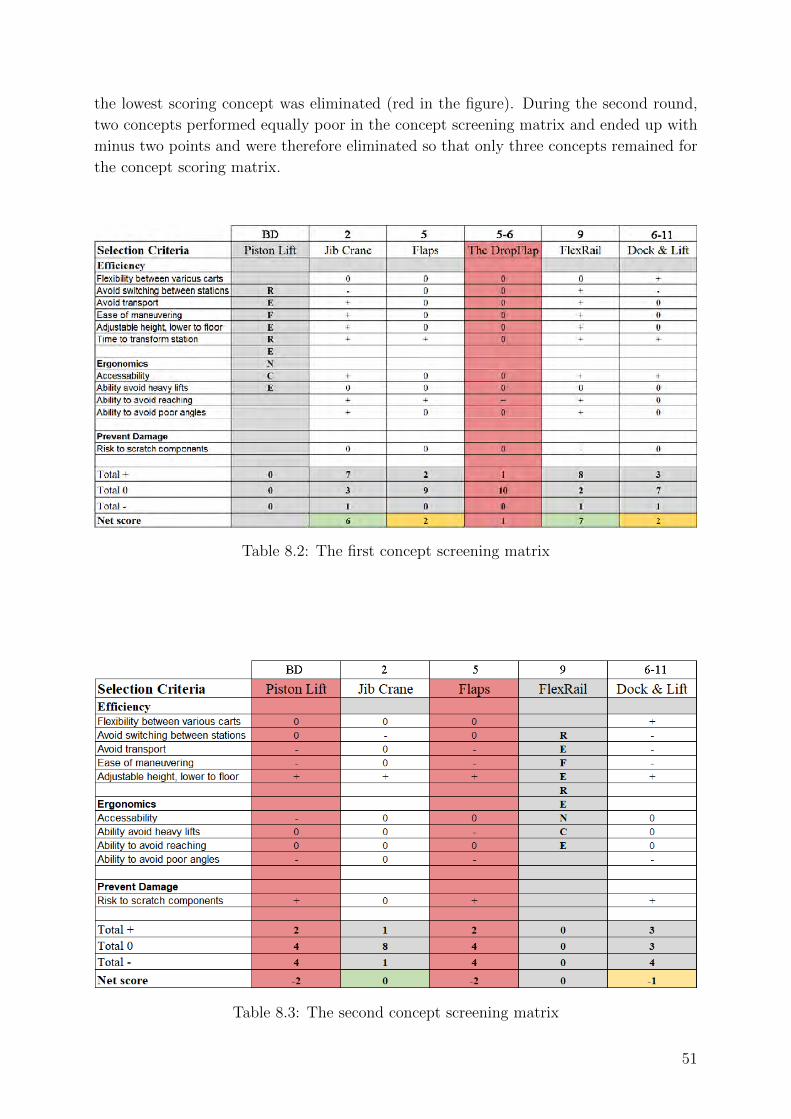
the lowest scoring concept was eliminated (red in the figure). During the second round,
two concepts performed equally poor in the concept screening matrix and ended up with
minus two points and were therefore eliminated so that only three concepts remained for
the concept scoring matrix.
Table 8.2: The first concept screening matrix
Table 8.3: The second concept screening matrix
51
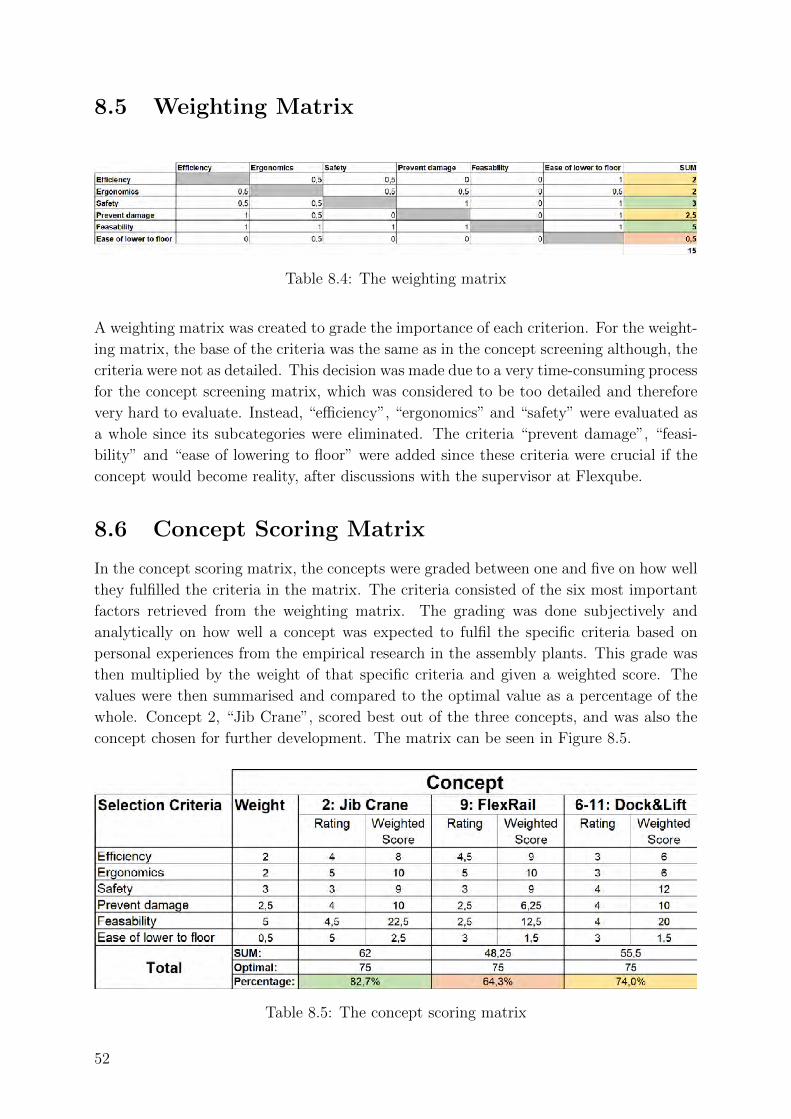
8.5 Weighting Matrix
Table 8.4: The weighting matrix
A weighting matrix was created to grade the importance of each criterion. For the weight-
ing matrix, the base of the criteria was the same as in the concept screening although, the
criteria were not as detailed. This decision was made due to a very time-consuming process
for the concept screening matrix, which was considered to be too detailed and therefore
very hard to evaluate. Instead, “efficiency”, “ergonomics” and “safety” were evaluated as
a whole since its subcategories were eliminated. The criteria “prevent damage”, “feasi-
bility” and “ease of lowering to floor” were added since these criteria were crucial if the
concept would become reality, after discussions with the supervisor at Flexqube.
8.6 Concept Scoring Matrix
In the concept scoring matrix, the concepts were graded between one and five on how well
they fulfilled the criteria in the matrix. The criteria consisted of the six most important
factors retrieved from the weighting matrix. The grading was done subjectively and
analytically on how well a concept was expected to fulfil the specific criteria based on
personal experiences from the empirical research in the assembly plants. This grade was
then multiplied by the weight of that specific criteria and given a weighted score. The
values were then summarised and compared to the optimal value as a percentage of the
whole. Concept 2, “Jib Crane”, scored best out of the three concepts, and was also the
concept chosen for further development. The matrix can be seen in Figure 8.5.
Table 8.5: The concept scoring matrix
52
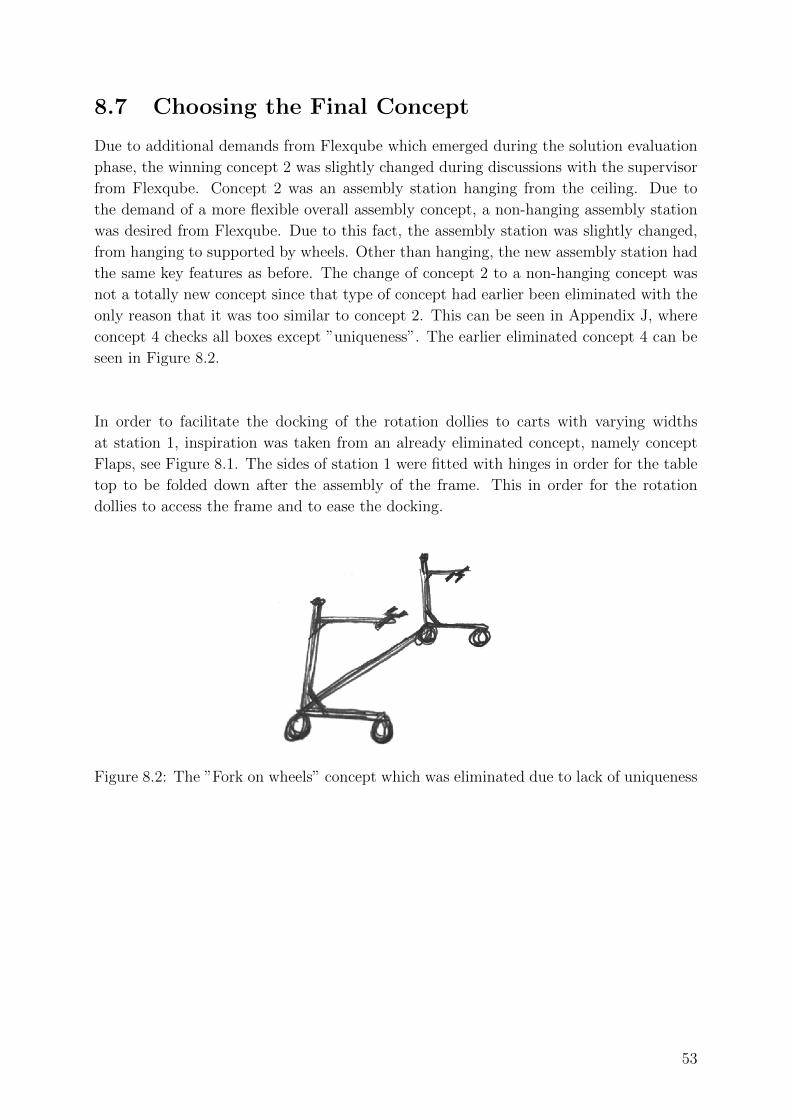
8.7 Choosing the Final Concept
Due to additional demands from Flexqube which emerged during the solution evaluation
phase, the winning concept 2 was slightly changed during discussions with the supervisor
from Flexqube. Concept 2 was an assembly station hanging from the ceiling. Due to
the demand of a more flexible overall assembly concept, a non-hanging assembly station
was desired from Flexqube. Due to this fact, the assembly station was slightly changed,
from hanging to supported by wheels. Other than hanging, the new assembly station had
the same key features as before. The change of concept 2 to a non-hanging concept was
not a totally new concept since that type of concept had earlier been eliminated with the
only reason that it was too similar to concept 2. This can be seen in Appendix J, where
concept 4 checks all boxes except ”uniqueness”. The earlier eliminated concept 4 can be
seen in Figure 8.2.
In order to facilitate the docking of the rotation dollies to carts with varying widths
at station 1, inspiration was taken from an already eliminated concept, namely concept
Flaps, see Figure 8.1. The sides of station 1 were fitted with hinges in order for the table
top to be folded down after the assembly of the frame. This in order for the rotation
dollies to access the frame and to ease the docking.
Figure 8.2: The ”Fork on wheels” concept which was eliminated due to lack of uniqueness
53

54
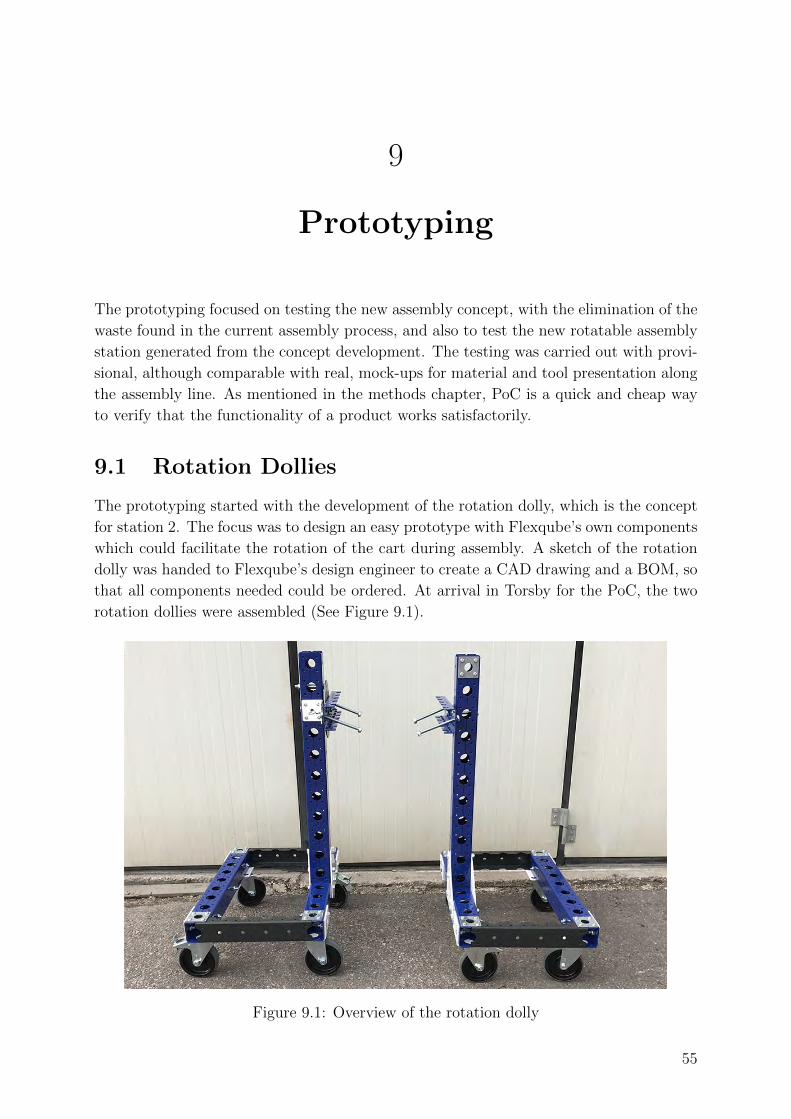
9
Prototyping
The prototyping focused on testing the new assembly concept, with the elimination of the
waste found in the current assembly process, and also to test the new rotatable assembly
station generated from the concept development. The testing was carried out with provi-
sional, although comparable with real, mock-ups for material and tool presentation along
the assembly line. As mentioned in the methods chapter, PoC is a quick and cheap way
to verify that the functionality of a product works satisfactorily.
9.1 Rotation Dollies
The prototyping started with the development of the rotation dolly, which is the concept
for station 2. The focus was to design an easy prototype with Flexqube’s own components
which could facilitate the rotation of the cart during assembly. A sketch of the rotation
dolly was handed to Flexqube’s design engineer to create a CAD drawing and a BOM, so
that all components needed could be ordered. At arrival in Torsby for the PoC, the two
rotation dollies were assembled (See Figure 9.1).
Figure 9.1: Overview of the rotation dolly
55
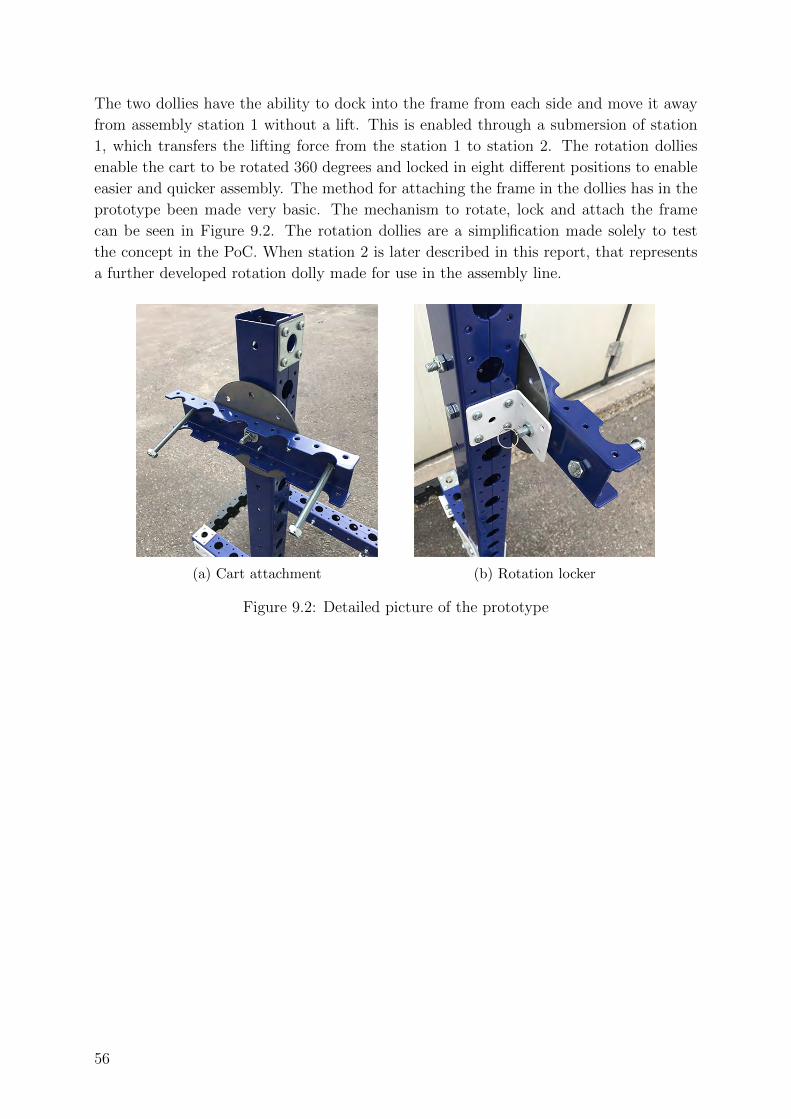
The two dollies have the ability to dock into the frame from each side and move it away
from assembly station 1 without a lift. This is enabled through a submersion of station
1, which transfers the lifting force from the station 1 to station 2. The rotation dollies
enable the cart to be rotated 360 degrees and locked in eight different positions to enable
easier and quicker assembly. The method for attaching the frame in the dollies has in the
prototype been made very basic. The mechanism to rotate, lock and attach the frame
can be seen in Figure 9.2. The rotation dollies are a simplification made solely to test
the concept in the PoC. When station 2 is later described in this report, that represents
a further developed rotation dolly made for use in the assembly line.
(a) Cart attachment (b) Rotation locker
Figure 9.2: Detailed picture of the prototype
56
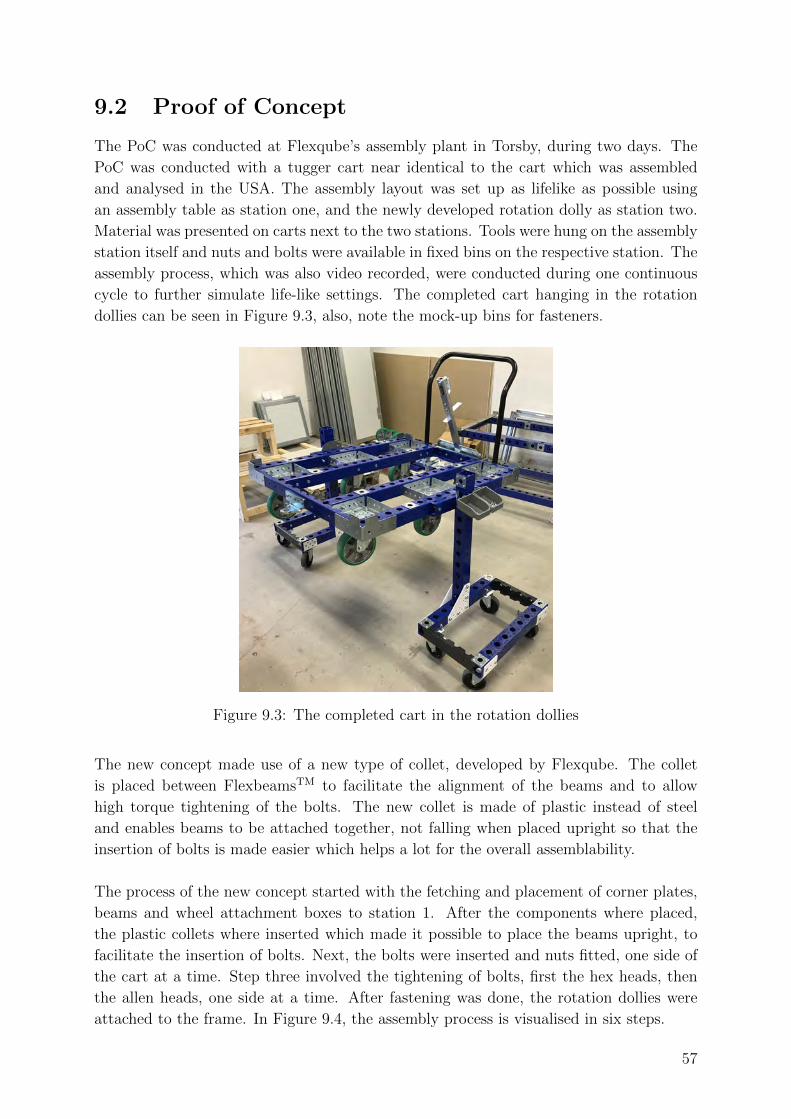
9.2 Proof of Concept
The PoC was conducted at Flexqube’s assembly plant in Torsby, during two days. The
PoC was conducted with a tugger cart near identical to the cart which was assembled
and analysed in the USA. The assembly layout was set up as lifelike as possible using
an assembly table as station one, and the newly developed rotation dolly as station two.
Material was presented on carts next to the two stations. Tools were hung on the assembly
station itself and nuts and bolts were available in fixed bins on the respective station. The
assembly process, which was also video recorded, were conducted during one continuous
cycle to further simulate life-like settings. The completed cart hanging in the rotation
dollies can be seen in Figure 9.3, also, note the mock-up bins for fasteners.
Figure 9.3: The completed cart in the rotation dollies
The new concept made use of a new type of collet, developed by Flexqube. The collet
is placed between FlexbeamsTM to facilitate the alignment of the beams and to allow
high torque tightening of the bolts. The new collet is made of plastic instead of steel
and enables beams to be attached together, not falling when placed upright so that the
insertion of bolts is made easier which helps a lot for the overall assemblability.
The process of the new concept started with the fetching and placement of corner plates,
beams and wheel attachment boxes to station 1. After the components where placed,
the plastic collets where inserted which made it possible to place the beams upright, to
facilitate the insertion of bolts. Next, the bolts were inserted and nuts fitted, one side of
the cart at a time. Step three involved the tightening of bolts, first the hex heads, then
the allen heads, one side at a time. After fastening was done, the rotation dollies were
attached to the frame. In Figure 9.4, the assembly process is visualised in six steps.
57
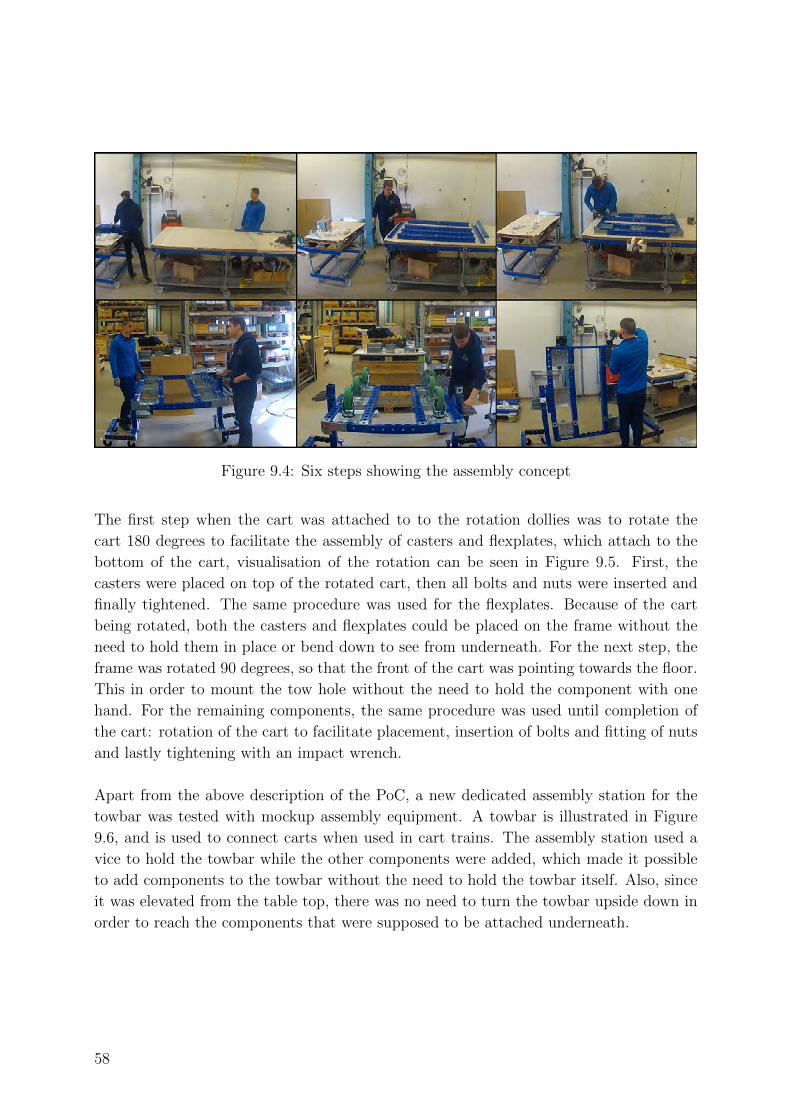
Figure 9.4: Six steps showing the assembly concept
The first step when the cart was attached to to the rotation dollies was to rotate the
cart 180 degrees to facilitate the assembly of casters and flexplates, which attach to the
bottom of the cart, visualisation of the rotation can be seen in Figure 9.5. First, the
casters were placed on top of the rotated cart, then all bolts and nuts were inserted and
finally tightened. The same procedure was used for the flexplates. Because of the cart
being rotated, both the casters and flexplates could be placed on the frame without the
need to hold them in place or bend down to see from underneath. For the next step, the
frame was rotated 90 degrees, so that the front of the cart was pointing towards the floor.
This in order to mount the tow hole without the need to hold the component with one
hand. For the remaining components, the same procedure was used until completion of
the cart: rotation of the cart to facilitate placement, insertion of bolts and fitting of nuts
and lastly tightening with an impact wrench.
Apart from the above description of the PoC, a new dedicated assembly station for the
towbar was tested with mockup assembly equipment. A towbar is illustrated in Figure
9.6, and is used to connect carts when used in cart trains. The assembly station used a
vice to hold the towbar while the other components were added, which made it possible
to add components to the towbar without the need to hold the towbar itself. Also, since
it was elevated from the table top, there was no need to turn the towbar upside down in
order to reach the components that were supposed to be attached underneath.
58
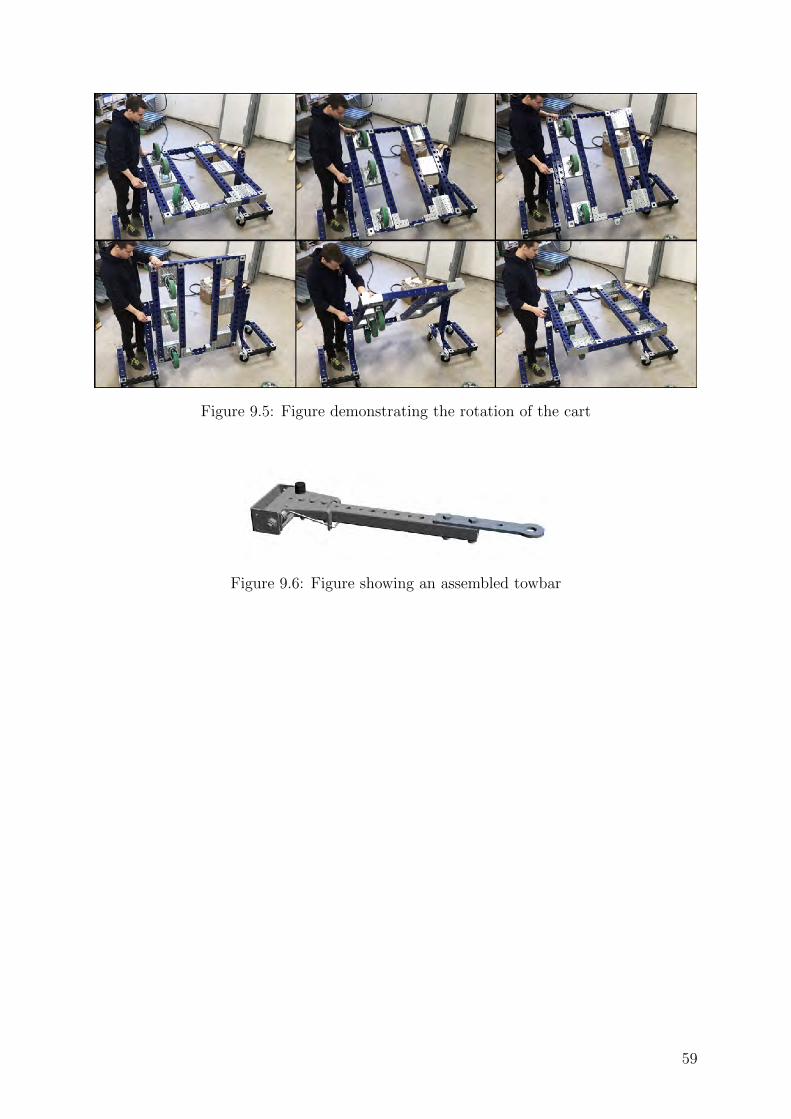
Figure 9.5: Figure demonstrating the rotation of the cart
Figure 9.6: Figure showing an assembled towbar
59
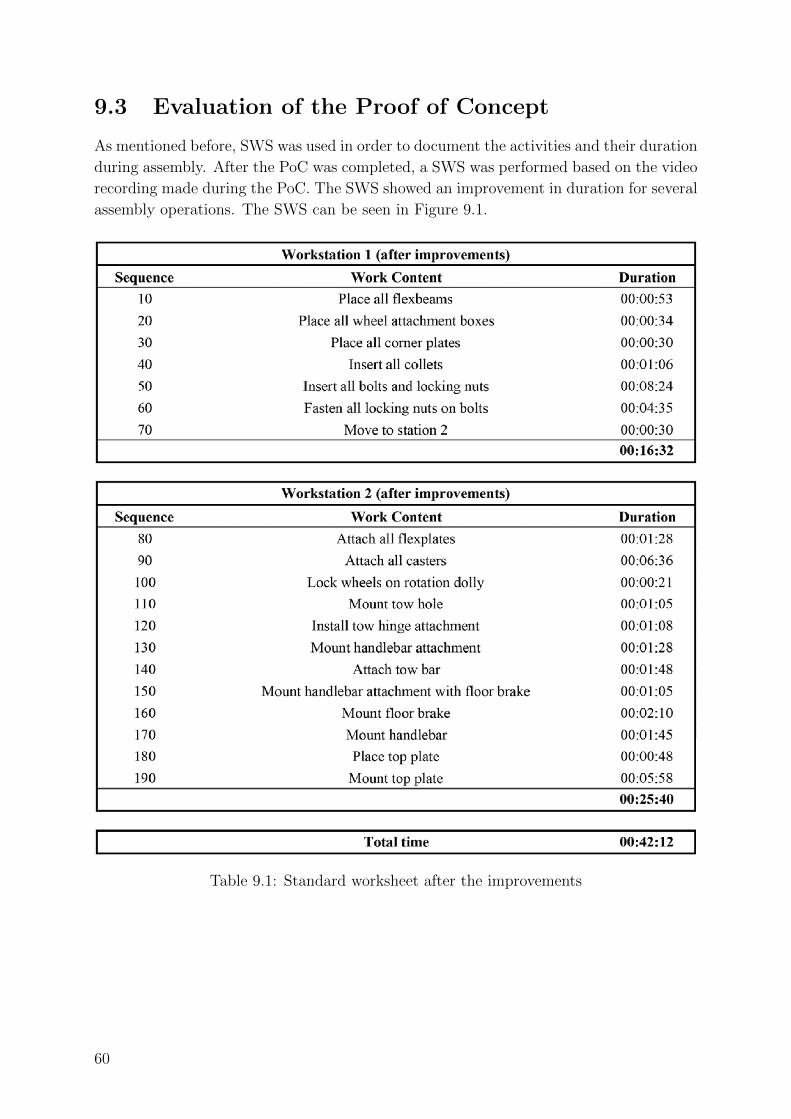
9.3 Evaluation of the Proof of Concept
As mentioned before, SWS was used in order to document the activities and their duration
during assembly. After the PoC was completed, a SWS was performed based on the video
recording made during the PoC. The SWS showed an improvement in duration for several
assembly operations. The SWS can be seen in Figure 9.1.
Table 9.1: Standard worksheet after the improvements
60
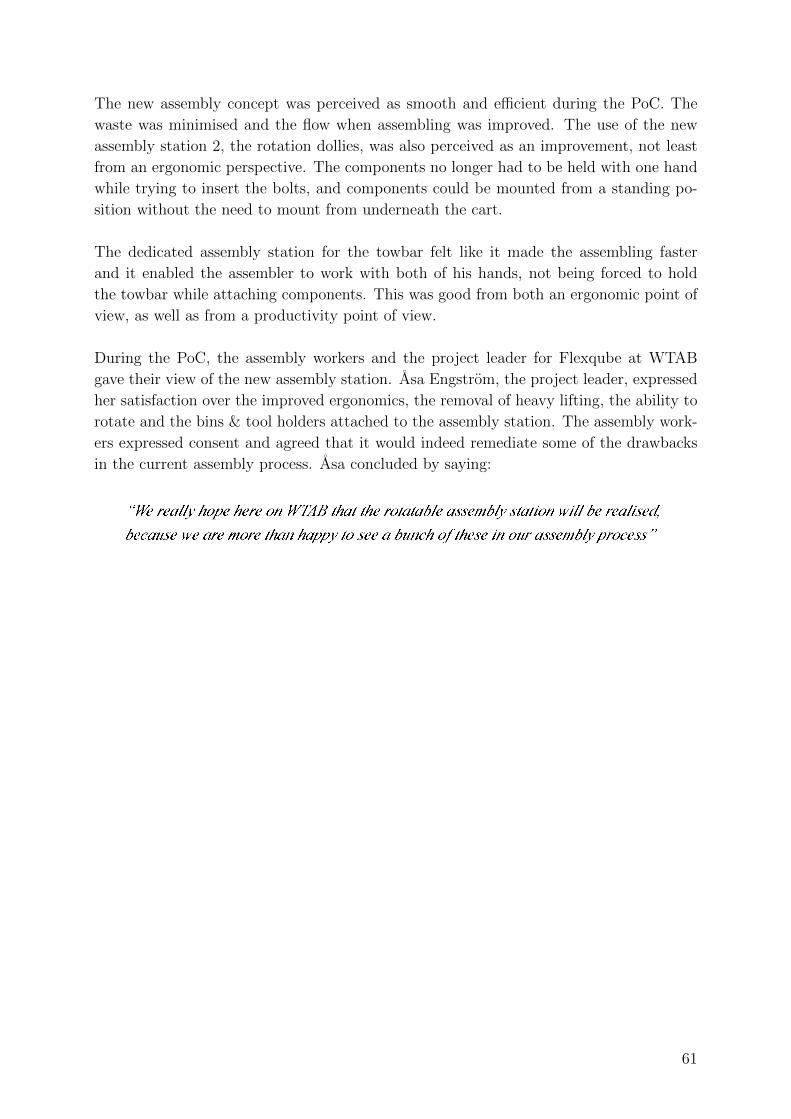
The new assembly concept was perceived as smooth and efficient during the PoC. The
waste was minimised and the flow when assembling was improved. The use of the new
assembly station 2, the rotation dollies, was also perceived as an improvement, not least
from an ergonomic perspective. The components no longer had to be held with one hand
while trying to insert the bolts, and components could be mounted from a standing po-
sition without the need to mount from underneath the cart.
The dedicated assembly station for the towbar felt like it made the assembling faster
and it enabled the assembler to work with both of his hands, not being forced to hold
the towbar while attaching components. This was good from both an ergonomic point of
view, as well as from a productivity point of view.
During the PoC, the assembly workers and the project leader for Flexqube at WTAB
gave their view of the new assembly station. Asa Engstrom, the project leader, expressed
her satisfaction over the improved ergonomics, the removal of heavy lifting, the ability to
rotate and the bins & tool holders attached to the assembly station. The assembly work-
ers expressed consent and agreed that it would indeed remediate some of the drawbacks
in the current assembly process. Asa concluded by saying:
61

62
10
Results
This chapter describes the final solution of this project, including the system level as-
sembly concept and its flows, and also the assembly stations and their carts for material
presentation.
10.1 System Level Assembly Concept Layout
A new layout of the assembly has been developed which almost exclusively consists of
equipment built with Flexqube’s own products. The layout is fully flexible since all parts
of the assembly are based on wheels, meaning that the assembly overview presented in
Figure 10.1 and Figure 10.2 is just one example of how the assembly could be set up.
The approximate length and width of the assembly layout is 25 meters and 11 meters
respectively, including the AGV highway.
Figure 10.1: 3D overview of the assembly (left angle)
63
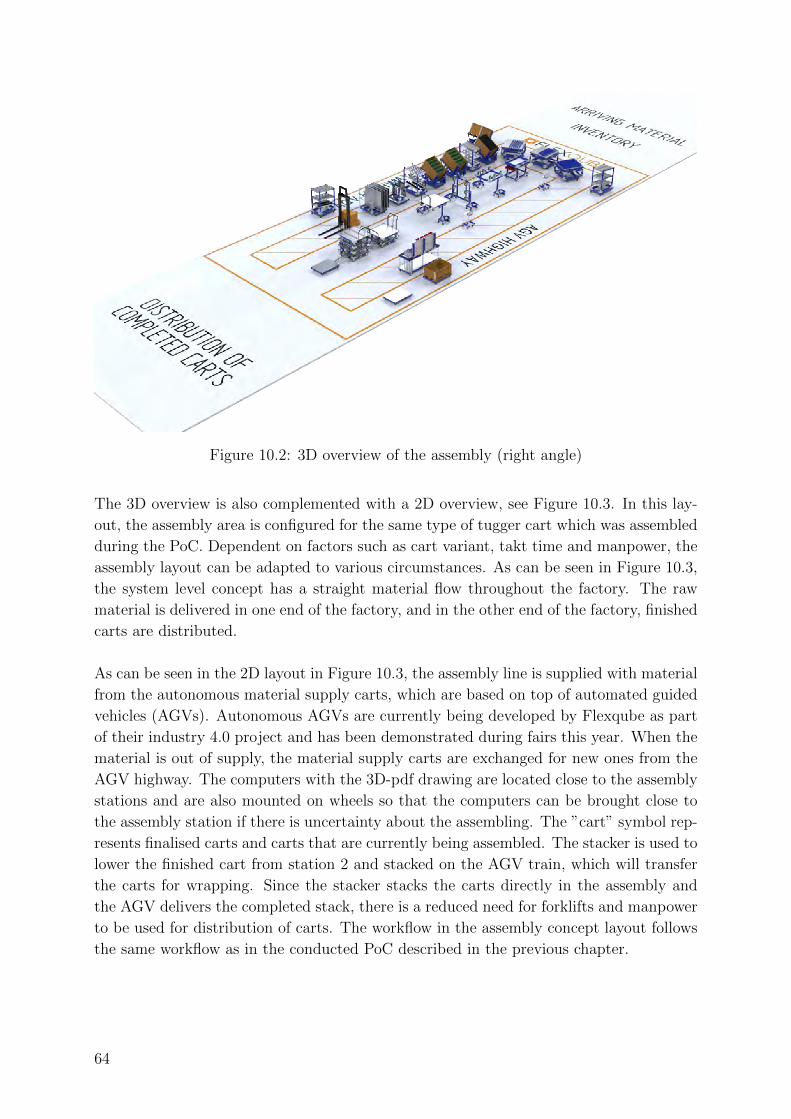
Figure 10.2: 3D overview of the assembly (right angle)
The 3D overview is also complemented with a 2D overview, see Figure 10.3. In this lay-
out, the assembly area is configured for the same type of tugger cart which was assembled
during the PoC. Dependent on factors such as cart variant, takt time and manpower, the
assembly layout can be adapted to various circumstances. As can be seen in Figure 10.3,
the system level concept has a straight material flow throughout the factory. The raw
material is delivered in one end of the factory, and in the other end of the factory, finished
carts are distributed.
As can be seen in the 2D layout in Figure 10.3, the assembly line is supplied with material
from the autonomous material supply carts, which are based on top of automated guided
vehicles (AGVs). Autonomous AGVs are currently being developed by Flexqube as part
of their industry 4.0 project and has been demonstrated during fairs this year. When the
material is out of supply, the material supply carts are exchanged for new ones from the
AGV highway. The computers with the 3D-pdf drawing are located close to the assembly
stations and are also mounted on wheels so that the computers can be brought close to
the assembly station if there is uncertainty about the assembling. The ”cart” symbol rep-
resents finalised carts and carts that are currently being assembled. The stacker is used to
lower the finished cart from station 2 and stacked on the AGV train, which will transfer
the carts for wrapping. Since the stacker stacks the carts directly in the assembly and
the AGV delivers the completed stack, there is a reduced need for forklifts and manpower
to be used for distribution of carts. The workflow in the assembly concept layout follows
the same workflow as in the conducted PoC described in the previous chapter.
64

Figure 10.3: 2D-layout of the system level assembly concept65
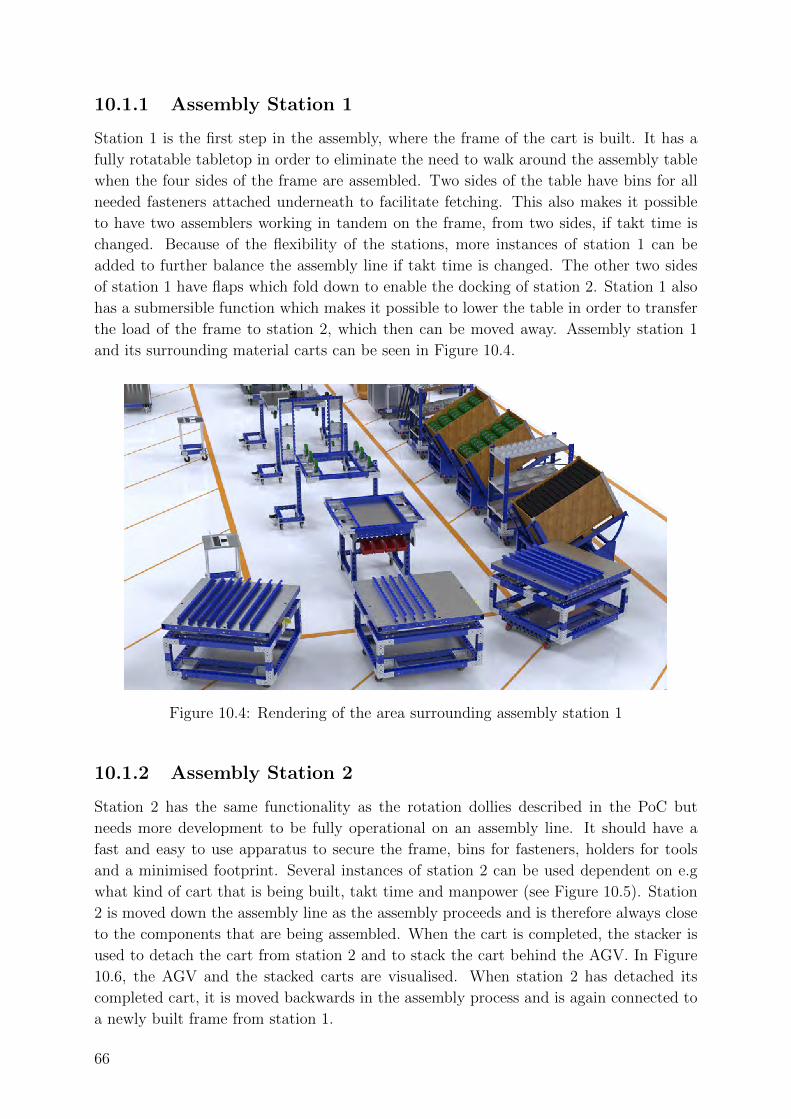
10.1.1 Assembly Station 1
Station 1 is the first step in the assembly, where the frame of the cart is built. It has a
fully rotatable tabletop in order to eliminate the need to walk around the assembly table
when the four sides of the frame are assembled. Two sides of the table have bins for all
needed fasteners attached underneath to facilitate fetching. This also makes it possible
to have two assemblers working in tandem on the frame, from two sides, if takt time is
changed. Because of the flexibility of the stations, more instances of station 1 can be
added to further balance the assembly line if takt time is changed. The other two sides
of station 1 have flaps which fold down to enable the docking of station 2. Station 1 also
has a submersible function which makes it possible to lower the table in order to transfer
the load of the frame to station 2, which then can be moved away. Assembly station 1
and its surrounding material carts can be seen in Figure 10.4.
Figure 10.4: Rendering of the area surrounding assembly station 1
10.1.2 Assembly Station 2
Station 2 has the same functionality as the rotation dollies described in the PoC but
needs more development to be fully operational on an assembly line. It should have a
fast and easy to use apparatus to secure the frame, bins for fasteners, holders for tools
and a minimised footprint. Several instances of station 2 can be used dependent on e.g
what kind of cart that is being built, takt time and manpower (see Figure 10.5). Station
2 is moved down the assembly line as the assembly proceeds and is therefore always close
to the components that are being assembled. When the cart is completed, the stacker is
used to detach the cart from station 2 and to stack the cart behind the AGV. In Figure
10.6, the AGV and the stacked carts are visualised. When station 2 has detached its
completed cart, it is moved backwards in the assembly process and is again connected to
a newly built frame from station 1.
66
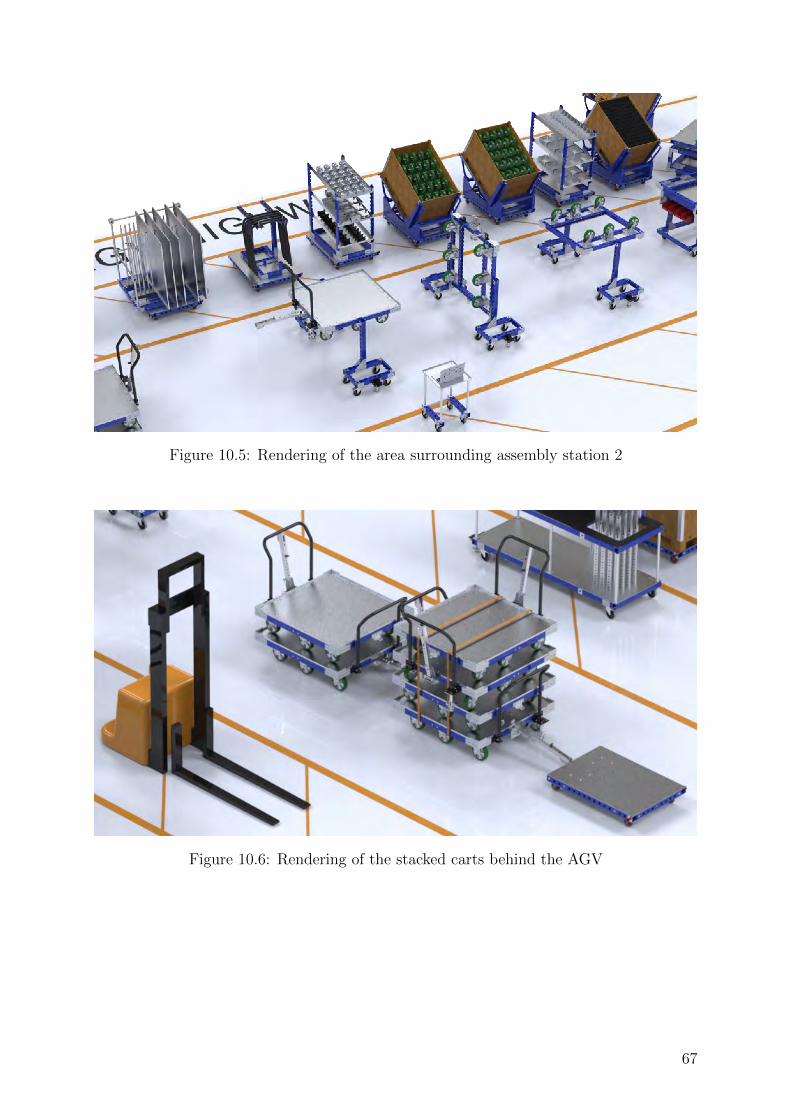
Figure 10.5: Rendering of the area surrounding assembly station 2
Figure 10.6: Rendering of the stacked carts behind the AGV
67
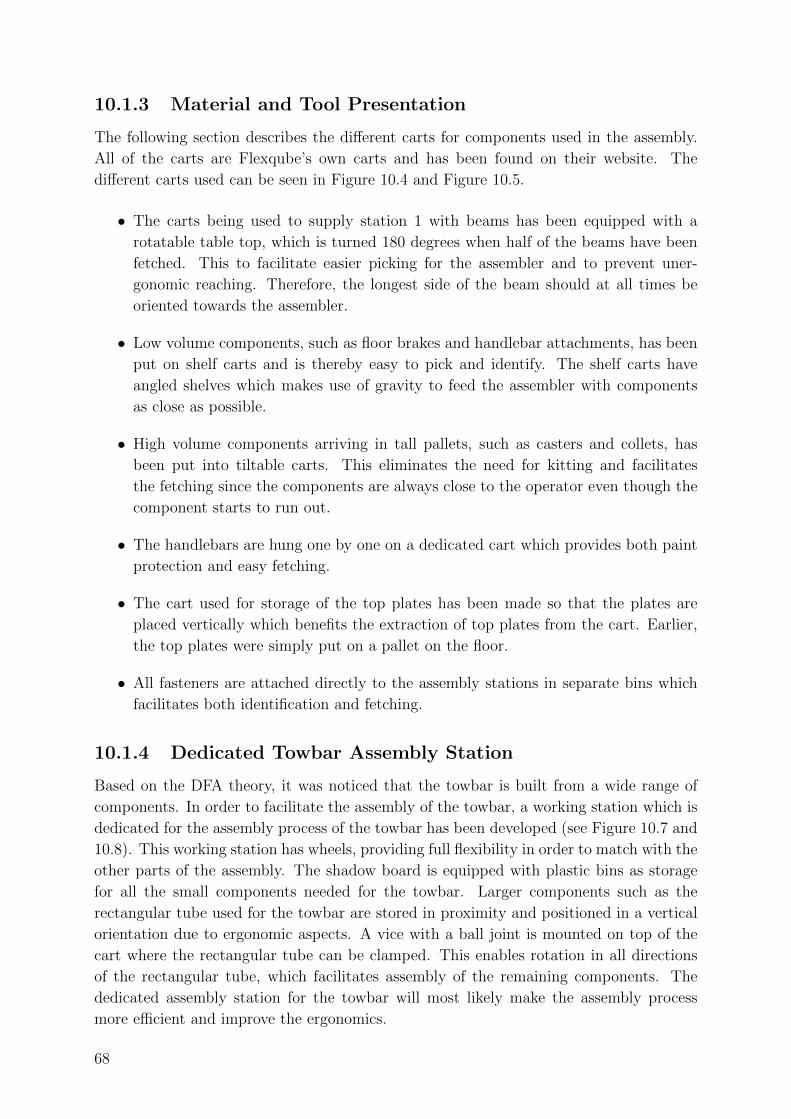
10.1.3 Material and Tool Presentation
The following section describes the different carts for components used in the assembly.
All of the carts are Flexqube’s own carts and has been found on their website. The
different carts used can be seen in Figure 10.4 and Figure 10.5.
• The carts being used to supply station 1 with beams has been equipped with a
rotatable table top, which is turned 180 degrees when half of the beams have been
fetched. This to facilitate easier picking for the assembler and to prevent uner-
gonomic reaching. Therefore, the longest side of the beam should at all times be
oriented towards the assembler.
• Low volume components, such as floor brakes and handlebar attachments, has been
put on shelf carts and is thereby easy to pick and identify. The shelf carts have
angled shelves which makes use of gravity to feed the assembler with components
as close as possible.
• High volume components arriving in tall pallets, such as casters and collets, has
been put into tiltable carts. This eliminates the need for kitting and facilitates
the fetching since the components are always close to the operator even though the
component starts to run out.
• The handlebars are hung one by one on a dedicated cart which provides both paint
protection and easy fetching.
• The cart used for storage of the top plates has been made so that the plates are
placed vertically which benefits the extraction of top plates from the cart. Earlier,
the top plates were simply put on a pallet on the floor.
• All fasteners are attached directly to the assembly stations in separate bins which
facilitates both identification and fetching.
10.1.4 Dedicated Towbar Assembly Station
Based on the DFA theory, it was noticed that the towbar is built from a wide range of
components. In order to facilitate the assembly of the towbar, a working station which is
dedicated for the assembly process of the towbar has been developed (see Figure 10.7 and
10.8). This working station has wheels, providing full flexibility in order to match with the
other parts of the assembly. The shadow board is equipped with plastic bins as storage
for all the small components needed for the towbar. Larger components such as the
rectangular tube used for the towbar are stored in proximity and positioned in a vertical
orientation due to ergonomic aspects. A vice with a ball joint is mounted on top of the
cart where the rectangular tube can be clamped. This enables rotation in all directions
of the rectangular tube, which facilitates assembly of the remaining components. The
dedicated assembly station for the towbar will most likely make the assembly process
more efficient and improve the ergonomics.
68
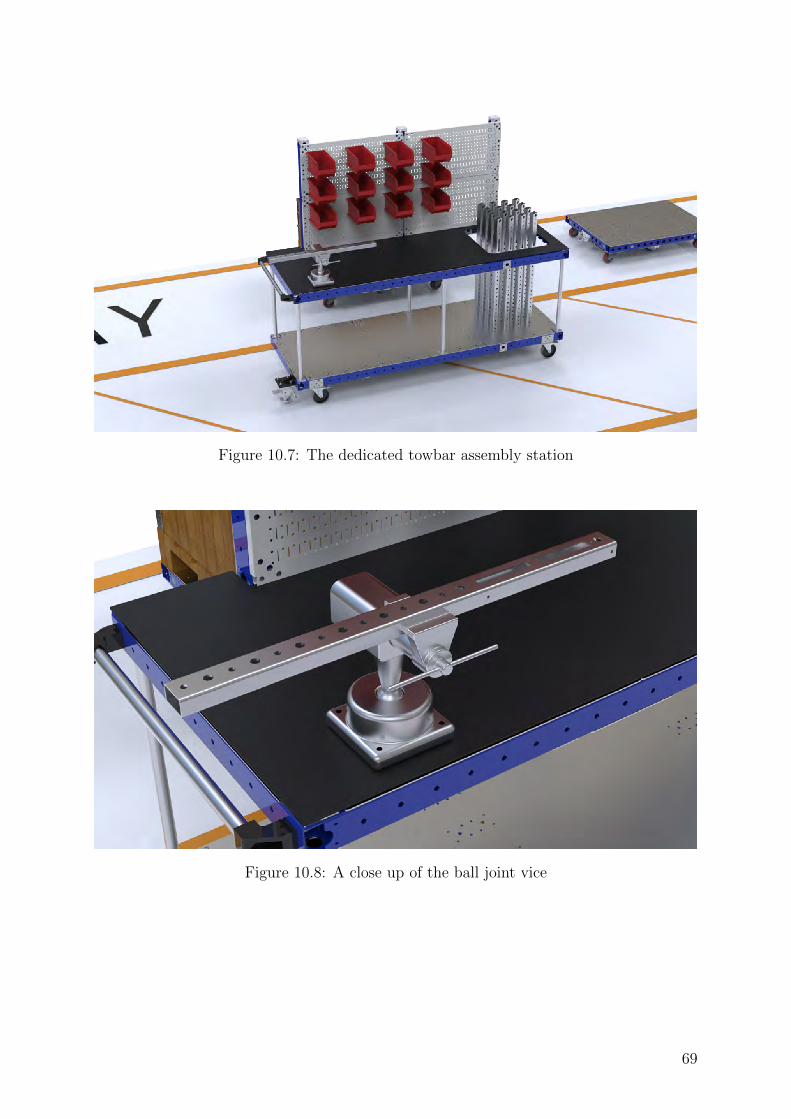
Figure 10.7: The dedicated towbar assembly station
Figure 10.8: A close up of the ball joint vice
69
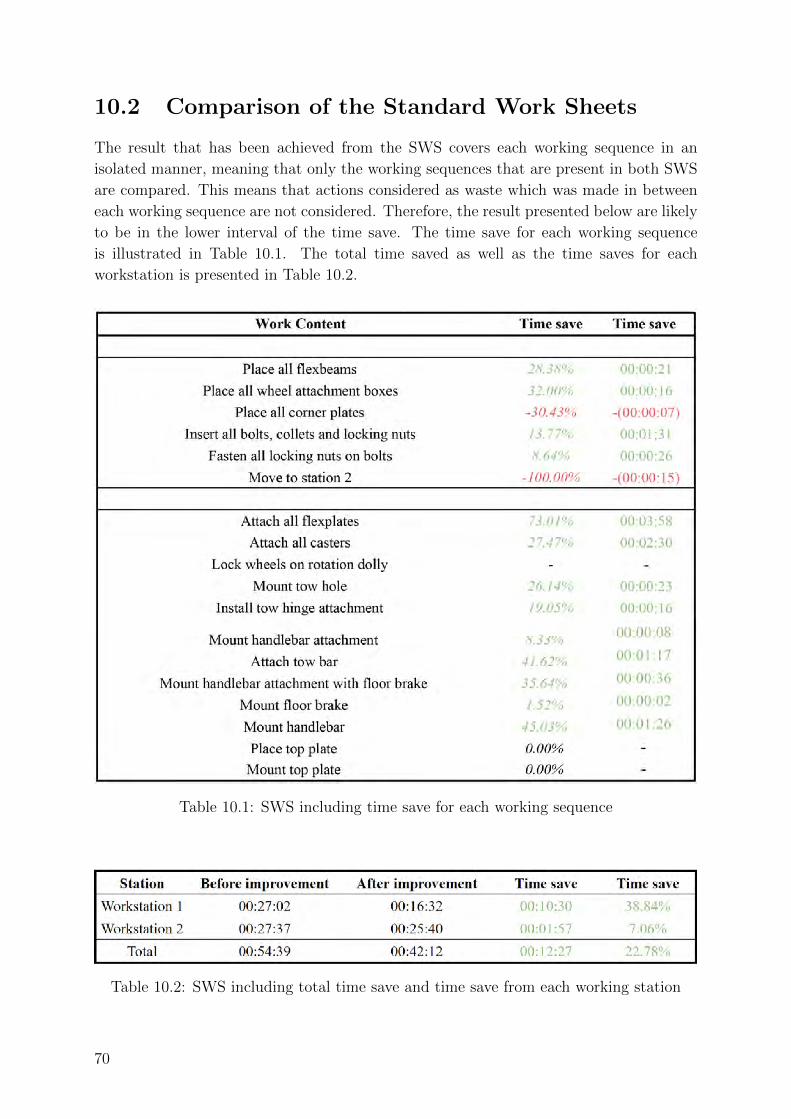
10.2 Comparison of the Standard Work Sheets
The result that has been achieved from the SWS covers each working sequence in an
isolated manner, meaning that only the working sequences that are present in both SWS
are compared. This means that actions considered as waste which was made in between
each working sequence are not considered. Therefore, the result presented below are likely
to be in the lower interval of the time save. The time save for each working sequence
is illustrated in Table 10.1. The total time saved as well as the time saves for each
workstation is presented in Table 10.2.
Table 10.1: SWS including time save for each working sequence
Table 10.2: SWS including total time save and time save from each working station
70
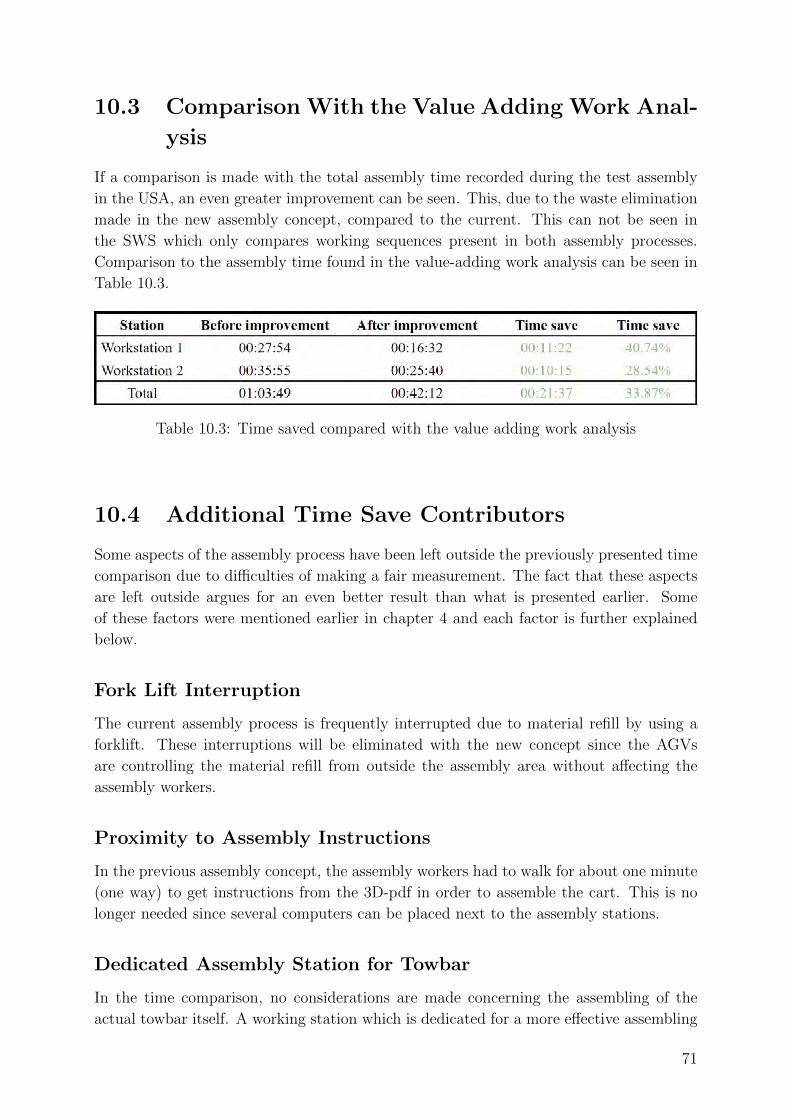
10.3 Comparison With the Value Adding Work Anal-
ysis
If a comparison is made with the total assembly time recorded during the test assembly
in the USA, an even greater improvement can be seen. This, due to the waste elimination
made in the new assembly concept, compared to the current. This can not be seen in
the SWS which only compares working sequences present in both assembly processes.
Comparison to the assembly time found in the value-adding work analysis can be seen in
Table 10.3.
Table 10.3: Time saved compared with the value adding work analysis
10.4 Additional Time Save Contributors
Some aspects of the assembly process have been left outside the previously presented time
comparison due to difficulties of making a fair measurement. The fact that these aspects
are left outside argues for an even better result than what is presented earlier. Some
of these factors were mentioned earlier in chapter 4 and each factor is further explained
below.
Fork Lift Interruption
The current assembly process is frequently interrupted due to material refill by using a
forklift. These interruptions will be eliminated with the new concept since the AGVs
are controlling the material refill from outside the assembly area without affecting the
assembly workers.
Proximity to Assembly Instructions
In the previous assembly concept, the assembly workers had to walk for about one minute
(one way) to get instructions from the 3D-pdf in order to assemble the cart. This is no
longer needed since several computers can be placed next to the assembly stations.
Dedicated Assembly Station for Towbar
In the time comparison, no considerations are made concerning the assembling of the
actual towbar itself. A working station which is dedicated for a more effective assembling
71
of the towbar has been developed which most likely will improve the assembly time due
to its proximity to components and the ergonomic ability of manoeuvring.
Transportation of Assembled Carts
In the current assembly process, the finalised carts are preliminarily stored in the assem-
bly area. When this area is full, each cart is manually transported one by one to the
wrapping area where it is later stacked four by four (for tugger carts) with a forklift. The
transportation time to the wrapping area is more than one minute (one way) which aver-
age over two minutes extra for each cart. In the new assembly, the carts are immediately
stacked four by four, if it is a tugger cart, with the stacker in order to prepare for the
transportation performed by the AGV. This enables for the assembly workers to use their
time for value adding work instead of stacking the carts one by one with a forklift, which
was a very time-consuming process. This was confirmed by the assembly manager who
argued that “palletising is the most time-consuming part of the process”.
72
11
Discussion
The following chapter will discuss the result of this thesis. Discussions concern whether
the outcome was as expected, the advantages and disadvantages compared to the pre-
vious assembly concept and a critical discussion where the procedure of the project will
be challenged. In addition, potential shortcomings within the thesis will be brought up.
Below follow discussions regarding whether the aim and goals of this thesis has been ac-
complished.
”Identify and describe the shortcomings in the current assembly process”
Due to several test assembling opportunities, and the video recording made during these,
numerous shortcomings in the current assembly process has been identified. The short-
comings have been identified with the help of tools such as ”Eight waste’s” and the ”7-M
method” which have earlier been described.
”Shorten the assembly time of a chosen reference cart with at least 25 percent”
The total assembly time was lowered with 34 percent with the new assembly concept com-
pared to the assembly time during the test assembly in the USA. The comparison made
with SWS, which isolates just the identical assembly operations, show an improvement of
23 percent. As mentioned before, the SWS does not take all of the identified waste into
account which is why the goal to reach at least 25 percent shortened assembly time is
considered to be met. However, it must be mentioned that the new collets have been used
during the PoC which is part of the time reduction. On the other hand, as mentioned
earlier, additional time contributors such as the elimination of the forklift interruption,
the proximity to assembly instructions, a dedicated assembly station for the towbar and
a more efficient way of transporting the carts for wrapping are factors that benefit the
new concept but have not been considered in the time comparison.
”Develop a flexible assembly concept which is insensitive for variation in carts,
assembly location and takt time”
The developed assembly concept has a high grade of flexibility. All assembly stations
and pallets with components are equipped with wheels, meaning that they easily can be
moved and modified to fit different cart variants, demands and locations. The assembly
concept also provides flexibility regarding balancing of assembly operations and number
of assembly stations to suit different takt times.
73
”Demonstrate a proof of concept of the improved assembly concept in or-
der to measure if improvements has been made”
A PoC was completed, utilising the improved assembly concept with minimised waste and
the developed rotatable assembly station. The PoC showed large improvements regarding
the assembly time of the measured tugger cart and also in perceived ergonomics.
”Improve the overall ergonomics in the assembly and eliminate assembly op-
erations with high risk of musculoskeletal disorders”
The PoC showed that the improvements made to the overall concept and especially the
rotatable assembly station had a great impact on the ergonomics during assembly. The
vicinity to the components, the possibility to mount all components from above instead
of underneath and the ability to always be able to use both hands for assembling, all
contributed to an overall improvement in ergonomics. Although, the largest improvement
to the assembly process is the elimination of the lifting of carts, from the assembly table
down on the floor. From experiences during the test assembling, and also input from
assembly workers, this activity is the heaviest and most probable source for acquiring
MSDs during assembly work.
The theoretical study gave a good foundation of knowledge and has been valuable through-
out the project. Furthermore, it contributed with knowledge of what to look for during
the empiric research. The empiric research was perhaps the most important part of this
thesis, where the test assembling and observations in Flexqube’s assembly plants has
been an invaluable experience and source of inspiration. Due to the notes taken, the
video recorded and information from Flexqube, a solid compilation of data facilitated the
idea generation to cover the whole assembly process and to pinpoint where improvements
made the biggest impact. The decision matrices gave, partly, an unbiased screening of
the generated ideas and made sure unfeasible solutions were eliminated. The PoC which
challenged our assembly concept, was performed in a good phase at the end of the project
and proved, black on white, that the improvements gave a more efficient assembly process.
Due to the available space and layout of Flexqube’s current assembly plants, the concept
as a whole might not be applicable at these locations. Although, most of the measures
can be implemented on their own to the current assembly process.
The presented assembly concept makes use of autonomous AGVs, which are still un-
der development. The implementation of the autonomous AGVs will further improve the
productivity of Flexqube’s assembly, since they eliminate the need for a lot of transporta-
tion which currently has to be made by assembly personnel.
The development of the rotation dollies into a proper station 2 might be crucial in order
for the assembly workers to make use of its benefits. If the attachment during docking,
the rotation functionality and the overall usability is not easy enough, there might be a
risk that the assembly workers does not use the new equipment.
74
One thing that could have been made different was to eliminate unfeasible ideas before
using the concept combination matrix. Using unfeasible solutions in a combination matrix
made the elimination matrix larger and more time consuming. If eliminated before the
combination matrix, the overall flow could have been improved. However, as mentioned
earlier, a range of concepts were brought into the concept combination matrix due to the
reasoning that a very abstract solution may become realisable if combined with another.
In hindsight, these abstract solutions could have been eliminated earlier.
During solution development, time was spent developing the concepts on a very detailed
level. For example, investigating what kind of bearings that could support the load, stress
calculation on beams or which kind of lifting system that could meet our demands. After
discussions with the supervisor at Flexqube, he explained that this kind of deep analysis
would not contribute with value for Flexqube. What would give value, was a concept on
a system level, and if proven to work efficiently, the details can then be investigated after
the PoC. This detail level thinking was time consuming and without the concept proven
to be more efficient it would not give Flexqube significant value. We agreed upon this
and made it an important lesson.
The duration between the meetings with the supervisor at Flexqube was occasionally a bit
too long. Due to much travelling in line of work of our supervisor and holidays, meetings
between us and the supervisor during the most communication demanding phase, idea
generation and solution development, was too infrequent. This caused our vision and the
supervisor’s vision to deviate. If more frequent meetings would have been held, deviation
between our visions could have been aligned at an earlier stage which would have saved
time.
Another aspect worth discussing is the validity of the video which Figure 6.4 and Table
6.1 are based on. This data is based on only one operation, meaning that the distribution
between the categories may vary between various assembly cycles. However, based on our
experience the interpretation is that this data was representative for the reference cart
used in this thesis since the same assembly cycle was performed without any significant
deviation when the camera was not filming.
75

76
12
Conclusions
A concept has been developed which would save at least 23 percent of the assembly time
for Flexqube even though it is likely that even larger saves can be achieved. This builds
upon the concept presented earlier in this report, including the usage of AGVs. However,
a lot of time saves can be achieved solely through removing the faults identified in the
current assembly process.
From the analysis of the current assembly process, a lot of shortcomings has been identi-
fied and documented. Many of which are remedied from the results of this thesis work.
One conclusion that can be drawn is that there is a lot of potential for improvements and
if Flexqube wants to reduce their cost, investments in the assembly process are definitely
one way to increase the profitability in the long term.
The outcome of this thesis work is a highly flexible assembly concept with improved
productivity and ergonomics. Most of the improvements made in the system level con-
cept can be implemented on their own, although the full gain in productivity might not be
reached. Due to the use of mainly Flexqube’s own components and carts, the investment
should be relatively low.
A lot of the improvements made are ergonomic improvements, not least in station 2.
These are hard to measure, but from our experience during the PoC, the elimination
of the heavy lifts and the rotatable assembly station will benefit the assembly workers
greatly. This will not only affect the assemblers physical health but will also benefit the
productivity and might reduce the large turnover on staff. Having assembly workers that
are experienced increases the quality and reduces time spent on educating new personnel.
No practical recommendation has been made for the tool presentation. This decision
was made since this thesis has been performed on a concept level, meaning that the final
design is not yet fully determined. When the concept has passed further development,
including the detailed design phase, a recommendation is to define designated positions
for each tool. If possible, the recommendation is to store tools at the working station
where the tool is intended to be used to minimise unnecessary transportation.
77

78
13
Recommendations for Future Work
This chapter concludes this report and provides recommendations for future work. Al-
though the goals are considered to be reached, some further development of the assembly
concept is needed.
DFA and Reduction of Screws and Bolts
Although left out of this master’s thesis report, DFA was studied during the literature
study. During the mapping of the current assembly process, thoughts were made regard-
ing the use of DFA on specific sub-assemblies or components in Flexqube’s carts. One
possible candidate to have its components reduced is the towbar, which consists of a wide
array of different components for a rather simple function.
Another candidate would be the number of screws and bolts used in the overall designs.
Even though the bolts allow for flexibility in the design, they also increase the assem-
bly time. Certain design changes could be made to some components. For example, a
pin or similar would allow the use of less bolts which could further reduce the assembly
time. Also, if one larger bolt could replace several smaller bolts, the same effect would
be obtained. Finally, some components might use more fasteners than is necessary. For
example top plates, triangle joints or shelves, the number of fasteners in some of these
assemblies could in our eyes be reduced. This would allow faster assembly without com-
promising the rigidity of the cart.
Assembly Station 2
Because of the simple design of the rotating assembly station developed, there are a
number of things that need more attention in order to further improve the usability and
efficiency of the station. First of all is the need of a faster and easier attachment of the
frame to the rotating assembly station. In the prototype this function was made as easy as
possible, just using two bolts and two nuts to secure the frame on each side. This operation
should be made fast and easy for the operators to use, to facilitate a streamlined assembly.
During the PoC, a play was detected between the bolt that holds the horizontal beam
which is attached to the frame of the cart, and the hole in the vertical beam. This play
caused instability of the assembly stations and caused difficulties during rotation. This
bolt should be exchanged to a larger axle and secured in bearings to prevent instability.
79
Proper bins for fasteners and tool holders should be attached to both assembly stations
to prevent unnecessary movement and searching for misplaced tools. Also, to reduce the
need for the assembly worker to hold screws in one hand and assemble with the other. If
the fasteners are close, both hands can be used for assembly which facilitates an efficient
assembly process. Furthermore, it is recommended to use different colours on the bins to
further simplify for the assembly workers to find the correct fastener.
The rotation dollies in the PoC had four wheels, mainly to facilitate movement of the
dolly when the frame is detached. This made the footprint of the dollies larger which
made assembly harder due to the risk of tripping. If the footprint could be reduced, by
for example having a folding base on the dolly so that only two wheels are used when
the frame is attached, this would reduce the risk of tripping and thereby the productivity
since the assembler does not have to worry about falling while assembling.
Review of the Current Assembly Process
In the earlier described ”fishbone diagram” (Figure 6.7), ”pro’s and con’s in the assembly
process” (Appendix G) and ”the eight wastes” (Appendix H), a number of factors are
listed which affects the effectiveness and efficiency of the assembly process. Several of
these factors have no direct connection to the result presented in this thesis. However,
a lot of these factors can be resolved with relatively low investments in both time and
capital. Therefore, a recommendation is to start by reviewing these listed factors before
investing in a new assembly concept.
80
References
Peter Almstrom. Sustainable production systems, January 2015. URL
https://www.youtube.com/watch?v=aJ8hBR8HiyY. [Video File] Accessed on
21.05.2018.
Zeki Ayag. An integrated approach to concept evaluation in a new product development.
Journal of Intelligent Manufacturing, 27(5):991–1005, 2014.
Daria Battini, Xavier Delorme, Alexandre Dolgui, Alessandro Persona, and Fabio Sgar-
bossa. Ergonomics in assembly line balancing based on energy expenditure: a multi-
objective model. International Journal of Production Research, 54(3):824–845, 2016.
Michel Baudin. Lean Assembly: The nuts and bolts of making assembly operations flow.
Productivity Press, 1st edition, 2002.
Cecilia Berlin and Caroline Adams. Production Ergonomics: Designing Work Systems
to Support Optimal Human Performance. Ubiquity Press, London, UK, 1st edition
edition, 2017.
John Bicheno. The new lean toolbox : towards fast, flexible flow. PICSIE Books, 3rd
edition, 2004.
Geoffrey Boothroyd, Peter Dewhurst, and Winston A. Knight. Product Design for Man-
ufacture and Assembly. Taylor & Francis Group, 3rd edition, 2011.
Alan Bryman and Emma Bell. Business research methods. Oxford University Press, 6th
edition, 2011.
Chalmers. Staff at chalmers university of technology, July 2011. URL
Available: https://www.chalmers.se/en/Staff/Pages/lars-trygg.aspx. Ac-
cessed on 23.02.2018.
Chalmers. Staff at chalmers university of technology, December 2012. URL
Available: https://www.chalmers.se/sv/personal/Sidor/magper.aspx. Ac-
cessed on 15.02.2018.
Chalmers. Staff at chalmers university of technology, November 2013. URL
https://www.chalmers.se/en/Staff/Pages/petera.aspx. Accessed on 15.05.2018.
81
Douglas Daetz. The Effect of Product Design on Product Quality and Product Cost,
Quality Progress. Number 6. Quality progress, 20 edition, 1987.
Robert Damelio. Basics of Process Mapping. Productivity Press, 2nd edition, 2011.
Martyn Denscombe. The Good Research Guide: For Small-scale Social Research Projects.
McGraw-Hill, 5th edition, 2014.
Ann-Christine Falck, Roland Ortengren, and Dan Hogberg. The impact of poor assembly
ergonomics on product quality: A cost–benefit analysis in car manufacturing. Human
Factors and Ergonomics in Manufacturing & Service Industries, 20(1):24–41, 2014.
Flexqube. These 3 material handling carts were our cus-
tomers favourites of 2017, December 2017. URL
https://www.flexqube.com/flexqube-news/these-3-material-handling-carts-were-our-customers-favourites-2017.
Accessed on 14.05.2018.
Tilda Gaskell. The process of empirical research: a learning experience? Research in
Post-Compulsory Education, 5(3):349–360, 2011.
Michael L George, David Rowlands, Mark Price, and John Maxey. The lean six sigma
pocket toolbook. McGraw-Hill, 1st edition, 2005.
E. Gurevsky, O. Hazir, O. Batta’fa, and A. Dol. Robust balancing of straight assembly
lines with interval task times. Journal of the Operational Research Society, 64:607–1613,
2013.
IEA. Definition and domains of ergonomics, December 2017. URL
http://www.iea.cc/whats/. Accessed on 18.05.2018.
Hans Johannesson, Jan-Gunnar Persson, and Dennis Pettersson. Produktutveckling. Liber
AB, 2nd edition, 2013.
Hanna Kallio, Anna-Maija Pietila, Martin Johnson, and Mari Kangasniemi. System-
atic methodological review: developing a framework for a qualitative semi-structured
interview guide. Journal of Advanced Nursing, 72, 2016.
Onur Kaya. Information search and analysis, 2016. Unpublished Lecture Notes, PPU085,
Chalmers University of Technology.
Jonathan Law. A Dictionary of Business and Management. Oxford University Press, 6th
edition, 2016.
David S. Leonard. Does color of warnings affect risk perception? International Journal
of Industrial Ergonomics, 23(5-6):499–504, 1999.
Andrea Leskova. Principles of lean production to designing manual assembly workstations.
International Journal of Engineering, pages 31–36, 2013.
Jeffrey K. Liker. The Toyota way. McGraw-Hill, 2004.
82
Management Mania. 5-m method, March 2016. URL
https://managementmania.com/en/5-m-method. Accessed on 21.05.2018.
Willem Mertens, Amedeo Pugliese, and Jan Recker. Quantitative Data Analysis A Com-
panion for Accounting and Information Systems Research. Springer International Pub-
lishing Switzerland, 2017.
Alex Milton and Paul Rodgers. Product Design. Laurence King Publishing, 1st edition,
2011.
Ron Moore. Selecting the Right Manufacturing Improvement Tools. Butterworth-
Heinemann, 1st edition, 2006.
Chris A. Ortiz. Kaizen Assembly: Designing, Constructing, and Managing Lean Assembly
Line. Taylor & Francis Group, 1st edition, 2006.
Kevin N. Otto and Kristin L. Wood. Product design: Techniques in reverse engineering
and new product development. Prentice Hall, 1st edition, 2001.
Runa Patel and Bo Davidson. Forskningsmetodikens grunder. Lund:Studentlitteratur,
4th edition, 2011.
John. W. Priest and Jose M. Sanchez. Product Development and Design for Manufactur-
ing. Marcel Dekker, 2nd edition, 2001.
PSU. Empirical research in education and the behavioral/social sciences, February 2018.
URL http://guides.libraries.psu.edu/emp. Accessed on 18.05.2018.
Colin Robson. Real World Research: A resource for users of social research methods in
applied settings. John Wiley & Sons Ltd., 3rd edition, 2011.
Parastoo Roghaniana, Amran Rasli, and Hamed Gheysari. Productivity through effec-
tiveness and efficiency in the banking industry. page 550 – 556, 2012.
Simon Algesten. Private communication, 2018. March 15, 2018.
Lena Sperling, Sven Dahlman, Li Wikstrom, Asa Kilbom, and Roland Kadefors. A cube
model for the classification of work with hand tools and the formulation of functional
requirements. Applied Ergonomics, 24(3):212–220, 1993.
Linda Strande, Mariska Ronteltap, and Damir Brdjanovic. Faecal Sludge Management:
Systems Approach for Implementation and Operation. Iwa Pub, 2014.
K.G. Swift and J.D. Booker. Process Selection From design to manufacture. Butterworth
Heinemann, 2nd edition, 2003.
David G Ullman. The mechanical design process. McGraw-Hill/Irwin, 4th edition, 2010.
Karl T. Ulrich and Steven D. Eppinger. Product Design and Development. McGraw-Hill,
5th edition, 2012.
83
U.S.Army. Human Engineer Design Data Digest. CREATESPACE, Washington, DC,
2000.
Kim B Wheelwright, Steven C; Clark. Revolutionizing product development: quantum
leaps in speed, efficiency and quality. Free Press, 1992.
Mohsen Zare. Does ergonomics improve product quality and reduce costs? a review
article. Human factors and ergonomics in manufacturing & service industries, 26(2):
205–223, 2016.
X.F. Zhaa, H.J. Dua, and J.H. Qiu. Knowledge-based approach and system for assembly
oriented design. Engineering Applications of Artificial Intelligence, 14(1):61–75, 2001.
84

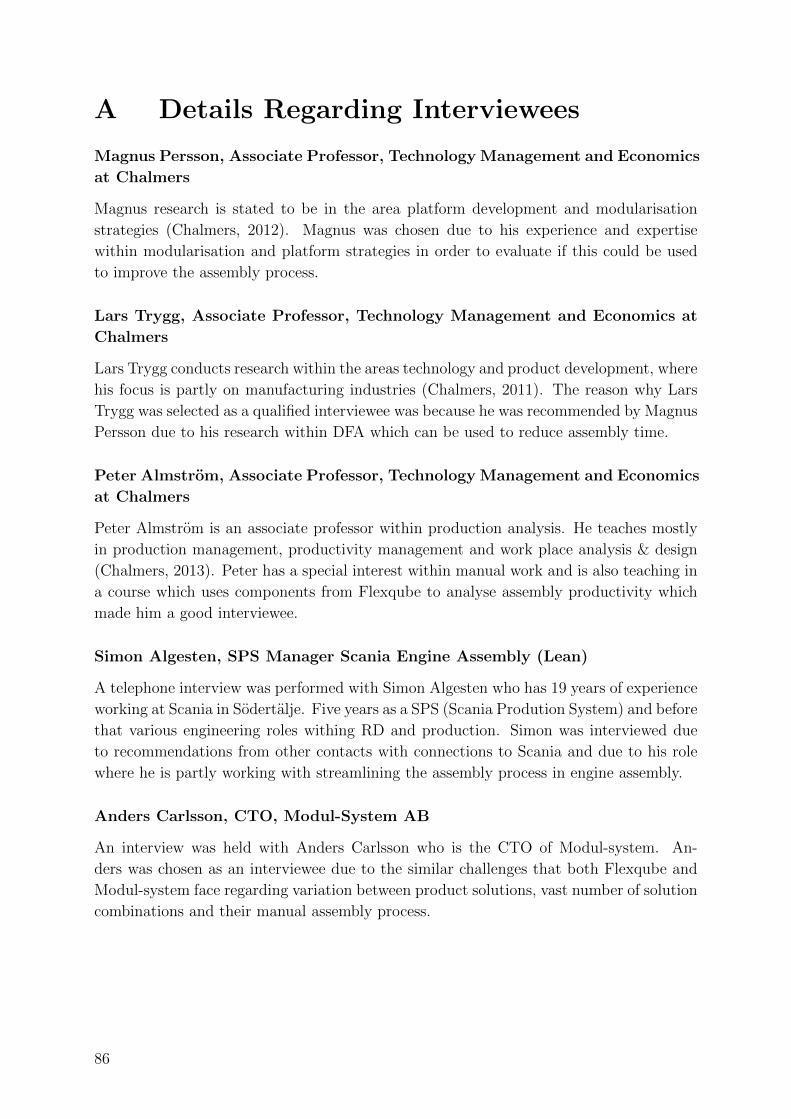
A Details Regarding Interviewees
Magnus Persson, Associate Professor, Technology Management and Economics
at Chalmers
Magnus research is stated to be in the area platform development and modularisation
strategies (Chalmers, 2012). Magnus was chosen due to his experience and expertise
within modularisation and platform strategies in order to evaluate if this could be used
to improve the assembly process.
Lars Trygg, Associate Professor, Technology Management and Economics at
Chalmers
Lars Trygg conducts research within the areas technology and product development, where
his focus is partly on manufacturing industries (Chalmers, 2011). The reason why Lars
Trygg was selected as a qualified interviewee was because he was recommended by Magnus
Persson due to his research within DFA which can be used to reduce assembly time.
Peter Almstrom, Associate Professor, Technology Management and Economics
at Chalmers
Peter Almstrom is an associate professor within production analysis. He teaches mostly
in production management, productivity management and work place analysis & design
(Chalmers, 2013). Peter has a special interest within manual work and is also teaching in
a course which uses components from Flexqube to analyse assembly productivity which
made him a good interviewee.
Simon Algesten, SPS Manager Scania Engine Assembly (Lean)
A telephone interview was performed with Simon Algesten who has 19 years of experience
working at Scania in Sodertalje. Five years as a SPS (Scania Prodution System) and before
that various engineering roles withing RD and production. Simon was interviewed due
to recommendations from other contacts with connections to Scania and due to his role
where he is partly working with streamlining the assembly process in engine assembly.
Anders Carlsson, CTO, Modul-System AB
An interview was held with Anders Carlsson who is the CTO of Modul-system. An-
ders was chosen as an interviewee due to the similar challenges that both Flexqube and
Modul-system face regarding variation between product solutions, vast number of solution
combinations and their manual assembly process.
86
Olof Henriksson, Logistic Technician at Volvo Trucks
An interview was conducted with Olof Henriksson who has seven years of experience
working at Volvo Trucks in Tuve. Olof was reached through the contact network at
Chalmers and fit well due to his experience with the internal logistics at the assembly
plant.
Wesley Worthen, Assembly Manager, Georgia, USA
Wesley has the role as an assembly manager where he is responsible for the assembly of the
low volume production line, prior to that he was also responsible for the internal logistics
for Flexqube’s parts. Wesley were chosen due to his experience assembling Flexqube carts
and his holistic view of the whole assembly process.
Jeff Watson, Assembly Manager, Georgia, USA
The interview with Jeff was conducted subsequently to the one with Wesley and included
identical questions and duration. Jeff is the assembly manager of the high volume produc-
tion line, which means that he is responsible for the assembly of the carts where variation
is lower but volume higher. Similar to Wesley, Jeff was chosen due to his experience of
the assembly process and assembling of Flexqube’s carts.
87
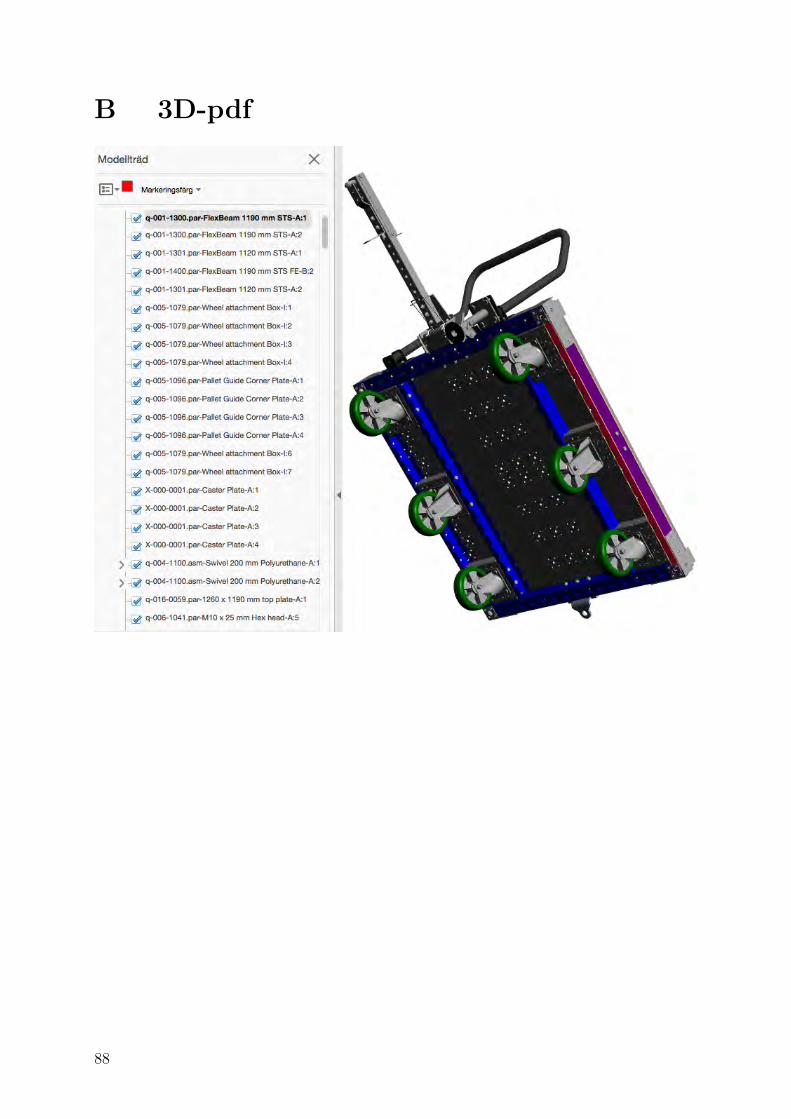
B 3D-pdf
88
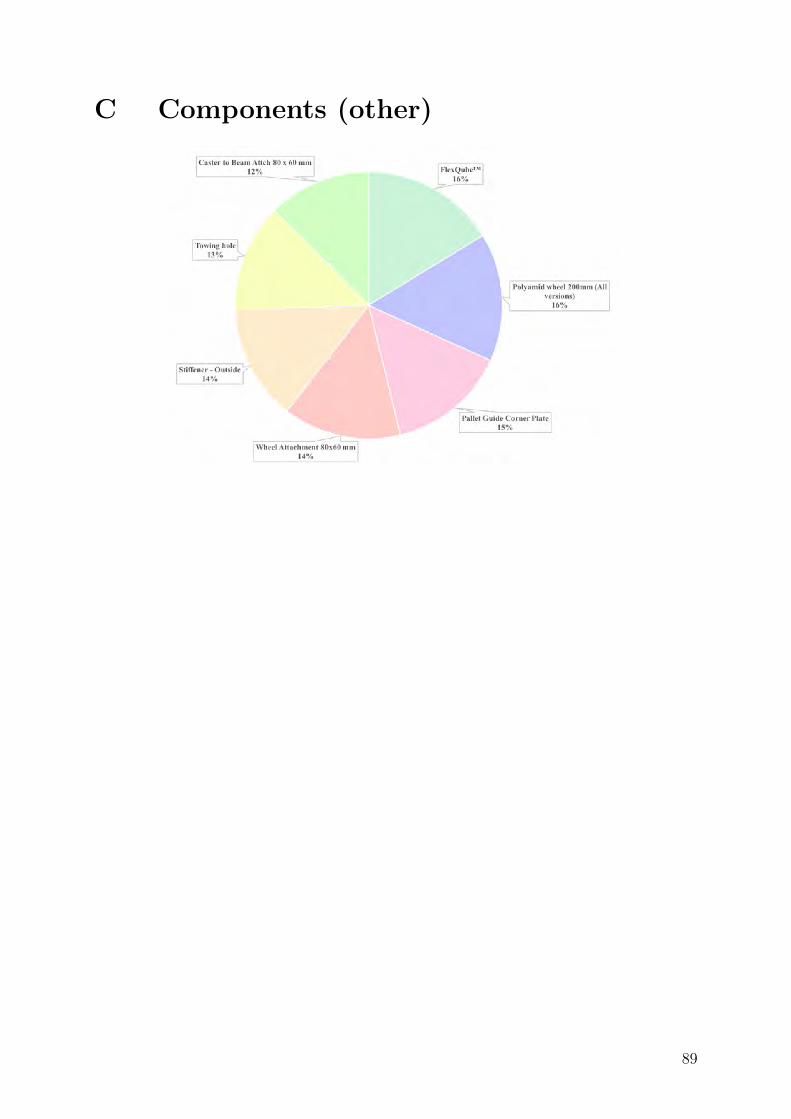
C Components (other)
89
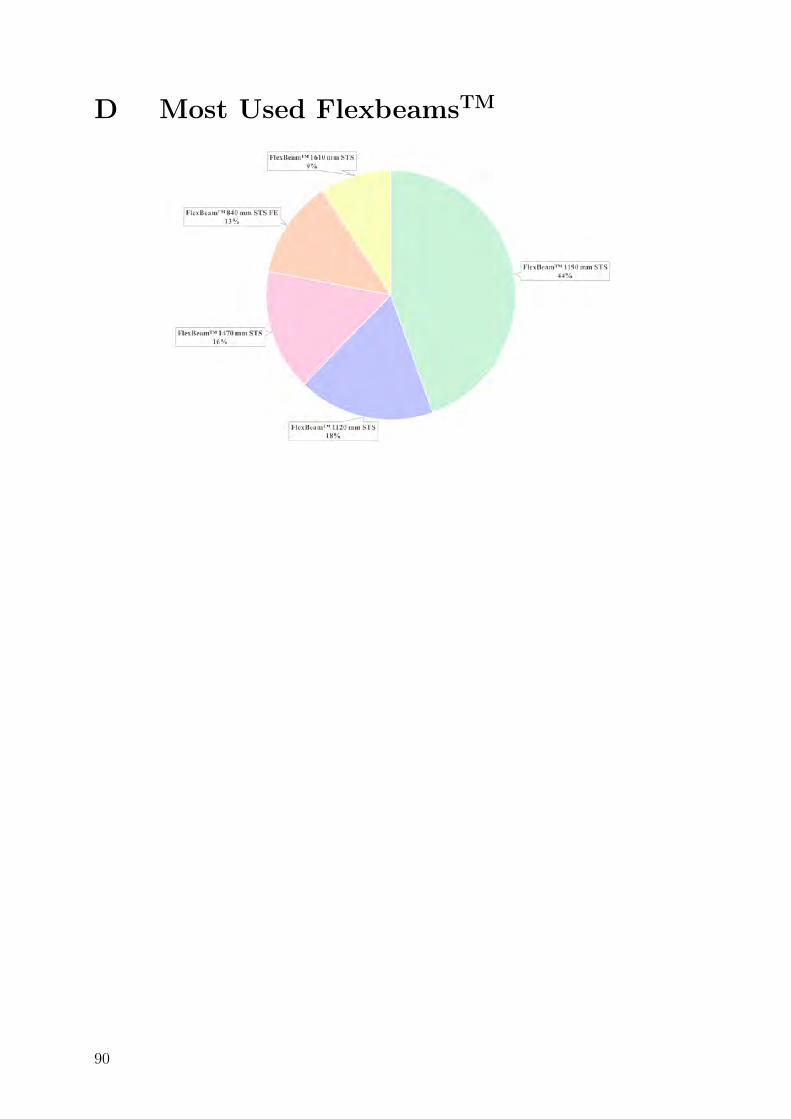
D Most Used FlexbeamsTM
90
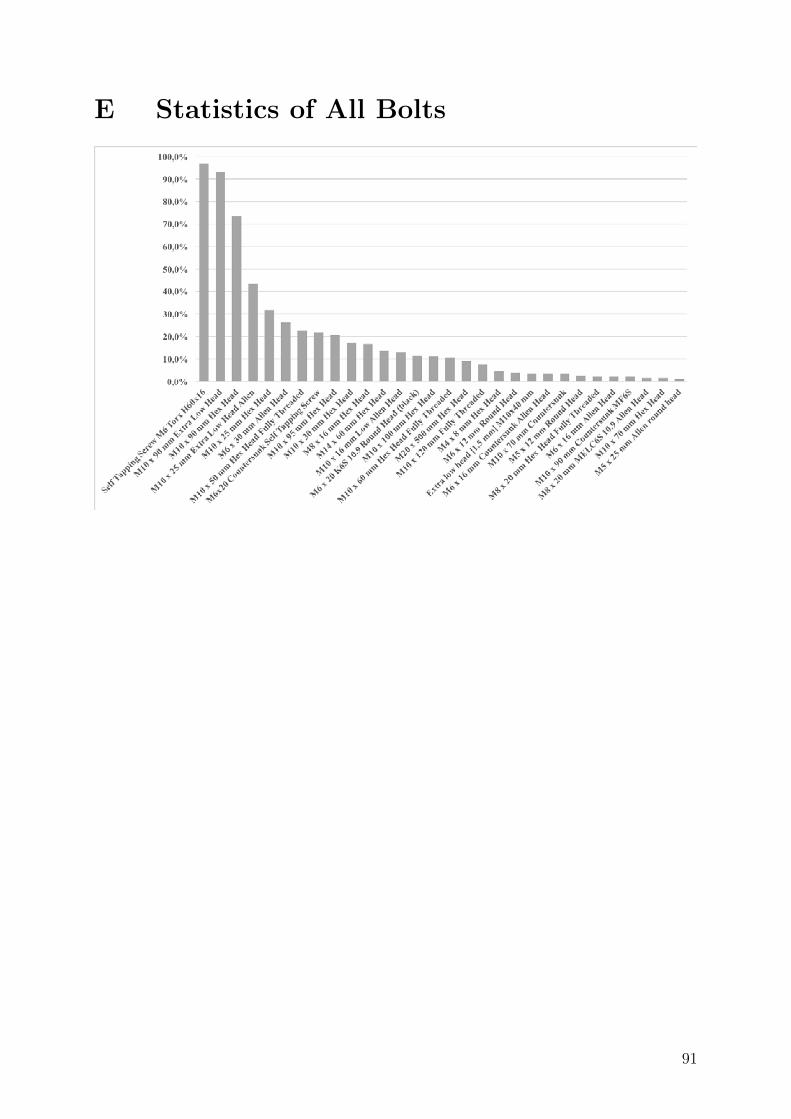
E Statistics of All Bolts
91
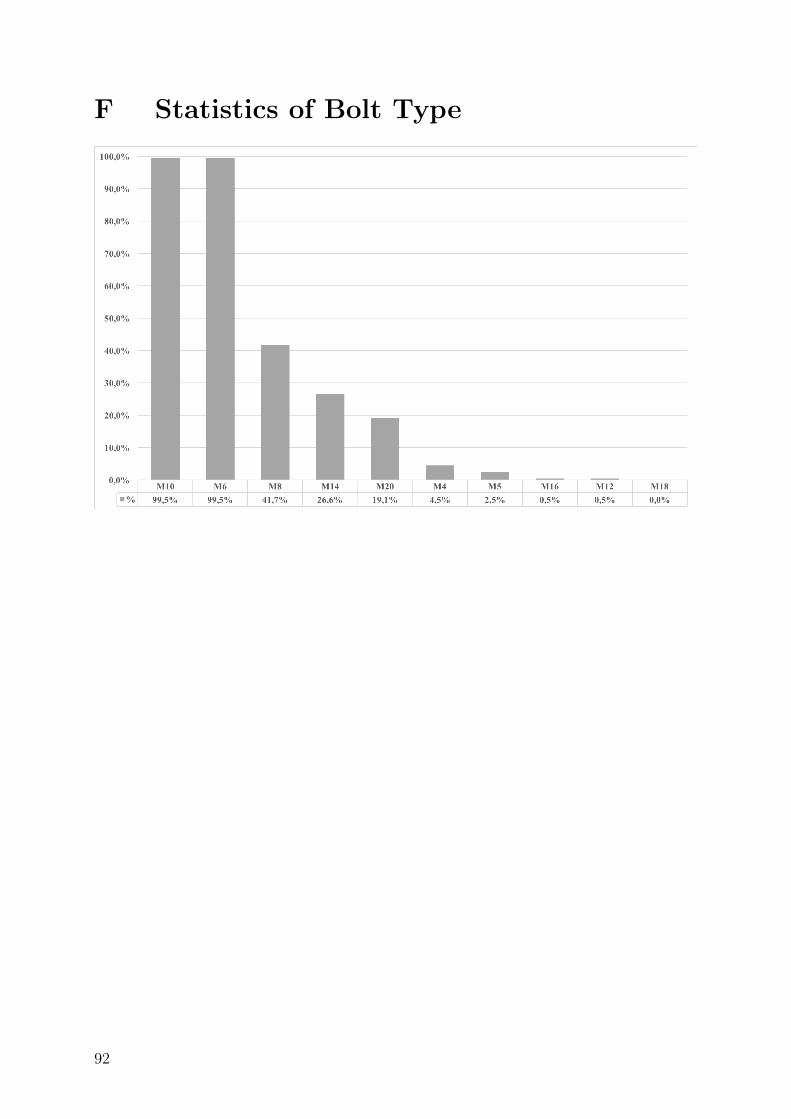
F Statistics of Bolt Type
92
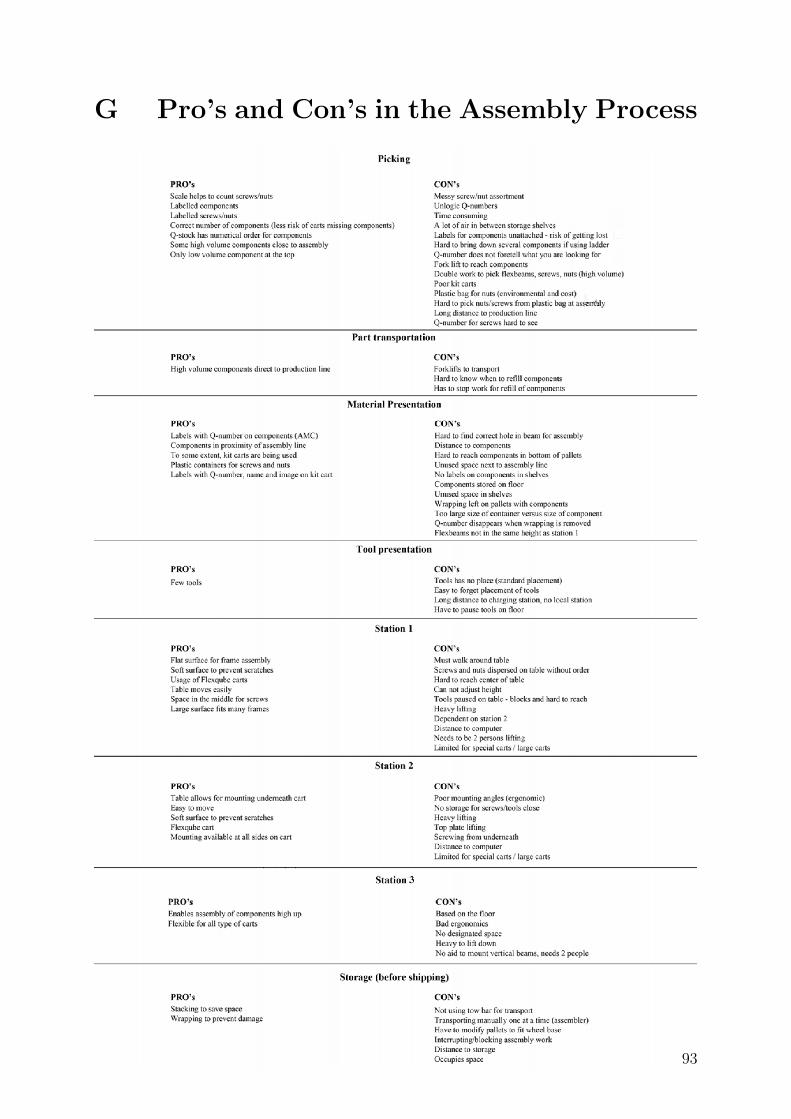
G Pro’s and Con’s in the Assembly Process
93
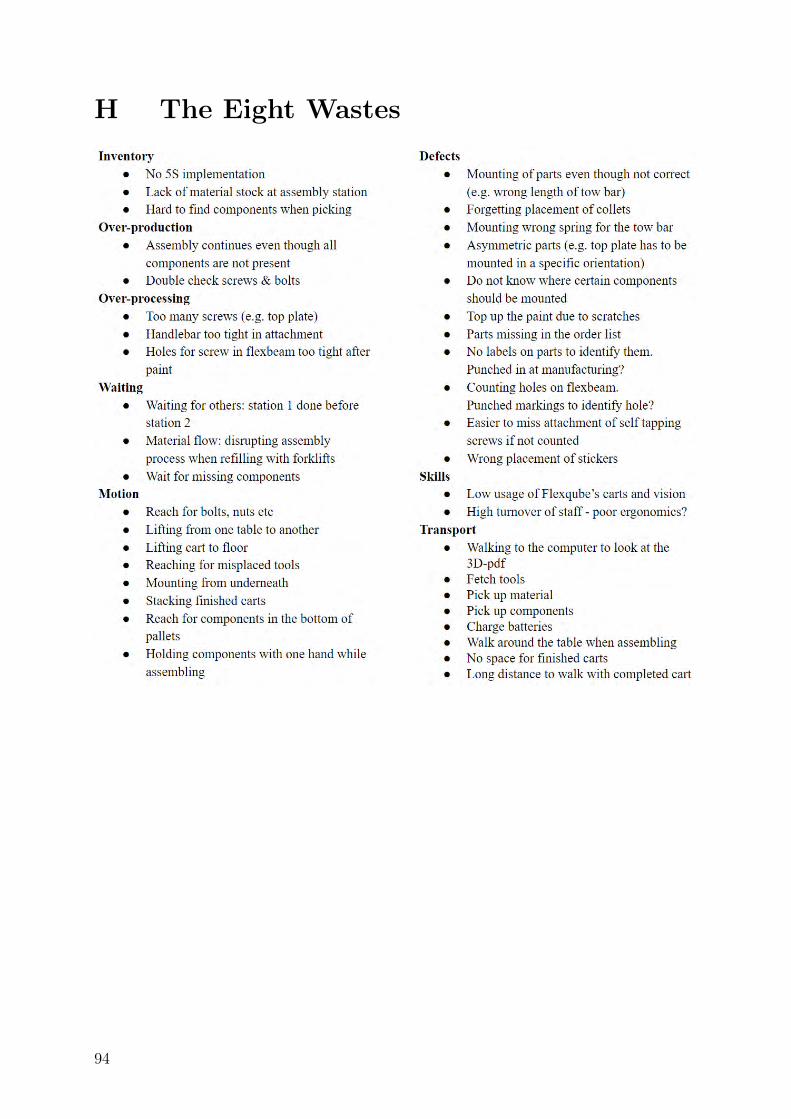
H The Eight Wastes
94

I Paper-based Physical Mock-ups
95
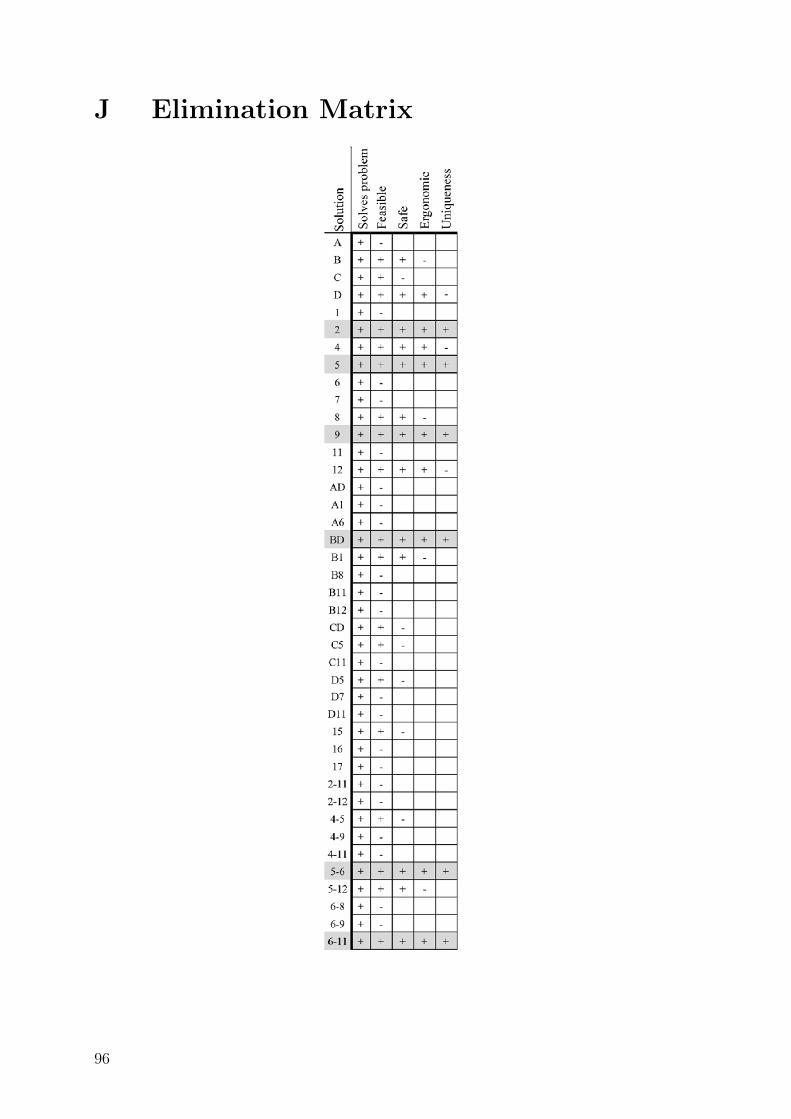
J Elimination Matrix
96