Regulatory T cell development in the absence of functional Foxp3
Upload
khangminh22Category
view
1download
0
Development of an Alginate Based
Microcarrier for Cell Expansion
Chih-Yao Chui Jesus College
Institute of Biomedical Engineering
Department of Engineering Science
University of Oxford
Thesis Submitted for
Doctor of Philosophy in Engineering Science

1
Contents Abstract ......................................................................................................................................... 5
Acknowledgements ....................................................................................................................... 6
List of Publications ........................................................................................................................ 8
Nomenclature ............................................................................................................................... 9
List of Figures .............................................................................................................................. 11
List of Tables ................................................................................................................................ 12
Chapter 1 – Introduction ............................................................................................................. 14
1.1 Background ....................................................................................................................... 14
1.2 Aims of Thesis ................................................................................................................... 17
1.3 Scope ................................................................................................................................. 18
Chapter 2 Literature Review ....................................................................................................... 20
2.1 Cellular Therapy ................................................................................................................ 20
2.2 Mesenchymal Stem Cells .................................................................................................. 21
2.3 Microcarriers ..................................................................................................................... 29
2.4 Alginate ............................................................................................................................. 36
2.5 Electrospraying – Production of Alginate Microbeads ..................................................... 46
2.6 Chitosan and Genipin ........................................................................................................ 55
2.6.1 Chitosan...................................................................................................................... 55
2.6.2 Genipin ....................................................................................................................... 58
Chapter 3 Creation and Development of Genipin Crosslinked Alginate-Chitosan Microcarriers
..................................................................................................................................................... 63
3.1 Introduction ...................................................................................................................... 63
3.2 Materials ........................................................................................................................... 64
3.3 Methods ............................................................................................................................ 64
3.3.1 Electrospraying ........................................................................................................... 64
3.3.2 Chitosan Coating and Genipin Crosslinking ............................................................... 66
3.3.3 Microscope Imaging and Fluorescence Analysis ........................................................ 68
3.3.4 Rheological Test ......................................................................................................... 68
3.3.5 Statistical Analysis ...................................................................................................... 69
3.4 Results and Discussion ...................................................................................................... 69
3.4.1 Pure Jetting Mode with No Voltage Leads to a Wide Distribution of Bead Diameter
............................................................................................................................................. 69
3.4.2 Simple Jet Mode Electrospraying Produces Homogenous Spherical Microbeads ..... 70
3.4.3 Genipin Crosslinked Alginate-Chitosan Microcarriers Characterized by Fluorescence
............................................................................................................................................. 79
2
3.4.3.1 Preliminary Experiments Show Bursting of Microcarriers in Culture Media ...... 79
3.4.3.2 pH of the Chitosan Solution ................................................................................ 85
3.4.3.3 Chitosan Coating Time ........................................................................................ 87
3.4.3.4 Chitosan Concentration ...................................................................................... 90
3.4.3.5 Crosslinking at 60°C ............................................................................................. 92
3.4.3.6 Optimal Microcarrier Production Parameters .................................................... 94
3.4.3.7 Optimized Microcarriers Remain Intact in Culture Media .................................. 95
3.4.5 Rheological Properties of Chitosan Affected by Higher Temperature Treatment ..... 97
3.5 Conclusions ....................................................................................................................... 99
Chapter 4 – Stability of Microcarriers in Cell Culture ............................................................... 100
4.1 Introduction .................................................................................................................... 100
4.2 Materials and Methods ................................................................................................... 102
4.2.1 Alginate Microbeads Preparation by Electrospraying ............................................. 102
4.2.2 Assessment of Bead Swelling ................................................................................... 103
4.2.3 Freeze Drying Beads ................................................................................................. 104
4.2.4 AFM Measurement .................................................................................................. 104
4.2.4.1 AFM Indentation Experiments .......................................................................... 104
4.2.4.2 Comparison between ALXL37 and ALXL60 ........................................................ 105
4.2.4.3 Mechanical properties of beads during cell culture ......................................... 105
4.2.4.4 Modified Measurement on AB and FDAB ......................................................... 105
4.2.4.5 Fitting procedure to extract elastic modulus .................................................... 106
4.2.5 Statistical Analysis .................................................................................................... 109
4.3 Results and Discussion .................................................................................................... 109
4.3.1 Bead Swelling Behaviour in Cell Culture Media ....................................................... 109
4.3.1.1 AB Swelling Behaviour Stable Following 48 Hours in Cell Culture Media ......... 109
4.3.1.2 Swelling Behaviour of ALXL60 vs ALXL37 were Non-Significant ....................... 113
4.3.1.3 Swelling Behaviour of FDAB and FDXL60 Differ from Freshly Made Counterparts
....................................................................................................................................... 115
4.3.1.4 ALXL60 Swelling Unaffected by Cell Presence .................................................. 118
4.3.2 Reduced Young’s Modulus of the Beads .................................................................. 120
4.3.2.1 No Conclusive Result could be Drawn from Reduced Young’s Modulus (E*) of
ALXL37 and ALXL60 ....................................................................................................... 121
4.3.2.2 Freeze Drying has Significant Effect on Reduced Young’s Modulus (E*) .......... 124
4.3.3 Hertz model Valid for Indentation Experiments ...................................................... 125
4.3.4 Limitations of Indentation Experiments .................................................................. 125
4.4 Conclusions ..................................................................................................................... 129

3
Chapter 5 – Cell Growth on Alginate Based Microcarriers ....................................................... 131
5.1 Introduction .................................................................................................................... 131
5.2 Materials ......................................................................................................................... 132
5.3 Methods .......................................................................................................................... 132
5.3.1 Cell Culture ............................................................................................................... 132
5.3.2 Cell Inoculation ......................................................................................................... 132
5.2.3 Cell Attachment........................................................................................................ 134
5.3.4 Detachment Efficiency ............................................................................................. 135
5.3.5 Cell Proliferation ...................................................................................................... 135
5.3.6 RNA Extraction ......................................................................................................... 136
5.3.7 Quantitative Polymerase Chain Reaction (qPCR) ..................................................... 137
5.3.8 Large Scale Bead Culture .......................................................................................... 139
5.3.9 Statistical Analysis .................................................................................................... 142
5.4 Results and Discussion .................................................................................................... 142
5.4.1 Higher Cell Attachment on ALXL60 Compared to Cytodex 1 ................................... 142
5.4.1.1 Human Dermal Fibroblasts................................................................................ 142
5.4.1.2 MSC ................................................................................................................... 144
5.4.2 Higher Cell Detachment from ALXL60 Compared to Cytodex 1............................... 149
5.4.2.1 Human Dermal Fibroblasts................................................................................ 149
5.4.2.2 MSC ................................................................................................................... 149
5.4.3 Higher Cell Proliferation on ALXL60 Compared to Cytodex 1 .................................. 152
5.4.3.1 Human Dermal Fibroblasts................................................................................ 152
5.4.3.2 MSC ................................................................................................................... 153
5.4.4 qPCR and Gene Expression Displayed no changes to MSC Phenotype when Cultured
on ALXL60 .......................................................................................................................... 158
5.4.5 Higher Cell Culture Properties of ALXL60 were retained in Large Scale Culture ..... 163
5.4.6 Industrial Production Potential ................................................................................ 168
5.5 Conclusions ................................................................................................................. 170
Chapter 6 Conclusion and Future Work .................................................................................... 172
6.1 Conclusions ..................................................................................................................... 172
6.2 Future Work .................................................................................................................... 174
6.2.1 Microcarrier Production Optimization ..................................................................... 174
6.2.2 Freeze Drying ........................................................................................................... 177
6.2.3 Large Scale Cell Expansion ....................................................................................... 178
6.2.4 Macrocarrier Work ................................................................................................... 180
6.2.4.1 Preliminary Data for Macrocarrier MSC Culture ............................................... 181

4
6.2.4.2 Future Macrocarrier Work ................................................................................ 189
References................................................................................................................................. 192
Appendix ................................................................................................................................... 212
A.1 Detection of AFM Cantilever Contact Point .................................................................... 212
A2 Appendix Statistical Analysis............................................................................................ 215
A2.1 No Significant Difference between Replicates.......................................................... 215
A2.2 Normality of the thesis data ..................................................................................... 216
A2.2.1 Alginate Beads ................................................................................................... 216
A2.2.2 Microcarrier Production and Swelling ............................................................... 219
A2.2.3 Microcarrier Mechanical Properties .................................................................. 221
5
Abstract Mesenchymal stem cells (MSCs) are potential therapeutic candidates, owing to their
differential ability. However, the gap between availability and demand of MSCs requires
alternative expansion methods from 2D flasks such as microcarriers which provide a high
surface area to volume ratio. However, current commercial microcarriers support low cell
attachment and difficulty in cell detachment.
This study developed genipin crosslinked alginate-chitosan microcarriers to overcome
the aforementioned issues with commercial microcarriers. Alginate beads produced by
electrospraying were coated with chitosan and crosslinked in genipin. The degree of
crosslinking was determined through fluorescence of genipin-chitosan conjugates. By
implementing a high crosslinking temperature of 60°C compared to the traditional 37°C,
the microcarrier production time was significantly decreased.
To ensure microcarrier stability under cell culture conditions, atomic force microscopy
(AFM) based indentation assessing the local elastic reduced modulus (E*) was performed
in parallel to measurement of bead swelling. Results generally show stability of E* and
diameter of microcarriers. Additionally no significant differences in bead diameter
between microcarriers crosslinked at 60°C compared to 37°C demonstrating the high
crosslinking temperature did not affect the bead swelling behaviour.
MSCs cultured on these microcarriers had a higher cell attachment and twice the
proliferation rate compared to the commercial microcarrier Cytodex 1. Unlike in Cytodex
1, cells easily detached under trypsin treatment and did not require extended incubation
periods or intense agitation. Furthermore, the possibility of freeze drying the
microcarriers was also investigated to reduce storage and transportation costs of the
microcarriers.

6
Acknowledgements Throughout the course of my D.Phil I have received numerous support and advice from
several people. I am grateful to all of you, and therefore, I would like to take this
opportunity to thank the following individuals.
Firstly, I am thankful to the Department of Engineering Science, Oxford and China
Regenerative Medicine International (CRMI) for providing me the opportunity to work
on this project and sponsoring me throughout my D.Phil.
I am particularly grateful to my supervisor Prof. Cathy Ye. Thank you for your
unwavering guidance and support during the entire duration of my D.Phil. I would like
to thank my collaborators, Andrea, Jacob and Prof. Sonia Contera, for sharing with me
your knowledge on the application of the Atomic Force Microscope and providing me a
chance to explore a new field of study.
Thank you to all members of the Tissue Engineering and Regenerative Medicine
Research Group, you have been wonderful colleagues and made my work here enjoyable.
In particular, Prof Zhanfeng Cui for providing me insight to the bigger picture of tissue
engineering and careers advise. Akin, Linh and Naresh for giving me advice and
suggestions on my work. Michelle for providing me with insight on how to improve my
scientific writing. Henry and Hui for looking out for me during my research placement
in Suzhou. And finally, Cat, Bo, Sharlayne, Robin, Fabio, Erfan, Di, Mookie and Miren
for your constant support, great lunch talks and group socials.
I am also grateful to all the wonderful friends I made in Oxford throughout my work. I
would like to thank in particular my housemates Jack, Stefan and Alison for your constant
moral support and putting up with me throughout the 4 years. Candice, Marie, Ben, Luigi,
Karan, Ronald and Medha for your great company. Eveliina and Aurelia for encouraging

7
me and cheering me up during my thesis writing sessions in the study room. Finally, I am
thankful to Jesus College MCR for providing the wonderful events and memories that I
experienced during my time here.
Last but certainly not least I would like to thank my parents. I would not have been able
to do this without your constant encouragement, advice and belief in me. I am forever
grateful for what you have done for me and hence, I dedicate this work to both of you.
8
List of Publications
Journal Papers:
Chui, CY., Mouthuy, PA. & Ye, H. Direct electrospinning of poly(vinyl butyral)
onto human dermal fibroblasts using a portable device. Biotechnol Lett (2018),
40(4), 737-744. DOI: https://doi.org/10.1007/s10529-018-2522-7
C.-Y. Chui, A. Odeleye, L. Nguyen, N. Kasoju, E. Soliman, H. Ye,
Electrosprayed genipin cross-linked alginate-chitosan microcarriers for ex
vivo expansion of mesenchymal stem cells, J. Biomed. Mater. Res. Part A. (2018)
1–12. doi:10.1002/jbm.a.36539.
Chui CY*, Bonilla-Brunner A*, Seifert J, Contera S, Ye H. Atomic force
microscopy-indentation demonstrates that alginate beads are mechanically
stable under cell culture conditions. Journal of the Mechanical Behavior of
Biomedical Materials, 93 (2019), 61–69. doi:10.1016/j.jmbbm.2019.01.019.
(*Joint first author)
Conference Presentations:
Chui CY, Odeleye A, Nguyen L, Ye H. Cell Proliferation on Genipin
Crosslinked Chitosan Alginate Microcarriers. Termis EU, Davos, Switzerland,
2017 (Poster).
Chui CY, Ye H. Physical Behaviour of Alginate Microbeads in Cell Culture
Reagents. Bioprocess UK, Newcastle, UK, 2016 (Poster – selected for poster
flash talk).
Chui CY, Ye H. Creation of Alginate Microbeads using Simple Jet Mode
Electrospraying MEI Bioeng, Oxford, UK, 2016 (Poster).

9
Nomenclature
A Cell attachment efficiency
AB Unmodified alginate beads
AFM Atomic force microscope
ALXL37 Genipin crosslinked alginate-chitosan microcarriers
crosslinked at 37 °C
ALXL60 Genipin crosslinked alginate-chitosan microcarriers
crosslinked at 60 °C
CaCl2 Calcium chloride
CCK-8 Cell counting kit 8
CFU-F Colony forming unit-fibroblasts
CO2 Carbon dioxide
D Cell detachment efficiency
DI Deionised
DMEM Dulbecco’s Modified Eagle Media
E Young’s modulus
E* Reduced modulus
ESC Embryonic stem cell
EDTA Ethylenediaminetetraacetic acid
FBS Fetal bovine serum
FDAB Freeze dried alginate beads
FDXL60 Freeze dried ALXL60
G L-guluronic acid
G* Complex modulus

10
G1 Storage modulus
G2 Loss modulus
GAG Glycosaminoglycan
GFP Green fluorescent protein
HCl Hydrochloric acid
HDF Human dermal fibroblast
hMSC Human mesenchymal stem cell
Htert Human telomerase reverse transcriptase
IPSC Induced pluripotent stem cell
M D-mannuroic acid
MSC Mesenchymal Stem Cell
NaCl Sodium chloride
NaOH Sodium hydroxide
Oh Ohnesorge number
P/S Penicillin/Streptomycin
PBS Phosphate buffered saline
qPCR Quantitative polymerase chain reaction
RSD Relative standard deviation
v Poisson’s ratio

11
List of Figures Fig 2.1. Number of clinical trials involving MSCs ........................................................................ 22
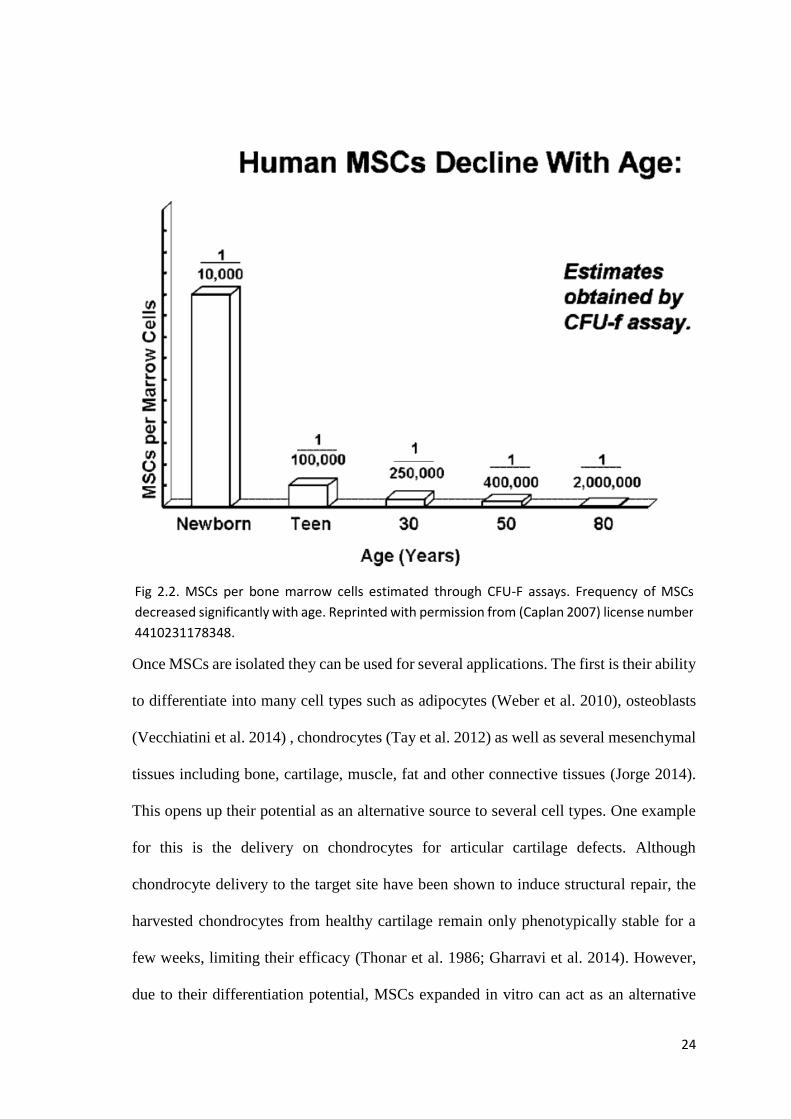
Fig 2.2. MSCs per bone marrow cells .......................................................................................... 24
Fig 2.3. MSC cell morphology vs passage number ...................................................................... 28
Fig 2.4. Structure of porous and solid microcarriers ................................................................... 30
Fig 2.5. Cell culture on commercially available solid microcarriers ............................................ 35
Fig 2.6. Structure of sodium alginate .......................................................................................... 36
Fig 2.7. Gelation of alginate through divalent ions. .................................................................... 38
Fig 2.8. FTIR spectrum of alginate pre and post gelling .............................................................. 39
Fig 2.9. Gelation methods of alginate using calcium ions ........................................................... 41
Fig 2.10. Mechanical properties of alginate ................................................................................ 42
Fig 2.11. Cell culture on hydrogel based microcarriers............................................................... 44
Fig 2.12. Creation of alginate microbeads through electrospraying........................................... 47
Fig 2.13. Dripping mode electrospraying . .................................................................................. 51
Fig 2.14. Cone jet mode electrospraying .................................................................................... 53
Fig 2.15. Simple jet mode electrospraying .................................................................................. 54
Fig 2.16. Production of chitosan from chitin ............................................................................... 57
Fig 2.17. Crosslinking reaction of chitosan with genipin ............................................................. 60
Fig 2.18. Genipin crosslinked alginate chitosan beads ............................................................... 62
Fig 3.1. Electrospraying Setup ..................................................................................................... 65
Fig 3.2. Production of genipin crosslinked alginate-chitosan microcarriers. .............................. 67
Fig 3.3. Alginate beads created with no voltage applied. ........................................................... 70
Fig 3.4. Effect of voltage and electrode distance on alginate bead diameter ........................... 73
Fig 3.5. Brightfield microscope images of electrosprayed alginate beads .................................. 76
Fig 3.6. Effect of voltage on alginate bead circularity. ................................................................ 77
Fig 3.7. Brightfield, fluorescence images and photographs of genipin crosslinked alginate
chitosan microcarriers. ............................................................................................................... 81
Fig 3.8. Brightfield microscope images of preliminary microcarriers in media. ......................... 84
Fig 3.9. Effect of pH on microcarrier coating layer ..................................................................... 86
Fig 3.10. Effect of chitosan coating time on microcarrier coating layer. .................................... 89
Fig 3.11. Effect of chitosan concentration on microcarrier coating layer ................................... 91
Fig 3.12. Effect of crosslinking temperature on microcarrier coating layer. .............................. 93
Fig 3.13. Brightfield microscope images of final genipin crosslinked alginate chitosan
microcarriers in media. ............................................................................................................... 96
Fig 3.14. Effect of tempearture on chitosan rheological properties. .......................................... 98
Fig 4.1. AFM cantilever. ............................................................................................................. 108
Fig 4.2. Alginate beads swelling in media ................................................................................. 112
Fig 4.3. Brightfield microscope images of ALXL37 and ALXL60 microcarriers swelling in media
................................................................................................................................................... 114
Fig 4.4. Microcarrier diameter in DMEM over a 14 day period ................................................ 115
Fig 4.5. Brightfield microscope images of freeze dried alginate beads and ALXL60 microcarriers
................................................................................................................................................... 117
Fig 4.6. Diameter of freeze dried beads in DMEM over a 14 day period .................................. 118

12
Fig 4.7. Microcarrier diameter changes during MSC culture .................................................... 119
Fig 4.8. AFM indentation curves. .............................................................................................. 120
Fig 4.9. E* of microcarriers measured using AFM indentation over a 14 day period. .............. 123
Fig 4.10. Effect on bead movement during indentation on E* ................................................. 127
Fig 4.11. E* of alginate beads and freeze dried alginate beads measured using AFM indentation
over a 14 day period. ................................................................................................................ 128
Fig 5.1. Microcarrier culture within 22ml glass vials.. ............................................................... 134
Fig 5.2. Large scale microcarrier culture in 500ml bottles. ....................................................... 141
Fig 5.3. Brightfield microscope images of human dermal fibroblasts on various microcarriers.
................................................................................................................................................... 144
Fig 5.4. Fluorescent images of GFP modified MSCs on microcarrier.. ...................................... 145
Fig 5.5. Attachment efficiency of HDFs and MSCs on microcarriers ......................................... 146
Fig 5.6. Brightfield image of HDFs detaching from ALXL60 ....................................................... 149
Fig 5.7. Detachment efficiency of HDF and MSCs from different types of microcarriers ......... 151
Fig 5.8. Cell proliferation of HDFs on microcarriers over 14 days............................................. 153
Fig 5.9. Proliferation of MSCs on ALXL60, FDXL60 and Cytodex 1. ........................................... 156
Fig 5.10. Brightfield images of MSC culture on ALXL60 during day 7 and 14 of culture ........... 157
Fig 5.11. Relative gene expression of MSC markers for cells harvested from microcarriers ... 161
Fig 5.12. Raw CT data for cells harvested from microcarriers .................................................. 162
Fig 5.13. Fluorescent images of MSC culture with ALXL60 and Cytodex 1 microcarriers in large
scale culture .............................................................................................................................. 166
Fig 5.14. Cell growth parameters on ALXL60 and Cytodex 1 in large scale culture. ................. 167
Fig 6.1. All in one setup combining microcarrier production with cell culture and harvest ..... 180
Fig 6.2. Cracking on macrocarrier surface following media exchange...................................... 183
Fig 6.3. Macrocarriers in CaCl2 enriched media do not display cracking phenomenon.. ......... 184
Fig 6.4. Uncrosslinked alginate chitosan macrocarrier produced display no surface cracking
following media exchange. ....................................................................................................... 185
Fig 6.5. MSC seeded on macrocarriers. ..................................................................................... 188
Figure A.1. Experimental force vs distance curve (F/Fδ ). ....................................................... 213
Figure A.2. Frequency histogram of alginate beads created under no voltage. ....................... 217
List of Tables Table 2.1. Characteristics of MSCs isolated from various sources .............................................. 23
Table 2.2. Summary of how particle size changes with electrospraying operating parameters.
..................................................................................................................................................... 49
Table 3.1. Relative standard deviation (RSD) of microbead diameter vs voltage. ..................... 72

13
Table 3.2. Summary of manufacturing parameters for beads crosslinked at 37°C and 60°C used
for further comparison................................................................................................................ 94
Table 5.1. Genes analysed, accession numbers, primer sequences for qPCR and amplicon sizes
in base pairs. ............................................................................................................................. 138
Table 5.2. Microcarrier scalability using simple jet electrospraying ......................................... 168
Table A.1. ANOVA test comparing bead diameter between 3 replicates of electrosprayed
alginate beads. .......................................................................................................................... 215
Table A.2. ANOVA test of fluorescent intensity and coating layer thickness between 3
replicates for varying microcarrier production parameters. .................................................... 215
Table A.3. D'Agostino-Pearson normality test on diameter of alginate beads produced under
no voltage chapter 3.4.1.. ......................................................................................................... 217
Table A.4. D'Agostino-Pearson normality test on diameter of electrosprayed alginate beads
produced in chapter 3.4.2.. ....................................................................................................... 218
Table A.5. D'Agostino-Pearson normality test fluorescence intensity of microcarriers using
various process parameters during microcarrier production as described in 3.4.3. ................ 219
Table A.6. D'Agostino-Pearson normality test on diameter of alginate beads (AB) during
swelling in media, performed in 4.3.1. ..................................................................................... 220
Table A.7. D'Agostino-Pearson normality test on diameter of freeze dried alginate beads
(FDAB) during swelling in media, performed in 4.3.1. .............................................................. 220
Table A.8. D'Agostino-Pearson normality test on diameter of ALXL37 during swelling in media,
performed in 4.3.1. ................................................................................................................... 220
Table A.9. D'Agostino-Pearson normality test on diameter of ALXL60 during swelling in media,
performed in 4.3.1. ................................................................................................................... 220
Table A.10. D'Agostino-Pearson normality test on diameter of FDXL60 during swelling in
media, performed in 4.3.1. ....................................................................................................... 221
Table A.11. D'Agostino-Pearson normality test on the reduced modulus (E*) of AB during AFM
indentation in 4.3.2.. ................................................................................................................. 221
Table A.12. D'Agostino-Pearson normality test on the reduced modulus (E*) of FDAB during
AFM indentation in 4.3.2.. ........................................................................................................ 221
14
Chapter 1 – Introduction
1.1 Background Stem cells have two specific properties which make them very attractive for use within
the regenerative medicine, cell therapy and tissue engineering fields (Wang et al. 2012).
The first property is self-renewal – the ability to undergo division while maintaining their
undifferentiated state, while the second is cell potency, which describes the ability to
differentiate into several other cell types (Martin 1981). Mesenchymal Stem cells (MSCs)
have generated particular interest as they do not cause ethical controversy and teratoma
formation, found in embryonic stem cells which hamper the latter’s research potential
(Pera et al. 2000; Wang et al. 2012).
Due to these properties, MSCs has been explored as a potential tool for cellular therapy.
This process involves transplantation of live cells to repair or restore lost or defective
functions within the body (Giancola et al. 2012) and have the potential for treatment of
a number of conditions such as cardiovascular, liver and autoimmune diseases (Wang et
al. 2012; Kim and Cho 2013). Currently, the biggest obstacle preventing these therapies
from being clinically viable is the requirement of large cell numbers per clinical dose,
with doses up to 9 million cells per kg patient body weight (Ringdén et al. 2006). As the
frequency of MSCs within the body is low and direct collection of such a large number
of cells is not practical, MSCs expansion is required before any treatment could be
conducted (Ikebe and Suzuki 2014).
MSCs are anchorage dependent cells hence require attachment to a surface for cell
proliferation (Merten 2015). 2D tissue culture flasks are the current conventional tool
used in cell expansion. However, due to their low surface area to volume ratio, the flasks
take up a significant level of physical space. This hence requires extensive handling and
labour hours to maintain the culture (Weber et al. 2007a). Moreover, culture parameters
15
such as temperature and pH cannot be controlled using this system, limiting tissue culture
flasks to laboratory scale studies rather than the commercial or clinical scene (dos Santos
et al. 2013).
Microcarriers are small spherical particles (µm-mm) which support cell growth by acting
as a surface for the attachment of cells (van Wezel 1967), and are used to overcome the
drawbacks of tissue culture flasks. They offer a large surface area to volume ratio for
anchorage dependent cell proliferation within a suspension culture. This generates more
homogenous culture conditions, ease of monitoring and control of the culture parameters
(Schop et al. 2008) compared to monolayer cultures such as tissue culture flasks, leading
to large scale production of cells (Varani et al. 1983; Reiter et al. 1990).
An alternative to microcarrier culture is cell encapsulation, where MSCs are entrapped
within microbeads (Jossen et al. 2014). Encapsulation shields cells from hydrodynamic
shear forces found in dynamic bioreactor environments. This offers an advantage over
microcarriers which are more susceptible to these external forces (Merten 2015).
However MSCs were found not to proliferate when encapsulated within alginate beads
(Ma et al. 2002). This decrease in proliferation is thought to be caused by steric hindrance
of the entrapped cells (Lund et al. 2009). Additionally, cell leakage, where cells
eventually escape the microcapsules into the surrounding cell culture media also occurs
during encapsulation if the bead size or the cell density are not optimized (Selimoglu and
Elibol 2010). Despite this, encapsulated MSCs have been shown to successfully
differentiate into adipocytes or chondrocytes given the suitable in vitro differentiation
environment (Weber et al. 2010; Tay et al. 2012). Therefore it is believed that
encapsulation is a preferred technique during cell differentiation while microcarriers are
utilized for cell expansion purposes.
16
Following the use of DEAE Sephadex (GE Healthcare) beads by van Wezel, several
commercial microcarriers were subsequently developed. These are mostly dextran (GE
Healthcare 2011a), plastic (Pall 2015) or glass (Sigma) based. Commercial microcarriers
were mainly developed with respect to their yield for production of hormones, enzymes,
antibodies and other secreted molecules from the cells attached (GE Healthcare 2007).
These processes do not require cell harvesting as the end product is produced in
suspension within the culture medium. Although these microcarriers support cell
attachment and growth, it has been proven difficult to detach cells from them at the end
of culture, making them unsuitable for culturing cells as therapeutics (Nienow et al.
2014). The difficulty in cell detachment leads to another challenge; the separation of the
microcarriers from the harvested cells (Chen et al. 2013). Due to the small size of the
microcarriers, this typically involves techniques such as filtration or centrifugation,
exacerbating the costs and labour intensity as the expansion scale increases (Nienow et
al. 2014) . Moreover, the diameter and density of commercial microcarriers such as the
Cytodex line have been optimized for use within the traditional stirred tank bioreactor
and may not be suitable for use within newer bioreactor types such as the perfusion or
fluidized bed bioreactor (GE Healthcare 2007).
More recently, natural hydrogel-based microcarriers have been developed. These include
coating alginate microbeads with gelatin (Jorge 2014) or collagen (Gröhn et al. 1997) as
well as genipin crosslinked gelatin microbeads (Lau et al. 2011). It is argued that hydrogel
based microcarriers yields a higher attachment efficiency compared to several
commercial microcarriers, which have been found to only support up to 60-70%
attachment efficiency for stem cells (Chen et al. 2011). Furthermore, through
manipulation of production parameters, the size of the hydrogel based microcarriers can
be optimized for a variety of bioreactors and is not limited by what is available

17
commercially (Gröhn et al. 1997). The mechanical stiffness of natural hydrogels could
easily be varied over a large range (<1kPa – 500kPa) through crosslinking. This allows
stem cell growth and differentiation to be controlled by altering material properties
(Murphy et al. 2014). Additionally, unlike synthetic materials, several natural hydrogels
have structures similar to the native extracellular matrix (ECM) which promotes stem cell
attachment and growth (Murphy et al. 2014).
1.2 Aims of Thesis The overall aim of this thesis is to develop a hydrogel based carrier with a higher cell
attachment, detachment efficiency and proliferation of MSCs compared to commercial
microcarriers. In order to achieve this, it is proposed to design and fabricate genipin
crosslinked alginate-chitosan microcarriers as an alternative cell expansion tool for
cellular therapy.
Alginate is a biocompatible hydrogel derived from brown seaweed. Divalent cations such
as Ca2+ bind forming ionic interchain bridges with the polymer, causing the alginate to
gel (Rowley et al. 1999). However, alginate discourages cell adhesion due to the lack of
surface adhesive properties (Lee and Mooney 2012). As cell adhesion is a requirement
for survival, the alginate bead surface is coated with chitosan to promote cell anchorage
and interaction with the microcarrier. Chitosan is a natural polycationic polysaccharide
derived from the abundantly available chitin (Croisier and Jérôme 2013). It is
biocompatible and resembles glycosaminoglycan in the extracellular matrix (Yang et al.
2009) and has been show to support cell adhesion (Croisier and Jérôme 2013). The
advantage of chitosan over gelatin or collagen is that it is not made from mammalian
products which have a higher risk of spreading infectious diseases (Gorgieva and Kokol
2011). In order to provide additional structural integrity of the chitosan coating layer, the
chitosan was covalently bonded to genipin - a natural glucone extracted from ripe Genipa
18
Americana fruits (Djerassi et al. 1960). Genipin is believed to be far more biocompatible
than other commonly used crosslinkers for tissue grafts such as glutaraldehyde (Sung et
al. 1999).
1.3 Scope Chapter 2 presents the literature review, beginning with a brief introduction of stem cell
therapy. This is followed by the properties and advantages of MSCs, as well as potential
applications explored by past studies. Microcarrier cell culture is then discussed, covering
the applications and composition of both commercial as well as researched based
microcarriers. Subsequently, the properties of alginate, the core material of the
microcarrier in this study is explored. The background and theory behind electrospraying
and the production of alginate microbeads are then introduced. The final section involves
reviewing the properties of chitosan and genipin, the coating and crosslinking materials
used to produce the microcarriers.
Chapter 3 demonstrates the production process of the genipin crosslinked alginate-
chitosan microcarriers. Alginate microbeads were produced by electrospraying, a well-
known technique for generating small microdroplets (Zhang et al. 2007a). The
microbeads were gelled within a gelling bath before being coated with chitosan and
crosslinked with genipin. The genipin-chitosan conjugates fluoresces under green
channel, a property which can be exploited to characterize crosslinking density without
the need to add further florescence markers (Chen et al. 2005). Through measurement of
fluorescence intensity, the effect of production properties on the final crosslinking density
and coating layer thickness of the microcarriers could be determined.
Chapter 4 reports the stability of the microcarriers under cell culture conditions. This was
assessed by measuring the changes in microcarrier diameter over the course of 2 weeks
within cell culture conditions, the typical amount of time required in stem cell expansion
19
(Williams et al. 2005; Lee et al. 2010; Serra et al. 2011; Lechanteur 2014). In parallel to
the diameter, the changes in reduced Young’s moduli (E*) of the microcarrier surface
were investigated using Atomic Force Microscopy (AFM) microindentation over the
course of 14 days. The chapter also discusses the advantages and drawbacks of AFM
cantilever indentation as well as the validity of the results obtained.
Chapter 5 investigates the suitability of the microcarriers for cell expansion. The
following properties: the cell attachment, detachment and proliferation rates of human
dermal fibroblasts (HDFs) and MSCs were compared between the genipin crosslinked
alginate-chitosan microcarriers to the popular commercial microcarrier, Cytodex 1.
Following MSC harvest after 2 weeks of microcarrier culture, any potential changes in
MSC phenotype were investigated using quantitative polymerase chain reaction (qPCR).
Chapter 6 presents a summary of the contributions and conclusions of this thesis.
Potential future work are subsequently discussed paying particular attention on the
possibility to scale up the size of the genipin crosslinked alginate-chitosan microcarriers
into macrocarriers - beads of mm scale rather than micron scale. This increases the final
cell yield through ease of separation of the carriers from the cell suspension following
cell detachment.
20
Chapter 2 Literature Review
2.1 Cellular Therapy Cellular therapy is a sub category of regenerative medicine involving transplantation of
live cells to repair or restore lost or defective functions within the body (Giancola et al.
2012). Following the first allogenic bone marrow transplant in 1968 (Bach et al. 1968),
the field has quickly evolved over the past decade with several preclinical and clinical
trials (Sharma et al. 2014). In particular, stem cell based therapies have been investigated
as potential treatment for a number of conditions such as cardiovascular, liver and
autoimmune diseases (Wang et al. 2012; Kim and Cho 2013).
Stem cells have two specific properties which make them very attractive for use within
the regenerative medicine, cell therapy and tissue engineering fields. The first property is
self-renewal – the ability to undergo division while maintaining their undifferentiated
state, while the second is cell potency, which describes the ability to differentiate into
several other cell types (Martin 1981).
There are two main categories of stem cells, embryonic and non-embryonic (adult).
Embryonic stem cells (ESCs) are derived from the inner cell mass of the blastocyst and
can differentiate into cells in all 3 germ layers. However, ethical controversy and teratoma
formation limits its research potential (Wang et al. 2012). Recently, induced pluripotent
stem cells (IPSCs) have been developed through reprogramming differentiated somatic
cells or fibroblasts into a pluripotent state (Takahashi et al. 2007). Hence, IPSCs share
the characteristics of ESCs without ethical concerns. However, like ESCs, IPSCs have
the potential for teratoma development compromising their potential (Wei et al. 2013).
Another drawback of IPS is the use of genetic modification via delivery vectors such as
retrovirus (Medvedev et al. 2010). Viral vectors inserted into the host cell’s genomes
results in tumorigenesis due to genetic abnormalities (Bhartiya et al. 2013). Transgene

21
free reprogramming methods have been developed, however, these methods typically
display low efficiency of IPS induction (Fernandez et al. 2013). Additionally, although
all the reprogramming methods integrate DNA factors into the cells, the reprogrammed
cells display epigenic abnormalities with an average of 5 point mutations found in various
IPS cell lines reprogrammed using a variety of methods (Gore et al. 2011). Therefore, a
much more in depth research is required to realize the true clinical potential of IPS
(Bhartiya et al. 2013). Due to this, adult stem cells free of these drawbacks have to be
explored for cell therapy.
2.2 Mesenchymal Stem Cells Mesenchymal stem cells (MSCs) are a type of adult stem cell which unlike ESCs and
IPSCs, are free of concerns that arise in ESCs and IPSCs. Hence, MSCs have generated
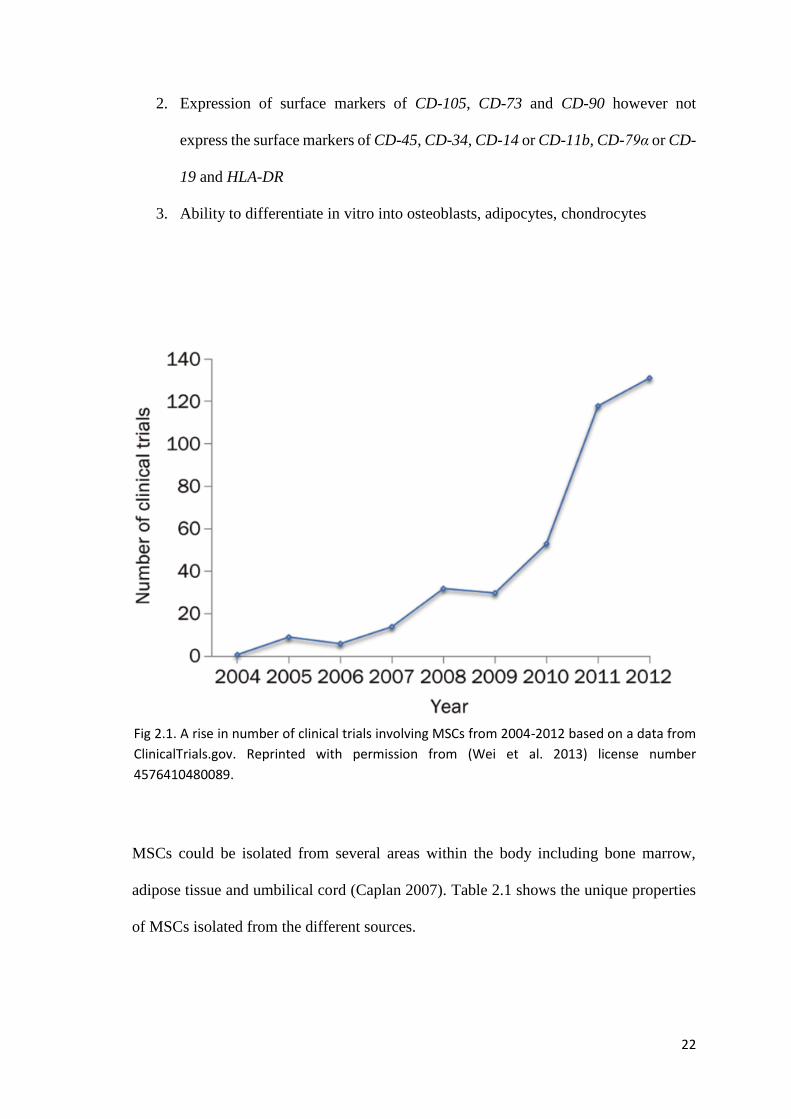
particular interest in the regenerative medicine field. This is shown by the fact that there
are currently more than 344 registered clinical trials worldwide evaluating the potency of
MSCs for cellular therapy, a number which has been rising since 2004 (Fig 2.1).
MSCs originates from the mesoderm and were first isolated and characterized by
Friedenstein et al in the 1970s from bone marrow samples. When seeded into culture
flasks, the initial cell population observed was heterogeneous, however, within a few
days of culture, fibroblast-like cells, termed as colony forming unit-fibroblasts (CFU-F)
had developed. It was found that these cells were able to differentiate into bone or
cartilage deposits (Friedenstein et al. 1970). Over the years, MSCs have been studied
extensively among investigators. However, the defining characteristics of MSCs were
inconsistent between several reports. Hence, the International Society of Cellular
Therapy has since proposed a set of standards in order to define human MSCs. The 3
criteria proposed are (Dominici et al. 2006):
1. Adherence to plastic in standard culture conditions
22
2. Expression of surface markers of CD-105, CD-73 and CD-90 however not
express the surface markers of CD-45, CD-34, CD-14 or CD-11b, CD-79α or CD-
19 and HLA-DR
3. Ability to differentiate in vitro into osteoblasts, adipocytes, chondrocytes
MSCs could be isolated from several areas within the body including bone marrow,
adipose tissue and umbilical cord (Caplan 2007). Table 2.1 shows the unique properties
of MSCs isolated from the different sources.
Fig 2.1. A rise in number of clinical trials involving MSCs from 2004-2012 based on a data from
ClinicalTrials.gov. Reprinted with permission from (Wei et al. 2013) license number
4576410480089.

23
Source Characteristics
Bone Marrow Most commonly studied and furthest development (Klingemann et al. 2008)
Differentiate into chondrocytes, adipocytes, osteoblasts (Klingemann et al. 2008)
Biopsy is painful and inconvenient (Klingemann et al. 2008)
Lose proliferative and differentiation capacity with age (Klingemann et al. 2008)
Adipose Tissue Easily accessible for repeated harvests (Keyser et al. 2007)
Higher harvesting numbers compared to bone marrow MSCs (Kern et al. 2006)
Do not differentiate into chondrocytes (Klingemann et al. 2008)
Immunosuppression properties similar to bone marrow MSCs (Keyser et al. 2007)
Umbilical Cord Do not differentiate into adipocytes (Kern et al. 2006)
More preferentially involved in immune functions compared to bone marrow MSCs (Klingemann et al. 2008)
Higher expansion capability compared to bone marrow MSCs (Kern et al. 2006)
As described in table 2.1, bone marrow MSCs are the most commonly studied and have
the furthest development with respect to preclinical and clinical applications
(Klingemann et al. 2008). One of its greatest drawbacks is that frequency of MSCs within
tissue sample is low and the number of cells decreases with age. Bone marrow MSCs are
found in roughly 1 in 10000 bone marrow titers within a new born baby. This number
decreases to 1 in 250000 marrow titers at adulthood (Fig 2.2) (Caplan 2007). Despite this,
bone marrow MSCs are typically regarded as the “Gold Standard” for MSC studies
(Klingemann et al. 2008).
Table 2.1. Characteristics of MSCs isolated from bone marrow, adipose tissue and umbilical cord
24
Once MSCs are isolated they can be used for several applications. The first is their ability
to differentiate into many cell types such as adipocytes (Weber et al. 2010), osteoblasts
(Vecchiatini et al. 2014) , chondrocytes (Tay et al. 2012) as well as several mesenchymal
tissues including bone, cartilage, muscle, fat and other connective tissues (Jorge 2014).
This opens up their potential as an alternative source to several cell types. One example
for this is the delivery on chondrocytes for articular cartilage defects. Although
chondrocyte delivery to the target site have been shown to induce structural repair, the
harvested chondrocytes from healthy cartilage remain only phenotypically stable for a
few weeks, limiting their efficacy (Thonar et al. 1986; Gharravi et al. 2014). However,
due to their differentiation potential, MSCs expanded in vitro can act as an alternative
Fig 2.2. MSCs per bone marrow cells estimated through CFU-F assays. Frequency of MSCs
decreased significantly with age. Reprinted with permission from (Caplan 2007) license number
4410231178348.
25
source for chondrocytes during cartilage repair (Ma et al. 2002). Similarly, osteogenesis
differentiation of MSCs could be applied to obtain osteoblasts for the in vivo treatment
of osteogenesis imperfecta, a bone defect. The osteoblasts generated would be able to
contribute a collagen matrix to the defective bone (Horwitz et al. 2002). It has also been
reported that MSCs differentiation to cardiomyocytes provides a potential cell based
therapy for myocardial infarction through replacement of lost cardiomyocytes (Pittenger
and Martin 2004).
MSCs are said to be immune privileged allowing them to escape immune recognition
following an allogenic transplantation (Rasmusson 2006). The exact mechanism of how
MSCs interact with immune cells is not known however it is believed that the
immunosuppressive and anti-inflammatory effects of MSCs are due their interactions
with lymphocytes (Kim and Cho 2013). Typically if T cells are co-cultured or exposed
to allogenic cells a proliferative response is subsequently generated. However, it has been
shown that MSCs not only do not elicit this response but also reduces activity of T cells
to other stimulators. Moreover, following the removal of MSCs, T cells once again
recover their previous characteristics and respond normally to stimulators (Pittenger and
Martin 2004). The immune regulation properties of MSCs have given promising results
for treatment of immune diseases. In recent clinical trials, it was reported that MSCs
could reverse the effects of graft vs host disease while displaying no side effects or acute
toxicity within patients (Prasad et al. 2011). MSCs are also shown to be a feasible
treatment of fistulas developed from Crohn’s disease, with no adverse effects in patients
being observed after treatment (García-Olmo et al. 2005).
Another property of MSCs that have been investigated is their tendency to migrate to
damaged tissue sites and inflammation (Wei et al. 2013). This appears to be irrespective
of the type of tissue the MSCs were introduced to. MSCs migrate to the lung in response
26
to injury and subsequently reduced inflammation within a mice model (Ortiz et al. 2003).
It has also been reported that MSCs migrate to pancreatic islet and renal glomeruli within
diabetic mice (Lee et al. 2006). The exact mechanism which causes this behaviour is yet
to be fully identified (Jung et al. 2012). However, it is believed that the migratory action
could be a response to signals from growth factors or chemokines generated from the
injured cells (Wang et al. 2012). This migratory behaviour can be modulated for
therapeutic treatment of cancer as tumour sites produce similar inflammatory factors
compared to a site of injury (Balkwill 2004; Kim and Cho 2013).
In addition to the migratory feature, MSCs are also known for their regenerative effects
by secreting bioactive molecules such as growth factors or cytokines at the site of injury.
Moreover, MSCs signal nearby cells to secrete active biomolecules to speed up the
healing process (Wang et al. 2012). This feature creates opportunities to use MSCs for
cell therapy such as for the treatment of myocardial infarction, a condition which leads
to cell death due to lack of oxygen supplied to heart cells. MSCs are shown to stimulate
vasculogenesis and angiogenesis within heart tissue increasing the survival rate of cardiac
cells preventing cell death due to hypoxic conditions (Rahul and Yang 2014). MSCs have
also been used to treat chemical injuries to the cornea, which causes several deleterious
effects such as inflammatory damage. Through secretion of the anti-inflammatory protein
TSG-6, MSCs were able to reduce inflammation and opacity of the cornea within a rat
model (Roddy et al. 2011). The use of autologous MSC treatment for end-stage liver
disease have underwent clinical trials. Patients displayed improved liver function with no
adverse side effects following introduction of MSCs (Kharaziha et al. 2009).
Although there have been significant progress in development of MSCs over the recent
years, they are far from a mature clinical technology. There are several challenges and
hurdles that need to be overcome. Firstly, the exact mechanisms behind MSC clinical
27
effectiveness needs to be verified. Arnold Caplan, one of the leading researchers in MSCs
have recently questioned the ability of MSCs to differentiate into regenerative tissue cells
and urged Mesenchymal Stem Cells to be renamed as Mesenchymal Signalling Cells.
Caplan stated that MSCs cause other cells to construct new tissue based on their
signalling ability rather than differentiating into new cells themselves (Caplan 2017).
Secondly, the required MSC numbers for one clinical dose of cell therapy has not yet
been optimized. Although recent studies have used doses up to 9 million cells per kg
patient body weight (Ringdén et al. 2006), this number needs to be defined based on type
of disease and severity (Wang et al. 2012).
Additionally, clinical production of MSCs have to be standardize under GMP conditions.
Due to low frequency of MSCs following isolation, MSCs expansion is required before
any treatment could be conducted (Ikebe and Suzuki 2014). During expansion, MSCs
should not be allowed to grow to more than 80% confluency as this causes the cells to
lose their stem cell phenotype (Wolfe et al. 2008). It should also be noted that, the passage
number of MSCs should not exceed 4 to 6 due to the changes in their properties at later
passages (Penfornis and Pochampally 2011a). This can be seen in Fig 2.3, MSCs at
passage zero are spindle shaped, and rapidly proliferating cells (Fig 2.3 A, C). However,
as the passage number increases, these cells are gradually replaced with mature MSCs
displaying larger and broader cells (Fig 2.3 B, D) which proliferate at a much slower rate.
Finally, another challenge lies in the variability between the sources of MSCs depending
on the area of isolation for example, bone marrow, umbilical cord or adipose tissue etc.
Hence, the most suitable source of MSCs used to treat each disease or condition has to
be standardized. Additionally, a clinical grade isolation and administration procedure has
28
to be set, with the proper viability, phenotype and endotoxin tests to be conducted during
this process (Wang et al. 2012; Kim and Cho 2013).
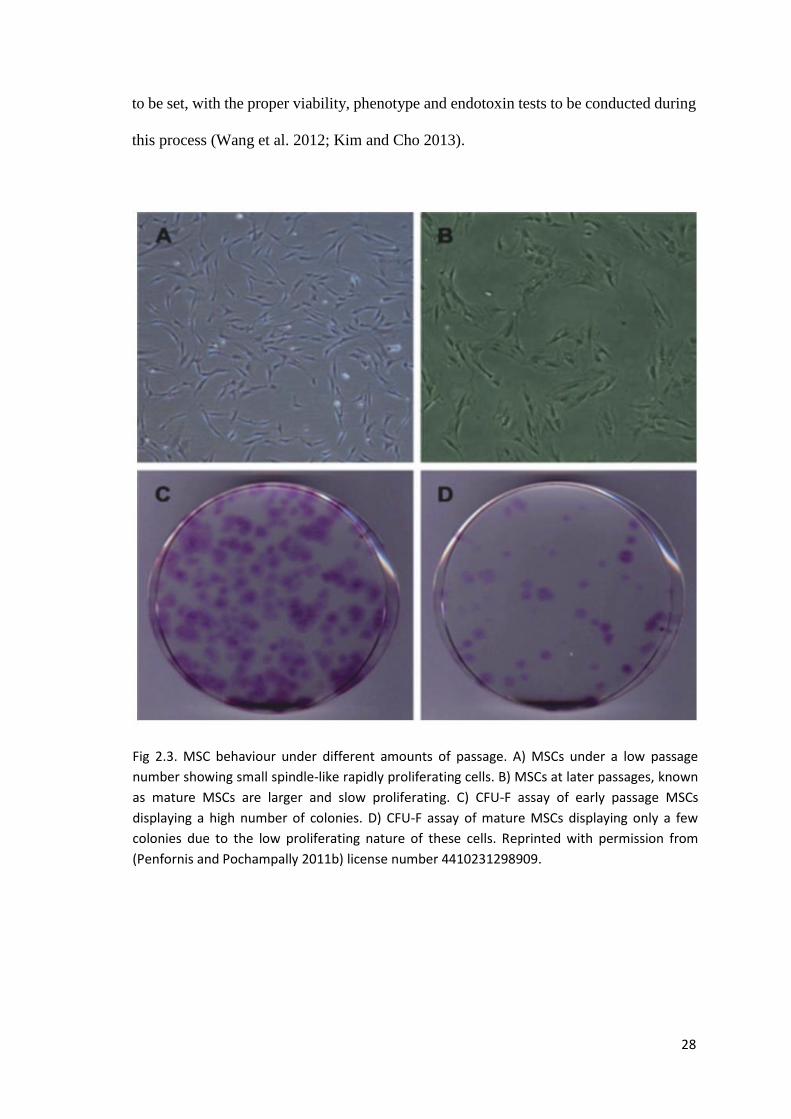
Fig 2.3. MSC behaviour under different amounts of passage. A) MSCs under a low passage
number showing small spindle-like rapidly proliferating cells. B) MSCs at later passages, known
as mature MSCs are larger and slow proliferating. C) CFU-F assay of early passage MSCs
displaying a high number of colonies. D) CFU-F assay of mature MSCs displaying only a few
colonies due to the low proliferating nature of these cells. Reprinted with permission from
(Penfornis and Pochampally 2011b) license number 4410231298909.

29
2.3 Microcarriers Currently, one of the biggest obstacles preventing MSC therapy from being clinically
viable is the requirement of large cell numbers per clinical dose (Wang et al. 2012). Due
to the low numbers of MSCs isolated, in vitro expansion up to 9 million cells per kg
patient body weight is normally required (Ringdén et al. 2006).
In order to achieve these numbers, MSC expansion is typically performed through 2D
tissue culture flasks. These flasks have several major drawbacks, as they require intensive
labour and time consumption during the maintenance of the culture as a result of a poor
surface area to volume ratio. Furthermore, they lack the ability to monitor culture
parameters such as pH and oxygen levels (dos Santos et al. 2013).
Microcarriers are small spherical particles supporting growth of anchorage dependant
cells (Nilsson 1988). The concept of microcarriers was first developed by Van Wezel
who used of Diethylaminoethyl (DEAE) Sephadex (GE Healthcare) beads to culture
several cell lines and primary cells (van Wezel 1967). Their main advantage is the ability
to provide a higher surface area to volume ratio compared to traditional cell culture
methods such as tissue culture flasks (Schop et al. 2009). Hence large scale production
of cells can be achieved more easily compared to tissue culture flasks, (van Wezel 1967),
with several microcarrier cultures reaching up to 200 million cells per ml (GE Healthcare
2016). In addition, microcarriers allow anchorage dependent cells, such as MSCs to be
cultured in suspension. This generates a more homogenous cell culture environment
compared to the static 2D culture as well as enabling automated monitoring and control
of cell culture environment. The potential for automation reduces the labour intensiveness
and costs of the microcarrier culture (Reiter et al. 1990; Weber et al. 2007b). Due to these
advantageous properties, microcarriers are being explored for cell expansion in cellular
therapy.
30
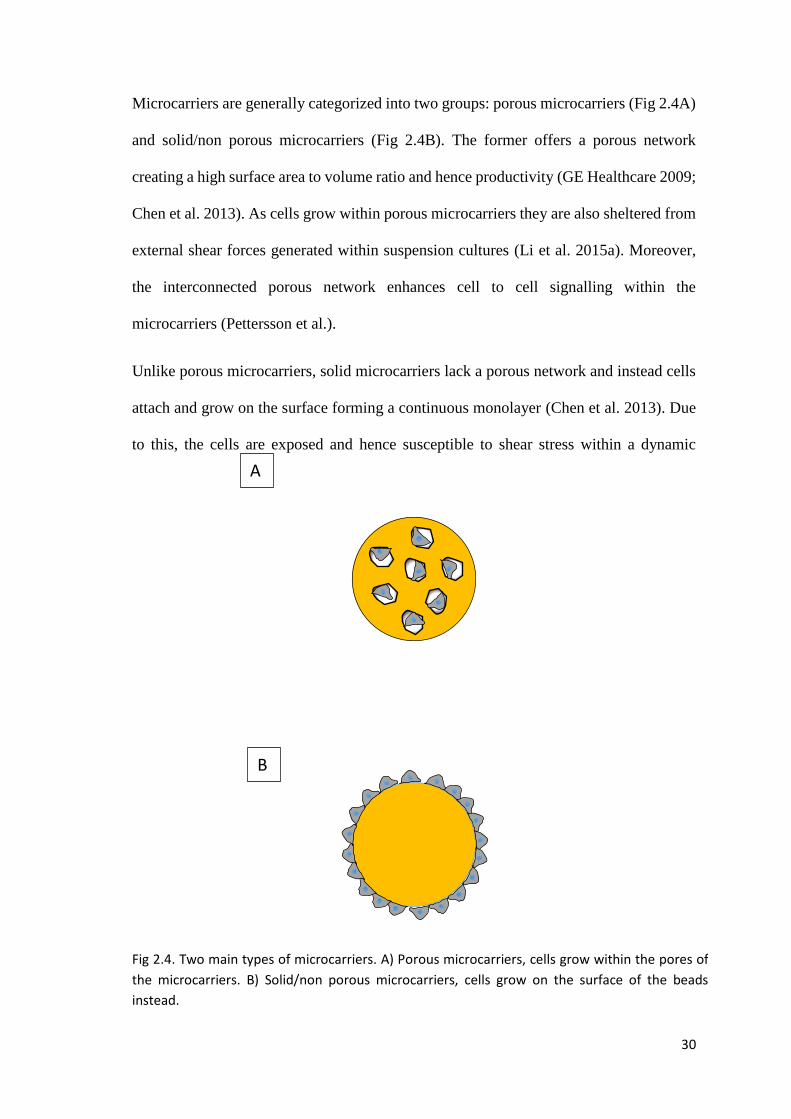
Microcarriers are generally categorized into two groups: porous microcarriers (Fig 2.4A)
and solid/non porous microcarriers (Fig 2.4B). The former offers a porous network
creating a high surface area to volume ratio and hence productivity (GE Healthcare 2009;
Chen et al. 2013). As cells grow within porous microcarriers they are also sheltered from
external shear forces generated within suspension cultures (Li et al. 2015a). Moreover,
the interconnected porous network enhances cell to cell signalling within the
microcarriers (Pettersson et al.).
Unlike porous microcarriers, solid microcarriers lack a porous network and instead cells
attach and grow on the surface forming a continuous monolayer (Chen et al. 2013). Due
to this, the cells are exposed and hence susceptible to shear stress within a dynamic
A
B
Fig 2.4. Two main types of microcarriers. A) Porous microcarriers, cells grow within the pores of
the microcarriers. B) Solid/non porous microcarriers, cells grow on the surface of the beads
instead.
31
environment (Merten 2015). Furthermore, the lack of interconnected pores lowers the
overall surface area to volume ratio compared to their porous counterparts (Merten 2015).
Despite these drawbacks, the main advantage of solid microcarriers over porous
microcarriers is their higher detachment efficiency. Cell recovery from porous
microcarriers is typically low due to difficulty of the harvesting solution penetrating the
porous network and coming in contact with all the cells (GE Healthcare 2016). This
makes solid microcarriers popular for applications such as cell expansion where cells are
required to be harvested.
The size distribution of the microcarriers should be small as an uneven distribution would
lead to cell attaching to the smaller microcarriers due to the sedimentation of the larger
beads (Nilsson 1989). Microcarriers are available in a large range of diameters from µm
to mm scale (GE Healthcare 2016). The size of the microcarriers used plays a huge role
on the final product yield as well as production parameters. Higher microcarrier diameters
would lower the surface area to volume ratio hence requiring higher volumes to achieve
a similar growth surface area (Brun-Graeppi et al. 2011). Furthermore, larger
microcarriers require a higher energy input in order to achieve complete microcarrier
suspension compared to smaller microcarriers within bioreactors (GE Healthcare 2007).
On the other hand, during cell harvest, separation of the cell suspension from smaller
microcarriers would be challenging compared to larger microcarriers. This would lower
the final cell yield as well as incur high costs (Chen et al. 2013; Nienow et al. 2014).
Based on the above analysis, the diameter would need to be optimized in order to balance
the advantages and drawbacks of large and small microcarriers. To achieve this, Hu et al
developed a model to predict the optimal microcarrier diameter in order to maximize
yield. The study believes that the number of cells per microcarrier after cell seeding has
to be above a threshold in order for cells to proliferate on the microcarrier. Increasing
32
the seeding density will lower the proportion of microcarriers with less than the critical
number of cells required for cell proliferation. However, a large seeding density would
lead to the microcarriers rapidly reaching confluency and several cultivation passages
may be required before the target multiplication ratio is achieved. As the cells per
microcarrier is proportional to the (diameter)-3, the optimal microcarrier diameter would
give rise to the highest net increase in cell number i.e. minimizing the proportion of beads
with lower cells than the critical number while also lowering the number of passages
required (Hu and Wang 1986). Despite this, the size of commercial microcarriers
available are typically reported to be between 90-300µm (Freshney 2011; Szczypka et al.
2014). Within this range, the microcarriers would have a sufficient growth surface to
support several doublings with several hundred cells per bead at the end of the culture
(Chen et al. 2013).
There are several microcarriers which are available commercially. The surface charge of
the Sephadex beads initially used by Van Wezel was optimized leading to the
development of Cytodex 1 (Fig 2.5A), the first of the Cytodex series (GE Healthcare)
developed for a variety of cell types. Cytodex 1 consists of a crosslinked dextran matrix
containing several positively charged DEAE groups (Nilsson 1988). Cytodex 3 is another
microcarrier part of the Cytodex series, unlike its predecessor Cytodex 1, Cytodex 3
couples a layer of denatured collagen on the surface of the crosslinked dextran matrix
(Fig 2.5B). The collagen layer could be digested by proteolytic enzymes, creating novel
opportunities during cell harvest to maintain maximum viability and membrane stability.
According to its manufacturers, Cytodex 3 is recommended for cells which are difficult
to culture in vitro such as cells with an epithelial morphology (GE Healthcare 2011a).
Aside from the Cytodex series, glass beads (Fig 2.5C) have been developed as
microcarriers, making use of the fact that cells grow in high densities on glass in
33
monolayer cultures. The main drawback of glass microcarriers is the high density of
glass. This requires high stirring speeds to create a uniform suspension (Varani et al.
1983). Despite this, glass microcarriers with density as low as 1.02g/cm3 has been
developed recently (Sigma Aldrich) which overcomes the aforementioned drawback. In
addition, the microcarriers could be reused up to 10 times following enzymatic or
chromic acid cleaning (Sigma).
Similar to glass, cells adhere well to plastic surfaces such as in tissue culture flasks.
Solohill plastic microcarriers (Pall) utilizes this with a similar growth surface to tissue
culture flasks. The manufacturers demonstrated the ability to expand MSCs on the
microcarriers where the cells grew for several passages without a decrease in doubling
rate as well as retaining stem cell phenotype. Following harvest, the MSCs successfully
underwent differentiation into adipocytes and osteocytes (Pall 2015).
All of the aforementioned microcarriers are solid microcarriers, however several
commercial porous microcarriers have also been developed. Cytoline (Ge life sciences)
is a porous microcarrier with a matrix consisting of polyethene and silica. The carriers
contain no materials from biological origin and hence possess lot-to-lot consistency.
Being porous, it provides both an internal and external surface for anchorage cell
population. The high sedimentation rate of Cytoline allows a high recirculation rate to be
used to ensure a high supply of oxygen to the cells (GE Healthcare 2011b). Cytopore is
a porous microcarrier based on natural cellulose which is non-toxic and biodegradable.
Positively charged DEAE groups are placed within the cellulose matrix for cell
attachment (GE Healthcare 2009). Both Cytoline and Cytopore are primarily optimized
for culturing Chinese Hamster Ovarian (CHO) cells involved in the production of
recombinant proteins for therapeutic applications, (GE Healthcare 2009, 2011b).
34
Despite the large amount of commercial microcarriers developed, their main applications
are within the pharmaceutical field for the production of hormones, enzymes, antibodies
and other secreted bioactive molecules from the cells attached (GE Healthcare 2007;
Chen et al. 2011). These processes do not require cell harvesting as the end product is
produced in suspension within the culture medium. This had led to difficulty in detaching
cells from the commercial microcarriers, which require extended periods of time within
proteolytic enzymes, lowering downstream yield (Nienow et al. 2014). hMSCs grown on
both Cytodex 1 and Cytodex 3 displayed cell detachment of around 20% or lower
following 10 minutes of trypsin treatment (Weber et al. 2007a). Furthermore, Solohill
microcarriers used for MSC expansion achieved a less than 2.5% detachment efficiency
following 15 min of incubation in trypsin under low agitation (Nienow et al. 2014).
Therefore for applications such as cell expansion, where the cells has to be recovered at
the end of culture, the microcarriers used need to possess a good detachment efficiency.
In order to overcome the aforementioned issue with commercial microcarriers, hydrogel-
based microcarriers have been developed recently for cell expansion. Hydrogels possess
the unique property to absorb water up to thousand times their dry weight (Hoffman
2012). The high water content within the gel reduces mechanical friction on the
surrounding tissue, as well as providing a similar environment to the native extracellular
matrix, compositionally and mechanically (Hoare and Kohane 2008). Additionally, the
surface of hydrogel microcarriers possess functional groups derived from the
extracellular matrix of cells, such as collagen, gelatin, primary amines and peptides (Chen
et al. 2013). These surfaces support the growth and attachment of anchorage dependent
cells and hence hydrogel based microcarriers developed have been shown to achieve a
higher attachment efficiency compared to commercial microcarriers (Jorge 2014).
35
A B
C
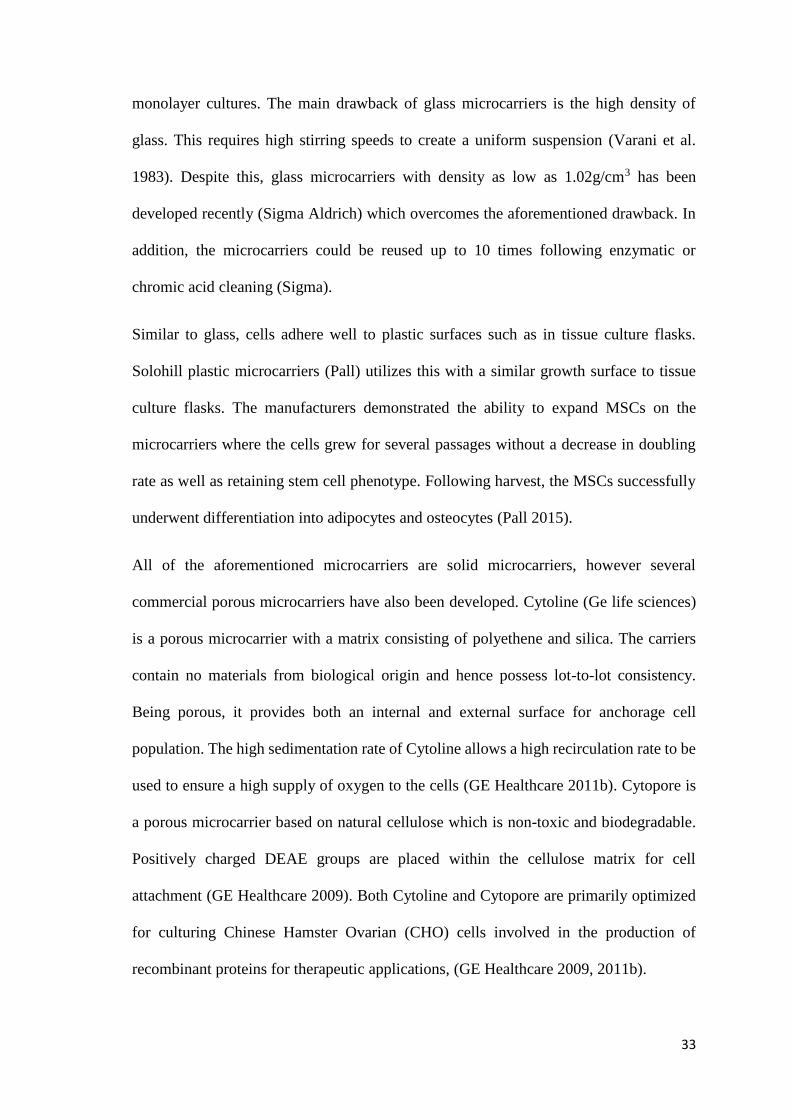
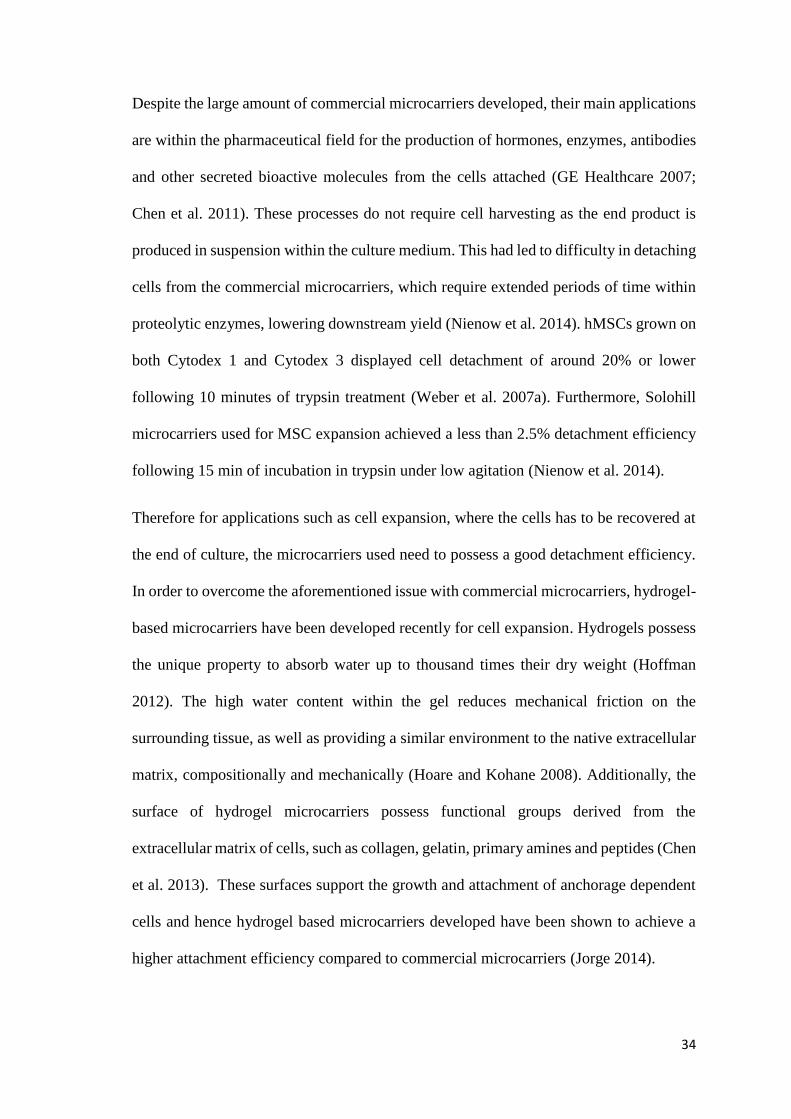
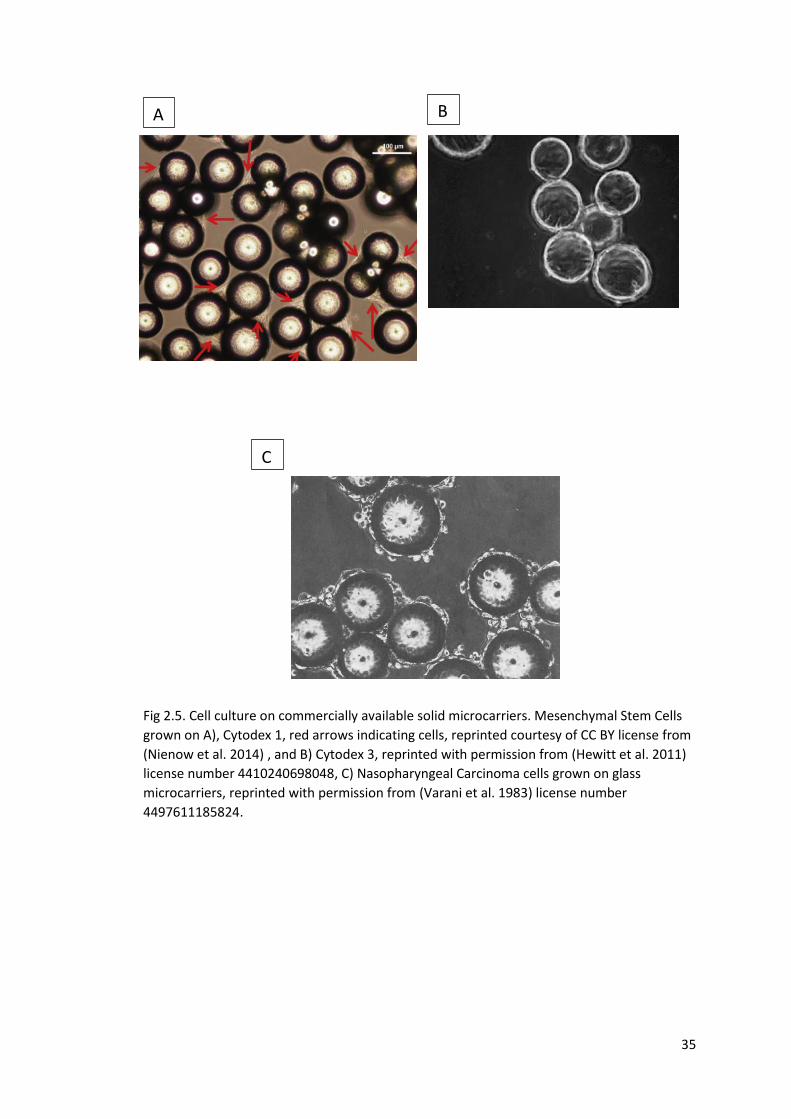
Fig 2.5. Cell culture on commercially available solid microcarriers. Mesenchymal Stem Cells
grown on A), Cytodex 1, red arrows indicating cells, reprinted courtesy of CC BY license from
(Nienow et al. 2014) , and B) Cytodex 3, reprinted with permission from (Hewitt et al. 2011)
license number 4410240698048, C) Nasopharyngeal Carcinoma cells grown on glass
microcarriers, reprinted with permission from (Varani et al. 1983) license number
4497611185824.
36
2.4 Alginate Alginate, is a naturally occurring polymer derived from brown seaweed, mainly the giant
Kelp Macrocystis pyrifera as well as various types of Laminaria (Smidsrød and Skjak-
Braek 1990) by treatment with sodium carbonate (Rinaudo 2008). The extract is filtered
and precipitated with sodium chloride creating the water soluble sodium-alginate
(Rinaudo 2008).
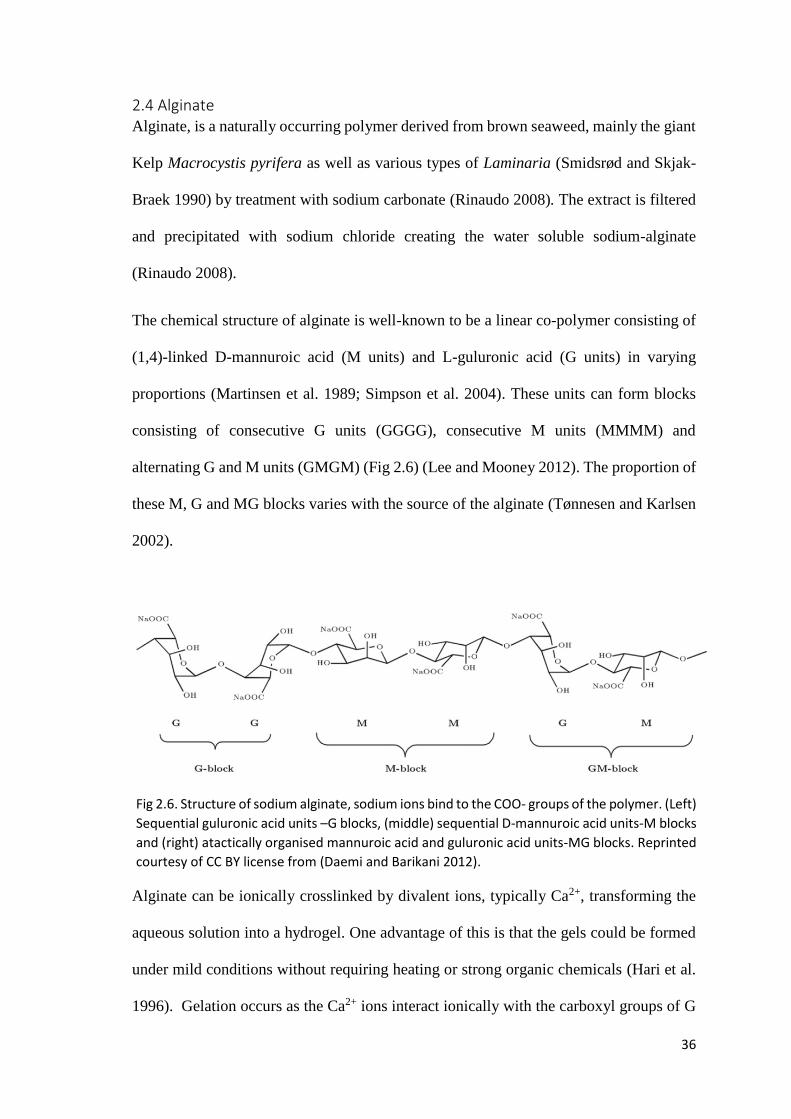
The chemical structure of alginate is well-known to be a linear co-polymer consisting of
(1,4)-linked D-mannuroic acid (M units) and L-guluronic acid (G units) in varying
proportions (Martinsen et al. 1989; Simpson et al. 2004). These units can form blocks
consisting of consecutive G units (GGGG), consecutive M units (MMMM) and
alternating G and M units (GMGM) (Fig 2.6) (Lee and Mooney 2012). The proportion of
these M, G and MG blocks varies with the source of the alginate (Tønnesen and Karlsen
2002).
Alginate can be ionically crosslinked by divalent ions, typically Ca2+, transforming the
aqueous solution into a hydrogel. One advantage of this is that the gels could be formed
under mild conditions without requiring heating or strong organic chemicals (Hari et al.
1996). Gelation occurs as the Ca2+ ions interact ionically with the carboxyl groups of G
Fig 2.6. Structure of sodium alginate, sodium ions bind to the COO- groups of the polymer. (Left)
Sequential guluronic acid units –G blocks, (middle) sequential D-mannuroic acid units-M blocks
and (right) atactically organised mannuroic acid and guluronic acid units-MG blocks. Reprinted
courtesy of CC BY license from (Daemi and Barikani 2012).
37
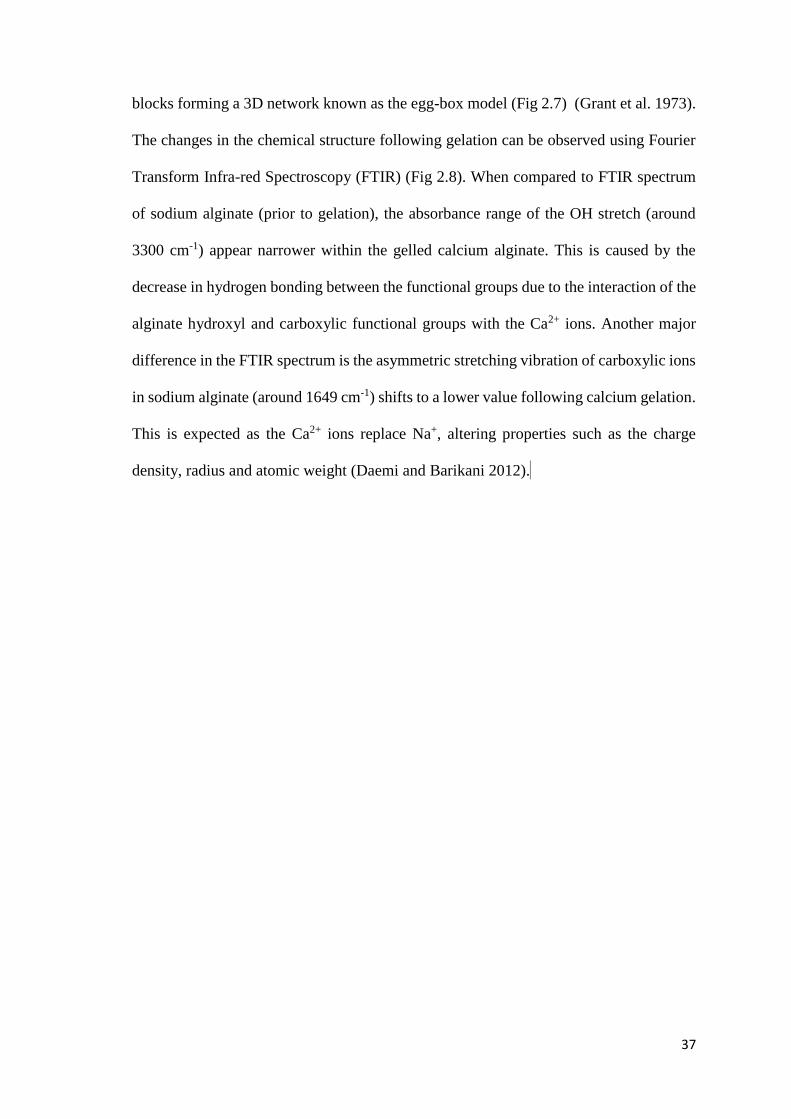
blocks forming a 3D network known as the egg-box model (Fig 2.7) (Grant et al. 1973).
The changes in the chemical structure following gelation can be observed using Fourier
Transform Infra-red Spectroscopy (FTIR) (Fig 2.8). When compared to FTIR spectrum
of sodium alginate (prior to gelation), the absorbance range of the OH stretch (around
3300 cm-1) appear narrower within the gelled calcium alginate. This is caused by the
decrease in hydrogen bonding between the functional groups due to the interaction of the
alginate hydroxyl and carboxylic functional groups with the Ca2+ ions. Another major
difference in the FTIR spectrum is the asymmetric stretching vibration of carboxylic ions
in sodium alginate (around 1649 cm-1) shifts to a lower value following calcium gelation.
This is expected as the Ca2+ ions replace Na+, altering properties such as the charge
density, radius and atomic weight (Daemi and Barikani 2012). ..

38
A
B
Fig 2.7. Gelation of alginate through divalent ions. A) Divalent ions (Denoted by M) binding to
COO- groups within alginate G blocks, through ionic interlinkages. Reprinted courtesy of CC BY
license from (Sun and Tan 2013). B) The binding of divalent ions links the different polymer
chains forming an egg box model which causes the alginate to gel. Reprinted with permission
from (Lee and Yuk 2007) license number 4410191399367.
39
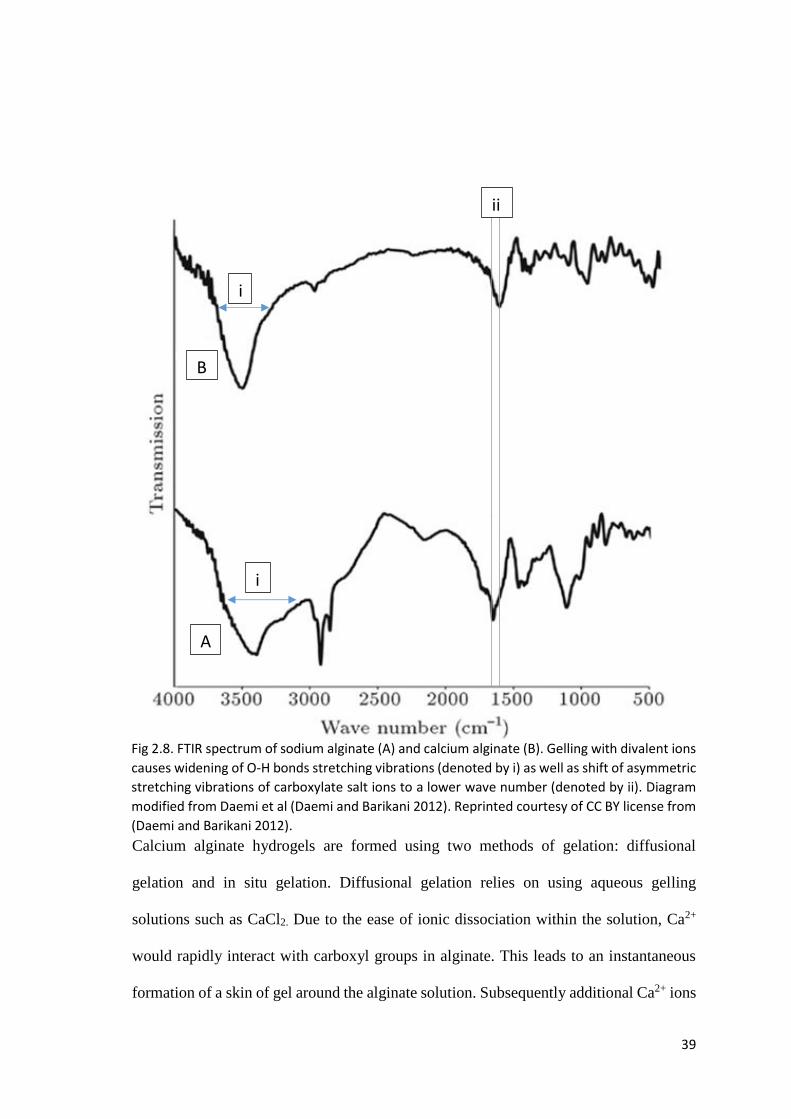
Calcium alginate hydrogels are formed using two methods of gelation: diffusional
gelation and in situ gelation. Diffusional gelation relies on using aqueous gelling
solutions such as CaCl2. Due to the ease of ionic dissociation within the solution, Ca2+
would rapidly interact with carboxyl groups in alginate. This leads to an instantaneous
formation of a skin of gel around the alginate solution. Subsequently additional Ca2+ ions
B
A
ii
i
i
Fig 2.8. FTIR spectrum of sodium alginate (A) and calcium alginate (B). Gelling with divalent ions
causes widening of O-H bonds stretching vibrations (denoted by i) as well as shift of asymmetric
stretching vibrations of carboxylate salt ions to a lower wave number (denoted by ii). Diagram
modified from Daemi et al (Daemi and Barikani 2012). Reprinted courtesy of CC BY license from
(Daemi and Barikani 2012).

40
diffuse through the gel skin completing the gelation of the alginate core (Fig 2.9a)
(Blandino et al. 1999).
Unlike diffusional gelation, in situ gelation utilizes less soluble forms of calcium salts
such as calcium carbonate, calcium hydrogen orthophosphate or calcium sulphate. The
salt is mixed with the alginate solution forming a mixture. Subsequently, a catalyst such
as glucono-d-lactone is added to the mixture increasing its acidity. This leads to release
of Ca2+ from the salt and gelling of the alginate in situ (Fig 2.9b) (Fernández Farrés and
Norton 2014).
Each method of gelation offers its advantages and drawbacks. The diffusional method
results in rapid gel formation, with the skin formation being almost instantaneous. On the
other hand, in situ gelation is more time consuming due to the steps required for Ca2+
release. However, gels created using the in situ method were shown to possess a denser
and more homogenous crosslinking network compared to the diffusional method. This
was demonstrated when alginate disks gelled in situ demonstrated a more stable complex
moduli within an in vivo rat model, compared to their counterparts gelled using the
diffusional method. Hence there was a greater potential of mechanical failure in the
diffusional gelled alginate (Nunamaker et al. 2007). Despite these differences, there were
no indication of differences in biocompatibility between the methods (Nunamaker et al.
2007).
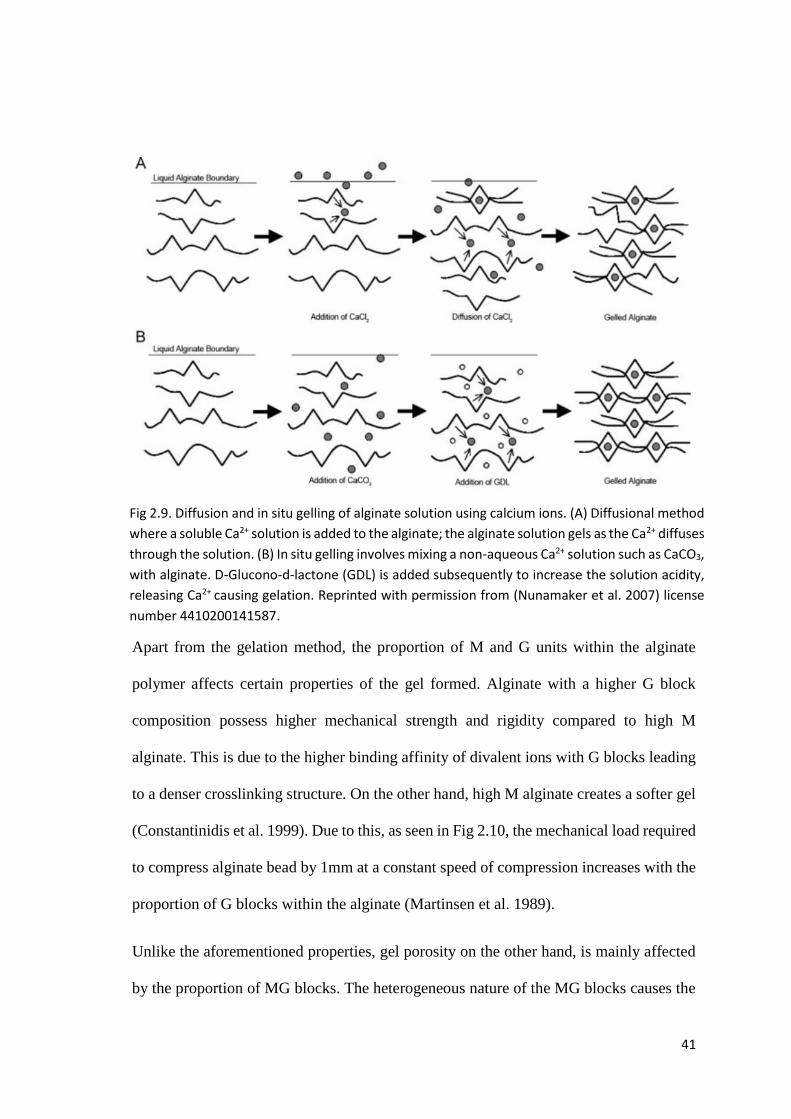
41
Apart from the gelation method, the proportion of M and G units within the alginate
polymer affects certain properties of the gel formed. Alginate with a higher G block
composition possess higher mechanical strength and rigidity compared to high M
alginate. This is due to the higher binding affinity of divalent ions with G blocks leading
to a denser crosslinking structure. On the other hand, high M alginate creates a softer gel
(Constantinidis et al. 1999). Due to this, as seen in Fig 2.10, the mechanical load required
to compress alginate bead by 1mm at a constant speed of compression increases with the
proportion of G blocks within the alginate (Martinsen et al. 1989).
Unlike the aforementioned properties, gel porosity on the other hand, is mainly affected
by the proportion of MG blocks. The heterogeneous nature of the MG blocks causes the
Fig 2.9. Diffusion and in situ gelling of alginate solution using calcium ions. (A) Diffusional method
where a soluble Ca2+ solution is added to the alginate; the alginate solution gels as the Ca2+ diffuses
through the solution. (B) In situ gelling involves mixing a non-aqueous Ca2+ solution such as CaCO3,
with alginate. D-Glucono-d-lactone (GDL) is added subsequently to increase the solution acidity,
releasing Ca2+ causing gelation. Reprinted with permission from (Nunamaker et al. 2007) license
number 4410200141587.
42
polymer to be more flexible and increases the difficulty of molecular diffusion through
the gel (Martinsen et al. 1992).
Incr
easi
ng
G b
lock
co
nte
nt
of
algi
nat
e
Fig 2.10. The maximum load required to compress 1mm of calcium alginate bead at a constant
compression speed increases with alginate solution concentration. Load required also increases
with a higher G block content within the alginate. Modified from (Martinsen et al. 1989). Reprinted
with permission from (Martinsen et al. 1989) license number 4410200304384.

43
Alginate is generally considered biocompatible and non-toxic, making it popular for the
tissue engineering and regenerative medicine applications (Lee and Mooney 2012). The
polymer has since been labelled as “Generally regarded as safe (GRAS)” by the FDA
(George and Abraham 2006). These properties make alginate particularly attractive for
regenerative medicine and tissue engineering applications.
Alginate based microbeads are a strong candidate for microcarrier culture due to their
biocompatibility and non-toxicity (Lee and Mooney 2012). Moreover, alginate gels could
be dissolved using calcium chelating agents opening up the potential of dissolving the
microcarriers, harvesting cells without the use of proteolytic enzyme solutions, skipping
the entire microcarrier separation step and hence achieving a high cell detachment
efficiency (Gröhn et al. 1997). In addition, the transparency of alginate microbeads would
also allow for easy microscopic examination of the attached cells (GE Healthcare 2007).
Finally the cost of alginate is generally lower compared to most other hydrogels (Lee and
Mooney 2012).

44
Despite its advantages, a major disadvantage of alginate is the instability of the hydrogel
due to their sensitivity towards monovalent ions such as Na+ (Bajpai and Sharma 2004)
which are present in cell culture media. These ions exchange with Ca2+ from G groups
causing the egg box structure to disintegrate, leading to swelling and the eventual
dissolution of the alginate bead under physiological conditions (Bajpai and Sharma
2004). In order to increase stability of alginate beads, a polycation layer is often coated
around the alginate core (Lim and Sun 1980).
In addition to its instability outside Ca2+ rich environments, alginate discourages cell
adhesion due to the lack of surface adhesive properties (Lee and Mooney 2012).
However, alginate acts as a blank state and several cellular interactive groups could be
Fig 2.11. Collagen coated on the surface of barium alginate beads. Beads acted as microcarriers
and supported the growth of A) human chang liver cells, at 2 days of culture and B) mouse
fibroblasts at 3 days of culture. Reprinted courtesy of CC BY license from (Gröhn et al. 1997).
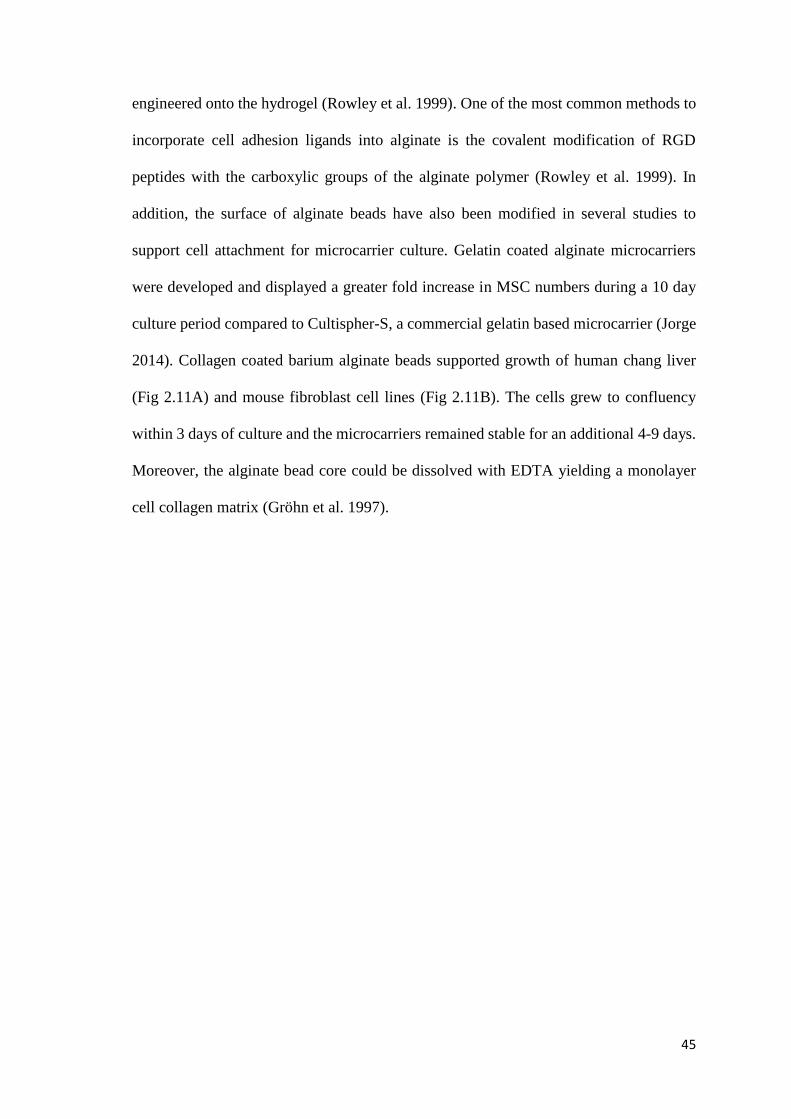
45
engineered onto the hydrogel (Rowley et al. 1999). One of the most common methods to
incorporate cell adhesion ligands into alginate is the covalent modification of RGD
peptides with the carboxylic groups of the alginate polymer (Rowley et al. 1999). In
addition, the surface of alginate beads have also been modified in several studies to
support cell attachment for microcarrier culture. Gelatin coated alginate microcarriers
were developed and displayed a greater fold increase in MSC numbers during a 10 day
culture period compared to Cultispher-S, a commercial gelatin based microcarrier (Jorge
2014). Collagen coated barium alginate beads supported growth of human chang liver
(Fig 2.11A) and mouse fibroblast cell lines (Fig 2.11B). The cells grew to confluency
within 3 days of culture and the microcarriers remained stable for an additional 4-9 days.
Moreover, the alginate bead core could be dissolved with EDTA yielding a monolayer
cell collagen matrix (Gröhn et al. 1997).
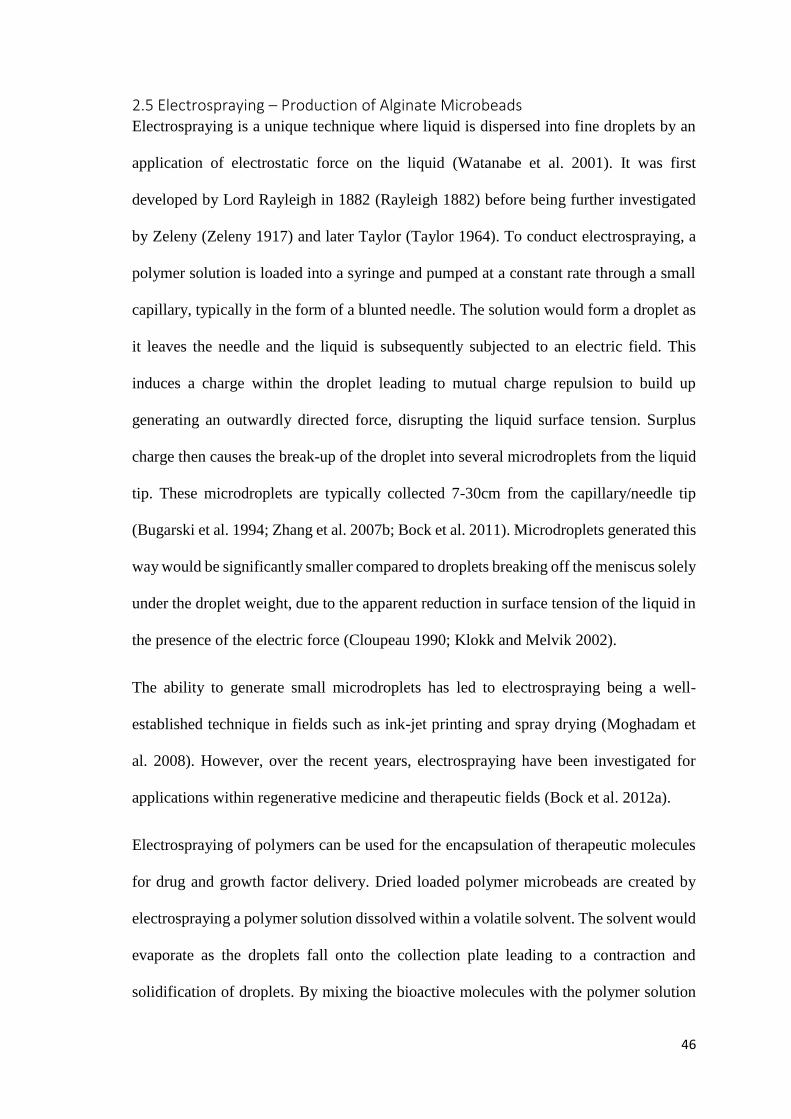
46
2.5 Electrospraying – Production of Alginate Microbeads Electrospraying is a unique technique where liquid is dispersed into fine droplets by an
application of electrostatic force on the liquid (Watanabe et al. 2001). It was first
developed by Lord Rayleigh in 1882 (Rayleigh 1882) before being further investigated
by Zeleny (Zeleny 1917) and later Taylor (Taylor 1964). To conduct electrospraying, a
polymer solution is loaded into a syringe and pumped at a constant rate through a small
capillary, typically in the form of a blunted needle. The solution would form a droplet as
it leaves the needle and the liquid is subsequently subjected to an electric field. This
induces a charge within the droplet leading to mutual charge repulsion to build up
generating an outwardly directed force, disrupting the liquid surface tension. Surplus
charge then causes the break-up of the droplet into several microdroplets from the liquid
tip. These microdroplets are typically collected 7-30cm from the capillary/needle tip
(Bugarski et al. 1994; Zhang et al. 2007b; Bock et al. 2011). Microdroplets generated this
way would be significantly smaller compared to droplets breaking off the meniscus solely
under the droplet weight, due to the apparent reduction in surface tension of the liquid in
the presence of the electric force (Cloupeau 1990; Klokk and Melvik 2002).
The ability to generate small microdroplets has led to electrospraying being a well-
established technique in fields such as ink-jet printing and spray drying (Moghadam et
al. 2008). However, over the recent years, electrospraying have been investigated for
applications within regenerative medicine and therapeutic fields (Bock et al. 2012a).
Electrospraying of polymers can be used for the encapsulation of therapeutic molecules
for drug and growth factor delivery. Dried loaded polymer microbeads are created by
electrospraying a polymer solution dissolved within a volatile solvent. The solvent would
evaporate as the droplets fall onto the collection plate leading to a contraction and
solidification of droplets. By mixing the bioactive molecules with the polymer solution
47
beforehand would yield loaded microbeads following the electrospraying process (Bock
et al. 2012a).
One of the most common polymers electrosprayed is sodium alginate for the production
of calcium alginate beads which would be a main focus of this study. Alginate
microdroplets generated from the electric field are typically gelled within a CaCl2 bath
below the capillary tip (Fig 2.12) (Klokk and Melvik 2002). The small diameter of the
microbeads created provides a high surface area to volume ratio. Hence, alginate
microbeads provides plenty of applications such as cell encapsulation (Gasperini et al.
2013), drug delivery (Suksamran et al. 2009), microcarriers (Gröhn et al. 1997) and
several other bioprocess applications.
Fig 2.12. Creation of calcium alginate microbeads through electrospraying. Alginate solution is pumped through a syringe needle attached to a high voltage generator. The electric field causes the alginate leaving the needle tip to be broken up into tiny droplets falling into a CaCl2 gelling bath. Figure modified from Park et al (Park et al. 2012). Reprinted with permission from (Park et al. 2012) license number 4576040498795.
48
The size of the droplets produced during electrospraying is determined by several
parameters, including: voltage applied, electrode distance, the conductivity and viscosity
of the polymer solution (Cloupeu and Prunet-Foch 1989; Ku and Kim 2002). Voltage is
the most commonly investigated parameter as it has the most direct effect on the
electrostatic force on the droplets (Zhang and He 2009; Bock et al. 2012b; Gasperini et
al. 2013). A higher voltage would generate smaller droplets (Bugarski et al. 1994;
Moghadam et al. 2013; Gasperini et al. 2013) due to an increase in accumulated charge
and hence a greater electrostatic force within the liquid, overcoming the droplet surface
tension at a faster rate compared to lower voltages (Zhang et al. 2007a). Similarly the
electrode distance affects the overall electrostatic force applied to the liquid. A lower
electrode distance would generate higher electric field strength lowering droplet diameter
(Zhang et al. 2007a). Typically, the needle tip acts as the positive electrode (Bugarski et
al. 1994; Gasperini et al. 2013), while the ground electrode is typically connected to the
collector (Goosen et al. 2000; Manojlovic et al. 2006; Kim et al. 2009). However, a
conductive ring or disk, attached above the collecting dish have also been utilized as a
ground electrode (Moghadam et al. 2008).
Aside from voltage and electrode distance, the physical properties of the polymer such as
viscosity and conductivity also effect the rate the droplets leave the needle tip. Viscosity
of the solution affects the jet breakup (Bock et al. 2012b). For electrospraying to occur,
the viscosity of the solution is required to be below a certain threshold. Above said
threshold, the jet would elongate into fibres rather than droplets in a process called
electrospinning (Husain et al. 2016). On the other hand, conductivity affects the charge
build up within the droplets. A polymer with higher conductivity would allow a faster
charge build up within the droplet compared to polymers of lower conductivity (Bock et
al. 2012b). However, a higher conductivity would also favour the production of elongated
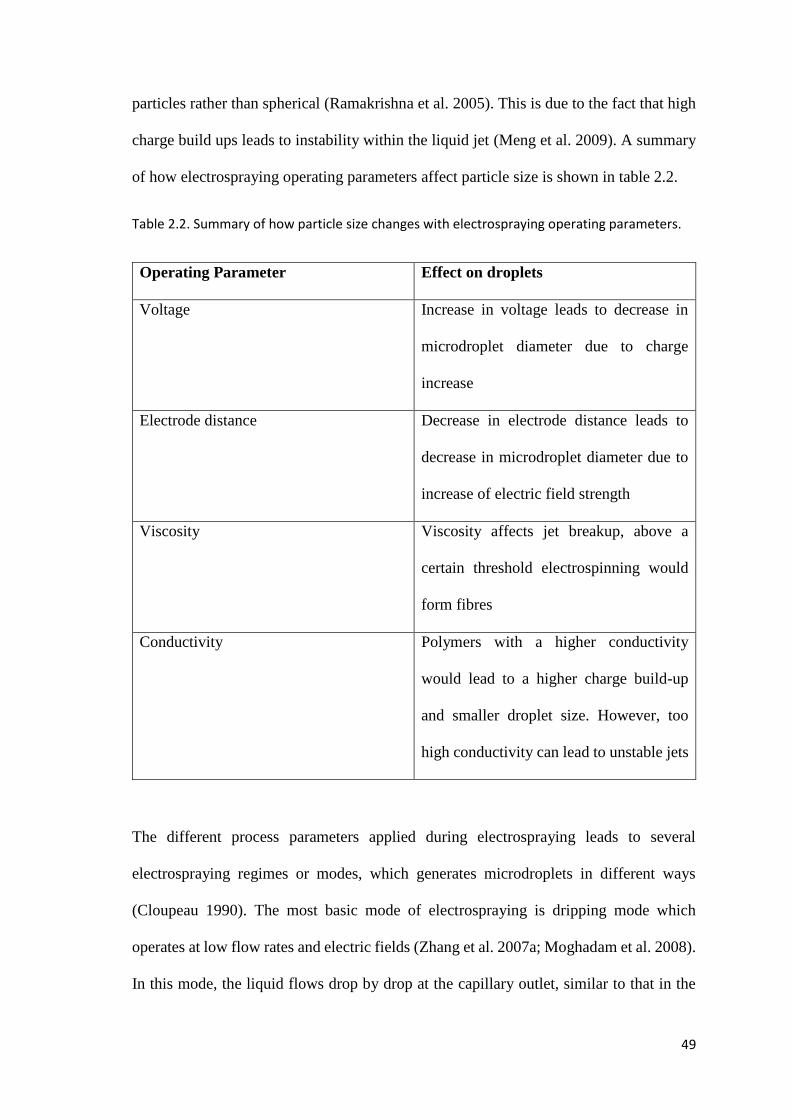
49
particles rather than spherical (Ramakrishna et al. 2005). This is due to the fact that high
charge build ups leads to instability within the liquid jet (Meng et al. 2009). A summary
of how electrospraying operating parameters affect particle size is shown in table 2.2.
Operating Parameter Effect on droplets
Voltage Increase in voltage leads to decrease in
microdroplet diameter due to charge
increase
Electrode distance Decrease in electrode distance leads to
decrease in microdroplet diameter due to
increase of electric field strength
Viscosity Viscosity affects jet breakup, above a
certain threshold electrospinning would
form fibres
Conductivity Polymers with a higher conductivity
would lead to a higher charge build-up
and smaller droplet size. However, too
high conductivity can lead to unstable jets
The different process parameters applied during electrospraying leads to several
electrospraying regimes or modes, which generates microdroplets in different ways
(Cloupeau 1990). The most basic mode of electrospraying is dripping mode which
operates at low flow rates and electric fields (Zhang et al. 2007a; Moghadam et al. 2008).
In this mode, the liquid flows drop by drop at the capillary outlet, similar to that in the
Table 2.2. Summary of how particle size changes with electrospraying operating parameters.

50
absence of an electric field. However, the presence of an electric field generates smaller
droplets as well as increases the frequency of droplets as the electric force overcomes the
surface tension faster than the weight of the droplet alone (Cloupeau and Prunet-Foch
1994; Jaworek and Krupa 1998). The alginate droplet size and frequency under dripping
mode electrospraying was captured using a high speed camera in a previous study. As
the voltage increases, the increasing electric field leads to a decrease in droplet size as
well as increasing droplet frequencies (Fig 2.13). However, the increase in voltage causes
the mutual repulsive charges to suppress the surface tension creating a long neck between
the primary droplet and needle tip. This would form satellite droplets after the main
droplet breaks off (Fig 2.13 – 6kV). Further increase of the voltage causes the droplet to
become unstable leading to a whipping behaviour (Fig 2.13 – 10 & 12 kV) (Xie and
Wang 2007).
At low flow rates the dripping mode would transition to a microdripping mode. Unlike
the dripping mode where the meniscus contracts following each droplet detachment, a
stable meniscus is formed in microdripping mode and a small droplet detaches from the
end of the meniscus (Jaworek and Krupa 1998). The droplets produced via this mode is
significantly smaller compared to the capillary outlet. Moreover, the frequency of droplet
emission is significantly higher compared to the conventional dripping mode (Cloupeau
1990).

51
0k
V
12k
V
4k
V
6k
V
8k
V
10k
V
Fig 2.13. Dripping mode electrospraying with increasing voltage (0kV, 4kV, 6kV, 8kV, 10kV, 12kV).
Dripping frequency increases as voltage is increased. Satellite droplets were seen at 6kV, created
when the main droplet breaks off from the meniscus. At higher voltages (10kV and 12kV) nozzle
vibration created jet instability and a whipping behaviour was observed which made it difficult to
observe droplets. Reprinted with permission from (Xie and Wang 2007) license number
4410201197001.
52
Cone jet mode electrospraying is the most developed mode of electrospraying and is
utilized in several studies (Goosen et al. 2000; Hartman et al. 2000; Bock et al. 2012a).
At higher electric fields compared to the dripping mode (Moghadam et al. 2008), the
electric field causes the liquid meniscus to transform into a axisymmetric cone (Jaworek
and Krupa 1998). This structure is known as the Taylor’s cone, first defined by Taylor in
1964 (Taylor 1964). As the electric field is increased there is an acceleration of liquid in
the cone creating a liquid jet at the apex of the cone. Excess charges eventually dissipates
due to mutual repulsion causing breakup of the jet into droplets (Cloupeu and Prunet-
Foch 1989; Hartman et al. 2000). The shape of the cone jet varies with the conductivity
of the liquid. In liquids with high conductivities the jet formation zone is limited to the
apex of the meniscus (Fig 2.14a). On the other hand, the acceleration zone would extend
further for liquids with lower conductivity (Fig 2.14b) (Cloupeau and Prunet-Foch 1994).
The popularity of the cone jet mode is due to its ability to create microdroplets
significantly smaller compared to the inner diameter of the capillary with a low standard
deviation (Agostinho et al. 2012b), with droplet sizes as low as 20µm being generated
(Cloupeu and Prunet-Foch 1989). In addition to the small bead size formed, the cone jet
mode could generate the a very large range of droplet sizes through modifying the
electrospraying parameters (Cloupeau and Prunet-Foch 1994). Hence this mode allows
suitable sized microbeads to be created for several bioprocess applications such as drug
delivery, cell encapsulation and microcarriers.

53
The main draw back of both the cone jet mode and dripping mode is the low operating
flow rates (Cloupeu and Prunet-Foch 1989). This limits the application of electrospraying
in industry, as the flow rates for the aforementioned modes are too low for processes such
as cooling towers, thermal desalination and spray drying (Agostinho et al. 2012b). In
order to overcome this limitation, another electrospraying mode, the simple jet mode
which operates at a higher flow rate compared to cone jet and dripping modes, has
recently been explored (Agostinho et al. 2012a). Under the simple jet mode, the flow rate
through the nozzle is increased so a constant stream of liquid jet is formed prior to the
application of an electric field (Fig 2.15) (Cloupeau 1990; Agostinho et al. 2012b).
However, due to the higher inertia within the liquid jet compared to the droplets in
dripping mode or the cone in cone jet mode, the electric field would only have a minor
A B
Fig 2.14. The meniscus transforms into a Taylors cone during cone jet mode. The excess charges
causes a jet to accelerate from the Taylors cone. This acceleration is based on the conductivity
of the liquid. A) At high conductivities, the jet formation is limited to the apex of the Taylors
cone before breaking into droplets. B) On the other hand, at low conductivities the acceleration
zone would extend further away from the apex. Reprinted with permission from (Cloupeu and
Prunet-Foch 1989) license number 4410201494891.

54
influence on the jet and hence creating droplet sizes significantly larger compared to those
created using cone jet mode (Agostinho et al. 2012a).
The high flow rates applied would increase the rate of droplet formation overcoming the
drawbacks of the cone jet and dripping modes. Several studies have investigated the
behaviour of water while operating under simple jet mode, where uniform water droplets
were generated under high throughput (Agostinho et al. 2012a, 2013). However, very few
studies have examined the behaviour or alginate, a non-Newtonian liquid, under simple
jet mode electrospraying (Moghadam et al. 2008). Therefore this would be in mode of
choice for this study.
A B C
Fig 2.15. Electrospraying of de-ionized water at increasing voltages in simple jet mode. A) Under no
voltage, the flow rate is increased until a constant liquid jet is observed. B & C) As an electric field
is applied, the jet breaks up into charged droplets, generating microdroplets with high throughput.
Reprinted with permission from (Agostinho et al. 2012b) license number RNP/18/AUG/006891.
55
2.6 Chitosan and Genipin
2.6.1 Chitosan
Chitin is a polymer consisting of N-acetyl D glucosamine (Fig 2.16). It is synthesized in
several organisms such as shellfish and shrimps as well as in fungi and yeast. Unlike the
animal variant, the fungal variant lack batch to batch variability and due to controlled
production all year (Wu et al. 2004). Hence, due to the wide variety of sources, chitin is
the 2nd most abundant polymer in the world (Rinaudo 2006). One of the most common
derivatives of chitin is chitosan, formed through the de-acetylation of the N-acetyl D-
glucosamine groups in chitin under alkaline conditions producing D-glucosamine (Fig
2.16) (Croisier and Jérôme 2013). The degree of de-acetylation could vary between
different chitosan products however the commercial range is typically between 50-90%
(Madihally and Matthew 1999).
Chitosan is insoluble at pH 7 as it exists as a crystalline polymer. However, unlike chitin,
chitosan is soluble under acidic solutions. This is due to the protonation of the NH2 group
at the C-2 position of the D-glucosamine, as a result, transforming the polysaccharide
into a polyelectrolyte (Madihally and Matthew 1999; Rinaudo 2006).
Chitosan is generally considered non-toxic and biocompatible (Chandy and Sharma’
1990) and has been approved by the FDA for tissue engineering, drug delivery and wound
healing purposes (Wedmore et al. 2006; Mohammed et al. 2017). The advantage of
chitosan over other biopolymers such as gelatin or collagen is that it is not made from
mammalian products which have a higher risk of spreading infectious diseases (Gorgieva
and Kokol 2011).
The structure of chitosan is similar to glycosaminoglycan found within the extracellular
matrix (Yang et al. 2009). Due to this, chitosan sponges form the basis of several scaffolds
for MSC culture. MSCs have successfully been cultured on porous freeze dried chitosan

56
microbeads and cells were able to proliferate on the chitosan surface (Maeng et al. 2009).
It has also been reported that MSCs grown on chitosan membranes retain a better stem
cell phenotype at the end of the culture compared to conventional 2D culture within tissue
culture flasks (Li et al. 2013).
Due to the polycationic nature of chitosan, chitosan-based hydrogels can be formed
through interaction with polyanions (Croisier and Jérôme 2013), such as alginate
microbeads, creating polyelectrolytic complexes (Gåserød and Skja 1998). As alginate
discourages cell adhesion due to the lack of surface adhesive properties (Lee and Mooney
2012), chitosan coating would promote cell anchorage and interaction with the bead
surface for potential use as microcarriers (Li et al. 2014). Moreover, the chitosan coating
layer would increase the mechanical stability of the beads (Ribeiro et al. 1999). This
property have been utilized to increase the stability as well as half-lives of bioactive
molecules for delivery to a specific target site in vivo. As demonstrated in a study by Hari
et al, orally delivered alginate chitosan beads containing albumin retained 70% of the
payload following the encapsulation process. On the other hand, less than half of the
original levels of albumin was retained following encapsulation with alginate beads
without coating. During release of the payload at the target size, it was found that the
chitosan coating increased the albumin delivery. This was due to the increased payload
as well as the modification of alginate structure caused by chitosan (Hari et al. 1996).
Similarly, another report demonstrated DNA encapsulated within chitosan coated
alginate beads displayed a more controlled released profile compared to alginate beads
(Thumsing 2013).
On the other hand, due to chitosan only exhibiting ionic properties under acidic
conditions, chitosan hydrogels or scaffolds are reported to be unstable within
physiological conditions and could undergo uncontrolled disintegration as well as being
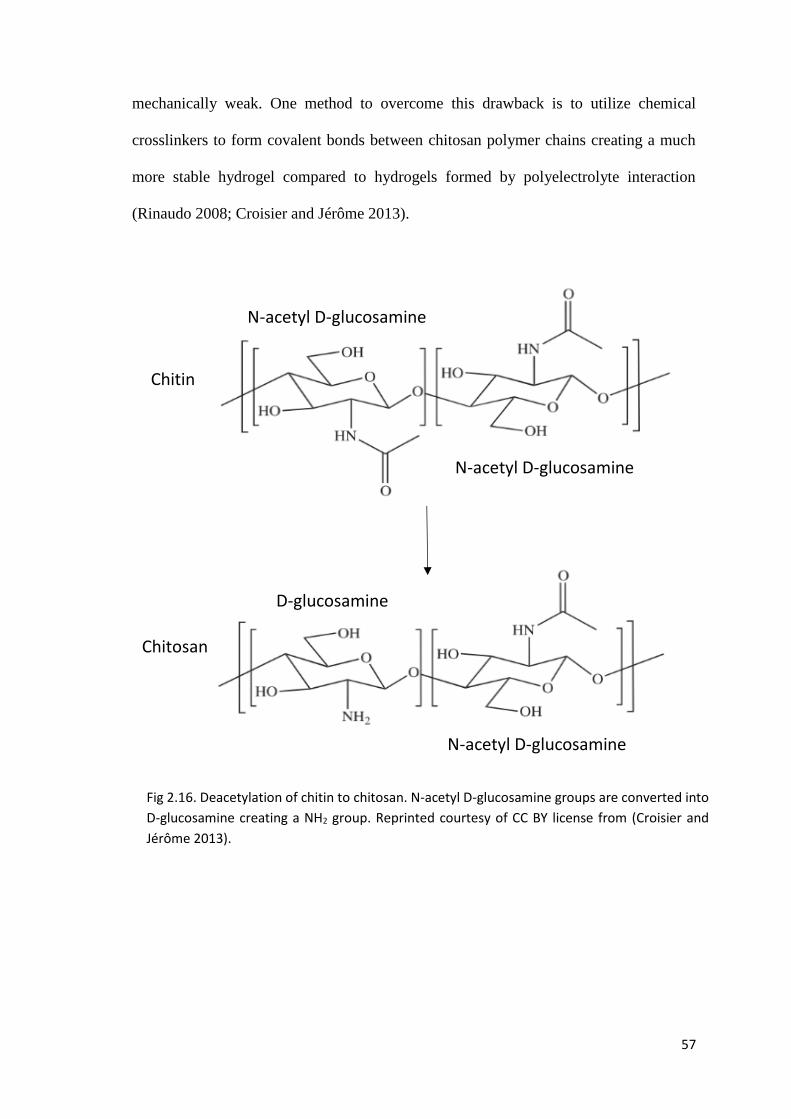
57
mechanically weak. One method to overcome this drawback is to utilize chemical
crosslinkers to form covalent bonds between chitosan polymer chains creating a much
more stable hydrogel compared to hydrogels formed by polyelectrolyte interaction
(Rinaudo 2008; Croisier and Jérôme 2013).
Deacetylation
N-acetyl D-glucosamine
D-glucosamine
N-acetyl D-glucosamine
N-acetyl D-glucosamine
Chitin
Chitosan
Fig 2.16. Deacetylation of chitin to chitosan. N-acetyl D-glucosamine groups are converted into
D-glucosamine creating a NH2 group. Reprinted courtesy of CC BY license from (Croisier and
Jérôme 2013).

58
2.6.2 Genipin
Glutaraldehyde has been generally used for crosslinking and stabilization of tissue
engineering grafts and scaffolds and there is extensive clinical knowledge on its long
term use as a crosslinker (Yoo et al. 2011; Manickam et al. 2014) despite the fact that
glutaraldehyde have demonstrated several cytotoxic effects (Gough et al. 2002). Hence,
recently studies have shifted to the exploration of natural crosslinkers.
One of the most studied natural crosslinkers is genipin, which is a natural glucone
extracted from the ripe Genipa Americana fruits (Djerassi et al. 1960) as well as within
the bark of Eucommia ulmoides, the latter being a component which is officially listed in
the Chinese Pharmacopoeia (Li et al. 2015b). Genipin was typically associated with high
costs due to its limited source and difficult extraction process by chemical procedures
(Zhao and Sun 2018). However, genipin could now be isolated in large quantities using
a microbiological process leading to a low cost and low environmental impact procedure
(Muzzarelli 2009). Hence, genipin has been widely used in herbal medicine due to its
anti-inflammatory (Koo et al. 2004) and anticancer (Cao et al. 2010) properties leading
to genipin being approved for pharmaceutical use in Japan, Korea, Taiwan and South
East Asia (Adikwu and Esimone 2009). This has led to the development of Inchin-koto,
a clinically approved genipin based drug developed in Japan for liver treatment
(Yamamoto et al. 2000; Yamashiki et al. 2000).
Genipin forms bonds with the amine (NH2) groups of the chitosan creating a tertiary
amine bond, following which crosslinking occurs either through polymerization of
genipin or the formation of a secondary amide linkage with another chitosan polymer
(Fig 2.17) (Muzzarelli 2009; Lai et al. 2010). The crosslinking process increases the
stiffness and surface roughness of the chitosan hydrogel which enables cells to attach and
spread on the surface, as well as enhances the hydrogel stability (Muzzarelli 2009; Gao
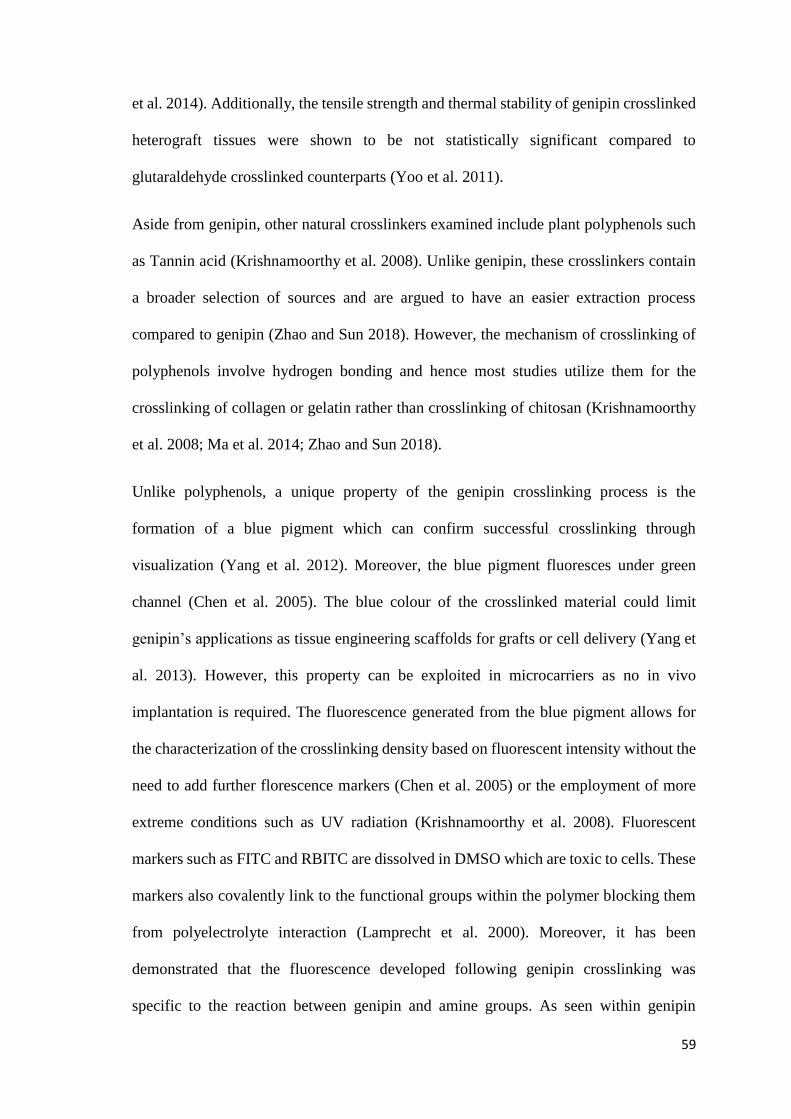
59
et al. 2014). Additionally, the tensile strength and thermal stability of genipin crosslinked
heterograft tissues were shown to be not statistically significant compared to
glutaraldehyde crosslinked counterparts (Yoo et al. 2011).
Aside from genipin, other natural crosslinkers examined include plant polyphenols such
as Tannin acid (Krishnamoorthy et al. 2008). Unlike genipin, these crosslinkers contain
a broader selection of sources and are argued to have an easier extraction process
compared to genipin (Zhao and Sun 2018). However, the mechanism of crosslinking of
polyphenols involve hydrogen bonding and hence most studies utilize them for the
crosslinking of collagen or gelatin rather than crosslinking of chitosan (Krishnamoorthy
et al. 2008; Ma et al. 2014; Zhao and Sun 2018).
Unlike polyphenols, a unique property of the genipin crosslinking process is the
formation of a blue pigment which can confirm successful crosslinking through
visualization (Yang et al. 2012). Moreover, the blue pigment fluoresces under green
channel (Chen et al. 2005). The blue colour of the crosslinked material could limit
genipin’s applications as tissue engineering scaffolds for grafts or cell delivery (Yang et
al. 2013). However, this property can be exploited in microcarriers as no in vivo
implantation is required. The fluorescence generated from the blue pigment allows for
the characterization of the crosslinking density based on fluorescent intensity without the
need to add further florescence markers (Chen et al. 2005) or the employment of more
extreme conditions such as UV radiation (Krishnamoorthy et al. 2008). Fluorescent
markers such as FITC and RBITC are dissolved in DMSO which are toxic to cells. These
markers also covalently link to the functional groups within the polymer blocking them
from polyelectrolyte interaction (Lamprecht et al. 2000). Moreover, it has been
demonstrated that the fluorescence developed following genipin crosslinking was
specific to the reaction between genipin and amine groups. As seen within genipin
60
crosslinked alginate chitosan beads, fluorescence was not observed in both alginate beads
in genipin solution and uncrosslinked alginate chitosan beads (Fig 2.18) (Chen et al.
2006). This would also act as confirmation of successful polyelectrolyte reaction between
alginate and chitosan. On the other hand, fluorescent markers such as FTIC would react
with the OH groups present in alginate (Chen et al. 2005).
Genipin has been shown in several studies to be extremely biocompatible. Decellularized
porcine liver matrices were crosslinked with either genipin or glutaraldehyde were
compared for biocompatibility in rats. Matrixes crosslinked with glutaraldehyde induced
a significantly higher immune response compared to genipin counterparts. Furthermore,
following seeding of cell lines onto the matrices in vitro, cells attached in a more uniform
pattern and higher numbers on the genipin crosslinked matrix compared to the matrixes
B
A
C
Fig 2.17. Crosslinking reaction of chitosan with genipin. A) Genipin first reacts with the amine
group of chitosan creating a chitosan-genipin monomer. Crosslinking occurs either through B)
polymerization of the monomers or C) replacement of the ester group with a secondary amide
linkage. Reprinted courtesy of CC BY license from (Lai et al. 2010).
61
crosslinked with glutaraldehyde (Wang et al. 2016). In another study both cellular and
acellular bovine pericardia were crosslinked with genipin or glutaraldehyde prior to
implantation into a growing rat model. The genipin-fixed tissues displayed significantly
lower inflammatory reactions compared to the glutaraldehyde control. This was due to
the better microenvironment for tissue regeneration provided by genipin due to its lower
cytotoxicity (Chang et al. 2002). In an in vitro study, L929 fibroblasts were successfully
grown on 2D crosslinked chitosan genipin hydrogels. Results from a MTT assay showed
that the hydrogels displayed excellent biocompatibility and cell proliferation capabilities
(Gao et al. 2014).

62
Wh
ite
fiel
d
Gre
en C
han
nel
Fig 2.18. Microbeads under whitefield (A, C and E) and green channel (B, D and E). A & B) Genipin
crosslinked alginate chitosan beads, a clear fluorescence coat was seen in the coating layer
showing genipin crosslinking. C & D) Alginate microbeads in genipin solution. E & F) Chitosan
coated alginate beads without crosslinker. Both of these beads displayed only background
fluorescence under the green channel. Scale bar shows 200µm. Reprinted with permission from
(Chen et al. 2006) Copyright (2006) American Chemical Society.

63
Chapter 3 Creation and Development of Genipin Crosslinked
Alginate-Chitosan Microcarriers
3.1 Introduction This chapter focuses on optimizing the production parameters to develop genipin
crosslinked alginate-chitosan microcarriers. Alginate microbeads were created using
simple jet mode electrospraying. Unlike the more conventional cone jet mode, the simple
jet mode utilized high flow rates to form a constant jet of alginate, prior to introducing
the electric field (Agostinho et al. 2012a). This increases the production rate of alginate
beads and hence the subsequent microcarrier production.
Alginate acts as a good base material for the microcarrier core due to its biocompatibility,
gel formation under mild conditions and transparency allowing easy imaging of cells.
However, alginate discourages cell adhesion due to the lack of surface adhesive
properties (Lee and Mooney 2012) and is unstable in non-calcium rich environments
(Bajpai and Kirar 2016). Hence the alginate bead surface was coated with chitosan.
Chitosan was selected due to its non-mammalian nature compared to gelatin or collagen
as well as its potential to provide cell attachment proteins on the microcarrier surface
(Croisier and Jérôme 2013). As the chitosan coating layer may be unstable under
physiological pH, as described in chapter 2, genipin was selected as a crosslinker for the
chitosan coating layer. Genipin was preferred over other crosslinkers due to its
biocompatibility, its approval for pharmaceutical use in several countries (Adikwu and
Esimone 2009) as well as its ability to fluoresce following crosslinking (Chen et al. 2006).
This feature allows the effect of microcarrier production parameters on the degree of
crosslinking and coating layer thickness to be assessed through the green fluorescence
emitted from the chitosan-genipin conjugates. The production parameters investigated in
this study were pH of chitosan, chitosan coating time, concentration of chitosan,
crosslinking time and temperature.
64
Finally, as various temperatures were employed during crosslinking, the effect of the
rheological properties of chitosan when exposed at different temperatures was
subsequently investigated. Previous reports show chitosan to uncontrollably decompose
at elevated temperatures causing depolymerisation, altering molecular weight, viscosity
and solubility (No et al. 2003; Szymańska and Winnicka 2015). This could therefore
affect the final stability of the microcarriers.
3.2 Materials Sodium alginate (A2033) with viscosity >2000 cP and the M/G ratio of 61/39, 97%
anhydrous calcium chloride (CaCl2), sodium chloride (NaCl), 200nm polystyrene
nanobeads, low molecular weight chitosan and sodium hydroxide (NaOH) were
purchased from Sigma Aldrich (USA). Acetic acid was purchased from Fisher Scientific
(USA). Genipin was purchased from Challenge Bioproducts (Taiwan). 30 gauge (G)
needles were purchased from BD (USA). Deionised water (DI water) used in this study
was obtained from Elix, Millipore (USA) ultrapure water purification system while
0.45µm pore filters were also obtained from Millipore (USA).
3.3 Methods
3.3.1 Electrospraying
Sodium alginate was dissolved in a 0.9% (w/v) NaCl solution to obtain a final
concentration of 1% (w/v). The solution was subsequently filtered through a 0.45µm pore
filter before being introduced into a 5ml syringe and extruded through a blunt 30G blunt
needle. The flow rate was adjusted to 3ml/min, the minimum flow rate at which a constant
alginate jet will form. Voltage was applied to the needle via a high voltage power supply
(model 73030, Genvolt, UK). A metal ring connected to the ground electrode was placed
below the needle. Alginate microdroplets were generated by the jet breakup and gelled
within a 0.1M CaCl2 bath, 10cm below the needle tip for 1 hour. The electrospraying
setup is presented in Fig. 3.1.

65
Voltages applied were 3.5kV, 4.5kV, 5.5kV, 6.5kV, 7.5kV and 8.5kV. The distance
between the needle tip and the ground ring was set to either 4.5cm or 2.5cm. An optimal
voltage and electrode distance was chosen based on the bead diameters obtained.
Experiments were repeated 3 times with each repeat performed on a different day with a
different alginate solution and a new needle. The images of beads were captured using a
Nikon TiE 2000 (Japan) fluorescence microscope. The diameter and circularity of beads
were measured using ImageJ (National Institutes of Health, US) software and the
diameter and circularity of 30 beads were selected randomly from the 3 repeats. Bead
circularity was defined as (ImageJ 2018):
𝐶𝑖𝑟𝑐𝑢𝑙𝑎𝑟𝑖𝑡𝑦 =4𝜋(𝐵𝑒𝑎𝑑 𝐴𝑟𝑒𝑎)
(𝐵𝑒𝑎𝑑 𝑃𝑒𝑟𝑖𝑚𝑒𝑡𝑒𝑟)2 (3.1)
1
2
4
3
5
Fig 3.1. Electrospraying setup. 1) Alginate supply from syringe pump, 2) positive electrode
attached to blunted needle, 3) ground ring electrode, 4) rotatable metal dish to catch initial
droplets before a continuous jet was formed, 5) calcium chloride gelling bath. Reprinted from
(Chui et al. 2019), permission not required as author of paper.
66
3.3.2 Chitosan Coating and Genipin Crosslinking
Figure 3.2 describes the microcarrier production process. The alginate microbeads were
created via electrospraying (as described above). Subsequently, the beads were coated in
0.3, 1 or 2% (w/v) chitosan solution containing 0.1M acetic acid and 0.1M CaCl2. The
beads were agitated during the coating process using a Stuart Orbital Shaker (Fisher
Scientific, USA) at a speed of 90 RPM. This provides an easy agitation method which
does not introduce external equipment into the solution such as magnetic stirrers. Coating
times were set to either 1 hour, 2 hours, 5 hours or 24 hours. pH of chitosan solution was
either adjusted to 5, using 1M sodium hydroxide or left unchanged at 3.9. The resulting
alginate-chitosan microbeads were washed with DI water 3 times.
The alginate-chitosan beads were crosslinked by immersing in a 1mg/ml genipin solution
at 37°C for 24 and 48 hours or 60°C for 4 hours. The resulting microcarriers were
collected and washed with DI water 3 times.
Microcarriers crosslinked at 37°C for 48 hours will henceforth be referred to as ALXL37
while microcarriers crosslinked at 60°C for 4 hours will be referred to as ALXL60.

67
A Alginate-chitosan beads
Alginate beads
Genipin crosslinked alginate-chitosan microcarriers
B
C
D
Fig 3.2. Production of genipin crosslinked alginate-chitosan microcarriers: A) electrospraying
of alginate beads, B) coating in chitosan solution, C) crosslinking of chitosan coated alginate
beads with genipin, D) genipin crosslinked alginate-chitosan microcarriers.

68
3.3.3 Microscope Imaging and Fluorescence Analysis
The microcarrier diameter and crosslinking density were investigated using a Nikon TiE
2000 (Japan) fluorescence microscope. During image acquisition the alginate and
alginate-chitosan microbeads were stored within DI water while genipin crosslinked
alginate-chitosan microcarriers were within 1mg/ml genipin solution. Microcarriers were
imaged under a green fluorescence channel and a brightfield channel. A green
fluorescence intensity profile corresponding to a line across the focal plane of a single
bead was acquired using the NIH Elements Advance software (Nikon, Japan) under a
constant shutter exposure length of 2s. Background fluorescence of the storage solution
was subtracted from the total fluorescence of the beads. The coating layer thickness of
each bead was measured and the average fluorescence intensity across the length of the
coating layer was calculated. The analysis was performed using NIH Elements Advance.
A total of 3 batches of microcarriers were created with the analysis being conducted on
7 randomly selected beads from each batch (n=21).
3.3.4 Rheological Test
In order to mimic the crosslinking procedure, 1% (w/v) chitosan solution at pH 5 was
heated at 37°C for 48 hours or for 4 hours at either 60°C or 80°C. Chitosan solution stored
at room temperature was used as a control. The solutions were allowed to cool to room
temperature and subsequently mixed at a 9:1 (volume) ratio with a suspension of 10%
polystyrene nanobeads (200nm diameter) (Sigma, USA). The chitosan and particle
mixture were placed within a 5 mm thick cuvette and complex viscosity, complex
modulus (G*), storage modulus (G1) and loss modulus (G2) were measured using DWS
Rheolab (LS Instruments, Switzerland) at 37°C. Rheological values were compared at a
frequency of 100Hz. The experiments were performed 3 times.

69
3.3.5 Statistical Analysis
A one way ANOVA with Post-Hoc Tukey analysis was performed to investigate
significant changes in fluorescence intensity and coating layer values based on the
different production parameters. The same test was used to assess differences in
rheological properties of chitosan exposed to various temperatures.
A two way ANOVA test with Post-Hoc Tukey analysis was used to determine whether
voltage and electrode distance had a significant effect on bead diameter following
electrospraying.
All of the above analyses was conducted through GraphPad Prism 6 (GraphPad Software.
Inc, USA).
For all analyses p<0.05 was deemed significant.
3.4 Results and Discussion
3.4.1 Pure Jetting Mode with No Voltage Leads to a Wide Distribution of Bead Diameter
Alginate beads created under no voltage were used as a negative control (Fig 3.3A). An
alginate jet was directly pumped into the gelling bath. Beads generated had an average
diameter of 0.34mm, with a standard deviation of 0.12, yielding a relative standard
deviation (RSD) of the diameter of 35%. The high RSD was due to the two
subpopulations of beads, with larger beads around 400µm in diameter and smaller beads
at around 150µm (Fig 3.3A). The two subpopulations were formed from splashing of the
alginate jet upon impact with the gelling bath producing satellite droplets. These satellite
droplets would gel forming the smaller subpopulation of microbeads. Hence, alginate
beads created under no voltage would not be suitable for microcarrier culture due to the
unpredictability of the size of the beads. This would lead to an uneven distribution of
cells on the beads as well as difficulty of fluidization within bioreactor systems.
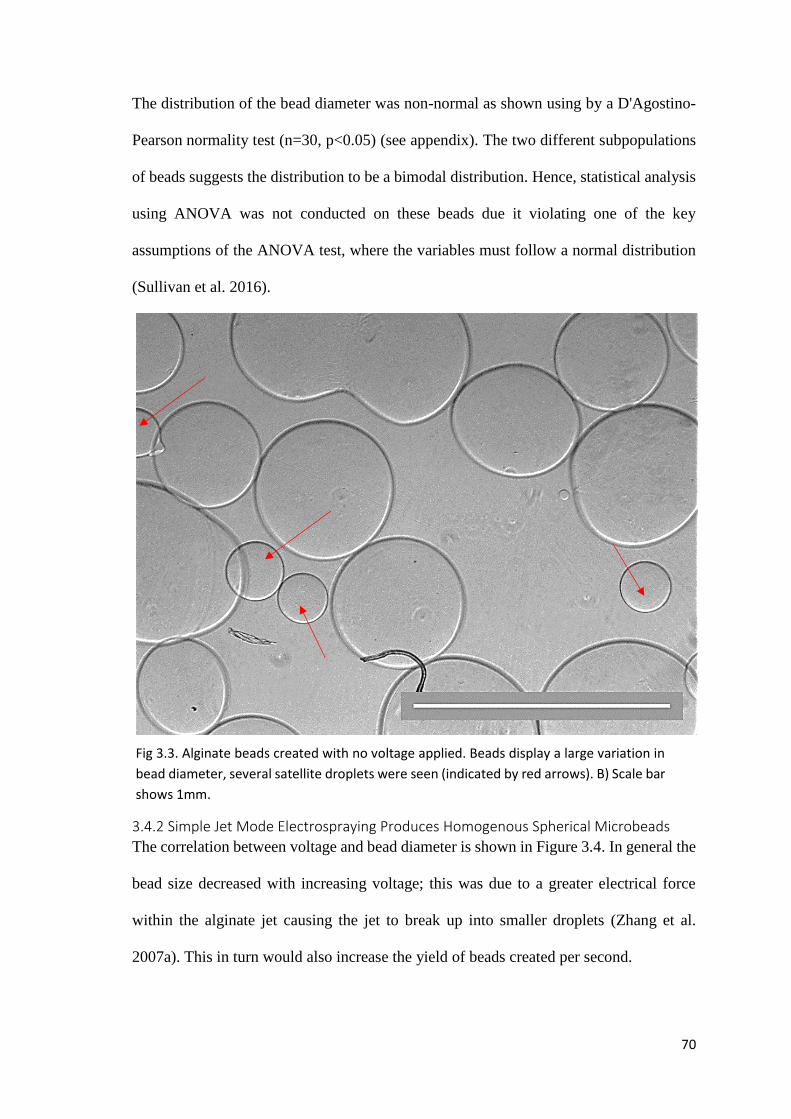
70
The distribution of the bead diameter was non-normal as shown using by a D'Agostino-
Pearson normality test (n=30, p<0.05) (see appendix). The two different subpopulations
of beads suggests the distribution to be a bimodal distribution. Hence, statistical analysis
using ANOVA was not conducted on these beads due it violating one of the key
assumptions of the ANOVA test, where the variables must follow a normal distribution
(Sullivan et al. 2016).
3.4.2 Simple Jet Mode Electrospraying Produces Homogenous Spherical Microbeads
The correlation between voltage and bead diameter is shown in Figure 3.4. In general the
bead size decreased with increasing voltage; this was due to a greater electrical force
within the alginate jet causing the jet to break up into smaller droplets (Zhang et al.
2007a). This in turn would also increase the yield of beads created per second.
Fig 3.3. Alginate beads created with no voltage applied. Beads display a large variation in
bead diameter, several satellite droplets were seen (indicated by red arrows). B) Scale bar
shows 1mm.
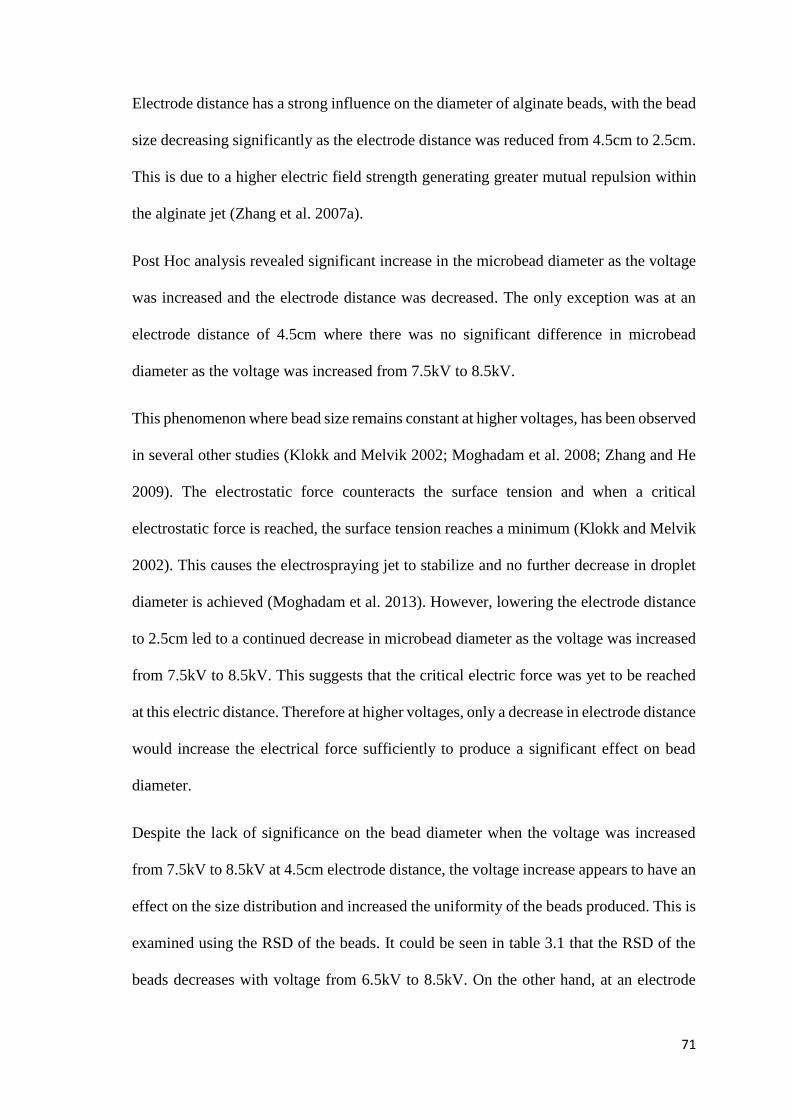
71
Electrode distance has a strong influence on the diameter of alginate beads, with the bead
size decreasing significantly as the electrode distance was reduced from 4.5cm to 2.5cm.
This is due to a higher electric field strength generating greater mutual repulsion within
the alginate jet (Zhang et al. 2007a).
Post Hoc analysis revealed significant increase in the microbead diameter as the voltage
was increased and the electrode distance was decreased. The only exception was at an
electrode distance of 4.5cm where there was no significant difference in microbead
diameter as the voltage was increased from 7.5kV to 8.5kV.
This phenomenon where bead size remains constant at higher voltages, has been observed
in several other studies (Klokk and Melvik 2002; Moghadam et al. 2008; Zhang and He
2009). The electrostatic force counteracts the surface tension and when a critical
electrostatic force is reached, the surface tension reaches a minimum (Klokk and Melvik
2002). This causes the electrospraying jet to stabilize and no further decrease in droplet
diameter is achieved (Moghadam et al. 2013). However, lowering the electrode distance
to 2.5cm led to a continued decrease in microbead diameter as the voltage was increased
from 7.5kV to 8.5kV. This suggests that the critical electric force was yet to be reached
at this electric distance. Therefore at higher voltages, only a decrease in electrode distance
would increase the electrical force sufficiently to produce a significant effect on bead
diameter.
Despite the lack of significance on the bead diameter when the voltage was increased
from 7.5kV to 8.5kV at 4.5cm electrode distance, the voltage increase appears to have an
effect on the size distribution and increased the uniformity of the beads produced. This is
examined using the RSD of the beads. It could be seen in table 3.1 that the RSD of the
beads decreases with voltage from 6.5kV to 8.5kV. On the other hand, at an electrode

72
distance of 2.5cm, RSD decreases with increasing voltage from 3.5kV to 8.5kV. This
phenomenon was also observed in other studies and suggests the stabilization of the
alginate jet under higher voltages (Gasperini et al. 2013).
Electrode Distance 2.5cm RSD
3.5 0.126
4.5 0.117
5.5 0.112
6.5 0.102
7.5 0.094
8.5 0.081
Electrode Distance 4.5cm RSD
3.5 0.130
4.5 0.139
5.5 0.121
6.5 0.129
7.5 0.120
8.5 0.092
Table 3.1. Relative standard deviation (RSD) of microbead diameter vs voltage.
73
In order to prevent deformation in the alginate bead, the sharp tip of the needles were
blunted using sand paper. This process was done manually and could potentially
introduce a source of variation between each experiment. However, when comparing the
average bead diameter obtained from the 3 bead batches, the one way ANOVA yielded a
non-significant result (see appendix). This demonstrates the reproducibility and
consistency of the electrospraying device and the variation in the needle tip had no
significant effect on the final bead diameter.
Several previous studies have demonstrated that the size of alginate microbeads produced
via cone jet mode electrospraying followed a bimodal distribution (Ku and Kim 2002;
Kim et al. 2009). This is similar to the beads created under no voltage in section 3.4.1.
However for all beads created via simple jet electrospraying, the bead diameter was
shown to follow a normal distribution (n=30, p<0.05, see appendix). Hence, the ANOVA
Fig 3.4. Alginate microbead diameter vs voltage for different electrode distances. In general,
the bead diameter significantly decreased as voltage increases. However, there was no
significant difference between bead diameter for 7.5kV and 8.5kV for beads created at an
electrode distance of 4.5cm. Bead diameter significantly decreased as electrode distance was
decreased from 2.5cm to 4.5cm. * denotes significance (n=30, p<0.05). Error bars show
standard deviation.

74
test is valid for the analysis of the effect of voltage and electrode distance on the bead
diameter. Additionally the sample size used was 30 which is considered sufficiently large
to ensure normality via the central limit theorem (Khan and Rayner 2003; Sullivan et al.
2016).
Similarly to diameter, the circularity of the beads was significantly affected by the voltage
applied. Between voltages 3.5kV and 4.5kV at an electrode distance of 2.5cm, beads
created were mostly tear or pear shaped (Fig 3.5A). However, as the voltage was
increased to 5.5kV, the beads displayed a significant increase in circularity (Fig. 3.6) due
to the transition towards spherical beads (Fig 3.5B, 3.5C). Circularity continued to
increase at higher voltages, albeit the changes were non-significant between the
circularity measured at 5.5kV-8.5kV. Despite this, the highest circularity was measured
at 7.5kV.
The differences in circularity were due to the liquid properties of the alginate droplets.
These include the surface tension, viscosity, droplet diameter and density. As reported
previously, the liquid properties could be expressed using the Ohnesorge number (Oh)
defined as (Chan et al. 2009):
𝑂ℎ =𝑣𝜌
(𝜌𝑑𝑝𝛾)0.5 (3.2)
Where
v = kinematic viscosity of the alginate
ρ = Density of the alginate solution
dp = Diameter of the alginate droplets
γ = surface tension of the alginate solution
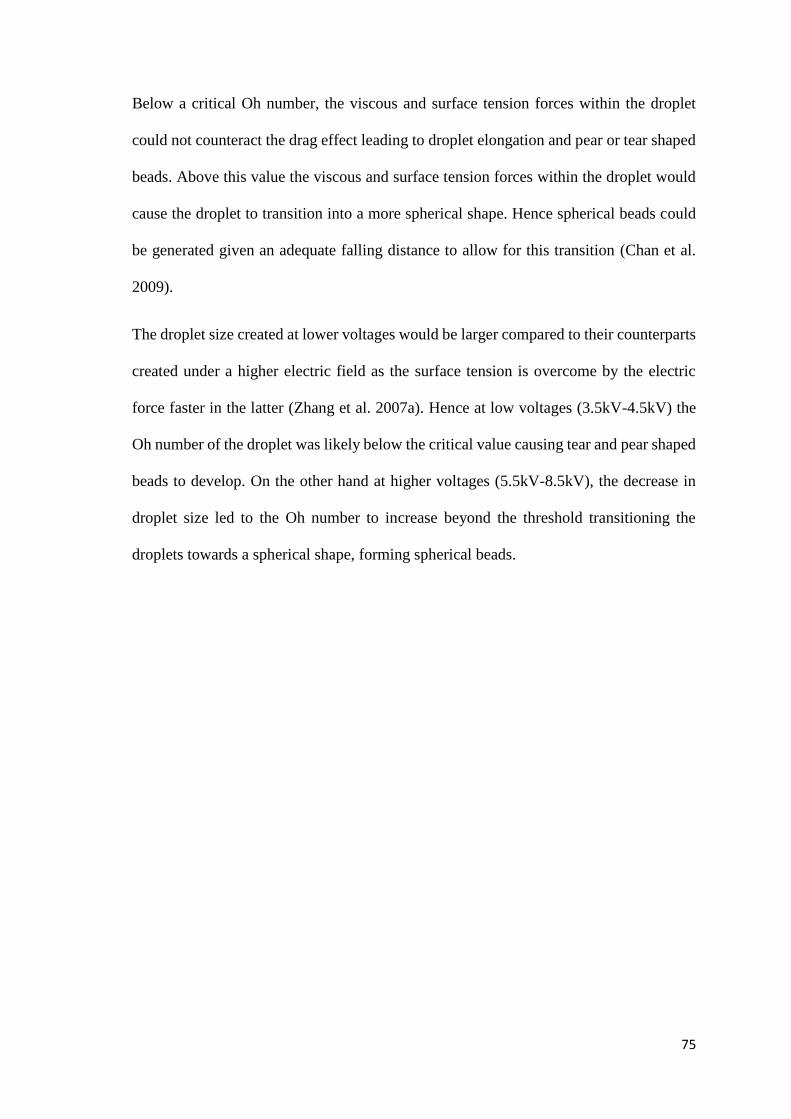
75
Below a critical Oh number, the viscous and surface tension forces within the droplet
could not counteract the drag effect leading to droplet elongation and pear or tear shaped
beads. Above this value the viscous and surface tension forces within the droplet would
cause the droplet to transition into a more spherical shape. Hence spherical beads could
be generated given an adequate falling distance to allow for this transition (Chan et al.
2009).
The droplet size created at lower voltages would be larger compared to their counterparts
created under a higher electric field as the surface tension is overcome by the electric
force faster in the latter (Zhang et al. 2007a). Hence at low voltages (3.5kV-4.5kV) the
Oh number of the droplet was likely below the critical value causing tear and pear shaped
beads to develop. On the other hand at higher voltages (5.5kV-8.5kV), the decrease in
droplet size led to the Oh number to increase beyond the threshold transitioning the
droplets towards a spherical shape, forming spherical beads.
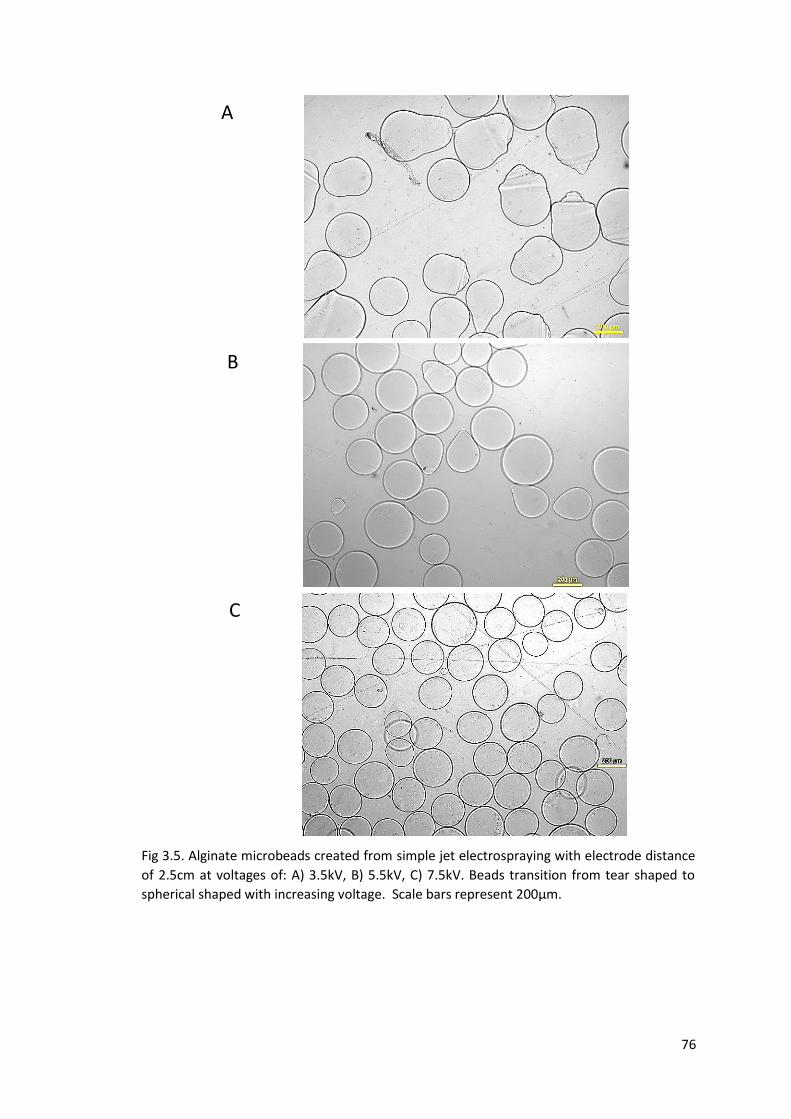
76
A
B
C
Fig 3.5. Alginate microbeads created from simple jet electrospraying with electrode distance
of 2.5cm at voltages of: A) 3.5kV, B) 5.5kV, C) 7.5kV. Beads transition from tear shaped to
spherical shaped with increasing voltage. Scale bars represent 200µm.

77
Based on these results, the most optimal parameters to produce the microcarriers was
7.5kV and 2.5cm electrode distance. The bead diameter created was close to 200µm,
which is within the preferred range of spherical microcarriers from 90-300µm (Freshney
2011; Szczypka et al. 2014) as described in chapter 2. Furthermore, the beads created
under these conditions were spherical and had the highest circularity.
In this study, the simple jet mode was used to create alginate microbeads. This increases
the production rate of the beads through high flow rates at the ml/min range compared to
the lower flow rates in the ml/hr range utilized by most studies implementing the dripping
3.5
kV
4.5
kV
5.5
kV
6.5
kV
7.5
kV
8.5
kV
0 .8 0
0 .8 5
0 .9 0
0 .9 5
1 .0 0
V o lta g e ( k V )
Cir
cu
lari
ty
N.S
*
Fig 3.6. Circularity vs voltage of alginate microbeads electrosprayed at 2.5cm electrode
distance. At low voltages of 3.5-4.5kV the circularity values were significantly lower compared
to higher voltages (denoted by *, n=30, p<0.05). At 5.5kV a significant increase in circularity
was observed where the circularity remained non significant with increasing voltage from
5.5kV-8.5kV.
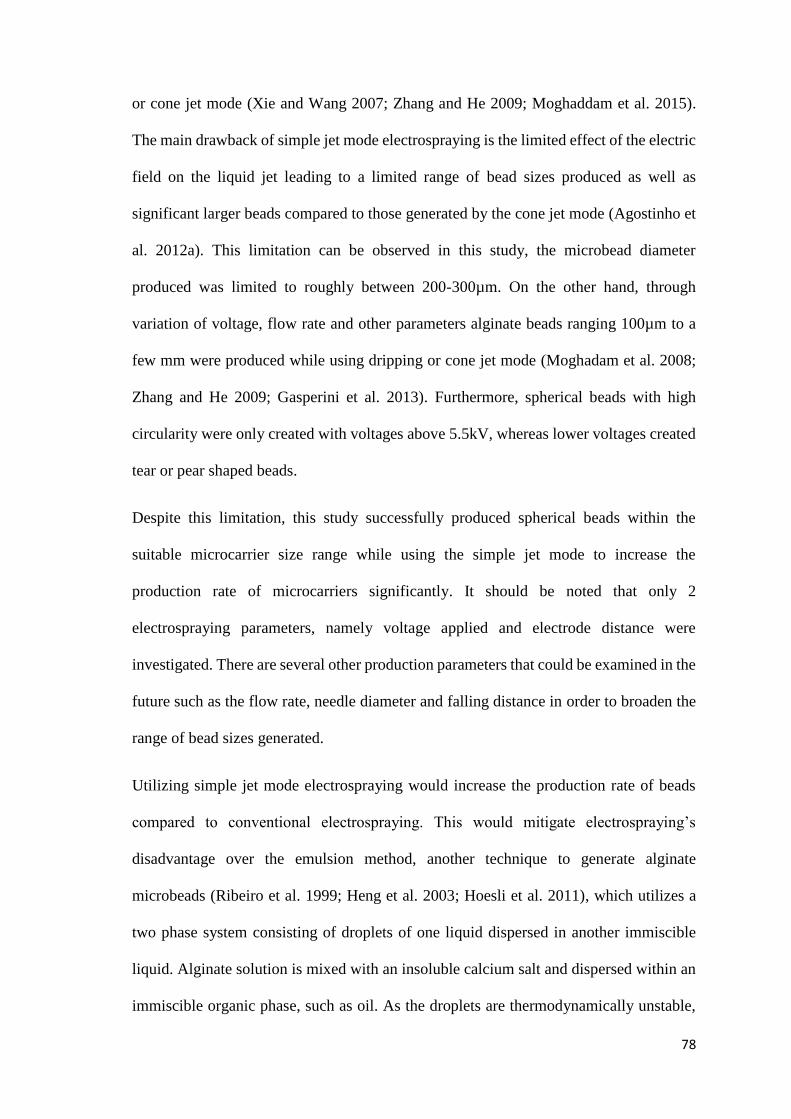
78
or cone jet mode (Xie and Wang 2007; Zhang and He 2009; Moghaddam et al. 2015).
The main drawback of simple jet mode electrospraying is the limited effect of the electric
field on the liquid jet leading to a limited range of bead sizes produced as well as
significant larger beads compared to those generated by the cone jet mode (Agostinho et
al. 2012a). This limitation can be observed in this study, the microbead diameter
produced was limited to roughly between 200-300µm. On the other hand, through
variation of voltage, flow rate and other parameters alginate beads ranging 100µm to a
few mm were produced while using dripping or cone jet mode (Moghadam et al. 2008;
Zhang and He 2009; Gasperini et al. 2013). Furthermore, spherical beads with high
circularity were only created with voltages above 5.5kV, whereas lower voltages created
tear or pear shaped beads.
Despite this limitation, this study successfully produced spherical beads within the
suitable microcarrier size range while using the simple jet mode to increase the
production rate of microcarriers significantly. It should be noted that only 2
electrospraying parameters, namely voltage applied and electrode distance were
investigated. There are several other production parameters that could be examined in the
future such as the flow rate, needle diameter and falling distance in order to broaden the
range of bead sizes generated.
Utilizing simple jet mode electrospraying would increase the production rate of beads
compared to conventional electrospraying. This would mitigate electrospraying’s
disadvantage over the emulsion method, another technique to generate alginate
microbeads (Ribeiro et al. 1999; Heng et al. 2003; Hoesli et al. 2011), which utilizes a
two phase system consisting of droplets of one liquid dispersed in another immiscible
liquid. Alginate solution is mixed with an insoluble calcium salt and dispersed within an
immiscible organic phase, such as oil. As the droplets are thermodynamically unstable,
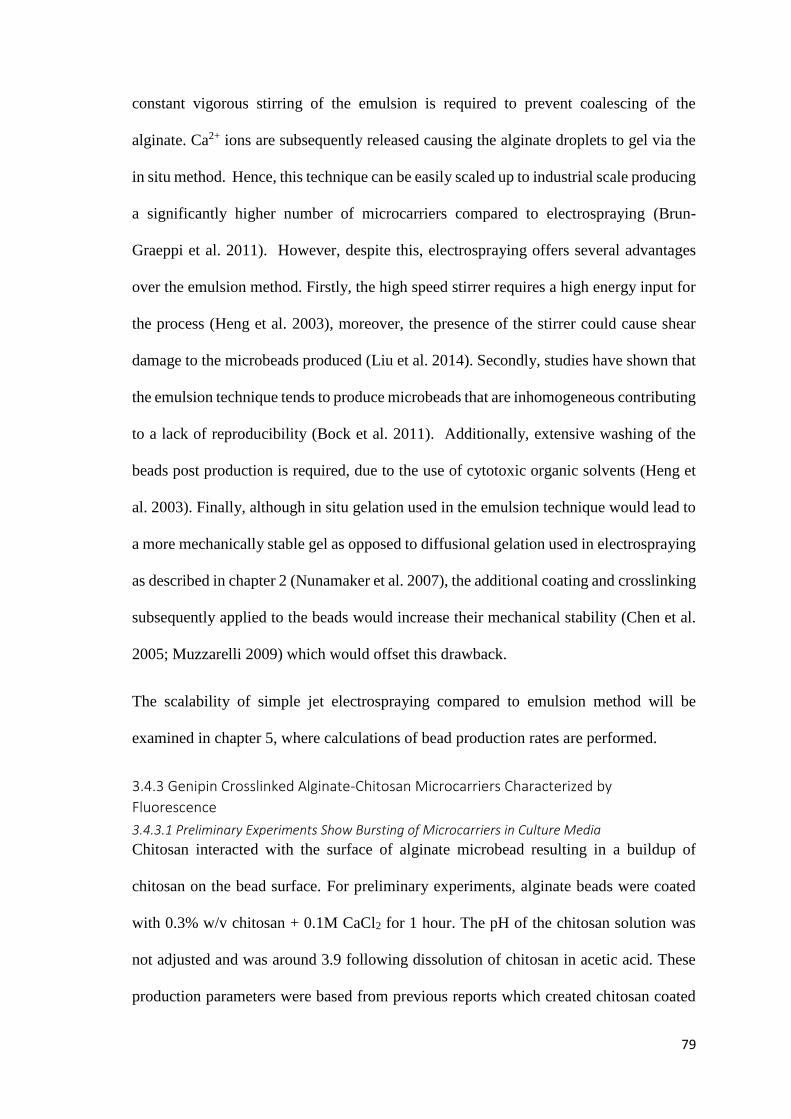
79
constant vigorous stirring of the emulsion is required to prevent coalescing of the
alginate. Ca2+ ions are subsequently released causing the alginate droplets to gel via the
in situ method. Hence, this technique can be easily scaled up to industrial scale producing
a significantly higher number of microcarriers compared to electrospraying (Brun-
Graeppi et al. 2011). However, despite this, electrospraying offers several advantages
over the emulsion method. Firstly, the high speed stirrer requires a high energy input for
the process (Heng et al. 2003), moreover, the presence of the stirrer could cause shear
damage to the microbeads produced (Liu et al. 2014). Secondly, studies have shown that
the emulsion technique tends to produce microbeads that are inhomogeneous contributing
to a lack of reproducibility (Bock et al. 2011). Additionally, extensive washing of the
beads post production is required, due to the use of cytotoxic organic solvents (Heng et
al. 2003). Finally, although in situ gelation used in the emulsion technique would lead to
a more mechanically stable gel as opposed to diffusional gelation used in electrospraying
as described in chapter 2 (Nunamaker et al. 2007), the additional coating and crosslinking
subsequently applied to the beads would increase their mechanical stability (Chen et al.
2005; Muzzarelli 2009) which would offset this drawback.
The scalability of simple jet electrospraying compared to emulsion method will be
examined in chapter 5, where calculations of bead production rates are performed.
3.4.3 Genipin Crosslinked Alginate-Chitosan Microcarriers Characterized by
Fluorescence
3.4.3.1 Preliminary Experiments Show Bursting of Microcarriers in Culture Media
Chitosan interacted with the surface of alginate microbead resulting in a buildup of
chitosan on the bead surface. For preliminary experiments, alginate beads were coated
with 0.3% w/v chitosan + 0.1M CaCl2 for 1 hour. The pH of the chitosan solution was
not adjusted and was around 3.9 following dissolution of chitosan in acetic acid. These
production parameters were based from previous reports which created chitosan coated
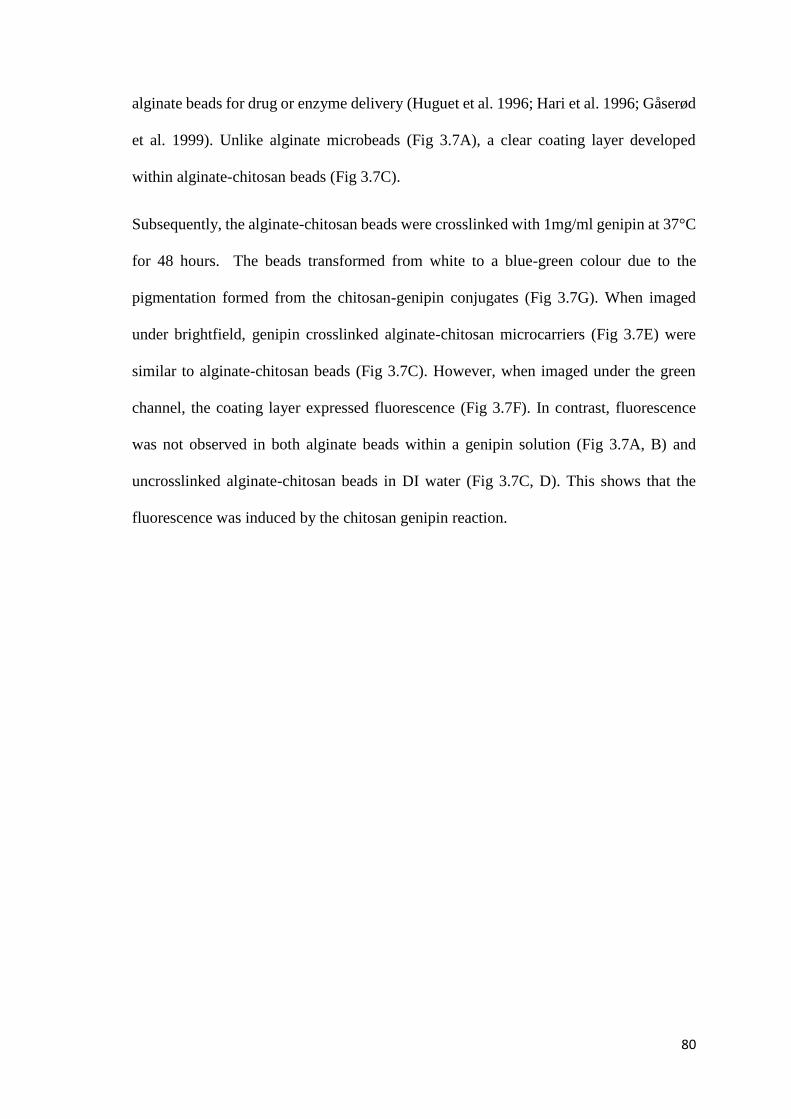
80
alginate beads for drug or enzyme delivery (Huguet et al. 1996; Hari et al. 1996; Gåserød
et al. 1999). Unlike alginate microbeads (Fig 3.7A), a clear coating layer developed
within alginate-chitosan beads (Fig 3.7C).
Subsequently, the alginate-chitosan beads were crosslinked with 1mg/ml genipin at 37°C
for 48 hours. The beads transformed from white to a blue-green colour due to the
pigmentation formed from the chitosan-genipin conjugates (Fig 3.7G). When imaged
under brightfield, genipin crosslinked alginate-chitosan microcarriers (Fig 3.7E) were
similar to alginate-chitosan beads (Fig 3.7C). However, when imaged under the green
channel, the coating layer expressed fluorescence (Fig 3.7F). In contrast, fluorescence
was not observed in both alginate beads within a genipin solution (Fig 3.7A, B) and
uncrosslinked alginate-chitosan beads in DI water (Fig 3.7C, D). This shows that the
fluorescence was induced by the chitosan genipin reaction.
81
C
E
A B
D
F
G i ii
Fig 3.7. Production of genipin crosslinked alginate-chitosan microcarriers. A) Alginate microbeads created using electrospraying at 7.5kV with an electrode distance of 2.5cm. B) Incubation of alginate microbeads within a genipin solution displayed no fluorescence under the green channel. C) Alginate-chitosan microbeads prior to crosslinking with genipin under brightfield channel. D) Alginate-chitosan microbeads under green channel. No fluorescence was observed. E) Genipin crosslinked alginate-chitosan microcarriers under brightfield channel. F) Genipin crosslinked alginate-chitosan microcarriers displaying fluorescence under green channel. G) i) Alginate microbeads. ii) Genipin crosslinked alginate-chitosan microcarriers. Beads turn blue following successful crosslinking. All scale bars represent 500µm. Reprinted with permission from (Chui et al. 2018) license number 4497661255175.
82
Upon addition into Dulbecco’s Modified Eagle’s Medium (DMEM) + Foetal Bovine
Serum (FBS), these preliminary results show that the genipin crosslinked alginate-
chitosan microcarriers swelled and burst during the first 24 hours (Fig. 3.8). On the other
hand, within PBS and serum free media, although swelling was observed, the beads
remained mostly intact (Fig 3.8C and D). Hence, the bursting of the beads could be due
to the interaction of proteins within the FBS with the surface polymers of the beads
together with the swelling caused by ion exchange. The swelling of beads in DMEM are
further explored in chapter 4. The stability of the microcarriers in media is critical as
alginate is sensitive in non-Ca2+ rich environments (Bajpai and Kirar 2016) while
commercial microcarriers are stable. It would also be interesting to investigate the
behaviour of the beads in other cell culture media apart from DMEM such as RPMI or
DMEM-F12 for future investigations.
Due to the bursting effect, the coating thickness and integrity were optimized in order to
create a microcarrier which is stable within a cell culture environment. The aim is to
produce beads with strong and stable coating layer, while taking into consideration of the
production time. To do this, the effects of the production parameters on crosslinking
density and coating layer thickness were assessed through the fluorescence intensity. As
fluorescence represents chitosan-genipin conjugates, higher fluorescence intensity
indicates a higher degree of crosslinking in the beads and therefore results in stronger
microcarriers (Chen et al. 2006).
The screening process of different process parameters during microcarrier production is
performed based on the design of experiments and results obtained from previous studies.
This method was selected over a multifactor analysis design of experiment due to time
constraints. However, the latter method could be considered in future studies to further
optimize the microcarriers.
83
The chitosan coating variables were first examined. The first factor investigated in
previous studies was the molecular weight of chitosan. Based on this, low molecular
weight chitosan was selected for this study as it has been shown previously that low
molecular weight chitosan has greater polyelectrolyte interaction with alginate due to
steric hindrance of higher molecular weight polymers (Gåserød and Skja 1998).
Following molecular weight, the effect of pH of the chitosan solution on the interaction
with alginate beads was next examined in previous investigations (Gåserød and Skja
1998). This is followed by chitosan coating time and chitosan concentration (Gåserød et
al. 1999).
A study by Chen et al demonstrated that genipin crosslinking temperature and
crosslinking time had a significantly greater impact on the final bead fluorescence
intensity compared to genipin concentration (Chen et al. 2006). Therefore, temperature
and time of crosslinking were investigated following the chitosan coating step.
In order to characterise the fluorescence intensity and the coating layer thickness a total
of 7 beads per batch were randomly measured with a total of 3 batches. An ANOVA test
revealed that there were no significant differences between the batches for all the beads
regardless of the process parameters used (see appendix). Hence this demonstrates that
the production process is able to generate uniform beads.
The number of beads examined per batch were low due to time constraints and the large
number of process parameters to examine. However as there were no significant
differences between the data for the 3 batchers, the data from the replicates were
combined when comparing the effects of different process parameters on fluorescence
and coating layer thickness, yielding a larger final sample number of 21. Although this
represents pseudoreplication, the beads were randomly selected and there were no
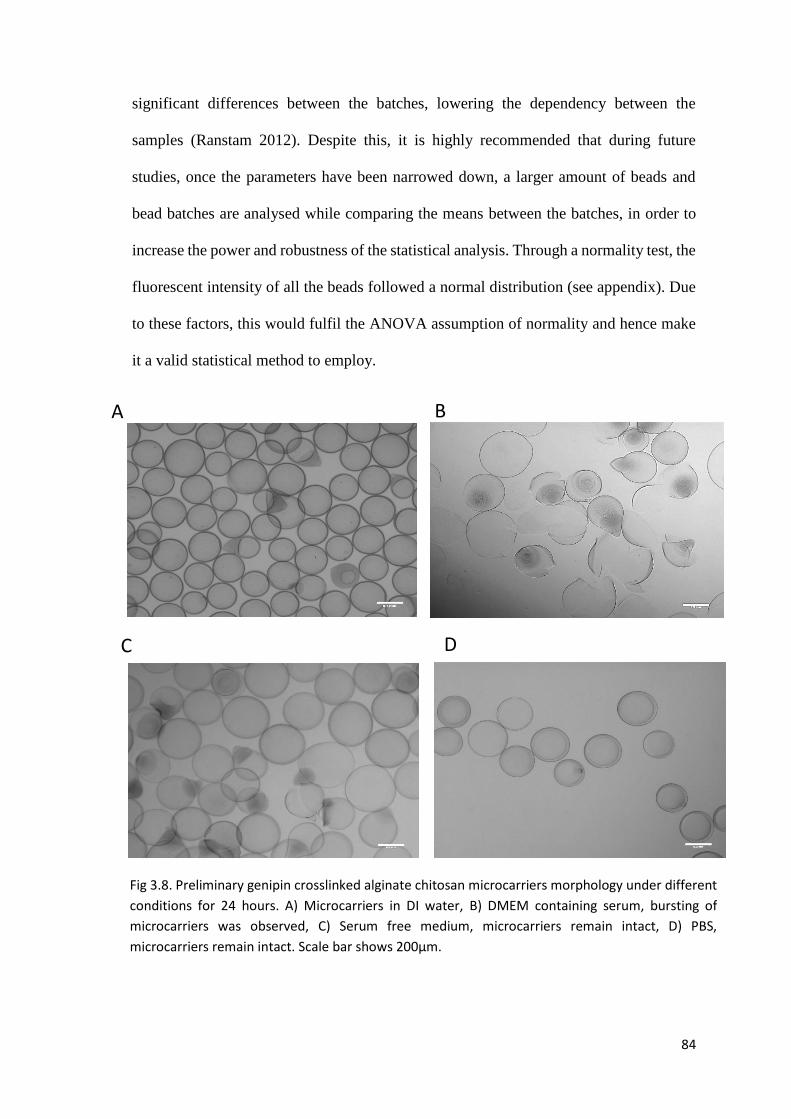
84
significant differences between the batches, lowering the dependency between the
samples (Ranstam 2012). Despite this, it is highly recommended that during future
studies, once the parameters have been narrowed down, a larger amount of beads and
bead batches are analysed while comparing the means between the batches, in order to
increase the power and robustness of the statistical analysis. Through a normality test, the
fluorescent intensity of all the beads followed a normal distribution (see appendix). Due
to these factors, this would fulfil the ANOVA assumption of normality and hence make
it a valid statistical method to employ.
A B
C D
Fig 3.8. Preliminary genipin crosslinked alginate chitosan microcarriers morphology under different
conditions for 24 hours. A) Microcarriers in DI water, B) DMEM containing serum, bursting of
microcarriers was observed, C) Serum free medium, microcarriers remain intact, D) PBS,
microcarriers remain intact. Scale bar shows 200µm.

85
3.4.3.2 pH of the Chitosan Solution
There was a significant increase in both fluorescence intensity and coating layer thickness
(Fig 3.9A and 3.9B respectively) as the pH of the chitosan coating solution was adjusted
from 3.9 to 5. This was due to the increase in degree of dissociation of NH2 and COOH
within chitosan and alginate respectively. The pKa value of chitosan is 6.3 (Yalpani and
Hall 1984), as the pH of the solution falls below this, the NH2 groups are protonated
producing positively charged NH3+ groups. On the other hand, the M or G groups on
alginate has a pKa of 3.38 or 3.65 (Francis et al. 2013) respectively, as the pH rises above
the pKa values, the COOH groups within the polymer deprotonate generating COO- . It
has been shown previously that the maximum ionic bonding between COO- of alginate
and NH3+ occurs at pH 5 where the highest degrees of dissociation of each polysaccharide
were present. At a lower or higher pH, a dominance of the non-ionised COOH and NH2
groups occur respectively, leading to lower ionic interaction between alginate and
chitosan (Elzatahry et al. 2009; Francis et al. 2013). The increased alginate-chitosan
interaction at pH 5 would hence lead to a greater degree of crosslinking causing the beads
to display a higher fluorescence intensity compared to solutions coated at a pH of 3.9.
Hence the pH of the chitosan solution was adjusted to 5 for the rest of the work described
in this thesis.
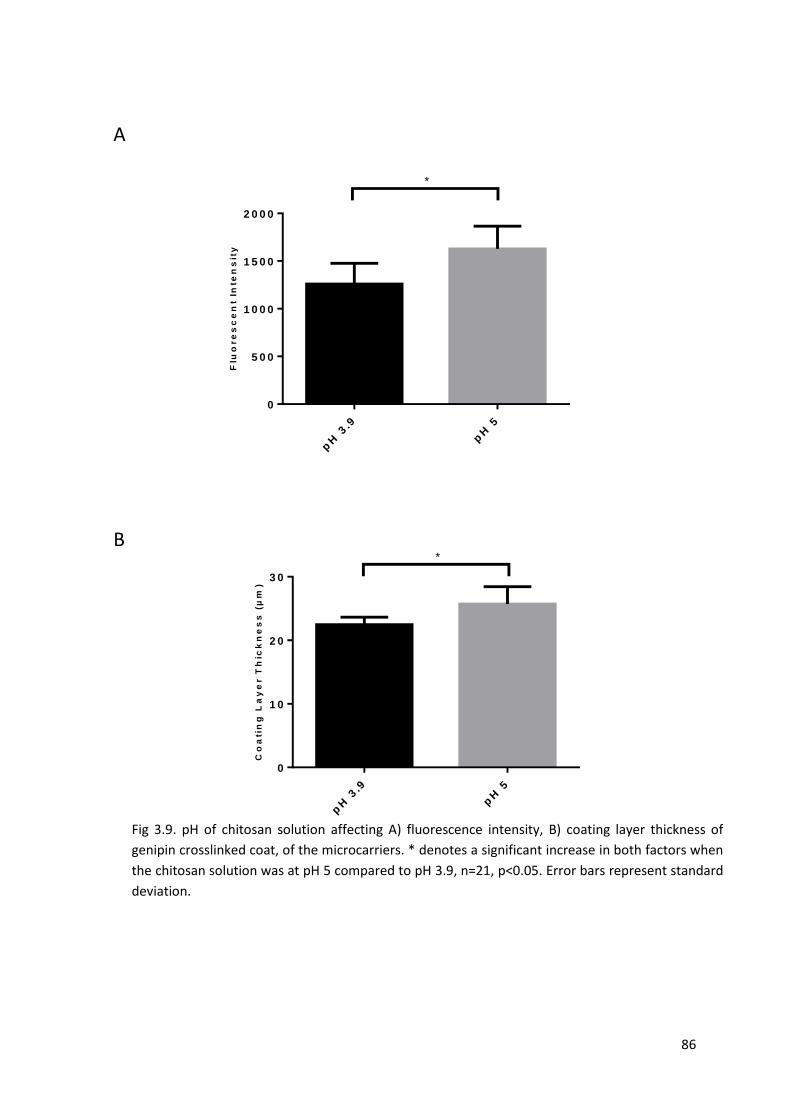
86
A
B
pH
3.9
pH
5
0
5 0 0
1 0 0 0
1 5 0 0
2 0 0 0
Flu
ore
sc
en
t In
ten
sit
y
*
pH
3.9
pH
5
0
1 0
2 0
3 0
Co
ati
ng
La
ye
r T
hic
kn
es
s (
µm
)
*
Fig 3.9. pH of chitosan solution affecting A) fluorescence intensity, B) coating layer thickness of
genipin crosslinked coat, of the microcarriers. * denotes a significant increase in both factors when
the chitosan solution was at pH 5 compared to pH 3.9, n=21, p<0.05. Error bars represent standard
deviation.

87
3.4.3.3 Chitosan Coating Time
The membrane fluorescence increased significantly (n=21, p<0.05) with increasing
chitosan coating times of 1 hour, 2 hours and 5 hours with a fixed crosslinking
temperature and time of 37°C and 48 hours (Fig 3.10A). However, no significant increase
in fluorescence intensity was observed as the chitosan coating time was extended from 5
hours to 24 hours. (Fig 3.10A). As alginate beads come in contact with the chitosan
solution during the coating process, chitosan diffuses into the bead and interacts alginate
through to polyelectrolyte interaction. (Gåserød and Skja 1998). Hence as the coating
time increases, a higher density of chitosan develops on the alginate bead. As the
crosslinking density is directly proportional to the chitosan density, a longer coating time
would result in increased fluorescence intensity. However, the chitosan chains would
eventually result in diffusion resistance to additional chitosan (Elzatahry et al. 2009),
therefore the chitosan density and hence fluorescence intensity reaches a maximum
following 5 hours of coating.
Unlike the fluorescence intensity, there was no significant change in coating layer
thickness when the chitosan coating time was increased from 1 to 2 hours (Fig 3.10B, Fig
3.10Ci, Fig 3.10Cii). This was due to the insufficient time for significant build-up of the
coating layer thickness. Further increase of coating time to 5 hours developed a
significantly thicker (n=21, p<0.05) coating layer (Fig 3.10B - graph, Fig 3.10Ciii) as a
result of the chitosan build up. Following 24 hours of coating, the entire bead became
fluorescent with no clear distinction between the coating layer and the alginate core (Fig
3.10Civ). It is a possibility that as the coating layer increases, the alginate core and
chitosan coat could not be distinguished due to fluorescent quenching during crosslinking
or the number of colours supported by the detector (Fig 3.10Civ).

88
The optimal chitosan coating time was chosen to be 5 hours where the maximum
fluorescence intensity was reached.
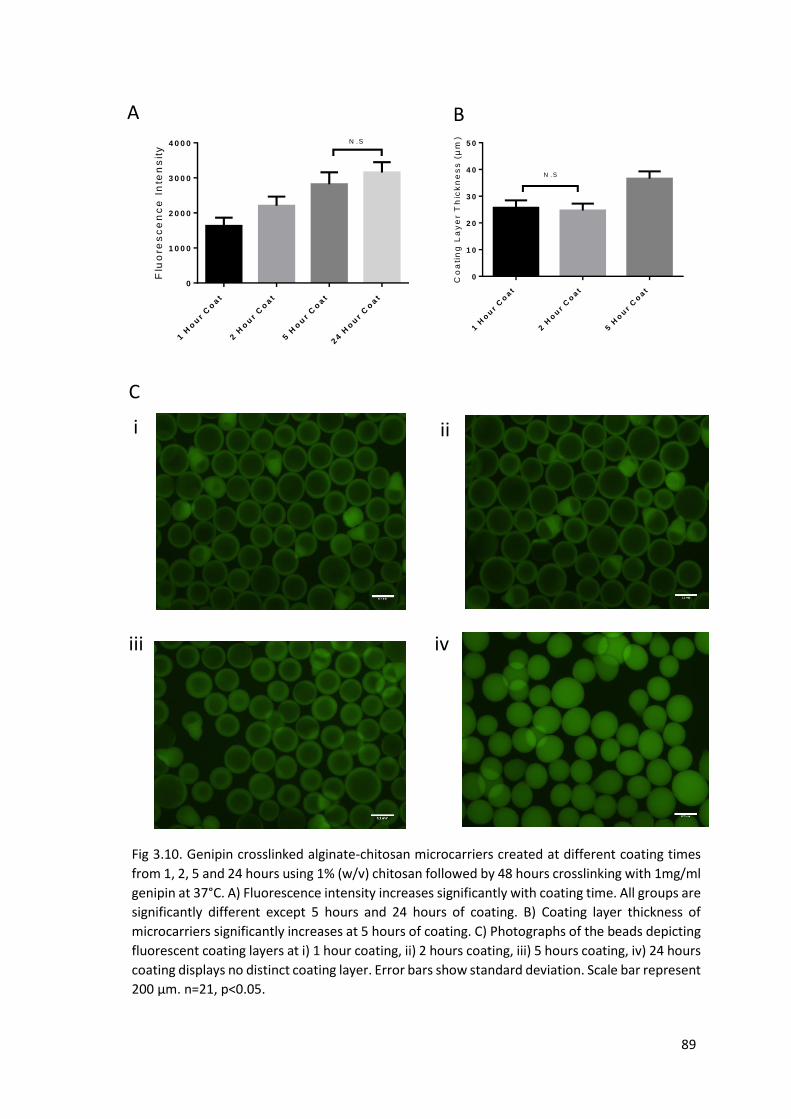
89
A B
C
i ii
iii iv
Fig 3.10. Genipin crosslinked alginate-chitosan microcarriers created at different coating times
from 1, 2, 5 and 24 hours using 1% (w/v) chitosan followed by 48 hours crosslinking with 1mg/ml
genipin at 37°C. A) Fluorescence intensity increases significantly with coating time. All groups are
significantly different except 5 hours and 24 hours of coating. B) Coating layer thickness of
microcarriers significantly increases at 5 hours of coating. C) Photographs of the beads depicting
fluorescent coating layers at i) 1 hour coating, ii) 2 hours coating, iii) 5 hours coating, iv) 24 hours
coating displays no distinct coating layer. Error bars show standard deviation. Scale bar represent
200 µm. n=21, p<0.05.
1 H
ou
r C
oat
2 H
ou
r C
oat
5 H
ou
r C
oat
24 H
ou
r C
oat
0
1 0 0 0
2 0 0 0
3 0 0 0
4 0 0 0
Flu
ore
sc
en
ce
In
ten
sit
y
N .S
1 H
ou
r C
oat
2 H
ou
r C
oat
5 H
ou
r C
oat
0
1 0
2 0
3 0
4 0
5 0
Co
ati
ng
La
ye
r T
hic
kn
es
s (
µm
)
N .S

90
3.4.3.4 Chitosan Concentration
Fig 3.11 shows the effect of chitosan concentration on the fluorescence intensity and
coating layer thickness. It was shown that given a constant coating time of 5 hours, an
increase in chitosan concentration from 0.3% - 1% (w/v) significantly (n=21, p<0.05)
increased the fluorescence intensity and coating layer thickness. This result is explained
by the higher density of chitosan deposited on the alginate surface at higher chitosan
concentrations. However, as the chitosan concentration was increased to 2% (w/v), the
resulting beads were shrunk and deformed. (Fig 3.11Ciii). This phenomenon could be
due to the high viscosity of the chitosan solution damaging the alginate beads. The non-
uniformity of beads coated in 2% chitosan is a major compromise for the microbeads’
suitability as microcarriers as it would encourage non uniform cell attachment (Nilsson
1989). Moreover, the viscous coating solution also increased the difficulty of bead
handling during microcarrier production. Due to these results, the optimal chitosan
concentration was chosen to be 1% (w/v). It is acknowledged that there is a large increase
in chitosan concentration from 1% - 2% (w/v). However, in the interest of time no other
concentrations were investigated. Additionally, 1% (w/v) provided a significantly higher
crosslinking density and chitosan coating layer compared to the originally chosen 0.3%
(w/v). However, in future studies examining the effect of coating with 1.5% (w/v) of
chitosan could be interesting.
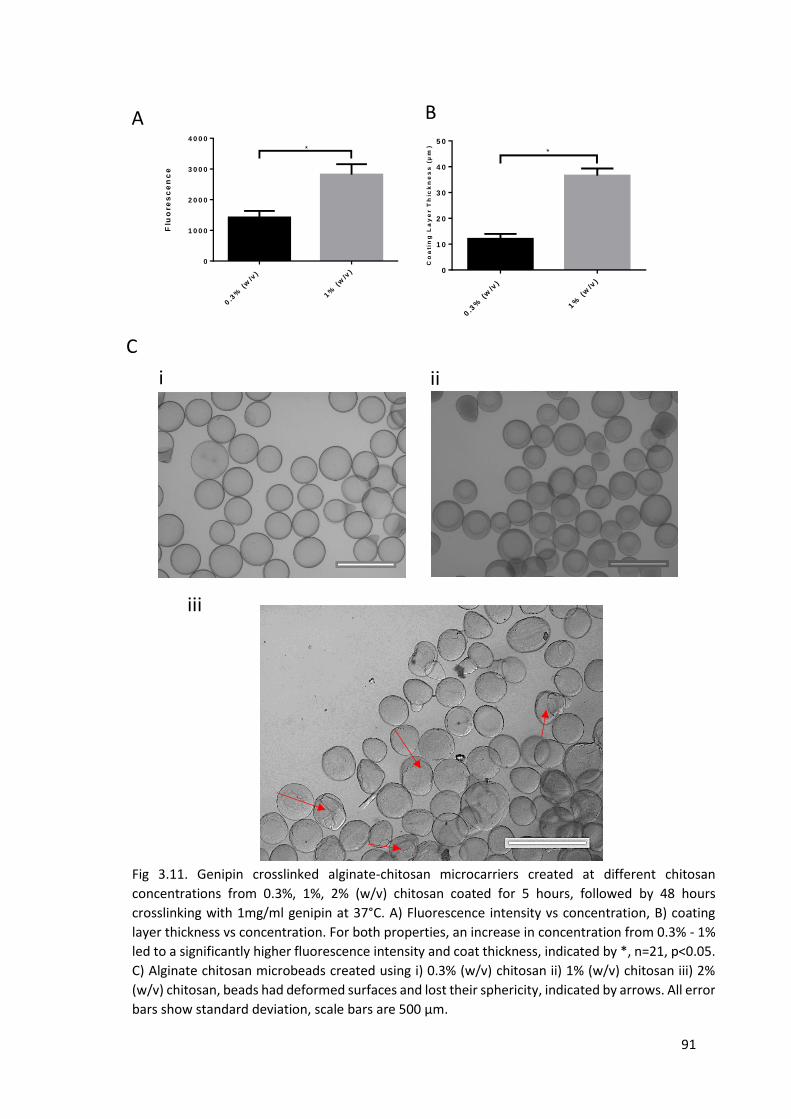
91
0.3
% (
w/v
)
1%
(w
/v)
0
1 0 0 0
2 0 0 0
3 0 0 0
4 0 0 0
Flu
ore
sc
en
ce
*
0.3
% (
w/v
)
1%
(w
/v)
0
1 0
2 0
3 0
4 0
5 0
Co
ati
ng
La
ye
r T
hic
kn
es
s (
µm
)
*
C
BA
i
iii
ii
Fig 3.11. Genipin crosslinked alginate-chitosan microcarriers created at different chitosan
concentrations from 0.3%, 1%, 2% (w/v) chitosan coated for 5 hours, followed by 48 hours
crosslinking with 1mg/ml genipin at 37°C. A) Fluorescence intensity vs concentration, B) coating
layer thickness vs concentration. For both properties, an increase in concentration from 0.3% - 1%
led to a significantly higher fluorescence intensity and coat thickness, indicated by *, n=21, p<0.05.
C) Alginate chitosan microbeads created using i) 0.3% (w/v) chitosan ii) 1% (w/v) chitosan iii) 2%
(w/v) chitosan, beads had deformed surfaces and lost their sphericity, indicated by arrows. All error
bars show standard deviation, scale bars are 500 µm.
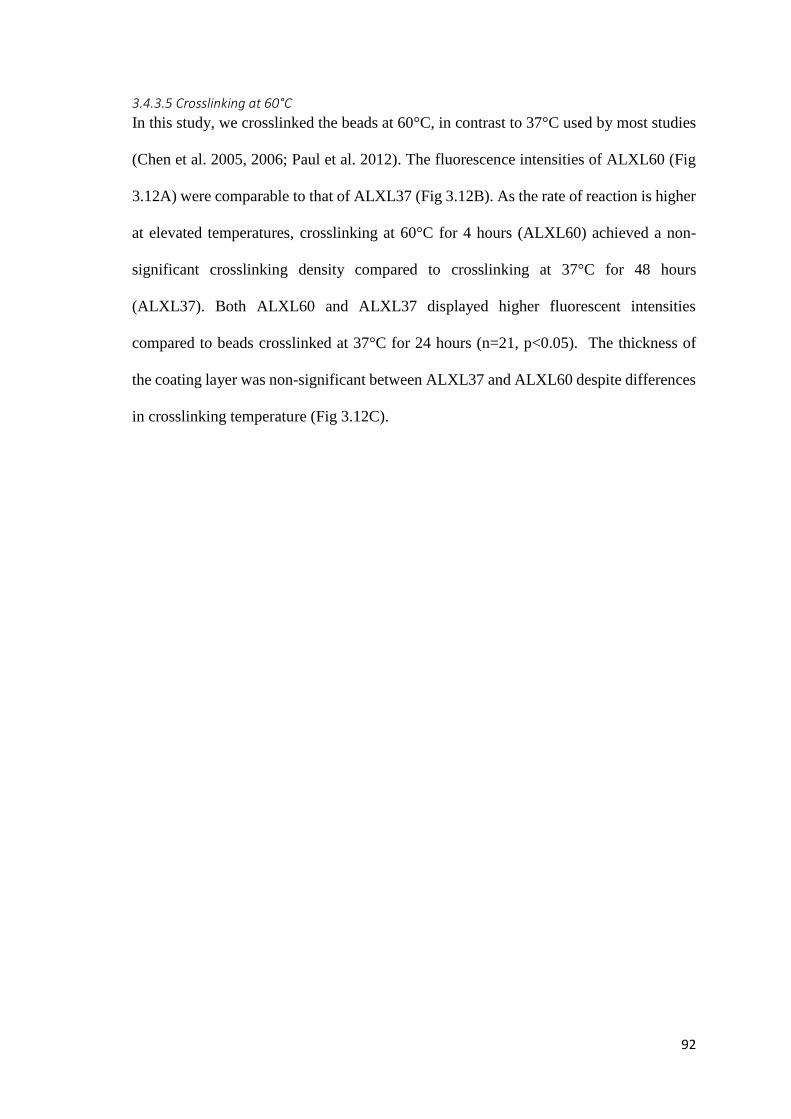
92
3.4.3.5 Crosslinking at 60°C
In this study, we crosslinked the beads at 60°C, in contrast to 37°C used by most studies
(Chen et al. 2005, 2006; Paul et al. 2012). The fluorescence intensities of ALXL60 (Fig
3.12A) were comparable to that of ALXL37 (Fig 3.12B). As the rate of reaction is higher
at elevated temperatures, crosslinking at 60°C for 4 hours (ALXL60) achieved a non-
significant crosslinking density compared to crosslinking at 37°C for 48 hours
(ALXL37). Both ALXL60 and ALXL37 displayed higher fluorescent intensities
compared to beads crosslinked at 37°C for 24 hours (n=21, p<0.05). The thickness of
the coating layer was non-significant between ALXL37 and ALXL60 despite differences
in crosslinking temperature (Fig 3.12C).
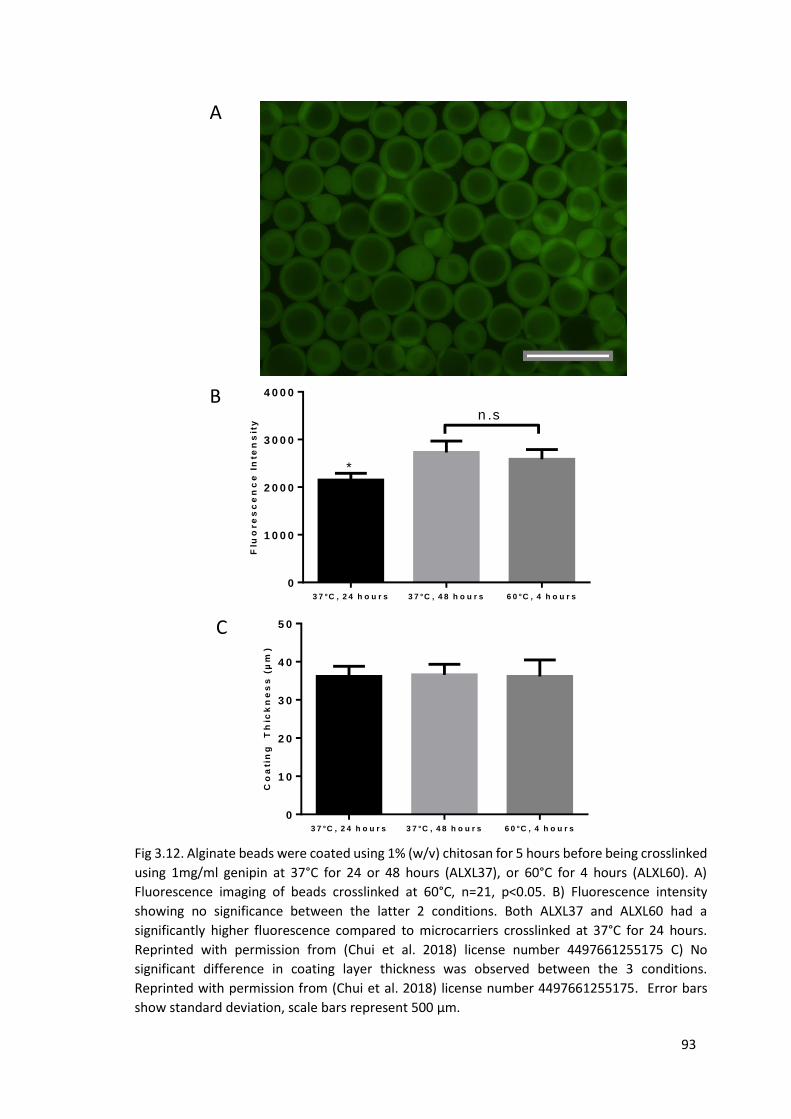
93
A
B
C
3 7 °C , 2 4 h o u r s 3 7 °C , 4 8 h o u r s 6 0 °C , 4 h o u r s
0
1 0
2 0
3 0
4 0
5 0
Co
ati
ng
T
hic
kn
es
s (
µm
)
3 7 °C , 2 4 h o u r s 3 7 °C , 4 8 h o u r s 6 0 °C , 4 h o u r s
0
1 0 0 0
2 0 0 0
3 0 0 0
4 0 0 0
Flu
ore
sc
en
ce
In
ten
sit
y
n .s
*
Fig 3.12. Alginate beads were coated using 1% (w/v) chitosan for 5 hours before being crosslinked
using 1mg/ml genipin at 37°C for 24 or 48 hours (ALXL37), or 60°C for 4 hours (ALXL60). A)
Fluorescence imaging of beads crosslinked at 60°C, n=21, p<0.05. B) Fluorescence intensity
showing no significance between the latter 2 conditions. Both ALXL37 and ALXL60 had a
significantly higher fluorescence compared to microcarriers crosslinked at 37°C for 24 hours.
Reprinted with permission from (Chui et al. 2018) license number 4497661255175 C) No
significant difference in coating layer thickness was observed between the 3 conditions.
Reprinted with permission from (Chui et al. 2018) license number 4497661255175. Error bars
show standard deviation, scale bars represent 500 µm.

94
3.4.3.6 Optimal Microcarrier Production Parameters
In this study, fluorescence intensity generated by the chitosan genipin reaction provides
an indication of the degree of crosslinking in the beads. The higher the fluorescence
intensity, the more conjugates are formed, thus producing a higher crosslinking density
and as a result stronger microcarriers (Chen et al. 2006). Therefore, to obtain the greatest
crosslinking density while lowering bead production time, the optimal coating conditions
were 5 hours coating time with 1% (w/v) chitosan adjusted to pH 5 while the crosslinking
conditions were 4 hours crosslinking time at 60°C (Table 3.2). Microcarriers produced
under these parameters would be denoted as ALXL60. On the other hand, ALXL37 were
used as a comparison for microcarrier swelling and mechanical properties (See Chapter
4).
Despite establishing the optimal production parameters for this study, there are two key
factors to take into consideration when analysing the fluorescence intensity and coating
layer thickness. Firstly, the fluorescence intensity and coating layer thickness values
obtained were only approximations, as the resolution of the fluorescent microscope
would not be high enough to determine the boundary between the coating layer and the
alginate core. Secondly, the coating and crosslinking would not be uniform across all
beads as these processes were not performed under an optimized mixing environment
such as a stirred tank vessel or a fluidization chamber (Groboillot et al. 1994).
Abbreviation Chitosan Solution Concentration % (w/v)
Chitosan Coating Time (hours)
Genipin Concentration (mg/ml)
Genipin Crosslinking Temperature (°C)
Genipin Crosslinking Time (Hours)
ALXL37 1 5 1 37 48
ALXL60 1 5 1 60 4
Table 3.2. Summary of manufacturing parameters for beads crosslinked at 37°C and 60°C used
for further comparison.

95
3.4.3.7 Optimized Microcarriers Remain Intact in Culture Media
The morphology of ALXL37 and ALXL60 remained spherical and intact when incubated
in DMEM containing 10% FBS and 1% P/S for 48 hours (Fig 3.13). This was in contrast
to the microcarriers shown in Fig 3.7, where the microcarriers burst upon contact with
cell culture media. The higher crosslinking density and thicker coating layer developed a
stronger coating layer on ALXL37 and ALXL60 compared to the beads in Fig 3.7. This
provides resistance to bead swelling and FBS interaction suggesting stability under cell
culture conditions. Microcarrier stability over the course of two weeks would be assessed
in the next chapter.
96
A
B
Fig 3.13. Stability of genipin crosslinked alginate chitosan microcarriers within cell culture medium
(DMEM, 10% FBS, 1% P/S). Microcarriers remain mostly intact and no rupture of the microcarriers
was observed. A) Microcarriers crosslinked at 37°C for 48 hours (ALXL37). B) Microcarriers
crosslinked at 60°C for 4 hours (ALXL60). Scale bar shows 500µm.
97
3.4.5 Rheological Properties of Chitosan Affected by Higher Temperature Treatment
G1, G2, G* and complex viscosity of chitosan were generally unaltered following
treatment at 37°C compared to the control group at 25°C. On the other hand, solutions
incubated at 60°C and 80°C, had a significant (n=3, p<0.05) decrease in the measured
rheological properties as seen in Fig 3.19.
Due to the chitosan solution being dissolved in acetic acid, the elevated temperature could
cause depolymerisation of chitosan, lowering its rheological properties. It has been
reported previously that chitosan chains depolymerise following exposure to acid with
the rate of acid hydrolysis increasing with temperature (Varum et al. 2001; Kasaai et al.
2013). This creates lower molecular weight polymer chains or oligomers which would
possess different rheological properties to the original polymer (Il’ina and Varlamov
2004).
The changes in rheological properties could lead to weakening of the structure. However,
due to the extensive washing between the coating and crosslinking steps, the acid residues
on the beads would be kept to a minimum. In addition, during production, microcarriers
were only exposed to elevated temperatures during the crosslinking step during which
the beads were not within an acidic solution. Therefore assuming changes in chitosan
rheology was due to acid hydrolysis, the elevated temperature during crosslinking would
have minimal effect on the final microcarrier structure.
The final crosslinking temperature was chosen to be 60°C due to the increased rate of
reaction compared to 37°C. In addition, 60°C serves as a suitable crosslinking
temperature as alginate was heated to a similar temperature during solution preparation.
This ensures that the structural properties of the alginate bead had not be altered during
the crosslinking process. Moreover, no changes in pigmentation intensity was found
when several amino acids were crosslinked with genipin at 60°C for 10 hours, indicating

98
that the properties of genipin were not affected at this temperature (Paik et al. 2001).
Although crosslinking at 80°C suggests a higher rate of reaction, a previous report
showed that genipin was shown to produce the highest degree of crosslinking at 60°C,
when crosslinking egg proteins at a temperature range of 40°C-70°C (Yang et al. 2012).
A B
C D
Fig 3.14. Rheological properties of 1% chitosan solution treated at different temperatures. A)
Complex viscosity, B) G1, C) G2, D) G*. No significant changes in rheology were found between
temperatures 25°C and 37°C. On the other hand, rheological properties decreased significantly
at higher temperatures of 60°C and 80°C (with the exception of G1 where no significance was
observed between solutions treated at 25°C, 37°C and 60°C). Error bars show standard
deviation. n=3, p<0.05.
25
37
60
80
0 .0 0
0 .0 2
0 .0 4
0 .0 6
0 .0 8
0 .1 0
T e m p e ra tu re T re a te d ( °C )
Co
mp
lex
Vis
co
sit
y (
Pa
s)
N .S
25
37
60
80
0
1 0
2 0
3 0
T e m p e ra tu re T re a te d ( °C )
G1
(P
a)
N .S
N .S
25
37
60
80
0
2 0
4 0
6 0
8 0
T e m p e ra tu re T re a te d ( °C )
G* (
Pa
)
N .S
25
37
60
80
0
2 0
4 0
6 0
T e m p e ra tu re T re a te d ( °C )
G2
(P
a)
N .S

99
3.5 Conclusions In this chapter, alginate microbeads were created through simple jet mode
electrospraying. This mode involves applying an electric field to a constant jet of alginate.
The high flow rates involved would increase the microbead production rate compared to
more conventional electrospraying methods such as the cone jet mode. The optimal
voltage and electrode distance to produce spherical microbeads were found to be 7.5kV
and 2.5cm. In order to generate microcarriers, the alginate beads were subsequently
coated with chitosan and crosslinked with genipin. The genipin crosslinked alginate-
chitosan membrane was characterized through measurement of the fluorescence intensity
to determine the crosslinking density. Manipulation of the production parameters could
vary the crosslinking density as well as the coating layer thickness. One of the key
parameters was crosslinking temperature, it was shown that the overall microcarrier
production time was significantly lowered by crosslinking at 60°C compared to 37°C.
Rheology tests suggest a change in chitosan rheological properties following treatment
at 60°C, although it is believed due to the crosslinking method, these changes would not
affect the overall bead integrity significantly. However, long term microcarrier stability
of ALXL60 and ALXL37 within cell culture medium will be examined in the next chapter
to further assess the effects of the high crosslinking temperature.

100
Chapter 4 – Stability of Microcarriers in Cell Culture
4.1 Introduction ALXL37 and ALXL60 microcarriers were developed in chapter 3 through optimization
of production parameters during electrospraying, chitosan coating and genipin
crosslinking. Although the microcarriers were shown to be stable in DMEM following
48 hours of incubation, long term stability under cell culture conditions has to be
accessed. There are several concerns about the stability of alginate based beads during in
vitro studies due to monovalent ions such as Na+ present in cell culture environments
(Bajpai and Sharma 2004; Darrabie et al. 2006). These ions exchange with Ca2+ within
the alginate altering the bead mechanical integrity leading to swelling, rupture and
eventually, the dissolution of the beads, which leads to a premature release of the cells.
Furthermore, changes in microcarrier properties could alter the final cell yield/product as
it has been shown in tissue engineering and regenerative medicine studies that the
material´s mechanical properties have a strong influence on cell phenotype (Discher
2005; Engler et al. 2006; Saha et al. 2008; Guilak et al. 2009; Ghasemi-Mobarakeh 2015).
To ensure successful long term culture, it is essential to understand stability, swelling
behaviour and the mechanical properties of the microcarriers under cell culture
conditions. Previous reports have examined these characteristics of alginate beads in
buffer saline (Bajpai and Sharma 2004; Mørch et al. 2006; Darrabie et al. 2006;
Pasparakis and Bouropoulos 2006; Yuan et al. 2012) or water (Wang et al. 2005; Chan
et al. 2011). However, very few studies have measured these parameters in cell culture
media (Gaumann et al. 2000). Despite the similarities between these medium, there are
significant differences in the salt content between the buffer solutions and cell culture
media, which could lead to different swelling behaviour or surface mechanical properties.
101
Alginate bead mechanical stiffness has been previously investigated by measuring the
bulk properties typically using a texture analyzer (Gugerli et al. 2002; Wang et al. 2005;
Chan et al. 2011) or micropipette aspiration (Kleinberger et al. 2013). Nevertheless, bulk
properties do not reflect the properties of the material felt by cells at the micron scale.
However, application of local nanoNewton (nN) forces at the cellular level, can be
achieved via indentation experiments using Atomic Force Microscopy (AFM) (Markert
et al. 2013). In addition, the measurements could be performed within a liquid
environment mimicking a cell culture system (Rehfeldt et al. 2007). Despite its
advantages, AFM measurements are slow and tedious to set up. They also require
significant expertise to perform (Markert et al. 2013). Hence, this work is performed in
collaboration with Andrea Bonilla-Brunner, Jacob Seifert and Sonia Contera at
Biophysics lab, Condense Matter Physics, University of Oxford.
AFM indentations have been used to characterise the mechanical properties of hydrogel
scaffolds for tissue engineering (Markert et al. 2013); alginate-based 3D scaffolds for
tissue-engineered cartilage constructs (Tomkoria et al. 2007), as well as investigating the
correlation of matrix stiffness with breast cancer cellular activity (Cavo et al. 2016). AFM
indentations have also been performed on alginate beads however, the indentations were
not performed in cell culture conditions (Lekka et al. 2004; Patel et al. 2016; Helfricht et
al. 2017). Moreover, most of these studies focus on the surface topography (Patel et al.
2016) or adhesion of the beads (Helfricht et al. 2017) and relatively few studies
investigated the mechanical properties of the microbeads (Lekka et al. 2004).
Furthermore, none of the studies mentioned above measured beads of a diameter suitable
for microcarrier use. As discussed in chapter 3, microcarriers are typically between 90-
300µm in diameter (Freshney 2011; Szczypka et al. 2014) to maximize surface area to
volume ratio while providing a sufficient surface area per bead to support cell growth
102
(Markvicheva and Grandfils 2004; Chen et al. 2013). It has been shown that the
dimensions of the sample would affect the stiffness values measured via AFM (Guo et
al. 2014). Hence, in order to quantify bead stability during microcarrier culture, it is vital
to perform indentations in a cell culture environment with suitably sized beads.
In this chapter, our first objective is to use AFM-indentation to quantify the variations in
the reduced Young’s modulus (E*), diameter and swelling of alginate microbeads and
the genipin crosslinked alginate-chitosan microcarriers in cell culture media over a period
of 2 weeks, which is the typical amount of time required in stem-cell culture (Lee et al.
2010; Serra et al. 2011; Lechanteur 2014) for cell therapy.
Freeze drying is employed within the food and pharmaceutical industry for long term
preservation and storage. The process involves removing water from a material through
sublimation (Barley). Successful freeze drying could extend shelf life and provide a
pathway towards commercialization for the microcarriers (Labconco 2010). It was
previously shown that the porous gel networks of alginate beads could be preserved
following freeze drying (Liu et al. 2016). However, freeze dried beads are more fragile
in their dry state (Choi et al. 2002) and have been shown to be mechanically weaker
compared to vacuum dried alginate beads during compression tests (Gal and
Nussinovitch 2007). Because of this, the second goal of this study is to use AFM
indentation to identify differences in E* and swelling behaviour of rehydrated freeze
dried alginate beads and microcarriers compared to their freshly made counterparts.
4.2 Materials and Methods
4.2.1 Alginate Microbeads Preparation by Electrospraying
Alginate powder was dissolved within 0.9% (w/v) NaCl solution to obtain an alginate
solution of 1% (w/v). Alginate beads were electrosprayed by passing the solution through
a 30G blunt needle at 3ml/min with an applied voltage of 7.5kV and electrode distance
103
2.5cm. Alginate microdroplets fell and were gelled into beads within a 0.1M CaCl2 bath
for 1 hour. The unmodified alginate beads would be referred to as AB.
The beads were subsequently coated with 1% (w/v) chitosan + 0.1M CaCl2 for 5 hours.
Following this the alginate-chitosan microbeads were crosslinked with 1mg/ml genipin
either at 37°C for 48 hours (ALXL37) or 60°C for 4 hours (ALXL60).
4.2.2 Assessment of Bead Swelling
AB, ALXL37 and ALXL60 were added to low glucose (1g/l) DMEM with 10% FBS and
0.1% Penicillin-Streptomycin (P/S). The beads were left in DMEM for 24 hours a period
referred to as the conditioning period. Following this, the images of beads were captured
using a Nikon TiE 2000 fluorescence microscope. The diameters of 30 beads were
measured each day using ImageJ, with the first measurement known as day 1 for a total
of 14 days. Culture media was changed every 3rd day to mimic cell culture protocol.
Based on the results from the swelling test (see 4.3.1), ALXL60 was selected due to its
stability as well as shorter production time. Hence, ALXL37 was not investigated further
in swelling studies or freeze drying. However, its mechanical properties would still be
compared to ALXL60 (see 4.2.4.2).
Green fluorescent protein (GFP) modified human MSCs-hTERT cell line was kindly
provided by the Department of Pediatrics and Adolescent Medicine, LKS Faculty of
Medicine, The University of Hong Kong. Based on the results from the above swelling
tests, microcarriers were allowed to condition in media for 2 days prior to cell culture.
The cells were cultured on ALXL60 microcarriers to examine the effect of cells on bead
swelling. Bead diameter was measured at Day 1, 4, 7, 10 and 14 during culture. AB was
not investigated due to the lack of cell adhesion proteins on alginate (Lee and Mooney
2012), this would be confirmed in chapter 5.

104
4.2.3 Freeze Drying Beads
AB and ALXL60 were suspended in 2ml of DI water at 13000 beads/ml within a 6 well
plate. The beads were frozen down to -40°C at 100mtorr before being freeze dried for
400 min at 200mtorr. The temperature was ramped to -20°C at 200mtorr over 100
minutes. Finally, the temperature of the sample was ramped to 20°C over the next 100
minutes. This recipe has not been optimized specifically for alginate beads but for general
hydrogels. It was developed under the advice and suggestion from Dr Julian Dye
(Department of Engineering Science, University of Oxford). Freeze drying was
conducted using a BPS Genisis II freeze dryer (SP Scientific, USA). The resulting dried
beads would be known as FDAB and FDXL60 respectively and investigated for bead
swelling in an identical manner compared to AB and ALXL60 as described in 4.2.2.
4.2.4 AFM Measurement
This work was done in collaboration with Andrea Bonilla-Brunner, Jacob Seifert and
Sonia Contera at Biophysics lab, Condense Matter Physics, University of Oxford.
4.2.4.1 AFM Indentation Experiments
In order to consider an average E* of the alginate beads and microcarriers, a 20 m
polystyrene bead (Sigma-Aldrich, 74491) (Young’s modulus (E) = 3GPa) was glued to a
Scanasyst-fluid + cantilever (spring constant k = 0.7-1.4N/m, resonance frequency =
150kHz, Bruker) using sealant (Weicon, Germany) by indenting the glue and
immediately pressing the bead until cantilever deflection was observed and setting for 5
minutes. Cantilevers were allowed to dry overnight.
Force vs. distance curves were obtained with a commercial MFP-3D AFM (Asylum
Research, Santa Barbara, CA). The cantilever was positioned on the highest part of the
bead by observing the piezo extension/retraction whilst moving the stage in both x and y
directions. Fast indentations of the beads were performed (45μm/s) to minimise the time-
dependent behaviour of the beads due to viscoelasticity or poroelasticity. A force trigger

105
point of 70 nN was used to indent the microbeads/microcarriers. The setup is shown in
Fig 4.1.
Due to the large amount of time and expertise required, the timepoints were based on the
availability of the collaborators as well as the equipment. Therefore, the timepoints were
not identical between experiments 4.2.4.2 – 4.2.4.4. However, they were all fairly
uniformly distributed during the 2 week period.
4.2.4.2 Comparison between ALXL37 and ALXL60
Following a 24 hour conditioning period. E* of ALXL37 and ALXL60 were measured
at day 1, day 6, day 8 and day 14. 9 beads were indented a total of 200 times each.
4.2.4.3 Mechanical properties of beads during cell culture
Based on ALXL60’s similar mechanical properties compared to ALXL37 (See 4.3.2.1)
as well as lower production time, ALXL60 was selected for cell culture. ALXL60 were
divided into 3 different groups within cell culture media with E* measured at days 1, 4,
7, 10 and 14 of culture using the method described above. The first group was measured
using the same method as section 4.2.4.2. Aliquots of the 2nd group were treated with
trypsin/EDTA for 5 minutes under 37°C, prior to each measurement. This accesses the
potential effects of trypsin/EDTA on bead properties. Finally, to assess microcarrier
stability during cell culture, MSCs were seeded onto the 3rd group of microcarriers at
5000 cells/cm2. At each measurement point, cells were detached from an aliquot of beads
using Trypsin/EDTA prior to AFM indentation.
4.2.4.4 Modified Measurement on AB and FDAB
The AFM indentation method was further optimized to develop quicker measurements
as well as establish statistically power for the data. The number of indentations was
decreased to 50 while a total of 30 beads were indented. Indentations of AB and FDAB
were conducted on day 1, day 5, day 8, day 12 and day 14.
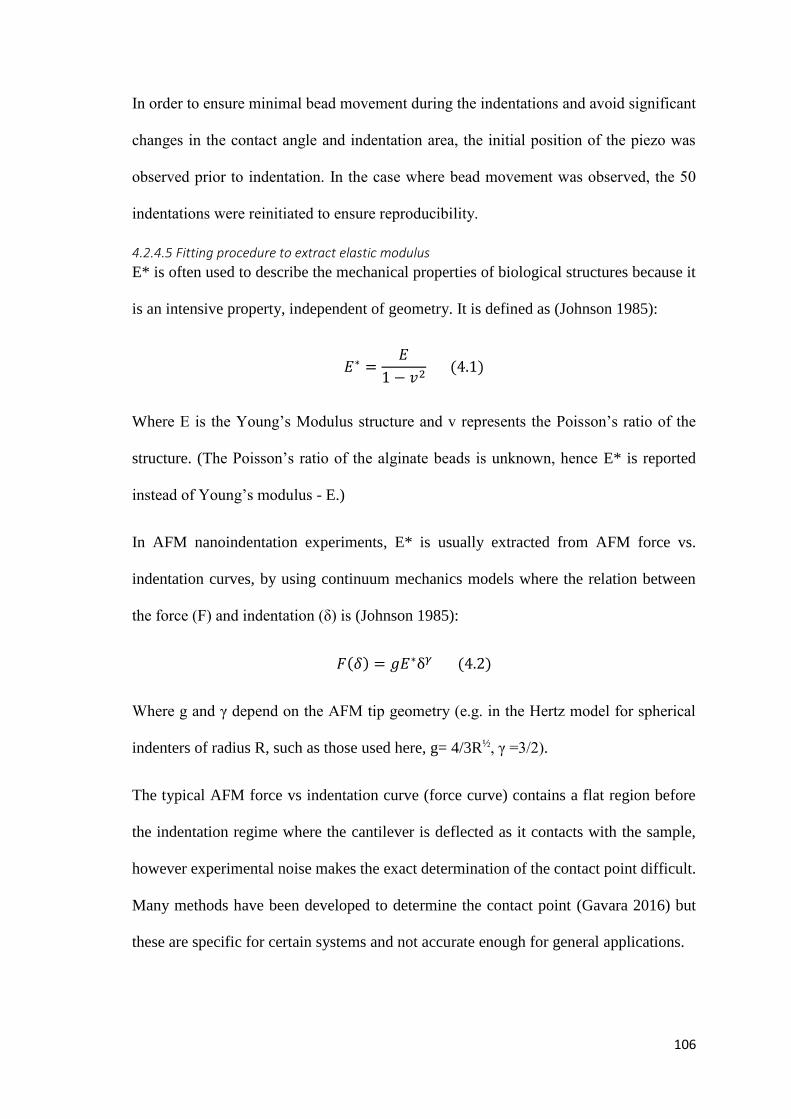
106
In order to ensure minimal bead movement during the indentations and avoid significant
changes in the contact angle and indentation area, the initial position of the piezo was
observed prior to indentation. In the case where bead movement was observed, the 50
indentations were reinitiated to ensure reproducibility.
4.2.4.5 Fitting procedure to extract elastic modulus
E* is often used to describe the mechanical properties of biological structures because it
is an intensive property, independent of geometry. It is defined as (Johnson 1985):
𝐸∗ =𝐸
1 − 𝑣2 (4.1)
Where E is the Young’s Modulus structure and v represents the Poisson’s ratio of the
structure. (The Poisson’s ratio of the alginate beads is unknown, hence E* is reported
instead of Young’s modulus - E.)
In AFM nanoindentation experiments, E* is usually extracted from AFM force vs.
indentation curves, by using continuum mechanics models where the relation between
the force (F) and indentation (δ) is (Johnson 1985):
𝐹(𝛿) = 𝑔𝐸∗δ𝛾 (4.2)
Where g and γ depend on the AFM tip geometry (e.g. in the Hertz model for spherical
indenters of radius R, such as those used here, g= 4/3R½, γ =3/2).
The typical AFM force vs indentation curve (force curve) contains a flat region before
the indentation regime where the cantilever is deflected as it contacts with the sample,
however experimental noise makes the exact determination of the contact point difficult.
Many methods have been developed to determine the contact point (Gavara 2016) but
these are specific for certain systems and not accurate enough for general applications.
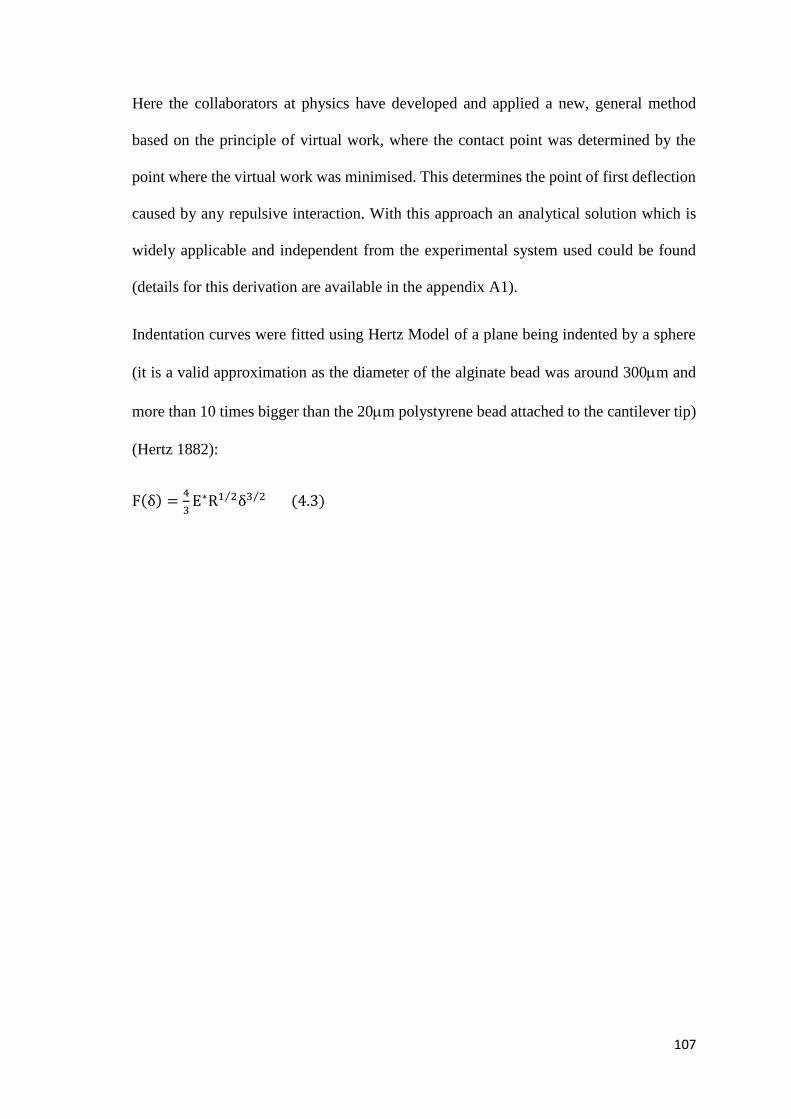
107
Here the collaborators at physics have developed and applied a new, general method
based on the principle of virtual work, where the contact point was determined by the
point where the virtual work was minimised. This determines the point of first deflection
caused by any repulsive interaction. With this approach an analytical solution which is
widely applicable and independent from the experimental system used could be found
(details for this derivation are available in the appendix A1).
Indentation curves were fitted using Hertz Model of a plane being indented by a sphere
(it is a valid approximation as the diameter of the alginate bead was around 300m and
more than 10 times bigger than the 20m polystyrene bead attached to the cantilever tip)
(Hertz 1882):
F(δ) =4
3E∗R1 2⁄ δ3 2⁄ (4.3)
108
A
B
Photo-detector
Laser
Piezoelectric scanner
Feedback loop from detector
Alginate Bead
Cantilever Tip
Rbead = 10 µm
Fig 4.1. AFM cantilever. A) Image of triangular cantilever with a 20 µm in diameter bead
attached. Figure produced by Andrea Bonilla-Brunner, Department of Physics, University
of Oxford. Reprinted from (Chui et al. 2019), permission not required as author of paper.
B) Schematic of AFM instrumentation depicting a spherical cantilever tip which indents
onto the surface of the alginate bead causing deflection on the cantilever.

109
4.2.5 Statistical Analysis
A two way ANOVA was used to determine significant changes in E* and diameter for
AB, FDAB, ALXL60 and FDXL60 during the two-week measurement period. A post-
hoc Tukey test was used to identify the significance.
An unpaired t test was used to compare the diameter of ALXL37 vs ALXL60.
P<0.05 was considered significant for both analyses.
Bootstrapping was performed on the E* values in order to estimate the standard error of
the mean. Each bootstrap contained 30 samples from the data with replacement, a total
of 100 bootstraps were performed.
4.3 Results and Discussion
4.3.1 Bead Swelling Behaviour in Cell Culture Media
The diameter of all the beads investigated displayed a normal distribution during the
swelling test. Hence, the immersing of alginate beads and the microcarriers in cell culture
media did not affect the distribution of the beads (see appendix). This justifies the use of
the ANOVA and t-test in order to analyse the changes in diameter throughout the 2 week
period.
4.3.1.1 AB Swelling Behaviour Stable Following 48 Hours in Cell Culture Media
AB created via electrospraying are shown in Fig. 4.2A in an optical microscopy image,
with a diameter of 217 ± 20μm on average (mean ± standard deviation). The beads
swelled to an average of 310 ± 20μm 24 hours after addition of DMEM (Fig. 4.2B).
Following this, the beads displayed significant swelling (n=30, p<0.05) from day 1 to day
2 (Fig 4.2C). However, the bead size remained stable over the rest of the measurement
period.
The swelling behaviour observed was due to the gelation mechanism of the alginate.
Divalent cations such as Ca2+ interact with both M and G blocks of alginate. Ca2+ packs
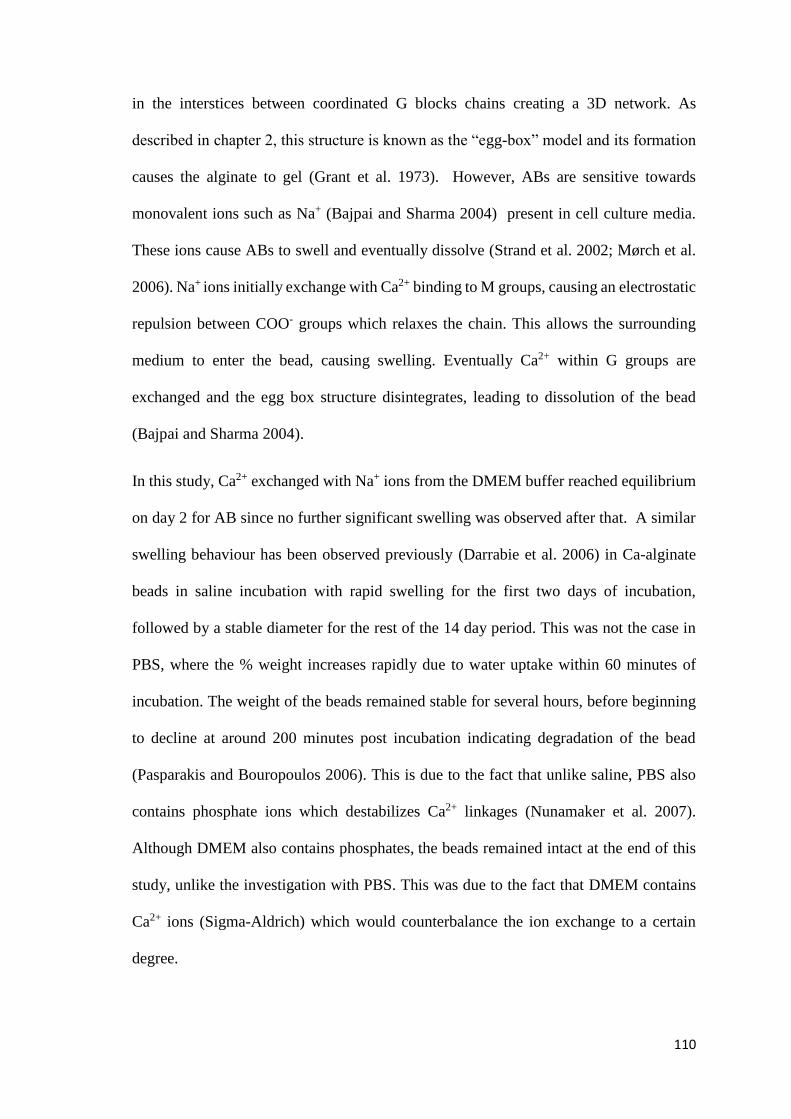
110
in the interstices between coordinated G blocks chains creating a 3D network. As
described in chapter 2, this structure is known as the “egg-box” model and its formation
causes the alginate to gel (Grant et al. 1973). However, ABs are sensitive towards
monovalent ions such as Na+ (Bajpai and Sharma 2004) present in cell culture media.
These ions cause ABs to swell and eventually dissolve (Strand et al. 2002; Mørch et al.
2006). Na+ ions initially exchange with Ca2+ binding to M groups, causing an electrostatic
repulsion between COO- groups which relaxes the chain. This allows the surrounding
medium to enter the bead, causing swelling. Eventually Ca2+ within G groups are
exchanged and the egg box structure disintegrates, leading to dissolution of the bead
(Bajpai and Sharma 2004).
In this study, Ca2+ exchanged with Na+ ions from the DMEM buffer reached equilibrium
on day 2 for AB since no further significant swelling was observed after that. A similar
swelling behaviour has been observed previously (Darrabie et al. 2006) in Ca-alginate
beads in saline incubation with rapid swelling for the first two days of incubation,
followed by a stable diameter for the rest of the 14 day period. This was not the case in
PBS, where the % weight increases rapidly due to water uptake within 60 minutes of
incubation. The weight of the beads remained stable for several hours, before beginning
to decline at around 200 minutes post incubation indicating degradation of the bead
(Pasparakis and Bouropoulos 2006). This is due to the fact that unlike saline, PBS also
contains phosphate ions which destabilizes Ca2+ linkages (Nunamaker et al. 2007).
Although DMEM also contains phosphates, the beads remained intact at the end of this
study, unlike the investigation with PBS. This was due to the fact that DMEM contains
Ca2+ ions (Sigma-Aldrich) which would counterbalance the ion exchange to a certain
degree.

111
Only DMEM was investigated in this study due to it being the media of choice for MSC
culture. However, it would be an interesting future work to investigate the swelling
behaviour of the microcarriers in other types of cell culture media such as RPMI or
DMEM F12. Each type of culture media has varying ionic concentrations of Ca2+ and
monovalent ions which would likely lead to different swelling behaviour and ratios
(Sigma-Aldrich 2018).

112
Conditioning
in Media
B
A
C
Fig 4.2. Alginate beads (AB) swelling in cell culture media over a 14 day period. A) AB in calcium
chloride solution created by electrospraying. Reprinted from (Chui et al. 2019), permission not
required as author of paper. B) Swelling of AB upon conditioning in medium. Reprinted from
(Chui et al. 2019), permission not required as author of paper. C) Bead diameter in DMEM culture
media over a 14 day period. Beads were immersed in media for 24 hours before the first
measurement was made. Error bars show standard deviation. Diameter on day 1 was
significantly lower compared to the rest of the measurements (Indicated by numbers above the
plot). There was no further significant changes in diameter after day 1, n=30, p<0.05. Error bars
show standard deviation. Scale bars represent 500 µm.

113
4.3.1.2 Swelling Behaviour of ALXL60 vs ALXL37 were Non-Significant
ALXL37 and ALXL60 microcarriers (Fig 4.3) displayed significantly (n=30, p<0.05)
lower swelling on day 1 compared to ABs with the diameter increasing from 220µm to
around 270µm. From day 1-2 further swelling was observed in both microcarriers from
270µm to around 290µm. The microcarriers were stable from day 2-14 with no significant
changes in diameter as equilibrium was reached (Fig 4.4). To ensure microcarriers remain
stable throughout culture, the conditioning period was raised to 48 hours in future
chapters.
Applying a coating layer around alginate beads have been previously shown to provide
resistance to the alginate core swelling hence increasing bead stability and lowering the
swelling ratio (Gåserød et al. 1999; Pasparakis and Bouropoulos 2006). This behaviour
was also observed in this study by the significantly lower swelling of the chitosan coated
ALXL37 and ALXL60 within DMEM compared to AB.
Although ALXL37 and ALXL60 displayed no significant difference in terms of
fluorescence intensity or coating layer thickness, high crosslinking temperatures of the
latter could alter rheological properties due to denaturisation or depolymerisation of the
hydrogel (Mao et al. 2004; Holme et al. 2008). This would lead to potential weakening
of the gel structure and hence the stability of the microcarriers. Therefore, to ensure
stability in cell culture conditions, bead swelling behaviour in media was assessed.
A t-test yielded no significant difference in diameter between ALXL37 and ALXL60 at
every time point. As both microcarriers also demonstrated diameter stability throughout
the culture, this demonstrates the swelling behaviour of the ALXL60 within cell culture
conditions were not compromised by the high temperatures used during crosslinking. Due
to the decreased production time, ALXL60 was selected as the microcarrier of choice for
the cell culture work.

114
B
Conditioning
in Media
A
C D
Fig 4.3. Microcarriers crosslinked at 37°C and 60°C (ALXL37 and ALXL60) swelling within cell
culture media. A) ALXL37 following genipin crosslinking. B) ALXL37 within DMEM. C) ALXL60
following genipin crosslinking. D) ALXL60 within DMEM. Scale bars represent 500µm.
115
4.3.1.3 Swelling Behaviour of FDAB and FDXL60 Differ from Freshly Made Counterparts
Upon freeze drying, both FDAB and FDXL60 shrunk into small ellipsoids with an
average diameter ± standard deviation of 90 ± 10µm and 130 ± 20µm respectively (Fig.
4.5A & C) however, the beads re-swelled into distinct spherical beads of diameter of 267
± 20μm and 250 ± 20µm following addition of DMEM (Fig. 4.5B & D).
This initial swelling on day 1 was also observed in both FDAB and FDXL60. For the
former, the diameter on day 2 remained significantly (n=30, p<0.05) smaller compared
to the diameter of day 8, 10, 11 and 14 (Fig 4.6). After day 2, the bead size remained
Fig 4.4. Microcarrier diameter within DMEM. Day 0 denotes the diameter prior to addition of
DMEM. Both ALXL37 and ALXL60 display significant swelling when submerged in media from day
0 to day 1. (Red) ALXL37, (Green) ALXL60. For both groups, bead diameter on day 1 was
significantly smaller compared to diameters measured at several days between days 2-14 as
denoted by *. For ALXL37, the diameter on day 1 was significantly smaller than the diameter on
day 3, 4, 6, 7, 9, 12, 13, 14. For ALXL60, the diameter on day 1 was significantly smaller than the
diameter on day 2, 3, 7, 8, 9, 11, 12, 14. Both ALXL37 and ALXL60 had a significantly lower
diameter compared to AB (Black) as denoted by **. Microcarrier diameter remained stable from
day 2-14 for all groups. n=30, p<0.05. Error bars represent standard deviation.

116
stable. On the other hand, for FDXL60, the beads remain stable from day 2-14. The
diameter of FDAB was significantly higher compared to FDXL60 for all of the days (Fig
4.6).
When compared to AB and ALXL60, both FDAB and FDXL60 were significantly (n=30,
p<0.05) smaller compared to the freshly made counterparts on all days. This could be due
to structural changes produced upon freeze drying. It is known that collapse of the
hydrogel porous structure could result from the freeze drying process if the drying
temperature exceeds the glass transition point of alginate beads (Barley). However, it was
unlikely that this occurred due to the low temperature of the process (- 40 ºC slowly
ramped to -20 ºC during the drying phase); the fact that FDAB and FDXL60 remained
spherical following addition of media (Fig 4.5) also makes this hypothesis unlikely.
Oven-dried beads have been shown to deform and shrivel, indicating serious deformation
and structural collapse (Abubakr et al. 2009; Liu et al. 2016), which differs from our
findings. Shrinkage of the alginate hydrogel structure during freeze drying is expected;
ice sublimation during freeze drying generates pores leading to shrinkage of the beads
due to surface forces as the ice crystals leave the structure (Krokida and Karathanos
1998). Such material shrinkage due to water loss could result in a molecular
rearrangement such as increased chain entanglement arising from inter-chain interactions
and H-bond formation (Sideridou et al. 2003; Domarecka et al. 2016). This is distinct
from structural collapse which would be seen if lyophilisation were to exceed the glass
transition temperature (Rambhatla et al. 2005). Therefore a smaller bead diameter after
rehydration is likely to reflect a slight compaction of the alginate polymer through
lyophilisation. Thus the final diameter would be lower compared to freshly made
counterparts despite further swelling of the freeze dried beads in culture media due to
sodium ion exchange.
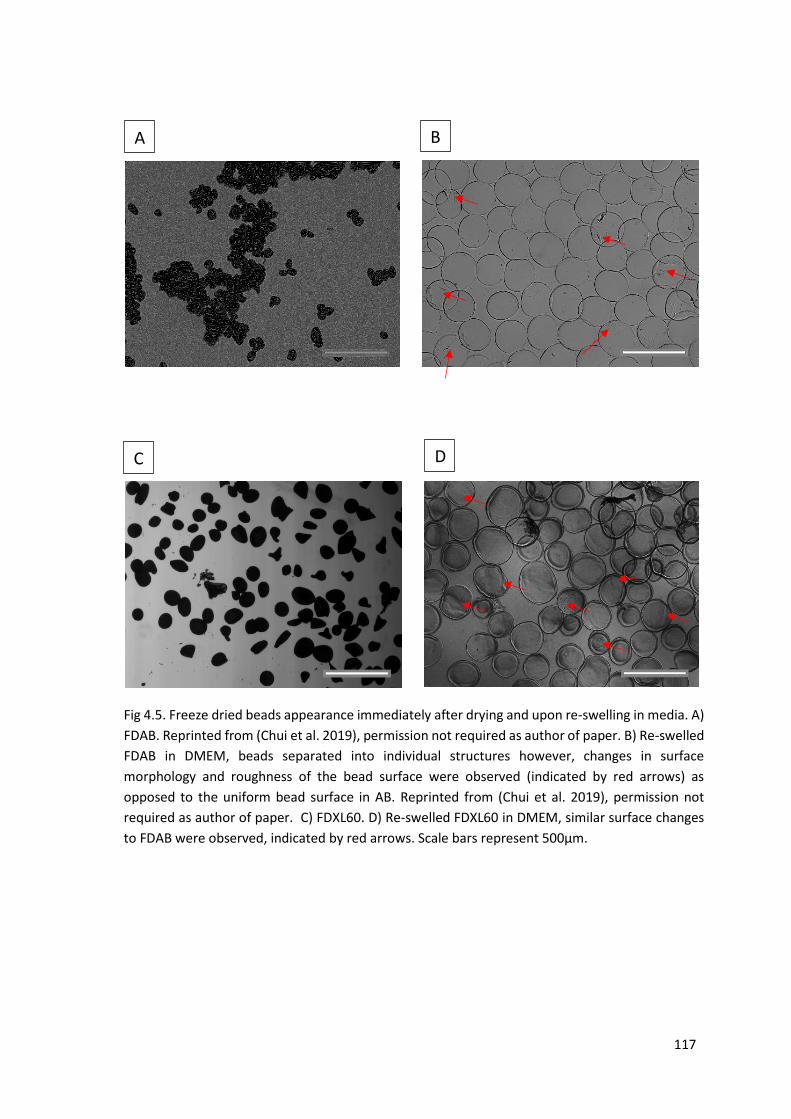
117
A B
C D
Fig 4.5. Freeze dried beads appearance immediately after drying and upon re-swelling in media. A)
FDAB. Reprinted from (Chui et al. 2019), permission not required as author of paper. B) Re-swelled
FDAB in DMEM, beads separated into individual structures however, changes in surface
morphology and roughness of the bead surface were observed (indicated by red arrows) as
opposed to the uniform bead surface in AB. Reprinted from (Chui et al. 2019), permission not
required as author of paper. C) FDXL60. D) Re-swelled FDXL60 in DMEM, similar surface changes
to FDAB were observed, indicated by red arrows. Scale bars represent 500µm.

118
4.3.1.4 ALXL60 Swelling Unaffected by Cell Presence
Cell attachment on the microcarrier surface could potentially affect their stability due to
the consumption of growth factors within the culture media. This alters the culture
environment of the microcarrier and hence could influence swelling behaviour. However
as presented in Fig 4.7, MSC growth on ALXL60 and FDXL60 did not significantly
affect the stability or the size of the beads compared to their counterparts without cells .
This shows that the presence of cells attached onto the surface of the microcarrier does
not affect the swelling behaviour. As the microcarriers were given 48 hours to condition
rather than 24, the microcarrier diameter on day 1 was non significant to the rest of the
time points.
Fig 4.6. Diameter of FDAB (Blue) and FDXL60 (Red) after re-swelling in media over a 2 week
period. Significance was denoted by day number above the plots. * denotes the diameter
of FDAB was significantly larger compared to FDXL60 on all of the days, n=30, p<0.05. Error
bars represent standard deviation.

119
A
B
Fig 4.7. Microcarrier diameter changes during MSC proliferation on beads crosslinked at 60°C
following a two day conditioning period, prior to cell seeding (day 0). A) Diameter of ALXL60 seeded
with MSCs, ALXL60-MSC (Blue) compared to diameter of blank ALXL60 (Red) and B) Diameter of
FDXL60 seeded with MSCs, FDXL60-MSC (Blue) compared to diameter of blank FDXL60 (Red) over
the 14 day period. n=30, p<0.05. Error bars represent standard deviation. The presence of cells did
not significantly affect the microcarrier swelling properties.

120
4.3.2 Reduced Young’s Modulus of the Beads
The E* of the beads were calculated from indentation experiments as described in the
methods section and in Fig. 4.8 which shows the a) cantilever used with an attached 20
µm bead, b) an example of a force/indentation curve on an alginate bead with the contact
point and the Hertz model fit on the trace from 10 to 400 nm. This range of fitting was
chosen since it corresponds to low forces and small indentations in order to avoid non-
linear elasticity effects (Gavara 2016).
Contact point
B
Rbead
= 10 µm A
Fig 4.8. AFM indentation experiments. A) Image of the triangular cantilever with a 20 µm
diameter bead attached. B) Force vs displacement (𝛿) curve showing the contact point in the
loading curve in red (when the cantilever is approaching the sample), the unloading curve in
blue (when the cantilever is retracting after the contact was made) and the Hertz Model fit
10nm after the contact point to 400 nm. Figures were produced by Andrea Bonilla-Brunner at
Department of Physics, University of Oxford. Reprinted from (Chui et al. 2019), permission not
required as author of paper.
121
4.3.2.1 No Conclusive Result could be Drawn from Reduced Young’s Modulus (E*) of ALXL37 and
ALXL60
Results from cantilever indentation appear to show that no significant difference between
E* of ALXL37 and ALXL60 beads (Fig 4.9A). Due to its lower production time and
swelling results, ALXL60 was selected for the next study which appear to show the
presence of cells or trypsin treatment do not affect E* of the microcarriers (Fig 4.9B).
However, both these results are preliminary and more importantly lack statistical power
due to only 9 microcarriers being measured. The low number of beads was selected due
to the long operating times of the AFM as well as the large number of indentations (200)
by the cantilever on each bead.
In addition to the lack of statistical power, there was a large variation in E* within the 9
microcarriers measured at each time point, with the RSD reaching 35%. The large RSD
could have arisen from the non-homogeneity of the chitosan coating layer of the
microcarriers. Although the coating layer thickness and fluorescence intensity were
measured in chapter 3, the results were limited by the low resolution of the optical
microscope. Moreover, the fluorescent intensities and coating layer thickness measured
were averages of across the whole bead. In contrast, the AFM cantilever indentations
measure the local E* on the microcarrier surface. Hence, slight fluctuations of coating
layer thickness and crosslinking density across the microcarrier surface would result in
variations of E* values. Therefore, it would be difficult to conclude whether the
significant alterations in E* between different timepoints throughout the 14 day culture
(Fig 4.9) was due to the ion exchange within the alginate core or rather the high variance
within bead batches.
In addition to the resolution limit of the optical microscope preventing an accurate value
of the coating layer thickness being measured, the swelling of the alginate core would
cause the chitosan genipin coating layer to stretch, altering the thickness measured in
122
chapter 3. Due to this, it was unknown whether the E* measured was a result of feedback
from both the coat and the core of the microcarrier or the coating layer alone. This could
vary between microcarriers due to the variations in coating layer thickness and would
lead to a high standard deviations of the E* measured.
Another factor that potentially contributed to the high standard deviation in E* was the
movement of the microcarriers during the 200 indentations. Sample movement alters the
contact angle between the material surface and the cantilever causing the sample to
appear softer. Eventually the bead surface would move beyond the range of the cantilever
indentation requiring the cantilever to be repositioned at the apex of the bead, yielding
the true value of the bead once again. This was evident in Fig 4.10A, where large
variations within the 200 indentations was observed for a microcarrier which displayed
movement during the process. On the other hand, the E* values remain relatively uniform
from a microcarrier which remained stationary (Fig 4.10B).
Due the potential sources of error described above, the accuracy and reliability of
ALXL60 and ALXL37’s mechanical properties could not be assured. Therefore, E* of
AB and FDAB were measured instead, as unlike the microcarriers, alginate microbeads
do not have two distinct layers. In order to limit the movement of beads during
indentation, the number of indentations was lowered from 200 to 50. This decreases the
measurement time and ensures minimal bead movement. In addition, this shortens the
measurement time per bead and would allow a larger sample of beads to be measured
(n=30). Although the E* values of the microcarriers would differ from alginate
microbeads, the microcarriers comprises of an alginate core and changes in stability are
primarily due to the alginate core swelling. Hence, measurement of the changes in E* for
alginate microbeads could still provide a certain degree of knowledge of the microcarriers
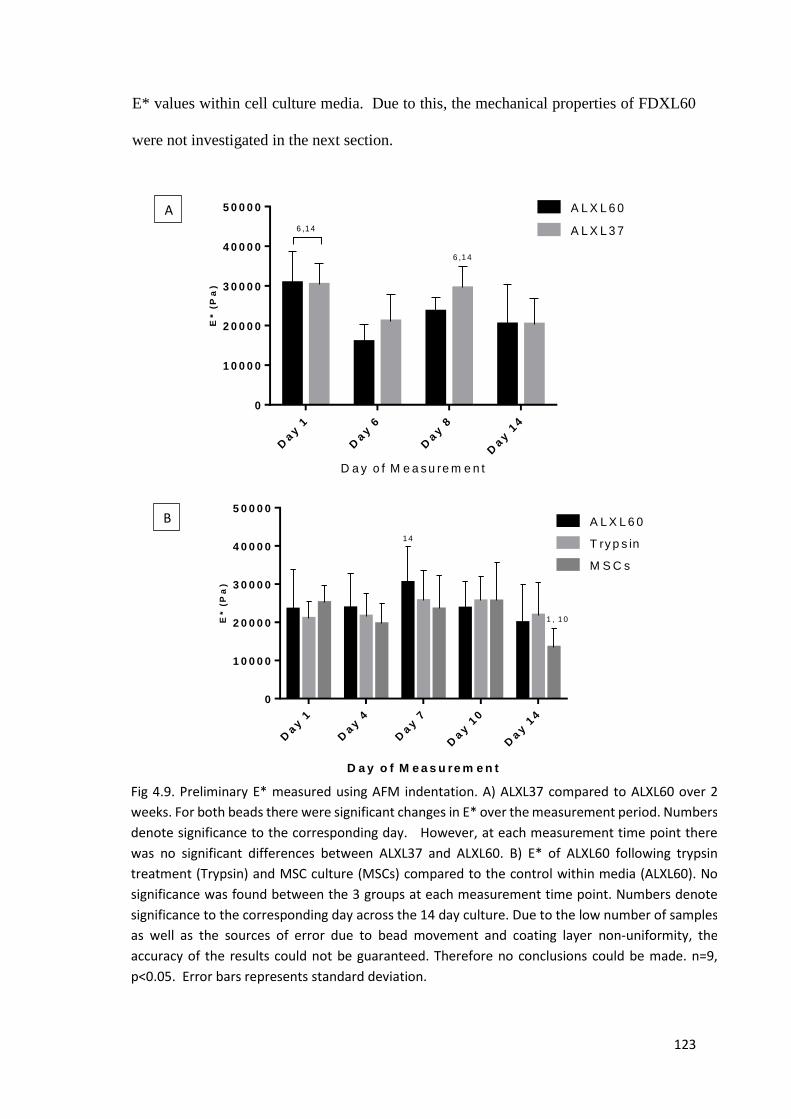
123
E* values within cell culture media. Due to this, the mechanical properties of FDXL60
were not investigated in the next section.
Day 1
Day 6
Day 8
Day 1
4
0
1 0 0 0 0
2 0 0 0 0
3 0 0 0 0
4 0 0 0 0
5 0 0 0 0E
* (
Pa
)A L X L 6 0
A L X L 3 76 ,1 4
6 ,1 4
D a y o f M e a s u re m e n t
B
A
Day 1
Day 4
Day 7
Day 1
0
Day 1
4
0
1 0 0 0 0
2 0 0 0 0
3 0 0 0 0
4 0 0 0 0
5 0 0 0 0
D a y o f M e a s u re m e n t
E* (
Pa
)
A L X L 6 0
T ry p s in
M S C s
1 , 1 0
1 4
Fig 4.9. Preliminary E* measured using AFM indentation. A) ALXL37 compared to ALXL60 over 2
weeks. For both beads there were significant changes in E* over the measurement period. Numbers
denote significance to the corresponding day. However, at each measurement time point there
was no significant differences between ALXL37 and ALXL60. B) E* of ALXL60 following trypsin
treatment (Trypsin) and MSC culture (MSCs) compared to the control within media (ALXL60). No
significance was found between the 3 groups at each measurement time point. Numbers denote
significance to the corresponding day across the 14 day culture. Due to the low number of samples
as well as the sources of error due to bead movement and coating layer non-uniformity, the
accuracy of the results could not be guaranteed. Therefore no conclusions could be made. n=9,
p<0.05. Error bars represents standard deviation.

124
4.3.2.2 Freeze Drying has Significant Effect on Reduced Young’s Modulus (E*)
The E* of AB was significantly (n=30, p<0.05) higher on day 1 however, there was no
significant change in E* over the rest of the 2-week period (Fig 4.11A). Compared to AB,
the freeze drying process resulted in a significantly (n=30, p<0.05) higher E* in FDAB.
Freeze drying creates microscale porosity by sublimation of ice crystals embedded within
the polymeric lattice (Oikonomopoulou et al. 2011; Liu et al. 2016). Hence, as the ice
crystals leave the structure, the remaining hydrogel polymer becomes denser, with higher
inter-chain entanglement, and a rougher surface (as discussed in 4.3.1.3). This
restructuring may account for the higher E* of FDAB, compared to AB. However, the
softening (reduction of E*) of FDAB that occurred on day 12 to day 14 may be due to
some slow Na+ ion exchange with Ca2+. This is in agreement with the generally expected
swelling of calcium alginate gels in physiological media, as seen with the freshly made
beads.
The AB and FDAB had a RSD of around 20% which was lower compared to the
microcarriers described in section 4.3.2.1. This could be due to the lower movement of
the bead during the 50 indentations (Fig 4.10C). Moreover, as a total of 30 beads were
indented, the results had greater statistical power compared to the E* values of ALXL37
and ALXL60 where only 9 beads were measured. Additionally, the mechanical properties
of the beads follow a normal distribution (see appendix) justifying the validity of the
ANOVA test employed during the statistical analysis.
Changes in E* of the beads during the two week period could be used as an indication of
the stability of the microbeads during cell culture applications. Although bead swelling
is related to the stability of the beads, mechanical properties of hydrogels normally alter
prior to any physical change (Kleinberger et al. 2013) therefore, it was necessary to
perform both tests in parallel.
125
4.3.3 Hertz model Valid for Indentation Experiments
The compressed materials are required to be linearly elastic and follow Hooke’s law for
Hertz’s theory to be valid (Dintwa et al. 2008). Because of this, the chosen fitting region
of the force vs distance curves was 10 to 400 nm, since it corresponds to low forces and
small indentations in order to avoid non-linear elasticity effects (Gavara 2016) and fall
within the Hertzian limit.
Alginate beads behave viscoelastically and poroelastically as the water content within the
beads is pushed out during the deformation of the bead, causing the measurement to be
time dependent. However, it has been shown that at high compression speeds the time
dependent behaviour could be neglected (Wang et al. 2005). Furthermore, the standard
deviation of the E* values within the 50 indentations for AB and FDAB (4.10C) was low,
with a relative standard deviation of roughly 10%, suggesting that the results were time
independent, hence any viscoelastic responses could be neglected as they will be minimal
compared to E*. Additionally, small dispersions in E* values can be an indication of the
lack of bead movement in between each indentation, indicating experimental
reproducibility.
4.3.4 Limitations of Indentation Experiments
Standard error is used to measure how the mean of a sample group deviates from the
population mean. On the other hand standard deviation measures the variability of the
population from which the sample is drawn (Altman and Bland 2005). In other words,
standard deviation measures the spread within the sample, while standard error measures
the accuracy of the sample mean from the population mean. Both have statistical
relevance and provide different information about the data. However in this study the
standard error is chosen because there were several potential sources of error and
variation during the indentation process. Firstly, the position of the bead was optimised
(to the highest part of the alginate bead) by the position of the piezo, but this could lead

126
to slight variations of the angle between the cantilever and the bead surface. Secondly,
there is a natural variation in bead diameter from electrospraying. These errors could
lead to differences in means of each sample compared to the population mean and hence
standard error can show the extent of these differences.

127
0 5 0 1 0 0 1 5 0 2 0 0
0
1 0 0 0 0
2 0 0 0 0
3 0 0 0 0
In d e n ta t io n N u m b e r
E* (
Pa
)
0 5 0 1 0 0 1 5 0 2 0 0
0
5 0 0 0
1 0 0 0 0
1 5 0 0 0
2 0 0 0 0
In d e n ta t io n N u m b e r
E* (
Pa
)
0 2 0 4 0
0
5 0 0
1 0 0 0
1 5 0 0
2 0 0 0
In d e n ta t io n N u m b e r
E* (
Pa
)
A
B
C
Fig 4.10. Effect on microcarrier movement during indentation on reduced moduli (E*). A) As
ALXL37 and ALXL60 moved during the 200 indentation method, the contact angle between
the cantilever and surface decreased causing the beads to appear softer (indicated by red
circles). The cantilever was readjusted back into position leading to the higher true value of
E*. B) For beads that remained relatively still, E* obtained were relatively uniform throughout
the 200 indentations. C) When the number of indentations was decreased to 50 during
measurement of AB, the beads remained in place during measurement yielding uniform E*
with relative standard deviation less than 10% for all the beads indented. Reprinted from
(Chui et al. 2019), permission not required as author of paper.

128
A
B
Fig 4.11. Reduced modulus measured on day 1, 5, 8, 10 and 14 post conditioning, of AB (A) and FDAB
(B). Error bars show standard error to the mean. Bead diameter from bead swelling measurements
were plotted on the secondary axis. A) E* on day 1 was significantly higher compared to rest of the
measurements, denoted by *. B) Stiffness measured on day 1, 5 and 8 were significantly higher
compared to day 12 and 14, denoted by *. n=30, p<0.05. Reprinted from (Chui et al. 2019),
permission not required as author of paper.
0 5 1 0 1 5
1 0 0 0
2 0 0 0
3 0 0 0
4 0 0 0
0 .1
0 .2
0 .3
0 .4
D a y o f M e a s u re m e n t
E*(P
a)
Be
ad
Dia
me
ter (m
m)
*
B e a d D ia m e te r
0 5 1 0 1 5
2 0 0 0
3 0 0 0
4 0 0 0
5 0 0 0
6 0 0 0
0 .1
0 .2
0 .3
0 .4
D a y o f M e a s u re m e n t
E*(P
a)
Be
ad
Dia
me
ter (m
m)
ns
*
*
*
B e a d D ia m e te r
129
4.4 Conclusions This chapter demonstrated that the diameter of ALXL37, ALXL60 and FDXL60 were
stable in cell culture conditions for a period of 14 days. The genipin crosslinked chitosan
coat of the microcarriers provided a certain degree of resistance to bead swelling
increasing their stability and lowering swelling ratio compared to AB. Moreover,
ALXL60 displayed no significant difference in diameter and stability compared to
ALXL37 suggesting that the higher crosslinking temperature does not affect the bead
swelling in cell culture medium. Hence, this method would significantly lower production
time of the microcarriers.
Mechanical properties, such as stiffness of the beads plays an important role to their
performance as microcarriers. Stem cell proliferation and differentiation are highly
dependent on the stiffness of the materials they are grown on (Murphy et al. 2014).
Additionally, the stability of the microcarriers’ stiffness is vital to ensure that these cell
growth properties remain consistent throughout the entire culture period.
Therefore, in parallel to measuring the bead diameter, the E* of the microcarriers and
alginate microbeads was accessed. This was achieved through measurement of the local
mechanical properties via AFM microindentations over the course of two weeks. Due to
the possible non-uniformity in coating layer thickness as well as movement of the beads
microcarriers indentation, the E* values of ALXL60 and ALXL37 yielded a large
standard deviation and no conclusions could be made. However, the E* of AB and FDAB
was successfully measured.
To demonstrate whether freeze drying has an effect on the bead diameter and E* stability,
AB and ALXL60 were freeze dried forming FDAB and FDXL60. However,
heterogeneous and shrivelled areas of the beads’ surfaces were observed on FDAB and
130
FDXL60 following re-swelling in media. Moreover, beads did not re-swell to similar
diameters displayed by AB and ALXL60. E* of the FDAB was also significantly higher
compared to AB counterparts. These differences could be due to the shrinkage of the
alginate beads during freeze drying. Whether this potential change has an effect on cell
growth would be discussed in the next chapter.

131
Chapter 5 – Cell Growth on Alginate Based Microcarriers
5.1 Introduction In this chapter, the performance of ALXL60 and FDXL60 during MSC expansion was
compared with Cytodex 1, a popular commercial non porous microcarrier (GE Healthcare
2011a). Cytodex 1 has been used previously for MSC expansion and reported to yield the
highest seeding efficiency (57%) out of 9 commercial microcarriers during hMSCs
expansion within spinner flasks (Schop et al. 2009). Moreover, Cytodex 1 have shown
higher seeding efficiency compared to Cytodex 2 and Cytodex 3 for porcine MSCs
(Frauenschuh et al. 2007). Hence, Cytodex 1 was selected as to serve as a benchmark for
ALXL60 and FDXL60. Additionally, the difference in performance of ALXL60 to
FDXL60 was also compared to determine the effect of freeze drying on the cell culture
capabilities of the microcarriers.
The material of microcarriers plays a large role in stem cell growth and hence the
screening and selection of microcarriers is important prior to any large scale culture.
ALXL60 and FDXL60 were screened against Cytodex 1 based on criteria adopted by
previous studies who conducted screening of several commercial microcarriers for MSC
expansion (Schop et al. 2009; Rafiq et al. 2016). These criteria include i) the cell
attachment efficiency on the microcarriers following seeding, ii) the ability to efficiently
harvest cells from the microcarriers and iii) the extent of cell proliferation on the
microcarriers. Following harvest, it is critical to ensure that the material of the
microcarrier did not affect stem cell phenotype, hence qPCR was performed comparing
gene expressions of key MSC markers of cells harvested from microcarriers to cells
grown on 2D culture.
Human Dermal Fibroblasts (HDFs) were used as a template cell for initial studies due to
their lower cost as well as possessing a similar morphology to MSCs (Friedenstein et al.
132
1970). Following this, green fluorescent protein (GFP) – hTERT modified MSCs were
seeded onto the microcarriers.
5.2 Materials Primary adult HDFs (Catalog number C0135C) were purchased from Thermofisher
(USA). GFP-hTERT modified human MSCs (ABM, Canada) were kindly provided by
the Department of Pediatrics and Adolescent Medicine, LKS Faculty of Medicine, The
University of Hong Kong. Cytodex 1, Sigmacote, Crystal Violet, citric acid, Tryton X-
100 and CCK-8 were purchased from Sigma Aldrich (USA). cDNA synthesis kit and
SyGreen Blue Mix Lo-Rox were obtained from qPCRBio (UK). RNAeasy Plus Microkit
was purchased from Qiagen (Netherlands).
5.3 Methods
5.3.1 Cell Culture
HDFs and MSCs were defrosted from frozen and seeded at 5000 cells/cm2. High glucose
DMEM with 10% FBS and 1% P/S was used to culture HDFs. On the other hand, MSCs
were cultured in low glucose DMEM with 10% FBS and 0.1% P/S.
Cells were maintained at 37°C and 5% CO2. Media exchange was performed every 3
days. Both cells were harvested when 80% confluent using Trypsin/EDTA.
All cell experiments are conducted in triplicates (n=3).
5.3.2 Cell Inoculation
ALXL60, FDXL60 and Cytodex 1 with a total surface area of the 75cm2 were used. In
order to predict the total bead surface area, two assumptions were made:
1) Microcarriers were perfectly spherical.
2) Microcarriers were packed in a face centred cubic arrangement with an atomic
packing factor of 0.74.
The total surface area was then estimated as follows:

133
1) The volume and surface area of an individual microcarrier were calculated using
the average microcarrier diameter.
2) The apparent volume of the microcarrier bed was measured.
3) The true volume of the microcarriers was estimated using the atomic packing
factor of 0.74.
4) The true volume of all the microcarriers was divided by the volume of a single
microcarrier yielding the total number of microcarriers.
5) The surface area of an individual microcarrier was multiplied by the total number
of microcarriers giving the total surface area.
It was essential that an equivalent growth surface area of Cytodex 1 (Sigma Aldrich,
USA) was used to ensure a fair comparison between the microcarriers. The required
amount of Cytodex 1 to be weighed out using the approximate surface area per gram of
dry weight provided by the manufacturer as 4400cm2/g (GE Healthcare 2011a). Cytodex
1 were hydrated in DI water and autoclaved.
22ml glass vials were siliconized using Sigmacote (Sigma Aldrich, USA) to prevent cells
adhering to the vessel walls. The required amount of microcarriers was added to the vial
and suspended within 10ml of media (Fig 5.1). Based on the results from assessing
microcarrier swelling within a cell culture environment (Chapter 4), microcarriers were
allowed to condition in media for 2 days (48 hours). Following this, the media was
exchanged and the desired amount of cells was seeded into each vial. The vials were
placed on an orbital shaker for 5 minutes at 90 rpm. Following this, the microcarriers
were placed in static culture in an incubator at 37° C and 5% CO2.

134
5.2.3 Cell Attachment
To investigate cell attachment efficiency, cells were seeded at a density of 15000cells/cm2
onto microcarriers with an equivalent growth area of 75cm2. This seeding density was
higher compared to the density used in proliferation studies, as this would provide a
sufficient cell count during the assessment of cell attachment and detachment (Pall 2015).
24 hours after cell inoculation, the supernatant of the microcarrier suspension was
sampled and the unattached cells were counted using a Countess cell counter (Invitrogen,
USA). The attachment efficiency (A) was determined by:
𝐴 =𝐶𝑇 − 𝐶𝐷
𝐶𝑇 (5.1)
1
2
3
Fig 5.1. Setup of microcarrier culture within 22ml glass vials. 1) Glass surface is treated with
Sigmacote to prevent cell attachment. 2) 10ml of media was added for cell culture. 3) ALXL60
microcarrier layer providing 75cm2 of available cell growth area.

135
Where CT is the total number of cells seeded, and CD represents the number of cells that
did not attach on the microcarriers. The microcarriers were too large to enter the cell
counting plate and hence were always excluded.
5.3.4 Detachment Efficiency
Following the measurement of attachment efficiency, the microcarriers were allowed to
settle and media was removed. Microcarriers were washed with PBS twice to remove all
unattached cells. Trypsin/EDTA was added to the microcarrier suspension and incubated
at 37°C for 5 minutes. Following this, the microcarrier suspension were gently pipetted
to release the trypsin treated cells from the microcarrier surface creating a single cell
suspension. Culture media was then added to inactivate the trypsin. The total number of
cells harvested was counted by sampling the supernatant. The detachment efficiency (D)
was estimated by:
𝐷 =𝐶𝐻
𝐶𝑇 − 𝐶𝐷 (5.2)
Where CH is the total number of cells harvested using trypsin. The viability of the
harvested cells was measured using the Trypan blue assay.
5.3.5 Cell Proliferation
Cell proliferation on microcarriers was investigated for 14 days. Cells were seeded onto
the microcarriers at 5000cells/cm2 with an approximate growth surface area of 75cm2.
The amount of media added to each sample was constant at 10ml. CCK-8 assay was
performed on day 1, 4, 7, 10, and 14 (with cells being seeded at day 0) to measure cell
metabolic activity. WST-8 within the CCK-8 assay was reduced by metabolites in live
cells to give rise to a yellow-orange coloured dye which could be measured on an
absorbance spectrum (Tominaga et al. 1999). According to the suppliers’ protocol, the
amount of dye reduced by cellular activity is directly proportional to the number of living

136
cells (Sigma-Aldrich). Hence, this assay could be used to provide an indication of cell
proliferation on the microcarriers. The assay was described to possess low toxicity to
cells (Dojindo 2016). Therefore, the presence of the assay should not influence the total
viable cell number.
Before each measurement 5ml of culture media was removed. 150µl of CCK-8 solution
was added to the microcarriers culture and incubated for 4 hours at 37°C. Following the
incubation period, 100µl of media samples were transferred to a 96 well plate. A TECAN
(Switzerland) multifunction microplate reader was used to measure the absorbance of the
samples at 450nm. The fold increase of the cell number was estimated by the following
equation:
𝐶𝑒𝑙𝑙 𝐹𝑜𝑙𝑑 𝐼𝑛𝑐𝑟𝑒𝑎𝑠𝑒 =𝐴𝑏𝑜𝑠𝑟𝑏𝑎𝑛𝑐𝑒 𝑣𝑎𝑙𝑢𝑒 𝑜𝑛 𝑑𝑎𝑦 𝑜𝑓 𝑚𝑒𝑎𝑠𝑢𝑟𝑒𝑚𝑒𝑛𝑡
𝐴𝑏𝑠𝑜𝑟𝑏𝑎𝑛𝑐𝑒 𝑣𝑎𝑙𝑢𝑒 𝑜𝑛 𝑑𝑎𝑦 1 (5.3)
Cell free microcarriers were used to determine the background.
For MSC culture, additional microcarriers with a total surface area of 75cm2 were added
to the microcarrier cultures on day 6, increasing the growth surface to 150cm2. Cell
culture media used was doubled to 20ml accordingly and 15ml of media was removed
during subsequent addition of CCK-8.
5.3.6 RNA Extraction
MSCs were enzymatically dissociated from the microcarriers using trypsin. Cells were
separated from the microcarriers using a 40µm cell strainer. The cell number was counted
and roughly divided into 500,000 cell batches. Each batch of cells was washed twice with
PBS and centrifuged. The cell pellet was stored at -80°C. Cells from the same batch
grown in 2D culture but not seeded onto the carriers for the 14 day proliferation were
frozen down and used as the control group (referred to as the 2D control).

137
RNA extraction was performed using RNAeasy Plus Microkit (Qiagen, Netherlands),
according to the manufacturer’s instructions. Briefly, following cell lysis, the lysate was
passed through a gDNA eliminator column, and ethanol was subsequently added to the
flow through. The mixture was transferred into an RNeasy spin column where RNA binds
to the membrane of the column and several washes were conducted to remove
contaminants. Finally, RNA was eluted from the column with RNase free water.
To each sample a total of 0.1µg/µl of RNA was converted to cDNA by adding 20x reverse
transcriptase and 5x cDNA mix, adjusting to a final volume of 20µl with PCR grade
water. According to the suppliers’ instructions, samples were incubated at 42°C for 30
minutes, followed by 10 minutes at 85°C. The cDNA created was stored at -20°C.
5.3.7 Quantitative Polymerase Chain Reaction (qPCR)
cDNA samples were analysed by real-time qPCR. The amplification was performed in
triplicates using SyGreen Blue Mix Lo-Rox. All reactions were performed with 3
biological repeats and 3 technical repeats (n=9). Each sample has a total volume of 20µl
with 1µl of cDNA and 400nM of forward and reverse primers. Amplification of cDNA
was achieved using a Rotor Gene Q Series, Qiagen (Netherlands), beginning with an
initial activation and denaturing step holding at 95°C for 2 minutes. This was followed
by 40 cycles with 3 sec at 95°C and 25 sec at 60°C. Each cycle was run for another 25
sec at 72°C during which data was acquired.
Primers were used to detect CD-90 (THY1), CD-105 (ENG), and CD-73 (NT5E),
representing positive MSC markers, as well as CD-45 (PTPRC) and CD-34, representing
negative MSC markers. Primer information, accession numbers and amplicon sizes are
shown in Table 5.1. Primers were designed by Erfan Soliman at Institute of Biomedical
Engineering, University of Oxford. Gene expression levels were determined using the
comparative CT method. Delta CT (CT) values were obtained after normalization to the

138
reference gene GAPDH. Relative gene expression was calculated using delta-delta CT
(ΔΔCT) values obtained by normalizing the ΔCT values for ALXL60, FDXL60 and
Cytodex 1 to the 2D control group (Livak and Schmittgen 2001):
𝑅𝑒𝑙𝑎𝑡𝑖𝑣𝑒 𝐺𝑒𝑛𝑒 𝐸𝑥𝑝𝑟𝑒𝑠𝑠𝑖𝑜𝑛 = 2−ΔΔCT (5.4)
Gene Accession
Number
Primer Sequence Amplicon
Size
GAPDH NM_001256799 F: GGATTTGGTCGTATTGGG
R: GGAAGATGGTGATGGGATT
204
CD-90
(Thy1) NM_001311160 F: GCATTCTCAGCCACAACCAA
R: TTGTAGCCCTCTCCACTGTG
242
CD-105
(Eng) NM_000118 F: CAACATGCAGATCTGGACCAC
R: CTTTAGTACCAGGGTCATGGC
319
CD-73
(NT5E) NM_001204813 F:
GACAGAGTAGTCAAATTAGATG
R: TGAGAGGGTCATAACTGG
64
CD-45
(PTPRC) NM_002838 F:
GGAAGTGCTGCAATGTGTCATT
R:
CTTGACATGCATACTATTATCTG
ATGTCA
102
CD-34 NM_001025109 F: CAGGAGAAAGGCTGGGCGAA
R: GAATGGCCGTTTCTGGAGGT
163
Table 5.1. Genes analysed, accession numbers, primer sequences for qPCR and amplicon sizes in base pairs. Primers were designed by Erfan Soliman at Institute of Biomedical Engineering, University of Oxford. Reprinted with permission from (Chui et al. 2018) license number 4575971342557.
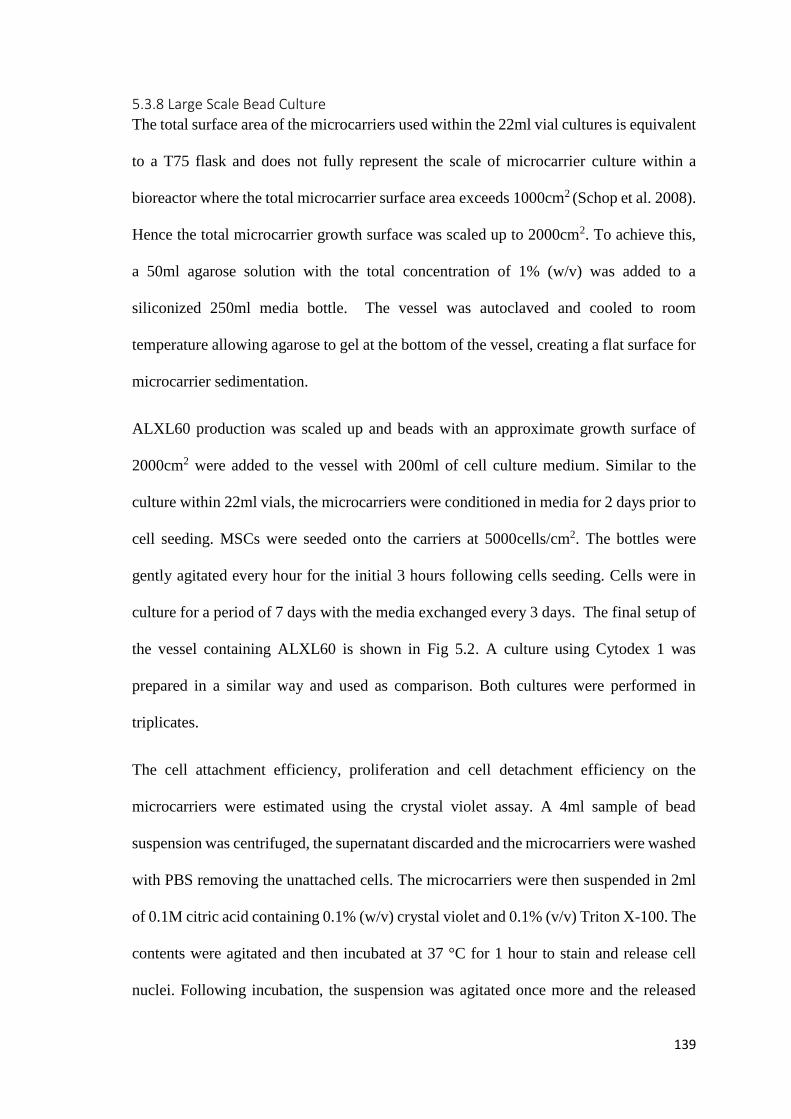
139
5.3.8 Large Scale Bead Culture
The total surface area of the microcarriers used within the 22ml vial cultures is equivalent
to a T75 flask and does not fully represent the scale of microcarrier culture within a
bioreactor where the total microcarrier surface area exceeds 1000cm2 (Schop et al. 2008).
Hence the total microcarrier growth surface was scaled up to 2000cm2. To achieve this,
a 50ml agarose solution with the total concentration of 1% (w/v) was added to a
siliconized 250ml media bottle. The vessel was autoclaved and cooled to room
temperature allowing agarose to gel at the bottom of the vessel, creating a flat surface for
microcarrier sedimentation.
ALXL60 production was scaled up and beads with an approximate growth surface of
2000cm2 were added to the vessel with 200ml of cell culture medium. Similar to the
culture within 22ml vials, the microcarriers were conditioned in media for 2 days prior to
cell seeding. MSCs were seeded onto the carriers at 5000cells/cm2. The bottles were
gently agitated every hour for the initial 3 hours following cells seeding. Cells were in
culture for a period of 7 days with the media exchanged every 3 days. The final setup of
the vessel containing ALXL60 is shown in Fig 5.2. A culture using Cytodex 1 was
prepared in a similar way and used as comparison. Both cultures were performed in
triplicates.
The cell attachment efficiency, proliferation and cell detachment efficiency on the
microcarriers were estimated using the crystal violet assay. A 4ml sample of bead
suspension was centrifuged, the supernatant discarded and the microcarriers were washed
with PBS removing the unattached cells. The microcarriers were then suspended in 2ml
of 0.1M citric acid containing 0.1% (w/v) crystal violet and 0.1% (v/v) Triton X-100. The
contents were agitated and then incubated at 37 °C for 1 hour to stain and release cell
nuclei. Following incubation, the suspension was agitated once more and the released

140
stained nuclei was counted using a haemocytometer. This process was performed on day
1, 4 and 7 of culture. The measurement on day 1 was divided by the total cell number
seeded yielding the attachment efficiency.
Following crystal violet measurement on Day 7, the medium was removed from the
culture and the beads were washed twice with PBS. Trypsin/EDTA solution was added
to the vessel and the microcarriers were incubated at 37°C for 5 minutes. The
microcarriers were subsequently agitated causing cells to detach from the microcarriers
and forming a single cell suspension. The total number of detached cells were counted
using a Countess cell counter and the detachment efficiency could then be calculated
through the following formula:
𝐷 =𝐶𝑒𝑙𝑙𝑠 𝑐𝑜𝑢𝑛𝑡𝑒𝑑 𝑓𝑜𝑙𝑙𝑜𝑤𝑖𝑛𝑔 𝑇𝑟𝑦𝑝𝑠𝑖𝑛 𝐷𝑒𝑡𝑎𝑐ℎ𝑚𝑒𝑛𝑡
𝐶𝑟𝑦𝑠𝑡𝑎𝑙 𝑣𝑖𝑜𝑙𝑒𝑡 𝑐𝑜𝑢𝑛𝑡 𝑜𝑛 𝐷𝑎𝑦 7 (5.5)
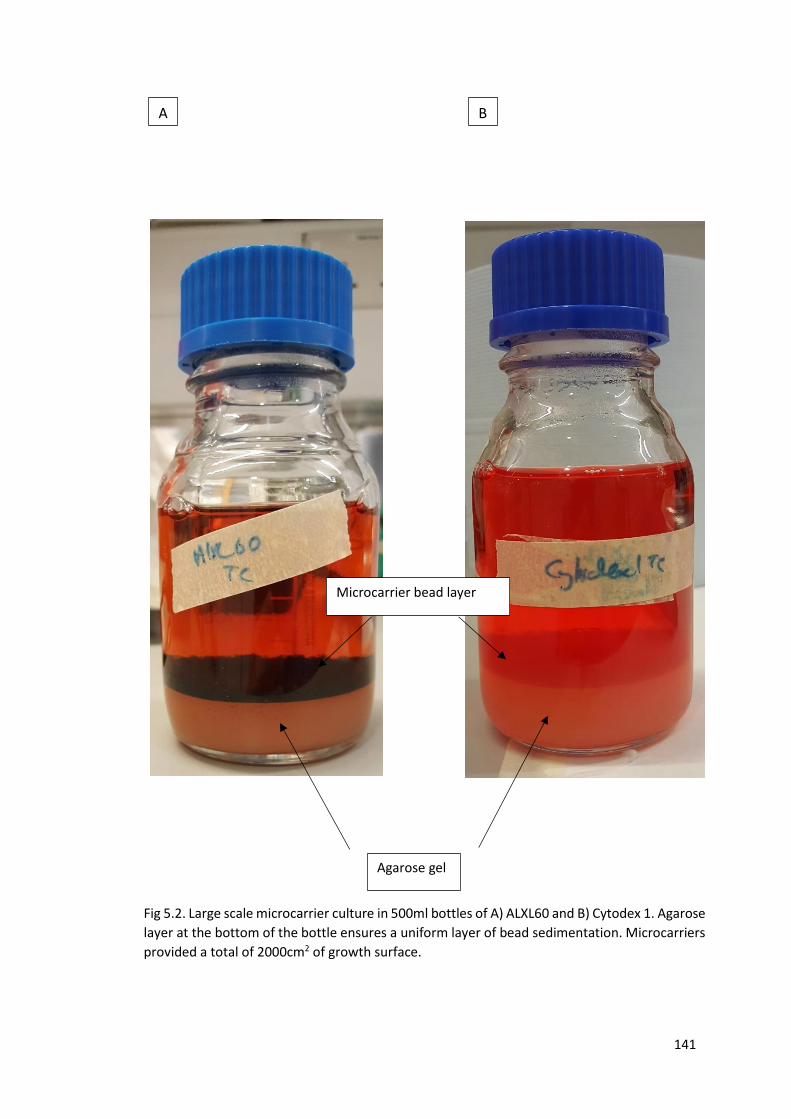
141
Agarose gel
Microcarrier bead layer
A B
Fig 5.2. Large scale microcarrier culture in 500ml bottles of A) ALXL60 and B) Cytodex 1. Agarose
layer at the bottom of the bottle ensures a uniform layer of bead sedimentation. Microcarriers
provided a total of 2000cm2 of growth surface.

142
5.3.9 Statistical Analysis
In order to determine significance in fold increase between ALXL60, FDXL60 and
Cytodex 1, a two way ANOVA with Post-Hoc Tukey analysis was performed. The same
procedure was used to compare CD marker gene expressions for cells grown on the
microcarriers.
A one way ANOVA was used to determine significant difference in attachment and
detachment efficiency between ALXL60, FDXL60 and Cytodex 1.
P<0.05 was deemed significant for all analyses.
One concern that arisen during the analysis of cell growth properties (attachment,
detachment and proliferation) and qPCR were the low sample sizes used (n=3 and 9
respectively). The low sample number increase the difficulty of determining whether the
cell growth properties follow a normal distribution. When normality could not be
assumed or non-normal conditions are present, the non-parametric Kruskal-Wallis test is
typically employed in place of an ANOVA test. However, a study by Khan et al revealed
that for small samples such as n=3, the ANOVA test is a better option compared to the
Kruskal-Wallis test even for non-normal populations due to the lower probability of a
Type I error in an ANOVA test (Khan and Rayner 2003). Additionally, a sample size
calculator developed by SigmaXL (Canada) showed that the ANOVA test is extremely
robust to non-normality with the minimum sample size required to be n=3 (SigmaXL
2018). Therefore, the ANOVA test was still used for statistical analysis for both these
cases.
5.4 Results and Discussion
5.4.1 Higher Cell Attachment on ALXL60 Compared to Cytodex 1
5.4.1.1 Human Dermal Fibroblasts
After 24 hours of incubation of HDFs with ALXL60 (Fig 5.3A), FDXL60 (Fig 5.3B) and
Cytodex 1 (Fig 5.3C), cells attached and flattened out into a spindle-like morphology.
143
The cell attachment efficiency on ALXL60 was 76% which is non-significant to FDXL60
(74%). Cytodex 1 had an attachment efficiency (63%) although this was lower compared
with the genipin crosslinked alginate-chitosan microcarriers, the difference was not
significant (Fig 5.5A).
HDFs displayed no cell adhesion to alginate microbeads. The cells remained within
suspension and developed large clusters instead of attaching to the microbeads (Fig
5.3D).
144
5.4.1.2 MSC
MSCs attached and flattened out into their spindle-like morphology on the microcarriers.
This is clearer under green channel with GFP inserted into the cells emitting fluorescence
(Fig 5.4). The attachment efficiency for MSC (Fig 5.5B) on ALXL60 was found to be
76% non-significant from 71% on FDXL60. Cytodex 1 had a significantly lower
attachment efficiency of 50% (n=3, p<0.05).
C D
B A
Fig 5.3. Attachment of HDFs on different microcarriers. Cells flattened out into spindle-like
morphology on A) ALXL60, B) FDXL60, where cells cluster on a select few microcarriers (circled) with
several microcarriers lacking cells (arrows) and C) Cytodex 1. On the other hand, cells remained
spherical and unattached to D) alginate microbeads due to lack of surface receptors on the beads.
Scale bars represent 200µm.

145
A
B
Fig 5.4. GFP modified MSC cultured on microcarrier. A) Cells attached onto ALXL60. Reprinted
with permission from (Chui et al. 2018) license number 4497661255175. B) Cells cluster on a
select few FDXL60 (circled) with several microcarriers lacking cells (arrows). GFP emits a higher
fluorescence intensity compared to the genipin crosslinked coat allowing cells to be clearly
identified. Scale bar shows 500µm.

146
AL
XL
60
FD
XL
60
Cy
t od
ex
1
0 . 4
0 . 6
0 . 8
1 . 0
At
ta
ch
me
nt
E
ffic
ien
cy
(%
)
N . SA
B
Fig 5.5. Attachment efficiency of A) HDFs and B) MSCs on ALXL60, FDXL60 and Cytodex 1. There
were no significant differences between the microcarriers in attachment efficiency for HDFs.
However, Cytodex 1 had a significantly lower attachment efficiency compared to ALXL60 and
FDXL60 during MSC culture, denoted by *. n=3, p<0.05. Error bars denote standard deviation.
147
Cell adhesion to alginate is typically poor, as demonstrated in Fig 5.3D, due to the lack
of cell adhesion proteins (Lee and Mooney 2012). Therefore, the surface of the alginate
microbeads were coated with chitosan which possesses a similar structure to GAG within
the extracellular matrix (Yang et al. 2009). However, without crosslinking, the highly
hydrated alginate-chitosan membrane is considered too “water-like” causing cells to
interpret the structure as “water” and hence not attach (Gao et al. 2014). Furthermore, the
polycationic nature of the chitosan may interact electronically with the surface membrane
of cells causing a loss in membrane functionality (Veleirinho et al. 2013).
Genipin crosslinking would overcome both of the aforementioned issues as the
crosslinking lowers the charge of the chitosan enabling cell attachment without damage
to the surface membrane (Gao et al. 2014). Additionally, the process increases the
stiffness and surface roughness of the bead maximizing the surface area for cells to attach
and spread. Surface texture and roughness of a material have been shown to induce self-
renewal or differentiation of stem cells (Murphy et al. 2014). This property could be
measured or observed using Scanning Electron Microscopy (SEM) as well as AFM, with
the latter also assessing the topography of the bead (Chen et al. 2006). The relationship
between microcarrier surface texture and cell growth properties is an interesting aspect
to investigate and could affect stem cell growth and differentiation (Murphy et al. 2014).
However, this was not covered in the thesis due to time constraints, as the main goal of
the thesis is to develop an alternative microcarrier for MSC expansion, rather than
creating a specific novel surface texture. Moreover, it has been previously discussed that
an analysis on surface properties to stem cell fate is more meaningful if varied over a
large surface area as this leads to the surface features becoming a more valuable
independent variable (Murphy et al. 2014). In this study, although microcarriers provide

148
a large total surface area, the local surface area per bead is very low and each bead only
supports around a few hundred cells.
Genipin crosslinked alginate-chitosan microcarriers created in this study displayed
greater cell attachment efficiency compared to Cytodex 1 for MSCs. This was due to the
chitosan structure resembling the ECM in vivo (Yang et al. 2009). Several commercial
microcarriers have been reported to have a low cell attachment efficiency for stem cells,
however, as these microcarriers were coated with ECM proteins the attachment efficiency
increased significantly (Chen et al. 2011).
Cell seeding densities for microcarrier culture are selected based on the attachment
efficiency of cells onto the microcarriers as a critical cell number per bead is required in
order for cell proliferation to occur (Hu and Wang 1986). The higher attachment
efficiency seen in genipin crosslinked alginate chitosan microcarriers would hence
require a lower seeding density to achieve the critical cell number per bead compared to
Cytodex 1. This provides a key advantage to microcarriers created in this study as a
lower seeding density would lower clinical costs due to the low frequencies of MSCs
during isolation (Caplan 2007).
HDFs and MSCs appear congregated to a selected few microcarriers within FDXL60
culture (Fig 5.3B & 5.4B). On the other hand, a more even cell distribution appear to
form among ALXL60 (Fig 5.3A & 5.4A). This phenomenon further suggests alteration
of the hydrogel network due to freeze drying. As described in chapter 4, the microbead
stiffness significantly increases following drying. This rigidity of the surface could limit
cell movement on the bead (Lo et al. 2000) causing congregation and cells within certain
areas.

149
5.4.2 Higher Cell Detachment from ALXL60 Compared to Cytodex 1
5.4.2.1 Human Dermal Fibroblasts
Following trypsin/EDTA treatment, HDFs were released from the microcarriers forming
a single cell suspension (Fig 5.6). Detachment efficiency results are presented in Fig
5.7A. Cells achieved a 51% detachment efficiency from ALXL60 and 57% in FDXL60.
On the other hand, only 12% of HDFs detached from Cytodex 1, significantly lower
compared to ALXL60 and FDXL60 (n=3, p<0.05). The viability of the detached cells,
however, was found to be around 90%, for all 3 microcarriers.
5.4.2.2 MSC
MSCs harvested using trypsin/EDTA yielded a detachment efficiency of 55% from
ALXL60. The viability of the cells harvested was 96%. Interestingly, FDXL60 had a
detachment efficiency significantly higher at 79% with the harvested cell viability at 97%
Fig 5.6. HDFs detaching from ALXL60 microcarriers upon addition of trypsin. A single cell
suspension of round detached cells was observed. Scale bar shows 200µm.
150
(Fig 5.7B).On the other hand, Cytodex 1 had a significantly (n=3, p<0.05) lower
detachment efficiency at only 38% while the viability of the cells was 92%.
A key issue with commercial microcarriers is their difficulty in cell detachment following
trypsin treatment (Nienow et al. 2014). ALXL60 and FDXL60 proved to have
significantly higher detachment efficiency compared to Cytodex 1. However, the genipin
crosslinked alginate-chitosan microcarriers also maintained a superior attachment
efficiency. The poor attachment and detachment efficiency displayed by Cytodex 1 could
be due to the fact that the carriers were not initially designed for stem cell expansion but
rather for the production of biomolecules (GE Healthcare 2011a).
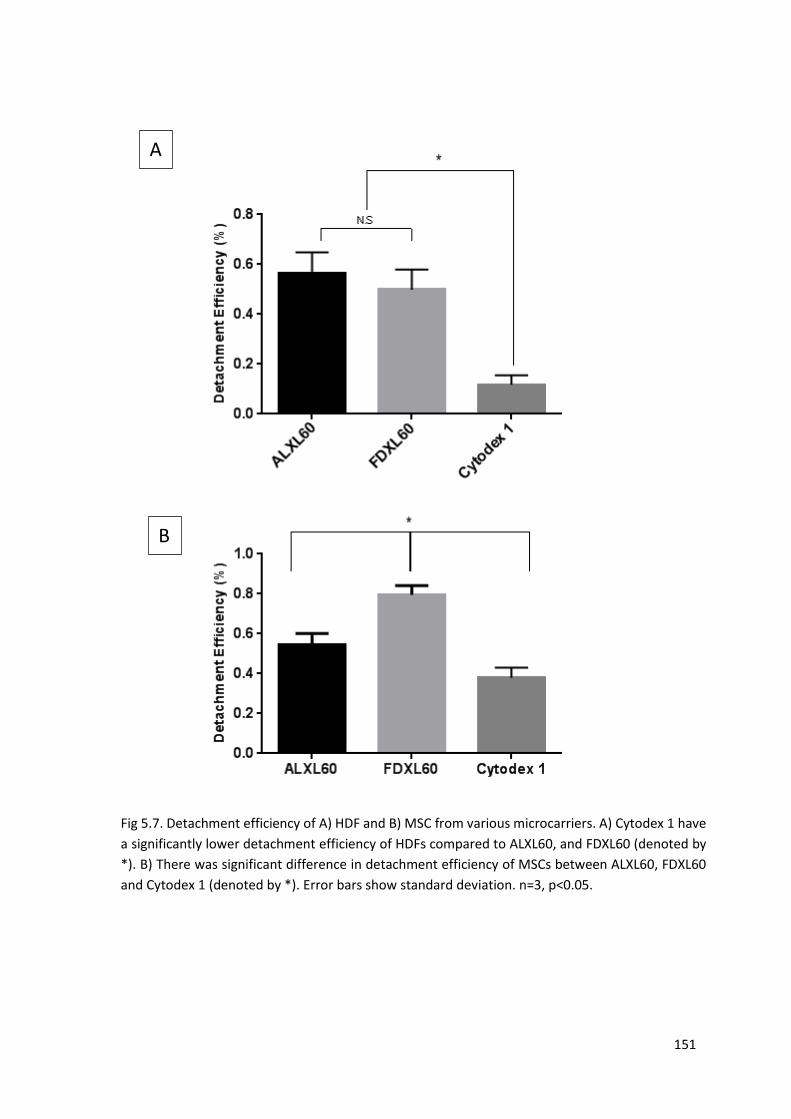
151
A
B
Fig 5.7. Detachment efficiency of A) HDF and B) MSC from various microcarriers. A) Cytodex 1 have
a significantly lower detachment efficiency of HDFs compared to ALXL60, and FDXL60 (denoted by
*). B) There was significant difference in detachment efficiency of MSCs between ALXL60, FDXL60
and Cytodex 1 (denoted by *). Error bars show standard deviation. n=3, p<0.05.
152
5.4.3 Higher Cell Proliferation on ALXL60 Compared to Cytodex 1
5.4.3.1 Human Dermal Fibroblasts
The fold increase of HDFs over the course of 14 days is shown in Fig 5.8. For the first 7
days, CCK-8 assay revealed ALXL60 reached a significantly (n=3, p<0.05) higher fold
increase compared to Cytodex 1. Both microcarriers reached a maximum fold increase at
day 7 before displaying a decrease in cell number. This could be due to the limited growth
surface area and the cells reaching confluency.
Based on these results and observations during HDF expansion, the following changes
were made to the experimental procedures for MSC expansion. In order to prevent the
decrease in cell growth at day 7 of culture, fresh microcarriers with a surface area of
75cm2 were added to the culture on day 6 and media was doubled accordingly. In
addition, a time point at day 10 was added. Finally, proliferation of MSCs on FDXL60
was examined.

153
5.4.3.2 MSC
MSCs attached onto ALXL60, FDXL60 and Cytodex 1 proliferated over a course of 2
weeks (Fig 5.9B). Fig 5.10A and B show the microcarrier culture on day 7 and day 14
respectively. CCK-8 assay revealed a steady cell fold increase with respect to day 1 (24
hours following cell seeding) for all 3 microcarriers: ALXL60, FDXL60 and Cytodex 1,
as illustrated in Figure 5.9A. However, there was a significantly (n=3, p<0.05) higher
fold increase throughout the culture for cells grown ALXL60 compared to FDXL60 and
Cytodex 1. The final fold increase at the end of the 14 day period were 4.6, 3.7 and 2.3
respectively.
Although MSCs were able to proliferate on FDXL60, the fold increase was significantly
(n=3, p<0.05) lower compared to ALXL60. In addition, the standard deviation between
Day 1
Day 3
Day 7
Day 1
4
0 .0
0 .5
1 .0
1 .5
2 .0
2 .5
3 .0
Fo
ld I
nc
re
as
e
A L X L 6 0
C y to d e x 1
11
n .s
Fig 5.8. Fold increase of HDFs on ALXL60 and Cytodex 1. The fold increase on ALXL60 was
significantly higher compared to Cytodex 1 on Day 3, 7 and 14. For ALXL60, there was significant
increase from day 1 to day 7. At day 14 the cell number decreases and was non-significant to
day 3. For Cytodex 1, day 7 and day 14 were significantly different to day 1 as denoted by
number above the plot. Error bars show standard deviation. n=3, p<0.05.
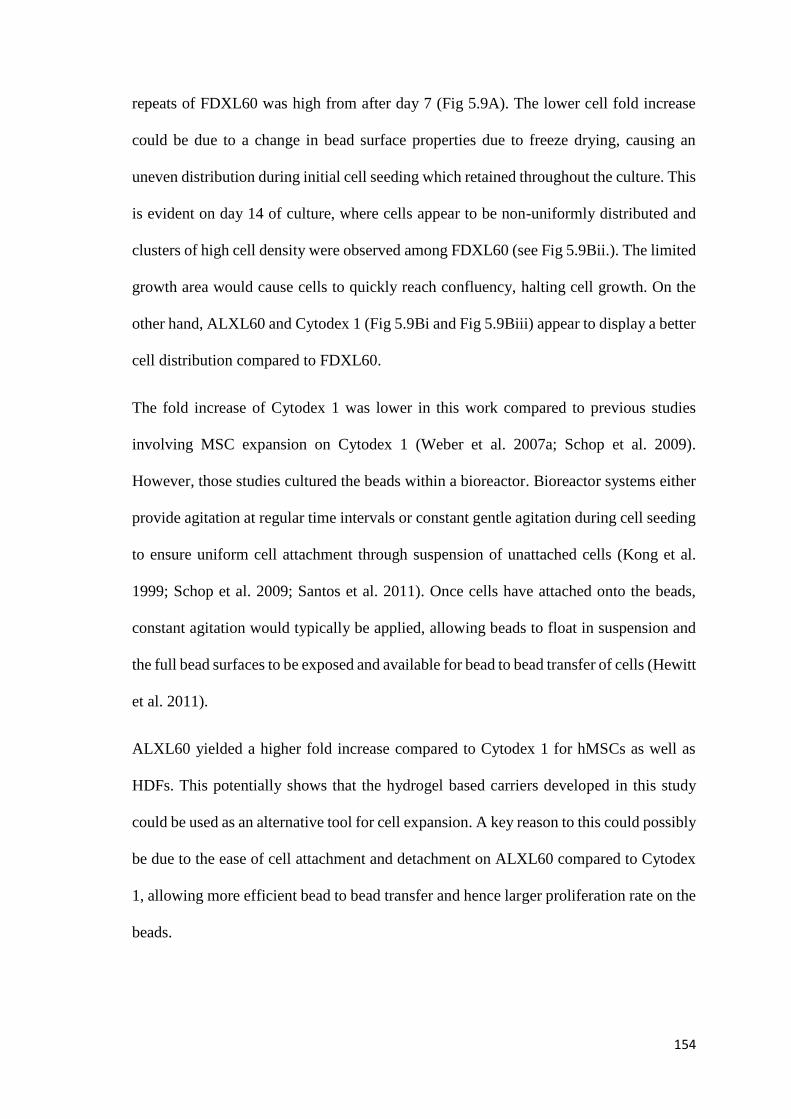
154
repeats of FDXL60 was high from after day 7 (Fig 5.9A). The lower cell fold increase
could be due to a change in bead surface properties due to freeze drying, causing an
uneven distribution during initial cell seeding which retained throughout the culture. This
is evident on day 14 of culture, where cells appear to be non-uniformly distributed and
clusters of high cell density were observed among FDXL60 (see Fig 5.9Bii.). The limited
growth area would cause cells to quickly reach confluency, halting cell growth. On the
other hand, ALXL60 and Cytodex 1 (Fig 5.9Bi and Fig 5.9Biii) appear to display a better
cell distribution compared to FDXL60.
The fold increase of Cytodex 1 was lower in this work compared to previous studies
involving MSC expansion on Cytodex 1 (Weber et al. 2007a; Schop et al. 2009).
However, those studies cultured the beads within a bioreactor. Bioreactor systems either
provide agitation at regular time intervals or constant gentle agitation during cell seeding
to ensure uniform cell attachment through suspension of unattached cells (Kong et al.
1999; Schop et al. 2009; Santos et al. 2011). Once cells have attached onto the beads,
constant agitation would typically be applied, allowing beads to float in suspension and
the full bead surfaces to be exposed and available for bead to bead transfer of cells (Hewitt
et al. 2011).
ALXL60 yielded a higher fold increase compared to Cytodex 1 for hMSCs as well as
HDFs. This potentially shows that the hydrogel based carriers developed in this study
could be used as an alternative tool for cell expansion. A key reason to this could possibly
be due to the ease of cell attachment and detachment on ALXL60 compared to Cytodex
1, allowing more efficient bead to bead transfer and hence larger proliferation rate on the
beads.
155
In order for the cell numbers to increase continuously throughout the 14 day culture,
additional microcarriers were added on day 6. As described in 5.4.3.1, HDF experiments
without the addition of extra carriers, demonstrated a slowed cell growth rate around day
7 due to the cell numbers reaching confluency. This was seen in the ALXL60 culture on
day 7 (Fig 5.10A) showing a proportion of fully confluent microcarriers (indicated by
green arrows), and several empty microcarriers which represent the freshly added
microcarriers (indicated by red arrows). By day 14, MSCs migrated to the growth
surfaces of the empty microcarriers resulting in a confluent culture (Fig 5.10B).
Similar to cell passaging in 2D culture, the addition of extra microcarriers ensured
sufficient growth surface area was available throughout the culture and ensured that cell
confluency was not reached. This was achieved through bead to bead transfer of cells to
the newly added microcarriers, eventually generating a homologous cell distribution
within the microcarrier culture. It was shown in a previous report by Schop et al that the
additional surface area provided would prevent the stationary growth phase from being
reached during microcarrier culture (Schop et al. 2008). Unlike cell passaging, addition
of extra microcarriers does not utilize proteolytic enzymes such as trypsin which
degrades the extracellular matrix and its cell receptors, leading to reduced viability
(Yamato et al. 1998; Kushida et al. 1999). Moreover, the process is simple and a less
labour intensive process compared to cell passaging, saving running costs and time.

156
Fig 5.9. Proliferation of MSCs on ALXL60, FDXL60 and Cytodex 1. A) Fold increase of MSCs on
microcarriers over 14 days. ALXL60 has a significantly higher proliferation rate compared to
FDXL60 and Cytodex 1 from Day 4-10 (Denoted by *), n=3, p<0.05. FDXL60 showed no significant
difference in fold increase compared to Cytodex 1 with the exception on Day 14. On Day 14 the
fold increase in all 3 microcarriers were significanty different to each other (denoted by *). Error
bars show standard deviation. B) Growth of cells on day 14 on i) ALXL60, ii) FDXL60, unlike ALXL60
and Cytodex 1, cells were distributed on a selected few carriers (circled) with several carriers
having no or very few cells (arrows). iii) MSC culture on Cytodex 1. Scale bar represents 500µm.
A
B
ii
iii
i
Day 1
Day 4
Day 7
Day 1
0
Day 1
4
0
1
2
3
4
5
D a y a fte r c e ll s e e d in g
Fo
ld I
nc
re
as
e
A L X L 6 0
F D X L 6 0
C y to d e x 1
N .S
N .S
N .S
*
**
*
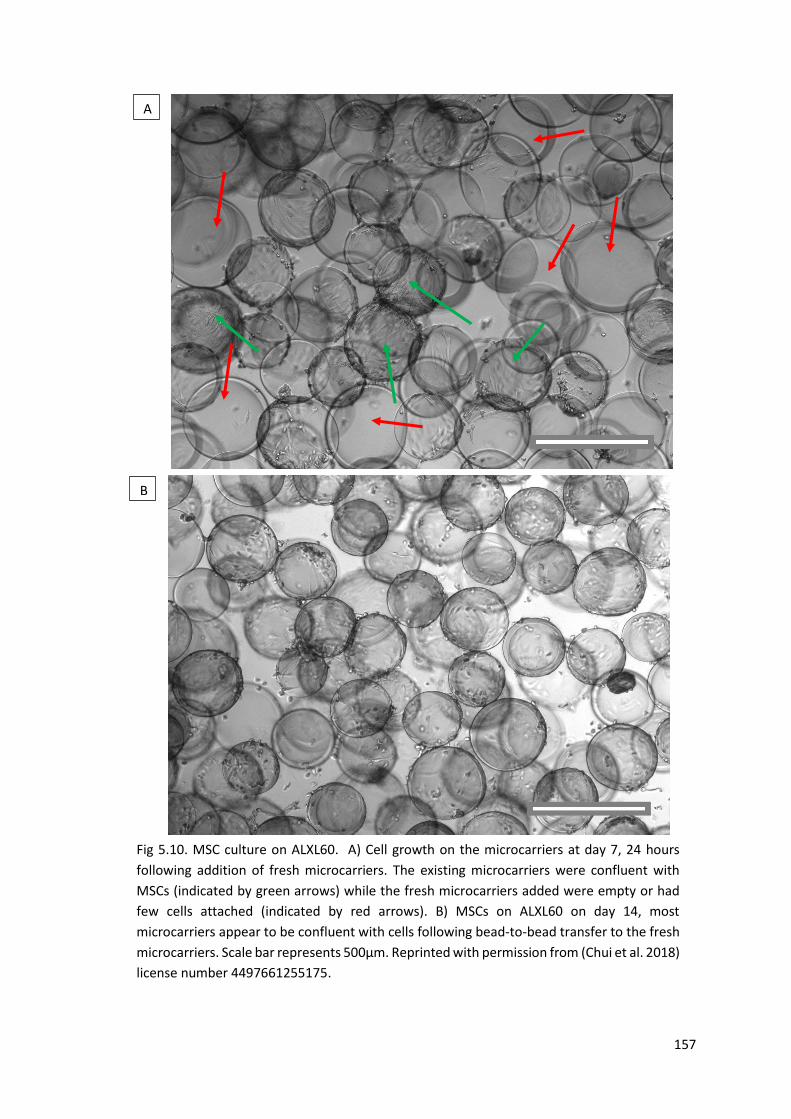
157
A
B
Fig 5.10. MSC culture on ALXL60. A) Cell growth on the microcarriers at day 7, 24 hours
following addition of fresh microcarriers. The existing microcarriers were confluent with
MSCs (indicated by green arrows) while the fresh microcarriers added were empty or had
few cells attached (indicated by red arrows). B) MSCs on ALXL60 on day 14, most
microcarriers appear to be confluent with cells following bead-to-bead transfer to the fresh
microcarriers. Scale bar represents 500µm. Reprinted with permission from (Chui et al. 2018)
license number 4497661255175.
158
5.4.4 qPCR and Gene Expression Displayed no changes to MSC Phenotype when
Cultured on ALXL60
There was no significant difference in the relative gene expression levels of cells cultured
on ALXL60, FDXL60 and Cytodex 1 compared to the 2D control (Figure 5.11).
No expression for CD-45 could be detected for all the groups tested indicating absence
of leukocytes (Altin and Sloan 1997). The threshold cycle (CT) values obtained for CD-
34, a marker for hematopoietic and endothelial cells and negative marker for MSCs
(Dominici et al. 2006), were around 35 and higher compared to the CT values obtained
for the 3 positive makers (Fig 5.12). This shows a lower amount of PCR product for the
DNA sequence representing CD-34 compared to the positive MSC markers.
qPCR was performed to ascertain whether the growth surface affected the phenotypic
properties of hMSCs. The surface markers: CD-90, CD-105 and CD-73 should be present
on hMSCs as defined by the International Society for Cellular Therapy (Dominici et al.
2006). The defined negative hMSC markers are used to mainly exclude the presence of
monocytes, hematopoietic cells, leukocytes, B cells and lymphocytes within the hMSC
culture (Jossen et al. 2014). These cells are typically present due the heterogeneous cell
population obtained during MSC isolation (Dominici et al. 2006). However, the cells
used in this study were immortalised commercial cell lines, therefore contamination
would be kept to a minimum. Hence, only 2 negative markers, CD-45 and CD-34, were
investigated for qPCR. As little or no changes in cell phenotype were expected with an
increasing passage number (Weber et al. 2007a), any potential changes to MSC
phenotype would likely be due to the culture process and material.
Several studies have shown that culture on Cytodex 1 does not alter the hMSC surface
markers (Schop et al. 2009) or their differentiation potential (Frauenschuh et al. 2007) .
Therefore, due to the similar expression levels of CD markers between ALXL60 and

159
Cytodex 1, it is likely that MSCs cultured on ALXL60 and FDXL60 retained their
phenotypic properties. Moreover, the lack of significant difference in relative gene
expression for the cells harvested from ALXL60 and FDXL60 compared to the 2D
control further confirmed that the phenotype of the cells did not change during the 14
days of culture.
One of the concerns that arose from the method used in this study is that the cells were
initially detached using trypsin prior to RNA extraction. It has been previously shown
that trypsin causes alterations in gene expressions of cells (Chaudhry 2008). Therefore,
the gene expressions measured in this study could vary compared to cells prior to
detachment from microcarriers. However, as all the groups were treated with trypsin (2D,
Cytodex 1, ALXL60 and FDXL60), the relative gene expression should not be
significantly affected assuming the up or down regulation of genes due to trypsin is
identical for each group. Despite this, direct RNA extraction should be considered in
future work to bypass the use of trypsin. However, the number of cells on attached on the
microcarriers would need to be calculated as RNA needs to be extracted from an equal
amount of cells in order to provide a meaningful comparison. This could be estimated
using a CCK-8 or an Alamar Blue assay.
Another point of consideration is the housekeeping gene selected for normalization. A
housekeeping gene serves as a common denominator for genes investigated, hence
selecting a stable housekeeping gene is critical for qPCR (Mane et al. 2008). GapDH has
been traditionally used as a housekeeping gene for MSCs and hence selected for this
study (Curtis K et al. 2010). However, recent studies have found that GapDH lacks gene
stability and is unsuitable for normalization, therefore, other genes should be used instead
(Amable et al. 2013; Li et al. 2015c). Additionally, the most suitable housekeeping gene
varies based on the source of the MSC, for example RPL13A was shown to be the most
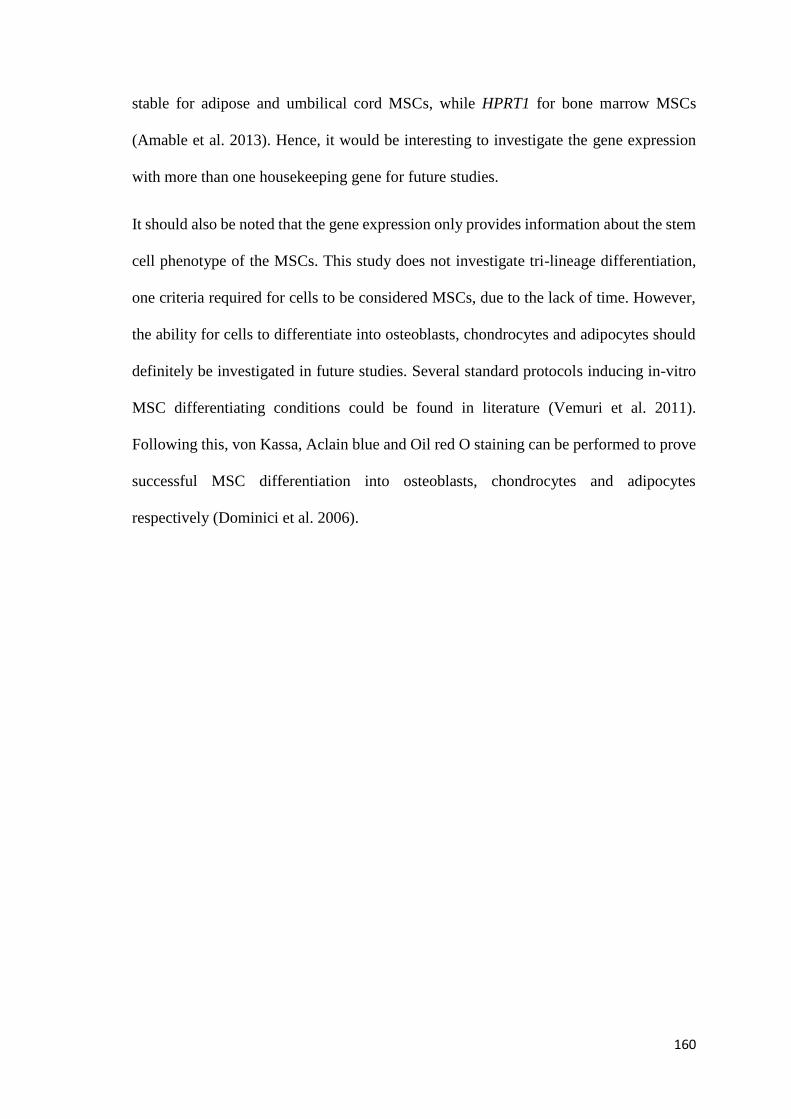
160
stable for adipose and umbilical cord MSCs, while HPRT1 for bone marrow MSCs
(Amable et al. 2013). Hence, it would be interesting to investigate the gene expression
with more than one housekeeping gene for future studies.
It should also be noted that the gene expression only provides information about the stem
cell phenotype of the MSCs. This study does not investigate tri-lineage differentiation,
one criteria required for cells to be considered MSCs, due to the lack of time. However,
the ability for cells to differentiate into osteoblasts, chondrocytes and adipocytes should
definitely be investigated in future studies. Several standard protocols inducing in-vitro
MSC differentiating conditions could be found in literature (Vemuri et al. 2011).
Following this, von Kassa, Aclain blue and Oil red O staining can be performed to prove
successful MSC differentiation into osteoblasts, chondrocytes and adipocytes
respectively (Dominici et al. 2006).
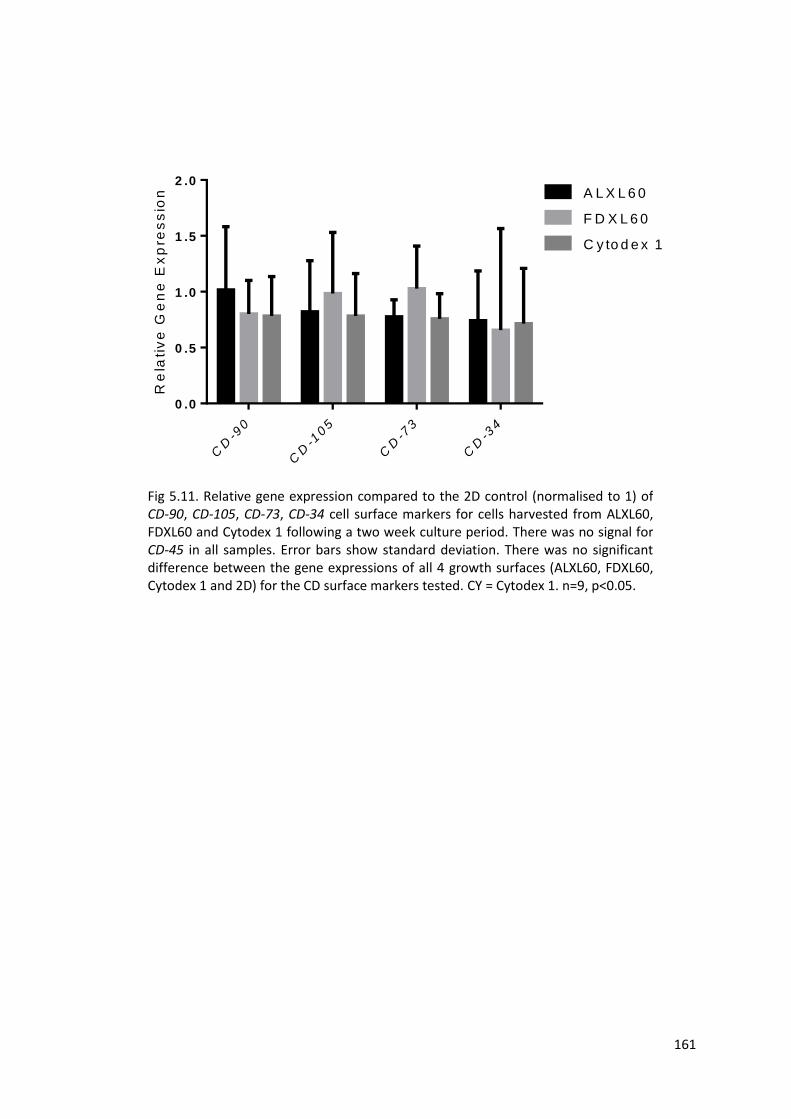
161
Fig 5.11. Relative gene expression compared to the 2D control (normalised to 1) of CD-90, CD-105, CD-73, CD-34 cell surface markers for cells harvested from ALXL60, FDXL60 and Cytodex 1 following a two week culture period. There was no signal for CD-45 in all samples. Error bars show standard deviation. There was no significant difference between the gene expressions of all 4 growth surfaces (ALXL60, FDXL60, Cytodex 1 and 2D) for the CD surface markers tested. CY = Cytodex 1. n=9, p<0.05.
CD
-90
CD
-105
CD
-73
CD
-34
0 .0
0 .5
1 .0
1 .5
2 .0
Re
lati
ve
Ge
ne
Ex
pre
ss
ion A L X L 6 0
F D X L 6 0
C y to d e x 1
162
Fig 5.12. Raw CT data for cells harvested from ALXL60, FDXL60, Cytodex 1 and 2D flasks.
For each microcarrier and 2D culture the negative marker CD-34 had a significantly higher
CT expression compared to the positive markers (**), while the other negative surface
marker CD-45 displayed no signal. On the other hand, GapDH, the housekeeping gene
showed a significantly lower CT expression compared to the CD surface markers (*). Error
bars represent standard deviation. n=9, p<0.05.
2D
AL
XL
60
FD
XL
60
Cyto
dex 1
0
1 0
2 0
3 0
4 0C
T E
xp
re
ss
ion
G a p D H
C D -9 0
C D -1 0 5
C D -7 3
C D -3 4
* * * * * * * *
* * **
163
5.4.5 Higher Cell Culture Properties of ALXL60 were retained in Large Scale Culture
Imaging under the green channel illustrated that most cells formed a spindle-like
morphology on the microcarrier surfaces displaying the MSC attachment characteristics
(Fig 5.13). The distribution of the cells appear to be uniform by visual observation (Fig
5.13) on ALXL60 and Cytodex 1. At the end of the 7 day culture, there appears to be no
microcarrier in the image which were lacking any cells. Aggregation of cells begin to
occur due to increasing cell number as well as the lack of agitation within the culture.
This has been shown in previous studies where MSCs clump together after longer culture
periods (Pall 2015). The distribution and morphology of cells on the microcarriers could
be further investigated through staining and counting of the number of MSCs attached
per bead.
ALXL60 had an attachment efficiency of 73% within the 250ml vessel. On the other
hand, Cytodex 1 had an attachment efficiency of 66% (Fig 5.14A). These values were
compared to the attachment efficiency obtained within the 22ml culture (Fig 5.5) and
there was no significant difference between the attachment efficiency between the 250ml
and 22ml culture for ALXL60. However, the attachment efficiency for Cytodex 1 was
significantly (n=3, p<0.05) higher within the 250ml vessel.
Cell proliferation was significantly (n=3, p<0.05) higher on ALXL60 compared to
Cytodex 1 with the former reaching a 3.96 fold increase, on the other hand, the latter only
achieved a 3.08 fold increase at the end of day 7 (Fig 5.14C & D). The fold increase from
day 1 to 4 was larger compared to the increase from day 4 to 7 for both microcarriers.
This was possibly due to the beads reaching confluency and the formation of bead clusters
(Fig 5.13C & F) hence requiring additional beads to be added to provide additional
growth area. Despite this, both ALXL60 and Cytodex 1 achieved a significantly higher

164
fold increase when cultured in the 250ml vessel compared to the fold increase at day 7
within the 22ml culture (Fig 5.9A).
Following cell detachment with trypsin on day 7, there was a significantly (n=3, p<0.05)
higher detachment efficiency from ALXL60 (79%) compared to Cytodex 1 (37%) (Fig
5.15B). Most cells detached from ALXL60 formed a single cell suspension following
trypsin treatment. On the other hand, several cells retained their spindle shaped
morphology and remained attached onto Cytodex 1. While the detachment efficiency was
non-significant between the 250ml and 22ml cultures for Cytodex 1, this value was
significantly higher in the 250ml vessel for ALXL60.
The discrepancy between the attachment and detachment efficiencies between 250ml and
22ml vessels could be due to the different cell seeding densities used between the two
studies (5000 cells/cm2 and 15000 cells/cm2 respectively). The higher cell density seeded
in 22ml vials would occupy most of the available growth area. This would lower trypsin
efficiency as well as delay cell attachment rate as cells competed for space. Moreover,
for the 22ml culture, the attachment efficiency was calculated via the unattached cells.
As illustrated in the alginate bead culture (Fig 5.3A), unattached cells tend to cluster
together in suspension, leading inaccuracies during cell counting. On the other hand,
culture within the 250ml vessel enables the possibility to using more accurate cell
counting methods compared to the small scale culture. The higher total cell number
would yield a sufficient cell count during sampling, hence the typical cell seeding density
of 5000 cells/cm2 could be used, eliminating the need to raise the cell seeding density to
15000 cells/cm2 which is higher than the typical cell seeding densities for MSC expansion
(Pall 2015).

165
Crystal violet staining was not a viable method within the 22ml cultures as the assay lyses
the cells releasing the stained nuclei for counting (Pall 2016). Therefore sampling was
required for each measurement. The total cell number within the 22ml culture was too
low to yield enough cells per sample for an accurate nuclei count. On the other hand, the
large total cell number within the 250ml culture allows accurate sampling and hence the
use of the crystal violet assay. The major advantage the crystal violet assay is that it
provides a quantitative measure of the total number of cells as opposed to the comparative
fold increase using the CCK-8 assay. These differences in which the two assays measure
cell proliferation could explain the discrepancy between the fold increase of the 250ml
and 22ml culture.
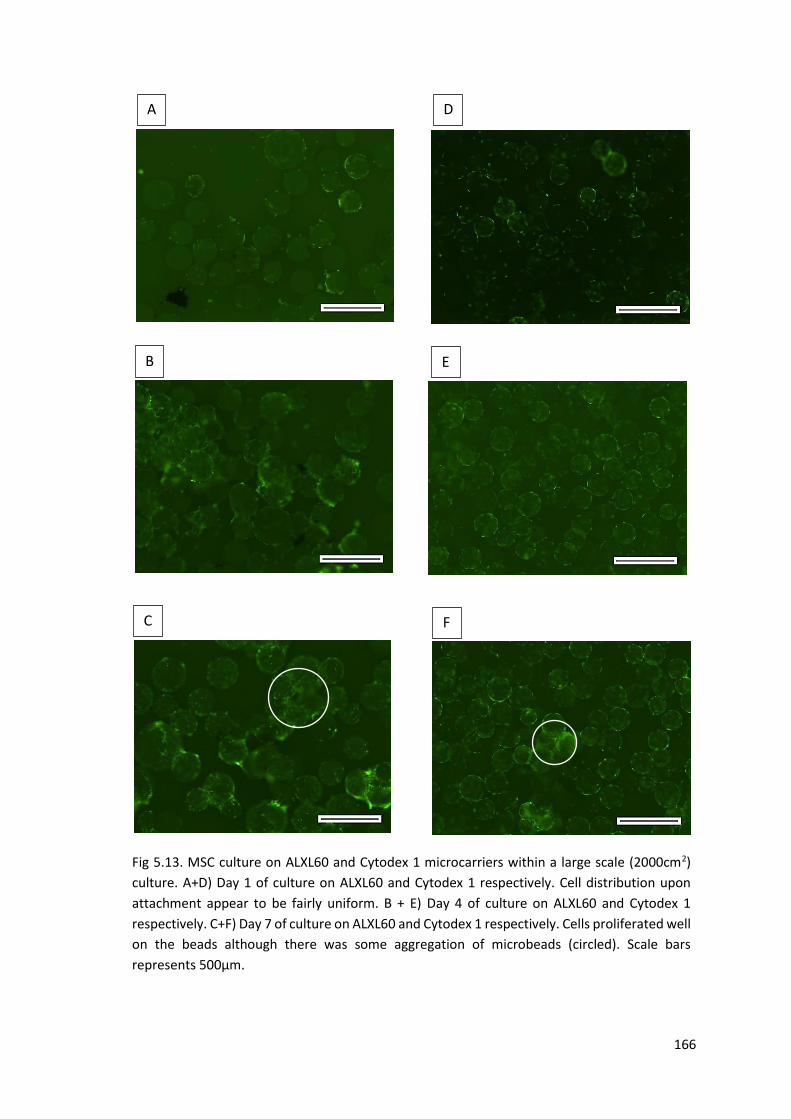
166
F
E
D A
B
C
Fig 5.13. MSC culture on ALXL60 and Cytodex 1 microcarriers within a large scale (2000cm2)
culture. A+D) Day 1 of culture on ALXL60 and Cytodex 1 respectively. Cell distribution upon
attachment appear to be fairly uniform. B + E) Day 4 of culture on ALXL60 and Cytodex 1
respectively. C+F) Day 7 of culture on ALXL60 and Cytodex 1 respectively. Cells proliferated well
on the beads although there was some aggregation of microbeads (circled). Scale bars
represents 500µm.
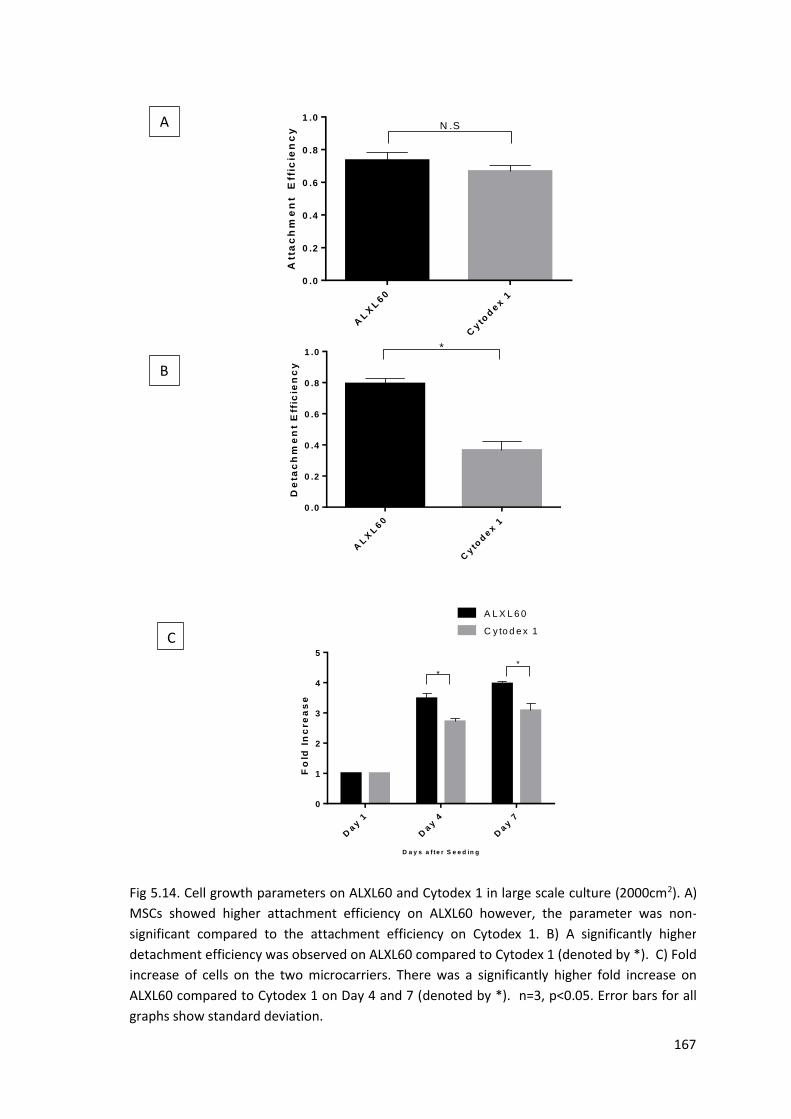
167
Fig 5.14. Cell growth parameters on ALXL60 and Cytodex 1 in large scale culture (2000cm2). A)
MSCs showed higher attachment efficiency on ALXL60 however, the parameter was non-
significant compared to the attachment efficiency on Cytodex 1. B) A significantly higher
detachment efficiency was observed on ALXL60 compared to Cytodex 1 (denoted by *). C) Fold
increase of cells on the two microcarriers. There was a significantly higher fold increase on
ALXL60 compared to Cytodex 1 on Day 4 and 7 (denoted by *). n=3, p<0.05. Error bars for all
graphs show standard deviation.
A
B
C
AL
XL
60
Cyto
dex 1
0 .0
0 .2
0 .4
0 .6
0 .8
1 .0
Att
ac
hm
en
t E
ffic
ien
cy
N .S
AL
XL
60
Cyto
dex 1
0 .0
0 .2
0 .4
0 .6
0 .8
1 .0
De
tac
hm
en
t E
ffic
ien
cy
*
Day 1
Day 4
Day 7
0
1
2
3
4
5
D a y s a f te r S e e d in g
Fo
ld I
nc
re
as
e
A L X L 6 0
C y to d e x 1
*
*

168
5.4.6 Industrial Production Potential
In chapter 3 discussions were made on increasing microcarrier production rate using
simple jet electrospraying compared to cone jet mode. By utilizing results acquired in
chapters 3-5, the time to create the required number of microcarriers for a typical stem
cell therapy is calculated in table 5.2. The following assumptions were made:
1. The total number of MSCs required per clinical dose is 9 million cells per kg.
patient body weight (Ringdén et al. 2006) with an average patient weight of 62kg
based on the average human weight worldwide (Walpole et al. 2012).
2. The microcarriers created were spherical.
3. Microcarriers were packed in a face central cubic orientation with an atomic
packing factor of 0.74.
4. No passaging of cells was performed during microcarrier culture
Units Ref/Comments
1 MSCs required per kg 9.00E+06 Cells/kg (Ringdén et al. 2006)
2 Patient Weight 62 kg
3 Total cells 5.58E+08 cells (1 x 2 )
4 Fold increase 4.6 Result from chapter 5.4.3
5 Cells required at the start of culture 1.21E+08 cells
(3/4) Assuming no passaging required
6 Seeding density 5000 cells/cm2 Used in chapter 5.3.5
7 Microcarrier surface area needed 2.43E+04 cm2
(5/6)
8 Bead diameter (swollen) 0.03 cm
Rough microcarrier diameter following swelling in DMEM as found in chapter 4.3.1.2
9 Surface area per bead 0.002826 cm2 Assuming spherical beads
10 Number of beads required 8.58E+06 beads
(7/9)
11 Microcarrier diameter prior to swelling 2.20E-02 cm
Microbead diameter before swelling as seen in chapter 4.3.1.2
Table 5.2. Microcarrier scalability using simple jet electrospraying
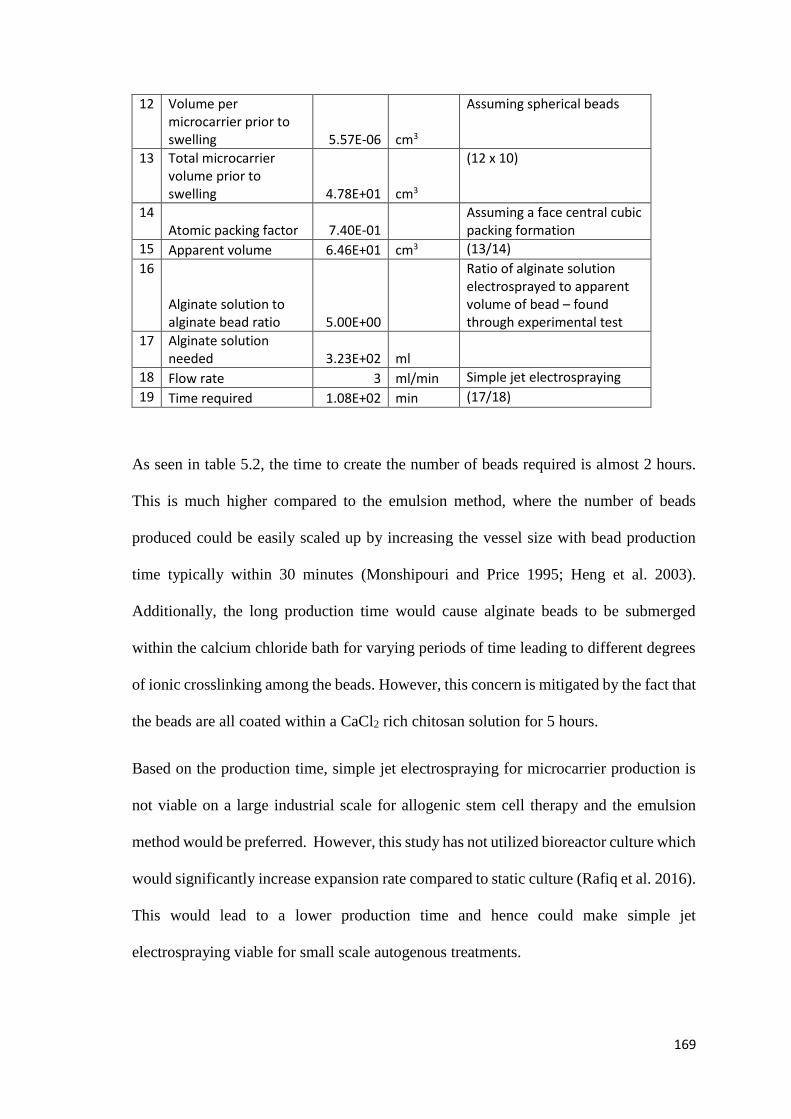
169
12 Volume per microcarrier prior to swelling 5.57E-06 cm3
Assuming spherical beads
13 Total microcarrier volume prior to swelling 4.78E+01 cm3
(12 x 10)
14 Atomic packing factor 7.40E-01
Assuming a face central cubic packing formation
15 Apparent volume 6.46E+01 cm3 (13/14)
16
Alginate solution to alginate bead ratio 5.00E+00
Ratio of alginate solution electrosprayed to apparent volume of bead – found through experimental test
17 Alginate solution needed 3.23E+02 ml
18 Flow rate 3 ml/min Simple jet electrospraying
19 Time required 1.08E+02 min (17/18)
As seen in table 5.2, the time to create the number of beads required is almost 2 hours.
This is much higher compared to the emulsion method, where the number of beads
produced could be easily scaled up by increasing the vessel size with bead production
time typically within 30 minutes (Monshipouri and Price 1995; Heng et al. 2003).
Additionally, the long production time would cause alginate beads to be submerged
within the calcium chloride bath for varying periods of time leading to different degrees
of ionic crosslinking among the beads. However, this concern is mitigated by the fact that
the beads are all coated within a CaCl2 rich chitosan solution for 5 hours.
Based on the production time, simple jet electrospraying for microcarrier production is
not viable on a large industrial scale for allogenic stem cell therapy and the emulsion
method would be preferred. However, this study has not utilized bioreactor culture which
would significantly increase expansion rate compared to static culture (Rafiq et al. 2016).
This would lead to a lower production time and hence could make simple jet
electrospraying viable for small scale autogenous treatments.

170
5.5 Conclusions
In this study we have successfully demonstrated that ALXL60 microcarriers support the
growth of HDFs and MSCs for cell expansion. Cells attach on ALXL60 at a higher
attachment efficiency compared to Cytodex 1, this would potentially enable a lower
seeding density to be utilized to achieve the minimum cell number per bead for cell
proliferation, lowering the number of cells required during isolation. Cell proliferation
was found to be significantly higher on ALXL60 compared to the commercial
microcarrier, Cytodex 1. Furthermore, the cells easily detached from the ALXL60
following trypsin/EDTA treatment, overcoming one of the main drawbacks associated
with commercial microcarriers, where long incubation and high agitation in proteolytic
enzymes solutions are required during cell harvest, lowering cell yield.
Similar to ALXL60, FDXL60 had the higher cell attachment and detachment features
compared to Cytodex 1. However, the lack of optimization of the freeze dried process
lead to potentially altered microcarrier surface properties causing cells to form clusters
on certain beads and lowering the proliferation rate over the 2 week culture compared to
ALXL60. Despite this, the final fold increase following the 14 day on FDXL60 remained
significantly higher compared to Cytodex 1.
The sample size used in cell culture studies were in triplicates. Although this sample size
is small, a literature search has shown it is sufficient to utilize an ANOVA for statistical
analysis in order to provide a robust test. Additionally, the cell culture data could not be
tested for normality due to the low sample size, however, it has been shown that an
ANOVA test is more suitable compared to the non-parametric Kruskal-Wallis when the
sample size is small. Despite this, the sample size used in microcarrier cell culture studies
should be increased for future investigations in order to verify the normality of the data
171
and hence the validity of the ANOVA test, as well as potentially eliminating any
anomalies which might have been analysed while using a small sample size.
A similar gene expression was obtained for various MSC surface markers following
qPCR analysis with MSCs harvested from ALXL60, FDXL60 and Cytodex 1 as well as
the initial 2D control. This indicated that expansion of MSCs on ALXL60 and FDXL60
did not alter the phenotype of the cells and fulfils one of the minimum criteria for cells to
be considered as MSCs.
Tri-lineage differentiation was not conducted in this study due to the lack of time.
However, it is essential to investigate the ability of the cells to differentiate into
osteoblasts, chondrocytes and adipocytes following detachment from the microcarriers
to verify that the microcarrier material does not alter the MSC differentiation potential
during culture.
172
Chapter 6 Conclusion and Future Work
6.1 Conclusions The use of MSCs in stem cell therapy could provide treatment to several diseases such as
Graft vs Host disease, Crohn’s disease and diabetes etc which affects millions of people
worldwide. In order for MSC treatment to be effective, a large number of cells is required
per dose, however, 2D cell culture methods have proven to be cost and labour ineffective.
As an alternative, commercial microcarriers have been used for MSC expansion due to
their high surface area to volume ratio and potential for automation. However, as these
microcarriers were previously designed for the production of bioactive molecules, they
have been shown to suffer from two main drawbacks. The first is low cell attachment
efficiency following seeding of stem cells such as embryonic stem cells or MSCs (Schop
et al. 2009; Chen et al. 2011). Although attached MSCs have been shown to proliferate
on commercial microcarriers, the second challenge lies in the difficulty in detaching cells
from their surfaces at the end of the culture (Nienow et al. 2014). This would require
increased agitation or extended periods of proteolytic enzyme treatment, both of which
have been shown to lower the final cell yield.
This thesis aims to overcome the aforementioned drawbacks and challenges faced while
using microcarriers for MSC expansion. In order to achieve this, a genipin crosslinked
alginate-chitosan microcarrier was developed as an alternative tool for MSC expansion.
According to a literature search, although genipin crosslinked alginate-chitosan beads
have been previously investigated for cell encapsulation (Chen et al. 2006), this work is
the first to utilize these materials as microcarriers for MSC expansion. Results in chapter
5 demonstrated that the hydrogel based microcarrier had a superior MSC attachment and
detachment efficiency compared to the popular commercial microcarrier Cytodex 1.
173
Moreover, MSCs, while maintaining their stem cell phenotype, had a higher proliferation
rate on the microcarriers created in this study than on Cytodex 1.
The core material of the microcarrier, alginate, does not promote cell adhesion. However,
this allows engineering of specific cellular interactions as the polymer acts as a blank
template (Rowley et al. 1999). As shown in chapter 3, bead diameter and circularity could
be controlled using electrospraying by manipulation of the electrospraying parameters.
The microcarriers could hence be produced in a range of sizes for various applications
allowing the opportunity for customization of the culture. In order to generate a cell
adhesive surface, the alginate beads were subsequently coated with chitosan and
crosslinked with genipin. All 3 materials the microcarrier comprises of: alginate, chitosan
and genipin, are highly biocompatible and approved for pharmaceutical or clinical use by
various regulation bodies around the world. Hence, should the microcarriers be
commercialized, this would enable a smoother regulatory approval process.
The production process of the microcarriers were all performed under mild conditions
without the use of strong organic solvents. Additionally, through optimization of the
production parameters in chapter 3 and confirmation of microcarrier stability in cell
culture conditions in chapter 4, the production time was significantly reduced compared
to typical genipin crosslinked materials. The techniques used were simple and not labour
intensive. This allowed the number of microcarriers produced to be easily scaled up from
a 22ml vial culture to a 250ml bottle as shown in chapter 5. Although additional work
would be required, these properties of the production process would enable the
microcarriers to be easily produced within an automated system, allowing microcarriers
to be generated based on the demand for cells while inducing minimal labour costs.
174
Most commercial microcarriers are sold in a dry state (GE Healthcare 2011a). This would
significantly increase the shelf life of the microcarrier, preserving its properties until use,
as well as lowering storage and transportation costs (Barley). Hence, in order to ensure a
smooth pathway towards commercialization, the microcarriers were freeze dried and their
stability as well as cell culture properties had to be verified following re-swelling. The
results in chapter 4 and 5 suggested shrinkage of the alginate structure during freeze
drying. This led to rough and deformed surfaces which altered the cell attachment
behaviour. Hence, more fundamental work should be carried out to study the microcarrier
hydrogel structure during the freeze drying cycle. Such work would involve designing a
specific freeze drying recipe utilizing temperatures to prevent shrinkage of the
microcarriers.
To conclude, although much work is still required in order to achieve a microcarrier fit
for commercial cell expansion, the genipin crosslinked alginate-chitosan microcarriers
developed in this study were able to overcome several drawbacks of commercial
microcarriers. Most notably, the microcarriers yielded a higher level of MSCs and
possessed a greater detachment efficiency following culture compared to Cytodex 1.
Based on the outcome of this research, several potential future work are suggested in the
next section. These offer either potential solutions to the limitations faced in this work or
a future path to further develop the microcarriers as a commercial cell expansion product.
6.2 Future Work
6.2.1 Microcarrier Production Optimization
The effect of different coating and crosslinking parameters on the crosslinking density as
well as the coating layer thickness was assessed through green fluorescence generated
from chitosan-genipin conjugates under a fluorescence optical microscope. This
eliminates the need for additional fluorescent staining to provide an indication of the
175
effects of the production parameters on the final coating layer. Despite this, the results
were ultimately limited by the resolution of the microscope. As the microcarriers were
thicker than 2µm, secondary fluorescence emitted from regions away from the focus
plane would interfere with the resolution of features in focus (Nikon 2018). Hence, the
fluorescence intensity and the coating layer thickness values measured could not be
interpreted as absolute figures.
In order to increase the resolution of the images acquired, it is proposed to employ
confocal microscopy. Unlike the optical microscope, the confocal microscope contains a
pinhole aperture which excludes out-of-focus flare in thick fluorescent specimens,
resulting in a higher resolution (Nikon 2018). This would provide a clearer picture of the
microcarrier coating layer profile and detect any potential variations within the coating
layer.
AFM microindentation of ALXL37 and ALXL60 yielded E* values with a high standard
deviation possibly due to non-uniformity with the coating layer of a single bead. For the
current study, alginate-chitosan microbeads were crosslinked under static conditions with
no agitation. Although the alginate microbeads were placed on an orbital shaker during
chitosan coating, the centripetal force causes the beads to aggregate at the centre of the
well, restricting bead mobility. Moreover, bead movement was further reduced by the
high viscosity of the chitosan solution.
In order to develop a more homogenous microcarrier coating layer, uniform agitation
during the coating and crosslinking steps should be applied. This generates homogenous
mixing conditions, preventing physiochemical gradients developing (David et al. 2004;
Gautier et al. 2011; Yeatts and Fisher 2011). Hence, it is proposed to coat and crosslink
alginate beads within a fluidized bed chamber to provide a greater and more uniform
176
mixing compared to the current methods. Fluidization ensures all the beads come in equal
contact to the coating/crosslinking solution. Moreover, these conditions could be
achieved without the presence of an impeller, lowering the shear levels (Groboillot et al.
1994; Liu et al. 2014). It is suggested to employ a fluidization rate which is slightly above
the minimum fluidized bed velocity. This will yield a single bead suspension maximizing
bead surface area while ensuring chitosan and genipin molecules have sufficient time to
interact and diffuse into the bead surface.
Finally, the degree of genipin crosslinking could also be quantified through the ninhydrin
assay. Ninhydrin reacts with amino groups transforming from a yellow colour to a deep
purple colour. Therefore, the total concentration of free amino groups present in the
microcarriers could be determined by measuring the absorbance values at 570nm.
Ninhydrin could be reacted with known concentrations of glycine in order to generate a
standard curve. The degree of crosslinking following genipin treatment can be
subsequently quantified by (Lai et al. 2010):
𝐶𝐵 − 𝐶𝐴
𝐶𝐵 𝑥 100 (6.1)
Where CB is the concentration of amino groups in the alginate-chitosan microbead prior
to crosslinking. CA is the amount of free amino groups in the genipin crosslinked alginate-
chitosan microcarriers post crosslinking.
The assay successfully quantified the degree of crosslinking in genipin crosslinked
chitosan (Lai et al. 2010) and gelatin (Chang et al. 2003) membranes. Hence showing
that the fluorescence released by the crosslinked genipin conjugates do not interfere with
the readings generated by the ninhydrin reactions. The advantage of using the ninhydrin
assay compared to comparing fluorescent intensity is the ability to quantify the degree of
crosslinking in terms of free amino groups. However, the latter method provides a
177
structure of the crosslinked coat and the coating layer thickness. Therefore, both methods
should be employed in future investigations.
6.2.2 Freeze Drying
A part of the project which is worth examining in more depth concerns the potential to
freeze dry the microcarriers. Although this was attempted in chapter 4, the shrivelled
surfaces of FDAB and FDXL60 as well as their failure to re-swell to similar diameters
compared to AB and ALXL60 respectively suggests shrinkage of the hydrogel structure
had occurred as a result of freeze drying.
In order to confirm that shrinkage has occurred, the possibility of structural collapse of
the hydrogel structure due to exceeding of the glass transition temperature should be
eliminated. This could be done by oven drying the microcarriers for a similar amount of
time and comparing the beads’ porous structure with FDAB and FDXL60 via SEM. The
next step is to determine the glass transitional temperature of the microcarriers as this
provides a useful value to optimizing the freeze drying process. This could be obtained
by using a trial and error approach. Initially, a low temperature and pressure would be set
for a long and conservative drying cycle, these parameters are raised in subsequent cycles
until a temperature where evidence of structural collapse is observed under SEM. The
glass transition temperature of the microcarriers could be measured through temperature
probes attached to the sample plate. For future freeze drying runs, the drying temperature
would be maintained below the glass transition temperature minimizing drying time
while maintaining product integrity (Barley).
The relationship between the glass transition temperature minus product temperature, to
the degree of shrinkage could then be investigated. However, it should be noted that even
if freeze dried samples are maintained well below the glass transition temperature, some
shrinkage would still occur due to the sublimation process (Rambhatla et al. 2005).

178
Despite this, the freeze drying conditions developed in past studies for drying alginate
microbeads could act as a benchmark and starting temperature for ALXL60
microcarriers. In a previous report, alginate beads were successfully freeze dried at –
33°C and 10mmtorr for 24 hours, resulting in a highly porous hydrogel network with the
dried beads undergoing minimal shrinking (Abubakr et al. 2009).
Once the optimal freeze drying parameters have been determined, cell culture and bead
stability experiments could be repeated on FDXL60.
6.2.3 Large Scale Cell Expansion
Microcarrier cell culture described in this thesis is limited to static culture. Although this
setup provided a comparative study of the performance of ALXL60 to Cytodex 1, it
ultimately does not assess the microcarrier behaviour within a dynamic culture
environment. To achieve this, it is proposed to design an all in one unit incorporating
microcarrier production (electrospraying, coating and crosslinking) and microcarrier
culture. The unit would lower the risk of contamination while increasing potential for
automation.
The proposed system’s schematic is presented in Fig 6.1. An electrospraying unit is built-
in the system (Fig 6.1A) and is connected to a fluidized bed chamber (Fig 6.1B), which
is linked to either the conditioning vessel within an incubator (Fig 6.1C) or the waste (Fig
6.1D). Several smaller vessels (Fig 6.1E-G) housing various microcarrier production
solutions such as chitosan and genipin as well as cell culture reagents are connected to
the conditioning vessel. The conditioning vessel serves as a chamber where solutions are
allowed to reach their required temperature prior to entering the fluidization chamber.
Alginate microbeads are generated using the in-built electrospraying unit. The
microbeads are subsequently transferred to the fluidization chamber. Chitosan is pumped
into the fluidization chamber at room temperature creating a fluidized bed. This provides

179
vigorous agitation and effective mixing during the coating process. The chitosan solution
is recirculated into the conditioning vessel and back into the fluidization chamber
throughout the duration of coating. However, microbeads are prevented from leaving the
fluidized bed vessel through a cell strainer and control of the applied flow rate. At the
end of the coating, valves would redirect the liquid output into waste and DI water is
pumped through, washing the unit. Subsequently, genipin is allowed to reach 60°C within
the conditioning vessel. The alginate-chitosan microbeads were then crosslinked for the
required amount of time, yielding the genipin crosslinked alginate-chitosan microcarriers
(ALXL60).
Following the microcarrier production, the microcarrier cell culture begins. Cell culture
media is first warmed to 37 °C and circulated through the fluidization vessel where the
microcarriers are conditioned. A cell seeding port is linked to the top of the fluidization
chamber where freshly harvested cells can be injected. During the first 24 hours of cell
culture, the flow rate is adjusted to induce gentle agitation near minimal fluidization
velocity to ensure a uniform cell attachment. Following this, media is renewed and the
flow rate would be increased for the 2 week culture. Bead and media samples can be
taken from the seeding channel allowing the cell growth properties to be monitored.
At the end of the culture, trypsin is pumped into the fluidization chamber at 37 °C. The
cells are detached from the microcarriers before fresh media is pumped into the chamber
to halt trypsin activity. Subsequently, the waste chamber is replaced with a collection
vessel and the cell suspension is directed to the collection vessel.
Due to the lower production rate of electrospraying compared to the emulsion method (as
shown in chapter 5), this device would be more suited towards autologous treatment. The
unit would allow local practitioners who lack facilities for cell culture to expand MSCs

180
immediately after isolation without requiring transportation. The number of beads
produced can be customized based on the isolation count and final cell numbers required.
6.2.4 Macrocarrier Work
As shown in chapters 5, ALXL60 developed in this study has displayed better MSC
expansion capabilities compared to Cytodex 1. However, one of the biggest challenges
Temperature
controlled
chamber
A
B
C
D
E F G
Pump
Valve
Fig 6.1. All in one setup combining microcarrier production with cell culture and harvest. A)
Electrospraying setup containing alginate beads. B) Dual purpose fluidization chamber supporting
coating/crosslinking of alginate beads as well as microcarrier cell culture. Fluidization rate is
controlled to maintain microcarrier within the chamber. In addition, a mesh could be installed
within the valves at chamber exit to prevent microcarriers from leaving. C) Conditioning vessel
adjusting solution temperature to required levels before entering the fluidization chamber. This
part of the system would be stored within an adjustable temperature controlled chamber. D)
Waste liquid vessel. Can be exchanged for cell collection vessel during cell harvest. E) Microcarrier
production reagents such as chitosan, genipin and DI water. Genipin would be heated up to 60 °C
within the conditioning chamber. F) Cell culture reagents such as media and PBS, the solutions are
adjusted to 37 °C within the condition chamber before moving to fluidization culture vessel. G)
Trypsin for cell detachment.
181
for microcarriers is the separation of the beads from the detached cell suspension (Nienow
et al. 2014). Due to the small size of microcarriers, efficient separation would typically
involve techniques such as filtration or centrifugation (Chen et al. 2013), exacerbating
the costs and labour intensity as the expansion scale increases (Nienow et al. 2014;
Badenes et al. 2016).
It is hence proposed to produce ALXL60 as macrocarriers – spherical beads of mm scale.
This creates a large discrepancy between the macrocarrier and cell size, allowing easy
separation of the detached cells. Although this lowers the surface area to volume ratio of
the beads, the increase in separation efficiency could increase the final cell yield
compared to the microcarriers.
6.2.4.1 Preliminary Data for Macrocarrier MSC Culture
A study exploring the potential for macrocarrier MSC culture has been conducted. Due
to time constraints of this project, these results are only preliminary and no solid
conclusions could be drawn from this work, however these results could provide a
direction for future investigations.
Alginate macrobeads were produced by preparing a 2% (w/v) alginate solution. The
solution was introduced to a 10ml syringe and extruded through a blunt 18G needle. Flow
rate was kept constant at 3ml/min and no voltage was applied to the needle. Macrobeads
were generated within a 0.1M CaCl2 bath 15cm below the needle tip. A magnetic stirrer
was placed within the gelling bath, agitating the solution in order to prevent bead
clumping.
Macrocarriers were created using two techniques. The first is similar to microcarrier
production where the alginate macrobeads were coated in 1% (w/v) chitosan + 0.1M
CaCl2 for 24 hours producing alginate-chitosan macrobeads which were subsequently
crosslinked by immersing them within a 1mg/ml genipin solution at 60°C for 24 hours.

182
As this method contains 3 steps: alginate macrobead formation, chitosan coating and
genipin crosslinking, it would be referred to as the 3 step method.
The second method involves dripping the alginate solution into a 1% chitosan + 0.1M
CaCl2 solution, 15cm below the needle tip. An alginate-chitosan membrane would
develop around the droplet via complex coacervation. Ca2+ ions would subsequently
diffuse through the membrane gelling the alginate core. The beads were left in the bath
for 1 hour before crosslinking with 1mg/ml genipin at 60°C for 24 hours. Unlike the 3
step method, this method only consists of 2 steps: formation of alginate chitosan beads
and bead crosslinking. Therefore, it would be referred to as the 2 step method.
Macrocarriers created using both techniques swelled in cell culture media, however upon
media exchange following a 48 hour conditioning period, cracks began to propagate on
the bead surface (Fig 6.2), this suggests fracture of the genipin crosslinked coating layer,
exposing the alginate core. As the alginate core does not support cell adhesion (Lee and
Mooney 2012), fracture of the coating layer would decrease the overall available surface
area for cell attachment. Moreover, cells attached to the macrocarriers could potentially
be expelled as the cracks propagate.
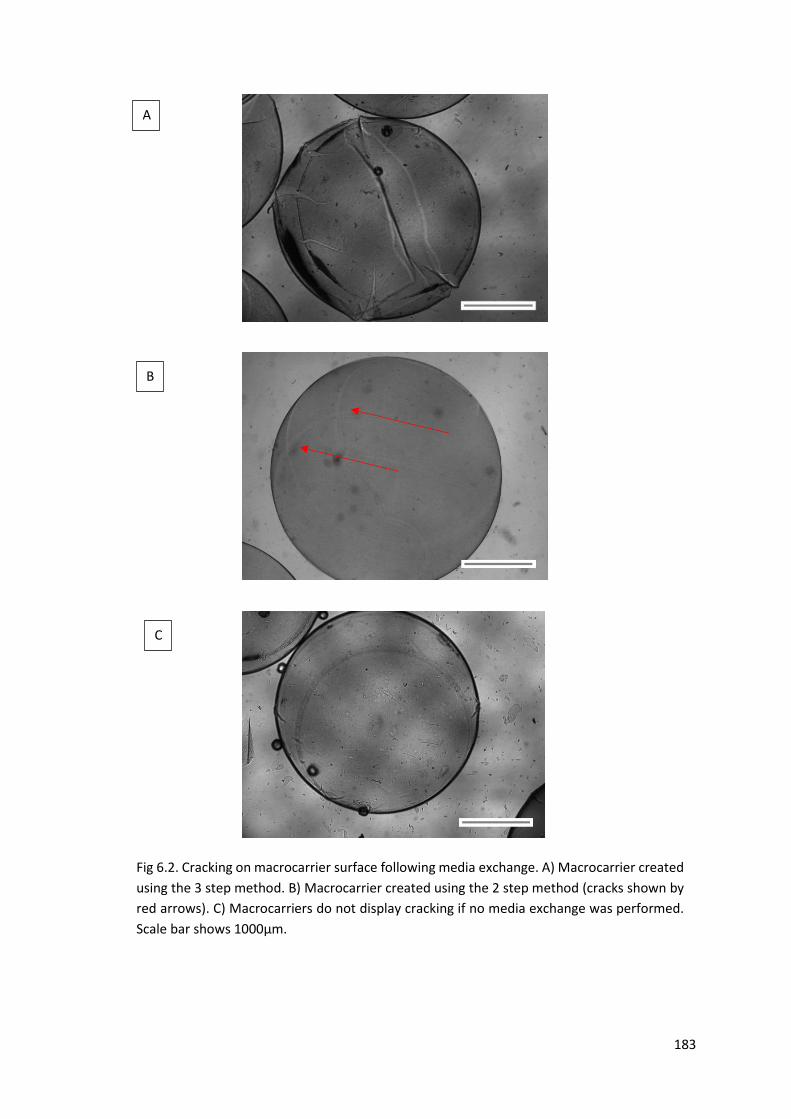
183
A
Fig 6.2. Cracking on macrocarrier surface following media exchange. A) Macrocarrier created
using the 3 step method. B) Macrocarrier created using the 2 step method (cracks shown by
red arrows). C) Macrocarriers do not display cracking if no media exchange was performed.
Scale bar shows 1000µm.
B
C

184
The cause of the cracks was most likely due to the swelling of the alginate core. Initial
addition of media causes Ca2+ within the alginate core to flow out of the macrocarrier due
to the high levels of non-gelling monovalent ions within the medium causing the
macrocarrier to swell (Bajpai and Sharma 2004). Hence, the coating layer was
compromised due to the swelling pressure. On the other hand, as the macrocarriers
produced using the 3 step method were added to cell culture media with 0.01M CaCl2,
the macrocarriers displayed a lower swelling ratio compared to standard cell culture
media as well as showing no signs of surface cracking (Fig 6.3).
In addition to the initial swelling following the addition of media, media exchange also
appear to have an effect on macrocarrier swelling and surface cracking. The surface
cracking phenomenon did not occur if no media exchange was made (Fig 6.2C). As the
Ca2+ was removed from the macrocarriers during ion exchange with monovalent ions, the
Ca2+ levels within the macrocarriers would gradually equilibrate with the Ca2+ level in
the media. This would halt the ion exchange process and stabilize the macrocarrier
diameter. However, following media exchange, the Ca2+ levels within the media would
Fig 6.3. Macrocarrier in CaCl2 enriched media do not display cracking phenomenon. Scale bar
shows 1000µm.

185
once again fall below the level within the alginate core causing additional ion exchange
of Ca2+ out of the macrocarriers, leading to further macrocarrier swelling and eventually
compromise of the coating layer. On the other hand, the degree of ion exchange would
decrease within the modified high Ca2+ media as Ca2+ levels reached equilibrium at a
faster rate compared to the standard media. As the medium was exchanged, the level of
Ca2+ within macrocarriers would be close the surrounding medium leading to no further
swelling and hence cracking.
The surface cracking was only observed within macrocarriers crosslinked with genipin.
Uncrosslinked alginate chitosan macrobeads swelled significantly during media addition
and exchange, however displayed no surface cracking (Fig 6.4). This was due to the fact
that following crosslinking, the coating layer became stiffer and hence more rigid (Chen
et al. 2005; Pandit et al. 2013). Although this significantly increases the gel’s ultimate
tensile strength, the coating layer’s strain-at-fracture was significantly reduced
(Muzzarelli 2009). This leads to a greater chance of fracture following the alginate core
swelling. On the other hand, the uncrosslinked alginate-chitosan membrane could expand
with the bead core during swelling.
Fig 6.4. Uncrosslinked alginate chitosan macrocarrier produced using the 3 step method
display no surface cracking following media exchange. Scale bar shows 1000µm.

186
The degree of crack propagation and frequency of cracks appear to be lower on the
macrocarriers created using the 2 step method compared to their counterparts created
using the 3 step method (Fig 6.2). It has been previously reported that alginate-chitosan
beads formed through complex coarcevation (ie the two step method) had a significantly
lower amount of deposited chitosan compared to alginate beads coated within a chitosan
solution (3 step method). This is due to the fact that as the alginate droplet comes in
contact with the chitosan+CaCl2 solution, chitosan within the solution instantaneously
binds to the alginate surface, however, the initial membrane formed hinders further
diffusion of chitosan into the alginate core. On the other hand, when alginate beads are
coated in a chitosan solution, chitosan can diffuse through the pores of the alginate beads
binding deeper within the hydrogel network (Gåserød and Skja 1998; Gåserød et al.
1999). The lower chitosan bounded using the 2 step method would lead to a lower
crosslinking density following genipin crosslinking, resulting in a less stiff and rigid
coating layer. This would provide the coating layer greater freedom to expand during
bead swelling resulting in a lower degree of surface fracture.
Unlike the macrocarriers, the diameter and surface integrity of ALXL60 microcarriers
(see chapter 4) were not affected by media exchange and the latter remained stable for
the 14 day period with no signs of surface cracking. These discrepancies were due to two
main reasons, the first is the significant difference in diameter between the macrocarriers
and the microcarriers. It was shown in a previous report that chitosan:alginate weight
ratio decreases with increasing bead size. The coating layer thickness to bead diameter
could be used to characterize this:
𝑇ℎ𝑖𝑐𝑘𝑛𝑒𝑠𝑠 𝑅𝑎𝑡𝑖𝑜 =𝐶𝑜𝑎𝑡𝑖𝑛𝑔 𝐿𝑎𝑦𝑒𝑟 𝑇ℎ𝑖𝑐𝑘𝑛𝑒𝑠𝑠 (𝑚𝑚)
𝐵𝑒𝑎𝑑 𝐷𝑖𝑎𝑚𝑒𝑡𝑒𝑟 (𝑚𝑚) (6.2)
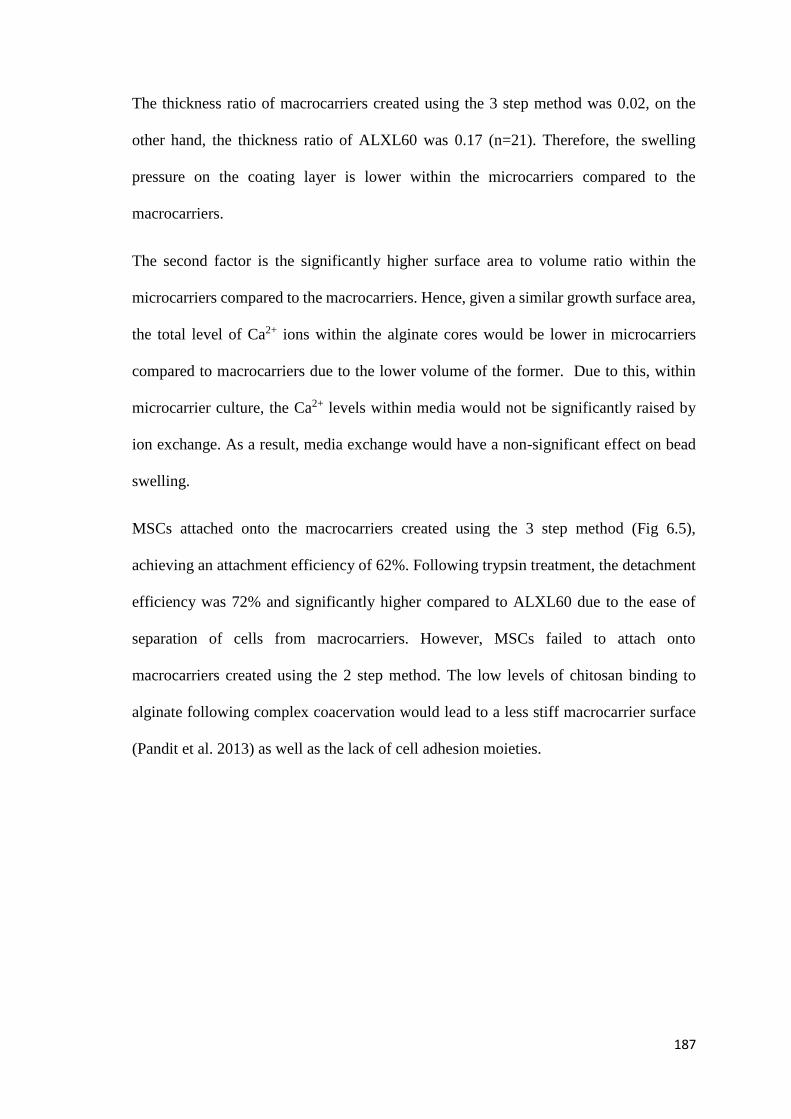
187
The thickness ratio of macrocarriers created using the 3 step method was 0.02, on the
other hand, the thickness ratio of ALXL60 was 0.17 (n=21). Therefore, the swelling
pressure on the coating layer is lower within the microcarriers compared to the
macrocarriers.
The second factor is the significantly higher surface area to volume ratio within the
microcarriers compared to the macrocarriers. Hence, given a similar growth surface area,
the total level of Ca2+ ions within the alginate cores would be lower in microcarriers
compared to macrocarriers due to the lower volume of the former. Due to this, within
microcarrier culture, the Ca2+ levels within media would not be significantly raised by
ion exchange. As a result, media exchange would have a non-significant effect on bead
swelling.
MSCs attached onto the macrocarriers created using the 3 step method (Fig 6.5),
achieving an attachment efficiency of 62%. Following trypsin treatment, the detachment
efficiency was 72% and significantly higher compared to ALXL60 due to the ease of
separation of cells from macrocarriers. However, MSCs failed to attach onto
macrocarriers created using the 2 step method. The low levels of chitosan binding to
alginate following complex coacervation would lead to a less stiff macrocarrier surface
(Pandit et al. 2013) as well as the lack of cell adhesion moieties.

188
Fig 6.5. MSC seeded on macrocarriers. A) Cells attached and spread into spindle-like
structures when seeded on macrocarriers created using the 3 step method. B) MSCs failed to
attach to macrocarriers created using the 2 step method and remain spherically shaped. Scale
bar represent 1000µm.
A
B

189
The next section discusses the potential solutions to surface cracking observed within
macrocarriers based on the results and evidence gathered from the preliminary results.
6.2.4.2 Future Macrocarrier Work
An important aspect of preventing surface cracking is the understanding of the chitosan
to alginate weight ratio on the macrocarriers. To calculate this, the weight of dried
alginate macrobeads would yield the total weight of alginate. On the other hand, the total
weight of bound chitosan can be measured through radioactive labelling of the chitosan.
Following washing with DI water after chitosan coating, the radiation levels on each bead
can be analysed with a gamma counter. As the radiation is proportional to weight, the
total amount of chitosan on the alginate-chitosan macrobead could be calculated
(Gåserød and Skja 1998). In order to prevent surface cracking the chitosan:alginate
weight ratio of the macrocarriers should be non-significant when compared to ALXL60.
A significant drawback of using radioactive materials is the requirement of several
licences as well as intensive training and protection equipment. This can be time
consuming and incur high costs potentially delaying the project. Therefore, as a potential
alternative, the ratio of the chitosan coat to alginate diameter could be considered in order
to provide an indication of the total chitosan deposited on the bead surface, as used in the
preliminary studies. Measurement was difficult under the optical microscope as the
coating layer thickness was significantly lower compared to the macrocarrier diameter.
However, as with microcarriers, the accuracy of the coating layer measurements could
be improved through the use of a confocal microscope.
Aside from improving the measurement techniques for obtaining the chitosan:alginate
ratio, the effect of different production parameters on the final coating layer thickness
can be further optimized. The effect of coating times could be studied, through sampling
at hourly intervals to determine the coating time which achieves the maximum chitosan
190
deposition through measurements of the coating layer thickness. Similarly, the time to
achieve maximum crosslinking can also be assessed through fluorescent intensity of
chitosan genipin conjugates or the ninhydrin assay.
The methods utilized in this study mainly involves altering the production parameters in
order increase the chitosan:alginate ratio and prevent surface cracking. However, as
future work, it is proposed to investigate the properties of the alginate and chitosan used.
One such property is the M/G ratio of the alginate polymer and has not been investigated
in this study. Alginate (A2033) used in this study has a M/G ratio of 1.56 according to
the supplier’s FAQ and hence could be considered as high M alginate. It was selected
due to its low cost, easy availability and ability to create spherical beads under simple jet
mode. However, previous reports established that high G alginate forms gels with a
higher mechanical stability compared to high M alginates (Purcell et al. 2009; Lee and
Mooney 2012). As a result, high G alginate beads display a significantly lower swelling
ratio within a saline solution compared to their high M counterparts (Darrabie et al. 2006).
This would lower the pressure on the coating layer potentially keeping the surfaces intact.
In addition to lower swelling, chitosan binds more rapidly and in higher densities to
calcium alginate beads created from high G alginate compared to high M alginate,
developing a higher chitosan:alginate weight ratio in the former (Gåserød and Skja 1998).
This was due to the more open and porous gel network created with high G alginate
compared to high M alginate, as shown by the former’s higher diffusion coefficients
(Martinsen et al. 1992).
Another property which could increase chitosan binding is the chitosan molecular weight.
Although, chitosan utilized in this study was classified as low molecular weight by the
supplier (Sigma Aldrich) with an average molecular weight of 120kDa, ranging from
50kDa to 190kDa, chitosan with molecular weights of around 70kDa could be purchased
191
commercially (Chen et al. 2010). Moreover, studies have created chitosan with molecular
weight as low as 15kDa through degradation of longer polymer chains (Gåserød et al.
1999). As discussed in a previous study, chitosan of lower molecular weight bind in
higher densities to the alginate bead surface due to the lower steric hindrance (Gåserød
and Skja 1998). Therefore it is proposed to use chitosan of lower molecular weight in
order to achieve a thicker and denser coating layer to resist alginate swelling.
192
References
Abubakr N, Lin SX, Chen XD (2009) Effects of Drying Methods on the Release Kinetics of Vitamin B 12 in Calcium Alginate Beads. Dry Technol 27:1258–1265 . doi: 10.1080/07373930903267732
Adikwu M, Esimone CO (2009) Biopolymers in Drug Delivery: Recent Advances and Challenges
Agostinho LLF, Tamminga G, Yurteri CU, et al (2012a) Morphology of water electrosprays in the simple-jet mode. Phys Rev E 86:066317 . doi: 10.1103/PhysRevE.86.066317
Agostinho LLF, Yurteri CU, Fuchs EC, Marijnissen JCM (2012b) Monodisperse water microdroplets generated by electrohydrodynamic atomization in the simple-jet mode. Appl Phys Lett 100:1–5 . doi: 10.1063/1.4729021
Agostinho LLF, Yurteri CU, Wartena J, et al (2013) Insulated multinozzle system for electrohydrodynamic atomization in the simple-jet mode. Appl Phys Lett 102:194103 . doi: 10.1063/1.4806977
Altin JG, Sloan EK (1997) The role of CD45 and CD45-associated molecules in T cell activation. Immunol Cell Biol 75:430–445 . doi: 10.1038/icb.1997.68
Altman DG, Bland JM (2005) Standard deviations and standard errors. Bmj 331:903 . doi: 10.1136/bmj.331.7521.903
Amable PR, Teixeira MVT, Carias RBV, et al (2013) Identification of Appropriate Reference Genes for Human Mesenchymal Cells during Expansion and Differentiation. PLoS One 8:e73792
Bach F, Albertini R, Joo P, et al (1968) Bone-Marow Transplantation in a patient with the Wiskott-Aldrich Syndrome. Lancet 292:1364–1366 . doi: 10.1016/S0140-6736(68)92672-X
Badenes SM, Fernandes-Platzgummer A, Rodrigues CA V, et al (2016) Chapter 4 - Microcarrier Culture Systems for Stem Cell Manufacturing BT - Stem Cell Manufacturing. Elsevier, Boston, pp 77–104
Bajpai SK, Kirar N (2016) Swelling and drug release behavior of calcium alginate/poly (sodium acrylate) hydrogel beads. Des Monomers Polym 19:89–98 . doi: 10.1080/15685551.2015.1092016
Bajpai SK, Sharma S (2004) Investigation of swelling/degradation behaviour of alginate beads crosslinked with Ca2+ and Ba2+ ions. React Funct Polym 59:129–140 . doi: 10.1016/j.reactfunctpolym.2004.01.002
Balkwill F (2004) Cancer and the chemokine network. Nat Rev Cancer 4:540–50 . doi: 10.1038/nrc1388
Barley J Basic Principles of Freeze Drying. In: SP Sci. https://www.spscientific.com/freeze-drying-lyophilization-basics/. Accessed 13 Jun 2018
193
Bhartiya D, Nagvenkar P, Sriraman K, Shaikh A (2013) An Overview of Pluripotent Stem Cells. In: Pluripotent Stem Cells
Blandino ANA, Macias M, Canter D (1999) Formation of Calcium Alginate Gel Capsules : Influence of Sodium Alginate and CaC12 Concentration on Gelation Kinetics. 88:686–689
Bock N, Dargaville TR, Woodruff M a. (2012a) Electrospraying of polymers with therapeutic molecules: State of the art. Prog Polym Sci 37:1510–1551 . doi: 10.1016/j.progpolymsci.2012.03.002
Bock N, Dargaville TR, Woodruff M a. (2012b) Electrospraying of polymers with therapeutic molecules: State of the art. Prog Polym Sci 37:1510–1551 . doi: 10.1016/j.progpolymsci.2012.03.002
Bock N, Woodruff M a., Hutmacher DW, Dargaville TR (2011) Electrospraying, a Reproducible Method for Production of Polymeric Microspheres for Biomedical Applications. Polymers (Basel) 3:131–149 . doi: 10.3390/polym3010131
Brun-Graeppi AKAS, Richard C, Bessodes M, et al (2011) Cell microcarriers and microcapsules of stimuli-responsive polymers. J Control Release 149:209–24 . doi: 10.1016/j.jconrel.2010.09.023
Bugarski B, Li Q, Goosen MF a, et al (1994) Electrostatic Droplet Generation: Mechanism. AIChE J 40: . doi: 10.1002/aic.690400613
Cao H, Feng Q, Xu W, et al (2010) Genipin induced apoptosis associated with activation of the c-Jun NH2-terminal kinase and p53 protein in HeLa cells. Biol Pharm Bull 33:1343–1348 . doi: 10.1248/bpb.33.1343
Caplan AI (2007) Adult Mesenchymal Stem Cells for Tissue Engineering Versus Regenerative Medicine. 341–347 . doi: 10.1002/JCP
Caplan AI (2017) Mesenchymal stem cells: Time to change the name! Stem Cells Transl Med 6:1445–1451 . doi: 10.1002/sctm.17-0051
Cavo M, Fato M, Peñuela L, et al (2016) Microenvironment complexity and matrix stiffness regulate breast cancer cell activity in a 3D in vitro model. Sci Rep 6:35367 . doi: 10.1038/srep35367
Chan E-S, Lee B-B, Ravindra P, Poncelet D (2009) Prediction models for shape and size of ca-alginate macrobeads produced through extrusion-dripping method. J Colloid Interface Sci 338:63–72 . doi: 10.1016/j.jcis.2009.05.027
Chan E-S, Lim T-K, Voo W-P, et al (2011) Effect of formulation of alginate beads on their mechanical behavior and stiffness. Particuology 9:228–234 . doi: 10.1016/j.partic.2010.12.002
Chandy T, Sharma’ CP (1990) Chitosan - as a Biomaterial. Biomater Artif Cells Artif Organs 18:1–24 . doi: 10.3109/10731199009117286
194
Chang WH, Chang Y, Lai PH, Sung HW (2003) A genipin-crosslinked gelatin membrane as wound-dressing material: In vitro and in vivo studies. J Biomater Sci Polym Ed 14:481–495 . doi: 10.1163/156856203766652084
Chang Y, Tsai CC, Liang HC, Sung HW (2002) In vivo evaluation of cellular and acellular bovine pericardia fixed with a naturally occurring crosslinking agent (genipin). Biomaterials 23:2447–2457 . doi: 10.1016/S0142-9612(01)00379-9
Chaudhry M (2008) Induction of Gene Expression Alterations by Culture Medium from Trypsinized Cells. J Biol Sci 8:81–87
Chen AK-L, Chen X, Choo ABH, et al (2011) Critical microcarrier properties affecting the expansion of undifferentiated human embryonic stem cells. Stem Cell Res 7:97–111 . doi: 10.1016/j.scr.2011.04.007
Chen AK-L, Reuveny S, Oh SKW (2013) Application of human mesenchymal and pluripotent stem cell microcarrier cultures in cellular therapy: Achievements and future direction. Biotechnol Adv 31:1032–1046 . doi: 10.1016/j.biotechadv.2013.03.006
Chen H, Ouyang W, Lawuyi B, et al (2005) Reaction of chitosan with genipin and its fluorogenic attributes for potential microcapsule membrane characterization. J Biomed Mater Res - Part A 75:917–927 . doi: 10.1002/jbm.a.30492
Chen H, Ouyang W, Lawuyi B, Prakash S (2006) Genipin cross-linked alginate-chitosan microcapsules: Membrane characterization and optimization of cross-linking reaction. Biomacromolecules 7:2091–2098 . doi: 10.1021/bm050862y
Chen H, Ouyang W, Martoni C, et al (2010) Investigation of genipin cross-linked microcapsule for oral delivery of live bacterial cells and other biotherapeutics: Preparation and in vitro analysis in simulated human gastrointestinal model. Int J Polym Sci 2010: . doi: 10.1155/2010/985137
Choi BY, Park HJ, Hwang SJ, Park JB (2002) Preparation of alginate beads for floating drug delivery system : effects of CO 2 gas-forming agents. 239:81–91
Chui C-Y, Bonilla-Brunner A, Seifert J, et al (2019) Atomic force microscopy-indentation demonstrates that alginate beads are mechanically stable under cell culture conditions. J Mech Behav Biomed Mater 93:61–69 . doi: 10.1016/j.jmbbm.2019.01.019
Chui CY, Odeleye A, Nguyen L, et al (2018) Electrosprayed genipin cross-linked alginate–chitosan microcarriers for ex vivo expansion of mesenchymal stem cells. J Biomed Mater Res - Part A 122–133 . doi: 10.1002/jbm.a.36539
Cloupeau M (1990) Electrostatic spraying of liquids : Main functioning modes. 25:165–184
Cloupeau M, Prunet-Foch B (1994) Electrohydrodynamic spraying functioning modes: a critical review. J Aerosol Sci 25:1021–1036 . doi: 10.1016/0021-8502(94)90199-6
Cloupeu M, Prunet-Foch B (1989) Electrostatic Spraying of Liquids in Cone-Jet Mode. J Electrostat 22:135–159 . doi: 10.1016/0304-3886(89)90081-8
195
Constantinidis I, Rask I, Long RC, Sambanis A (1999) Effects of alginate composition on the metabolic, secretory, and growth characteristics of entrapped βTC3 mouse insulinoma cells. Biomaterials 20:2019–2027 . doi: 10.1016/S0142-9612(99)00104-0
Croisier F, Jérôme C (2013) Chitosan-based biomaterials for tissue engineering. Eur Polym J 49:780–792 . doi: 10.1016/j.eurpolymj.2012.12.009
Curtis K, Gomez L, Rios C, et al (2010) EF1alpha and RPL13a represent normalization genes suitable for RT-qPCR analysis of bone marrow derived mesenchymal stem cells. BMC Mol Biol 11:61 . doi: 10.1186/1471-2199-11-61
Daemi H, Barikani M (2012) Synthesis and characterization of calcium alginate nanoparticles, sodium homopolymannuronate salt and its calcium nanoparticles. Sci Iran 19:2023–2028 . doi: 10.1016/j.scient.2012.10.005
Darrabie MD, Kendall WF, Opara EC (2006) Effect of alginate composition and gelling cation on micro-bead swelling. J Microencapsul 23:29–37 . doi: 10.1080/02652040500286144
David B, Dufresne M, Nagel M (2004) In Vitro Assessment of Encapsulated C3A Hepatocytes Functions in a Fluidized Bed Bioreactor. 1204–1212 . doi: 10.1021/bp034301z
Dintwa E, Tijskens E, Ramon H (2008) On the accuracy of the Hertz model to describe the normal contact of soft elastic spheres. Granul Matter 10:209–221 . doi: 10.1007/s10035-007-0078-7
Discher DE (2005) Tissue Cells Feel and Respon to the Stiffness of Their Substrate. Science (80- ) 310:1139–1143 . doi: 10.1126/science.1116995
Djerassi C, Eisenbraun E, Finnegan R, et al (1960) Naturally occurring oxygen heterocyclics. IX Isolation and Characterization of Genipin. Tetrahedron Lett 25:2174–2177 . doi: 10.1016/S0040-4039(00)70284-X
Dojindo (2016) Dojindo: Cell Counting Kit-8 Technical Manual. Dojindo. doi: papers3://publication/uuid/0C39710D-D2AE-4891-8F2F-68A0200CC81B
Domarecka M, Sokołowski K, Krasowski M, et al (2016) Influence of water sorption on the shrinkage stresses of dental composites. J Stomatol 69:412–419 . doi: 10.5604/00114553.1225380
Dominici M, Le Blanc K, Mueller I, et al (2006) Minimal criteria for defining multipotent mesenchymal stromal cells. The International Society for Cellular Therapy position statement. Cytotherapy 8:315–7 . doi: 10.1080/14653240600855905
Dos Santos FF, Andrade PZ, da Silva CL, Cabral JMS (2013) Bioreactor design for clinical-grade expansion of stem cells. Biotechnol J 8:644–54 . doi: 10.1002/biot.201200373
Elzatahry a. a., Eldin MSM, Soliman E a., Hassan E a. (2009) Evaluation of alginate-chitosan bioadhesive beads as a drug delivery system for the controlled release of theophylline. J Appl Polym Sci 111:2452–2459 . doi: 10.1002/app.29221

196
Engler AJ, Sen S, Sweeney HL, Discher DE (2006) Matrix Elasticity Directs Stem Cell Lineage Specification. Cell 126:677–689 . doi: 10.1016/j.cell.2006.06.044
Fernández Farrés I, Norton IT (2014) Formation kinetics and rheology of alginate fluid gels produced by in-situ calcium release. Food Hydrocoll 40:76–84 . doi: 10.1016/j.foodhyd.2014.02.005
Fernandez TDS, De Souza Fernandez C, Mencalha AL (2013) Human induced pluripotent stem cells from basic research to potential clinical applications in cancer. Biomed Res Int 2013: . doi: 10.1155/2013/430290
Francis NL, Hunger PM, Donius AE, et al (2013) An ice-templated, linearly aligned chitosan-alginate scaffold for neural tissue engineering. J Biomed Mater Res - Part A 101:3493–3503 . doi: 10.1002/jbm.a.34668
Frauenschuh S, Reichmann E, Ibold Y, et al (2007) A Microcarrier-Based Cultivation System for Expansion of Primary Mesenchymal Stem Cells. Biotechnol Prog 23:187–193 . doi: 10.1021/bp060155w
Freshney R. (2011) Biology of Cultured Cells. In: Culture of Animal Cells: A Manual of Basic Technique and Specialized Applications
Friedenstein AJ, Chailakjan RK, Lalykina KS (1970) The development of fibroblast colonies in monolayer cultures of guinea-pig bone marrow and spleen cells. 393–403 . doi: 10.1111/j.1365-2184.1970.tb00347.x
Gal A, Nussinovitch A (2007) Hydrocolloid Carriers with Filler Inclusionfor Diltiazem Hydrochloride Release. J Pharm Sci 96:168–178 . doi: https://doi.org/10.1002/jps.20775
Gao L, Gan H, Meng Z, et al (2014) Effects of genipin cross-linking of chitosan hydrogels on cellular adhesion and viability. Colloids Surfaces B Biointerfaces 117:398–405 . doi: 10.1016/j.colsurfb.2014.03.002
García-Olmo D, García-Arranz M, Herreros D, et al (2005) A phase I clinical trial of the treatment of crohn’s fistula by adipose mesenchymal stem cell transplantation. Dis Colon Rectum 48:1416–1423 . doi: 10.1007/s10350-005-0052-6
Gåserød O, Sannes A, Skja G (1999) Microcapsules of alginate — chitosan . II . A study of capsule stability and permeability. 20:773–783 . doi: 10.1016/S0142-9612(98)00230-0
Gåserød O, Skja G (1998) Microcapsules of alginate-chitosan — I A quantitative study of the interaction between alginate and chitosan. 19:1815–1825 . doi: 10.1016/S0142-9612(98)00073-8
Gasperini L, Maniglio D, Migliaresi C (2013) Microencapsulation of cells in alginate through an electrohydrodynamic process. J Bioact Compat Polym 28:413–425 . doi: 10.1177/0883911513501599
Gaumann A, Laudes M, Jacob B, et al (2000) Effect of media composition on long-term in vitro stability of barium alginate and polyacrylic acid multilayer microcapsules. 21:1911–1917 . doi: 10.1016/S0142-9612(00)00071-5
197
Gautier A, Carpentier B, Dufresne M, et al (2011) Impact of alginate type and bead diameter on mass transfers and the metabolic activities of encapsulated C3A cells in bioartificial liver applications. 21:94–106 . doi: 10.22203/eCM.v021a08
Gavara N (2016) Combined strategies for optimal detection of the contact point in AFM force-indentation curves obtained on thin samples and adherent cells. Sci Rep 6:1–13 . doi: 10.1038/srep21267
GE Healthcare (2011a) Cytodex TM surface microcarriers
GE Healthcare (2007) Microcarrier Cell Culture Principles and Methods
GE Healthcare (2016) Microcarrier Cell Culture Principles and Methods
GE Healthcare (2009) Cytopore - macroporous microcarriers. GE Healthc Bio-Sciences AB 1–2 . doi: papers3://publication/uuid/3E939DAD-F5EF-4F25-8E49-3D18AAF92374
GE Healthcare (2011b) CytolineTM 1 microcarrier. 3–6
George M, Abraham TE (2006) Polyionic hydrocolloids for the intestinal delivery of protein drugs: alginate and chitosan--a review. J Control Release 114:1–14 . doi: 10.1016/j.jconrel.2006.04.017
Gharravi AM, Orazizadeh M, Hashemitabar M (2014) Direct expansion of chondrocytes in a dynamic three-dimensional culture system: overcoming dedifferentiation effects in monolayer culture. Artif Organs 38:1053–8 . doi: 10.1111/aor.12295
Ghasemi-Mobarakeh L (2015) Structural properties of scaffolds: Crucial parameters towards stem cells differentiation. World J Stem Cells 7:728 . doi: 10.4252/wjsc.v7.i4.728
Giancola R, Bonfini T, Iacone A (2012) Cell therapy : cGMP facilities and manufacturing. 2:243–247
Goosen MFA, Mahmud ESE, Al-ghafri AS, et al (2000) Immobilization of Cells Using Electrostatic Droplet Generation. 167–174 . doi: 10.1385/0-89603-386-4:167
Gore A, Li Z, Fung H-L, et al (2011) Somatic coding mutations in human induced pluripotent stem cells. Nature 471:63
Gorgieva S, Kokol V (2011) Collagen-vs. Gelatin-Based Biomaterials and Their Biocompatibility : Review and Perspectives. In: Biomaterials Applications for Nanomedicine. InTech Open Access Publisher, pp 17–51
Gough JE, Scotchford C a., Downes S (2002) Cytotoxicity of glutaraldehyde crosslinked collagen/poly(vinyl alcohol) films is by the mechanism of apoptosis. J Biomed Mater Res 61:121–130 . doi: 10.1002/jbm.10145
Grant GT, Morris ER, Rees D a., et al (1973) Biological interactions between polysaccharides and divalent cations: The egg-box model. FEBS Lett 32:195–198 . doi: 10.1016/0014-5793(73)80770-7
198
Groboillot a, Boadi DK, Poncelet D, Neufeld RJ (1994) Immobilization of cells for application in the food industry. Crit Rev Biotechnol 14:75–107 . doi: 10.3109/07388559409086963
Gröhn P, Klöck G, Zimmermann U (1997) Collagen-Coated Ba2+ Alginate Microcarriers for the Culture of Anchorage-Dependent Mammalian Cells. Biotechniques 22:970–975
Gugerli R, Cantana E, Heinzen C, et al (2002) Quantitative study of the production and properties of alginate/poly-L-lysine microcapsules. J Microencapsul 19:571–590 . doi: 10.1080/02652040210140490
Guilak F, Cohen DM, Estes BT, et al (2009) Control of Stem Cell Fate by Physical Interactions with the Extracellular Matrix. Cell Stem Cell 5:17–26 . doi: 10.1016/j.stem.2009.06.016
Guo D, Li J, Xie G, et al (2014) Elastic properties of polystyrene nanospheres evaluated with atomic force microscopy: Size effect and error analysis. Langmuir 30:7206–7212 . doi: 10.1021/la501485e
Hari PR, Chandy T, Sharma CP (1996) Chitosan/calcium—alginate beads for oral delivery of insulin. J Appl Polym Sci 59:1795–1801 . doi: 10.1002/(SICI)1097-4628(19960314)59:11<1795::AID-APP16>3.3.CO;2-F
Hartman RP a., Brunner DJ, Camelot DM a., et al (2000) Jet Break-Up in Electrohydrodynamic Atomization in the Cone-Jet Mode. J Aerosol Sci 31:65–95 . doi: 10.1016/S0021-8502(99)00034-8
Helfricht N, Doblhofer E, Bieber V, et al (2017) Probing the adhesion properties of alginate hydrogels: a new approach towards the preparation of soft colloidal probes for direct force measurements. Soft Matter 13:578–589 . doi: 10.1039/C6SM02326F
Heng PWS, Chan LW, Wong TW (2003) Formation of alginate microspheres produced using emulsification technique. J Microencapsul 20:401–13 . doi: 10.1080/0265204031000093069
Hertz (1882) Über die Berührung fester elastischer Körper.
Hewitt CJ, Lee K, Nienow AW, et al (2011) Expansion of human mesenchymal stem cells on microcarriers. Biotechnol Lett 33:2325–35 . doi: 10.1007/s10529-011-0695-4
Hoare TR, Kohane DS (2008) Hydrogels in drug delivery: Progress and challenges. Polymer (Guildf) 49:1993–2007 . doi: 10.1016/j.polymer.2008.01.027
Hoesli C a, Raghuram K, Kiang RLJ, et al (2011) Pancreatic cell immobilization in alginate beads produced by emulsion and internal gelation. Biotechnol Bioeng 108:424–34 . doi: 10.1002/bit.22959
Hoffman AS (2012) Hydrogels for biomedical applications. Adv Drug Deliv Rev 43:3–12 . doi: 10.1016/j.addr.2012.09.010
Holme HK, Davidsen L, Kristiansen A, Smidsrød O (2008) Kinetics and mechanisms of depolymerization of alginate and chitosan in aqueous solution. Carbohydr Polym 73:656–664 . doi: 10.1016/j.carbpol.2008.01.007
199
Horwitz EM, Gordon PL, Koo WKK, et al (2002) Isolated allogeneic bone marrow-derived mesenchymal cells engraft and stimulate growth in children with osteogenesis imperfecta: Implications for cell therapy of bone. Proc Natl Acad Sci U S A 99:8932–7 . doi: 10.1073/pnas.132252399
Hu W, Wang DIC (1986) Selection of Microcarrier Diameter for the Cultivation of Mammalian Cells on Microcarriers. doi: 10.1002/bit.260300412
Huguet ML, Neufeld RJ, Dellacherie E (1996) Calcium-alginate beads coated with polycationic polymers: Comparison of chitosan and DEAE-dextran. Process Biochem 31:347–353 . doi: 10.1016/0032-9592(95)00076-3
Husain O, Lau W, Edirisinghe M, Parhizkar M (2016) Investigating the particle to fibre transition threshold during electrohydrodynamic atomization of a polymer solution. Mater Sci Eng C 65:240–250 . doi: 10.1016/j.msec.2016.03.076
Ikebe C, Suzuki K (2014) Mesenchymal Stem Cells for Regenerative Therapy: Optimization of Cell Preparation Protocols. Biomed Res Int 2014:1–11 . doi: 10.1155/2014/951512
Il’ina a. V., Varlamov VP (2004) Hydrolysis of chitosan in lactic acid. Appl Biochem Microbiol 40:300–303 . doi: 10.1023/B:ABIM.0000025956.98250.30
ImageJ (2018) Analyze Menu. https://imagej.nih.gov/ij/docs/menus/analyze.html. Accessed 25 Dec 2018
Jaworek A, Krupa A (1998) Main modes of electrohydrodynamic spraying of liquids. In: Third International Conference on Multiphase Flow. Lyon, France
Johnson KL (1985) Normal Contact of Elastic Solids: Hertz Theory. Cambridge Univ Press 84–106 . doi: http://dx.doi.org/10.1017/CBO9781139171731
Jorge SD (2014) Expansion of multipotent mesenchymal stromal cells on gelatin coated alginate microcarriers. Tecnico Lisboa
Jossen V, Pörtner R, Kaiser SC, et al (2014) Mass Production of Mesenchymal Stem Cells — Impact of Bioreactor Design and Flow Conditions on Proliferation and Differentiation. In: Cells and Biomaterials in Regenerative Medicine. InTech
Jung S, Panchalingam KM, Rosenberg L, Behie L a (2012) Ex vivo expansion of human mesenchymal stem cells in defined serum-free media. Stem Cells Int 2012:123030 . doi: 10.1155/2012/123030
Kasaai MR, Arul J, Charlet G (2013) Fragmentation of chitosan by acids. Sci World J 2013: . doi: 10.1155/2013/508540
Kern S, Eichler H, Stoeve J, et al (2006) Comparative Analysis of Mesenchymal Stem Cells from Bone Marrow, Umbilical Cord Blood, or Adipose Tissue. Stem Cells 24:1294–1301 . doi: 10.1634/stemcells.2005-0342
200
Keyser K a., Beagles KE, Kiem HP (2007) Comparison of mesenchymal stem cells from different tissues to suppress T-cell activation. Cell Transplant 16:555–562 . doi: 10.3727/000000007783464939
Khan A, Rayner G (2003) Robustness to Non-Normality of Common Tests for the Many-Sample Location Problem. J Appl Math Decis Sci 7:187–206
Kharaziha P, Hellstrom PM, Noorinayer B, et al (2009) Improvement of liver function in liver cirrhosis patients after autologous mesenchymal stem cell injection: A phase I-II clinical trial. Eur J Gastroenterol Hepatol 21:1199–1205 . doi: 10.1097/MEG.0b013e32832a1f6c
Kim H, Ogata A, Kim J (2009) High Speed Camera Observation of Electrospray. In: Electrostatics Joint Conference
Kim N, Cho S-G (2013) Clinical applications of mesenchymal stem cells. Korean J Intern Med 28:387–402 . doi: 10.3904/kjim.2013.28.4.387
Kleinberger RM, Burke N a D, Dalnoki-Veress K, Stöver HDH (2013) Systematic study of alginate-based microcapsules by micropipette aspiration and confocal fluorescence microscopy. Mater Sci Eng C 33:4295–4304 . doi: 10.1016/j.msec.2013.06.033
Klingemann H, Matzilevich D, Marchand J (2008) Mesenchymal stem cells - Sources and clinical applications. Transfus Med Hemotherapy 35:272–277 . doi: 10.1159/000142333
Klokk TI, Melvik JE (2002) Controlling the size of alginate gel beads by use of a high electrostatic potential. J Microencapsul 19:415–24 . doi: 10.1080/02652040210144234
Kong D, Cardak S, Chen M, et al (1999) High cell density and productivity culture of Chinese hamster ovary cells in a fluidized bed bioreactor. 215–220 . doi: 10.1023/A:1008064217040
Koo HJ, Song YS, Kim HJ, et al (2004) Antiinflammatory effects of genipin, an active principle of gardenia. Eur J Pharmacol 495:201–208 . doi: 10.1016/j.ejphar.2004.05.031
Krishnamoorthy G, Madhan B, Sadulla S, et al (2008) Stabilization of collagen by the plant polyphenolics Acacia mollissima and Terminalia chebula. J Appl Polym Sci 108:199–205 . doi: 10.1002/app.27430
Krokida MK, Karathanos VT (1998) Effect of Freeze-drying Conditions on Shrinkage and Porosity of Dehydrated Agricultural Products. J Food Eng 35:369–380 . doi: 10.1177/0734282906298643
Ku BK, Kim SS (2002) Electrospray characteristics of highly viscous liquids. J Aerosol Sci 33:1361–1378 . doi: 10.1016/S0021-8502(02)00075-7
Kushida A, Yamato M, Konno C, et al (1999) Decrease in culture temperature releases monolayer endothelial cell sheets together with deposited fibronectin matrix from temperature-responsive culture surfaces. J Biomed Mater Res 45:355–362 . doi: 10.1002/(SICI)1097-4636(19990615)45:4<355::AID-JBM10>3.0.CO;2-7
201
Labconco (2010) A Guide to Freeze Drying for the Laboratory. doi: 10.1017/CBO9781107415324.004
Lai J-Y, Li Y-T, Wang T-P (2010) In vitro response of retinal pigment epithelial cells exposed to chitosan materials prepared with different cross-linkers. Int J Mol Sci 11:5256–5272 . doi: 10.3390/ijms11125256
Lamprecht a., Schäfer UF, Lehr CM (2000) Characterization of microcapsules by confocal laser scanning microscopy: Structure, capsule wall composition and encapsulation rate. Eur J Pharm Biopharm 49:1–9 . doi: 10.1016/S0939-6411(99)00063-6
Lau TT, Wang C, Png SW, et al (2011) Genipin-crosslinked microcarriers mediating hepatocellular aggregates formation and functionalities. J Biomed Mater Res - Part A 96 A:204–211 . doi: 10.1002/jbm.a.32975
Lechanteur C (2014) Large-Scale Clinical Expansion of Mesenchymal Stem Cells in the GMP-Compliant, Closed Automated Quantum® Cell Expansion System: Comparison with Expansion in Traditional T-Flasks. J Stem Cell Res Ther 04:1–11 . doi: 10.4172/2157-7633.1000222
Lee CSD, Moyer HR, Gittens I. R a., et al (2010) Regulating in vivo calcification of alginate microbeads. Biomaterials 31:4926–4934 . doi: 10.1016/j.biomaterials.2010.03.001
Lee KY, Mooney DJ (2012) Alginate: properties and biomedical applications. Prog Polym Sci 37:106–126 . doi: 10.1016/j.progpolymsci.2011.06.003
Lee KY, Yuk SH (2007) Polymeric protein delivery systems. Prog Polym Sci 32:669–697 . doi: 10.1016/j.progpolymsci.2007.04.001
Lee RH, Seo MJ, Reger RL, et al (2006) Multipotent stromal cells from human marrow home to and promote repair of pancreatic islets and renal glomeruli in diabetic NOD/scid mice. Proc Natl Acad Sci 103:17438–17443 . doi: 10.1073/pnas.0608249103
Lekka M, Sainz-Serp D, Kulik AJ, Wandrey C (2004) Hydrogel Microspheres: Influence of Chemical Composition on Surface Morphology, Local Elastic Properties, and Bulk Mechanical Characteristics. Langmuir 20:9968–9977 . doi: 10.1021/la048389h
Li B, Wang X, Wang Y, et al (2015a) Past, present, and future of microcarrier-based tissue engineering. J Orthop Transl 3:51–57 . doi: 10.1016/j.jot.2015.02.003
Li C, Zhao S, Zhao Y, et al (2014) Chemically crosslinked alginate porous microcarriers modified with bioactive molecule for expansion of human hepatocellular carcinoma cells. J Biomed Mater Res B Appl Biomater 102:1648–58 . doi: 10.1002/jbm.b.33150
Li L, Guo Y, Zhao L, et al (2015b) Enzymatic hydrolysis and simultaneous extraction for preparation of genipin from bark of eucommia ulmoides after ultrasound, microwave pretreatment. Molecules 20:18717–18731 . doi: 10.3390/molecules201018717
Li X, Yang Q, Bai J, et al (2015c) Identification of appropriate reference genes for human mesenchymal stem cell analysis by quantitative real-time PCR. Biotechnol Lett 37:67–73 . doi: 10.1007/s10529-014-1652-9

202
Li Z, Tian X, Yuan Y a N, et al (2013) Effect of cell culture using chitosan membranes on stemness marker genes in mesenchymal stem cells. 1945–1949 . doi: 10.3892/mmr.2013.1423
Lim F, Sun a. (1980) Microencapsulated islets as bioartificial endocrine pancreas. Science (80- ) 210:908–910 . doi: 10.1126/science.6776628
Liu G, Hu Z, Guan R, et al (2016) Efficient removal of methylene blue in aqueous solution by freeze-dried calcium alginate beads. Korean J Chem Eng 33:3141–3148 . doi: 10.1007/s11814-016-0177-4
Liu N, Zang R, Yang S-T, Li Y (2014) Stem cell engineering in bioreactors for large-scale bioprocessing. Eng Life Sci 14:4–15 . doi: 10.1002/elsc.201300013
Livak KJ, Schmittgen TD (2001) Analysis of Relative Gene Expression Data Using Real-Time Quantitative PCR and the 2−ΔΔCT Method. Methods 25:402–408 . doi: https://doi.org/10.1006/meth.2001.1262
Lo CM, Wang HB, Dembo M, Wang YL (2000) Cell movement is guided by the rigidity of the substrate. Biophys J 79:144–152 . doi: 10.1016/S0006-3495(00)76279-5
Lund AW, Bush JA, Plopper GE, Stegemann JP (2009) NIH Public Access. 87:213–221 . doi: 10.1002/jbm.b.31098.Osteogenic
Ma B, Wang X, Wu C, Chang J (2014) Crosslinking strategies for preparation of extracellular matrix-derived cardiovascular scaffolds. Regen Biomater 1:81–89 . doi: 10.1093/rb/rbu009
Ma H, Hung S, Lin S, et al (2002) Chondrogenesis of human mesenchymal stem cells encapsulated in alginate beads. doi: 10.1002/jbm.a.10370
Madihally S V., Matthew HWT (1999) Porous chitosan scaffolds for tissue engineering. Biomaterials 20:1133–1142 . doi: 10.1016/S0142-9612(99)00011-3
Maeng Y-J, Choi S-W, Kim HO, Kim J-H (2009) Culture of human mesenchymal stem cells using electrosprayed porous chitosan microbeads. J Biomed Mater Res Part A 9999A:NA–NA . doi: 10.1002/jbm.a.32417
Mane VP, Heuer MA, Hillyer P, et al (2008) Systematic Method for Determining an Ideal Housekeeping Gene for Real-Time PCR Analysis. J Biomol Tech 19342–347 342–347
Manickam B, Sreedharan R, Elumalai M (2014) “Genipin” – The Natural Water Soluble Cross-linking Agent and Its Importance in the Modified Drug Delivery Systems: An Overview. Curr Drug Deliv 11:139–145 . doi: 10.2174/15672018113106660059
Manojlovic V, Djonlagic J, Obradovic B, et al (2006) Immobilization of cells by electrostatic droplet generation: a model system for potential application in medicine. Int J Nanomedicine 1:163–171 . doi: 10.2147/nano.2006.1.2.163
203
Mao S, Shuai X, Unger F, et al (2004) The depolymerization of chitosan: Effects on physicochemical and biological properties. Int J Pharm 281:45–54 . doi: 10.1016/j.ijpharm.2004.05.019
Markert CD, Guo X, Skardal A, et al (2013) Characterizing the micro-scale elastic modulus of hydrogels for use in regenerative medicine. J Mech Behav Biomed Mater 27:115–127 . doi: 10.1016/j.jmbbm.2013.07.008
Markvicheva E, Grandfils C (2004) Microcarriers for Animal Cell Culture. In: Fundamentals of Cell Immobilisation Biotechnology. pp 141–161
Martin GR (1981) Isolation of a pluripotent cell line from early mouse embryos cultured in medium conditioned by teratocarcinoma stem cells. Proc Natl Acad Sci 78:7634–7638 . doi: 10.1073/pnas.78.12.7634
Martinsen A, Skjak-Braek G, Smidsrød O (1989) Alginate as Immobilization Material: I. Correlation between Chemical and Physical Properties of Alginate Gel Beads. Biotechnol Bioeng 33:79–89 . doi: 10.1002/bit.260330111
Martinsen A, Storro I, Skjak-Braek G (1992) Alginate as immobilization material: III. Diffusional properties. Biotechnol Bioeng 39:186–194 . doi: 10.1002/bit.260390210
McDonald J (2014) HANDBOOK OF BIOLOLOGICAL STATISTICS, 3rd editio. Sparky House Publishing
Medvedev SP, Shevchenko AI, Zakian SM (2010) Induced Pluripotent Stem Cells: Problems and Advantages when Applying them in Regenerative Medicine. Acta Naturae 2:18–28
Meng F, Jiang Y, Sun Z, et al (2009) Electrohydrodynamic Liquid Atomization of Biodegradable Polymer Microparticles: Effect of Electrohydrodynamic Liquid Atomization Variables on Microparticles. J Appl Polym Sci 113:526–534 . doi: 10.1002/app.30107
Merten O-W (2015) Advances in cell culture: anchorage dependence. Philos Trans R Soc Lond B Biol Sci 370:20140040 . doi: 10.1098/rstb.2014.0040
Moghadam H, Samimi M, Samimi A, Khorram M (2013) Electrospray Modeling of Highly Viscous and Non-Newtonian Liquids. Polym Polym Compos 21:449–456 . doi: 10.1002/app
Moghadam H, Samimi M, Samimi A, Khorram M (2008) Electro-spray of high viscous liquids for producing mono-sized spherical alginate beads. Particuology 6:271–275 . doi: 10.1016/j.partic.2008.04.005
Moghaddam MK, Mortazavi SM, Khayamian T (2015) Preparation of calcium alginate microcapsules containing n-nonadecane by a melt coaxial electrospray method. J Electrostat 73:56–64 . doi: 10.1016/j.elstat.2014.10.013
Mohammed M a., Syeda JTM, Wasan KM, Wasan EK (2017) An overview of chitosan nanoparticles and its application in non-parenteral drug delivery. Pharmaceutics 9: . doi: 10.3390/pharmaceutics9040053
204
Monshipouri M, Price RR (1995) Emulsification preparation of calcium alginate beads in the presence of sequesterant. J Microencapsul 12:255–262 . doi: 10.3109/02652049509010294
Mørch ÄA, Donati I, Strand BL, Skja G (2006) Effect of Ca2 + , Ba2 + , and Sr2 + on Alginate Microbeads. 7:1471–1480 . doi: 10.1021/bm060010d
Murphy WL, McDevitt TC, Engler AJ (2014) Materials as stem cell regulators. Nat Mater 13:547–557 . doi: 10.1038/nmat3937
Muzzarelli R a. a. (2009) Genipin-crosslinked chitosan hydrogels as biomedical and pharmaceutical aids. Carbohydr Polym 77:1–9 . doi: 10.1016/j.carbpol.2009.01.016
Nienow AW, Rafiq Q a., Coopman K, Hewitt CJ (2014) A potentially scalable method for the harvesting of hMSCs from microcarriers. Biochem Eng J 85:79–88 . doi: 10.1016/j.bej.2014.02.005
Nikon M (2018) Introductory Confocal Concepts. https://www.microscopyu.com/techniques/confocal/introductory-confocal-concepts. Accessed 4 May 2018
Nilsson K (1988) Microcarrier cell culture. Biotechnol Genet Eng Rev 6:403–439 . doi: 10.1080/02648725.1988.10647854
Nilsson K (1989) Microcarrier Cell Culture. Biotechnol Genet Eng Rev 6:
No HK, Nah JW, Meyers SP (2003) Effect of time/temperature treatment parameters on depolymerization of chitosan. J Appl Polym Sci 87:1890–1894 . doi: 10.1002/app.11628
Nunamaker EA, Purcell EK, Kipke DR (2007) In vivo stability and biocompatibility of implanted calcium alginate disks. J Biomed Mater Res A 81:771–780 . doi: 10.1002/jbm.a
Oikonomopoulou VP, Krokida MK, Karathanos VT (2011) The influence of freeze drying conditions on microstructural changes of food products. Procedia Food Sci 1:647–654 . doi: 10.1016/j.profoo.2011.09.097
Ortiz L a., Gambelli F, McBride C, et al (2003) Mesenchymal stem cell engraftment in lung is enhanced in response to bleomycin exposure and ameliorates its fibrotic effects. Proc Natl Acad Sci 100:8407–8411 . doi: 10.1073/pnas.1432929100
Paik YS, Lee CM, Cho MH, Hahn TR (2001) Physical stability of the blue pigments formed from geniposide of gardenia fruits: Effects of ph, temperature, and light. J Agric Food Chem 49:430–432 . doi: 10.1021/jf000978f
Pall (2015) Expansion and Characterization of Mesenchymal Stem Cells on Pall SoloHill® Microcarriers. Appl Note 2976:
Pall (2016) Pall SoloHill® Small-Scale Microcarrier Culture
205
Pandit V, Zuidema JM, Venuto KN, et al (2013) Evaluation of Multifunctional Polysaccharide Hydrogels with Varying Stiffness for Bone Tissue Engineering. Tissue Eng Part A 19:2452–2463 . doi: 10.1089/ten.tea.2012.0644
Park H, Kim P-H, Hwang T, et al (2012) Fabrication of cross-linked alginate beads using electrospraying for adenovirus delivery. Int J Pharm 427:417–25 . doi: 10.1016/j.ijpharm.2012.01.050
Pasparakis G, Bouropoulos N (2006) Swelling studies and in vitro release of verapamil from calcium alginate and calcium alginate–chitosan beads. Int J Pharm 323:34–42 . doi: 10.1016/j.ijpharm.2006.05.054
Patel N, Lalwani D, Gollmer S, et al (2016) Development and evaluation of a calcium alginate based oral ceftriaxone sodium formulation. Prog Biomater 5:117–133 . doi: 10.1007/s40204-016-0051-9
Paul A, Chen G, Khan A, et al (2012) Genipin-Crosslinked Microencapsulated Human Adipose Stem Cells Augment Transplant Retention Resulting in Attenuation of Chronically Infarcted Rat Heart Fibrosis and Cardiac Dysfunction. Cell Transplant 21:2735–2751 . doi: 10.3727/096368912X637497
Penfornis P, Pochampally R (2011a) Isolation and Expansion of Mesenchymal Stem Cells/Multipotential Stromal Cells from Human Bone Marrow. In: Mesenchymal Stem Cell Assays and Applications Methods in Molecular Biology. pp 11–21
Penfornis P, Pochampally R (2011b) Isolation and Expansion of Mesenchymal Stem Cells/Multipotential Stromal Cells from Human Bone marrow. 698:11–21 . doi: 10.1007/978-1-60761-999-4
Pera MF, Reubinoff B, Trounson a (2000) Human embryonic stem cells. J Cell Sci 113:5–10 . doi: 10.1002/(sici)1097-0215(19960611)66:6<806::aid-ijc17>3.0.co
Pettersson S, Wetterö J, Tengvall P, Kratz G Human articular chondrocytes on macroporous gelatin microcarriers form structurally stable constructs with blood‐derived biological glues in vitro. J Tissue Eng Regen Med 3:450–460 . doi: 10.1002/term.179
Pittenger MF, Martin BJ (2004) Mesenchymal stem cells and their potential as cardiac therapeutics. Circ Res 95:9–20 . doi: 10.1161/01.RES.0000135902.99383.6f
Prasad VK, Lucas KG, Kleiner GI, et al (2011) Efficacy and Safety of Ex Vivo Cultured Adult Human Mesenchymal Stem Cells (ProchymalTM) in Pediatric Patients with Severe Refractory Acute Graft-Versus-Host Disease in a Compassionate Use Study. Biol Blood Marrow Transplant 17:534–541 . doi: 10.1016/j.bbmt.2010.04.014
Purcell EK, Singh A, Kipke DR (2009) Alginate composition effects on a neural stem cell-seeded scaffold. Tissue Eng Part C Methods 15:541–50 . doi: 10.1089/ten.tec.2008.0302
Rafiq Q a., Coopman K, Nienow AW, Hewitt CJ (2016) Systematic microcarrier screening and agitated culture conditions improves human mesenchymal stem cell yield in bioreactors. Biotechnol J 11:473–486 . doi: 10.1002/biot.201400862
206
Rahul T, Yang P (2014) Mesenchymal Stem Cell Therapy for Cardiac Repair. Curr Treat Options Cardiovasc Med 16: . doi: 10.1038/jid.2014.371
Ramakrishna S, Fujihara K, Teo W., et al (2005) An Introduction To Electrospinning And Nanofibers
Rambhatla S, Obert JP, Luthra S, et al (2005) Cake shrinkage during freeze drying: A combined experimental and theoretical study. Pharm Dev Technol 10:33–40 . doi: 10.1081/PDT-200035871
Ranstam J (2012) Repeated measurements, bilateral observations and pseudoreplicates, why does it matter? Osteoarthr Cartil 20:473–475 . doi: 10.1016/j.joca.2012.02.011
Rasmusson I (2006) Immune modulation by mesenchymal stem cells. Exp Cell Res 312:2169–2179 . doi: 10.1016/j.yexcr.2006.03.019
Rayleigh, Lord (1882) On the equilibrium of liquid conducting masses charged with electricity. Philos Mag Ser 5 14:184–186 . doi: 10.1080/14786448208628425
Rehfeldt F, Engler AJ, Eckhardt A, et al (2007) Cell responses to the mechanochemical microenvironment-Implications for regenerative medicine and drug delivery. Adv Drug Deliv Rev 59:1329–1339 . doi: 10.1016/j.addr.2007.08.007
Reiter M, Hohenwarter O, Gaida T, et al (1990) T h e use o f macroporous gelatin carriers for the cultivation of m a m m a - lian cells in fluidised bed reactors. Cytotechnology 3:271–277
Ribeiro AJ, Neufeld RJ, Arnaud P, Chaumeil JC (1999) Microencapsulation of lipophilic drugs in chitosan-coated alginate microspheres. Int J Pharm 187:115–123 . doi: 10.1016/S0378-5173(99)00173-8
Rinaudo M (2008) Main properties and current applications of some polysaccharides as biomaterials. Polym Int 57:397–430
Rinaudo M (2006) Chitin and chitosan: Properties and applications. Prog Polym Sci 31:603–632 . doi: 10.1016/j.progpolymsci.2006.06.001
Ringdén O, Uzunel M, Rasmusson I, et al (2006) Mesenchymal stem cells for treatment of therapy-resistant graft-versus-host disease. Transplantation 81:1390–1397 . doi: 10.1097/01.tp.0000214462.63943.14
Roddy GW, Oh JY, Lee RH, et al (2011) Action at a distance: Systemically administered adult stem/progenitor cells (MSCs) reduce inflammatory damage to the cornea without engraftment and primarily by secretion of TNF-α stimulated gene/protein 6. Stem Cells 29:1572–1579 . doi: 10.1002/stem.708
Rowley J a, Madlambayan G, Mooney DJ (1999) Alginate hydrogels as synthetic extracellular matrix materials. Biomaterials 20:45–53
Saha K, Keung AJ, Irwin EF, et al (2008) Substrate modulus directs neural stem cell behavior. Biophys J 95:4426–4438 . doi: 10.1529/biophysj.108.132217
207
Santos F Dos, Andrade PZ, Abecasis MM, et al (2011) Toward a clinical-grade expansion of mesenchymal stem cells from human sources: a microcarrier-based culture system under xeno-free conditions. Tissue Eng Part C Methods 17:1201–10 . doi: 10.1089/ten.tec.2011.0255
Schop D, Borgart E, Janssen FW, Rozemuller H (2009) Expansion of human mesenchymal stromal cells on microcarriers : growth and metabolism. J tTssue Eng Regen Med 4:131–140 . doi: 10.1002/term
Schop D, F. W. Janssen EB, Bruijn JD d., Dijkhuizen-Radersma R van (2008) Expansion of mesenchymal stem cells using a microcarrier-based cultivation system: growth andmetabolism. J Tissue Eng Regen Med 4:524–531 . doi: 10.1002/term
Selimoglu SM, Elibol M (2010) Alginate as an immobilization material for MAb production via encapsulated hybridoma cells. Crit Rev Biotechnol 30:145–59 . doi: 10.3109/07388550903451652
Serra M, Correia C, Malpique R, et al (2011) Microencapsulation Technology: A Powerful Tool for Integrating Expansion and Cryopreservation of Human Embryonic Stem Cells. PLoS One 6:e23212 . doi: 10.1371/journal.pone.0023212
Sharma RR, Pollock K, Hubel A, McKenna D (2014) Mesenchymal stem or stromal cells: a review of clinical applications and manufacturing practices. Transfusion 54:1418–37 . doi: 10.1111/trf.12421
Sideridou I, Tserki V, Papanastasiou G (2003) Study of water sorption, solubility and modulus of elasticity of light-cured dimethacrylate-based dental resins. Biomaterials 24:655–665 . doi: 10.1016/S0142-9612(02)00380-0
Sigma Product Information: Glass microcarrier beads
Sigma-Aldrich Product Information: Dulbecco ’ s Modified Eagle ’ s Medium ( DME )
Sigma-Aldrich (2018) Media Formulations. https://www.sigmaaldrich.com/life-science/cell-culture/learning-center/media-formulations.html. Accessed 26 Dec 2018
Sigma-Aldrich Cell Counting Kit - 8. Prod Inf
SigmaXL (2018) Minimum Sample Size for Robust t-Tests and ANOVA. https://sigmaxl.com/MinSampleSizeRobust.shtml. Accessed 1 Jan 2019
Simpson NE, Stabler CL, Simpson CP, et al (2004) The role of the CaCl2–guluronic acid interaction on alginate encapsulated bTC3 cells. Biomaterials 25:2603–2610 . doi: 10.1016/j.biomaterials.2003.09.046
Smidsrød O, Skjak-Braek G (1990) Alginate as immobilization matrix for cells. 8: . doi: 10.1016/0167-7799(90)90139-O
Strand BL, Gåserød O, Kulseng B, et al (2002) Alginate-polylysine-alginate microcapsules: effect of size reduction on capsule properties. J Microencapsul 19:615–30 . doi: 10.1080/02652040210144243
208
Suksamran T, Opanasopit P, Rojanarata T, et al (2009) Biodegradable alginate microparticles developed by electrohydrodynamic spraying techniques for oral delivery of protein. J Microencapsul 26:563–70 . doi: 10.3109/02652040802500622
Sullivan LM, Weinberg J, Keaney JF (2016) Common statistical pitfalls in basic science research. J Am Heart Assoc 5:1–9 . doi: 10.1161/JAHA.116.004142
Sun J, Tan H (2013) Alginate-Based Biomaterials for Regenerative Medicine Applications. Materials (Basel) 6:1285–1309 . doi: 10.3390/ma6041285
Sung HW, Huang RN, Huang LH, Tsai CC (1999) In vitro evaluation of cytotoxicity of a naturally occurring cross-linking reagent for biological tissue fixation. J Biomater Sci Polym Ed 10:63–78 . doi: 10.1163/156856299X00289
Szczypka M, Splan D, Woolls H, Brandwein H (2014) Single-use bioreactors and microcarriers. Bioprocess Int 12:54–64
Szymańska E, Winnicka K (2015) Stability of chitosan-a challenge for pharmaceutical and biomedical applications. Mar Drugs 13:1819–46 . doi: 10.3390/md13041819
Takahashi K, Tanabe K, Ohnuki M, et al (2007) Induction of Pluripotent Stem Cells from Adult Human Fibroblasts by Defined Factors. Cell 131:861–872 . doi: 10.1016/j.cell.2007.11.019
Tay LX, Ahmad RE, Dashtdar H, et al (2012) Treatment outcomes of alginate-embedded allogenic mesenchymal stem cells versus autologous chondrocytes for the repair of focal articular cartilage defects in a rabbit model. Am J Sports Med 40:83–90 . doi: 10.1177/0363546511420819
Taylor G (1964) Disintegration of water drops in an electric field
Thonar EJM a, Buckwalter J a., Kuettner KE (1986) Maturation-related differences in the structure and composition of proteoglycans synthesized by chondrocytes from bovine articular cartilage. J Biol Chem 261:2467–2474
Thumsing S (2013) Encapsulation of biological molecule in chitosan-coated alginate microspheres by electrospraying. In: Pure and Applied Chemistry International Conference. pp 574–579
Tominaga H, Ishiyama M, Ohseto F, et al (1999) A water-soluble tetrazolium salt useful for colorimetric cell viability assay. Anal Commun 36:47–50 . doi: 10.1039/a809656b
Tomkoria S, Masuda K, Mao J (2007) Nanomechanical properties of alginate-recovered chondrocyte matrices for cartilage regeneration. Proc Inst Mech Eng Part H J Eng Med 221:467–473 . doi: 10.1243/09544119JEIM205
Tønnesen HH, Karlsen J (2002) Alginate in drug delivery systems. Drug Dev Ind Pharm 28:621–630 . doi: 10.1081/DDC-120003853
Van Wezel AL (1967) Growth of Cell-strains and Primary Cells on Micro-Carriers in Homogeneuous Culture. Nature 216:64–65
209
Varani J, Dame M, Beals TEDF (1983) Growth of Three Established Cell Lines on Glass Microcarriers. XXV:1359–1372
Varum KM, Ottoy MH, Smidsrod O (2001) Acid hydrolysis of chitosans. Carbohydr Polym 46:89–98 . doi: 10.1016/S0144-8617(00)00288-5
Vecchiatini R, Penolazzi L, Lambertini E, et al (2014) Effect of dynamic three-dimensional culture on osteogenic potential of human periodontal ligament-derived mesenchymal stem cells entrapped in alginate microbeads. J Periodontal Res. doi: 10.1111/jre.12225
Veleirinho B, Berti F V., Dias PF, et al (2013) Manipulation of chemical composition and architecture of non-biodegradable poly(ethylene terephthalate)/chitosan fibrous scaffolds and their effects on L929 cell behavior. Mater Sci Eng C 33:37–46 . doi: 10.1016/j.msec.2012.07.047
Vemuri MC, Chase LG, Rao MS (2011) Mesenchymal stem cell assays and applications.
Walpole SC, Prieto-Merino D, Edwards P, et al (2012) The weight of nations: An estimation of adult human biomass. BMC Public Health 12:1 . doi: 10.1186/1471-2458-12-439
Wang CX, Cowen C, Zhang Z, Thomas CR (2005) High-speed compression of single alginate microspheres. Chem Eng Sci 60:6649–6657 . doi: 10.1016/j.ces.2005.05.052
Wang S, Qu X, Zhao RC (2012) Clinical applications of mesenchymal stem cells. J Hematol Oncol 5:19 . doi: 10.1186/1756-8722-5-19
Wang Y, Bao J, Wu X, et al (2016) Genipin crosslinking reduced the immunogenicity of xenogeneic decellularized porcine whole-liver matrices through regulation of immune cell proliferation. Sci Rep 6:1–16 . doi: 10.1038/srep24779
Watanabe H, Matsuyama T, Yamamoto H (2001) Preparation of immobilized enzyme gel particles using an electrostatic atomization technique. Biochem Eng J 8:171–174 . doi: 10.1016/S1369-703X(01)00121-8
Weber C, Pohl S, Poertner R, et al (2010) Production process for stem cell based therapeutic implants: expansion of the production cell line and cultivation of encapsulated cells. Adv Biochem Eng Biotechnol 123:143–62 . doi: 10.1007/10_2009_25
Weber C, Pohl S, Pörtner R, et al (2007a) Expansion and Harvesting of hMSC-TERT. 38–46 . doi: 10.2174/1874120700701010038
Weber C, Pohl S, Pörtner R, et al (2007b) Cultivation and Differentiation of Encapsulated hMSC-TERT in a Dispos- able Small-Scale Syringe-Like Fixed Bed Reactor. 64–70 . doi: 10.2174/1874120700701010064
Wedmore I, McManus JG, Pusateri AE, Holcomb JB (2006) A special report on the chitosan-based hemostatic dressing: experience in current combat operations. J Trauma 60:655–658 . doi: 10.1097/01.ta.0000199392.91772.44
Wei X, Yang X, Han Z, et al (2013) Mesenchymal stem cells: a new trend for cell therapy. Acta Pharmacol Sin 34:747–54 . doi: 10.1038/aps.2013.50

210
Williams GM, Klein TJ, Sah RL (2005) Cell density alters matrix accumulation in two distinct fractions and the mechanical integrity of alginate-chondrocyte constructs. Acta Biomater 1:625–33 . doi: 10.1016/j.actbio.2005.07.009
Wolfe M, Pochampally R, Swaney W, Reger R (2008) Isolation and culture of bone marrow-derived human multipotent stromal cells (hMSCs). Methods Mol Bio. doi: 10.1007/978-1-60327-169-1_1
Wu T, Zivanovic S, Draughon FA, Sams CE (2004) Chitin and chitosan-value-added products from mushroom waste. J Agric Food Chem 52:7905–7910 . doi: 10.1021/jf0492565
Xie J, Wang C-H (2007) Electrospray in the dripping mode for cell microencapsulation. J Colloid Interface Sci 312:247–55 . doi: 10.1016/j.jcis.2007.04.023
Yalpani M, Hall LD (1984) Some Chemical and Analytical Aspects Of Polysaccharide Modifications.1 3. Formation of Branched-Chain, Soluble Chitosan Derivatives2. Macromolecules 17:272–281 . doi: 10.1021/ma00133a003
Yamamoto M, Miura N, Ohtake N, et al (2000) Genipin, a metabolite derived from the herbal medicine Inchin-ko-to, and suppression of Fas-induced lethal liver apoptosis in mice. Gastroenterology 118:380–389 . doi: 10.1016/S0016-5085(00)70220-4
Yamashiki M, Mase A, Arai I, et al (2000) Effects of the Japanese herbal medicine “Inchinko-to” (TJ-135) on concanavalin A-induced hepatitis in mice. Clin Sci London Engl 1979 99:421–431 . doi: 10.1042/CS20000031
Yamato M, Okuhara M, Karikusa F, et al (1998) Signal transduction and cytoskeletal reorganization are required for cell detachment from cell culture surfaces grafted with a temperature- responsive polymer. J Biomed Mater Res 44:44–52 . doi: 10.1002/(SICI)1097-4636(199901)44:1<44::AID-JBM5>3.0.CO;2-X
Yang D, Zhou M, Wei W, et al (2012) Preparation of a genipin blue from egg protein and genipin. Nat Prod Res 26:765–769 . doi: 10.1080/14786419.2010.547859
Yang MC, Wang SS, Chou NK, et al (2009) The cardiomyogenic differentiation of rat mesenchymal stem cells on silk fibroin-polysaccharide cardiac patches in vitro. Biomaterials 30:3757–3765 . doi: 10.1016/j.biomaterials.2009.03.057
Yang X, Guo L, Fan Y, Zhang X (2013) Preparation and characterization of macromolecule cross-linked collagen hydrogels for chondrocyte delivery. Int J Biol Macromol 61:487–493 . doi: 10.1016/j.ijbiomac.2013.07.021
Yeatts AB, Fisher JP (2011) Tubular perfusion system for the long-term dynamic culture of human mesenchymal stem cells. Tissue Eng Part C Methods 17:337–48 . doi: 10.1089/ten.TEC.2010.0172
Yoo JS, Kim YJ, Kim SH, Choi SH (2011) Study on genipin: A new alternative natural crosslinking agent for fixing heterograft tissue. Korean J Thorac Cardiovasc Surg 44:197–207 . doi: 10.5090/kjtcs.2011.44.3.197
211
Yuan P, Jia Y, Zhang L, et al (2012) Swelling studies and in vitro release of acemetacin and BSA from alginate gel beads crosslinked with Ca2+ or Ba2+. J Wuhan Univ Technol Sci Ed 27:669–674 . doi: 10.1007/s11595-012-0526-z
Zeleny J (1917) Instability of electrified liquid surfaces. Phys Rev 10:1–6 . doi: 10.1103/PhysRev.10.1
Zhang J, Li X, Zhang D, Xiu Z (2007a) Theoretical and experimental investigations on the size of alginate microspheres prepared by dropping and spraying. J Microencapsul 24:303–22 . doi: 10.1080/02652040701339098
Zhang W, He X (2009) Encapsulation of living cells in small ( approximately 100 µm) alginate microcapsules by electrostatic spraying: a parametric study. J Biomech Eng 131:074515 . doi: 10.1115/1.3153326
Zhang Y, Wang W, Xie Y, et al (2007b) Optimization of Microencapsulated Recombinant CHO Cell Growth , Endostatin Production , and Stability of Microcapsule In Vivo. 79–88 . doi: 10.1002/jbmb
Zhao Y, Sun Z (2018) Effects of gelatin-polyphenol and gelatin–genipin cross-linking on the structure of gelatin hydrogels. Int J Food Prop 20:S2822–S2832 . doi: 10.1080/10942912.2017.1381111

212
Appendix
A.1 Detection of AFM Cantilever Contact Point This work to find the contact point of the force indentation curve is developed and written
by Jacob Seifert at the Department of Physics, University of Oxford.
The full indentation curve including the flat region, can be represented by the following
function:
�̃�(δ) = 𝑔𝐸δ𝛾 θ(δ) –b
Where θ (δ) is the Heaviside step function and b is the force offset.
The experimental indentation 𝛿 has also an offset δ0, therefore
δ = 𝛿 + δ0
In order to find the contact point, we use the variation of the two unknown offset
parameters δ0 and b. The variation of the indentation offset is done by adding an
additional term δ’.
𝛿 = δ̃ + δ0 + δ′
Hence the experimental force curve can be expressed as:
�̃�(𝛿) = 𝑔𝐸(𝛿 ̃ + 𝛿0 + 𝛿′)𝛾 θ(𝛿 ̃ + 𝛿0 + 𝛿′) –b

213
We multiply this equation by 𝛿 so that we obtain a discontinuous function which
minimum, 𝛿𝑚𝑖𝑛 corresponds to the contact point, as shown in Fig A.1.
The minimum of this function can be computed by
𝑑
𝑑𝑥�̃�(𝛿)𝛿 =̇ 0
It can be easily shown that the derivative of �̃�(𝛿) can be put in terms of the left hand
side (l.h.s) and right hand side (r.h.s) of the equation, defined as follows.
l.h.s= -b
r.h.s= 𝑔𝐸(𝛿 ̃ + 𝛿0 + 𝛿′)𝛾 + 𝑔𝐸(𝛿 ̃ + 𝛿0 + 𝛿′)𝛾−1 –b
The minima of this function are found for b>0, and δ’<<0 , δ’≤0 and δ’≥0, and when the
l.h.s. and r.h.s are equal, i.e.:
𝛿𝑚𝑖𝑛 + 𝛿0 + 𝛿′ = 0
Using an experimental curve instead of the ideal curve used above, and numerical
methods to find 𝛿𝑚𝑖𝑛 using the formula above, the position of the contact point can be
calculating by obtaining �̃�(𝛿𝑚𝑖𝑛) . In practice a good parameter for estimating the force
Figure A.1. Experimental force vs distance curve (�̃�/�̃�𝛿 ) showing the minimum 𝛿 that
corresponds to the contact point. Reprinted from (Chui et al. 2019), permission not required as
author of paper.

214
offset is given by 𝑏 = 0.6 (𝐹𝑚𝑎𝑥 − 𝐹𝑚𝑖𝑛) and a good parameter for the indentation offset
is 𝛿′ = 2(𝛿𝑚𝑎𝑥 − 𝛿𝑚𝑖𝑛).

215
A2 Appendix Statistical Analysis
A2.1 No Significant Difference between Replicates
In order to determine reproducibility of the microcarrier production method, an ANOVA
test was performed comparing the data obtained from the 3 replicates measuring alginate
bead diameter, described in section 3.4.2 (Table A.1) as well as microcarrier fluorescence
intensity and coating layer discussed in section 3.4.3 (Table A.2). ANOVA tests results
showed non significance between all of the replicates. This demonstrates the
reproducibility of the production processes.
Electrospraying Parameters (Voltage kV, Electrode Distance cm)
P value (n=30, p<0.05 significance)
Significance
3.5, 2.5 0.37 Not Significant
4.5, 2.5 0.70 Not Significant
5.5, 2.5 0.32 Not Significant
6.5, 2.5 0.44 Not Significant
7.5, 2.5 0.88 Not Significant
8.5, 2.5 0.24 Not Significant
3.5, 4.5 0.83 Not Significant
4.5, 4.5 0.88 Not Significant
5.5, 4.5 0.62 Not Significant
6.5, 4.5 0.79 Not Significant
7.5, 4.5 0.88 Not Significant
8.5, 4.5 0.87 Not Significant
Microcarrier Production Parameters
P value, fluorescent intensity (n=7, p<0.05 significance)
Significance P value, coating layer thickness (n=7, p<0.05 significance)
Significance
1% (w/v) chitosan pH 3.9, 1 hour coating, 1mg/ml genipin, 48 hours crosslinking at 37°C
0.50 Not Significant
0.27 Not Significant
1% (w/v) chitosan pH 5, 1 hour coating, 1mg/ml
0.14 Not Significant
0.08 Not Significant
Table A.1. ANOVA test comparing bead diameter between 3 replicates of electrosprayed
alginate beads. Results displayed no significance. (n=30, p<0.05).
Table A.2. ANOVA test of fluorescent intensity and coating layer thickness between 3 replicates
for varying microcarrier production parameters. Results displayed no significance (n=7, p<0.05)
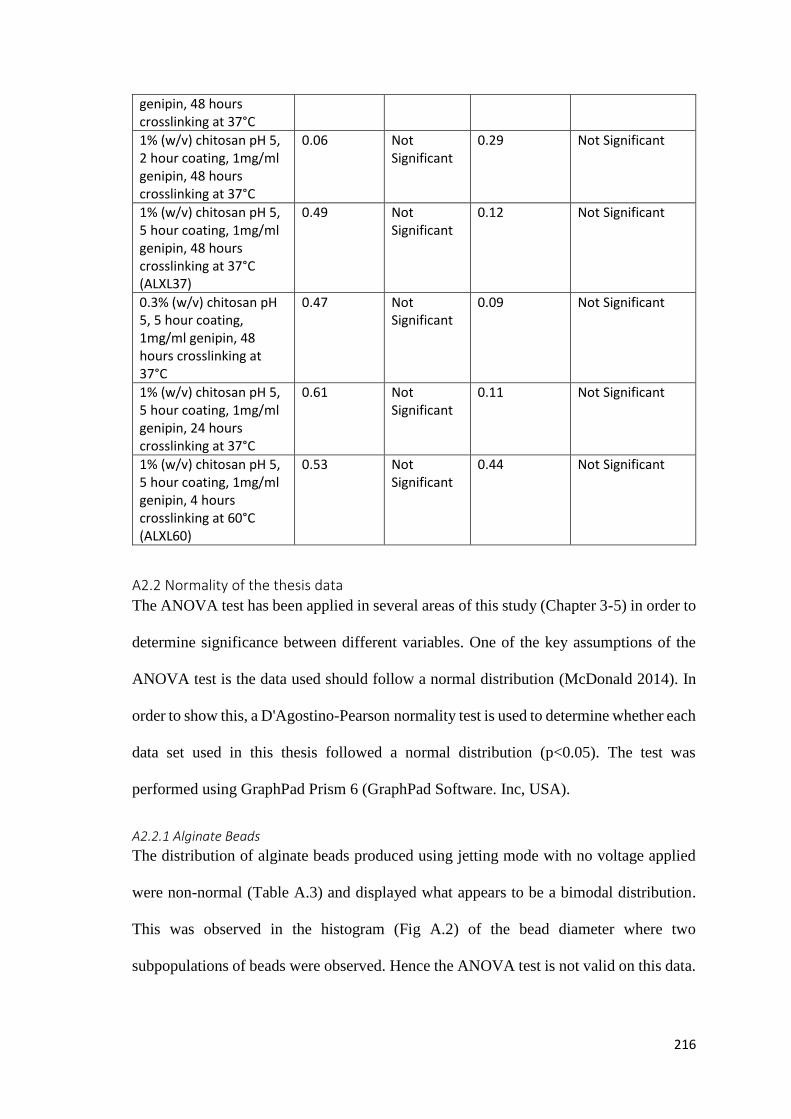
216
genipin, 48 hours crosslinking at 37°C
1% (w/v) chitosan pH 5, 2 hour coating, 1mg/ml genipin, 48 hours crosslinking at 37°C
0.06 Not Significant
0.29 Not Significant
1% (w/v) chitosan pH 5, 5 hour coating, 1mg/ml genipin, 48 hours crosslinking at 37°C (ALXL37)
0.49 Not Significant
0.12 Not Significant
0.3% (w/v) chitosan pH 5, 5 hour coating, 1mg/ml genipin, 48 hours crosslinking at 37°C
0.47 Not Significant
0.09 Not Significant
1% (w/v) chitosan pH 5, 5 hour coating, 1mg/ml genipin, 24 hours crosslinking at 37°C
0.61 Not Significant
0.11 Not Significant
1% (w/v) chitosan pH 5, 5 hour coating, 1mg/ml genipin, 4 hours crosslinking at 60°C (ALXL60)
0.53 Not Significant
0.44 Not Significant
A2.2 Normality of the thesis data
The ANOVA test has been applied in several areas of this study (Chapter 3-5) in order to
determine significance between different variables. One of the key assumptions of the
ANOVA test is the data used should follow a normal distribution (McDonald 2014). In
order to show this, a D'Agostino-Pearson normality test is used to determine whether each
data set used in this thesis followed a normal distribution (p<0.05). The test was
performed using GraphPad Prism 6 (GraphPad Software. Inc, USA).
A2.2.1 Alginate Beads
The distribution of alginate beads produced using jetting mode with no voltage applied
were non-normal (Table A.3) and displayed what appears to be a bimodal distribution.
This was observed in the histogram (Fig A.2) of the bead diameter where two
subpopulations of beads were observed. Hence the ANOVA test is not valid on this data.

217
Beads created with no voltage
Repeat 1 2 3
Mean (mm) 0.36 0.31 0.39
P value (n=30, p<0.05)
0.04 0.0001 0.007
Normal No No No
The results of the normality test for electrosprayed alginate beads is shown in Table A.4.
The test was performed on beads created under all the investigated electrospraying
conditions (3.3.1) and on each of the repeats conducted. Bead diameters displayed
normality with the exception of beads created in the 3rd repeat under 6.5kV and an
electrode distance of 4.5cm. Given that the other repeats under these conditions display
a normal distribution as well as all the other conditions yielding a normal distribution, it
is likely that this is an anomaly and it is hence concluded that the bead diameter of
electrosprayed alginate beads follow a normal distribution.
Figure A.2. Frequency histogram of alginate beads created under no voltage. Two
subpopulations of beads were observed suggesting a bimodal distribution.
Table A.3. D'Agostino-Pearson normality test on diameter of alginate beads produced under no voltage
chapter 3.4.1. (n=30, p<0.05).

218
Electrosprayed Alginate Beads
Voltage (kV), Electrode Distance (cm)
3.5, 2.5
Repeat 1 2 3
Mean (mm) 0.27 0.27 0.27
P value (n=30, p<0.05) 0.32 0.63 0.09
Normal Yes Yes Yes
Voltage (kV), Electrode Distance (cm)
4.5, 2.5
Repeat 1 2 3
Mean (mm) 0.26 0.26 0.26
P value (n=30, p<0.05) 0.84 0.16 0.40
Normal Yes Yes Yes
Voltage (kV), Electrode Distance (cm)
5.5, 2.5
Repeat 1 2 3
Mean (mm) 0.24 0.24 0.25
P value (n=30, p<0.05) 0.33 0.44 0.73
Normal Yes Yes Yes
Voltage (kV), Electrode Distance (cm)
6.5, 2.5
Repeat 1 2 3
Mean (mm) 0.24 0.23 0.24
P value (n=30, p<0.05) 0.05 0.08 0.51
Normal Yes Yes Yes
Voltage (kV), Electrode Distance (cm)
7.5, 2.5
Repeat 1 2 3
Mean (mm) 0.22 0.22 0.22
P value (n=30, p<0.05) 0.63 0.30 0.80
Normal Yes Yes Yes
Voltage (kV), Electrode Distance (cm)
8.5, 2.5
Repeat 1 2 3
Mean (mm) 0.20 0.21 0.21
P value (n=30, p<0.05) 0.15 0.20 0.94
Normal Yes Yes Yes
Voltage (kV), Electrode Distance (cm)
3.5, 4.5
Repeat 1 2 3
Mean (mm) 0.29 0.29 0.29
P value (n=30, p<0.05) 0.36 0.14 0.53
Normal Yes Yes Yes
Voltage (kV), Electrode Distance (cm)
4.5, 4.5
Repeat 1 2 3
Table A.4. D'Agostino-Pearson normality test on diameter of electrosprayed alginate beads
produced in chapter 3.4.2. (n=30, p<0.05).
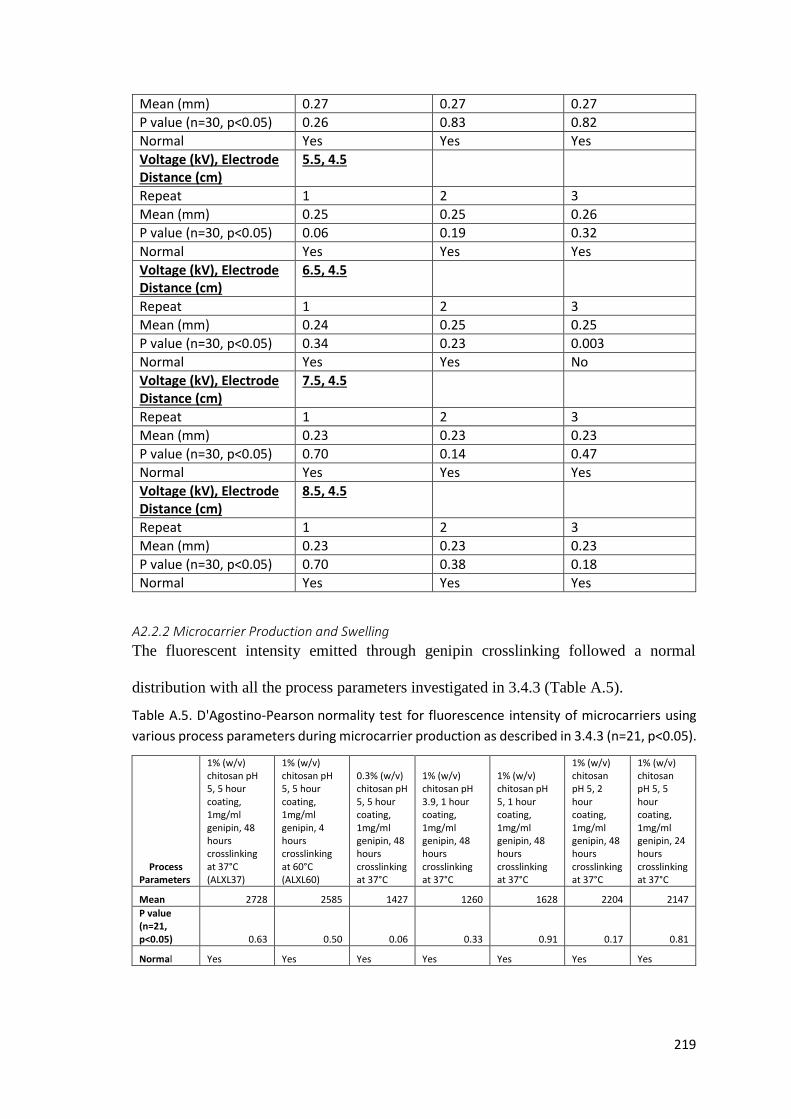
219
Mean (mm) 0.27 0.27 0.27
P value (n=30, p<0.05) 0.26 0.83 0.82
Normal Yes Yes Yes
Voltage (kV), Electrode Distance (cm)
5.5, 4.5
Repeat 1 2 3
Mean (mm) 0.25 0.25 0.26
P value (n=30, p<0.05) 0.06 0.19 0.32
Normal Yes Yes Yes
Voltage (kV), Electrode Distance (cm)
6.5, 4.5
Repeat 1 2 3
Mean (mm) 0.24 0.25 0.25
P value (n=30, p<0.05) 0.34 0.23 0.003
Normal Yes Yes No
Voltage (kV), Electrode Distance (cm)
7.5, 4.5
Repeat 1 2 3
Mean (mm) 0.23 0.23 0.23
P value (n=30, p<0.05) 0.70 0.14 0.47
Normal Yes Yes Yes
Voltage (kV), Electrode Distance (cm)
8.5, 4.5
Repeat 1 2 3
Mean (mm) 0.23 0.23 0.23
P value (n=30, p<0.05) 0.70 0.38 0.18
Normal Yes Yes Yes
A2.2.2 Microcarrier Production and Swelling
The fluorescent intensity emitted through genipin crosslinking followed a normal
distribution with all the process parameters investigated in 3.4.3 (Table A.5).
Process Parameters
1% (w/v) chitosan pH 5, 5 hour coating, 1mg/ml genipin, 48 hours crosslinking at 37°C (ALXL37)
1% (w/v) chitosan pH 5, 5 hour coating, 1mg/ml genipin, 4 hours crosslinking at 60°C (ALXL60)
0.3% (w/v) chitosan pH 5, 5 hour coating, 1mg/ml genipin, 48 hours crosslinking at 37°C
1% (w/v) chitosan pH 3.9, 1 hour coating, 1mg/ml genipin, 48 hours crosslinking at 37°C
1% (w/v) chitosan pH 5, 1 hour coating, 1mg/ml genipin, 48 hours crosslinking at 37°C
1% (w/v) chitosan pH 5, 2 hour coating, 1mg/ml genipin, 48 hours crosslinking at 37°C
1% (w/v) chitosan pH 5, 5 hour coating, 1mg/ml genipin, 24 hours crosslinking at 37°C
Mean 2728 2585 1427 1260 1628 2204 2147
P value (n=21, p<0.05) 0.63 0.50 0.06 0.33 0.91 0.17 0.81
Normal Yes Yes Yes Yes Yes Yes Yes
Table A.5. D'Agostino-Pearson normality test for fluorescence intensity of microcarriers using
various process parameters during microcarrier production as described in 3.4.3 (n=21, p<0.05).
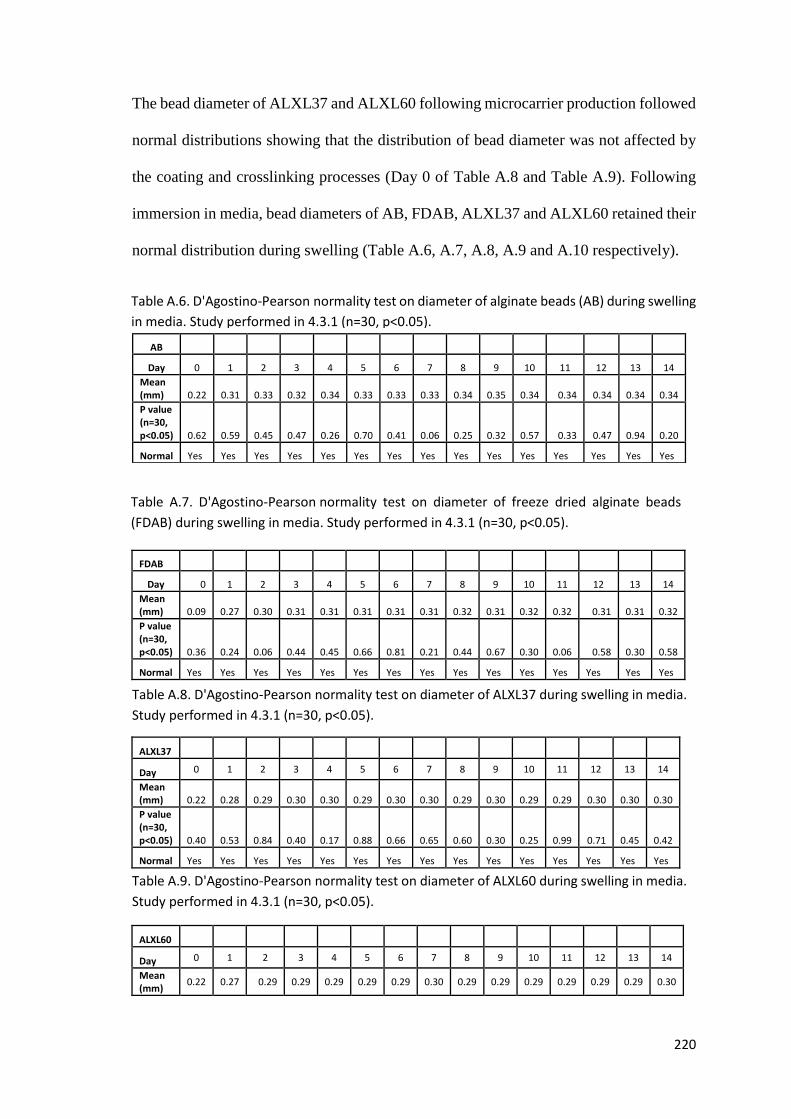
220
The bead diameter of ALXL37 and ALXL60 following microcarrier production followed
normal distributions showing that the distribution of bead diameter was not affected by
the coating and crosslinking processes (Day 0 of Table A.8 and Table A.9). Following
immersion in media, bead diameters of AB, FDAB, ALXL37 and ALXL60 retained their
normal distribution during swelling (Table A.6, A.7, A.8, A.9 and A.10 respectively).
FDAB
Day 0 1 2 3 4 5 6 7 8 9 10 11 12 13 14
Mean (mm) 0.09 0.27 0.30 0.31 0.31 0.31 0.31 0.31 0.32 0.31 0.32 0.32 0.31 0.31 0.32
P value (n=30, p<0.05) 0.36 0.24 0.06 0.44 0.45 0.66 0.81 0.21 0.44 0.67 0.30 0.06 0.58 0.30 0.58
Normal Yes Yes Yes Yes Yes Yes Yes Yes Yes Yes Yes Yes Yes Yes Yes
ALXL37
Day 0 1 2 3 4 5 6 7 8 9 10 11 12 13 14
Mean (mm) 0.22 0.28 0.29 0.30 0.30 0.29 0.30 0.30 0.29 0.30 0.29 0.29 0.30 0.30 0.30
P value (n=30, p<0.05) 0.40 0.53 0.84 0.40 0.17 0.88 0.66 0.65 0.60 0.30 0.25 0.99 0.71 0.45 0.42
Normal Yes Yes Yes Yes Yes Yes Yes Yes Yes Yes Yes Yes Yes Yes Yes
ALXL60
Day 0 1 2 3 4 5 6 7 8 9 10 11 12 13 14
Mean (mm)
0.22 0.27 0.29 0.29 0.29 0.29 0.29 0.30 0.29 0.29 0.29 0.29 0.29 0.29 0.30
AB
Day 0 1 2 3 4 5 6 7 8 9 10 11 12 13 14
Mean (mm) 0.22 0.31 0.33 0.32 0.34 0.33 0.33 0.33 0.34 0.35 0.34 0.34 0.34 0.34 0.34
P value (n=30, p<0.05) 0.62 0.59 0.45 0.47 0.26 0.70 0.41 0.06 0.25 0.32 0.57 0.33 0.47 0.94 0.20
Normal Yes Yes Yes Yes Yes Yes Yes Yes Yes Yes Yes Yes Yes Yes Yes
Table A.8. D'Agostino-Pearson normality test on diameter of ALXL37 during swelling in media.
Study performed in 4.3.1 (n=30, p<0.05).
Table A.6. D'Agostino-Pearson normality test on diameter of alginate beads (AB) during swelling
in media. Study performed in 4.3.1 (n=30, p<0.05).
Table A.7. D'Agostino-Pearson normality test on diameter of freeze dried alginate beads
(FDAB) during swelling in media. Study performed in 4.3.1 (n=30, p<0.05).
Table A.9. D'Agostino-Pearson normality test on diameter of ALXL60 during swelling in media.
Study performed in 4.3.1 (n=30, p<0.05).

221
P value (n=30, p<0.05)
0.83 0.93 0.09 0.10 0.10 0.10 0.95 0.41 0.17 0.23 0.88 0.81 0.41 0.21 0.16
Normal Yes Yes Yes Yes Yes Yes Yes Yes Yes Yes Yes Yes Yes Yes Yes
FDXL60
Day 0 1 2 3 4 5 6 7 8 9 10 11 12 13 14
Mean (mm) 0.13 0.23 0.25 0.26 0.25 0.25 0.25 0.25 0.25 0.25 0.26 0.25 0.26 0.26 0.26
P value (n=30, p<0.05) 0.26 0.12 0.50 0.50 0.24 0.25 0.15 0.37 0.37 0.73 0.89 0.91 0.50 0.11 0.38
Normal Yes Yes Yes Yes Yes Yes Yes Yes Yes Yes Yes Yes Yes Yes Yes
A2.2.3 Microcarrier Mechanical Properties
The mechanical properties measured using AFM indentation followed a normal
distribution for AB and FDAB, as shown in Table A.11 and A.12 respectively
AB
Day 1 5 8 12 14
Mean (Pa) 2661 1858 2156 1959 2165
P value (n=30, p<0.05) 0.76 0.86 0.30 0.42 0.16
Normal Yes Yes Yes Yes Yes
FDAB
Day 1 5 8 12 14
Mean (Pa) 3279 3288 3345 2570 2505
P value (n=30, p<0.05) 0.56 0.68 0.58 0.29 0.15
Normal Yes Yes Yes Yes Yes
Table A.11. D'Agostino-Pearson normality test on the reduced modulus (E*) of AB during AFM
indentation in 4.3.2. (n=30, p<0.05).
Table A.12. D'Agostino-Pearson normality test on the reduced modulus (E*) of FDAB during AFM
indentation in 4.3.2. (n=30, p<0.05).
Table A.10. D'Agostino-Pearson normality test on diameter of FDXL60 during swelling in
media. Study performed in 4.3.1 (n=30, p<0.05).
Copyright © 2022 FDOKUMEN