
Dynamic MicroRNA Gene Transcription and Processing during T Cell Development
11
The Journal of Immunology Dynamic MicroRNA Gene Transcription and Processing during T Cell Development Francis F. Kirigin,* ,† Kenneth Lindstedt, ‡ Maclean Sellars,* Maria Ciofani,* Siao Li Low, ‡ Lachlan Jones, ‡ Fiona Bell, ‡ Florencia Pauli, x Richard Bonneau, †,{ Richard M. Myers, x Dan R. Littman,* ,‖ and Mark M. W. Chong ‡,# By disrupting microRNA (miRNA) biogenesis, we previously showed that this pathway is critical for the differentiation and function of T cells. Although various cloning studies have shown that many miRNAs are expressed during T cell development, and in a dy- namic manner, it was unclear how comprehensive these earlier analyses were. We therefore decided to profile miRNA expression by next generation sequencing. Furthermore, we profiled miRNA expression starting from the hematopoietic stem cell. This analysis revealed that miRNA expression during T cell development is extremely dynamic, with 645 miRNAs sequenced, and the expression of some varying by as much as 3 orders of magnitude. Furthermore, changes in precursor processing led to altered mature miRNA sequences. We also analyzed the structures of the primary miRNA transcripts expressed in T cells and found that many were ex- tremely long. The longest was pri–mir-29b-1/29a at ∼168 kb. All the long pri-miRNAs also displayed extensive splicing. Our findings indicate that miRNA expression during T cell development is both a highly dynamic and a highly regulated process. The Journal of Immunology, 2012, 188: 3257–3267. E arly hematopoiesis occurs in the bone marrow (BM), giving rise to progenitors of all leukocyte lineages. Thy- mocyte progenitors then leave the BM to seed the thymus where definitive T cell development occurs. Early thymocytes first progress through four stages termed double-negative (DN) 1–4, because they lack expression of the CD4 and CD8 coreceptors. DN3 is a key stage. TCR b rearrangement occurs here, and pro- ductive rearrangement is required for progression to the DN4 stage (1). DN4 thymocytes then rapidly proliferate and upregulate both coreceptors as they progress to the CD4 + CD8 + double-positive (DP) stage. Appropriate selection then leads to differentiation of mature CD8 + cytotoxic T cells or CD4 + Th cells (2). Much of what is understood about T cell development is centered on proteins, such as those involved in transcription and signal transduction. However, there is an increasing appreciation for the role of non-protein–coding RNAs (ncRNAs). Both long ncRNAs (lncRNAs) (3) and small ncRNAs (4–6) are expressed in T cells, but the function of most ncRNA classes remains unknown. The best understood class is the microRNAs (miRNAs), which are ∼22-nt small RNAs that inhibit the translation of protein-coding messenger RNAs (mRNAs). Thousands of miRNAs have so far been identified in plants and animals, including some 1424 and 720 in humans and mice, respectively (miRBase) (7). miRNAs target protein-coding mRNAs via incomplete base pairings (8). Because only partial complementarity is required, numerous mRNAs can be the target of each miRNA. miRNAs originate from long primary transcripts (known as pri- miRNAs) containing one or more secondary stem-loop structures. It is from this stem loop that the mature miRNA is eventually derived. In the canonical biogenesis pathway, the intermediate “pre-miRNA” stem loop is released from the pri-miRNA in the nucleus by the microprocessor complex. At the core of this complex is the RNase III enzyme Drosha (9). The excised pre-miRNA is then exported to the cytoplasm where it is further processed by another RNase III enzyme complex containing Dicer, which clips off the loop struc- ture (10). This is followed by loading of the miRNA-5p:miRNA-3p duplex (i.e., the two arms of the stem loop) into the RNA-induced silencing complex (11), at which point one strand is degraded. We and others have shown that Drosha and Dicer, and therefore miRNAs, are important throughout the T cell compartment. miR- NAs are required for early thymocytes to progress through the DN stages (12). miRNAs are also necessary for T cell function. In particular, they maintain the suppressor program of Foxp3 + regu- latory T cells. Mice with Foxp3 + cell-specific Drosha or Dicer *Kimmel Center for Biology and Medicine, Skirball Institute of Biomolecular Medicine, New York University School of Medicine, New York, NY 10016; † Center for Genomics and Systems Biology, New York University, New York, NY 10003; ‡ Walter and Eliza Hall Institute of Medical Research, Parkville, Victoria 3052, Australia; x HudsonAlpha Institute for Biotechnology, Huntsville, AL 35806; { Courant Institute for Mathematical Sciences, New York, NY 10003; ‖ Howard Hughes Medical Institute, New York University School of Medicine, New York, NY 10016; and # Department of Medical Biology, University of Melbourne, Parkville, Victoria 3010, Australia Received for publication November 7, 2011. Accepted for publication January 22, 2012. This work was supported by grants from the Australian National Health and Medical Research Council (637338 and 1004541; to M.M.W.C.), the National Institutes of Health (RC1 AI087266-01, RC4 AI092765-01, and PN2 EY016586-06; to R.B.), and the National Science Foundation (DBI-0820757; to R.B.) and funding from the HudsonAlpha Institute for Biotechnology (to F.P. and R.M.M.). M.S. and M.C. were supported by postdoctoral fellowships from the Cancer Research Institute and the Leukemia and Lymphoma Society, respectively. M.M.W.C. is a Queen Elizabeth II Fellow of the Australian Research Council, and D.R.L. is an Investigator of the Howard Hughes Medical Institute. This work was made possible through Victorian State Government Operational Infrastructure Support and Australian National Health and Medical Research Council Research Institute Infrastructure Support Scheme. The sequences presented in this article have been submitted to the Gene Expression Omnibus (http://www.ncbi.nlm.nih.gov/geo/) under accession number GSE30584. Address correspondence and reprint requests to Dr. Mark M.W. Chong, Walter and Eliza Hall Institute of Medical Research, Parkville, VIC 3052, Australia. E-mail address: [email protected] The online version of this article contains supplemental material. Abbreviations used in this article: BM, bone marrow; ChIP, chromatin immunopre- cipitation; DN, double-negative; DP, double-positive; ITU, independent transcrip- tional unit; lncRNA, long ncRNA; LSK, Lin 2 Sca1 + kit + ; MEF, murine embryonic fibroblast; miRNA, microRNA; MPP, multipotent progenitor; ncRNA, non-protein– coding RNA; NGS, next generation sequencing; PolII, RNA polymerase II; pri- miRNA, primary microRNA; seq, sequencing. Copyright Ó 2012 by The American Association of Immunologists, Inc. 0022-1767/12/$16.00 www.jimmunol.org/cgi/doi/10.4049/jimmunol.1103175
-
Upload
independent -
Category
Documents
-
view
0 -
download
0
Transcript of Dynamic MicroRNA Gene Transcription and Processing during T Cell Development

The Journal of Immunology
Dynamic MicroRNA Gene Transcription and Processingduring T Cell Development
Francis F. Kirigin,*,† Kenneth Lindstedt,‡ Maclean Sellars,* Maria Ciofani,*
Siao Li Low,‡ Lachlan Jones,‡ Fiona Bell,‡ Florencia Pauli,x Richard Bonneau,†,{
Richard M. Myers,x Dan R. Littman,*,‖ and Mark M. W. Chong‡,#
By disrupting microRNA (miRNA) biogenesis, we previously showed that this pathway is critical for the differentiation and function
of T cells. Although various cloning studies have shown that many miRNAs are expressed during T cell development, and in a dy-
namic manner, it was unclear how comprehensive these earlier analyses were.We therefore decided to profile miRNA expression by
next generation sequencing. Furthermore, we profiled miRNA expression starting from the hematopoietic stem cell. This analysis
revealed that miRNA expression during T cell development is extremely dynamic, with 645 miRNAs sequenced, and the expression
of some varying by as much as 3 orders of magnitude. Furthermore, changes in precursor processing led to altered mature miRNA
sequences. We also analyzed the structures of the primary miRNA transcripts expressed in T cells and found that many were ex-
tremely long. The longest was pri–mir-29b-1/29a at ∼168 kb. All the long pri-miRNAs also displayed extensive splicing. Our
findings indicate that miRNA expression during T cell development is both a highly dynamic and a highly regulated process. The
Journal of Immunology, 2012, 188: 3257–3267.
Early hematopoiesis occurs in the bone marrow (BM),giving rise to progenitors of all leukocyte lineages. Thy-mocyte progenitors then leave the BM to seed the thymus
where definitive T cell development occurs. Early thymocytes firstprogress through four stages termed double-negative (DN) 1–4,because they lack expression of the CD4 and CD8 coreceptors.DN3 is a key stage. TCR b rearrangement occurs here, and pro-
ductive rearrangement is required for progression to the DN4 stage(1). DN4 thymocytes then rapidly proliferate and upregulate bothcoreceptors as they progress to the CD4+CD8+ double-positive(DP) stage. Appropriate selection then leads to differentiation ofmature CD8+ cytotoxic T cells or CD4+ Th cells (2).Much of what is understood about T cell development is centered
on proteins, such as those involved in transcription and signaltransduction. However, there is an increasing appreciation for therole of non-protein–coding RNAs (ncRNAs). Both long ncRNAs(lncRNAs) (3) and small ncRNAs (4–6) are expressed in T cells,but the function of most ncRNA classes remains unknown. Thebest understood class is the microRNAs (miRNAs), which are∼22-nt small RNAs that inhibit the translation of protein-codingmessenger RNAs (mRNAs). Thousands of miRNAs have so farbeen identified in plants and animals, including some 1424 and720 in humans and mice, respectively (miRBase) (7). miRNAstarget protein-coding mRNAs via incomplete base pairings (8).Because only partial complementarity is required, numerousmRNAs can be the target of each miRNA.miRNAs originate from long primary transcripts (known as pri-
miRNAs) containing one ormore secondary stem-loop structures. Itis from this stem loop that the mature miRNA is eventually derived.In the canonical biogenesis pathway, the intermediate “pre-miRNA”stem loop is released from the pri-miRNA in the nucleus by themicroprocessor complex. At the core of this complex is the RNaseIII enzyme Drosha (9). The excised pre-miRNA is then exported tothe cytoplasm where it is further processed by another RNase IIIenzyme complex containing Dicer, which clips off the loop struc-ture (10). This is followed by loading of the miRNA-5p:miRNA-3pduplex (i.e., the two arms of the stem loop) into the RNA-inducedsilencing complex (11), at which point one strand is degraded.We and others have shown that Drosha and Dicer, and therefore
miRNAs, are important throughout the T cell compartment. miR-NAs are required for early thymocytes to progress through the DNstages (12). miRNAs are also necessary for T cell function. Inparticular, they maintain the suppressor program of Foxp3+ regu-latory T cells. Mice with Foxp3+ cell-specific Drosha or Dicer
*Kimmel Center for Biology and Medicine, Skirball Institute of Biomolecular Medicine,New York University School of Medicine, New York, NY 10016; †Center for Genomicsand Systems Biology, New York University, New York, NY 10003; ‡Walter and ElizaHall Institute of Medical Research, Parkville, Victoria 3052, Australia; xHudsonAlphaInstitute for Biotechnology, Huntsville, AL 35806; {Courant Institute for MathematicalSciences, New York, NY 10003; ‖Howard Hughes Medical Institute, New YorkUniversity School of Medicine, New York, NY 10016; and #Department of MedicalBiology, University of Melbourne, Parkville, Victoria 3010, Australia
Received for publication November 7, 2011. Accepted for publication January 22,2012.
This work was supported by grants from the Australian National Health and MedicalResearch Council (637338 and 1004541; to M.M.W.C.), the National Institutes ofHealth (RC1 AI087266-01, RC4 AI092765-01, and PN2 EY016586-06; to R.B.), andthe National Science Foundation (DBI-0820757; to R.B.) and funding from theHudsonAlpha Institute for Biotechnology (to F.P. and R.M.M.). M.S. and M.C. weresupported by postdoctoral fellowships from the Cancer Research Institute and theLeukemia and Lymphoma Society, respectively. M.M.W.C. is a Queen Elizabeth IIFellow of the Australian Research Council, and D.R.L. is an Investigator of theHoward Hughes Medical Institute. This work was made possible through VictorianState Government Operational Infrastructure Support and Australian National Healthand Medical Research Council Research Institute Infrastructure Support Scheme.
The sequences presented in this article have been submitted to the Gene ExpressionOmnibus (http://www.ncbi.nlm.nih.gov/geo/) under accession number GSE30584.
Address correspondence and reprint requests to Dr. Mark M.W. Chong, Walter andEliza Hall Institute of Medical Research, Parkville, VIC 3052, Australia. E-mailaddress: [email protected]
The online version of this article contains supplemental material.
Abbreviations used in this article: BM, bone marrow; ChIP, chromatin immunopre-cipitation; DN, double-negative; DP, double-positive; ITU, independent transcrip-tional unit; lncRNA, long ncRNA; LSK, Lin2Sca1+kit+; MEF, murine embryonicfibroblast; miRNA, microRNA; MPP, multipotent progenitor; ncRNA, non-protein–coding RNA; NGS, next generation sequencing; PolII, RNA polymerase II; pri-miRNA, primary microRNA; seq, sequencing.
Copyright� 2012 by The American Association of Immunologists, Inc. 0022-1767/12/$16.00
www.jimmunol.org/cgi/doi/10.4049/jimmunol.1103175
deficiency die of a lymphoproliferative multiorgan inflammatory
disease because of loss of suppressor function (13–15).Compared with the posttranscriptional processing, less is known
about the transcription of miRNA genes. This has been due, inlarge part, to a lack of information about the full-length primarytranscript of most miRNAs, and thus, genomic databases have notbeen able to annotate these genes. It is estimated that 30–40% ofmammalian miRNAs are derived from the introns of protein-coding genes and thus are transcribed together with the hostgenes (16). However, the majority of miRNAs are derived fromindependent transcriptional units (ITUs). The transcription of mostmiRNA genes depends on RNA polymerase II (PolII) (17–19).Furthermore, PolII binding sites located near pre-miRNA genomiclocations (potentially correlating with promoters) are marked byhistone 3 trimethyl-lysine 4 (H3K4me3) (20). Because of rapidprocessing by the microprocessor complex, pri-miRNAs derivedfrom these ITUs are difficult to detect in cells. Full-length primarytranscripts have been characterized for only a handful of miRNAs(17, 21, 22). Thus, although it has been possible to determine fromwhere in the genome the pre-miRNA stem-loop intermediate isderived, the structure of many miRNA genes remains undefined.miRNAs are clearly important for the development and func-
tion of T cells. However, which specific miRNAs are important atwhich stage(s) is still unclear. In this article, we report the use of nextgeneration sequencing (NGS) to construct a comprehensive miRNAatlas of T cell development.We reveal the dynamic nature of miRNAgene transcription and processing throughout this developmentalpathway. We also use NGS coupled to chromatin immunoprecipi-tation sequencing (ChIP-seq) and polyA RNA enrichment (RNA-seq) to map the structures of miRNA genes expressed in T cells.
Materials and MethodsMice and cell preparations
DroshaF/F and DicerF/F CD4-cre mice have been described previously(13). C57BL/6 mice were purchased from Taconic Farms or produced atthe Walter and Eliza Hall Institute. Mice at 6- to 8-wk-old mice were usedfor all analyses. Single-cell suspensions were prepared from BM byflushing with a syringe, and thymocyte suspensions were prepared bymincing thymi through a 100-mm mesh. All Abs were purchased fromeBioscience, and cell sorting was performed on a FACSAria (BD Bio-sciences).
miRNA sequencing
Total RNAwas prepared from 0.5–53 105 cells (depending on population)using TRIzol (Invitrogen). The 19- to 24-nt small RNAs were fractionated,and libraries were constructed for sequencing on the Illumina GAII plat-
form as described previously (12, 23). Sequence reads were mapped toknown mature and pre-miRNAs deposited in miRBase (7). Nonmappingreads were then analyzed for potential novel miRNA species. In brief, thisinvolved aligning the remaining reads to the Mus musculus genome (mm9assembly, National Center for Biotechnology Information Build 37) usingNovoalign (NovoCraft V2.05.04). The genomic intervals in which novelsreads clustered were then extracted, and the corresponding RNA was an-alyzed for putative secondary structure using UNAfold (24). Sequenceswith predicted stem-loop structure were considered potential miRNAprecursors. However, only those structures where the small RNAs actuallymapped to the double-stranded stems were considered novel miRNAs.Scripts for these pipelines can be provided upon request.
RNA sequencing
RNA-seq was performed as described previously (25, 26). In brief, polyARNAs were selected using oligo-dT magnetic beads. The RNA was frag-mented and reversed transcribed to produce cDNA and then dsDNA.Illumina-compatible adaptors were ligated to the dsDNA after end-repairand dA addition. The resulting library was size selected at ∼225 bp andamplified and purified before being sequenced. The reads were mapped tomouse genome (mm9 assembly) using the Illumina ELAND software. Thedata were then visualized using the Integrative Genomics Viewer software(27) or the University of California Santa Cruz Genome Browser (28).Mammalian sequence conservation data were also obtained from theUniversity of California Santa Cruz Genome Browser.
ChIP sequencing
ChIPs were performed on native chromatin essentially as previously de-scribed (29), with some modifications. In brief, 1.1 3 107 cells were lysedin digestion buffer (50 mM Tris-HCl [pH 7.5], 250 mM sucrose, 3 mMMgCl2, 1 mM CaCl2, and 0.2% Triton X-100, supplemented with fresh 5mM sodium butyrate, 0.5 mM PMSF, and EDTA-free protease inhibitors)at 4˚C for 10 min. The nuclei were collected by centrifugation andresuspended in fresh digestion buffer. The nuclei were warmed to 37˚C,and then, micrococcal nuclease was added to a final concentration of 0.09U/ml. After 5 min, the reaction was stopped by the addition of EDTA/EGTA. The nuclei were collected and then lysed by two rounds of soni-cation (Diagenode Bioruptor 300) and incubation in lysis buffer (10 mMTris-HCl [pH 7.5], 0.25mM EDTA, supplemented with fresh 5mM sodiumbutyrate and 0.5 mM PMSF and EDTA-free protease inhibitors) for 1 h.More than 90% mononucleosomes release was confirmed. A total of 25 mgchromatin (∼5 3 106 cell equivalents) was subjected to ChIP using 15 mlProtein A Dynabeads (Invitrogen) precoated with anti-H3K4me3 (05-745;Upstate Biotechnology/Millipore) or anti-H3K36me3 (Ab9050; Abcam)Abs. Immunoprecipitated mononucleosomes were washed twice in radio-immunoprecipitation assay buffer, twice in radioimmunoprecipitation as-say buffer plus 0.3M NaCl, twice in LiCl buffer (0.25 M LiCl, 1% NonidetP-40, and 0.5% sodium deoxycholate), and finally twice with Tris-EDTAbuffer. DNA was eluted by incubation with 3% SDS and 50 mg/ml pro-teinase K in Tris-EDTA at 65˚C for 1 h. After phenol/chloroform ex-traction, libraries were prepared from 10 ng DNA using the ChIP-SeqPrepreparation Kit (Illumina), according to the manufacturer’s protocol,and sequenced on the Illumina GAII platform. The reads were mapped tomouse genome (mm9 assembly) using the Illumina ELAND software.
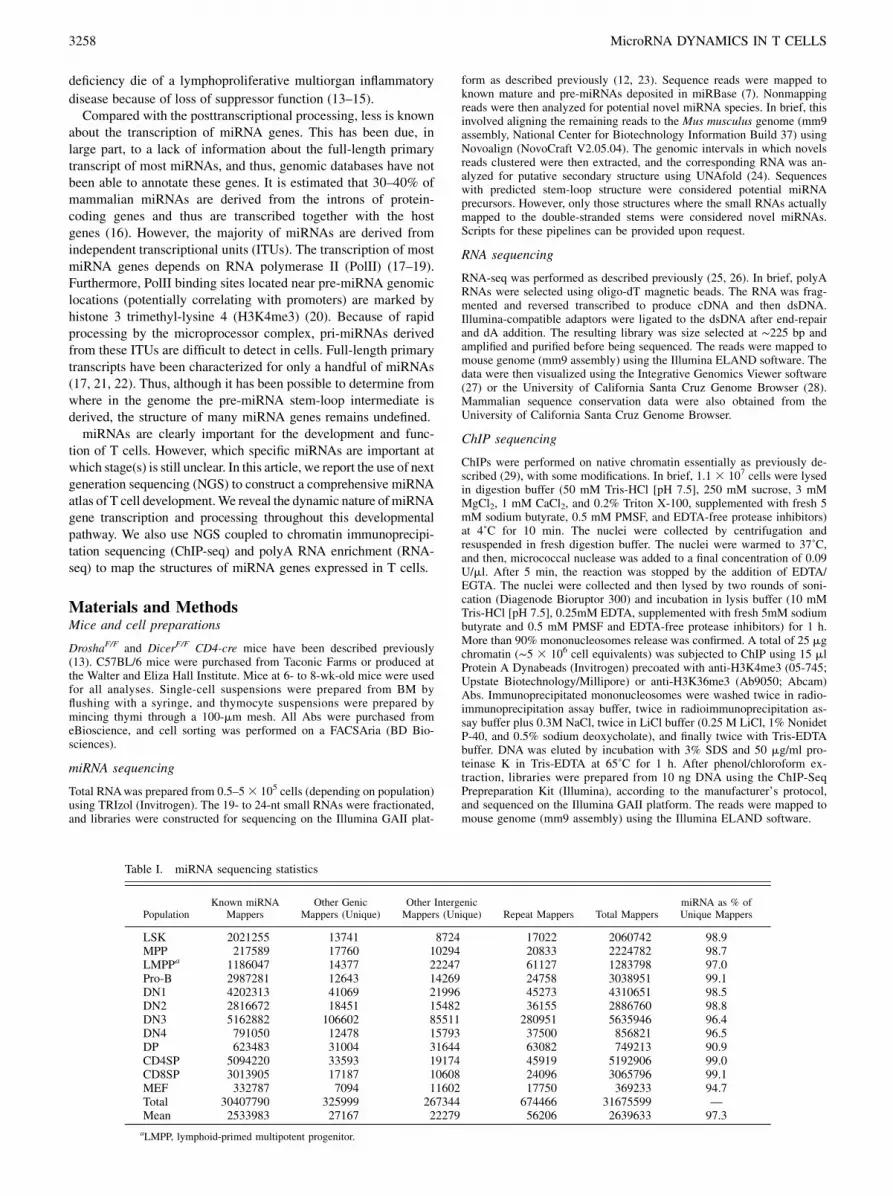
Table I. miRNA sequencing statistics
PopulationKnown miRNA
MappersOther Genic
Mappers (Unique)Other IntergenicMappers (Unique) Repeat Mappers Total Mappers
miRNA as % ofUnique Mappers
LSK 2021255 13741 8724 17022 2060742 98.9MPP 217589 17760 10294 20833 2224782 98.7LMPPa 1186047 14377 22247 61127 1283798 97.0Pro-B 2987281 12643 14269 24758 3038951 99.1DN1 4202313 41069 21996 45273 4310651 98.5DN2 2816672 18451 15482 36155 2886760 98.8DN3 5162882 106602 85511 280951 5635946 96.4DN4 791050 12478 15793 37500 856821 96.5DP 623483 31004 31644 63082 749213 90.9CD4SP 5094220 33593 19174 45919 5192906 99.0CD8SP 3013905 17187 10608 24096 3065796 99.1MEF 332787 7094 11602 17750 369233 94.7Total 30407790 325999 267344 674466 31675599 —Mean 2533983 27167 22279 56206 2639633 97.3
aLMPP, lymphoid-primed multipotent progenitor.
3258 MicroRNA DYNAMICS IN T CELLS

RT-PCR
cDNA was obtained by reverse transcription of total RNA using Super-script III (Invitrogen) and random hexamers. The following primers wereemployed to amplify pri-miRNA sequences: 59-GATACCAAAATGTCA-GACAGCC-39 and 59-AGTCTCAGCTGCACTAGC-39 were used to am-plify pri–mir-21; 59-GACTACGCTCTGCCCTTCTG-39 and 59-TTCTGC-TTCCTGAGTGCTGA-39 were used to amplify the pri–mir-29b-1/29a;and 59-AGGTTCATACCTGTTGGTGGA-39 and 59-CATTACGGCAATG-ACCAAGG-39 were used to amplify the pri–let-7c-2/let-7b.
NGS data sets
All miRNA-seq, RNA-seq, and ChIP-seq data sets have been deposited withthe Gene Expression Omnibus (http://www.ncbi.nlm.nih.gov/geo/) underaccession number GSE30584.
ResultsmiRNA libraries and the identification of putative novelmiRNAs expressed during T cell development
Early studies characterizing the expression of miRNAs in T cellsused cloning or hybridization microarrays on whole lymphoidorgans or partially fractionated T cell populations (5, 30). Morerecently, Neilson et al. (6) extended this analysis by focusingspecifically on T cell development. They analyzed libraries ofshort RNA clones derived from FACS-sorted thymocyte subsets.However, given that ,1000 clones were obtained for some pop-ulations, it was unclear how comprehensive this analysis was.We therefore decided to construct a more comprehensive miRNA
FIGURE 1. Dynamic miRNA expression during T cell development. (A) The indicated populations corresponding to distinct stages of T cell devel-
opment from LSKs through to mature CD4SP and CD8SP thymocytes were FACS purified and then analyzed for miRNA expression by miRNA-seq. As
a comparison, pro-B cells (related population) and MEFs (unrelated population) were also analyzed. Shown is a heat map of all mature miRNA species
sequenced at least once. The data have been clustered based on Euclidean distance. Comparisons of miRNA profiles between CD4SP and CD8SP thy-
mocytes (B); DN1 and pro-B (C); and LSK and MEF (D). Examples of miRNAs expressed at constant levels (E); hematopoietic progenitor-specific miRNAs
(F); miRNAs that are transiently upregulated during T cell development (G); and miRNAs with bimodal expression patterns (H). r, Pearson’s correlation.
The Journal of Immunology 3259

profile of T cell development using NGS. Furthermore, we de-cided to start from the hematopoietic stem cell-enrich Lin2Sca1+
kit+ (LSK) population in the BM. We sorted the following pop-ulations corresponding to known steps in T cell development fromthe BM and thymus of C57BL/6 mice: LSK, multipotent pro-genitor (MPP; Lin2Sca1+kit+CD135+CD106+), lymphoid-primedmultipotent progenitor (Lin2Sca1+kit+CD135+CD1062), DN1(CD90+CD42CD82CD32CD44+CD252), DN2 (CD90+CD42
CD82CD32CD44+CD25+), DN3 (CD90+CD42CD82CD32/lo
CD442CD25+), DN4 (CD90+CD42CD82CD3loCD442CD252),DP (CD90+CD4+CD8+CD3lo), CD4SP (CD90+CD4+CD82
CD24loCD3hi), and CD8SP (CD90+CD42CD8+CD24loCD3hi).We also included pro-B cells (B220+IgM2CD43hi) as a relatedpopulation and murine embryonic fibroblasts (MEFs) as an un-related population. A total of 3.17 3 107 mappable reads wasobtained at an average of 2.64 3 106 reads per library (Table I).
The vast majority (90.0–99.1%) mapped to previously annotatedmiRNA loci (Table I). An average of 2.1% of reads were non-unique mappers (i.e., mapped to multiple locations within thegenome, such as repetitive sequences) and were thus excludedfrom further analyses. An additional 1.9% of reads were found tobe unique mappers, equally distributed between genic and inter-genic regions.To identify novel miRNAs, the remaining 1.9% of unique reads
were pooled and analyzed for groups of reads clustering within50- to 200-bp genomic intervals. The RNA sequence of these in-tervals was then analyzed for potential secondary structure inunaFold (24). As pre-miRNAs are expected to fold into stablesecondary stem-loop structures, we analyzed further only thosesequences with predicted free energies (DG) of less than or equalto 230 kcal/mol. This yielded 310 sequences with potentiallystable secondary structure, of which 66 displayed clear stem-loop
FIGURE 2. Altered miRNA precursor processing
at DN3 to DP stages of T cell development. (A) Ex-
pression levels of miR-106b, -93, and -25, which are
all derived from the same polycistron. Distribution of
mature miRNA subspecies derived from the pre–mir-
17 (B) and pre–mir-21 (C) precursors. The data in-
dicate the contribution each subspecies makes to the
total mature miR-17 or -21 pool at each stage of T
cell development. miRNAs derived from both 5p and
3p arms are shown.
3260 MicroRNA DYNAMICS IN T CELLS

structure and mammalian sequence conservation (data not shown).Despite so many sequences predicted to fold into pre–miRNA-likestem-loops, for only 20 did the reads map clearly to the stems(Supplemental Fig. 1). Three of these (numbers 77, 1123, and1413) have since been annotated as miR-1843b, miR-3068 andmiR-1306b by miRBase (7). Two (numbers 28 and 665) mapped topredicted small nucleolar RNAs (31), and five (numbers 199, 624,647, 671, and 823) mapped to predicted transfer RNAs (32).However, these previous annotations were based on genomic se-quence rather than the RNA. Analysis of the actual RNAs suggeststhat all fold into stem-loop structures typical of pre-miRNAs ratherthan small nucleolar RNAs or transfer RNAs (Supplemental Fig. 1).
The dynamics of miRNA expression during T cell development
miRNA-seq generated a comprehensive and quantitative atlas ofmiRNA expression during T cell development (Fig. 1A, Supple-mental Table I). A total of 645 different mature miRNAs (in-cluding miRNA* species) were sequenced at least once in one ofthe populations within the T cell developmental pathway (Sup-plemental Table I). Previous studies suggested that although mostmiRNAs are widely expressed (4), different sets of miRNAs areexpressed by different cell types (33). These studies also impliedthat similar miRNA profiles are shared by related cell types. Fromour miRNA-seq analysis, developmental relationships were clearlyevident. The highly related populations, CD4SP and CD8SP thy-mocytes, displayed highly similar miRNA profiles, with a Pear-son’s correlation of 0.954 (Fig. 1B). The closely related popu-lations, DN1 thymocytes and pro-B cells, both being early stepsin their respective developmental pathways, displayed somewhatsimilar miRNA profiles, with a Pearson’s correlation of 0.75(Fig. 1C). In contrast, the completely unrelated populations, LSKand MEFs, displayed completely different miRNA profiles, witha Person’s correlation of 0.04 (Fig. 1D).Although many miRNAs were expressed at a constant level
throughout (Fig. 1E), including miR-181d and many Let-7 mem-bers, others displayed highly dynamic patterns. Many of themiRNAs that were highly expressed in the LSK and MPP stages,including miR-10a and miR-126-3p, were downregulated by asmuch as 3 orders of magnitude by the CD4SP and CD8SP stages(Fig. 1F). Others were transiently upregulated at specific stages. In
particular, there was a noticeable spike in miR-181a, miR-181b,miR-181c, and miR-142-3p at the late DN to DP stages (Fig. 1G).It has previously been observed that miR-181 family membersare highly enriched in DP thymocytes (6). Thus, the spike in themiR-181a/b/c expression was not a surprise. According to miR-Base (7), miR-181c clusters with miR-181d and thus coordinateexpression might have been expected. However, because miR-181d displayed a constant expression pattern (Fig. 1E), thereappeared to be a discrepancy between the two linked miRNAs.Finally, numerous miRNAs displayed biphasic expression pat-terns, including miR-142-5p (Fig. 1H). Again, one would haveexpected miR-142-5p and miR-142-3p to be expressed with sim-ilar patterns as both are derived from the same pre-miRNA.These miR-142-5p/3p and miR-181c/d discordances suggest thatmiRNA expression might not simply be determined by transcrip-tion of the gene but also on precursor processing that appears tovary during T cell development.
Developmental stage-specific processing of miRNA precursors
To further explore the possibility of regulated miRNA precursorprocessing, we examined the expression of miR-106b, miR-93, andmiR-25, which are all derived from intron 13 of the Mcm7 hosttranscript. Because all three are derived from the same precursor,one might expect similar expression patterns if all are processedwith similar efficiencies. miR-106b was poorly expressed at allstages (Fig. 2A). miR-93 and -25 were expressed at similar levelsat most stages (Fig. 2A). However, miR-25 was downregulated atthe DN3 to DP stages, suggesting that there was a loss in theability to process the premir-25 intermediate specifically at thesestages.Fine-mapping of miRNA subspecies also suggested altered pre-
cursor processing of some miRNAs at the DN3 to DP stages. The19- to 22-mer AAGUGCUUACAGUGCAGGU(AGU) subspecieswere the dominant miR-17-5p molecules expressed in LSK toDN2, CD4SP, and CD8SP populations (Fig. 2B). However, in DN3thymocytes, there was a shift of 2 bases 59 to the 21- to 24-merCAAAGUGCUUACAGUGCAGGU(AGU) miR-17-5p subspeciesand the appearance of miR-17-3p subspecies. This shifted by 1 baseagain 39 in DN4 and DP thymocytes to 20- to 22-mer AAA-GUGCUUACAGUGCAGGU(AGU) miR-17-5p subspecies.
FIGURE 3. Impact of altered seed sequence on predicted targets. (A) Shown are the miR-17 and miR-21 subspecies sequenced. The seed sequences are
highlighted. (B) The miR-17+1 subspecies has the same seed sequence as miR-302a and miR-106a, whereas the miR-17+2 subspecies has the same seed
sequence as miR-302c. Venn diagrams of targets predicted by Targetscan. Indicated are the numbers of targets that predicted for the annotated seed of miR-
17 (C) or miR-21 (D) and the +1 and +2 shifted seed. Overlaps indicate identical targets predicted for more than one subspecies.
The Journal of Immunology 3261

Pre–miR-21 also displayed altered processing at the DN3 to DPstages (Fig. 2C). Although most stages expressed 19- to 21-merGCUUAUCAGACUGAUGUUG(AC) miR-21-5p subspecies, thiswas shifted by 2 base positions 59 to 21- to 23-mer UAGCUUA-UCAGACUGAUGUUG(AC) in DN3 thymocytes and by 1 basein DN4 and DP thymocytes to 18- to 22-mer AGCUUAUCAGA-
CUGAUGU(UGAC). Subspecies derived from the 3p arm againappeared in DN4 and DP thymocytes.Thus, not only is miRNA maturation regulated during T cell
development but also the precise cut sites. Interestingly, for bothmaturation of the polycistron mir-106b∼25 and variable cleavagesites, the shifts occurred specifically at the DN3 to DP stages,
FIGURE 4. Mapping the structure of miRNA genes
expressed in T cells. Drosha deficiency results in the
accumulation of pri-miRNA transcripts derived from
independent transcriptional units. Shown are the
bicistronic Mir-29b-1/29a (A) and Mir-181a-1/181b-1
(B) genes in CD4+ T cells. PolyA RNAs (i.e., full-
length and spliced RNAs) were isolated from MACS-
purified CD4+ T cells obtained from DroshaF/F CD4-
cre and wild-type mice. Libraries were then con-
structed and analyzed by NGS (RNA-seq). The RNA
reads were then mapped to the mouse genome. (2),
Gene on the minus strand. Shown is the relative RNA
expression in wild-type and Drosha-deficient CD4+
T cells. Note that the neighboring protein-coding
Mkln1 gene is not affected by Drosha deficiency. (B)
RNA-seq combined with ChIP-seq for histone modi-
fication facilitates the mapping of actively transcribed
miRNA genes. ChIPs for the histone marks H3K4me3
and H3K36me3 were performed on nucleosomes iso-
lated from CD4+ T cells. Libraries were then con-
structed and analyzed by NGS (ChIP-seq). The RNA
or ChIP reads were then mapped to the mouse genome.
An H3K4me3 peak marks a promoter, whereas
H3K36me3 is broadly deposited over a gene body.
The boundary of a transcriptional unit is defined by the
interval in which both the pri-miRNA transcript
(RNAs-seq) and H3K36me3 map to, and the presence
of, an H3K4me3 peak at the 59-end. Shown are
examples of small miRNA genes Mir-17 ∼ 92a-1 (C)
andMir-142 (D); and large miRNA genesMir-30d/30b
(E) and Let7c-2/let7b (F).
3262 MicroRNA DYNAMICS IN T CELLS

suggesting that there may be specific changes to the miRNAbiogenesis machinery at this point in the T cell development.
Impact of altered miRNA precursor processing on the predictedtargets
Although miRNAs pair imperfectly with target mRNAs, pairingbetween the seed sequence (nucleotide positions 2–8) of themiRNA and target is thought to be a critical determinant (8).Altered precursor processing that result in shifts at the 59-seedsequence may therefore affect target recognition.Upon more careful examination of the miR-17 subspecies
expressed during T cell development, we found that those ex-pressed only in DN3 thymocytes corresponded to the annotatedmature miR-17 in miRBase (7). The miR-17 subspecies expressedin DN4 and DP thymocytes were shifted 39 by 1 base, whereas allother stages expressed miR-17 subspecies that were shifted 39 by 2bases compared with the annotated miR-17 (Fig. 3A). A +1 shiftresults in a seed sequence identical to that of miR-302a or miR-106a, whereas a shift of +2 results in a seed sequence identical tothat of miR-302c (Fig. 3B). Targetscan (8) predicts 827 targets formiR-17, whereas 498 targets are predicted for a +1 shift (Fig. 3C,Supplemental Table II). Of the targets predicted for miR-17+1,only 286 are also predicted targets of the annotated miR-17. Inother words, a single nucleotide change in the seed sequence ofmiR-17 changed two-thirds of the predicted targets. With a +2shift, only 132 of the same targets were predicted.For miR-21, the impact of shifted seeds on target prediction was
even more dramatic (Fig. 3D, Supplemental Table II). As withmiR-17, the miR-21 subspecies expressed in DN3 thymocytescorresponded to the mature miR-21 in miRBase (7). Only 7 of the94 predicted targets of the +1 shifted miR-21 were the same as forthe annotated miR-21. Similarly, only 7 of the 63 predicted targetsof the +2 shifted miR-21 were the same. Although only compu-tational predictions, these data suggest that altered precursorprocessing could potentially have an enormous impact on thetargets that are regulated by any single miRNA. Further geneticstudies will be required to determine whether altered maturemiRNA sequence does indeed affect target recognition this dra-matically.
The structures of miRNA genes
The dynamic miRNA expression patterns observed during T celldevelopment also suggested regulation at the level of miRNAgene transcription. In contrast to posttranscriptional processing,less is known about the transcription of miRNAs. Although up to40% of miRNAs may be derived from the introns of protein-codinggenes (16), and thus dependent on the transcription of the hostgene, most are derived from ITUs. From the few pri-miRNAtranscripts cloned previously from ITUs, we know that tran-scription is dependent on PolII and that they contain 7-methylguanosine caps and polyA tails (17, 21). However, for most ITU-derived miRNAs, the pri-miRNA transcripts have yet to be cloned.This is thought to be attributable to rapid processing of thesetranscripts by the miRNA biogenesis machinery (17).To map the structures of pri-miRNAs and miRNA genes in
T cells, we first needed to block miRNA processing and allowtranscript accumulation. We and others (13, 17, 34) have previ-ously shown that knocking out/down components of the micro-processor complex results in the accumulation of pri-miRNAtranscripts that can be detected, at least, by Northern blotting.Deletion of Drosha in T cells results in the accumulation of pri-miRNA transcripts derived from ITUs that can also be detected byRNA-seq (Fig. 4A, 4B) or by quantitative RT-PCR (data notshown). Drosha deficiency did not appear to affect the expression
of mRNAs with intron-embedded miRNAs (data not shown).RNA-seq analysis of polyA RNAs in Drosha-deficient cells thusallowed us to visualize the pri-miRNA transcripts and the structureof actively transcribed miRNA genes. We analyzed libraries fromboth CD4+ and CD8+ T cells, and ∼2 3 107 reads were obtainedfor each library.To clearly delineate the miRNA genes, we also analyzed specific
histone modifications. Barski et al. (35) have previously shownthat miRNA genes carry chromatin modifications similar to thatof protein-coding genes. Mapping of H3K4me3 peaks can there-fore be used to identify the promoters of actively transcribedmiRNA genes, whereas broadly distributed H3K36me3 shouldmark the gene body (Fig. 4C–F). From the miRNA-seq profile ofCD4SP and CD8SP cells, we identified some 70 miRNA genomicloci (Supplemental Table III). Of these, 35 were clearly locatedwithin introns of protein-coding mRNAs, 24 loci were clearlyexpressed as ITUs, and an additional 9 loci appeared to mapwithin or close to exons of protein-coding genes.Several of the 24 miRNA ITUs corresponded to previously
cloned pri-miRNAs (22, 36), including mir-17∼92a (Fig. 4B).However, to our knowledge, for the majority miRNAs, this was
FIGURE 5. Extensive splicing of pri-miRNA transcripts. (A) Location
of intron-spanning primer pairs within the Mir-29b-1/29a and Let7c-2/
let7b genes. (B) RT-PCR was performed on RNA extracted from Drosha-
deficient CD4+ T cells. PCR products were cloned and sequenced to de-
termine splice junctions. (C) Flanking RNA strands were quantified by
quantitative RT-PCR in Drosha-deficient, Dicer-deficient, and control
CD4+ T cells.
The Journal of Immunology 3263

the first demonstration of the primary transcript. Although severalmiRNA genes were only a few kilobases in length, such as Mir-142 (Fig. 4C) and Mir-146a (Supplemental Table III), most weresubstantially larger (Fig. 4D, 4E, Supplemental Table III). Thelargest, included Mir-29b-1/29a, which spanned 167.8kb, andMir-181a-2/181b-2, which spanned 111.4kb (Supplemental TableIII). Furthermore, several miRNA genes displayed more than oneH3K4me3 peak (Fig. 4E), suggesting that more than one promotermay be used by these genes.Splicing of pri-miRNA transcripts has been reported previously
(21). We found that although short pri-miRNA transcripts, such asmir-142, were not spliced, long pri-miRNAs appeared to be spliced
extensively (Fig. 4D, 4E). RT-PCR across putative introns confirmedsplicing throughout the flanking ssRNA strands (Fig. 5A, 5B).It was curious to observe so much splicing. Extensive splicing
is reminiscent of lncRNA maturation (37), in addition to protein-coding mRNAs. Thus, we wondered whether these long ssRNAsthat flank pre-miRNAs might remain in cells as mature lncRNAs.Our RNA-seq analysis had been performed on polyA-enrichedRNA. In wild-type cells, processing would cleave off theseflanking ssRNA strands and thus would not have been picked upthe oligo-dT pulldown and subsequent RNA-seq. We thereforemeasured expression by quantitative RT-PCR. However, we foundthat these flanking ssRNAs did not accumulate in either wild-type
FIGURE 6. Identification of independent pri-
miRNA transcriptional units embedded within pro-
tein-coding genes. (A) The Mir-21 gene overlaps
with 39-UTR of the overlapping protein-coding
Vmp1 gene. The pri–mir-21 transcript can be
identified as an independent transcript by the pres-
ence of an additional H3K4me3 peak (marking a
promoter) within intron 10 and RNA transcription
through introns 10 and 11 of the host Vmp1 gene.
Additional examples of miRNA genes overlapping
with protein-coding genes include Mir-700 (B),
Mir-15a/16-1 (C), and Mir-1891 (D). (E) Confir-
mation that the pri–mir-21 transcript is transcribed
independently from the overlapping protein-coding
gene. Shown are the locations of the primers used to
detect the pri–mir-21 transcript. One primer is lo-
cated within intron 10 of Vmp1, and thus specific
for pri–mir-21. (F) The pri–mir-21 transcript accu-
mulates only in Drosha-deficient CD4+ T cells, in-
dicating that it is a bona fide pri-miRNA transcript.
All analyses were performed on CD4+ T cells. (–),
Gene on the minus strand.
3264 MicroRNA DYNAMICS IN T CELLS

or Dicer-deficient cells, suggesting that they are normally de-graded following Drosha-dependent cleavage (Fig. 5C).
Independent pri-miRNA transcriptional units embedded withinprotein-coding genes
Nine loci appeared to map within or close to exons of other genes(Supplemental Table III). miR-21 is annotated within the 39-UTR(exon 12) of Vmp1 in mice (Fig. 6A). However, the presence of anH3K4me3 peak within intron 10 and RNA transcription throughintrons 10 and 11 of the Vmp1 gene suggested that miR-21 isactually derived from a short ITU that overlaps with the 39-end ofVmp1. Indeed, the same overlapping structure was reported forMIR21 and VMP1 in humans (21). Such an overlap between in-dependently transcribed miRNA and protein-coding genes was notunique. We found eight other examples (Supplemental Table III),including Mir-700, Mir-15a/16-1, and Mir-1839 (Fig. 6B–D).By using primers located within the pri–mir-21 sequence but
not exons of the overlapping Vmp1 gene (Fig. 6E), we could detectthe accumulation of the transcript in Drosha-deficient T cells(Fig. 6F), thus confirming that it is indeed a bona fide pri-miRNA transcript. Furthermore, the accumulation of RNA fromintron 10 of Vmp1 specifically within Drosha-deficient cells al-lowed us to confirmed that the H3K4me3 peak within intron 10is most likely the Mir-21 promoter.
miRNA genes display poor evolutionary sequence conservation
We next analyzed the sequence conservation of the miRNA genesexpressed in T cells to better understand the structures of thesegenes. In contrast to protein-coding genes, miRNA genes werefound to display very poor evolutionary conservation (Fig. 7A, 7B).Within the transcript itself, only the pre-miRNA portions dis-played a high degree of conservation among mammals, whereasthe remainder of the transcript displayed little or no conservation.This indicates that it is only the sequence of the stem loop underevolutionary pressure to maintain sequence. This is likely due tothe requirement for base pairings between the 5p and 3p arms toform the stem-loop structure and be process by Drosha and Dicer,and to pair with target protein-coding mRNAs.In contrast to the transcripts themselves, the regions upstream
of miRNA genes displayed substantial sequence conservation.Regions immediately 59 of transcriptional start sites, correspond-ing to the promoters of the genes, were invariably conserved (Fig.7A, 7B). We also observed numerous additional upstream peaks ofconservation that are likely to correspond to cis regulatory ele-ments. Thus, only the pre-miRNA stem-loop and cis regulatoryelements of miRNA genes are evolutionarily conserved and themajority of the RNA itself permits a large degree of sequenceflexibility.
DiscussionmiRNA dynamics and T cell development
miRNA-seq revealed substantially more dynamic miRNA ex-pression during T cell development than previously found. Severalstriking patterns were observed. First, many of the miRNAs thatwere highly expressed in BM progenitor populations, such as miR-10a, miR-99b, and so on, were downregulated by 2–3 orders ofmagnitude in thymocyte populations. A survey of miRNA-seqdata of B cell development and various other mature hematopoi-etic lineages (38) indicate that these miRNAs are also downreg-ulated in other differentiation pathways. These miRNAs maytherefore play important functions in maintaining the multipo-tential state of hematopoietic progenitors. miR-125a has beenshown previously to amplify the size and activity of hematopoieticstem cells in mice, in part, by inhibiting the expression of theproapoptotic protein Bak (39). We found that all miR-125 fam-ily members, miR-125a, miR-125b, and miR-351, were highlyexpressed in hematopoietic progenitors but then downregulated.Because all three have the same seed sequence, it is likely thatthey have similar spectra of targets. Coordinate expression inprogenitors then downregulation was also observed for miR-221and miR-222, which share the same seed sequence. miR-99a andmiR-99b also displayed this same expression pattern. Simulta-neous expression of miRNAs with shared seed sequence mayfunction as a mechanism of redundancy in hematopoietic pro-genitors.Changes in miRNA expression profiles specifically at late DN
and DP thymocyte stages were also prominent. For example, miR-181a, miR-181b, and miR-181c were all transiently upregulated.High levels of miR-181a have been reported previously for thethymus. Li et al. (40) reported expression at early DN stages andnot in DP thymocytes. In contrast, Neilson et al. (6) found highestexpression in DN4 thymocytes but overall greatest enrichment inDP thymocytes. The reason for this discrepancy is unclear but maybe due to method of detection. Li et al. analyzed miR-181a ex-pression by PCR, whereas we and the Neilson study used cloning.Regardless, miR-181a is thought to regulate the expression ofnumerous proteins important for TCR signaling and thymocyteselection, including phosphatases (40) and CD69 (6). It has alsobeen shown that miR-181a is necessary for the negative selectionof autoreactive TCRs (41), confirming its expression and functionin DP thymocytes.Although most of the changes in miRNA profiles can be at-
tributed to likely changes in pri-miRNA transcription, discrep-ancies in the expression of mature miRNAs derived from the samepolycistron suggested altered precursor processing. This appearedto change specifically at late DN and DP thymocyte stages.Likewise, precise endonucleolytic cleavage sites were also altered.
FIGURE 7. Poor evolutionary conservation of
miRNA genes. Shown is the alignment of H3K4me3
(marking the promoter) and RNA with mammalian
sequence conservation for two miRNA genes. Anal-
yses were performed on Drosha-deficient CD4+
T cells. The miRNA gene domains (pri-miRNA) are
indicated by the arrows. Note that only the regions
corresponding to the mature miRNAs, the promoter,
and a few other interspersed regions display sequence
conversion.
The Journal of Immunology 3265

It has previously been observed that miRNAs are usually expressedwith fixed 59-ends but more flexible 39-ends (42, 43). The inter-pretation was that a flexible 59-end would alter seed sequence andtherefore target genes. We found that a single homogenous pop-ulation of cells at the same stage in T cell development invariablyexpressed miRNAs with identical 59-ends. However, the preciseends could change in DN3, DN4, and/or DP thymocytes. Wefound that even a single nucleotide shift in the seed sequencedramatically affected the predicted targets (at least those predictedby Targetscan). Future genetic studies will be required to deter-mine the impact of such altered precursor processing on maturemiRNA targets. Regardless, our data imply that simply deter-mining whether a miRNA is expressed or not is insufficient forinvestigating miRNA-dependent gene regulation. It is also es-sential that the precise sequence(s) of that miRNA are known.That both polycistron processing and 59-ends were altered at
the same stages in T cell development suggests that the miRNAbiogenesis machinery may be regulated differently in this study.Interestingly, these changes appear to correlate with the pheno-types observed when Drosha or Dicer was deleted specificallywithin the T cell developmental pathway. Lack of either enzyme,and therefore miRNAs, resulted in a developmental block at theDN3 stage (12). In the case of miR-17 and miR-21, their 59-endsare generated by Drosha-mediated cleavage. Similarly, the releaseof different pre-miRNA intermediates from a common polycistronis dependent on Drosha. The Drosha complex may differ withinthymocytes at different stage of development. Cell-specific co-factors could be recruited. Indeed, p68 and p72 DEAD-box RNAhelicases have been shown to bind to Drosha and modulate theprocessing of specific miRNAs (44). Thus, miRNA expression isa complex regulated process and not simply dependent on tran-scription and inexorable processing by Drosha and Dicer.
miRNA gene structure
Previous studies have attempted to map pri-miRNA transcripts byassembling expressed sequence tags (45) or transcriptional featuressurrounding miRNA genomic locations, to predict the putativeboundaries (46). However, because most primary transcripts areefficiently processed by the microprocessor complex, mappingunobservable transcripts was obviously difficult. Although Sainiet al. (46) predicted that some miRNA genes would indeed be verylarge, we had expectedmost pri-miRNAs to be only several hundredbase pairs to a few kilobases in length, as the few characterized pri-miRNAs were within this range (17, 21). Pri-miRNA predictionbased on EST assembly also suggested this (45). This was alreadysurprisingly long, given that premiRNA intermediates are 50–70 ntand only 10 nt of ssRNA immediately 59 and 39 of the stem loop arenecessary for processing, at least in vitro (47). To our surprise, wefound that most of the miRNA genes expressed within T cells weretens of kilobases and up to a 167-kb length. Given that, on average,each miRNA gene encodes two pre-miRNA stem loops, only ∼88bp (5p + 3p of each stem loop) of each transcript is potentiallyfunctional. This means that up 99.95% of a pri-miRNA is tran-scribed, processed and then discarded.It is unclear why pri-miRNAs transcripts are so long. One
possibility is that the remaining long ssRNAs function as lncRNAs.However, the poor sequence conservation of these transcripts andtheir degradation in Drosha-sufficient cells suggest that this isunlikely. Another possibility is that flanking RNA strands are re-quired for regulated pri-miRNA processing. cis elements mightfunction from a distance to regulate the recognition and process-ing of the stem loop in an analogous manner to distal transcriptionfactor binding sites that regulate gene transcription. At leastin vitro, stem-loop–containing RNAs are not processed by Drosha
at equivalent efficiencies (12, 47). Although the majority of theseflanking ssRNA strands have poor sequence conservation, peaksof conservation were present throughout. These peaks may cor-respond to RNA cis elements critical for regulated processing.These elements might function in a cell-specific manner and couldhelp explain the variations in miRNA processing that occur duringT cell development.Our study has shown that miRNA expression during T cell
development is highly dynamic. This dynamic nature is likely tobe fundamental for controlling the transcriptional and proteomiclandscape during T cell development. It has long been recognizedthat transcription factors can both activate and repress gene ex-pression. However, with the discovery of regulatory ncRNAs, suchas miRNAs, it is clear that these transcriptional networks are morecomplicated than previously appreciated. Transcription factors thatactivate the transcription of protein-coding genes may, in someinstances, suppress targets indirectly by activating the transcriptionof regulatory miRNAs. Likewise, repressive transcription factorsmay upregulate protein expression by repressing miRNAs. Thus,a precise understanding both of protein-coding gene regulation andof miRNA (and other ncRNA) gene regulation will be fundamentalto elucidating the molecular mechanisms that control the devel-opment and function of T cells.
DisclosuresThe authors have no financial conflicts of interest.
References1. Rothenberg, E. V., J. E. Moore, and M. A. Yui. 2008. Launching the T-cell–
lineage developmental programme. Nat. Rev. Immunol. 8: 9–21.2. Klein, L., M. Hinterberger, G. Wirnsberger, and B. Kyewski. 2009. Antigen
presentation in the thymus for positive selection and central tolerance induction.Nat. Rev. Immunol. 9: 833–844.
3. Pang, K. C., M. E. Dinger, T. R. Mercer, L. Malquori, S. M. Grimmond,W. Chen, and J. S. Mattick. 2009. Genome-wide identification of long noncodingRNAs in CD8+ T cells. J. Immunol. 182: 7738–7748.
4. Landgraf, P., M. Rusu, R. Sheridan, A. Sewer, N. Iovino, A. Aravin, S. Pfeffer,A. Rice, A. O. Kamphorst, M. Landthaler, et al. 2007. A mammalian microRNAexpression atlas based on small RNA library sequencing. Cell 129: 1401–1414.
5. Monticelli, S., K. M. Ansel, C. Xiao, N. D. Socci, A. M. Krichevsky, T. H. Thai,N. Rajewsky, D. S. Marks, C. Sander, K. Rajewsky, et al. 2005. MicroRNAprofiling of the murine hematopoietic system. Genome Biol. 6: R71.
6. Neilson, J. R., G. X. Zheng, C. B. Burge, and P. A. Sharp. 2007. Dynamicregulation of miRNA expression in ordered stages of cellular development.Genes Dev. 21: 578–589.
7. Kozomara, A., and S. Griffiths-Jones. 2011. miRBase: integrating microRNAannotation and deep-sequencing data. Nucleic Acids Res. 39(Database issue):D152–D157.
8. Lewis, B. P., C. B. Burge, and D. P. Bartel. 2005. Conserved seed pairing, oftenflanked by adenosines, indicates that thousands of human genes are microRNAtargets. Cell 120: 15–20.
9. Lee, Y., C. Ahn, J. Han, H. Choi, J. Kim, J. Yim, J. Lee, P. Provost, O. Radmark,S. Kim, and V. N. Kim. 2003. The nuclear RNase III Drosha initiates microRNAprocessing. Nature 425: 415–419.
10. Hutvagner, G., J. McLachlan, A. E. Pasquinelli, E. Balint, T. Tuschl, andP. D. Zamore. 2001. A cellular function for the RNA-interference enzyme Dicerin the maturation of the let-7 small temporal RNA. Science 293: 834–838.
11. Matranga, C., Y. Tomari, C. Shin, D. P. Bartel, and P. D. Zamore. 2005.Passenger-strand cleavage facilitates assembly of siRNA into Ago2-containingRNAi enzyme complexes. Cell 123: 607–620.
12. Chong, M. M., G. Zhang, S. Cheloufi, T. A. Neubert, G. J. Hannon, andD. R. Littman. 2010. Canonical and alternate functions of the microRNA bio-genesis machinery. Genes Dev. 24: 1951–1960.
13. Chong, M. M., J. P. Rasmussen, A. Y. Rudensky, and D. R. Littman. 2008. TheRNAseIII enzyme Drosha is critical in T cells for preventing lethal inflammatorydisease. J. Exp. Med. 205: 2005–2017.
14. Liston, A., L. F. Lu, D. O’Carroll, A. Tarakhovsky, and A. Y. Rudensky. 2008.Dicer-dependent microRNA pathway safeguards regulatory T cell function. J.Exp. Med. 205: 1993–2004.
15. Zhou, X., L. T. Jeker, B. T. Fife, S. Zhu, M. S. Anderson, M. T. McManus, andJ. A. Bluestone. 2008. Selective miRNA disruption in T reg cells leads to un-controlled autoimmunity. J. Exp. Med. 205: 1983–1991.
16. Rodriguez, A., S. Griffiths-Jones, J. L. Ashurst, and A. Bradley. 2004. Identifi-cation of mammalian microRNA host genes and transcription units. GenomeRes. 14(10A): 1902–1910.
3266 MicroRNA DYNAMICS IN T CELLS

17. Lee, Y., M. Kim, J. Han, K. H. Yeom, S. Lee, S. H. Baek, and V. N. Kim. 2004.MicroRNA genes are transcribed by RNA polymerase II. EMBO J. 23: 4051–4060.
18. Corcoran, D. L., K. V. Pandit, B. Gordon, A. Bhattacharjee, N. Kaminski, andP. V. Benos. 2009. Features of mammalian microRNA promoters emerge frompolymerase II chromatin immunoprecipitation data. PLoS One 4: e5279.
19. Wang, G., Y. Wang, C. Shen, Y. W. Huang, K. Huang, T. H. Huang,K. P. Nephew, L. Li, and Y. Liu. 2010. RNA polymerase II binding patternsreveal genomic regions involved in microRNA gene regulation. PLoS One 5:e13798.
20. Ozsolak, F., L. L. Poling, Z. Wang, H. Liu, X. S. Liu, R. G. Roeder, X. Zhang,J. S. Song, and D. E. Fisher. 2008. Chromatin structure analyses identify miRNApromoters. Genes Dev. 22: 3172–3183.
21. Cai, X., C. H. Hagedorn, and B. R. Cullen. 2004. Human microRNAs are pro-cessed from capped, polyadenylated transcripts that can also function asmRNAs. RNA 10: 1957–1966.
22. Eis, P. S., W. Tam, L. Sun, A. Chadburn, Z. Li, M. F. Gomez, E. Lund, andJ. E. Dahlberg. 2005. Accumulation of miR-155 and BIC RNA in human B celllymphomas. Proc. Natl. Acad. Sci. USA 102: 3627–3632.
23. Hafner, M., P. Landgraf, J. Ludwig, A. Rice, T. Ojo, C. Lin, D. Holoch, C. Lim,and T. Tuschl. 2008. Identification of microRNAs and other small regulatoryRNAs using cDNA library sequencing. Methods 44: 3–12.
24. Markham, N. R., and M. Zuker. 2008. UNAFold: software for nucleic acidfolding and hybridization. Methods Mol. Biol. 453: 3–31.
25. Reddy, T. E., F. Pauli, R. O. Sprouse, N. F. Neff, K. M. Newberry,M. J. Garabedian, and R. M. Myers. 2009. Genomic determination of the glu-cocorticoid response reveals unexpected mechanisms of gene regulation. Ge-nome Res. 19: 2163–2171.
26. Mortazavi, A., B. A. Williams, K. McCue, L. Schaeffer, and B. Wold. 2008.Mapping and quantifying mammalian transcriptomes by RNA-Seq. Nat. Meth-ods 5: 621–628.
27. Robinson, J. T., H. Thorvaldsdottir, W. Winckler, M. Guttman, E. S. Lander,G. Getz, and J. P. Mesirov. 2011. Integrative genomics viewer. Nat. Biotechnol.29: 24–26.
28. Kent, W. J., C. W. Sugnet, T. S. Furey, K. M. Roskin, T. H. Pringle, A. M. Zahler,and D. Haussler. 2002. The human genome browser at UCSC. Genome Res. 12:996–1006.
29. Barski, A., S. Cuddapah, K. Cui, T. Y. Roh, D. E. Schones, Z. Wang, G. Wei,I. Chepelev, and K. Zhao. 2007. High-resolution profiling of histone methyl-ations in the human genome. Cell 129: 823–837.
30. Chen, C. Z., L. Li, H. F. Lodish, and D. P. Bartel. 2004. MicroRNAs modulatehematopoietic lineage differentiation. Science 303: 83–86.
31. Pruitt, K. D., T. Tatusova, W. Klimke, and D. R. Maglott. 2009. NCBI ReferenceSequences: current status, policy and new initiatives. Nucleic Acids Res. 37(Database issue): D32–D36.
32. Lowe, T. M., and S. R. Eddy. 1997. tRNAscan-SE: a program for improveddetection of transfer RNA genes in genomic sequence. Nucleic Acids Res. 25:955–964.
33. Lagos-Quintana, M., R. Rauhut, A. Yalcin, J. Meyer, W. Lendeckel, andT. Tuschl. 2002. Identification of tissue-specific microRNAs from mouse. Curr.Biol. 12: 735–739.
34. Wang, Y., R. Medvid, C. Melton, R. Jaenisch, and R. Blelloch. 2007. DGCR8 isessential for microRNA biogenesis and silencing of embryonic stem cell self-renewal. Nat. Genet. 39: 380–385.
35. Barski, A., R. Jothi, S. Cuddapah, K. Cui, T. Y. Roh, D. E. Schones, and K. Zhao.2009. Chromatin poises miRNA- and protein-coding genes for expression. Ge-nome Res. 19: 1742–1751.
36. He, L., J. M. Thomson, M. T. Hemann, E. Hernando-Monge, D. Mu, S. Goodson,S. Powers, C. Cordon-Cardo, S.W. Lowe, G. J. Hannon, and S.M.Hammond. 2005.A microRNA polycistron as a potential human oncogene. Nature 435: 828–833.
37. Guttman,M., I. Amit,M.Garber, C. French,M. F. Lin, D. Feldser,M.Huarte, O. Zuk,B. W. Carey, J. P. Cassady, et al. 2009. Chromatin signature reveals over a thousandhighly conserved large non-coding RNAs in mammals. Nature 458: 223–227.
38. Kuchen, S., W. Resch, A. Yamane, N. Kuo, Z. Li, T. Chakraborty, L. Wei,A. Laurence, T. Yasuda, S. Peng, et al. 2010. Regulation of microRNA ex-pression and abundance during lymphopoiesis. Immunity 32: 828–839.
39. Guo, S., J. Lu, R. Schlanger, H. Zhang, J. Y. Wang, M. C. Fox, L. E. Purton,H. H. Fleming, B. Cobb, M. Merkenschlager, et al. 2010. microRNA miR-125acontrols hematopoietic stem cell number. Proc. Natl. Acad. Sci. USA 107:14229–14234.
40. Li, Q. J., J. Chau, P. J. Ebert, G. Sylvester, H. Min, G. Liu, R. Braich,M. Manoharan, J. Soutschek, P. Skare, et al. 2007. miR-181a is an intrinsicmodulator of T cell sensitivity and selection. Cell 129: 147–161.
41. Ebert, P. J., S. Jiang, J. Xie, Q. J. Li, and M. M. Davis. 2009. An endogenouspositively selecting peptide enhances mature T cell responses and becomes anautoantigen in the absence of microRNA miR-181a. Nat. Immunol. 10: 1162–1169.
42. Chiang, H. R., L. W. Schoenfeld, J. G. Ruby, V. C. Auyeung, N. Spies, D. Baek,W. K. Johnston, C. Russ, S. Luo, J. E. Babiarz, et al. 2010. MammalianmicroRNAs: experimental evaluation of novel and previously annotated genes.Genes Dev. 24: 992–1009.
43. Ruby, J. G., C. Jan, C. Player, M. J. Axtell, W. Lee, C. Nusbaum, H. Ge, andD. P. Bartel. 2006. Large-scale sequencing reveals 21U-RNAs and additionalmicroRNAs and endogenous siRNAs in C. elegans. Cell 127: 1193–1207.
44. Fukuda, T., K. Yamagata, S. Fujiyama, T. Matsumoto, I. Koshida, K. Yoshimura,M. Mihara, M. Naitou, H. Endoh, T. Nakamura, et al. 2007. DEAD-box RNAhelicase subunits of the Drosha complex are required for processing of rRNAand a subset of microRNAs. Nat. Cell Biol. 9: 604–611.
45. Gu, J., T. He, Y. Pei, F. Li, X. Wang, J. Zhang, X. Zhang, and Y. Li. 2006.Primary transcripts and expressions of mammal intergenic microRNAs detectedby mapping ESTs to their flanking sequences. Mamm. Genome 17: 1033–1041.
46. Saini, H. K., A. J. Enright, and S. Griffiths-Jones. 2008. Annotation of mam-malian primary microRNAs. BMC Genomics 9: 564.
47. Han, J., Y. Lee, K. H. Yeom, J. W. Nam, I. Heo, J. K. Rhee, S. Y. Sohn, Y. Cho,B. T. Zhang, and V. N. Kim. 2006. Molecular basis for the recognition of primarymicroRNAs by the Drosha-DGCR8 complex. Cell 125: 887–901.
The Journal of Immunology 3267