Mapping resting-state functional connectivity using perfusion MRI
Upload
independentCategory
view
0download
0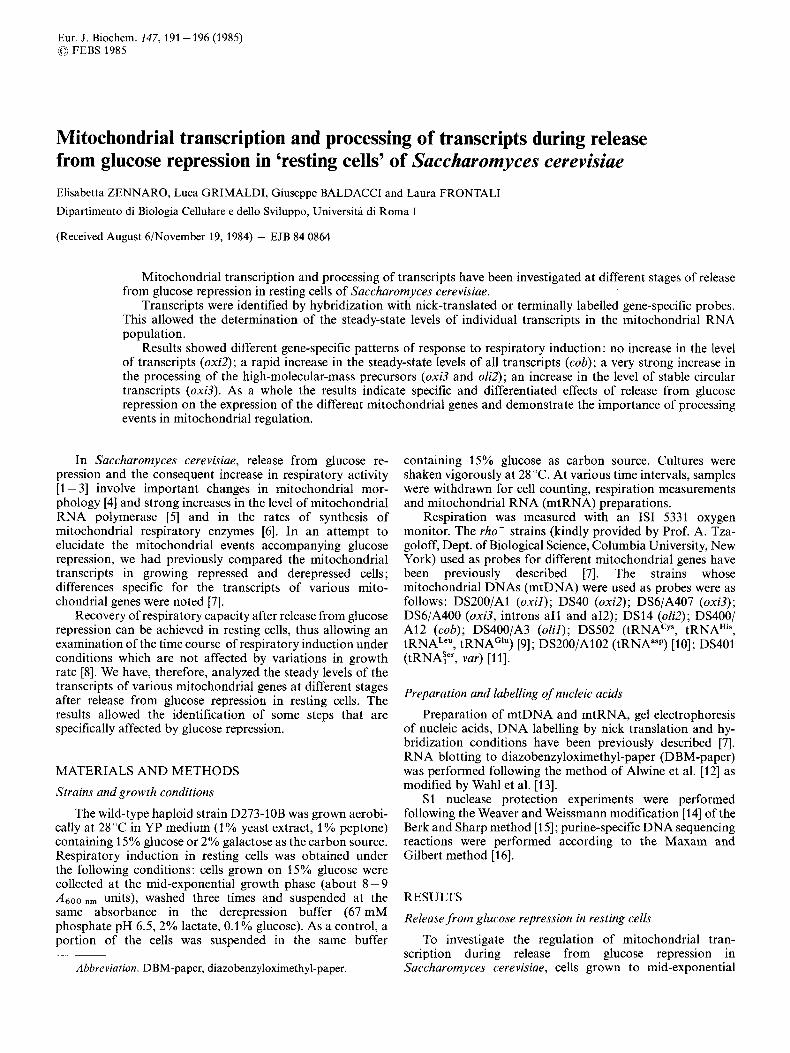
Eur. J. Biochem. 147,191 -196 (1985) 0 FEBS 1985
Mitochondrial transcription and processing of transcripts during release from glucose repression in 'resting cells' of Saccharomyces cerevisiae Elisabetta ZENNARO, Luca GRIMALDI, Giuseppe BALDACCI and Laura FRONTAL1 Dipartimento di Biologia Cellulare e dello Sviluppo, Universita di Roma I
(Received August 6/November 19, 1984) - EJB 84 0864
Mitochondria1 transcription and processing of transcripts have been investigated at different stages of release from glucose repression in resting cells of Saccharomyces cerevisiae.
Transcripts were identified by hybridization with nick-translated or terminally labelled gene-specific probes. This allowed the determination of the steady-state levels of individual transcripts in the mitochondrial RNA population.
Results showed different gene-specific patterns of response to respiratory induction: no increase in the level of transcripts (oxi2); a rapid increase in the steady-state levels of all transcripts (cob); a very strong increase in the processing of the high-molecular-mass precursors (oxi3 and oli2); an increase in the level of stable circular transcripts (oxi3). As a whole the results indicate specific and differentiated effects of release from glucose repression on the expression of the different mitochondrial genes and demonstrate the importance of processing events in mitochondrial regulation.
In Saccharomyces cerevisiae, release from glucose re- pression and the consequent increase in respiratory activity [I - 31 involve important changes in mitochondrial mor- phology [4] and strong increases in the level of mitochondrial RNA polymerase [5] and in the rates of synthesis of mitochondrial respiratory enzymes [6]. In an attempt to elucidate the mitochondrial events accompanying glucose repression, we had previously compared the mitochondrial transcripts in growing repressed and derepressed cells; differences specific for the transcripts of various mito- chondrial genes were noted [7].
Recovery of respiratory capacity after release from glucose repression can be achieved in resting cells, thus allowing an examination of the time course of respiratory induction under conditions which are not affected by variations in growth rate [8]. We have, therefore, analyzed the steady levels of the transcripts of various mitochondrial genes at different stages after release from glucose repression in resting cells. The results allowed the identification of some steps that are specifically affected by glucose repression.
MATERIALS AND METHODS
Strains and growth conditions
The wild-type haploid strain D273-1 OB was grown aerobi- cally at 28 "C in YP medium (1 % yeast extract, 1 YO peptone) containing 15% glucose or 2% galactose as the carbon source. Respiratory induction in resting cells was obtained under the following conditions: cells grown on 15% glucose were collected at the mid-exponential growth phase (about 8 - 9 A600 nm units), washed three times and suspended at the same absorbance in the derepression buffer (67 mM phosphate pH 6.5, 2% lactate, 0.1 % glucose). As a control, a portion of the cells was suspended in the same buffer
Abbreviation. DBM-paper, diazobenzyloximethyl-paper.
containing 15% glucose as carbon source. Cultures were shaken vigorously at 28 "C. At various time intervals, samples were withdrawn for cell counting, respiration measurements and mitochondrial RNA (mtRNA) preparations.
Respiration was measured with an IS1 5331 oxygen monitor. The rho- strains (kindly provided by Prof. A. Tza- goloff, Dept. of Biological Science, Columbia University, New York) used as probes for different mitochondrial genes have been previously described [7]. The strains whose mitochondrial DNAs (mtDNA) were used as probes were as follows: DS200/A1 (oxi l ) ; DS40 (oxi2); DS6/A407 (oxi3); DS6/A400 (oxi3, introns a11 and aI2); DS14 (oli2); DS400/ A12 (cob); DS400/A3 (olil); DS502 (tRNACyS, tRNAHiS, tRNALeU, tRNAG'") [9]; DS200/A102 (tRNAasP) [lo]; DS401 (tRNAp, var) [ll].
Preparation and labelling of nucleic acids
Preparation of mtDNA and mtRNA, gel electrophoresis of nucleic acids, DNA labelling by nick translation and hy- bridization conditions have been previously described [7]. RNA blotting to diazobenzyloximethyl-paper (DBM-paper) was performed following the method of Alwine et al. [12] as modified by Wahl et al. [13].
S1 nuclease protection experiments were performed following the Weaver and Weissmann modification [14] of the Berk and Sharp method [I 51; purine-specific DNA sequencing reactions were performed according to the Maxam and Gilbert method [16].
RESULTS
Release from glucose repression in resting cells
To investigate the regulation of mitochondrial tran- scription during release from glucose repression in Saccharomyces cerevisiae, cells grown to mid-exponential

192
a b o x i 2 oli 2
C o x i 1
d o l i 1
- -
3.6- - -
2.2-
1.6- 4.5-
4-
0.85-
0 30' 90' 180' 0 30' 90' 180' 0 30' 90' 180'
1.7-
0.9 -
0 30' 90' 180'
Fig. 1 . Autoradiograms of oxi2, oli2, oxil and olil gene transcripts during release from glucose repression. At the indicated times (0, 30,90 and 180 min) during respiratory induction cells were harvested and mtRNA was prepared. 10 pg RNA was loaded in each slot of 1.5% agarose/ 6 M urea gels, electrophoresed, blotted to nitrocellulose and hybridized with nick-translated gene-specific probes from the following petite mutants: (a) DS40 (oxi2); (b) DS14 (oli2); (c) DS200/A1 (oxi l ) ; (d) DS400/A3 (olil). To the left of each panel, the approximate RNA sizes are indicated in nucleotides x Mitochondria1 21-S rRNA (3200 nucleotides) and 15-S rRNA (1600 nucleotides) were used as size calibration markers
phase in 15% glucose were washed and transferred to buffered 2% lactate. At various time intervals aliquots were withdrawn, oxygen uptake was measured and mitochondrial RNA was prepared. Increase in the Qo, started after 90- 120 min and continued for about 5 h under our conditions.
The same amount of each mtRNA preparation (10 pg) was electrophoresed on 1.5% agarose/6 M urea gels, blotted onto nitrocellulose or DBM-paper and used for hybridization with different mitochondrial gene probes. Therefore, we examined the differences in the levels of the various transcripts relative to a constant amount of mtRNA.
Transcripts of the oxil, oxi2, olil and oli2 genes
Fig. 1 shows the autoradiograms of mtRNA prepared at the indicated times after the shift to buffered lactate, electrophoresed and hybridized with the 32P-labelled mtDNA of the following rho- mutants: DS40 (retaining the oxi2 gene, Fig. 1 a); DS14 (retaining the oli2 gene, Fig. 1 b); DS200/A1 (retaining the oxil gene, Fig. 1 c); DS400/A3 (retaining the olil gene, Fig. 1 d). The most evident band (3.6 x lo3 bases) hybridizing with the oxi2 probe (Fig. 1 a) corresponds to the mRNA of this gene [17]; its amount did not change in the course of respiratory induction and no changes were observed in the fainter bands detected with this probe.
The two most evident oli2 gene transcripts (Fig. 1 b) were 4 x lo3 and 4.5 x lo3 bases in length respectively; these sizes are in agreement with those previously reported for oli2 transcripts [18,19]. There was no significant variation in their intensities in the course of respiratory induction. Some higher- molecular-mass bands, which probably represent partially processed precursor RNAs, were visible and the largest such transcripts were detected only in glucose-repressed cells (0 min). This result might indicate that respiratory induction allows a rapid RNA processing which, however, does not lead to increase in mRNA concentrations, but rather to accumulation of partially processed precursor forms. The pat- tern of oxil transcripts (Fig. Ic) was very similar to that described by Cozuzzi et al. [20]. There was a clear increase in the steady-state level of mRNA (0.85 x lo3 bases) and of the
1.6 x 10³-base transcript, while the higher-molecular-mass RNA precursors were maintained at constant levels or in- creased only slightly in amount during respiratory induction.
The hybridization pattern of olil transcripts (Fig. 1 d) showed the induction of the 0.9 x 10³-base transcript, which corresponds to the olil mRNA [21]. The amount of a 1.7 x 10³-base band also increased, albeit less strongly. As a whole, the results obtained with olil and oxil probes showed increasing levels of mRNA and precursor species after respi- ratory induction, suggesting that both transcription and processing are involved in regulating the expression of these genes.
Transcripts of the oxi3, cob and varl genes
Fig. 2a shows the hybridization pattern obtained with a cob gene probe. A strong increase in the levels of all transcripts was evident within the first 30min after transfer to lactate medium. A precursor of 5 x lo3 bases was observed only after 180 min of induction. The induction of cob gene expression seemed to be mainly due to a rapid increase in the rate of transcription. Alternatively, these RNA species might be more stable under these conditions and accumulate for that reason. This would imply the existence of specific nucleolytic activities. The cob probe also hybridized with a 1.7 x lo3- base band whose level increased greatly during respiratory induction. The repeat unit of mtDNA from strain DS400/A12, which was used to prepare this probe, contains an extragenic region overlapping by about 300 bases the transcribed olil gene region. Therefore, it is possible that the 1.7 x 10³-base band is the same as that observed with the olil probe.
To examine oxi.? transcripts (Fig. 2b), we used two probes retaining different parts of the gene: DS6/A407 mtDNA (containing the A4-AS-A6 exons and a14-a15 introns) was used as an exonic probe and DS6/A400 mtDNA (containing a11 intron and part of a12 intron), was used as an intronic probe; the mini-exon A2 (36 bases) present in the second probe is too small to allow hybridization to oxi3 mRNA. Using the first probe, the hybridization pattern of mtRNA
193
a cob
5 - 4 3- 2 9-
2 2 . 17- =
' * * 0
.. .' * . 0 30' 90' 180
o x i 3 b C
var 1
- 2 4
1 6 * * Q i ; 1 9
-2.5 - 1 4 1.9-
* - 1
1-
0' 30' 90' 180' 0' 30' 90' 180' 0' 30' 90' 180'
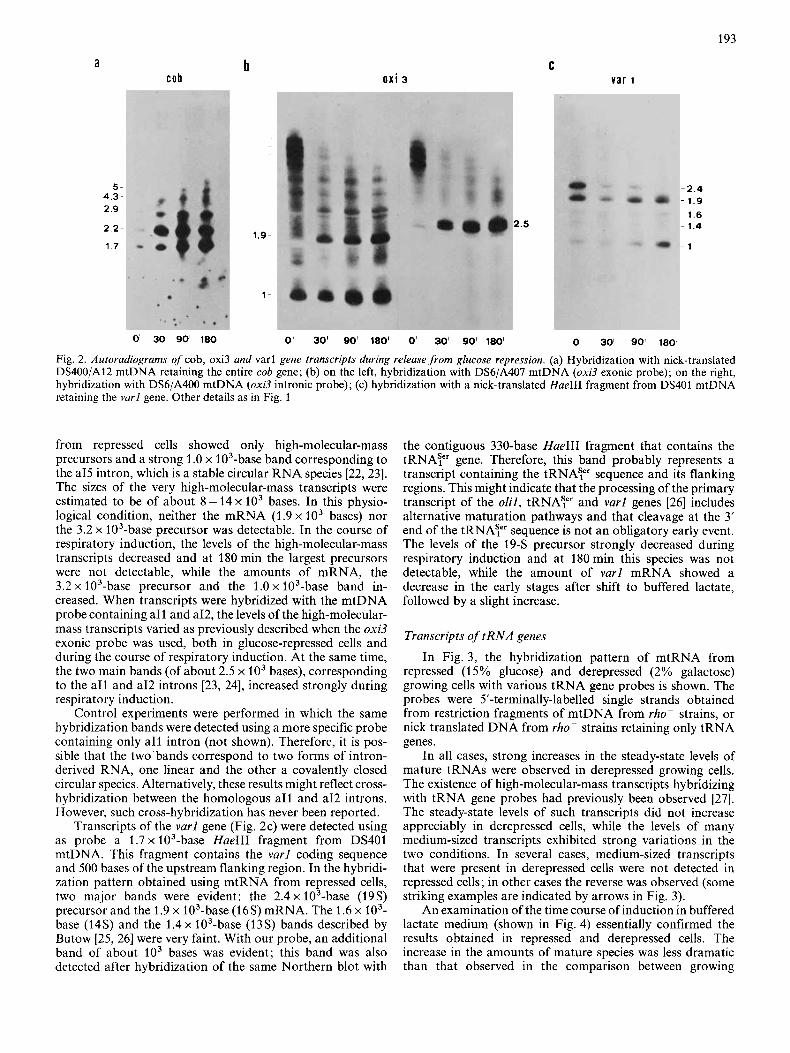
Fig. 2. Autoradiograms of cob, oxi3 and varl gene transcripts during release from glucose repression. (a) Hybridization with nick-translated DS400/A12 mtDNA retaining the entire cob gene; (b) on the left, hybridization with DS6/A407 mtDNA (oxi3 exonic probe); on the right, hybridization with DS6/A400 mtDNA (oxi3 intronic probe); (c) hybridization with a nick-translated HaeIII fragment from DS401 mtDNA retaining the varl gene. Other details as in Fig. 1
from repressed cells showed only high-molecular-mass precursors and a strong 1 .O x 103-base band corresponding to the a15 intron, which is a stable circular RNA species [22,23]. The sizes of the very high-molecular-mass transcripts were estimated to be of about 8 - 14 x lo3 bases. In this physio- logical condition, neither the mRNA (1.9 x lo3 bases) nor the 3.2 x 10³-base precursor was detectable. In the course of respiratory induction, the levels of the high-molecular-mass transcripts decreased and at 180 min the largest precursors were not detectable, while the amounts of mRNA, the 3.2 x 10³-base precursor and the 1.0 x 10³-base band in- creased. When transcripts were hybridized with the mtDNA probe containing a11 and a12, the levels of the high-molecular- mass transcripts varied as previously described when the oxi3 exonic probe was used, both in glucose-repressed cells and during the course of respiratory induction. At the same time, the two main bands (of about 2.5 x lo3 bases), corresponding to the a11 and a12 introns [23, 241, increased strongly during respiratory induction.
Control experiments were performed in which the same hybridization bands were detected using a more specific probe containing only a11 intron (not shown). Therefore, it is pos- sible that the two bands correspond to two forms of intron- derived RNA, one linear and the other a covalently closed circular species. Alternatively, these results might reflect cross- hybridization between the homologous a11 and a12 introns. However, such cross-hybridization has never been reported.
Transcripts of the varl gene (Fig. 2c) were detected using as probe a 1 . 7 ~ 103-base HaeIII fragment from DS401 mtDNA. This fragment contains the varl coding sequence and 500 bases of the upstream flanking region. In the hybridi- zation pattern obtained using mtRNA from repressed cells, two major bands were evident: the 2.4 x 10³-base (19s) precursor and the 1.9 x 10³-base (16s) mRNA. The 1.6 x lo3- base (14s) and the 1 . 4 ~ 103-base (13s) bands described by Butow [25, 261 were very faint. With our probe, an additional band of about lo3 bases was evident; this band was also detected after hybridization of the same Northern blot with
the contiguous 330-base HaeIII fragment that contains the tRNAY gene. Therefore, this band probably represents a transcript containing the t R N A p sequence and its flanking regions. This might indicate that the processing of the primary transcript of the olil, tRNAyr and varl genes [26] includes alternative maturation pathways and that cleavage at the 3' end of the tRNAY sequence is not an obligatory early event. The levels of the 19-S precursor strongly decreased during respiratory induction and at 180min this species was not detectable, while the amount of varl mRNA showed a decrease in the early stages after shift to buffered lactate, followed by a slight increase.
Transcripts of tRNA genes
In Fig. 3, the hybridization pattern of mtRNA from repressed (1 5% glucose) and derepressed (2% galactose) growing cells with various tRNA gene probes is shown. The probes were 5'-terminally-labelled single strands obtained from restriction fragments of mtDNA from rho- strains, or nick translated DNA from rho- strains retaining only tRNA genes.
In all cases, strong increases in the steady-state levels of mature tRNAs were observed in derepressed growing cells. The existence of high-molecular-mass transcripts hybridizing with tRNA gene probes had previously been observed [27]. The steady-state levels of such transcripts did not increase appreciably in derepressed cells, while the levels of many medium-sized transcripts exhibited strong variations in the two conditions. In several cases, medium-sized transcripts that were present in derepressed cells were not detected in repressed cells; in other cases the reverse was observed (some striking examples are indicated by arrows in Fig. 3).
An examination of the time course of induction in buffered lactate medium (shown in Fig. 4) essentially confirmed the results obtained in repressed and derepressed cells. The increase in the amounts of mature species was less dramatic than that observed in the comparison between growing

194
@ R D
@ R D
0 R D
@ R D
3 -
2.2 -
1.6 -
- 4.4 - 3.9
0.9-
0.35 -
CY S his g lu+ leu asp Fig. 3. tRNA transcripts in repressed ( R ) and derepressed ( D ) cells. Autoradiograms of mtRNA from wild-type cells grown on 15% glucose (R) or 2% galactose (D) hybridized with the indicated tRNA genes are shown. (a-c) Hybridization with single-stranded 5'-end labelled TaqI fragments from DS502 mtDNA retaining the tRNACYs, tRNAHiE and tRNAG'"+L'" genes, respectively. (d) Hybridization with nick-translated DS200/A102 mtDNA retaining the tRNAasP gene. 10 Fg RNA was loaded in each slot of a 1.5% agarose/6 M urea gel, electrophoresed and blotted to DBM-paper. Approximate sizes in nucleotides x are indicated
C d tRNA 9'"' leu tRNA asp tRNAISer
a b t RNA 'Ys
4.4 3.9
0' 30' 90' 180' 0' 30' 90' 180' 0' 30' 90' 180 0 ' 30' 90' 180'
Fig. 4. tRNAcys, tRNAG'n+Leu, tRNAaSP and tRNAS," transcripts during release from glucose repression. (a-c) The same probes as described in Fig. 3 were used. (d) Hybridization with a nick-translated HaeIII fragment fmm DS401 mtDNA retaining the t R N A y gene. Other details are as in Fig. 1
195
G G G
A D R A D R A D R + + +
I,
c u, c
UUU I TI m
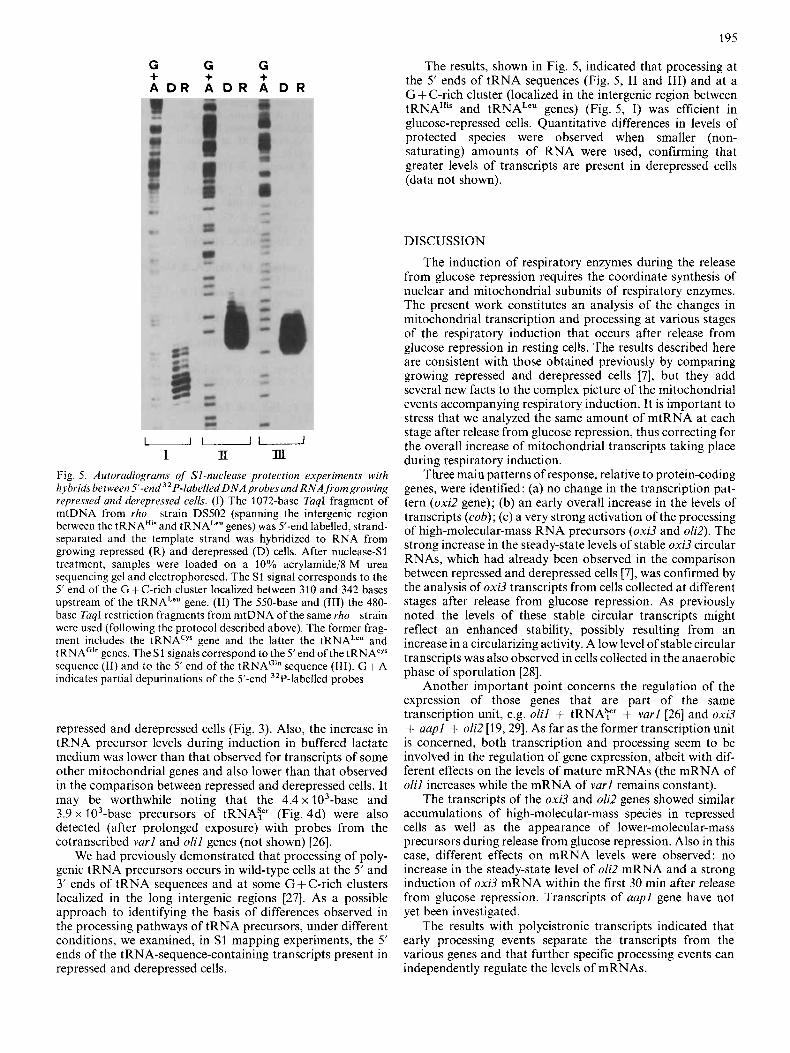
Fig. 5. Autoradiograms of Sl-nuclease protection experiments with hybrids between Y-end 3 2 P-labelled D N A probes and RNA fromgrowing repressed and derepressed cells. (I) The 1072-base TaqI fragment of mtDNA from rho- strain DS502 (spanning the intergenic region between the tRNA"" and tRNALe" genes) was 5'-end labelled, strand- separated and the template strand was hybridized to RNA from growing repressed (R) and derepressed (D) cells. After nuclease-S1 treatment, samples were loaded on a 10% acrylamide/8 M urea sequencing gel and electrophoresed. The S1 signal corresponds to the 5' end of the G + C-rich cluster localized between 310 and 342 bases upstream of the tRNALe" gene. (11) The 550-base and (111) the 480- base Taql restriction fragments from mtDNA of the same rho- strain were used (following the protocol described above). The former frag- ment includes the tRNACyr gene and the latter the tRNAL'" and tRNAG'" genes. The S1 signals correspond to the Send of the tRNACYS sequence (11) and to the 5' end of the tRNAG'" sequence (111). G + A indicates partial depurinations of the 5'-end 3ZP-labelled probes
repressed and derepressed cells (Fig. 3). Also, the increase in tRNA precursor levels during induction in buffered lactate medium was lower than that observed for transcripts of some other mitochondrial genes and also lower than that observed in the comparison between repressed and derepressed cells. It may be worthwhile noting that the 4.4 x 10³-base and 3.9 x 10³-base precursors of tRNAy (Fig. 4d) were also detected (after prolonged exposure) with probes from the cotranscribed varl and olil genes (not shown) [26].
We had previously demonstrated that processing of poly- genic tRNA precursors occurs in wild-type cells at the 5' and 3' ends of tRNA sequences and at some G+C-rich clusters localized in the long intergenic regions [27]. As a possible approach to identifying the basis of differences observed in the processing pathways of tRNA precursors, under different conditions, we examined, in S1 mapping experiments, the 5' ends of the tRNA-sequence-containing transcripts present in repressed and derepressed cells.
The results, shown in Fig. 5, indicated that processing at the 5' ends of tRNA sequences (Fig. 5, I1 and 111) and at a G + C-rich cluster (localized in the intergenic region between tRNAHis and tRNALe" genes) (Fig. 5, I) was efficient in glucose-repressed cells. Quantitative differences in levels of protected species were observed when smaller (non- saturating) amounts of RNA were used, confirming that greater levels of transcripts are present in derepressed cells (data not shown).
DISCUSSION
The induction of respiratory enzymes during the release from glucose repression requires the coordinate synthesis of nuclear and mitochondrial subunits of respiratory enzymes. The present work constitutes an analysis of the changes in mitochondrial transcription and processing at various stages of the respiratory induction that occurs after release from glucose repression in resting cells. The results described here are consistent with those obtained previously by comparing growing repressed and derepressed cells [7], but they add several new facts to the complex picture of the mitochondrial events accompanying respiratory induction. It is important to stress that we analyzed the same amount of mtRNA at each stage after release from glucose repression, thus correcting for the overall increase of mitochondrial transcripts taking place during respiratory induction.
Three main patterns of response, relative to protein-coding genes, were identified: (a) no change in the transcription pat- tern (oxi2 gene); (b) an early overall increase in the levels of transcripts (cob); (c) a very strong activation of the processing of high-molecular-mass RNA precursors (oxi3 and oli2). The strong increase in the steady-state levels of stable oxi3 circular RNAs, which had already been observed in the comparison between repressed and derepressed cells [7], was confirmed by the analysis of oxi3 transcripts from cells collected at different stages after release from glucose repression. As previously noted the levels of these stable circular transcripts might reflect an enhanced stability, possibly resulting from an increase in a circularizing activity. A low level of stable circular transcripts was also observed in cells collected in the anaerobic phase of sporulation [28].
Another important point concerns the regulation of the expression of those genes that are part of the same transcription unit, e.g. olil + tRNA?' + varl [26] and oxi3 + aapl + oli2 [19,29]. As far as the former transcription unit is concerned, both transcription and processing seem to be involved in the regulation of gene expression, albeit with dif- ferent effects on the levels of mature mRNAs (the mRNA of olil increases while the mRNA of varl remains constant).
The transcripts of the oxi3 and oli2 genes showed similar accumulations of high-molecular-mass species in repressed cells as well as the appearance of lower-molecular-mass precursors during release from glucose repression. Also in this case, different effects on mRNA levels were observed: no increase in the steady-state level of oli2 mRNA and a strong induction of oxi3 mRNA within the first 30 min after release from glucose repression. Transcripts of aapl gene have not yet been investigated.
The results with polycistronic transcripts indicated that early processing events separate the transcripts from the various genes and that further specific processing events can independently regulate the levels of mRNAs.
196
The analysis of tRNA gene transcripts in growing repressed and derepressed cells showed the presence of many tRNA precursors and of a complex maturation process that is affected by glucose repression; also, the level of mature tRNAs was greatly reduced in glucose repressed as compared to respiring cells. During release from glucose repression in resting cells, no significant increase in the levels of mature tRNAs was observed and only a slight induction of tRNA precursors was noted. A very small increase in the steady-state level of mRNA was also observed for the only mitochondrial gene coding for a ribosomal protein v a r l . Therefore, for the synthesis of these components of the mitochondrial trans- lation machinery (varl, tRNAs), much stronger effects were observed in the comparison between repressed and derepressed growing cells than in the course of respiratory induction in resting cells. This is consistent with previous results obtained from the study of translation products [6], indicating the possible existence of a control mechanism connected with cell proliferation and not operating in resting cells.
As a whole, the data indicate a very complex pattern of events regulating the expression of the various mitochondrial genes, probably implying the participation of several nuclear factors.
Since only one form of mitochondrial RNA polymerase [30] has so far been identified, a selective increase in the transcription of certain genes suggests the existence of different mtDNA sequences involved in promoting transcription at the various initiation sites. Our results, although indicating a selective increase in the transcription of specific mitochondrial genes, do not allow the resolution of this point; in fact, only steady-state levels of transcripts were measured and therefore differential stability of transcripts under the various physio- logical conditions cannot be excluded. On the other hand, significant and specific effects of release from glucose re- pression on certain steps in the processing of mitochondrial transcripts have been observed. This is consistent with the existence of a large set of specific splicing and processing enzymes, which probably undergo regulated variations in re- sponse to changes in environmental conditions.
We wish to thank Prof. A. Tzagoloff who kindly supplied us the rho- mutants. This work was supported by Consiglio Nazionale della Ricerche, Progetto Finalizzato Chimica Fine e Secondaria and partially by the Foundation Istituto Pasteur-Fondazione Cenci Bolognetti.
REFERENCES 3 . Slonimski, P. (1953) La formation des enzymes respiratoires chez
2. Perlman, P. S. & Mahler, H. R. (1974) Arch. Biochem. Biophys.
3. Mahler, H. R., Bastos, R. N., Feldman, F., Flury, V., Lin, C. C., Perlman, P. S. & Phan, S. H. (1975) in Membrane biogenesis (Tzagoloff, A., ed.) pp. 15-61, Plenum Press, New York.
la levure, Masson et Cie, Paris.
162,248 - 271.
E. Zennaro, L. Grimaldi, G. Baldacci and L. Frontali, Dipartimento di Biologia Cellulare e dello Sviluppo, Universita di Roma I, Piazzale Aldo Moro 5,1-00185 Roma, Italy
4. Stevens, B. J. (1977) Biol. Cell. 29, 37-56. 5. Levens, D., Lustig, A,, Ticho, B., Synenki, R., Merten, S.,
Christianson, T., Locker, J. & Rabinowitz, M. (1980) in The organization and expression of the mitochondria1 genome (Kroon, A. H. & Saccone, C., eds) pp. 265-276, Elsevier/ North-Holland Biochemical Press, Amsterdam.
6. Falcone, C., Agostinelli, M. & Frontah, L. (1983) J . Bacteriol.
7. Baldacci, G. & Zennaro, E. (1982) Eur. J . Biochem. 127, 41 1 -
8. Agostinelli, M., Falcone, C., Frontali, L. & Sacco, M. (1980)
9. Berlani, R. E., Bonitz, S. G., Coruzzi, G., Nobrega, M. &
10. Bonitz, S. G. & Tzagoloff, A. (1980) J. Biol. Chern. 255, 9075-
11. Tzagoloff, A,, Nobrega, M., Akai, A. & Macino, G. (1980) Curr.
12. Alwine, J. C., Keny, J. D. & Stark, G. R. (1977) Proc. Natl Acad.
13. Wahl, G. M., Stern, M. & Stark, G. R. (1979) Proc. Natl Acad.
14. Weaver, F. & Weissmann, C. (1979) Nucleic Acid Res. 7, 1175-
15. Berk, A. J. & Sharp, P. A. (1977) Cell 12, 721 -732. 16. Maxam, A. M. & Gilbert, W. (1980) Methods Enzymol. 65,499-
17. Thalenfeld, B. E., Hill, J. & Tzagoloff, A. (1983) J. Biol. Chern.
18. Cobon, G. S., Beilharz, M. W., Linnane, A. W. & Nagley, P. (1982) Curr. Genet. 5, 97-107.
19. Faye, G. & Simon, M. (1983) in Mitochondria 1983 nucleo- mitochondrial interactions (Schweyen, R. J., Wolf, K. & Kaudewitz, F., eds) pp. 433-439, Walter de Gruyter, Berlin, New York.
20. Coruzzi, G., Bonitz, S. G., Thalenfeld, B. E. & Tzagoloff, A. (1981) J. Biol. Chem. 256, 12780- 12787.
21. Thalenfeld, B. E., Bonitz, S. G., Nobrega, F. G., Macino, G. & Tzagoloff, A. (1983) J . Biol. Chem. 258, 14065- 14068.
22. Arnberg, A. C., Van Ommen, G. J . B., Grivell, L. A., Van Bruggen, E. F. J. & Borst, P. (1980) Cell 19, 313-319.
23. Hensgens, L. A. M., Arnberg, A. C., Roosendaal, E., Van der Horst, G., Van der Veen, R., Van Ommen, G. J. B. & Grivell, L. A. (1983) J . Mol. Biol. 164, 35-58.
24. Bonitz, S. G., Coruzzi, G., Thalenfeld, B. E., Tzagoloff, A. & Macino, G. (1980) J . Biol. Chem. 255, 11 927 - 11 941.
25. Farrelly, F., Zassenhaus, H. P. & Butow, R. A. (1982) J . Biol. Chem. 257,6581 -6587.
26. Zassenhaus, H. P., Martin, N. C. & Butow, R. A. (1984) J . Biol. Chem. 259,6019-6027.
27. Palleschi, C., Francisci, S., Zennaro, E. & Frontali, L. (1984)
28. Schroeder, R., Breitenbach, M. & Schweyen, R. J. (1983) Nucleic
29. Osinga, K. A,, De Vries, E., Van der Horst, G. & Tabak, H. F.
30. Levens, D., Morimoto, R. & Rabinowitz, M. (1981) J . Biol.
153, 1125-1132.
416.
Bull. Mol. Biol. Med. 5, 104- 112.
Tzagoloff, A. (1980) Nucleic Acid Res. 8, 5017-5030.
9081.
Genet. 2, 149 - 157.
Sci. USA 74,5350-5354.
Sci. USA 76,3683 - 3687.
1193.
560.
258,610-615.
EMBO J . 3, 1389-1395.
Acid Res. 11, 1735-1746.
(1984) EMBO J . 3, 829-834.
Chem. 256.1466- 1473.
Copyright © 2022 FDOKUMEN