Development and use of an instrument to measure students’ perceptions of a business statistics...
16
ORIGINAL PAPER Development and use of an instrument to measure students’ perceptions of a business statistics learning environment in higher education Thuyuyen H. Nguyen 1 • Michael Newby 1 • Panayiotis G. Skordi 1 Received: 25 October 2013 / Accepted: 5 May 2014 / Published online: 26 July 2015 Ó Springer Science+Business Media Dordrecht 2015 Abstract Statistics is a required subject of study in many academic disciplines, including business, education and psychology, that causes problems for many students. This has long been recognised and there have been a number of studies into students’ attitudes towards statistics, particularly statistical anxiety. However, none of these studies investigated the classroom learning environment in relation to students’ attitudes towards statistics. This paper describes the development and validation of two new instruments, the Business Statistics Computer Laboratory Environment Inventory and the Attitude towards Business Statistics instrument. The former measures appropriate aspects of the learning environment of a computer-based statistics class, whilst the latter measures students’ attitudes towards business statistics. The instruments were administered to undergraduate business students at a university in Southern California. When exploratory factor analysis was carried out, it was found that the items of both instruments loaded onto their a priori scales. All the scales exhibited both internal reliability and discriminant validity. Correlation analysis between the scales of the two instruments demonstrated a strong relationship between aspects of the learning environment and students’ attitudes towards business statistics. Keywords Attitude Á Business statistics Á Computer-based learning environments Á Instrument & Michael Newby [email protected] 1 Information Systems and Decision Sciences, California State University Fullerton, 800 N. State College Blvd., Fullerton, CA 92831-3599, USA 123 Learning Environ Res (2015) 18:409–424 DOI 10.1007/s10984-015-9192-3
Transcript of Development and use of an instrument to measure students’ perceptions of a business statistics...

ORI GIN AL PA PER
Development and use of an instrument to measurestudents’ perceptions of a business statistics learningenvironment in higher education
Thuyuyen H. Nguyen1 • Michael Newby1 •
Panayiotis G. Skordi1
Received: 25 October 2013 / Accepted: 5 May 2014 / Published online: 26 July 2015� Springer Science+Business Media Dordrecht 2015
Abstract Statistics is a required subject of study in many academic disciplines, including
business, education and psychology, that causes problems for many students. This has long
been recognised and there have been a number of studies into students’ attitudes towards
statistics, particularly statistical anxiety. However, none of these studies investigated the
classroom learning environment in relation to students’ attitudes towards statistics. This
paper describes the development and validation of two new instruments, the Business
Statistics Computer Laboratory Environment Inventory and the Attitude towards Business
Statistics instrument. The former measures appropriate aspects of the learning environment
of a computer-based statistics class, whilst the latter measures students’ attitudes towards
business statistics. The instruments were administered to undergraduate business students
at a university in Southern California. When exploratory factor analysis was carried out, it
was found that the items of both instruments loaded onto their a priori scales. All the scales
exhibited both internal reliability and discriminant validity. Correlation analysis between
the scales of the two instruments demonstrated a strong relationship between aspects of the
learning environment and students’ attitudes towards business statistics.
Keywords Attitude � Business statistics � Computer-based learning environments �Instrument
& Michael [email protected]
1 Information Systems and Decision Sciences, California State University Fullerton, 800 N. StateCollege Blvd., Fullerton, CA 92831-3599, USA
123
Learning Environ Res (2015) 18:409–424DOI 10.1007/s10984-015-9192-3

Introduction
Statistics is a subject that is studied in high school, as well as at university from the
undergraduate to the doctoral levels. In higher education, it is a required course for a large
number of disciplines including actuarial science, business, econometrics, epidemiology,
environmental studies, geology, engineering and psychology. In all of these fields, statistics
is used as a tool to analyse and summarise large amounts of data. In other words, because
these disciplines use applied statistics, statistics is seen as a service subject in the teaching
context. Many students do not know why they have to take a course in statistics or how it is
related to their main discipline (Petocz and Reid 2005). One student in an earlier study by
Petocz (1998) was reported as saying: ‘‘Statistics is something strange and useless. I was
studying engineering, and didn’t know why I had to study statistics’’. Even when students
have some appreciation of the importance of statistics in their future courses and careers,
they tend to dismiss it as being dull, boring and tedious and most students would not study
it if it were not compulsory (Gordon 2004). It would seem that many students view
statistics courses as something that they have to pass so that they can proceed to focus on
the real subjects in their degree programme.
In most business degree programmes, at least one statistics course is mandatory, and this
is certainly the case for those programmes that are accredited. The purpose of such courses
is to provide skills in ‘‘statistical data analysis and management science as they support
decision-making processes throughout an organization’’ (Association to Advance Colle-
giate Schools of Business [AACSB] 2012). Unfortunately, many students find statistics
very difficult, causing them anxiety which can result in poor performance and lead to
business statistics courses having relatively high failure rates (Cook 2010). This is not a
recent phenomenon (Williams et al. 2008) but, with the increase in the number of
undergraduate and graduate business degree programmes over the past three decades, it is
becoming more prevalent. One interesting observation that has been made is that, although
statistics is a subject requiring mathematics, business statistics is not a subject that can be
taught in the same way as mathematics (Ramsey 1999). Just getting an answer is not
enough; that answer has to be interpreted to determine what it means in the context of the
application. In addition, many students believe that there is one correct answer from
analysing data (Onwuegbuzie and Wilson 2003), just as there is one correct answer to a
mathematical problem. In many ways, business statistics has more in common with verbal
reasoning than with mathematics (Williams 2010). Having said this, it is still the case that
prior mathematical courses do have a positive effect on student grade performance in
statistics (Green et al. 2009), probably because of the need to manipulate numerical data.
One phenomenon with regard to student learning of statistics that has received a great
deal of attention in recent years is statistics anxiety (Carlson and Winquist 2011; Francis
and Lipson 2010; Hsu et al. 2009; Meletiou-Mavrotheris et al. 2007; Nguyen and Hampson
2012; Onwuegbuzie 2000; Onwuegbuzie and Wilson 2003; Pan and Tang 2005; Williams
et al. 2008). The main underlying causes of statistics anxiety among students would appear
to be a lack of numeracy skills, a lack of confidence in doing anything mathematical, and
low self-esteem (Zeidner 1991), culminating in a feeling that they do not really understand
the meaning or purpose of what they are doing (Wilensky 1997). This anxiety sometimes
manifests itself as fear of statistics with students making statements such as ‘‘This
[statistics] course is scary’’ (Nguyen and Hampson 2012) and ‘‘I’ve never been frightened
of math. In fact, I received an A in my last math class. Yet I am terrified of statistics’’
(Onwuegbuzie et al. 1997).
410 Learning Environ Res (2015) 18:409–424
123

Anxiety is just one aspect of attitude, which also includes perceived usefulness and
enjoyment as well as others. Attitude in general, not just anxiety, has been shown to be
associated with achievement in science (Freedman 1997), mathematics (Hemmings et al.
2011; Ma and Kishor 1997), business computing (Newby and Fisher 2000) and statistics
(Onwuegbuzie 2000; Onwuegbuzie and Wilson 2003; Pan and Tang 2005). In an educa-
tional setting, a factor that has an impact on attitude is the classroom learning environment.
The relationship between the learning environment and attitude towards mathematics was
investigated by Taylor and Fraser (2013) and between environment and attitude to business
computing by Newby (2002). To our knowledge, this is the first study of the relationship
between the learning environment of a computer-based statistics classroom and attitude
towards statistics. This paper describes the development and validation of two instruments,
one for measuring students’ perceptions of the learning environment of a computer
classroom used for statistics classes, and another for measuring the attitudinal outcomes
from the class. The next section deals with the literature on learning environments and this
is followed by a brief review of attitudes towards statistics, in particular, statistics anxiety.
Learning environments
Student learning and achievement are affected by many factors, including student char-
acteristics (Onwuegbuzie and Wilson 2003), teacher characteristics (Williams 2010),
formative assessment approaches (Newby and Nguyen 2010; Nguyen and Ulbrich 2013)
and the classroom learning environment (Fraser 1998). Of these, classroom learning
environments have received the most attention, having been an area of academic study for
over half a century (Dorman and Fraser 2009). It is recognised that the environment has a
significant impact on all aspects of learning. Classroom environment research concerns
psychosocial aspects of a single classroom, and this has succeeded in conceptualising
learning environments. Although the concept of a classroom environment is a subtle one,
teachers have always been aware of it in an informal manner. Different classes have
different characteristics arising from the ways in which individuals interact with each
other, with the teacher and with their environment.
The use of objective measures for classroom environments began with two research
programmes that started in the late 1960s. As part of the evaluation of the Harvard Physics
Project (Anderson et al. 1968), the Learning Environment Inventory (LEI) was developed
(Anderson and Walberg 1968; Walberg and Anderson 1968). At about the same time, but
arising from research into social climate scales in different settings, the Classroom
Environment Scale (Trickett and Moos 1973) was developed for measuring the environ-
ment of a classroom. The scales of these instruments measure various aspects of students’
perceptions of the classroom environment including interactions between students, inter-
actions between students and teacher, course organisation, class organisation and even the
physical environment. Since that time, many different instruments for measuring a class-
room learning environment have been developed. There are instruments that focus on
university settings, others for high schools and also for elementary schools (Fraser 1998).
A particularly robust instrument for general use, the What is Happening In this Class?
(WIHIC) questionnaire developed by Fraser et al. (1996) has been used in a variety of
settings, achieving what Dorman (2008) calls bandwagon status in the assessment of
classroom environments. The WIHIC has seven scales: Student Cohesiveness, Teacher
Support, Involvement, Investigation, Task Orientation, Cooperation, and Equity. As well
as instruments developed for general classroom environments, there are also many
instruments used in specialist settings such as high school science laboratories (Fraser et al.
Learning Environ Res (2015) 18:409–424 411
123

1993; Taylor and Fraser 2013), higher education seminars (Fraser and Treagust 1986),
distance learning (Jegede et al. 1995), language laboratories (Okan 2008) and medical
universities (Kek and Huijser 2011).
With the growth in the use of information technology in educational settings over the
past two decades, instruments have been developed to measure many aspects of the
environment of computer laboratory classrooms (Newby and Fisher 1997, 2000), to
research the environment of on-line web-based instructional systems (Chang and Fisher
2003), blended web-based environments (Chandra and Fisher 2009) and technology-in-
tegrated science classrooms (Wu et al. 2009). The widespread use of this technology has
given rise to a category of learning environments known as Technology Rich Learning
Environments, and a number of examples of these are given in Khine and Fisher (2003).
Dorman and Fraser (2009) developed the Technology-Rich Outcomes-Focused Learning
Environments Inventory (TROFLEI), based on the WIHIC instrument (Fraser et al. 1996)
with scales added for computer usage, differentiation and young adult ethos.
Classroom learning environment instruments have been used in a number of studies to
investigate the relationship between learning environment and attitudinal variables, such as
anxiety, enjoyment and perceived usefulness of a course or a subject. Newby and Fisher
(2000) demonstrated a causal relationship between students’ perceptions of their computer
laboratory environment and their attitudes towards computers and computing courses.
Their findings were supported and extended by a later study (Dorman and Fraser 2009) of
secondary school students in Australia in which they showed a relationship between
antecedents (age, school grade and computer usage), the learning environment and atti-
tudes to both the subject and computer use. Other studies have found associations between
the learning environment and attitudes towards science (Allen and Fraser 2007; Wolf and
Fraser 2008) and attitudes towards mathematics (Afari et al. 2013).
Attitude towards statistics
Attitude towards anything, whether physical or abstract, is a concept that is recognised as
having three components: cognitive, affective and behavioural (McGuire 1969). This
applies to attitude towards certain individuals, computers, learning, statistics or, even,
learning statistics. A cognitive component is what an individual believes, such as
‘‘statistics is a useful tool in business’’. An affective component is how the individual feels
and is based on emotions such as anxiety or enjoyment. An example of this is ‘‘business
statistics scares me’’ or ‘‘I enjoy this statistics class’’. A behavioural component is a
predisposition to act based on the cognitive and affective components. An example of this
type is procrastination regarding taking a statistics course. Students could believe that the
course is difficult and therefore they feel worried about having to do it in case they get a
low grade, and so they delay in enrolling in the course. In order for someone to have any
emotions about a situation, it is necessary for them to have a belief about that situation
(Kek and Huijser 2011). Moreover, this belief can be associated with pleasant or
unpleasant events, or desirable or undesirable goals. It is at this point that the individual’s
emotions are affected by the situation, which can lead to a predisposition to behave in a
certain way. If the events are pleasant or the goals are perceived to be desirable, the
individual will have a positive attitude towards the situation, and vice versa (McGuire
1969).
Of all the attitudinal outcomes from learning statistics, the one that has received the
most attention is anxiety and this has been defined by a number of authors. For example,
Cruise et al. (1985) define it as ‘‘a feeling of anxiety when taking a statistics course or
412 Learning Environ Res (2015) 18:409–424
123

doing statistical analysis; that is gathering, processing and analyzing data’’. Zeidner (1991)
expands on this by highlighting the accompanying effects of worry, tension and stress
when students are taking or have to take a statistics course. Onwuegbuzie et al. (1997)
define statistics anxiety simply as an anxiety that occurs when a student encounters
statistics in any form or at any level. Statistics anxiety is related to mathematics anxiety,
which has been studied intensively over many years (Pan and Tang 2005; Williams et al.
2008), but they are considered to be different (Williams 2010). The main difference is that,
while mathematics anxiety relates to manipulation of numbers and symbols, statistics has
the added factor of interpretation of the results with the insecurity of there possibly being
no one correct answer.
There have been a number of studies of statistics anxiety related to various factors,
which are classified by Onwuegbuzie and Wilson (2003) as situational, dispositional and
environmental. Situational factors refer directly to the specific course and include course
status (whether required or elective), student major, course structure, instructor attitude and
prior statistics knowledge. Dispositional factors are related to an individual student’s
attitude; they include self-esteem, perceived importance of statistics, mathematical self-
concept, and perceived mathematical and intellectual ability. Finally, environmental fac-
tors relate to attributes of the students such as gender, age, learning style, ethnicity and
whether or not they are studying overseas.
Statistics anxiety has been found to be related to a large number of factors including
academic major, learning style, expected grade, calculator use, mathematical ability and
the length of time since the student’s previous mathematics course (Pan and Tang 2005).
Ethnicity has also been shown to be related to anxiety (Onwuegbuzie and Wilson 2003),
with a study by Liu et al. (2012) showing that college students in China had lower anxiety
than their Western counterparts in the US and the UK. Williams (2010) demonstrated that
the instructor’s behaviour also affected student anxiety. She showed that instructor
immediacy, which refers to a set of communicative behaviours (Bell 1998), is directly
associated with many aspects of statistics anxiety. The performance of low-achieving
students is particularly affected by statistics anxiety.
Many studies have revealed that statistics anxiety has a negative impact on performance
(Lalonde and Gardner 1993; Onwuegbuzie and Seaman 1995; Pan and Tang 2005; Wil-
liams 2010; Zanakis and Valenzi 1997), and in many cases this anxiety leads to students to
delaying enrolling in such courses until the last possible moment (Onwuegbuzie 2004).
This is not desirable at either undergraduate or graduate level, because it could lead to
students being unprepared for other courses that require the use of statistical techniques. As
a potentially complicating factor, most statistics courses now have a computer laboratory
component, and students use software such as Microsoft Excel or SPSS (Hsu et al. 2009),
which means that in many cases they do not do the calculations by hand (Onwuegbuzie and
Wilson 2003). This approach relies even more on the interpretation of the results than
using hand calculations, and this in turn could lead to even greater statistics anxiety.
Instruments have been developed for measuring different aspects of attitude in several
disciplines and settings such as mathematics (Hannula 2002), science (Fraser 1978) and
computer usage (Newby and Fisher 1997). Ramirez et al. (2012) review a number of
instruments for measuring students’ attitudes towards statistics, and these cover those having
a single construct, such as Self-Efficacy to Learn Statistics instrument (Finney and Schraw
2003), to six-construct instruments such as the Statistical Anxiety Rating Scale (STARS)
(Cruise et al. 1985) and the Survey of Attitudes Towards Statistics-36 (Schau 2003). The
instrument that has been used in the majority of studies into attitudes towards statistics is the
STARS. It has six scales; four of them measure an aspect of anxiety or fear (interpretation
Learning Environ Res (2015) 18:409–424 413
123

anxiety, test anxiety, fear of asking for help, and fear of the instructor); worth of statistics
measures the student’s perceptions of the usefulness of statistics; and computational self-
concept measures the student’s belief in his/her ability to perform the required calculations.
Methods
Sample
The sample consisted of 302 students enrolled in a core statistics course as part of an
undergraduate business degree programme at a public university in Southern California. As
this is an upper level course, all business students are required to take it. The characteristics
of the sample are shown in Table 1.
Course, procedures and intervention
Students are taught in classes of up to 45 over one semester of 15 weeks and each section of
the course involves a lecture session and a practical laboratory session. The assessment for the
course consists of four tests: three in-class tests and a final examination, each worth 25 % of
the final score of 100. To remove instructor bias, the students surveyed were all taught by the
same instructor. Data were collected over three semesters, with the surveys being adminis-
tered in the twelfth week of each semester. A one-way ANOVA was performed on the data to
test for differences in overall achievement in each of the three semesters to test if the semester
in which the student took the course could affect their score.
Instruments
For this study, two instruments were developed, both of them adapted from existing
instruments. To measure the learning environment of a computer based statistics
Table 1 Description of sampleDescriptor Values Frequency (%)
Gender Male 46.4
Female 53.6
Age 24 or under 15.9
Between 25–29 61.9
30 and over 22.2
Prior knowledge of statistics All 6.6
Some 80.8
None 12.6
Major Accounting 32.8
Business studies 14.6
Economics 6.6
Finance 11.6
Information systems 6.6
Management 10.6
Marketing 17.2
414 Learning Environ Res (2015) 18:409–424
123

classroom, the Business Statistics Computer Laboratory Environment Inventory (BSCLEI)
was developed. The selection of appropriate constructs for this instrument was based on the
type of class being surveyed. These were practical computer workshops, in which students
were required to apply the techniques learned in the lecture sessions. They were supervised
by the instructor, who provided exercises for the students to work through but, in many
ways, these classes were relatively informal. Given the nature of the class, the following
five constructs were selected as being appropriate for the instrument: Student Cohesive-
ness, Integration, Technology Adequacy, Involvement and Task Orientation. The first three
were adapted from the Computer Laboratory Environment Inventory (CLEI) (Newby and
Fisher 1997) and the latter two from the WIHIC (Fraser et al. 1996). Student Cohesiveness
was chosen as a construct because it had been observed that students in such classes
collaborate with each other, Integration was included because the exercises were designed
to be based on material covered in the lectures, Technology Adequacy was selected
because the exercises were computer based and appropriate hardware and software were
necessary, Task Orientation was appropriate because the laboratory exercises are struc-
tured and students need to know what they are required to do and, finally, Involvement was
chosen because students need to do the exercises in order to gain proficiency in applying
statistical techniques to business problems. Each construct has five items, on a five-point
Likert scale ranging from Strongly Disagree to Strongly Agree. A description of the
constructs, together with a sample question from each and a reference to where they were
derived from, is given in Table 2.
The Attitude towards Business Statistics (ABS) instrument consists of four constructs:
Anxiety, Enjoyment, Perceived Usefulness of the Course and Perceived Usefulness of
Statistics. These constructs were adapted from the Attitude towards Computing and
Computing Courses (ACCC) instrument (Newby and Fisher 1997) and the Statistical
Anxiety Rating Scale (STARS) (Cruise et al. 1985). Again, each construct has five items
Table 2 Business Statistics Computer Laboratory Environment Inventory (BSCLEI)
Construct Description Sample item References
StudentCohesiveness(SC)
Extent to which students know, helpand are supportive of each other
I get on well with the otherstudents in my workshopsessions
Newby and Fisher(1997)
Integration (IN) Extent to which the IT workshopsessions are linked to non-laboratory and theory classes
What I do in the lecture isrelated to my workshopexercise
Newby and Fisher(1997)
TechnologyAdequacy(TA)
Extent to which IT facilities(computers and statisticalsoftware) adequately support theclass activities
The computer softwareavailable enables me towork on my exercisesefficiently
Newby and Fisher(1997)
Involvement(IV)
Extent to which students participateactively and attentively in classactivities
I put effort into what I do inthe workshop sessions
Fraser et al.(1996)
TaskOrientation(TO)
Extent to which it is important tocomplete planned activities and tostay on the subject matter
I know exactly what has tobe done in our workshopsessions
Fraser et al.(1996)
Learning Environ Res (2015) 18:409–424 415
123

on a five-point Likert scale from Strongly Disagree to Strongly Agree. A description of the
constructs, together with a sample question and a reference to where they were derived
from is given in Table 3.
Instrument validation procedures
Exploratory factor analysis using principal component analysis with varimax rotation was
performed to validate the BSCLEI. For the validation of the ABS, principal component
analysis followed by a direct oblimin rotation with d = 0 was performed. The reason for
direct oblimin rotation being carried out is that, because we believed that the factors within
ABS would be correlated, using oblique rotation could produce clearer axes than using
varimax rotation (Tabachnick and Fidell 2010).
Results
Sample
The results of the one-way ANOVA performed on the students’ overall scores across
semesters to test for differences in the average achievement are shown in Table 4. This
analysis shows that the semester in which the students took the course was not significant
with respect to students’ scores, F (2299) = 0.362, p = 0.696. This implies that students in
each semester had a similar range of abilities.
Instrument validation
The results of the principal component analysis with a varimax rotation on the 25 items of
the BSCLEI showed that the Kaiser–Meyer–Olkin (KMO) sampling adequacy measure-
ments (Kaiser 1958) was 0.852, indicating that the matrix is factorable. Using eigenvalues
greater than 1 as the criterion, with a cutoff point for the loadings at 0.4, five components
were extracted for the BSCLEI. The extracted five factors explained 50.3 % percent of the
Table 3 Attitude towards Business Statistics (ABS)
Construct Description Sample item References
Anxiety (AX) Extent of a student’snervousness or lack ofcomfort with statistics
Working with statistics makesme nervous
Cruise et al. (1985),Newby and Fisher(1997)
Enjoyment (EN) Extent to which a studentenjoys learning statistics
Learning about statisticalanalysis is interesting
Newby and Fisher(1997)
PerceivedUsefulness ofthe Course(PUC)
Extent to which the studentfound the course useful
This course provided me withskills I expect to use in futureemployment
Newby and Fisher(1997)
PerceivedUsefulness ofStatistics (PUS)
Extent to which the studentbelieves statistics is usefulin general
Statistical analysis is animportant factor in the successof a business
Cruise et al. (1985)
416 Learning Environ Res (2015) 18:409–424
123

variance, which is satisfactory for social sciences studies (Kline 1994). The final results of
principal component analysis for the BSCLEI are reported in Table 5.
Table 5 shows that all the hypothesised factors of the BSCLEI had items with high
loadings on to their a priori factors. For Student Cohesiveness, loadings were between
0.593 and 0.773, for Integration loadings were between 0.524 and 0.658, for Technology
Adequacy loadings were between 0.453 and 0.705, for Involvement loadings were between
Table 4 One-way ANOVAresults for achievement over thethree semesters
Semester N Mean SD Minimum Maximum
S01 111 77.8 10.0 53 99
S02 134 76.5 15.3 20 98
S03 57 76.3 12.9 42 100
F-value = 0.362df = 299, 2Sig. = .696
Table 5 Factor loadings ofrotated component matrixa forBSCLEI constructs
Extraction method: Principalcomponent analysis
Rotation method: Varimax withKaiser normalizationa Rotation converged in 6iterationsb Variance explained as apercentage
Item Factor 1 Factor 2 Factor 3 Factor 4 Factor 5
SC_01 0.593
SC_02 0.773
SC_03 0.715
SC_04 0.771
SC_05 0.675
IN_01 0.623
IN_02 0.531
IN_03 0.658
IN_04 0.570
IN_05 0.524
TA_01 0.521
TA_02 0.453
TA_03 0.705
TA_04 0.702
TA_05 0.520
IV_01 0.617
IV_02 0.780
IV_03 0.626
IV_04 0.472
IV_05 0.524
TO_01 0.692
TO_02 0.576
TO_03 0.555
TO_04 0.541
TO_05 0.529
VEb 24.66 9.04 6.38 5.39 4.83
Eigenvalue 6.17 2.26 1.60 1.35 1.21
Learning Environ Res (2015) 18:409–424 417
123
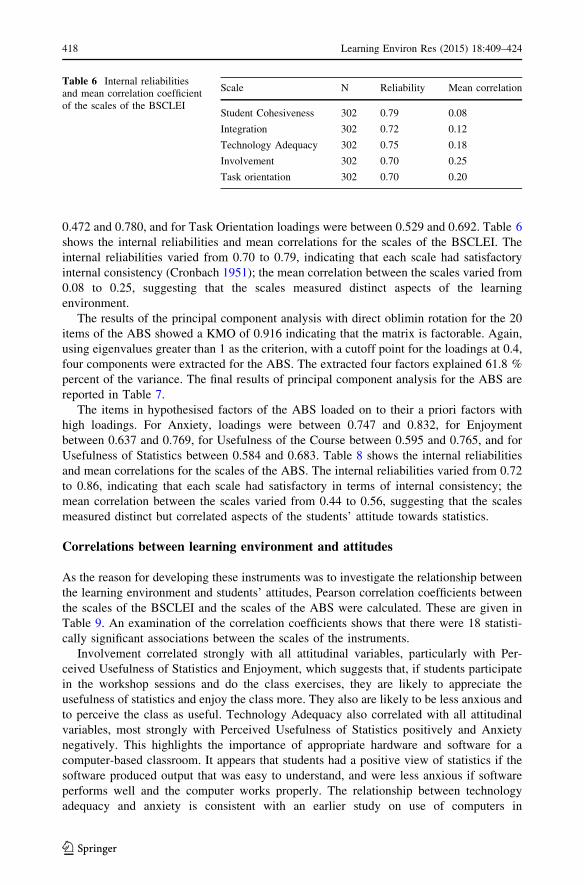
0.472 and 0.780, and for Task Orientation loadings were between 0.529 and 0.692. Table 6
shows the internal reliabilities and mean correlations for the scales of the BSCLEI. The
internal reliabilities varied from 0.70 to 0.79, indicating that each scale had satisfactory
internal consistency (Cronbach 1951); the mean correlation between the scales varied from
0.08 to 0.25, suggesting that the scales measured distinct aspects of the learning
environment.
The results of the principal component analysis with direct oblimin rotation for the 20
items of the ABS showed a KMO of 0.916 indicating that the matrix is factorable. Again,
using eigenvalues greater than 1 as the criterion, with a cutoff point for the loadings at 0.4,
four components were extracted for the ABS. The extracted four factors explained 61.8 %
percent of the variance. The final results of principal component analysis for the ABS are
reported in Table 7.
The items in hypothesised factors of the ABS loaded on to their a priori factors with
high loadings. For Anxiety, loadings were between 0.747 and 0.832, for Enjoyment
between 0.637 and 0.769, for Usefulness of the Course between 0.595 and 0.765, and for
Usefulness of Statistics between 0.584 and 0.683. Table 8 shows the internal reliabilities
and mean correlations for the scales of the ABS. The internal reliabilities varied from 0.72
to 0.86, indicating that each scale had satisfactory in terms of internal consistency; the
mean correlation between the scales varied from 0.44 to 0.56, suggesting that the scales
measured distinct but correlated aspects of the students’ attitude towards statistics.
Correlations between learning environment and attitudes
As the reason for developing these instruments was to investigate the relationship between
the learning environment and students’ attitudes, Pearson correlation coefficients between
the scales of the BSCLEI and the scales of the ABS were calculated. These are given in
Table 9. An examination of the correlation coefficients shows that there were 18 statisti-
cally significant associations between the scales of the instruments.
Involvement correlated strongly with all attitudinal variables, particularly with Per-
ceived Usefulness of Statistics and Enjoyment, which suggests that, if students participate
in the workshop sessions and do the class exercises, they are likely to appreciate the
usefulness of statistics and enjoy the class more. They also are likely to be less anxious and
to perceive the class as useful. Technology Adequacy also correlated with all attitudinal
variables, most strongly with Perceived Usefulness of Statistics positively and Anxiety
negatively. This highlights the importance of appropriate hardware and software for a
computer-based classroom. It appears that students had a positive view of statistics if the
software produced output that was easy to understand, and were less anxious if software
performs well and the computer works properly. The relationship between technology
adequacy and anxiety is consistent with an earlier study on use of computers in
Table 6 Internal reliabilitiesand mean correlation coefficientof the scales of the BSCLEI
Scale N Reliability Mean correlation
Student Cohesiveness 302 0.79 0.08
Integration 302 0.72 0.12
Technology Adequacy 302 0.75 0.18
Involvement 302 0.70 0.25
Task orientation 302 0.70 0.20
418 Learning Environ Res (2015) 18:409–424
123

programming classes (Newby and Fisher 1997). Task Orientation correlated with all
attitudinal factors, but strongly only with Perceived Usefulness of Statistics and Perceived
Usefulness of the Course. Again, this would imply that clear instructions for the exercises
are likely to be lead to students perceiving both the course and statistics to be useful, to
being less anxious and to having greater enjoyment.
With the exception of Enjoyment, Integration was associated with all attitudinal factors,
suggesting that a course in which the relationship between lecture and workshop is clear
tends to be associated with reduced anxiety and a perception of increased usefulness of
both the course and statistics itself. Finally, Student Cohesiveness correlated with all
attitudinal scales except Anxiety, implying that students perceive statistics and the course
as useful and enjoyable if they are allowed to work together. At first glance, the non-
Table 7 Factor loadings ofrotated component matrixa forABS constructs
Extraction method: Principalcomponent analysis
Rotation method: Oblimin withKaiser Normalizationa Rotation converged in 6iterationsb Variance explained as apercentage
Item Factor 1 Factor 2 Factor 3 Factor 4
AX_01 0.827
AX_02 0.832
AX_03 0.756
AX_04 0.777
AX_05 0.747
EN_01 0.775
EN_02 0.676
EN_03 0.769
EN_04 0.703
EN_05 0.637
PUC_01 0.703
PUC_02 0.595
PUC_03 0.765
PUC_04 0.634
PUC_05 0.738
PUS_01 0.626
PUS_02 0.683
PUS_03 0.594
PUS_04 0.605
PUS_05 0.584
VEb 38.44 10.86 6.80 5.71
Eigenvalue 7.69 2.17 1.36 1.14
Table 8 Internal reliabilities and mean correlation coefficient of the scales of the ABS
Scale N Reliability Mean correlation
Anxiety 302 0.86 -0.44
Enjoyment 302 0.86 0.56
Perceived Usefulness Course 302 0.77 0.56
Perceived Usefulness Statistics 302 0.72 0.52
Learning Environ Res (2015) 18:409–424 419
123

significant association between Student Cohesiveness and Anxiety seems counterintuitive,
given the nature of these workshops, but this result supports findings from a previous study
(Newby and Fisher 1997). It seems that, if students have anxiety about statistics, then
collaborating with other students does not change that feeling. Indeed, if all students in a
group are anxious, working together could well make it worse.
Looking at the correlations from the perspective of attitudinal variables, what stand out
are the significant relationships between all environment variables and Perceived Useful-
ness of the Course and Perceived Usefulness of Statistics. This implies that how students
perceive their computer classroom environment is strongly associated with their belief
about the usefulness of both the course and statistics.
Conclusions
This paper described two instruments, the BSCLEI for measuring aspects of the learning
environment of a computer-based business statistics workshop and the ABS for measuring
students’ attitudes towards a business statistics course. For both instruments, exploratory
factor analysis resulted in all items loading onto their postulated scales, with the five
factors of the BSCLEI explaining over 50 % of the variance and the four factors of the
ABS explaining over 60 % of the variance. The scales of the BSCLEI were shown to be
reliable and that they measured separate aspects of the learning environment. For the ABS,
the scales again were shown to be reliable. The mean correlations between the scales of the
ABS were high, which is to be anticipated with an instrument that measures attitudes.
However, it should be noted that the mean correlations are much smaller than the corre-
sponding reliability coefficients, indicating that the scales do measure separate aspects of
the students’ attitudes.
Correlation analysis indicated that there were associations between most of the learning
environment variables and the attitudinal variables. The aspects of the learning environ-
ment that had the strongest relationships with attitudes were Technology Adequacy,
Involvement and Task Orientation. This would imply that, to improve attitudes towards
business statistics, instructors should ensure that workshop exercises are well-designed,
that students do the exercises during the workshop sessions, and that the software chosen as
the vehicle for these classes is up to the task. Anxiety was not only associated with
Technology Adequacy, Involvement and Task Orientation, but it had a significant negative
relationship with Integration, suggesting that anxiety about statistics also might be reduced
Table 9 Correlation coefficients between the scales of the BSCLEI and the ABS
ABS scale Correlation with BSCCEI scale
StudentCohesiveness
Integration TechnologyAdequacy
Involvement Taskorientation
Anxiety -0.066 -0.202** -0.302** -0.254** -0.133*
Enjoyment 0.146* 0.079 0.257** 0.328** 0.144*
Perceived UsefulnessCourse
0.171** 0.131* 0.239** 0.268** 0.168**
Perceived UsefulnessStatistics
0.201** 0.172** 0.355** 0.445** 0.289**
* p\ 0.05; ** p\ 0.01
420 Learning Environ Res (2015) 18:409–424
123

by designing a course in which the student can see the relationship between theory and
practice. Student Cohesiveness was correlated with all attitudinal variables except Anxiety,
which would imply that students in a class where they are more helpful to and supportive
of each other are more likely to enjoy the class and perceive both the course and statistics
to be useful.
As statistical skills are now required in a number of disciplines and the study of
statistics is no longer restricted to particular subjects (British Academy 2012), these
findings have implications for both instructors and educational administrators. For
instructors who are designing and running a service statistics course, it is important that the
course is structured in such a way that the exercises for laboratory sessions are based on the
topics covered in the lectures and that the requirements are clear, easy to follow and
manageable in the time available. It is also desirable that the exercises are derived from
realistic problems appropriate to the discipline (business, in this case). Further, it must be
made clear to students that these exercises are very important as practice is the only way to
gain proficiency in a subject such as statistics. They should be encouraged to work through
these exercises during the laboratory sessions when the instructor is there to give them
assistance. Allowing students to collaborate during these sessions could be particularly
beneficial to students who do not see the course or statistics as relevant. It is also rec-
ommended that educational administrators ensure that computer laboratories are equipped
with suitable computers together with appropriate statistical software. Finally, because it
was observed that perceived usefulness of statistics was strongly correlated with all
environment variables, improving the classroom learning environment could lead to a
greater appreciation of the relevance and usefulness of statistics.
There are, of course, limitations with this study. Although the sample size was adequate,
the sample was taken from students in an undergraduate programme at one university in
Southern California. It would be of value to administer the instruments to students in
graduate programmes, particularly because this seems to be a major problem area (On-
wuegbuzie 2004; Onwuegbuzie and Wilson 2003; Williams 2010). Also, the scales of the
BSCLEI were selected based on the researchers’ experience as being most likely to be
associated with attitudes for computer workshops. It would be useful to include other
aspects of the learning environment in a future investigation. Despite these limitations, this
research has demonstrated a relationship between aspects of classroom learning environ-
ment and attitude towards statistics, and has led to the development and validation of two
instruments which can be used in future research.
Acknowledgments The authors wish to thank Professor Darrell Fisher of Curtin University, WesternAustralia for his insightful comments on an early draft of this paper.
References
Afari, E., Aldridge, J. M., Fraser, B. J., & Khine, M. S. (2013). Students’ perceptions of the learningenvironment and attitudes in game-based mathematics classrooms. Learning Environments Research,16(1), 131–150.
Allen, D., & Fraser, B. J. (2007). Parent and student perceptions of classroom learning environment and itsassociation with student outcomes. Learning Environments Research, 10(1), 67–82.
Anderson, G. J., & Walberg, H. J. (1968). Classroom climate and group learning. International Journal ofEducational Sciences, 2, 178–180.
Anderson, G. J., Walberg, H. J., & Welch, W. W. (1968). Curriculum effects on the social climate oflearning: A new representation of discriminant functions. American Educational Research Journal, 6,315–328.
Learning Environ Res (2015) 18:409–424 421
123

Association to Advance Collegiate Schools of Business. (2012). Eligibility procedures and accreditationstandards for business accreditation. http://www.aacsb.edu/accreditation/standards-busn-jan2012.pdf
Bell, J. A. (1998). International students have statistics anxiety too! Education, 118, 634–636.British Academy. (2012). Society counts. http://www.britac.ac.uk/policy/Society_Counts.cfmCarlson, K. A., & Winquist, J. R. (2011). Evaluating an active learning approach to teaching introductory
statistics: A classroom workbook approach. Journal of Statistics Education, 191, 1–22.Chandra, V., & Fisher, D. L. (2009). Students’ perceptions of a blended web-based learning environment.
Learning Environments Research, 12(1), 31–44.Chang, V., & Fisher, D. L. (2003). The validation and application of a new learning environment instrument
for online learning in higher education. In M. S. Khine & D. L. Fisher (Eds.), Technology-rich learningenvironments: A future perspective (pp. 1–20). Singapore: World Scientific.
Cook, A. (2010). Improving the success rate in statistics (No. 415). Brisbane: University of Queensland,School of Economics.
Cronbach, L. J. (1951). Coefficient alpha and the internal structure tests. Psychometrika, 16, 297–334.Cruise, R. J., Cash, R. W., & Bolton, D. L. (1985, August). Development and validation of an instrument to
measure statistical anxiety. Paper presented at the annual meeting of the statistical education sec-tion. Proceedings of the American Statistical Association, Chicago, IL.
Dorman, J. P. (2008). Use of multitrait-multimethod modeling to validate actual and preferred forms of theWhat Is Happening In this Class? (WIHIC) questionnaire. Learning Environments Research, 11,179–193.
Dorman, J. P., & Fraser, B. J. (2009). Psychosocial environment and affective outcomes in technology-richclassrooms: Testing a causal model. Social Psychology of Education, 12(1), 77–99.
Finney, S. J., & Schraw, G. (2003). Self-efficacy beliefs in college statistics courses. Contemporary Edu-cational Psychology, 28(2), 161–186.
Francis, G., & Lipson, K. (2010, July). The importance of teaching statistics in a professional context. InProceedings of the eighth international conference on teaching statistics, Ljubljana, Slovenia.
Fraser, B. J. (1978). Development of a test of science-related attitudes. Science Education, 62(4), 509–515.Fraser, B. J. (1998). Classroom environment instruments: Development, validity and applications. Learning
Environments Research, 1(1), 7–34.Fraser, B. J., Fisher, D. L., & McRobbie, C. J. (1996, April). Development, validation and use of personal
and class forms of a new classroom environment instrument. Paper presented at the annual meeting ofthe American Educational Research Association, New York.
Fraser, B. J., McRobbie, C. J., & Giddings, G. J. (1993). Development and cross-national validation of alaboratory classroom environment instrument for senior high school science. Science Education, 77(1),1–24.
Fraser, B. J., & Treagust, D. F. (1986). Validity and use of an instrument for assessing classroom psy-chosocial environment in higher education. Higher Education, 15(1–2), 37–57.
Freedman, M. P. (1997). Relationship among laboratory instruction, attitude toward science, and achieve-ment in science knowledge. Journal of Research in Science Teaching, 34(4), 343–357.
Gordon, S. (2004). Understanding students’ experiences of statistics in a service course. Statistics EducationResearch Journal, 3(1), 40–59.
Green, J. J., Stone, C. C., Zegeye, A., & Charles, T. A. (2009). How much math do students need to succeedin business and economics statistics? An ordered probit analysis. Journal of Statistics Education, 17(3),1–22.
Hannula, M. S. (2002). Attitude towards mathematics: Emotions, expectations and values. Educationalstudies in Mathematics, 49(1), 25–46.
Hemmings, B., Grootenboer, P., & Kay, R. (2011). Predicting mathematics achievement: The influence ofprior achievement and attitudes. International Journal of Science and Mathematics Education, 9(3),691–705.
Hsu, M. K., Wang, S. W., & Chiu, K. K. (2009). Computer attitude, statistics anxiety and self-efficacy onstatistical software adoption behavior: An empirical study of online MBA learners. Computers inHuman Behaviour, 252, 412–420.
Jegede, O. J., Fraser, B. J., & Fisher, D. L. (1995). The development and validation of a distance and openlearning environment scale. Educational Technology Research and Development, 43(1), 89–94.
Kaiser, H. F. (1958). The varimax criterion for analytic rotation in factor analysis. Psychometrika, 23,187–200.
Kek, M., & Huijser, H. (2011). Exploring the combined relationships of student and teacher factors onlearning approaches and self-directed learning readiness at a Malaysian University. Studies in HigherEducation, 36(2), 185–208.
422 Learning Environ Res (2015) 18:409–424
123

Khine, M. S., & Fisher, D. L. (Eds.). (2003). Technology-rich learning environments: A future perspective.Singapore: World Scientific.
Kline, P. (1994). An easy guide to factor analysis. London: Routledge.Lalonde, R. N., & Gardner, R. C. (1993). Statistics as a second language? Model for predicting performance
in psychology students. Canadian Journal of Behavioral Science, 25, 108–125.Liu, S., Onwuegbuzie, A. J., & Meng, L. (2012). Examination of the score reliability and validity of the
Statistics Anxiety Rating Scale. The Journal of Educational Enquiry, 11(1), 29–42.Ma, X., & Kishor, N. (1997). Assessing the relationship between attitude toward mathematics and
achievement in mathematics: A meta-analysis. Journal for Research in Mathematics Education, 28(1),26–47.
McGuire, W. J. (1969). The nature of attitudes and attitude change. In G. Lindzey & E. Aronson (Eds.), Thehandbook of social psychology (pp. 136–314). Reading, MA: Addision-Wesley.
Meletiou-Mavrotheris, M., Lee, C., & Fouladi, R. T. (2007). Introductory statistics, college student attitudesand knowledge—A qualitative analysis of the impact of technology based instruction. InternationalJournal of Mathematical Education, 19, 65–83.
Newby, M. (2002). An empirical study comparing the learning environments of open and closed computerlaboratories. Journal of Information Systems Education, 13(4), 303–314.
Newby, M., & Fisher, D. L. (1997). An instrument for assessing the learning environment of a computerlaboratory. Journal of Educational Computing Research, 16, 179–190.
Newby, M., & Fisher, D. L. (2000). A model of the relationship between university computer laboratoryenvironment and student outcomes. Learning Environments Research, 3(1), 51–66.
Newby, M., & Nguyen, T. H. (2010). Using the same problem with different techniques in programmingassignments: An empirical study of its effectiveness. Journal of Information Systems Education, 21(4),375–382.
Nguyen, T. H., & Hampson, P. (2012, March). Improving students’ learning outcomes in university businessstatistics modules: Increase contact hours or increase relevance? Paper presented at the 5th AnnualNortheast Universities (3 Rivers Consortium) Regional Learning and Teaching Conference, Mid-dlesbrough, Tees Valley, UK.
Nguyen, T. H., & Ulbrich, F. (2013, August). The effectiveness of different grading strategies: An empiricalstudy. In Proceedings of the 19th Americas conference on information systems, AMCIS 2013, 15–17Chicago, IL.
Okan, Z. (2008). Computing laboratory classes as language learning environments. Learning EnvironmentsResearch, 11(1), 31–48.
Onwuegbuzie, A. J. (2000). Statistics anxiety and the role of self-perceptions. Journal of EducationalResearch, 93, 323–335.
Onwuegbuzie, A. J. (2004). Academic procrastination and statistics anxiety. Assessment & Evaluation inHigher Education, 29(1), 3–19.
Onwuegbuzie, A. J., Da Ros, D., & Ryan, J. M. (1997). The components of statistics anxiety: A phe-nomenological study. Focus on Learning Problems in Mathematics, 19(4), 11–35.
Onwuegbuzie, A. J., & Seaman, M. (1995). The effect of time and anxiety on statistics achievement. Journalof Experimental Psychology, 63, 115–124.
Onwuegbuzie, A. J., & Wilson, V. A. (2003). Statistics anxiety: Nature, etiology, antecedents, effects andtreatments—A comprehensive review of the literature. Teaching in Higher Education, 8, 195–209.
Pan, W., & Tang, M. (2005). Students’ perceptions on factors of statistics anxiety and instructionalstrategies. Journal of Instructional Psychology, 32, 205–214.
Petocz, P. (1998). Effective video-based resources for learning statistics. In Statistical education—Ex-panding the network, fifth international conference on teaching statistics (pp. 985–991).
Petocz, P., & Reid, A. (2005). Something strange and useless: Service students’ conceptions of statistics,learning statistics and using statistics in their future profession. International Journal of MathematicalEducation in Science and Technology, 36(7), 789–800.
Ramirez, C., Schau, C., & Emmioglu, E. (2012). The importance of attitudes in statistics education.Statistics Education Research Journal, 11(2), 57–71.
Ramsey, J. B. (1999, August). Why do students find statistics so difficult? In Proceedings of the 52th Sessionof the International Statistical Institute, Helsinki, Finland.
Schau, C. (2003). Students’ attitudes: The ‘‘other’’ important outcome in statistics education. In Proceedingsof the joint statistical meetings (pp. 3673–3681).
Tabachnick, B. G., & Fidell, L. S. (2010). Using multivariate statistics (6th ed.). Boston, MA: Pearson.Taylor, B. A., & Fraser, B. J. (2013). Relationships between learning environment and mathematics anxiety.
Learning Environments Research, 16, 297–313.
Learning Environ Res (2015) 18:409–424 423
123

Trickett, E. J., & Moos, R. H. (1973). Social environment of junior high and high school classrooms.Journal of Educational Psychology, 65(1), 93–102.
Walberg, H. J., & Anderson, G. J. (1968). Classroom climate and individual learning. Journal of Educa-tional Psychology, 59, 414–419.
Wilensky, U. (1997). What is normal anyway? Therapy for epistemological anxiety. Educational Studies inMathematics, 33(2), 171–202.
Williams, A. S. (2010). Statistics anxiety and instructor immediacy. Journal of Statistics Education, 18,1–18.
Williams, M., Payne, G., Hodgkinson, L., & Poade, D. (2008). Does British sociology count? Sociologystudents’ attitudes toward quantitative methods. Sociology, 42, 1003–1021.
Wolf, S. J., & Fraser, B. J. (2008). Learning environment, attitudes and achievement among middle-schoolscience students using inquiry-based laboratory activities. Research in Science Education, 38(3),321–341.
Wu, W., Chang, H. P., & Guo, C. J. (2009). The development of an instrument for a technology-integratedscience learning environment. International Journal of Science and Mathematics Education, 7(1),207–233.
Zanakis, S. H., & Valenzi, E. R. (1997). Student anxiety and attitudes in business statistics. Journal ofEducation for Business, 73, 10–16.
Zeidner, M. (1991). Statistics and mathematics anxiety in social science students: Some interesting parallels.British Journal of Educational Psychology, 61, 319–328.
424 Learning Environ Res (2015) 18:409–424
123