Development and validation of a new patient-reported outcome measure for patients with pressure...
12
RESEARCH Open Access Development and validation of a new patient-reported outcome measure for patients with pressure ulcers: the PU-QOL instrument Claudia Gorecki 1* , Julia M Brown 1 , Stefan Cano 2 , Donna L Lamping 3 , Michelle Briggs 4 , Susanne Coleman 1 , Carol Dealey 5 , Elizabeth McGinnis 6 , Andrea E Nelson 4 , Nikki Stubbs 7 , Lyn Wilson 1 and Jane Nixon 1 Abstract Background: Patient-reported outcome (PRO) data are integral to patient care, policy decision making and healthcare delivery. PRO assessment in pressure ulcers is in its infancy, with few studies including PROs as study outcomes. Further, there are no pressure ulcer PRO instruments available. Methods: We used gold-standard methods to develop and evaluate a new PRO instrument for people with pressure ulcers (the PU-QOL instrument). Firstly a conceptual framework was developed forming the basis of PU-QOL scales. Next an exhaustive item pool was used to produce a draft instrument that was pretested using mixed methods (cognitive interviews and Rasch Measurement Theory). Finally, we undertook psychometric evaluation in two parts. This first part was item reduction, using PU-QOL data from 227 patients. The second part was reliability and validity evaluation of the item-reduced version using both Traditional and Rasch methods, on PU-QOL data from 229 patients. Results: The final PU-QOL contains 10 scales for measuring symptoms, physical functioning, psychological well-being and social participation specific to pressure ulcers. It is intended for administration and patients rate the amount of “bother” attributed during the past week on a 3-point response scale. Scale scores are generated by summing items, with lower scores indicating better outcome. The PU-QOL instrument was found to be acceptable, reliable (Cronbach’s alpha values ranging 0.89 - 0.97) and valid (hypothesised correlations between PU-QOL and SF-12 scores (r >0.30) and PU-QOL scales and sociodemographic variables (r <0.30) were consistent with predictions). Conclusions: The PU-QOL instrument provides a standardised method for assessing PROs, reflecting the domains in a pressure ulcer-specific conceptual framework. It is intended for evaluating patient orientated differences between interventions and in particular the impact from the perspective of patients. Keywords: Pressure ulcer, Patient-reported outcomes, Health-related quality of life, Reliability, Validity, Rasch analysis, Rating scale Background Chronic wounds are a major health problem and chal- lenge to patients, healthcare professionals and healthcare systems. Pressure ulcers (PUs) are chronic wounds that occur as localised injury to the skin and/or underlying tissue usually over a bony prominence, as a result of pressure, or pressure in combination with shear [1]. They range in size and severity of tissue layer affected, with particularly vulnerable areas being the sacrum, buttocks and heels [2]. With widespread prevalence and incidence in all health settings [3], PUs, often a complication of ser- ious acute or chronic illness, are a health problem associ- ated with increased morbidity [4], mortality [5], healthcare costs and hospitalisation, and identified as a UK National Health Service (NHS) quality indicator [6]. Both PUs themselves and interventions for preventing and treating PUs impact health-related quality of life (HRQL) and can severely compromise all areas of pa- tient functioning [7,8]. Clinical outcomes associated with PU prevention or healing, such as incidence or rate of healing, have been the focus of clinical inquiry; however, * Correspondence: [email protected] 1 Clinical Trials Research Unit (CTRU), University of Leeds, Leeds LS2 9JT, UK Full list of author information is available at the end of the article © 2013 Gorecki et al.; licensee BioMed Central Ltd. This is an Open Access article distributed under the terms of the Creative Commons Attribution License (http://creativecommons.org/licenses/by/2.0), which permits unrestricted use, distribution, and reproduction in any medium, provided the original work is properly cited. Gorecki et al. Health and Quality of Life Outcomes 2013, 11:95 http://www.hqlo.com/content/11/1/95
-
Upload
independent -
Category
Documents
-
view
0 -
download
0
Transcript of Development and validation of a new patient-reported outcome measure for patients with pressure...

RESEARCH Open Access
Development and validation of a newpatient-reported outcome measure for patientswith pressure ulcers: the PU-QOL instrumentClaudia Gorecki1*, Julia M Brown1, Stefan Cano2, Donna L Lamping3, Michelle Briggs4, Susanne Coleman1,Carol Dealey5, Elizabeth McGinnis6, Andrea E Nelson4, Nikki Stubbs7, Lyn Wilson1 and Jane Nixon1
Abstract
Background: Patient-reported outcome (PRO) data are integral to patient care, policy decision making andhealthcare delivery. PRO assessment in pressure ulcers is in its infancy, with few studies including PROs as studyoutcomes. Further, there are no pressure ulcer PRO instruments available.
Methods: We used gold-standard methods to develop and evaluate a new PRO instrument for people with pressureulcers (the PU-QOL instrument). Firstly a conceptual framework was developed forming the basis of PU-QOL scales. Nextan exhaustive item pool was used to produce a draft instrument that was pretested using mixed methods (cognitiveinterviews and Rasch Measurement Theory). Finally, we undertook psychometric evaluation in two parts. This first partwas item reduction, using PU-QOL data from 227 patients. The second part was reliability and validity evaluation of theitem-reduced version using both Traditional and Rasch methods, on PU-QOL data from 229 patients.
Results: The final PU-QOL contains 10 scales for measuring symptoms, physical functioning, psychological well-beingand social participation specific to pressure ulcers. It is intended for administration and patients rate the amount of“bother” attributed during the past week on a 3-point response scale. Scale scores are generated by summing items,with lower scores indicating better outcome. The PU-QOL instrument was found to be acceptable, reliable (Cronbach’salpha values ranging 0.89 - 0.97) and valid (hypothesised correlations between PU-QOL and SF-12 scores (r >0.30) andPU-QOL scales and sociodemographic variables (r <0.30) were consistent with predictions).
Conclusions: The PU-QOL instrument provides a standardised method for assessing PROs, reflecting the domains in apressure ulcer-specific conceptual framework. It is intended for evaluating patient orientated differences betweeninterventions and in particular the impact from the perspective of patients.
Keywords: Pressure ulcer, Patient-reported outcomes, Health-related quality of life, Reliability, Validity, Rasch analysis,Rating scale
BackgroundChronic wounds are a major health problem and chal-lenge to patients, healthcare professionals and healthcaresystems. Pressure ulcers (PUs) are chronic wounds thatoccur as localised injury to the skin and/or underlyingtissue usually over a bony prominence, as a result ofpressure, or pressure in combination with shear [1]. Theyrange in size and severity of tissue layer affected, withparticularly vulnerable areas being the sacrum, buttocks
and heels [2]. With widespread prevalence and incidencein all health settings [3], PUs, often a complication of ser-ious acute or chronic illness, are a health problem associ-ated with increased morbidity [4], mortality [5], healthcarecosts and hospitalisation, and identified as a UK NationalHealth Service (NHS) quality indicator [6].Both PUs themselves and interventions for preventing
and treating PUs impact health-related quality of life(HRQL) and can severely compromise all areas of pa-tient functioning [7,8]. Clinical outcomes associated withPU prevention or healing, such as incidence or rate ofhealing, have been the focus of clinical inquiry; however,
* Correspondence: [email protected] Trials Research Unit (CTRU), University of Leeds, Leeds LS2 9JT, UKFull list of author information is available at the end of the article
© 2013 Gorecki et al.; licensee BioMed Central Ltd. This is an Open Access article distributed under the terms of the CreativeCommons Attribution License (http://creativecommons.org/licenses/by/2.0), which permits unrestricted use, distribution, andreproduction in any medium, provided the original work is properly cited.
Gorecki et al. Health and Quality of Life Outcomes 2013, 11:95http://www.hqlo.com/content/11/1/95

due to advances in health outcome measurement, suchinformation alone is no longer sufficient to support pro-gress being made in the PU field [9]. Cochrane reviewshighlight the lack of robust evidence for the clinical ef-fectiveness of a majority of PU treatments [10]; resourceavailability is not based upon health economic evaluationand there is no systematic way of considering patients’priorities for interventions. Therefore, clinical decisionmaking continues despite being uninformed by highquality studies based on cost-effectiveness and patients’perspectives.The field of health is reliant on health outcome meas-
urement to provide a strong evidence-base, incorporat-ing both patient perspectives and cost analyses. In healthoutcomes research, evaluation of intervention-relatedoutcomes are often undertaken with the help of ratingscales, or more recently called patient-reported outcome(PRO) instruments. PRO instruments are increasinglyused in clinical studies for measuring outcome variables.In this role, instruments are the central dependent vari-ables which treatment decisions are made. They can beuseful tools for evaluating health changes following in-terventions if they are fit for purpose and accord withinternational standards for rigorous measurement [9,11].Patient-based outcome measurement in PUs is in its
infancy; few studies have measured PROs and those thathave done, have used generic instruments [12]. A PROinstrument specific to PUs could help improve theevidence-base through research assessing effectiveness ofPU therapies; facilitate clinician-patient communicationand shared decision making; prioritise patient problemsand preferences; monitor changes or outcomes of treat-ment; measure the performance of healthcare providersand services; and be used in clinical audit [13-15].Our previous work has identified PROs important to
people with PUs [7,16,17], established the need for apatient-reported measure of outcomes specific to PUs [12],and developed a provisional version of such a measure (thePU-QOL instrument). The PU-QOL instrument was de-veloped on the basis of a PU-specific HRQL conceptualframework [16] and existing PU and HRQL literature [7].These sources provided insight into variables important formeasurement from the perspective of patients with PUsand were used to generate an exhaustive list of items. Theitem list (n=122) was transformed into scales intended todefine coherent clinically meaningful constructs (scales)consisting of items representing aspects of the continuumof each construct, reflecting the domains within ourconceptual framework. This produced a preliminaryPU-QOL version which was pre-tested through cognitiveinterviews with 35 patients with PUs [18], producing aprovisional PU-QOL version. Pre-testing identified poten-tial strengths and weaknesses of PU-QOL items, guideddecision-making about modifications to items (content and
response options) and questionnaire design, and providedearly evidence for validity and clinical utility of each PU-QOL scale as reflected by clinically meaningful hierarchicalscales, prior to formal psychometric evaluation.The aim of this study was to provide researchers and
clinicians with a comprehensive evaluation of some ofthe fundamental psychometric measurement propertiesof the provisional PU-QOL instrument.
MethodsWe followed international PRO guidelines [9,19-21] for thedevelopment and validation of the PU-QOL instrument(Figure 1). Collaboration was sought from members of theEuropean Pressure Ulcer Advisory Panel (EPUAP) andfrom 29 acute and primary care NHS organisations aroundthe UK. A UK NHS Research Ethics Committee providedethical approval and all participants gave written informedconsent to participation.
Field test one designSampleThe first field test was undertaken to construct PU-QOLscales and perform a preliminary psychometric evaluationin a large sample of patients with PUs. Patients from acuteand community NHS Trusts around England and Scotlandwere included if they were aged ≥18 years, with an existingPU of any category, location or duration, and able to pro-vide informed consent to participate. Patients were ex-cluded if they had only moisture lesions, were unconscious,confused, cognitively impaired, deemed ethically inappro-priate to approach, did not speak or understand English orunable to provide informed consent.Eligible patients were purposively sampled, ensuring
balanced representation across PU categories (superfi-cial, severe) and skin sites (torso, limb), setting (acute,community), age (<70 years, ≥70) and gender. The ‘rule ofthumb’ sample size recommendation for psychometric ana-lyses of new summated scales is five to 10 subjects peritem, to reduce the effect of chance [19,22]. Following thisrecommendation, if the longest potential summated scalewas taken (pain containing 11 items), then a 110 patientsample would be required. For the Rasch analysis, a sampleof around 250 patients would allow sample selection acrossthe full measurement range; membership to five classinterval groups of around 50 patients in each group is sug-gested [23,24].
Rasch analysisA preliminary psychometric evaluation was performedusing both traditional psychometrics in line with pro-posed US Food and Drug Administration (FDA) criteria[9] and new psychometric methods, Rasch MeasurementTheory (RMT) [25]. RMT is increasingly used in thedevelopment of PRO instruments [26,27] as it provides a
Gorecki et al. Health and Quality of Life Outcomes 2013, 11:95 Page 2 of 12http://www.hqlo.com/content/11/1/95

formal method for evaluating scale functioning against asophisticated mathematical measurement model, the Raschmodel [25].A Rasch analysis, using the Andrich Rating Scale
Model [28], was performed using RUMM2030 [29].The following properties of the provisional PU-QOLversion were examined: mode of administration (patientself-completed or researcher administered; data will bepublished separately), scale targeting, item response cat-egories, item series (e.g. item-fit) and response bias, toguide scale construction and identify items with poor psy-chometric properties for possible elimination. PU-QOLdata was tested against model expectations and any devia-tions were examined to determine whether scales could beimproved. Final decisions on item inclusion/exclusion weremade according to appraisals of the analyses againstmeasurement criteria (Table 1) and clinical relevance(the extent to which items within proposed scales areclinically cohesive), as opposed to examinations carried outsingularly or sequentially.
Traditional analysisThe 10 Rasch constructed scales underwent a preliminarypsychometric evaluation using traditional psychometrictests [9,11,22] for: acceptability, scaling assumptions, reli-ability, and validity. SPSS 15.0 software was used for theseanalyses. Psychometric tests and criteria are summarised inTable 1.
Field test two designSampleThe second field test was undertaken to perform a com-prehensive psychometric evaluation of the final (10 scale/83-item) PU-QOL in a large independent sample of pa-tients with PUs (eligibility criteria and methods as for fieldtest 1.1). A sample of around 250 patients would providesufficient participants to estimate test-retest reliability;correlations at levels expected in test-retest situations(e.g. r >= 0.80) can be estimated with reasonable pre-cision (95% confidence intervals of ±0.1) with rela-tively few subjects [46,47].
• Literature review-generated broad HRQL domains/important PU-specific PROs identified
• Clinical expert opinion-produced a working conceptual framework
• Qualitative interviews (n=30) with people with PUs - revised conceptual framework
• Clinical and methodological expert review = produced a conceptual framwork of HRQL outcomes
1. Construct Defintion - PRO development should be
underpinned by theory (have a strong conceptual base) and consideration of the target
population (i.e. people with PUs)
• Literature review of PU and other chronic wound measures-no PU instrument available
• Content from existing instruments did not comprehensively represent PU-specific conceptual domains
2. Establish need for a new measure -
map content from existing instruments to conceptual
framework
• Qualitative interview transcripts reviewed (30)-patient words taken for items
• Operationalisation-content analysed and revised, producing 117 items into 13 scales
• Clinical and methodological expert review = produced a preliminary instrument
3. Item Generation
• Semi-structured cognitive interviews with people with PUs (n=35)-identified problems with item content (ambiguous, confusing), layout and administration
• Revised instrument based on patient recommendations• Clinical and methodological expert review = produced a first draft PU-QOL instrument
4. Pre-testing
• Item analysis and scale construction (n=227)• Rasch analysis followed by traditional psychometric tests for reliability and validity
• Sub-sample (n=75) randomised to self-complete or administered groups and differential item functioning performed to determine the best administration mode for this population
• Clinical and methodological expert review-considered analyses in combination and clinical relevance- modified first draft PU-QOL
5a. Field Test 1-
5b. Mode of Administration Study
• Final psychometric analysis (n=229)• Rasch analysis followed by traditional psychometric tests for reliability and validity
• Clinical and methodological expert review = produced final version PU-QOL
6. Field Test 2
Figure 1 Steps towards developing and evaluating the PU-QOL instrument.
Gorecki et al. Health and Quality of Life Outcomes 2013, 11:95 Page 3 of 12http://www.hqlo.com/content/11/1/95

Table 1 Psychometric tests and criteria used in the evaluation of the PU-QOL instrument
Psychometric property Traditional methods - test and criteria Rasch methods - test and criteria
Acceptability and data quality - Completenessof item- and scale-level data.
● Score distributions (floor/ceiling effects andskew of scale scores)
● Even distribution of endorsement frequenciesacross response categories (>80%)
● % of item-level missing data (<10%) [30] ● Low number of persons at extreme (i.e. floor/ceiling) ends of the measurement continuum
● % of computable scale scores (>50%completed items) [31]
● Items in scales rated ‘not relevant’ <35%
Scaling assumptions - Legitimacy of summinga set of items (items should measure a commonunderlying construct).
● Similar item mean scores [32] and SDs [33] ● Positive residual r between items (<0.30)
● Items have adequate corrected ITC (ITC ≥0.3)[34]
● High negative residual r (>0.60) suggestsredundancy
● Items have similar ITCs [34] ● Items sharing common variance suggestsuni-dimensionality
● Items do not measure at the same pointon the scale ● Evenly spaced items spanning whole
measurement range
Item response categories - categories in alogical hierarchy.
● NA ● Ordered set of response thresholds for eachscale item
Targeting - extent to which the range of thevariable measured by the scale matches therange of that variable in the study sample.
● Scale scores spanning entire scale range ● Person-item threshold distribution: personlocations should be covered by items anditem locations covered by persons when bothcalibrated on the same metric scale [35]
● Floor and ceiling (proportion sample atminimum and maximum scale score) effectsshould be low (<15%) [36]
● Skewness statistics should range from −1to +1 [37]
● Good targeting demonstrated by the meanlocation of items and persons around zero
● No published criteria for item level targeting
Reliability
Internal consistency - extent to which itemscomprising a scale measure the sameconstruct (e.g. homogeneity of the scale).
● Cronbach's alphas for summary scores(adequate scale internal consistency is ≥0.70 [22]
● High person separation index >0.7 [38];quantifies how reliably person measurementsare separated by items
● Item-total r between +0.4 and +0.6 indicateitems are moderately correlated with scalescores; higher values indicate well correlateditems with scale scores [22]
● Power-of-tests indicate the power in detectingthe extent to which the data do not fit themodel [24]
● Items with ordered thresholds
*Test-retest reliability - stability of a measuringinstrument.
● Intra-class r coefficient >0.70 between testand retest scores [11]
● Statistical stability across time points (no uniformor non-uniform item DIF (p=>0.05 or Bonferroniadjusted value))
● Pearson r: >0.7 indicates reliable scale stability
Validity ● Involves accumulating evidence fromdifferent forms
Content validity - extent to which the content(items) of a scale is representative of theconceptual construct it is intended to measure.
● Consideration of item sufficiency and thetarget population
● Clearly defined construct
● Qualitative evidence from individuals forwhom the measure is targeted, expert opinionand literature review (e.g. theoretical and/orconceptual definitions) [9].
● Validity comes from careful item constructionand consideration of what each item is meantto measure, then testing against modelexpectations
Construct validity
i) Within-scale analyses - extent to which adistinct construct is being measured and thatitems can be combined to form a scale score.
● Cronbach alpha for scale scores >0.70 ● Fit residuals (item-person interaction) withingiven range +/−2.5
● ITC >0.30
● Homogeneity coefficient (IIC mean andrange >0.3)
● Non-significant chi square (item-trait interaction)values
● Scaling success ● No under- or over-discriminating ICC
● Mean fit residual close to 0.0; SD approaching1.0 [39]
● Person fit residuals within given range +/−2.5
Gorecki et al. Health and Quality of Life Outcomes 2013, 11:95 Page 4 of 12http://www.hqlo.com/content/11/1/95

Rasch analysisA Rasch analysis was performed on all 10 PU-QOL scales.In addition to the properties examined in for field test 1,differential item functioning (DIF) was also assessed. DIFoccurs when people from different groups (e.g. gender)with the same latent trait (e.g. pain) have a different prob-ability of giving a certain response to an item [44]. Groupsto be studied were selected based on theoretical consider-ations about whether or not the construct measured byeach PU-QOL scale was hypothesised to have the sameconceptual meaning across groups.
Traditional analysisThe final PU-QOL version underwent traditional psy-chometric analyses as described in for field test 1.Additional tests for reliability (test re-test) and validity,
including both within- and between-scales testing (con-vergent, discriminant, known groups) were undertaken(Table 1). To minimise respondent burden, the SF-12v2Acute, English (UK) version was used [48] to examineconvergent validity.
ResultsField-test one: scale construction and preliminarypsychometric evaluationSampleThe first field test screened 989 patients from 21hospitals, 10 community services and one hospice. Ofthose screened, eligibility was assessed for 787 (79.6%);416 were considered eligible (52.9%); and of those eli-gible, 287 (69.0%) consented to participate; however, 60were excluded from analysis as they self-completed the
Table 1 Psychometric tests and criteria used in the evaluation of the PU-QOL instrument (Continued)
Measurement continuum - extent to whichscale items mark out the construct as acontinuum on which people can be measured.
● NA ● Individual scale items located across acontinuum in the same way locations ofpeople are spread across the continuum [26]
● Items spread evenly over a reasonablemeasurement range [40,41]. Items with similarlocations may indicate item redundancy
Response dependency –response to oneitem determines response to another.
● NA ● Response dependency is indicated by residualr >0.3 for pairs of items [40,41]
ii) Between scale analysis
Criterion Validity - hypotheses based oncriterion or ‘gold standard’ measure.
● There are no true gold standard HRQL [42],PU-specific or chronic wound-specificmeasures available [12]
● NA
*Convergent validity - scale correlated withother measures of the same/ similar constructs.
● Moderate to high r predicted for similarscales; criteria used as guides to themagnitude of r, as opposed to pass/failbenchmarks (high r >0.7; moderater=0.3-0.7; low r <0.3) [43]
● NA
*Discriminant validity – scale not correlatedwith measures of different constructs
● Low r (<0.3) predicted between scale scoresand measures of different constructs(e.g. age, gender)
● NA
*Known groups differences - ability of ascale to differentiate known groups
● ^Generate hypotheses (based on subgroupsknown to differ on construct measured) andcompare mean scores (e.g. predict a stepwisechange in PU-QOL scale scores across 3 PUseverity groups and that mean scores wouldbe significantly different)
● Hypothesis testing (e.g. clinical questions areformulated and the empirical testing comesfrom whether or not data fit the Rasch model)
● Statistically significant differences in meanscores (ANOVA)
*Differential item functioning (item bias) -The extent of any conditional relationshipsbetween item response and group membership.
● NA ● Persons with similar ability should respond insimilar ways to individual items regardless ofgroup membership (e.g. age) [44]
● Uniform DIF - uniformity amongst differencesbetween groups
● Non-Uniform DIF - non-uniformity amongstdifferences between groups; can be consideredat 1% (Bonferroni adjusted) and 5% CIs
Table adapted from [35,45]; *Additional tests performed for field test two; ^The PU HRQL literature is not well established, therefore was limited for identifyingclinical parameters to formulate known groups; NA No test for particular psychometric property; SD Standard deviation; ITC Item total correlation; IIT Inter-itemcorrelation; ICC Item characteristic curve; r correlation; ANOVA, Analysis of variance; DIF Differential item functioning; CI Confidence interval.
Gorecki et al. Health and Quality of Life Outcomes 2013, 11:95 Page 5 of 12http://www.hqlo.com/content/11/1/95
PU-QOL (data on the self-completed sample will bepublished elsewhere). Cognitive impairment was themain reason for ineligibility (38.8%). Table 2 presents thesample characteristics.
Rasch analysis: item reduction and scale formationThe first psychometric evaluation produced a 10-scaleinstrument (Table 3). The Rasch analysis detected im-portant limitations of the PU-QOL scales, resulting inmodifications. It detected that the four-category itemscoring function did not work as intended for multipleitems. For those items where the response categorieswere working as intended, thresholds were close to beingdisordered; people had difficulty distinguishing between‘a little bother’ and ‘quite a bit of bother’ categories. Thisprovided good evidence that items would benefit fromfewer response categories. All scale items were subjectedto a post hoc rescoring by collapsing adjacent categories.Re-analysis demonstrated that all thresholds were nowcorrectly ordered, producing scales with three categories(0 = no bother, 1 = little bother, 2 = a lot of bother).Targeting between the distribution of person mea-
surements and item locations indicated that the sam-ples were adequate for examining the scales but thescales were suboptimal for measuring the sample. Sig-nificant ceiling effects indicated that scales might pro-vide limited information about people at the extremesof the sample distribution (those with least disability/impairment). However, the location ordering of scaleitems was clinically sensible, providing evidence towardsconstruct validity. Some items had notable criterion fail-ures: fit residuals outside +/−2.5; high chi-squared valueswith significant p-value, and significantly under- or over-discriminating item characteristic curves (Table 3). Fewitems exceeded +/−0.3 residual correlations, indicating thatitem responses are independent of each other and no re-dundant items. Departures from item fit expectation wereconsidered in combination and guided item removal. Per-son separation index values indicated good to reasonablereliability for scales distinguishing between responders oneach scale variable (Table 3).
Traditional analysisA preliminary psychometric evaluation against traditionalpsychometric criteria supported the PU-QOL scales as reli-able and valid measures of PU-symptoms, physical andsocial functioning, and psychological well-being. Briefly,data quality was high (scale scores were computable for93–99.6% of respondents) and scaling assumptions weresatisfied (similar mean item scores, corrected item-totalcorrelations ranged 0.53-0.92). Scale-to-sample targetingwas good (scale scores spanned the scale range but werenotably skewed for three scales (values outside +/−1.0),mean scores were near scale mid-points for 67% of scales,
Table 2 Participant characteristics
Field test 1 Field test 2
Characteristics Range (Mean, SD) Range (Mean, SD)
Age 24 - 98 (72, 13.5) 20 - 103 (71.3, 16.5)
Gender Total n (%) Total n (%)
Total n=227 n=229
Male 90 (39.6) 119 (52.0)
Female 137 (60.4) 110 (48.0)
Ethnicity
White 223 (98.2) 227 (99.1)
Asian 1 (0.4) 2 (0.9)
Black/African 2 (0.4) 0
Chinese 0 0
Not stated 1 (0.4) 0
Setting
Hospital (surgery) 99 (43.6) 62 (27.1)
Hospital (medicine) 21 (9.3) 74 (32.3)
Community 107 (47.1) 88 (38.4)
PU severity
Category 1 38 (10.6%) 76 (18.1%)
Category 2 144 (40.2%) 170 (40.5%)
Category 3/4 153 (42.7%) 170 (40.5%)
Missing 1 (0.3%) 4 (0.9%)
PU risk classification
Short-term risk 39 (17.2) 36 (15.7)
Medium to long-term risk 71 (31.3) 87 (38.0)
On-going long-term risk 116 (51.1) 103 (45.0)
Missing 1 (0.4) 3 (1.3)
Marital status
Single 59 (26.0) 71 (31.0)
Married 85 (37.5) 77 (33.6)
Cohabiting 81 (35.7) 75 (32.8)
Missing 2 (0.8) 6 (2.6)
Living arrangements
Live alone 84 (37.0) 86 (37.6)
Cohabit with carer 63 (27.8) 51 (22.3)
Cohabit with other 61 (26.9) 48 (20.9)
Missing 19 (8.4) 44 (19.2)
Education
No formal education 129 (56.8) 125 (54.6)
GCSE or equivalent 39 (17.2) 40 (17.5)
A-Level or equivalent 25 (11.0) 16 (6.9)
Degree or higher 15 (6.6) 21 (9.2)
Missing 19 (8.4) 27 (11.8)
Gorecki et al. Health and Quality of Life Outcomes 2013, 11:95 Page 6 of 12http://www.hqlo.com/content/11/1/95

and ceiling effects were negligible; however floor effectsexceeded the 15% criterion for two scales. Reliability washigh as demonstrated by Cronbach’s alpha values (range0.89-0.96; Table 3). The item-total correlations, alpha coef-ficient and homogeneity coefficient (inter-item correlationmean and range; Table 3) provide evidence towards the in-ternal construct validity of PU-QOL scales.
Field-test two: final psychometric evaluationSampleThe second field test involved a comprehensive psycho-metric evaluation of the final (10 scale/83-item) PU-QOL,using RMT and traditional psychometric methods. A totalof 879 patients were screened of whom eligibility wasassessed for 717 (81.6%); 391 were considered eligible(54.5%); and of those eligible, 231 (59.1%) consented toparticipate; however two were excluded from analysis (one
patient died; one patient was recruited twice). Table 2 pre-sents the sample characteristics.
Rasch analysisThe measurement properties of PU-QOL scales werelargely supported as demonstrated through items thatmapped out continua of increasing intensity and locateditems along those continua in a clinically sensible order.Scale items work together to define single variables, al-beit, some item misfit and local dependence (Table 4).DIF was demonstrated in three items (e.g. items ‘diffi-culty standing for long periods’ and ‘limited in ability togo up and down stairs’ from the mobility scale; Table 4),however deviations from model expectations were mar-ginal, suggesting item performance across the four clin-ical subgroups is stable and that these groups can bemeasured on a common ruler.
Table 3 Summary of preliminary PU-QOL instrument psychometric analysis, field test 1
Scale (No. of items) Rasch analysis Traditional psychometric analysis
Items withdisorderedthresholds
Itemlocations
logits range
Fit statisticsfit residuals
outside +/−2.5
Items with Chisquare probabilitysignificance ≥0.001
Personseparation
index
Cronbachalpha
Range IIC Scalingassumptionscorrected ITC
Pain (8) 5 -0.94 − 0.80 0 4 0.78 0.89 0.24 – 0.66 0.53 – 0.70^
Exudate (8) 4 -0.51 − 0.48 0 0 0.59 0.92 0.40 – 0.86 0.56 – 0.84^
Odour (6) 2 -1.47 − 0.60 0 0 0.62 0.96 0.74 – 0.91 0.83 – 0.92^
Sleep (6) 3 -0.54 − 0.31 0 0 0.62 0.92 0.48 – 0.84 0.67 – 0.86^
Vitality (3) 0 -0.48 − 0.44 0 0 0.03 n/a n/a n/a
Movement/mobility (11) 4 -0.33 − 0.48 0 0 0.58 0.93 0.23 – 0.91 0.67 – 0.80^
ADL (9) 8 -0.54 − 0.57 0 0 0.29 0.95 0.41 – 0.90 0.58 – 0.90^
Emotional well-being (17) 4 -1.15 − 1.46 1 0 0.82 0.93 0.24 – 0.79 0.54 – 0.76^
Appearance & self-consciousness (7)
4 -0.83 − 0.65 0 0 0.56 0.90 0.41 – 0.75 0.60 – 0.79^
Participation (9) 4 -0.56 − 0.54 0 0 0.65 0.96 0.53 – 0.89 0.73 – 0.90^
IIC inter-item correlation; ^Range item-total correlation (ITC).
Table 4 Summary of PU-QOL Rasch analysis, field test 2
Scale (No. of items) Disorderedthresholds
Item locationslogits range
Fit statisticsfit residuals
outside +/−2.5
Items with Chisquare probabilitysignificance ≥0.001
Personseparation
index
DIF age DIF gender DIF HC setting
Uni Non Uni Non Uni Non
Pain (8) 0 -1.11 − 1.03 0 0 0.72 0 0 0 0 0 0
Exudate (8) 1 -0.75 – 0.84 1 1 0.69 0 0 0 0 0 0
Odour (6) 0 -1.31 – 0.91 0 0 0.66 0 0 0 0 0 0
Sleep (6) 0 -0.91 – 0.45 1 1 0.62 0 0 0 0 0 0
Mobility and movement (9) 2 -0.46 – 0.57 0 0 0.42 0 0 0 0 2 0
Activity (8) 4 -0.30 – 0.56 0 0 0.27 0 0 0 0 0 0
Vitality (6) 0 -0.50 – 0.81 0 0 0.38 1 0 0 0 0 0
Emotional well-being (15) 2 -1.48 – 2.44 0 0 0.86 0 0 0 0 0 0
Self-consciousness (7) 0 -1.27 – 1.02 0 0 0.58 0 0 0 0 0 0
Participation (9) 7 -0.91 – 1.00 0 0 0.57 0 0 0 0 0 0
DIF differential item functioning; HC healthcare; Uni uniform DIF; Non non-uniform DIF.
Gorecki et al. Health and Quality of Life Outcomes 2013, 11:95 Page 7 of 12http://www.hqlo.com/content/11/1/95

The Rasch analysis detected some important limita-tions; the three-category scoring function did not workas intended for some scale items, indicated by disor-dered thresholds (e.g. items ‘walking slowed’ and ‘lim-ited in ability to walk’ from the mobility scale; items‘regular activities’ and ‘jobs around the house’ from theactivity scale), and targeting problems emerged. Inspec-tion of threshold distributions demonstrated sub-optimaltargeting of PU-QOL scales to the study sample for mostscales (items did not span the full range of the patientsample, indicating that measurement could be improvedat the extreme ends of some scales; Table 4. The largestfrequency of respondents was often at the ceiling of scaleranges (least bother). Ideally, there should be a goodmatch between the scale and sample ranges, with peoplefalling within the range of the items. As sample sizeswere small for some scales (e.g. removing people with noodour bother resulted in a sample of 27 for analysis), itwas deemed premature to make major modifications toitems and the scoring function without additional empir-ical evidence.
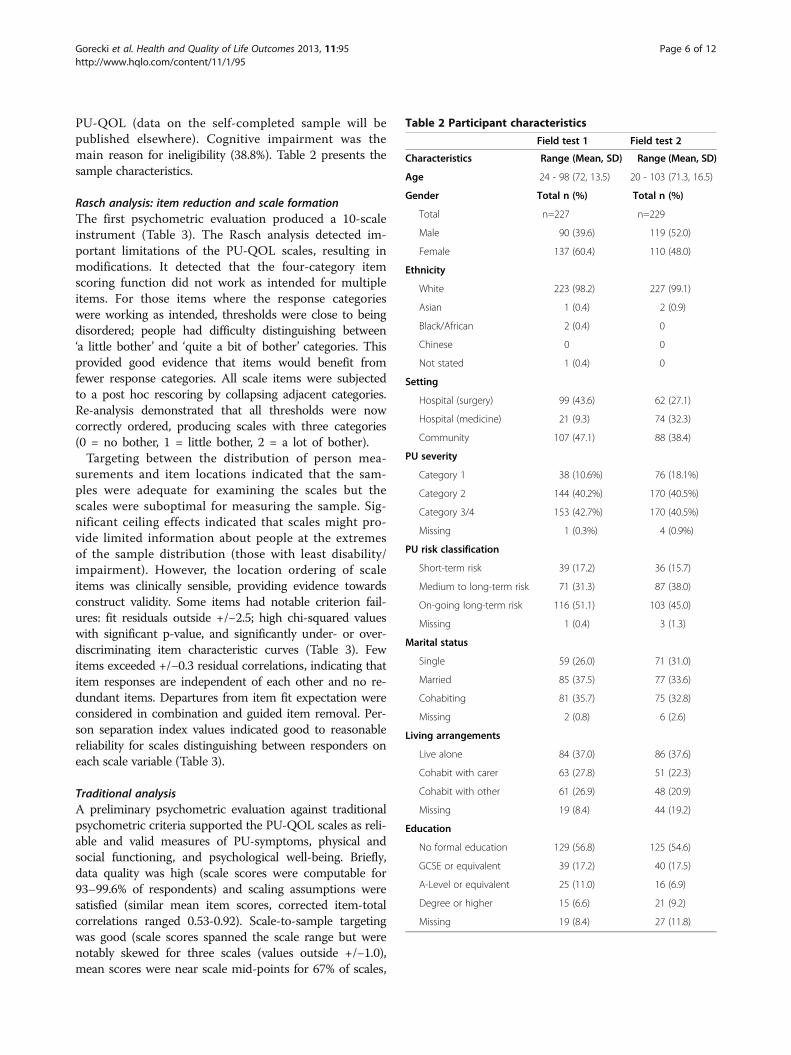
Traditional analysisThe traditional psychometric evaluation supported thePU-QOL scales as reliable and valid measures of PU-symptoms, physical and social functioning, and psycho-logical well-being. Total scores could be computed formost people (computable scale scores ranged 95.6-99.6%),implying good data quality. Scaling assumptions were satis-fied (corrected item-total correlations ranged 0.51-0.94).All item-own-scale correlations were high (corrected item-total correlations ranged 0.525-0.920; Table 5) and satisfiedrecommended criteria (> 0.3), thus providing support thatitems within scales measured a common underlying con-struct. Corrected item-total correlation >0.3 indicated thatitems within scales contained a similar proportion of infor-mation. Scale-to-sample targeting was reasonable: scalescores spanned the scale ranges but were notably skewedfor exudate odour and self-consciousness scales (value out-side +/−1.0); mean scores were near scale mid-points foronly pain, sleep and mobility scales, however due to manypeople responding at the floor (lowest score), this findingis expected; and ceiling effects were negligible, howeverfloor effects exceeded the 15% criterion for exudate, odour,vitality, and appearance and self-consciousness scales.Reliability was high as demonstrated by Cronbach’s
alpha values for all PU-QOL scales exceeding the stand-ard criterion of 0.7 (Table 5). Item–total correlationsranged 0.525-0.920, fulfilling the recommended criteria(>0.3). Test-retest correlations for 8/10 scales exceeded0.7; two scales had correlations below the recommendedcriteria, but marginally (Table 5), thus mostly fulfillingthe recommended minimum criteria and indicating goodscale stability.
Evidence of internal construct validity was supported bymoderate to high item-total correlations; high Cronbach’scoefficient alphas; and moderate to high inter-item correla-tions (means >0.48; ranges 0.226-0.934; Table 5), indicatingthat each PU-QOL scale measures a single construct.Hypothesised correlations between PU-QOL and relatedSF-12 scales were consistent with predictions (Table 5),thus providing support that scales measure what they in-tend to measure; moderate to high correlations (r >0.30)were predicted. Correlations between PU-QOL scales andsociodemographic variables (age, gender) were consistentwith predictions (r <0.30; Table 5), suggesting responses toscales are not biased by age or gender. Hypothesised groupdifferences were as predicted for scales: exudate, odour,vitality, daily activities, emotional well-being, and self-consciousness, with significant step increases in meanscores observed by PU severity groups. In contrast, therewas no step increase in mean scores for scales: pain, sleep,mobility and movement, and participation. Apart from thesleep scale, the mean score on outcomes for category 1 PUseverity was lower than category 3/4 severity, suggestingthat HRQL outcomes are worse for people with severe PUscompared to those with superficial category 1 PUs. It is im-portant to note that category 1 PUs had small samples(range 4–14 patients) therefore known groups results areconsidered preliminary.
Final PU-QOL InstrumentThe final PU-QOL is a self-report instrument, comprisingof 10 scales. These include three symptom (pain (8 items),exudate (8 items), odour (6 items)), plus an itchiness item;four physical functioning (sleep (6 items), movementand mobility (9 items), daily activities (8 items), vitality(5 items)); two psychological well-being (emotionalwell-being (15 items), self-consciousness and appearance(7 items)); and one social participation scale (9 items). Itis intended for administration where patients rate theamount of “bother” attributed (e.g. “During the past week,how much have you been bothered by…?”) on a 3-point re-sponse scale (e.g. 0=not at all - 2=a lot). Scale scores aregenerated by summing items and then transforming to a0–100 scale. High scores indicate greater patient bother.
DiscussionThe PU field requires a strong evidence-base that incor-porates health outcome measurement from the patientperspective. To fully capture and quantify the patients’viewpoint, appropriately constructed and validated in-struments are required. The PU-QOL instrument con-sists of 10 scales for measuring symptoms and physical,psychological, and social functioning specific to PUs.This is the first outcome measure reflecting PU-specificconceptual HRQL domains; content that differs from otherchronic wound-specific instruments [12], and provides a
Gorecki et al. Health and Quality of Life Outcomes 2013, 11:95 Page 8 of 12http://www.hqlo.com/content/11/1/95
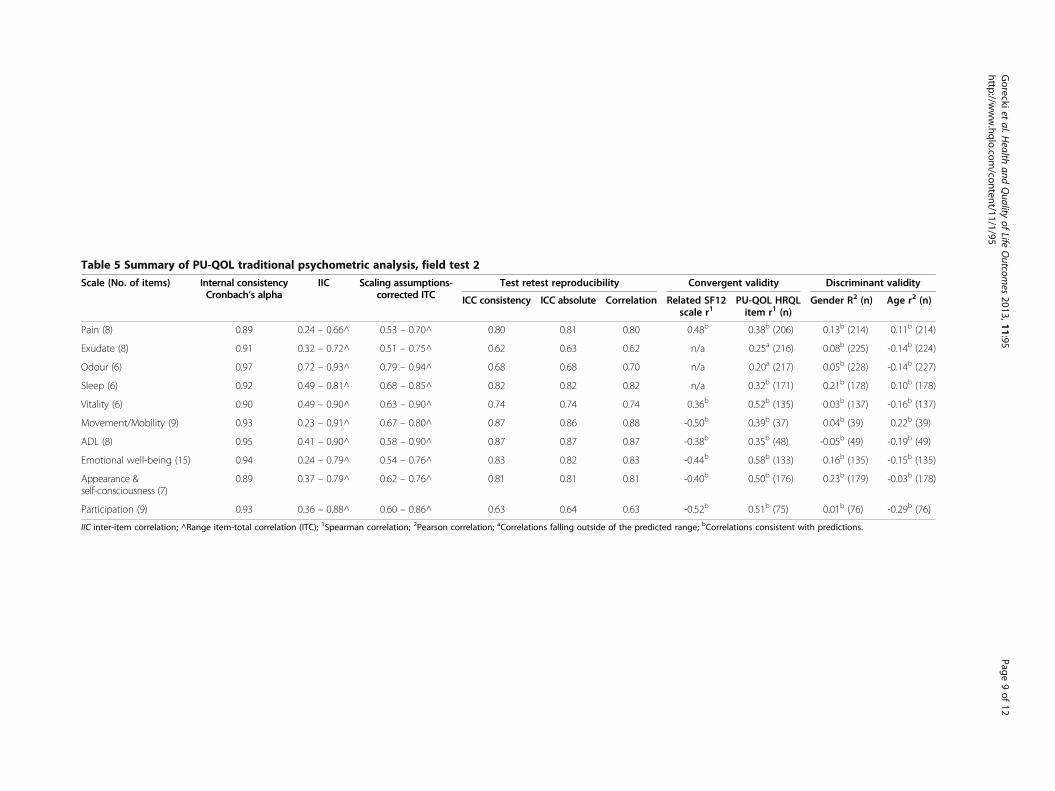
Table 5 Summary of PU-QOL traditional psychometric analysis, field test 2
Scale (No. of items) Internal consistencyCronbach’s alpha
IIC Scaling assumptions-corrected ITC
Test retest reproducibility Convergent validity Discriminant validity
ICC consistency ICC absolute Correlation Related SF12scale r1
PU-QOL HRQLitem r1 (n)
Gender R2 (n) Age r2 (n)
Pain (8) 0.89 0.24 – 0.66^ 0.53 – 0.70^ 0.80 0.81 0.80 0.48b 0.38b (206) 0.13b (214) 0.11b (214)
Exudate (8) 0.91 0.32 – 0.72^ 0.51 – 0.75^ 0.62 0.63 0.62 n/a 0.25a (216) 0.08b (225) -0.14b (224)
Odour (6) 0.97 0.72 – 0.93^ 0.79 – 0.94^ 0.68 0.68 0.70 n/a 0.20a (217) 0.05b (228) -0.14b (227)
Sleep (6) 0.92 0.49 – 0.81^ 0.68 – 0.85^ 0.82 0.82 0.82 n/a 0.32b (171) 0.21b (178) 0.10b (178)
Vitality (6) 0.90 0.49 – 0.90^ 0.63 – 0.90^ 0.74 0.74 0.74 0.36b 0.52b (135) 0.03b (137) -0.16b (137)
Movement/Mobility (9) 0.93 0.23 – 0.91^ 0.67 – 0.80^ 0.87 0.86 0.88 -0.50b 0.39b (37) 0.04b (39) 0.22b (39)
ADL (8) 0.95 0.41 – 0.90^ 0.58 – 0.90^ 0.87 0.87 0.87 -0.38b 0.35b (48) -0.05b (49) -0.19b (49)
Emotional well-being (15) 0.94 0.24 – 0.79^ 0.54 – 0.76^ 0.83 0.82 0.83 -0.44b 0.58b (133) 0.16b (135) -0.15b (135)
Appearance &self-consciousness (7)
0.89 0.37 – 0.79^ 0.62 – 0.76^ 0.81 0.81 0.81 -0.40b 0.50b (176) 0.23b (179) -0.03b (178)
Participation (9) 0.93 0.36 – 0.88^ 0.60 – 0.86^ 0.63 0.64 0.63 -0.52b 0.51b (75) 0.01b (76) -0.29b (76)
IIC inter-item correlation; ^Range item-total correlation (ITC); 1Spearman correlation; 2Pearson correlation; aCorrelations falling outside of the predicted range; bCorrelations consistent with predictions.
Goreckiet
al.Health
andQuality
ofLife
Outcom
es2013,11:95
Page9of
12http://w
ww.hqlo.com
/content/11/1/95

framework for designing future research that consequentlyimproves the quality of research in the field by inclusion ofPU-specific PROs.Scale development and item reduction were primarily
guided by RMT. RMT provides a powerful framework toguide scale construction by detecting items deviating frommodel expectations with the intention of improving scaleattributes. Evidence from RMT was used to understandwhy some scale items were not working and to pin pointwhere improvements could be made. However, final deci-sions on item inclusion were made according to appraisalsof the analyses of the observed data against measurementcriteria and clinical relevance, as opposed to examinationscarried out singularly or sequentially.The final psychometric evaluation demonstrated that
PU-QOL scales mostly satisfy criteria for acceptability,reliability and validity, in line with recommended FDAguidelines for measurement [9]. However, the Raschanalysis detected targeting problems despite attempts tosample a wide variety of patients with PUs drawn acrosssettings. Targeting is justified for the exudate and odourscales as not all patients have these problems; it is clinic-ally reasonable that these people fall outside the scalerange. Importantly, where people have symptom bother,there needs to be items within the scales that discrimin-ate symptom bother, and in this instance, the symptomscales perform this function. For the remaining scales,targeting could be improved by developing items thatspan a wider measurement range, and in the process,maximise the potential of the PU-QOL to detect change.Extending the measurement range can be achieved with-out affecting the scales as they stand, because the itemlocations are calibrated relative to each other. Importantto note, scale scores for >65% of the samples were withinthe best performing part of all scales. For example, thepain scale items spread 2-logits compared to a personspread of 7 logits, indicating suboptimal targeting. Butfor the majority of people in the sample, the measure-ment range distribution was within the range wheremost people lay, indicating good pain scale performance.Given the heterogeneity of the population with PUs,
further work is required to ensure that the PU-QOLscales fit the needs of all people with PUs includingpatients with superficial PUs. Appropriateness of PU-QOL’suse in individual decision-making needs investigation;strengthening the measurement precision could improvethe PU-QOLs ability to detect differences in HRQL out-comes between people with different PU severity. Thisis important for making inferences from future researchusing the PU-QOL. However, one consideration is thatduring field testing, as is standard practice, patients re-ceived some form of treatment for their PU; informationthat was not collected (e.g. amount of analgesia). There-fore, the true impact of PUs may not have been captured
(lower severity represented in the sample due to treatmenteffect) and be the reason for, at least in part, mistargetingand misrepresentation of known groups testing. Inactual fact, PUs appear to cause patients more bother(as indicated from the qualitative work) than was repre-sented but good care received lowered PU impact in thesample. This is a methodological issue in this area. Finally,the three-category scoring function did not work asintended for some scale items and requires exploration.The above limitations do not preclude use of the PU-QOLinstrument. PU-QOL scales can be included as one out-come measure, amongst others, for group comparisons infuture PU research (e.g. clinical trials) on the proviso thatstudies have built in a parallel psychometric analysis toindicate the performance (psychometric evaluation) of thescales in future samples.The final Rasch analyses provides an initial evidence-
base for future testing to improve the PU-QOL scalesand to establish the extent that psychometrically soundscales have been developed. Future scale developmentscan be empirically driven; the distribution of item loca-tions highlight where ‘gaps’ in the measurement con-tinuum are (fill notable distances in item locations withitems, particularly those representing superficial PU im-pact and extend the measurement range at the extremeends of the continuum). The process of modifying anewly developed instrument is part of an evolving, on-going measurement process intended to strengthen thehypothesised conceptual relationships with empiric evi-dence [49]. The usefulness of new measures is thereforedemonstrated by multiple applications in different stud-ies (accumulative body of evidence to support scalemeasurement properties). Future research will investi-gate the sensitivity of PU-QOL scales to change andresponsiveness, and develop an instrument to enable eco-nomic evaluation. Development of proxy measures andlanguage translations are needed given the high prevalenceof cognitively impaired patients with PUs.The PU-QOL instrument is intended for administra-
tion, following a user manual, with adults across therange of PU severity and type (location and duration)and UK acute and community healthcare settings. Scalescan be selected depending on the nature of the researchand scale items are summed to produce scores. The PU-QOL can be used for: effectiveness intervention researchwhere improvement and/or deterioration in HRQL ismeasured; promoting patient-clinician communication(i.e. flag issues); informing changes to treatment; facili-tating priority setting and patient care and PU manage-ment decisions and assessing the care given from thepatient’s perspective. Currently, the PUQOL is most ap-propriate for people with severe PUs, as demonstratedby a lack of items to represent people with little or nobother due to PUs. The exudate and odour scales are
Gorecki et al. Health and Quality of Life Outcomes 2013, 11:95 Page 10 of 12http://www.hqlo.com/content/11/1/95

not intended for people with superficial category 1 PUs.Electronically defined ‘skip’ questions would assist inselecting scales and items relevant to each individual’scircumstance.As the PU-QOL was developed and evaluated in the
UK, the validity and reliability are characteristics of theinstrument for a specific population (i.e. UK nationals)and should therefore be re-evaluated for a new popula-tion. A language translation or cross-cultural adaptionmay be required to ensure that the PU-QOL is appropri-ate for cultures, languages and ethnic groups outside theUK (see the PU-QOL instrument website for guidanceon language translation and cross-cultural adaptationprocesses: http://ctru.leeds.ac.uk/Skin).This research highlights the importance of fully testing
instruments before clinicians and researchers applythem. It highlights the value of item-level analyses, nottypically undertaken, that identified problems with thePU-QOL scales not detected by standard tests of scalereliability and validity. It also demonstrated that small it-erative steps, using mixed methods in an interactive way,rather than the traditional three stage approach to PROdevelopment (i.e. qualitative work to generate constructsand content, pre-testing and psychometric evaluation)may be beneficial, particularly at early content and scaleformat/design to understand and resolve instrument is-sues early in the development process. Both qualitativeand empirical findings should be used to inform subse-quent work and to make improvements to scales. Uni-formity of research approaches for PRO developmentcould lead to consistency in health measurement and theinclusion of mixed methods as well as the more sophisti-cated psychometric methods, such as RMT in acceptedinternational guidelines.
ConclusionsThis study makes important contributions to the PU andwider health measurement fields. The findings demon-strate that mixed methods, including RMT were benefi-cial for developing a new PRO instrument specific forPUs; a methodology that can be applied for furtherdevelopment of the PU-QOL as well as PROs in otherhealth areas. The PU-QOL instrument provides a meansfor the comprehensive assessment of PU impact andfor quantifying the benefits of PU interventions fromthe patients perspective; thus far lacking in the area.A scientifically rigorous PRO measurement needs tobecome more commonplace in the PU field so thatthe goal of PU management can be to enhance andmaintain the HRQL of people with PUs. Subject to fur-ther development, PU-QOL is a tool with which toevaluate whether PU treatments and the healthcaregiven achieve this; outcomes that are ultimately bestjudged by patients themselves.
Competing interestsThe authors declare they have no completing interests.
Authors’ contributionsCG contributed to study concept and design, acquisition of study data,analysis and interpretation of results, and preparation of the final manuscript.JB contributed to study design, interpretation of results and preparation ofthe final manuscript. SC contributed to study design, psychometric analysis,interpretation of data, and preparation of the final manuscript. DL contributedto study design, interpretation of data and provided methodologicalexpertise. MB, SCo, CD, EM, EAN, NS and LW contributed to interpretation ofresults and preparation of the final manuscript, and provided clinical expertisethroughout the duration of the study. JN contributed to study concept anddesign, interpretation of results and preparation of the final manuscript. Allauthors read and approved the final manuscript.
AcknowledgmentsThis paper presents independent research funded by the National Institutefor Health Research (NIHR) under its Programme Grants for Applied Researchprogramme (RP-PG-0407-10056). The views expressed in this paper are thoseof the author(s) and not necessarily those of the NHS, the NIHR or theDepartment of Health. We appreciate the help of all research teams atparticipating centres around England and Scotland and the participants fortaking time to be involved in this research. We thank the health outcomemethodologists Professor Katerina Hilari, and Drs Sarah Smith, Sarah Schroter,Yasmene Alavi, and Jennifer Petrillo for reviewing the item pool and thedraft, preliminary and final versions of the PU-QOL. The PU-QOL instrumentis available to clinicians and researchers at http://ctru.leeds.ac.uk/Skin.Practical information necessary for administration and scoring can be foundin a user’s manual. The manual includes information about the purposes forwhich the PU-QOL instrument should and should not be used.
Author details1Clinical Trials Research Unit (CTRU), University of Leeds, Leeds LS2 9JT, UK.2Clinical Neurology Research Group, Peninsula College of Medicine andDentistry, Plymouth, UK. 3Department of Health Services Research andTeaching, London School of Hygiene & Tropical Medicine, London, UK.4School of Healthcare, University of Leeds, Leeds, UK. 5University HospitalBirmingham NHS Foundation Trust, Birmingham, UK. 6Tissue Viability Service,Leeds Teaching Hospitals NHS Trust, Leeds, UK. 7Leeds CommunityHealthcare NHS Trust, Leeds, UK.
Received: 13 December 2012 Accepted: 5 April 2013Published: 13 June 2013
References1. National Pressure Ulcer Advisory Panel and the European Pressure Ulcer
Advisory Panel (NPUAP/EPUAP): Prevention and Treatment of Pressure Ulcers:Clinical Practice Guideline. Washington CD: NPUAP; 2009:16–20.
2. Bridel J: The epidemiology of pressure sores. Nurs Stand 1993, 7:25–30.3. Kaltenthaler E, Whitfield MD, Walters SJ, Akehurst RL, Paisley S: UK, USA and
Canada: how do their pressure ulcer prevalence and incidence datacompare? J Wound Care 2001, 10:530–535.
4. Thomas DR, Goode PS, Tarquine PH, Allman RM: Hospital-acquiredpressure ulcers and risk of death. J Am Geriatr Soc 1996, 44:1435–1440.
5. Allman RM, Goode PS, Patrick MM, Burst N, Bartolucci AA: Pressure ulcerrisk factors among hospitalized patients with activity limitation. JAMA1995, 273:865–870.
6. NHS: NHS Safety Thermometer. 2012. http://www.ic.nhs.uk/services/nhs-safety-thermometer.
7. Gorecki C, Brown J, Nelson E, Briggs M, Schoonhoven L, Dealey C, et al:Impact of pressure ulcers on quality of life in older patients: Asystematic review. J Am Geriatr Soc 2009, 57:1175–1183.
8. Spilsbury K, Nelson A, Cullum N, Iglesias C, Nixon J, Mason S: Pressureulcers and their treatment and effects on quality of life: hospitalinpatient perspectives. J Adv Nurs 2007, 57:494–504.
9. US Department of Health & Human Services FDA: Patient reported outcomemeasures: Use in medical product development to support labelling claims.MD: S Department of Health & Human Support Food & DrugAdministration; 2009.
Gorecki et al. Health and Quality of Life Outcomes 2013, 11:95 Page 11 of 12http://www.hqlo.com/content/11/1/95

10. The Cochrane Collaboration: The Cochrane Library. 2009. http://www.thecochranelibrary.com/view/0/index.html.
11. Scientific Advisory Committee of the Medical Outcomes Trust: Assessinghealth status and quality-of-life instruments: attributes and reviewcriteria. Qual Res 2002, 11:193–205.
12. Gorecki C, Nixon J, Lamping DL, Alavi Y, Brown JM: Patient-reportedoutcome measures for chronic wounds with particular reference topressure ulcer research: A systematic review. Int J Nurs Stud 2013,doi:10.1016/j.ijnurstu.2013.03.004.
13. Browne J, Jamieson L, Lawsey J, van der Meulen J, Black N, Cairns J, et al:Patient reported outcome measures (PROMs) in elective surgery. Report to theDepartment of Health. 2007. Available from: www.lshtm.ac.uk/hsru/research/PROMs-Report-12-Dec-07.pdf.
14. Greenhalgh J: The applications of PROs in clinical practice: what are they,do they work, and why? Qual Life Res 2009, 18:115–123.
15. Velikova G, Booth L, Smith A, Brown P, Lynch P, Brown J: Measuring qualityof life in routine oncology practice improves communication and patientwell-being: A randomised controlled trial. J Clin Oncol 2004, 22:714–724.
16. Gorecki C, Lamping DL, Brown JM, Madill A, Firth J, Nixon J: Developmentof a conceptual framework of health-related quality of life in pressureulcers: a patient-focused approach. Int J Nurs Stud 2010, 47:1525–1534.
17. Gorecki C, Nixon J, Madill A, Firth JJ: What influences the impact ofpressure ulcers on health-related qualityof life? A qualitative patient-focused exploration of contributory factors. J Tissue Viability 2012, 21:3–12.
18. Gorecki C, Lamping D, Nixon J, Brown J, Cano S: Applying mixed methodsto pretest the Pressure Ulcer Quality of Life (PU-QOL) instrument. QualLife Res 2012, 21:441–451.
19. Blazeby J, Sprangers M, Cull A, Groenvold M, Bottomley A, EORTC Quality ofLife Group: Guidelines for Developing Questionnaire Modules. 3rd edition. ; 2002.
20. Rothman M, Burke L, Erickson P, Kline Leidy N, Patrick D, Petrie C: Use ofexisting patient-reported outcome (PRO) instruments and their modification:The ISPOR good research practices for evaluating and documenting contentvalidity for the use of existing instruments and their modification PRO tasckforce report. Value Health 2009, 12:1075–1083.
21. Streiner D, Norman G: Health Measurement Scales: A Practical Guide to TheirDevelopment and Use. 3rd edition. Oxford: Oxford University Press; 2003.
22. Nunnally J, Bernstein I: Psychometric Theory. 3rd edition. New York: McGraw-Hill; 1994.
23. Andrich D: Rasch models for measurement. Beverly Hills: Sage Publications; 1988.24. Andrich D, Luo G, Sheridan B: Interpreting RUMM2020. Perth, WA: RUMM
Laboratory; 2004.25. Rasch G: Probabilistic models for some intelligence and attainment tests.
Chicago: University of Chicago; 1960.26. Hobart J, Cano S, Zajicek J, Thompson A: Rating scales as outcome
measures for clinical trials in neurology: problems, solutions, andrecommendations. Lancet Neurol 2007, 6:1094–1095.
27. Tennant A, McKenna S, Hagell P: Application of Rasch Analysis in theDevelopment and Application of Quality of Life Instruments. Value Health2004, 7:S22–S26.
28. Andrich D: Rating formulation for ordered response categories.Psychometrika 1978, 43:561–573.
29. Andrich D, Sheridan B, Luo G: RUMM 2030. 4.0 for windows (upgrade4600.0109. 2010. Perth, WA, RUMM Laboratory PTY LTD. Perth, WA: RUMMLaboratory; 2010. http://www.rummlab.com.au/.
30. Group WHOQOL: The World Health Organization Quality of LifeAssessment (WHOQOL): development and general psychometricproperties. Soc Sci Med 1998, 46:1569–1585.
31. Ware J, Snow K, Kosinski M, Gandek B: SF-36 Health survey: Manual andinterpretation guide. 2nd edition. Boston, USA: New England MedicalCentre; 1997.
32. Likert R: A technique for the measurement of attitudes. Arch Psychol 1932,140:5–55.
33. McHorney CA, Ware J, Lu J, Sherbourne C: The MOS 36-Item Short-FormHealth Survey (SF-36): III.Tests of data quality, scaling assumptions andreliability accross diverse patient groups. Med Care 1994, 32:40–66.
34. Ware J, Harris W, Gandek B, Rogers B, Reese P: MAP-R for windows: multitrait/multi-item analysis program - revised user's guide. Boston, MA: HealthAssessment lab; 1997.
35. Hobart JC, Cano S: Improving the evaluation of therapeutic interventionsin multiple sclerosis: the role of new psychometric methods. HealthTechnol Assess 2009, 12:1.
36. McHorney CA, Tarlov A: Individual-patient monitoring in clinical practice:are available health status surveys adequate? Qual Life Res 1995, 4:293–307.
37. Hays R, Anderson R, Revicki D: Psychometric consideration in evaluatinghealth-related quality of life measures. Qual Life Res 1993, 2:441–449.
38. Lohr KN, Aaronson NK, Alonso J, Burnam MA, Patrick DL, Perrin EB, et al:Evaluating quality-of-life and health status instruments: development ofscientific review criteria. Clin Ther 1996, 18:979–992.
39. Tennant A, Conaghan P: The measurement model model in rheumatology:What is it and why use it? When should it be applied, and what should onelook for in a Rasch paper? Arthritis Rheum 2007, 57:1358–1362.
40. Hobart J, Riazi A, Thompson A, Styles I, Ingram W, Vickery P, et al: Gettingthe measure of spasticity in multiple sclerosis: the Multiple SclerosisSpasticity Scale (MSSS-88). Brain 2006, 129:224–234.
41. Wright B, Masters G: Rating scale analysis: Rasch measurement. Chicago:MESA; 1982.
42. Fayers P, Hays R: Assessing quality of life in clinical trials: Methods andpractice. Oxford: Oxford University Press; 2005.
43. Cohen J: A coefficient of agreement for nominal scales. Educ Psychol Meas1960, 20:37–46.
44. Teresi J, Ramirez M, Lai J, Silver S: Occurences and sources of DifferentialItem Fuctioning (DIF) in patient-reported outcome measures: Descriptionof DIF methods, and review of measures of depression, quality of lifeand general health. Psychol Sci Q 2008, 50:538.
45. Lamping DL, Schroter S, Marquis P, Marrel A, Duprat-Lomon, Sagnier PP:The community-acquired pneumonia symptom questionnaire: a new,patient-based outcome measure to evaluate symptoms in patients withcommunity-acquired pneumonia. Chest 2002, 3:920–929.
46. Fleiss J: Reliability of measurements. In The design and analysis of clinicalexperiments. New York: John Wiley & Sons; 1986:2–31.
47. Guyatt G, Walter S, Norman G: Measuring change over time:assessing theusefullness of evaluative instruments. J Chron Disabil 1987, 4:171–178.
48. Ware J, Kosinski M, Turner-Bowker D: How to score version 2 of the SF-12Health Survey (with a supplement documenting version 1). Lincolm, RI: QualityMetric Incorporated; 2002.
49. Rothman ML, Beltran P, Cappelleri JC, Lipscomb J, Teschendorf B: Patient-Reported Outcomes: Conceptual Issues. Value Health 2007, 10:S66–S75.
doi:10.1186/1477-7525-11-95Cite this article as: Gorecki et al.: Development and validation of a newpatient-reported outcome measure for patients with pressure ulcers:the PU-QOL instrument. Health and Quality of Life Outcomes 2013 11:95.
Submit your next manuscript to BioMed Centraland take full advantage of:
• Convenient online submission
• Thorough peer review
• No space constraints or color figure charges
• Immediate publication on acceptance
• Inclusion in PubMed, CAS, Scopus and Google Scholar
• Research which is freely available for redistribution
Submit your manuscript at www.biomedcentral.com/submit
Gorecki et al. Health and Quality of Life Outcomes 2013, 11:95 Page 12 of 12http://www.hqlo.com/content/11/1/95