CREATION OF AN INSTRUMENT TO MEASURE CREATIVITY IN GRAPHIC DESIGN
10
CREATION OF AN INSTRUMENT TO MEASURE CREATIVITY IN GRAPHIC DESIGN José Luis Ayala Pérez, Universidad de Puerto Rico, Puerto Rico Daniel Tena Parera, Universidad Autónoma de Barcelona, España ABSTRACT This research develops a conceptual framework, which integrates creativity and graphic design. This research introduces a three-dimensional model of creativity in graphic design, which splits creativity in three dimensions, innovation, communication and aesthetics. Based on the Three-Dimensional Model of Creativity in Graphic Design, it’s an instrument to measure creativity in graphic design. The instrument was administered to 115 graphic designers of the Graphic Designers Association of Catalonia, to validate it. Finally, a coefficient was created in order to simplify the results found when using the instrument. INTRODUCTION One of the most difficult tasks, for both, junior and experienced designers, is the evaluation of the product designed and so its efficiency for the user. In the research field of graphic design there is no definitive tool that serves to evaluate its products. Most evaluations made to the pieces of design are justified by subjective scales, difficult to verify and light trustworthy. The consequences of this evaluations relapses in the fact that cannot be validated the efficiency and the quality of the pieces would be reduce to the judgment, based on a subjective variable, as it would be the preference. The utilization of instruments that would help to the evaluation of the pieces is essential for the graphic design as a discipline. Thus the designer could have a retro alimentation of his work, in his turn contributes to new knowledge and criteria’s that definitive will form part of his professional background. Different researchers such as Frascara, Costa, Tena, Heller and Chavez share this position. [...] Existing knowledge is the only method that is to succeed, is to obtain certain practical results. (Tena, 2006: 187); the assessment is an essential element of professional practice of communication design (Frascara, 2006: 111) Understanding who, what, how, when, where and of course why this design cannot be underestimated. (Heller, 2006: 13) THEORETICAL BACKGROUND For the fundamental methodology we consulted diverse precedent studies that have measure creativity in the area of publicity, which has been related graphic design (Caroff & Besançon 2008 y White, Shen & Smith 2001). These studies are sustain in the product analysis of creative products through the given judgment made by experts and expose the possibility that in the area of advertising as in more artistic sectors, the creativity might be measured with more emphasis in the originality and other dimensions. In 2003 Koslow, Sasser, and Riordan, led an investigation to compare the perception of creativity by different groups. Their research included a qualitative and a quantitative stage with the administration of a questionnaire. In the ambit of graphic design we’ve based on the studies made by Tena (1998) The influence of the graphic composition in the election of a text block and Martin (2005) The connotative meaning of the plastic sign in the visual communication. In these studies it was analyzed the aesthetic aspects.
Transcript of CREATION OF AN INSTRUMENT TO MEASURE CREATIVITY IN GRAPHIC DESIGN
CREATION OF AN INSTRUMENT TO MEASURE CREATIVITY IN GRAPHIC DESIGN
José Luis Ayala Pérez, Universidad de Puerto Rico, Puerto Rico
Daniel Tena Parera, Universidad Autónoma de Barcelona, España
ABSTRACT This research develops a conceptual framework, which integrates creativity and graphic design. This research introduces a three-dimensional model of creativity in graphic design, which splits creativity in three dimensions, innovation, communication and aesthetics. Based on the Three-Dimensional Model of Creativity in Graphic Design, it’s an instrument to measure creativity in graphic design. The instrument was administered to 115 graphic designers of the Graphic Designers Association of Catalonia, to validate it. Finally, a coefficient was created in order to simplify the results found when using the instrument.
INTRODUCTION
One of the most difficult tasks, for both, junior and experienced designers, is the evaluation of the product designed and so its efficiency for the user. In the research field of graphic design there is no definitive tool that serves to evaluate its products. Most evaluations made to the pieces of design are justified by subjective scales, difficult to verify and light trustworthy. The consequences of this evaluations relapses in the fact that cannot be validated the efficiency and the quality of the pieces would be reduce to the judgment, based on a subjective variable, as it would be the preference. The utilization of instruments that would help to the evaluation of the pieces is essential for the graphic design as a discipline. Thus the designer could have a retro alimentation of his work, in his turn contributes to new knowledge and criteria’s that definitive will form part of his professional background. Different researchers such as Frascara, Costa, Tena, Heller and Chavez share this position. [...] Existing knowledge is the only method that is to succeed, is to obtain certain practical results. (Tena, 2006: 187); the assessment is an essential element of professional practice of communication design (Frascara, 2006: 111) Understanding who, what, how, when, where and of course why this design cannot be underestimated. (Heller, 2006: 13)
THEORETICAL BACKGROUND
For the fundamental methodology we consulted diverse precedent studies that have measure creativity in the area of publicity, which has been related graphic design (Caroff & Besançon 2008 y White, Shen & Smith 2001). These studies are sustain in the product analysis of creative products through the given judgment made by experts and expose the possibility that in the area of advertising as in more artistic sectors, the creativity might be measured with more emphasis in the originality and other dimensions. In 2003 Koslow, Sasser, and Riordan, led an investigation to compare the perception of creativity by different groups. Their research included a qualitative and a quantitative stage with the administration of a questionnaire. In the ambit of graphic design we’ve based on the studies made by Tena (1998) The influence of the graphic composition in the election of a text block and Martin (2005) The connotative meaning of the plastic sign in the visual communication. In these studies it was analyzed the aesthetic aspects.
2
Searching an orientation toward the task of looking for an instrument that would help us measure the creativity in graphic design, we looked up to realized studies about creativity and found some instruments created to measure creativity. These were the CREA (Creative Intelligence. A Cognitive measure of the Creativity) Corbalán (2003), PIC (Test of Creative Imagination) González, Mairal, and others (2004) and Creative Product Semantic Scale Besemer and Treffinger (1981). The graphic designer is responsible for constructing a piece of graphic design to communicate a message. This message comes from the need of a person (that is not the designer) to communicate to other people. The designer acts like a filter: he takes the message and reconstructs it using his resources (knowledge and techniques) to attract the receptor of the message -by the display message (aesthetics). Since the graphic designer creates messages that nourish of the creativity like Frascara (2006), Tena (2005), Costa (1994), Chávez y Ledesma (1997) agree; it is necessary to profundity study, what is creativity and how it serves to the graphic designer? In this aspect we have to subscribe the following word of Ricarte (1998). […] this spark that we all have inside and from the one we have to learn serve as a tool of work. (Ricarte, 1998: 20) Based on the authors and the selected works by Huidobro (2002) we classify creativity into 4 components, which were defined primarily by Mooney (1963) and MacKinnon (1970) in Huidobro (2002), let’s say: person, process, product and context (environment or situation). “It could be affirm that the modern notion of the creativity already has a sediment of the empiric investigation based on the different experimental lines and theories: focusing on the study of the creativity like a product, like an specific process and like personal characteristics” (Ricarte, 1998: 43) Our work focuses on creativity in function of graphic design, which is why we will use the concept of “graphic creativity. “We must understand graphic creativity as the intelligent capability to find the correct solutions to problems that establish the communication through graphic. That is, those where vision plays an important role "(Tena, 2005: 4). We must conclude that the products created by graphic designers are the result of the action of that graphic creativity and that the mentioned product are solutions to a problem; solutions in different degrees. Graphic design uses creativity as a working tool in the creation of its products (Frascara; 2006, Tena; 2005, Costa; 1994, Chávez y Ledesma; 1997). These products, created by graphic design, in instance this creativity is compose of a series of elements that we can call dimensions. These allow its catalogue as a creative phenomena and affects creativity contained in these products. These dimensions will be Novelty, Communication and Aesthetics. It should be understood novelty as the capacity to give solutions as a determinate problem that, apart from being valid, will be original or even unpublished and will not only form variants of preceding solution, in context it should be infrequent solutions. We will see the communication as the responsible for materializing a message; also it has to find the best way to contextualize the basic content of the message, in order to transmit in a way that is understandable or intelligible. We will value the esthetic dimension of the investigation, like the formal treatment that is given to diverse elements that composes the message. So these elements are perceived and valued by our public as a whole and not in an isolation way. As we have seen, three dimensions, novelty, communication and aesthetics compose creativity in graphic design. The combination of these dimensions creates the construct of creativity in graphic design. Each of them directly intervenes in the creativity contained by a product of graphic design; the lack of some of them disturbs the creativity of the product, thus creating a variation between products to another. For a better understanding it is necessary to study and identify the mechanisms by which these dimensions interact in the valuation of creativity.
3
Study objective Elaboration of a trustworthy instrument to measure creativity in the graphic design. Hypothesis An efficient instrument can be crated to determine the degree of creativity for a determinant creative product.
METHOD
We’ve used a material composed by the Stapel scale (Crespi, 1961) that was administrated to graphic designer professionals. This made possible the data compilation, followed by statistics proceedings where it was calculated the alpha coefficient of Cronbanch and descriptive statistical about the relation between them. The sample was made in base of the Csikszentmihalyi (1996) Systems Theory where it was attribute to a group the power to decide what is creative and what not, in the action field known an experts. Based on the Consensual Assessment Technique of Amabile we’ll construct our methodology of the experimentation by supplying the instrument to the experts. This study had two phases, the pilot phase and the experimental phase. The pilot phase purpose was detecting errors in the development of the instrument and improves it before conducting the experimental phase. Phase 1 (Pilot Phase) Phase 1 Materials For visual stimulation, we choose three logos to validate the instrument. Both of them by reference of creative by the magazine Communication Arts (see illustration 1) in their web page; and another in exposed in the web logopond.com like a low punctuation in the user’s options. As an instrument of measurement we used the Creative Product Semantic Scale (Bessemer 1981) with some modifications in its semantic scale to be adjusted to the needs of this investigation according to Osgood (1976). Our scale will be composed of three dimensions: Novelty, Communication, and Aesthetics. Each dimension consists of five items, which will be punctually in every evaluation for the global valuation of the creativity in graphic design, using a Stapel scale of six points. A web platform was elaborated for the administration of the instrument via Internet. Subjects A snowball sample was made with graphic designers, which had the availability to participate as subjects in the pilot phase, take the instrument, and made comments via e-mail about its experience about using the instrument. A total of 30 subjects completed the instrument. Procedure Sent an e-mail to the sample population with a link to access the instrument. They were requested to enter the link, observe the logos and evaluate them according to the instrument. Once the evaluation was completed they were ask to send an e-mail in respond to.
4
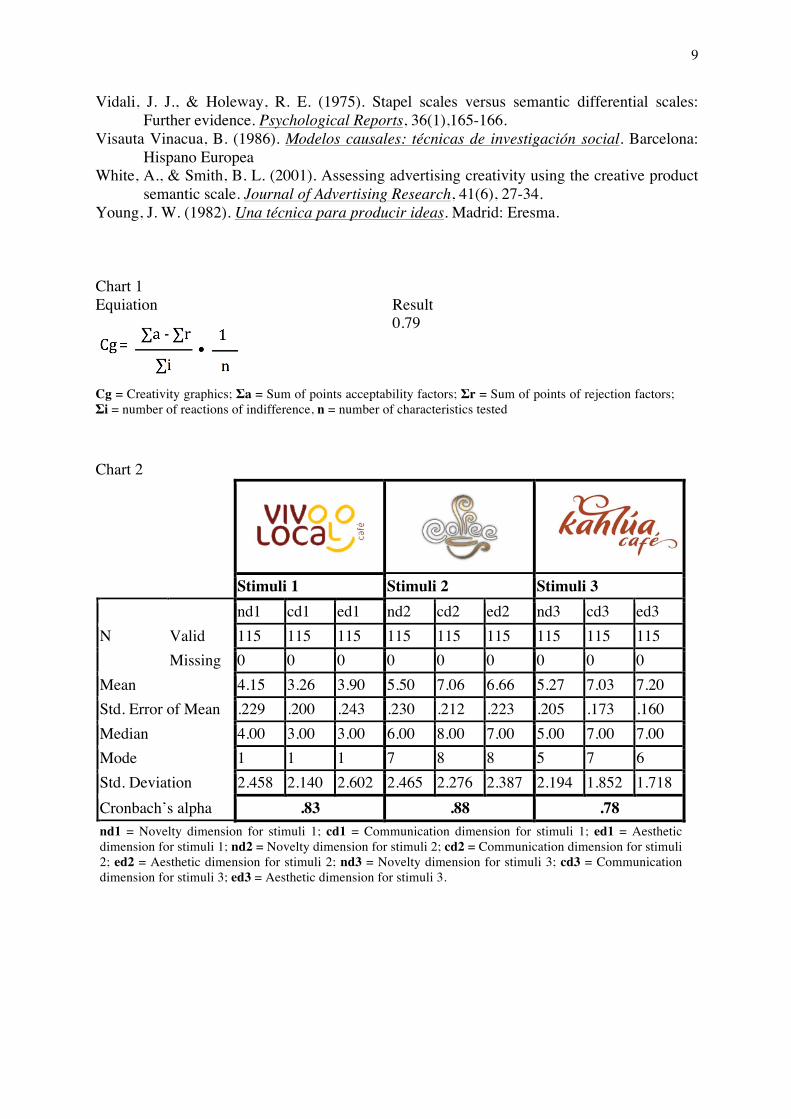
Results of the Test Phase The items that correspond to each dimensions of the first stimulation (see illustration 2) contain a high positive correlation between them, except from the unpublished – original that has a correlation of .354. The coefficient of Spearman-Brown obtained to calculate the reliability of the evaluations of the design 1 was .935. The grade of graphic creativity obtained for his design 1 was .79; this grade was determined using the formula of Soler (1990) (see table 1). In the second stimulation, it keeps the high positive correlations between the items that comprise each of the dimensions, although it was observed that does not exist a significant correlation between the items unusual and original. The coefficient of reliability of Spearman-Brown was .920 and the result of the grade of graphic creativity was from – 0.406. It is obtained a high positive correlation between the items that comprise the dimensions of the stimulation 3, except the item of originality that keeps a high negative correlation to a level .01. Equally, we highlight that the correlations between the original items with the rest that compose the dimensions of novelty is significant negative. The reliability coefficient of Spearman-Brown was .933 and the result of the degree of graphic creativity was 1.53. Conclusions of the Pilot Phase From the results obtained during the pre-test we can conclude that the items comprising each of the dimensions novelty, communication and aesthetics have a significant positive correlation between them. About 84% of these significant correlations obtained a level .001 of significance, implying that this correlation is 99% confidence and 1% error. The significance level .005 was obtained by the 11% of the correlations, which indicates that these have a 5% error and 95% confidence; 5% of the correlations were not significant. If we sum up both levels the correlations level .001 with a 84% and level .005 level with 11%, we will have 95% of the correlations are significant. The subjects reported that items of the dimensions caused confusion when evaluating the designs, by the similarity of their definitions. These results lead to the conclusion that the instrument should be simplified and use only one item for the evaluation of dimension to be tabulated, obtaining a reduction from 15 items to 3 items. The reliability coefficient obtained in the evaluation for the design 1 was .935, design 2 was .920, and for design 3 was .934, so this confirm the reliability sustained in theory of CAT of Amabile that this coefficient must be greater than .700. Phase 2 (Experimental) Phase 2 Materials As visual stimulus it was selected three logos to validate the instrument, one of them referenced as creative by Communication Arts magazine (see Illustration 2) on its website and the remaining exposed on page logoodtheday.com. It was decided that these were directed to the same industry, so that three had to somehow solve the same problem of communication, specifically meant to represent the image of a "coffee shop". Subjects participating A sample of convenience was used. This decision is based on the statements of different authors like Soler (1996), Fernández, Hernández and Batista (2006), Igartua (2006) and Sierra Bravo (2001). We select as our universe of graphic designers belonging to the Professional Association of Graphic Designers of Catalonia in order to validate our instrument, a total of 431. It was considered as a sample all who answered the questionnaire, a total of 115. With the confidence coefficient of 95.5% and a rate of 50% for the margin of error is 7.83.
5
The sample constitution was dominated by males (77%) over females (23%). The age range was from 23 to 63 years old, with a mean of 44 years, 87% of our sample has an academic background in graphic design; in that 87% training diploma was predominant with 57%. Procedure An email was sent from the administration of the Professional College of Graphic Designers of Catalonia, asking its members to complete the instrument. The instrument was posted online for 55 days. The information obtained was processed in Excel and then worked in a statistical program SPSS. Design of the Test The instrument was produced in two languages, Catalan and Spanish, because of the composition of our sample. Improvements were made in the instrument created based on the results of the pilot phase. Therefore the number of items decreased from 15 to 3, Novelty, Communication and Aesthetics. Then, we proceed to rate each dimension and the scale was modified to use a 10 point scale (-5 to 5). (See Illustration 3) Result of the Test The Cronbach coefficient for the stimuli 1 was .83, the stimulus 2 has one of .88, and 3 contains the coefficient of .78. Therefore there is evidenced of a high coefficient of internal reliability (See Chart 2). We developed a mathematical equation in order to create an index of creativity that simplify the presentation of the results of the instrument. The equation for determining the degree of creativity in the design would be as follows, C = fc(nv x nj) + (∑v) / fc(nv x nj) x 2. Where, fc = Creative Force is the maximum possible value that can reach the variable. This depends on the scale used, axis, using a Stapel scale from -5 to 5, the fc is 10. Since the codification of the values of the Stapel scale is -5 = 1, -4 = 2, -3 = 3, -2 = 4, -1 = 5, 1 = 6, 2 = 7 3 = 8, 4 = 9 and 5 = 10, you cannot use negative numbers; nv = number of variables that has been used to measure creativity; nj = number of judges who have rated the creativity; Σv = is the sum of the values of the variables. To indicate the variables, it must be accompanied by the assigned number, axis. On a scale with variables Novelty, Communication, and Aesthetics, V1 = Novelty, V2= Communication, and V3 = Communication = Aesthetics. The equation would be as follows: (V1 + V2 + V3). We must state that the maximum degree of creativity that can reach a product is 1 and its opposite is 0, meaning the total lack of creativity. The minimum accepted level of creativity for a product to be considered as positive creatively is .80. If all the dimensions of the stimulus were evaluated at -1 or less the index is below .80. Consequently, those stimuli where all of its dimensions were evaluated as positive (+1 or more) get an index of .80 or greater. Using the coefficient to determine the creativity in graphic design created in this investigation, stimulation 1 obtained a coefficient of .69 while the stimulation 2 and 3 were .89 in both cases.
CONCLUSION First, we must consider that we implement the appropriate statistical tests to verify the reliability of the instrument constructed in this investigation. This corresponds to the main objective: To validate an instrument to measure the creativity of a graphic design. Secondly, and as a result of this research its have been created a three-dimensional model of the creativity of graphic design products (Novelty, Communication, and Aesthetics) which

6
provide a theoretical and practical framework that allows further investigate the role of creativity in graphic design. The three-dimensional model of creativity in graphic design experimented and validated in this investigation should be thoroughly further studied and validated. Finally, the created instrument in this investigation is a step closer to obtaining a more thorough model that would be deeper, more valid and has great academic potential for the investigation field; and for the education fields as a pedagogic evaluation tool. In the professional area, it allows constructing a guide instrument to evaluate a product before it is terminated in order to study their potential effectiveness, or as an instrument for evaluate the product effectiveness after its development. In the academic area and investigation, it allows obtaining predictions with an acceptable reliability of targets behavior against the positive value of the graphic creativity.
7
Bibliography Añaños Carrasco, E., Estaún i Ferrer, S., Tena Parera, D., Mas Parera, M. T., Valli, A., &
Gamero, B. (2008). Psicología y comunicación publicitaria. Bellaterra: Universitat Autònoma de Barcelona, Servei de Publicacions.
Arfuch, L., Chaves, N., & Ledesma, M. (1997). Diseño y comunicación :Teorías y enfoques críticos. Buenos Aires etc.: Paidós.
Baños, M. (2001). Creatividad y publicidad. Madrid: Laberinto. Besemer, S. P., & O'Quin, K. (1986). Analyzing creative products: Refinement and test of a
judging instrument. Journal of Creative Behavior, 20(2), 115-126. Besemer, S. P., & O'Quin, K. (1999). Confirming the three-factor creative product analysis
matrix model in an american sample. Creativity Research Journal, 12(4), 287-296. Besemer, S. P., & Treffinger, D. J. (1981). Analysis of creative products: Review and
synthesis. Journal of Creative Behavior, 15(3), 158-178. Brace, I. (2008). Questionnaire Design: How to Plan, Structure and Write Survey Material
for Effective Market Research (Market Research in Practice). London: Kogan Page. Bravo, R. S. (2000). Técnicas Investigación Social - 13b0 Edición (Spanish Edition). Madrid:
Paraninfo. Brown, S., Foxall, G., & Goldsmith, R. E. (1998). Consumer Psychology for Marketing. New
York: Cengage Lrng Business Press. Caroff, X., & Besançon, M. (2008). Variability of creativity judgments. Learning &
Individual Differences, 18(4), 367-371. Conti, R., Coon, H., & Amabile, T. M. (1996). Evidence to support the componential model
of creativity: Secondary analyses of three studies. Creativity Research Journal, 9(4), 385-389.
Costa, J. (1987). Imagen global :Evolución del diseño de identidad. Barcelona: Ceac. Costa, J. (1994). Diseño, comunicación y cultura. Madrid: Fundesco. Costa, J. (2001). Imagen corporativa en el siglo XXI. Buenos Aires: La Crujía. Crespi, I. (1961). Use of a scaling technique in surveys. Journal of Marketing, 26(1), 69-72. Csikszentmihalyi, M. (1997). Creativity: Flow and the Psychology of Discovery and
Invention. New York: Harper Perennial. Csikszentmihalyi, M. (1998). Creatividad: El fluir y la psicología del descubrimiento y la
invención. Barcelona etc.: Paidós. Dollinger, S. J., & Shafran, M. (2005). Note on consensual assessment technique in creativity
research. Perceptual and Motor Skills, 100(3), 592-598. El-Murad, J., & West, D. C. (2004). The definition and measurement of creativity: What do
we know? Journal of Advertising Research, 44(2), 188-201. Esqueda, R. (2005). El juego del diseño: Un acercamiento a sus reglas de interpretación
creativa. México, D.F.: Designio. Frascara, J. (2006). El diseño de comunicación. Buenos Aires: Infinito. González Miranda, E. (1996). El proceso de creación y la evolución de los proyectos de
diseño gráfico : Tesis doctoral. Bilbao: Universidad del País Vasco, Euskal: Herriko Unibertsitatea.
Hawkins, D. I., Albaum, G., & Best, R. (1974). Stapel scale or semantic differential in marketing research? Journal of Marketing Research (JMR), 11(3), 318-322.
Heller, S. (2003). Teaching graphic design: Course offerings and class projects from the leading graduate and undergraduate programs. New York: Allworth Press : School of Visual Arts.
Heller, S. (2004) Design literacy: Understanding graphic design / Steven Heller (2nd ed. ed.)
8
Hennessey, B. A., Kim, G., Guomin, Z., & Weiwei, S. (2008). A multi-cultural application of the consensual assessment technique. The International Journal of Creativity & Problem Solving, 18(2), 87-100.
Hernández Sampieri, R., Fernández Collado, C., & Baptista Lucio, P. (2006). Metodología de la investigación (4ª ed.). México, D.F. etc.: McGraw-Hill Interamericana.
Huidobro Salas, T., González Marqués, J., & e-libro, C. (2002). Una definición de la creatividad a través del estudio de 24 autores seleccionados. Madrid: Universidad Complutense de Madrid.
Igartua, J. J. (2006). Métodos cuantitativos de investigación en comunicación. Barcelona: Bosch.
Kaufman, J. C., Lee, J., Baer, J., & Lee, S. (2007). Captions, consistency, creativity, and the consensual assessment technique: New evidence of reliability. Thinking Skills and Creativity, 2(2), 96-106.
Koslow, S., Sasser, S., Riordan, E. (2003),“What Is Creative to Whom and Why? Perceptions in Advertising Agencies,” Journal of Advertising Research, 43 (March), 96–110.
Koslow, S., Sasser, S., Riordan, E. (2006). Do Marketers Get The Advertising They Need or The Advertising They Deserve? Agency Views of How Clients Influence Creativity, Journal of Advertising. 35(3), 81-101.
Martín San Román, J. R., & Nó Sánchez, J. (2005). El significado connotativo del signo plástico en la comunicación visual : El rediseño de los diarios en la planificación estratégica de la imagen pública: Tesis Doctoral. Salamanca: Universidad de Salamanca
O'Quin, K., & Besemer, S. P. (1989). The development, reliability, and validity of the revised creative product semantic scale. Creativity Research Journal, 2(4), 267-278.
O'Quin, K., & Besemer, S. P. (2006). Using the creative product semantic scale as a metric for results-oriented business. Creativity and Innovation Management, 15(1), 34-44.
Ofir, C., Reddy, S., & Bechtel, G. (1987) Are semantic response scales equivalent? Multivariate Behavioral Research, 22(1), 21-38.
Osgood, C. E., & Snider, J. G. (1969). Semantic differential technique :A sourcebook. Chicago; New York: Aldine/Atherton.
Osgood, C. E., Tannenbaum, P. H., & Suci, G. J. (1971). The measurement of meaning (8th ed.). Urbana: University of Illinois.
Osgood, C., Suci, G. J., & Tannenbaum, P. H. (1976). La medida del significado. Madrid: Gredos.
Peterson, R. A. (1999). Constructing Effective Questionnaires. Thousand Oaks: Sage Publications, Inc.
Pritzker, S. R., & Runco, M. A. (1999). Encyclopedia of creativity. San Diego, Ca. Academic Press.
Ricarte Bescós, J. M. (1998). Creatividad y comunicación persuasiva. Bellaterra: Universitat Autònoma de Barcelona. Servei de Publicacions etc.
Romo, M. (1997). Psicología de la creatividad. Barcelona etc.: Paidós. Sasser, S., Koslow, S., (2008) Desperately Seeking Advertising Creativity. Engaging an
Imaginative “3Ps” Research Agenda. Journal of Advertising. 37(4), 5-19 Soler Pujals, P. (1990). La investigación motivacional en márketing y publicidad. Madrid
Deusto. Tena Parera, D. (2004). Diseño gráfico y comunicación. Madrid: Pearson Educación. Tena Parera, D. (2008). La investigación en comunicación gráfica. Barcelona: Anguiroda. Vidali, J. J. (1973). Single-anchor stapel scales versus double-anchor semantic differential
scales. Psychological Reports, 33(2), 373-374.
9
Vidali, J. J., & Holeway, R. E. (1975). Stapel scales versus semantic differential scales: Further evidence. Psychological Reports, 36(1),165-166.
Visauta Vinacua, B. (1986). Modelos causales: técnicas de investigación social. Barcelona: Hispano Europea
White, A., & Smith, B. L. (2001). Assessing advertising creativity using the creative product semantic scale. Journal of Advertising Research, 41(6), 27-34.
Young, J. W. (1982). Una técnica para producir ideas. Madrid: Eresma. Chart 1 Equiation Result
0.79
Cg = Creativity graphics; Σa = Sum of points acceptability factors; Σr = Sum of points of rejection factors; Σi = number of reactions of indifference, n = number of characteristics tested
Chart 2
Stimuli 1 Stimuli 2 Stimuli 3 nd1 cd1 ed1 nd2 cd2 ed2 nd3 cd3 ed3 N Valid 115 115 115 115 115 115 115 115 115
Missing 0 0 0 0 0 0 0 0 0 Mean 4.15 3.26 3.90 5.50 7.06 6.66 5.27 7.03 7.20 Std. Error of Mean .229 .200 .243 .230 .212 .223 .205 .173 .160 Median 4.00 3.00 3.00 6.00 8.00 7.00 5.00 7.00 7.00 Mode 1 1 1 7 8 8 5 7 6 Std. Deviation 2.458 2.140 2.602 2.465 2.276 2.387 2.194 1.852 1.718 Cronbach’s alpha .83 .88 .78 nd1 = Novelty dimension for stimuli 1; cd1 = Communication dimension for stimuli 1; ed1 = Aesthetic dimension for stimuli 1; nd2 = Novelty dimension for stimuli 2; cd2 = Communication dimension for stimuli 2; ed2 = Aesthetic dimension for stimuli 2; nd3 = Novelty dimension for stimuli 3; cd3 = Communication dimension for stimuli 3; ed3 = Aesthetic dimension for stimuli 3.
10
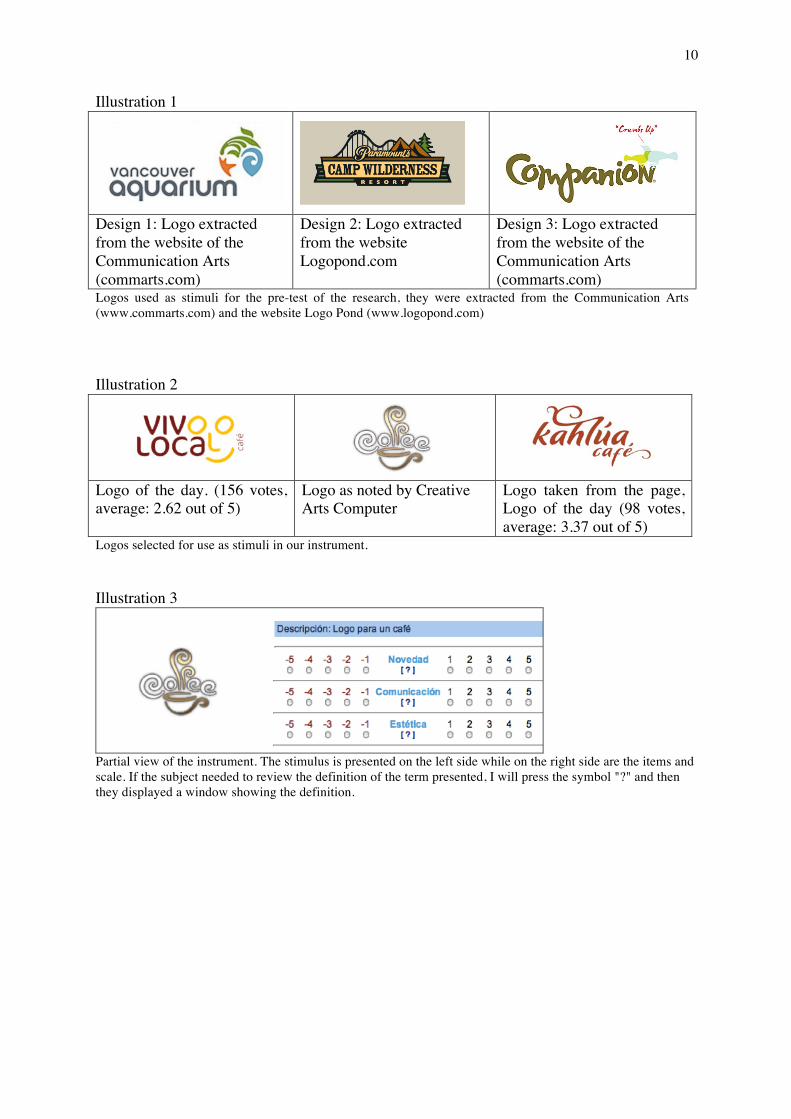
Illustration 1
Design 1: Logo extracted from the website of the Communication Arts (commarts.com)
Design 2: Logo extracted from the website Logopond.com
Design 3: Logo extracted from the website of the Communication Arts (commarts.com)
Logos used as stimuli for the pre-test of the research, they were extracted from the Communication Arts (www.commarts.com) and the website Logo Pond (www.logopond.com) Illustration 2
Logo of the day. (156 votes, average: 2.62 out of 5)
Logo as noted by Creative Arts Computer
Logo taken from the page, Logo of the day (98 votes, average: 3.37 out of 5)
Logos selected for use as stimuli in our instrument. Illustration 3
Partial view of the instrument. The stimulus is presented on the left side while on the right side are the items and scale. If the subject needed to review the definition of the term presented, I will press the symbol "?" and then they displayed a window showing the definition.