DIFFERENTIAL GRAPHIC ORGANIZER COMPREHENSION
132
Running head: DIFFERENTIAL GRAPHIC ORGANIZER COMPREHENSION THE EFFECTS OF GRAPHIC ORGANIZERS ON THE COMPREHENSION OF EXPOSITORY TEXT: EXAMINING INDIVIDUAL DIFFERENCES FOR THE MULTIMEDIA PRINCIPLE BASED ON VISUOSPATIAL ABILITIES A DISSERTATION SUBMITTED TO THE GRADUATE SCHOOL IN PARTIAL FULFILLMENT OF THE REQUIREMENTS FOR THE DEGREE DOCTOR OF PHILOSOPHY BY J. MICHAEL STARLING DR. JERRELL CASSADY – ADVISOR BALL STATE UNIVERSITY MUNCIE, INDIANA DECEMBER 2017
-
Upload
khangminh22 -
Category
Documents
-
view
1 -
download
0
Transcript of DIFFERENTIAL GRAPHIC ORGANIZER COMPREHENSION

Running head: DIFFERENTIAL GRAPHIC ORGANIZER COMPREHENSION
THE EFFECTS OF GRAPHIC ORGANIZERS ON THE COMPREHENSION OF
EXPOSITORY TEXT: EXAMINING INDIVIDUAL DIFFERENCES FOR THE
MULTIMEDIA PRINCIPLE BASED ON VISUOSPATIAL ABILITIES
A DISSERTATION
SUBMITTED TO THE GRADUATE SCHOOL
IN PARTIAL FULFILLMENT OF THE REQUIREMENTS
FOR THE DEGREE
DOCTOR OF PHILOSOPHY
BY
J. MICHAEL STARLING
DR. JERRELL CASSADY – ADVISOR
BALL STATE UNIVERSITY
MUNCIE, INDIANA
DECEMBER 2017

DIFFERENTIAL GRAPHIC ORGANIZER COMPREHENSION 2
ABSTRACT
DISSERTATION: The Effects of Graphic Organizers on the Comprehension of Expository
Text: Examining Individual Differences for the Multimedia Principle Based on Visuospatial
Abilities
STUDENT: J. Michael Starling
DEGREE: Doctor of Philosophy
COLLEGE: Teachers College
DATE: December 2017
PAGES: 132
To improve instructional design, it is important to identify the features and elements of
texts that are most effective at aiding students’ learning, and under what conditions. The use of
visual aids in textbooks is pervasive, and prior research has identified a number of associated
advantages and corresponding best practices. Specifically, graphic organizers refer to a class of
visual aids designed to help learners visualize how different concepts are connected. That is, they
organize ideas presented in texts into a visual, relational structure. These have been demonstrated
to promote learning relative to plain texts as well as other adjuncts such as outlines. One clear
possibility is that the visuospatial nature of the graphic organizer allows for this advantage in
learning. However, while verbal adjuncts summarize information in the text, they have not been
designed to verbally present the same relational information conveyed in the graphic organizer.
The present study attempted to replicate prior work on graphic organizers while extending its
known advantage to verbal adjuncts that present comparable organizing information. An
advantage here would help address an alternative, information-based interpretation for the
previously-observed advantages of graphic organizers.

DIFFERENTIAL GRAPHIC ORGANIZER COMPREHENSION 3
Previous studies have found that learning benefits from animated graphics are higher
when students have higher visuospatial skills. However, it is possible this result depends on the
absence of learner self-pacing. In the present study, it was hypothesized that an advantage of
static graphic organizers would also be moderated by visuospatial skill. If observed, this would
extend the known advantage of higher visuospatial skills in learning from graphics to self-paced,
static materials, as in textbooks.
Participants were recruited from two universities for this online study. Each completed
pretests of knowledge on two psychological topics and were then assigned to experimental
groups. Each read a roughly 1100-word passage about each topic, in counterbalanced order.
However, depending on assignment condition, one text had two supporting graphic organizers,
and the other had two information-equivalent verbal organizers. Participants then completed a
test of visuospatial skill followed by knowledge posttests for each topic. Linear mixed models
were computed to test for effects of the adjunct condition and its interaction with visuospatial
skill while controlling for other factors such as prior knowledge, academic level, and reading
time. Although visuospatial skill, prior knowledge, academic level, and reading time were
statistically significant predictors of performance among participants, graphic condition and its
interaction with visuospatial skill were not. Results are discussed in terms of potential
implications for theory and future directions for research on text-based instructional design.

DIFFERENTIAL GRAPHIC ORGANIZER COMPREHENSION 4
ACKNOWLEDGEMENTS
Many others were important to this project, and I want to thank all of them. Amy, first
and foremost, who supported me through thick and thin, especially in the times when needed
most. My parents, whose support, faith, and value of learning made this path possible in the first
place. My grandparents, for their love and their example. And the rest of my family and friends,
whose social support and persistence kept me going.
Several others contributed directly to this project, especially my committee. Dr. Cassady,
my chair, whose knowledge and instruction both inspired and continuously guided the project
from the initial focus on learning to the completion of the project. Dr. Finch, who significantly
and substantially directed the core of my statistical knowledge and helped ensure the study used
them validly. Dr. Stuve, who taught me to pay better attention to the details of design and their
potential consequences in practice. Dr. Ritchie, whose positivity and pragmatic advice helped me
to move forward and to look forward.
To all of my other teachers and professors over the years, thank you. All of you
contributed in too many ways to list. Many were indirectly or personally important, and some
lessons were directly relevant to this project. Dr. Paulson, for a great deal of advice during the
design of the study. Dr. Bolin, for her instruction in nested models. Dr. McIntosh, for critical
experience in the written and unwritten rules of research and professionalism. Dr. Ball, for the
same in different ways. Dr. Mucherah, for an important lesson in specificity regardless of
complexity. Dr. Griffith and Dr. Farmen, for groundings. Dr. Swindell and Dr. Leech, for an eye
for thought and behavior, respectively. Ms. Hickman, Mr. Meeks, and Mr. Robinson, for
teaching work. And Linda Jones, for her kindness and, importantly, for her patience.

DIFFERENTIAL GRAPHIC ORGANIZER COMPREHENSION 5
TABLE OF CONTENTS
Chapters
I. Introduction ....................................................................................................................6
II. Review of the Literature ..............................................................................................15
Learning Theories and Multimedia ....................................................................17
Graphic Organizers ............................................................................................39
Intelligence .........................................................................................................51
Present Study ......................................................................................................57
III. Methods........................................................................................................................60
Research Questions ............................................................................................60
Design .................................................................................................................63
Participants .........................................................................................................63
Materials .............................................................................................................64
Procedure ............................................................................................................72
IV. Results ..........................................................................................................................76
Case Validity and Outliers .................................................................................76
Properties of Scales ............................................................................................77
Hypothesis Tests ................................................................................................80
V. Discussion ....................................................................................................................93
Limitations .........................................................................................................98
Future Directions ................................................................................................99
References ....................................................................................................................................102
Appendices ...................................................................................................................................111

DIFFERENTIAL GRAPHIC ORGANIZER COMPREHENSION 6
CHAPTER ONE
Introduction
Students enrolled in traditional college classes are commonly required to independently
read a great deal of expository text for achieving the preponderance of course learning goals.
Expository text is different from narrative and other forms of written language, because it is
written and logically organized in relation to how the topic concepts are understood (Brewer,
1980). Although expository text may be written to persuade, the form considered here is that
intended to inform the reader. Learning from text has been studied at great length in cognitive
and educational literature. The efficiency with which an individual is able to decode and
comprehend the language of texts significantly affects learning outcomes over time (Kintsch,
1998). Because of this imperative, a variety of best practices regarding text construction have
been investigated and developed by this body of research (e.g., McDaniel & Einstein, 1989;
Mayer, 2008).
Learning
It is important to delineate the often unclear distinction between memory, or
remembering, and learning. Although certainly related, these terms are often incorrectly used
interchangeably. Historically, memory and learning are both used in the cognitive literature.
However, research relating to texts favors the use of the term learning. Here, memory refers to
remembering something as it was perceived. More specifically, memory for a text refers to the
ability to reproduce the text or text details verbatim, more or less accurately or completely,
regardless of the ability to understand or use the information within the text (Kintsch, 1994).
Although correlated with these more advanced outcomes, neither is strictly necessary for the
other. Learning is better defined as any positive change in knowledge that can be demonstrated

DIFFERENTIAL GRAPHIC ORGANIZER COMPREHENSION 7
in some task (Kintsch, 1994). This implies that the information can be applied in some fashion,
usually but not strictly beyond the ability to reproduce it (Kintsch, 1994). Research on memory
focuses on the memorization of lists or sequences of information and attempts to specify the
discrete functions and neural substrates of memory. In contrast, research on text learning focuses
on how texts are processed when read, including the mental models formed and learners' abilities
to apply them to solve problems (McDaniel & Einstein, 1989; Kintsch, 1994). This implies
consideration of a much wider range of cognitive operations. The primary goals of this body of
research are (1) to explore the ways in which texts and text features can be manipulated to
improve learning or learning efficiency (e.g., McDaniel & Einstein, 1998; Carney & Levin,
2002; Mayer, 2008) and (2) to delineate the functional processes involved in ecologically-valid
learning tasks, especially those used in education (e.g., Harp & Mayer, 1998; Muller, Lee, &
Sharma, 2008; Johnson & Mayer, 2012).
It is important to differentiate learning as a process from knowledge as the product of
learning, and the fact that it must be in some way documented is also important. Historically,
recall, the ability to reproduce or summarize presented information, has been the traditional
measure of learning following reading from a text (i.e., reading comprehension). Recall is a
general term for the ability to demonstrate that a specific piece of knowledge has been retained.
This can include meaningful information presented in the text as well as other details often
considered meaningless, such as the color of the text or a typographical error. Measures of recall
are sometimes further specified as free recall, which refers to a special case where cues are
limited. However, recall in the present sense can refer to recognition tasks as long as retention is
demonstrated. Recall is therefore a relatively simple learning outcome and is rarely considered
the most important learning goal in practice. According to Walter Kintsch (1998), for true

DIFFERENTIAL GRAPHIC ORGANIZER COMPREHENSION 8
learning from text, an individual must be able to apply the new information to new situations;
Kintsch called this kind of learning "situation model," which he differentiated from "textbase"
(that is, "recall"; 1994). An increase in the ability to use that situation model to solve a problem
can be defined as "transfer" learning. This further implies information is sufficiently integrated
with the learner’s knowledge base to allow generalization (or transfer) to new problems. When
assessing successful learning, it is important to examine the transfer outcome, not just recall
alone. Neither is necessarily dependent on the other. Kintsch (1998) was clear that a learner
could have the transfer outcome (i.e., successful application) without the specific related
knowledge of recall, and vice versa. That is, knowledge of a particular fact, or the ability to
reproduce it in some form, is neither sufficient nor necessary for solving a problem. For example,
recalling that positive reinforcement involves an increase in behavior due to the addition of a
pleasant stimulus is distinct from correctly predicting the behavioral results if a parent praised
their child for cleaning up after dinner without being asked. Learning to correctly answer the first
part may be independent of learning to correctly solve the second problem. Thus, a
comprehensive measure of learning should include both recall and transfer.
This framework for understanding the end goals of learning and learning research is a
useful starting point. From here, a great deal of research has been dedicated to predicting and
affecting these outcomes in both applied and basic research across multiple theoretical models.
One current theory of learning that is directly relevant to learning from texts is the Cognitive
Theory of Multimedia Learning (CTML). Rather than take a directly neurocognitive perspective
as may be conducive to memory research, this cognitive theory focuses on the kinds of abstract
learning goals we value so highly as outcomes of modern education. More specifically, it frames
the problem around the method, and sometimes medium, such that learning outcomes are

DIFFERENTIAL GRAPHIC ORGANIZER COMPREHENSION 9
predicted from the properties of the materials themselves (e.g., the text includes diagrams, the
text is narrated rather than printed) in addition to the properties of learners (e.g., intelligence,
reading fluency). This science of learning approach targets these kinds of features so that the
results are directly applicable to pedagogy (that is, a science of instruction; Mayer, 2008).
As the CTML developed, several principles for the effective design of multimedia
content were proposed and validated. Most importantly, the multimedia principle refers to the
general finding that, all else equal, materials that combine words and images are more effective
than words alone (e.g., Mayer, 2008; Carney & Levin, 2002), building directly off of Dual
Coding Theory (e.g., Paivio, 1991). Several other principles lay out conditions that modify, limit,
or extend this general principle to different circumstances (e.g., Levin & Mayer, 1993), which is
where much of the research in this field has been focused. In short, considerable attention has
been directed to explore under which conditions the use of images along with words improve
recall and transfer learning outcomes.
Of particular relevance to the present investigation –and an area that has been largely
overlooked - is the individual differences principle, which generally states there are effects of
individual differences on the size of the effects from other multimedia principles (Mayer, 2001).
That is, learner abilities moderate the effects of multimedia properties. Certainly, such a broad
statement should be broken down and investigated for specific aptitude-treatment interactions, as
Wittrock advocated in the science for learning more generally (Wittrock, 2010). However, to
date most of the research within this theoretical framework has focused primarily on learners’
prior knowledge. Within that frame, a general effect emerged finding that multimedia effects
tend to be stronger for those with lower prior knowledge regarding the content to be learned
(Mayer, 2001). Or, reframed, those who knew more to begin had less need of carefully-designed
DIFFERENTIAL GRAPHIC ORGANIZER COMPREHENSION 10
materials to learn the content simply because the learning task requires less processing. From a
Cognitive Load Theory (CLT) perspective, such individuals have less intrinsic load to process
during the learning task to achieve the same outcomes (e.g., Sweller, Ayres, & Kalyuga, 2011).
By comparison, other aspects of individual differences have been largely ignored. Few
studies in the literature have examined whether there are such moderating effects of visuospatial
skills, despite its apparent centrality to the issue of multimedia. The limited body of research
appears to suggest that multimedia principles are more important for learners with higher levels
of visuospatial skills (Mayer & Sims, 1994; Mayer, 2000). However, this interpretation may be
particular to the nature of challenging learning materials presented within specific conditions,
largely driving time limitations such as listening to narrations once without pausing or repeating.
Among other possibilities, it may be that those with lower visuospatial skills have less
opportunity to solve problems at their pace if time is held constant, preventing them from making
effective use of the added visuospatial materials. CLT predicts such effects due to cognitive
overload, where the materials exceed the ability of the learner to process them effectively,
reducing learning (Sweller, Ayres, & Kalyuga, 2011). Under such an interpretation, the effect
may not generalize to situations where the materials are self-paced (Harskamp, Mayer, & Suhre,
2007), allowing learners to manage cognitive load. As mentioned previously, this describes one
of the most common learning situations in higher education, reading from textbooks, which tend
to be universally presented in a multimodal format due to the combination of visual aids and
written text – although the design of standard texts may not always meet the guidelines of best
practice.
It is necessary at this point to distinguish among different kinds of graphic adjuncts, even
among graphics that are not animated. Specific graphics vary dramatically, but they can be

DIFFERENTIAL GRAPHIC ORGANIZER COMPREHENSION 11
classified based on their theoretical purpose. Carney and Levin (2002) distinguish several broad
kinds in this way. Material-irrelevant pictures aside, much of the research has focused on
representational pictures, which literally depict the concept to be learned (e.g., a completed
circuit diagram), and interpretational pictures, which demonstrate cause-and-effect sequences
often using multiple representations (e.g., a series of images of circuit diagrams showing
concrete steps that illustrate a general concept or procedure; Carney & Levin, 2002). Another
form is organizational pictures, which have not been frequently studied in the context of CTML
principles. These are often called graphic organizers (GOs) in the literature. In general, these
images can take multiple forms (e.g., concept maps, diagrams), but they all provide a visual
structure of relationships among concepts, often with verbal labels, that would be more fully
discussed in a text or narration. Graphic organizers are highly recommended to instructors as
author-provided tools for visualizing the relations among concepts in a text (e.g., Clark & Mayer,
2008; Robinson & Kiewra, 1995). Compared to concrete ideas, abstract ideas are less likely to
call to mind specific representations of what they refer to (Clark & Paivio, 1991). However,
graphic organizers are designed to provide a more visuospatial organizational structure that could
leverage the nonverbal system in memory and processing (Nesbit & Adesope, 2006). In this way,
graphic representations of abstract materials may benefit from the concrete, perceptual referents
provided (e.g., Clark & Paivio, 1991).
Dual-Coding Theory (DCT) draws on a large body of evidence that suggests learners use
separate but interacting channels in learning, one that works with verbal information and another
that works with nonverbal information (Paivio, 1991). The core implication here that became a
basic assumption of the later CTML is that learners can learn more and more quickly if they use
both systems at the same time to process a concept or set of related concepts. As dual coding

DIFFERENTIAL GRAPHIC ORGANIZER COMPREHENSION 12
theory and CTML predict, graphic organizers have been demonstrated to largely effective in
promoting learning outcomes, including text base and situation model outcomes (e.g., d = 1.27;
Kools, van de Wiel, Ruiter, Crüts, & Kok, 2006), and this is exactly what would be expected
theoretically. However, the empirical evidence for the mechanism of action leading to learning
gains is uncertain. Within a CLT or DCT framework, it is expected that graphic organizers may
allow students to make more effective use of their nonverbal systems (e.g., Paivio, 1991) and
devote more cognitive processing toward building mental representations of the appropriate
relational framework for the concept(s) in question (e.g., Sweller, Ayres, & Kalyuga, 2011). If
this is the case, an interaction with visuospatial skills might be expected. That is, materials that
enable learners to make better use of visuospatial processing may vary in effectiveness with the
learner’s visuospatial skills.
In addition to its theoretical importance, because of the common usage and
recommendations to use GOs in instructional practice, such an individual differences effect in
terms of visuospatial skills would have pragmatic implications. Specifically, it raises the question
of which students benefit most from the addition of graphics to texts. Research should answer the
question, “do individual visuospatial skills predict learning gains attributable to the inclusion of
graphic organizers in written texts?” At the same time, the mechanisms behind any such
moderating effects of visuospatial skills should be investigated to support improvements in the
specificity of multimedia learning theories, especially as they are intended to explain learning
outcomes in this context.
The present study was designed to test multiple hypotheses within a single study that
focuses on this principal research question. Participants read two expository text passages, one
with graphic organizers and one with verbal adjuncts designed to provide similar relational

DIFFERENTIAL GRAPHIC ORGANIZER COMPREHENSION 13
information in a verbal format. In a counterbalanced design, half received GOs in the first text
and half in the other, controlling for order of presentation. Learning outcomes were assessed
using a standardization process for each outcome measure (i.e., individual scores on each
measure were referenced to the average as z-scores rather than simple raw scores). This
accounted for differences between texts and tests such that individual differences in relative
performance in the GO condition versus the verbal adjunct condition could be assessed. With
prior knowledge accounted for based on a pretest, this tested the relative learning attributable to
the assigned condition: text with a graphic organizer or the same text with a verbal organizer.
This tests predictions of the multimedia principle. It has already been established that graphic
organizers are effective relative to plain texts (Kools et al., 2006) and verbal outlines (Robinson
& Kiewra, 1995), as predicted by the multimedia principle. The present study attempted to
replicate and extend this to the context of graphic organizers versus verbal organizers designed to
mirror the abstract relational content. Based on the multimedia principle (e.g., Mayer, 2008) and
DCT (e.g., Clark & Paivio, 1991), it is predicted that the graphic organizer condition will result
in greater learning given its visuospatial qualities. If confirmed, this would better establish that
multimedia principle effects are due to the graphic nature of the materials rather than the
particular information presented in the adjunct.
All participants also completed a measure of visuospatial abilities, the Spatial Thinking
Ability Test (STAT). It was expected that there would be a positive, moderate interaction effect
between the graphic organizer condition and a learner’s visuospatial ability. This would be
interpreted to mean that visuospatial ability moderates the experimental effect of GOs on
learning. That is, after accounting for any main effect of visuospatial ability, graphic organizers
have a larger effect for those with higher visuospatial abilities. From a CLT perspective, this

DIFFERENTIAL GRAPHIC ORGANIZER COMPREHENSION 14
would be consistent with a situation where the text has a high degree of intrinsic load that
learners must process to understand it. Those better able to apply visuospatial abilities to the task
(given the graphic organizer) would then experience less cognitive overload and better learning
outcomes (e.g., Sweller, Ayres, & Kalyuga, 2011). If a moderating effect of visuospatial skill is
detected, this would demonstrate an individual differences effect for graphic organizers specific
to visuospatial abilities. To be clear, such an effect would not necessarily be evidence supporting
a “meshing” hypothesis (e.g., Pashler et al., 2008). That is, an aptitude-by-treatment interaction
does not necessarily demonstrate that the practice of matching different methods to different
categories of learner is effective instructional practice (e.g., that graphic organizers should be
used for students with high visuospatial skill, verbal organizers for those with lower skill). For
example, graphic organizers may be more effective in general, but the advantage may be greater
(or weaker) with increasing visuospatial skill. Such a result would imply the graphic organizers
should be used in practice regardless of student visuospatial skill. Results are discussed in terms
of implications for the development of cognitive learning theory and pedagogy in psychology at
the college level.
DIFFERENTIAL GRAPHIC ORGANIZER COMPREHENSION 15
CHAPTER TWO
Review of the Literature
One way to think about the difference between recall and transfer learning outcomes is as
a broader view of Bloom's popular taxonomy of learning objectives, with knowledge and
understanding (recall) on one hand and application (transfer) as well as the more complex
cognitive tasks on the other. This Taxonomy of Educational Objectives was developed as a
classification system of learning outcomes to assist faculty in sharing test items on various topics
with equivalent objectives (Krathwohl, 2002). This system illustrated differing learning
outcomes of increasing complexity. Krathwohl describes a substantive, more theory-driven
revision of Bloom’s taxonomy, which categorizes learning tasks between two dimensions,
Knowledge and Cognitive Processes (2002). Any given learning task or test item can be
categorized within both dimensions simultaneously. That is, every measurement of learning
implicitly requires both parts, the information in question, and the task necessary to demonstrate
it was learned in some way.
Along the Knowledge dimension, or the information in question, knowledge can be
factual, conceptual, procedural, or metacognitive. Where factual knowledge refers to the basic
units of information, conceptual knowledge is about how facts interrelate or function together
(2002). Procedural knowledge relates to skills and techniques to follow, including knowledge
about when and whether to apply them in different contexts. Metacognition is a relatively new
division in comparison to Bloom's original taxonomy, and it specifies a category of knowledge
about that individual's other knowledge. Knowledge of general strategies falls under this
category, as does knowledge about how much you know about a topic. For example, knowing

DIFFERENTIAL GRAPHIC ORGANIZER COMPREHENSION 16
that you do not know much about the physics of lightning is a piece of metacognitive knowledge
(2002).
The Cognitive Process dimension in the taxonomy describes the learning task and, in
order of increasing complexity, remembering, understanding, applying, analyzing, evaluating, or
creating based on a piece of knowledge to be used in the task (2002). “Remember,” which is the
simplest process, is the act of recalling the relevant information from long-term memory (i.e., to
working memory). Where recognition and recall fall under the act of remembering relevant
knowledge, the “Understand” process requires some form of interpretation. This includes actions
focused on deriving meaning from a piece of knowledge, from summarizing or explaining it to
drawing inferences based on it. “Apply,” like each process in the dimension, is framed as a verb,
and it refers to putting knowledge to use in a particular setting. Such tasks vary in complexity,
and even though some Understand tasks are more complex than Apply tasks, Krathwohl argues
that Apply is more cognitively complex, on average (2002). “Analyze” refers to the process of
breaking down ideas, which includes finding how parts are structured, how they relate to each
other, and how they function within the whole. “Evaluate” refers to criticizing or making
judgments based on knowledge of standards or other criteria. Where Bloom placed this at the
pinnacle of complexity, the revised taxonomy shifted Create to the top. Formerly called
"synthesis," referring to bringing together separate elements (especially following Analysis).
"Create" refers to the broader action of producing an original plan or work based on prior
knowledge.
Altogether, the revised taxonomy classifies learning tasks in a way that explicitly
acknowledges both parts in a measure of knowledge, the kind of information presented and the
level of complexity of cognitive processing. In this sense, the demonstration of learning requires

DIFFERENTIAL GRAPHIC ORGANIZER COMPREHENSION 17
us to act at a given level of complexity based on specific knowledge of a given type. The
principal importance of this framework in the present investigation is to distinguish between
factual and conceptual knowledge separately from distinguishing between remembering
information versus applying it or using it in more complex ways.
In practice, a flat or nonexistent level of knowledge has often been implicitly assumed at
the outset of a study such that the measurement of knowledge provides a complete measure of
learning. However, this is not necessarily the case. For instance, a popular topic in research on
text has been the mechanics of lightning. This topic is commonly taught during grade school
science classes in the United States, so it is highly unlikely that high school and college students
there would have no prior knowledge. For this reason, a range of prior knowledge is expected,
and this is likely to affect knowledge measured on posttests. However, aside from knowing more
answers to test items ahead of time, the degree to which a student understands the concepts
before the learning situation can significantly affect the learning process for that student. Modern
information processing learning theories such as the Cognitive Theory of Multimedia Learning
(CTML) and Cognitive Load Theory (CLT) predict such effects. Although such effects would be
distributed randomly between groups during experimental studies, this has the potential to
introduce significant random error and inflate type two error rates. For this reason, prior
knowledge should be a consideration in designing the materials for any learning study.
Learning Theories and Multimedia
Miller conceptualized the learning process as an input-output communication system,
definable in terms of what "goes in" compared to what "goes out" (Miller, 1956). What
information comes out will likely not match perfectly with what information was presented

DIFFERENTIAL GRAPHIC ORGANIZER COMPREHENSION 18
originally, however there will be some information in common. The overlap between the two
represents the information transmitted successfully, or learning. Miller proposed that as
information "input" increases (given a limited time period), eventually the information output
cannot increase with it and levels off at a particular value. Miller called this limit "channel
capacity," analogous to the limit on an individual's ability to take in information and then
demonstrate it in some defined task (Miller, 1956). This development lead to a stronger
foundation for information-based theories of learning.
Short-term store. Building on this, Shiffrin and Atkinson developed a theory regarding a
functional channel in human memory that separated it from the long-term, permanent storage of
information (1969). This short-term store explained much of the research findings that a single
memory construct was unable to explain parsimoniously at the time (Atkinson & Shiffrin, 1968).
In particular, this helped explain the phenomenon of severe anterograde amnesia (1968), in
which an individual with lesions of the hippocampus is unable to encode new memories but can
retrieve memories from before the operation without serious difficulty as well as maintain these
thoughts for a brief period. This theory provided the basic foundation for the modern construct of
working memory (Baddeley, 2010).
Working Memory. Building on the theoretical base of the short-term store construct,
Baddeley and Hitch developed the construct of working memory, a more generalized space
within which information is processed (1974). Although coined by Miller, Galanter, and Pribram
in 1960, the term was not used to refer to a model of memory until 1974 (Baddeley, 2010).
Baddeley conceptualized the working memory construct as a central processing system of
limited capacity that controls a number of subsystems with more specific roles contributing to
short-term storage and manipulations in human memory (1983; Baddeley, 2000). Several

DIFFERENTIAL GRAPHIC ORGANIZER COMPREHENSION 19
attributes of this control system are particularly important to the present investigation. First,
working memory represents a memory system intervening between our senses and the long-term
storage of memories, encapsulating learning as a process (Atkinson & Shiffrin, 1968; Baddeley
& Hitch, 1974). Second, working memory is not merely a short-term store as proposed by
Atkinson and Shiffrin but also an information processing system (e.g., Baddeley, 2001) capable
of organizing, manipulating, and integrating information from the senses and long-term memory.
Last, Baddeley and Hitch's working memory proposed two specific subsystems (1974), now
called the phonological loop and the visuo-spatial sketchpad (Baddeley, 2001). That is, Baddeley
and Hitch proposed separate subsystems within working memory for working with auditory and
visual information beyond the sensory store. Although specific in its focus on sensory modality
rather than the nature of the information, this represented the first description of working
memory as happening in separate processing channels.
Dual Coding Theory. Over a decade later, Paivio (1991) developed a dual-coding theory
suggesting that the human brain, functionally-speaking, contains two separate yet interacting
working memory "channels" involved in cognition and learning, the verbal and nonverbal
systems. The verbal system processes and represents language. The nonverbal system processes
nonlinguistic objects and events (Sadoski & Paivio, 2004), which includes the direct
representation of their perceptual properties (Paivio, 2010). Both systems include internalized
sets of specific mental representations developed across an individual’s lifespan in a specific
cultural setting. External stimuli can activate these representations, pulling them from long-term
to working memory. Additionally, in the absence of external stimuli, spreading activation can
bring to mind other representations through links with other representations that have already
been activated.

DIFFERENTIAL GRAPHIC ORGANIZER COMPREHENSION 20
The two mental codes are orthogonal with our senses in that they have different qualities
of representations depending on which sense is involved. For instance, we have auditory-verbal
representations of spoken language and auditory-nonverbal representations of environmental
sounds, such as the sound of clinking glasses. Likewise, we have visual-verbal representations of
text and visual-nonverbal representations of everyday objects such as chairs and trees. Although
other senses are important in terms of verbal and nonverbal processing, particularly touch
(Sadoski & Paivio, 2004), these are not typically directly accessible through media commonly
available in education.
An important implication of these separate systems is that properly directed use of both
systems simultaneously would lead to more time-efficient learning through the use of two
parallel systems rather than either on its own. Although each channel has a set capacity, to use
Miller's analogy, using both channels in the same time period results in greater information
transmission overall. However, the combination of both systems may also lead to qualitatively
different learning. For instance, learning about the construction of a car from a technical diagram
at the same time as reading about how it is made may result in different information learned than
doing each in sequence, separate from any quantitative difference in learning that could be
described here. A corollary to this implication is that in taking in new information from
multimedia, the ability to do so may be limited by medium in that each system may only be able
to take in one input at a time. Therefore, the combination of visual-nonverbal material (e.g., a
technical diagram of a car) with visual-verbal material (i.e., written text describing the
construction of the car) may be inherently limited because the learner is unable to view each
simultaneously. DCT would suggest that a diagram (i.e., visual-nonverbal information)
DIFFERENTIAL GRAPHIC ORGANIZER COMPREHENSION 21
combined with narration (i.e., auditory-verbal information) would be more effective or at least
more time-efficient for the learner.
DCT differs from traditional linguistic and psychological theories involving language in
that it does not assert that mental representations of things (or things in themselves) correspond
one-to-one with words. Instead, DCT asserts that many different words may refer to the same or
similar things, and likewise one word may refer to many different things. In DCT, the term
“image” is commonly used to refer to a nonverbal representation regardless of modality (e.g.,
Paivio, 2010). For example, the smell of rain is an image as much as any representation of the
way it looks.
Dual-coding theories have led to research suggesting a number of important principles
about which aspects of multimedia text encourage successful learning and which do not. First,
generally speaking, pictures themselves are remembered better and for a longer duration than are
verbal representations, and when added to otherwise intact texts, memory for associated concepts
in a text can be improved (e.g., Mayer, 2008). Well-designed diagrams presented as part of text
help students comprehend the material better (Purnell & Solman, 1991; Levin & Mayer, 1993;
Carney & Levin, 2002). However, it is important to note that the mere inclusion of a picture is
not the mechanism that provides the benefit.
For instance, not all verbal concepts are amenable to corresponding visual-nonverbal
representations; therefore, an important limitation of pictures is their relevance to the material.
Irrelevant pictures naturally have no effect on text learning outcomes. Khoii and Forouzesh
found no effects of including topically related but non-complementary comic strips (2010),
though they would not have been able to detect modest group differences and did not examine
any potential differences in time spent on the materials. Ultimately, the effectiveness of a
DIFFERENTIAL GRAPHIC ORGANIZER COMPREHENSION 22
diagram (or a text) is dependent on how well suited the format is to the information conveyed. In
terms of DCT, processing visual-nonverbal information that is irrelevant should not be expected
to enhance memory for or understanding of the text.
DCT does not assert that verbal and visual information are provided completely separate
representations in memory once learned. On the contrary, Glenberg and McDaniel make the case
that mental models or schemas integrate spatial and verbal sources of information into a single
rather than separate representations (1992). Taylor and Tversky (1992a) determined that
individuals learning from a map produced similar results whether they needed to describe what
they remembered or reproduce it in pictorial form. Learners identified similar content using a
similar structure and, in particular, reproduced information in similar temporal order. They found
a similar pattern of results when a verbal stimulus was used (1992b). In a more recent study with
a child sample, Mammarella and colleagues (2009) administered a verbal stimulus with spatial
information and assessed subsequent reading comprehension of route and survey text (that is,
text describing spatial information from a first-person perspective or from a top-down, map-like
perspective, respectively) as well as the ability to locate described landmarks on a map. Students
identified with a nonverbal learning disability performed more poorly than students without
identified learning disabilities and those with identified reading disabilities on the survey-
perspective comprehension items. That is, where a spatial perspective is required (and not
otherwise), students with nonverbal learning disabilities were less capable than those with
reading disabilities in remembering spatial information even though it was presented in text
form. This finding also held for survey-perspective location of landmarks but not for rote recall
of directions. Although students with nonverbal learning disabilities were capable of memorizing
the text, their ability to construct a spatial model was impeded even for a verbal description of

DIFFERENTIAL GRAPHIC ORGANIZER COMPREHENSION 23
spatial information. This provides additional evidence that similar representations of spatial
information are constructed regardless of presentation format. When it comes to mental
representation, the important factor in text or multimedia materials is whether the format
supports the processing and construction of the specific kind of mental representations required.
Material Appropriate Processing. The Material-Appropriate Processing (MAP)
framework was developed by McDaniel and Einstein to improve our understanding of how text
is processed, particularly in combination with adjuncts that change the way the learner processes
the text (Hamilton, 2004). MAP suggests there are two basic kinds of elaboration for concepts,
item and relational. Item processing is focused on a specific piece of information, and relational
processing focuses on relationships among individual items (McDaniel & Einstein, 1989). As a
framework for understanding the effectiveness of a manipulation, MAP suggests a few core
effects. First, the kind of adjuncts presented alongside a text will influence to what degree the
learner elaborates on item-specific versus relational information (1989; Hamilton, 2004).
Second, the nature of the text will tend to promote one or the other kind of processing (1989).
Third, the combination of text and text adjuncts will also have an effect on the elaboration,
depending on how well they complement each other (1989). Therefore, text adjuncts are
effective when they encourage the processing of the appropriate kind of information given the
nature of the text itself (the information to be learned).
The key finding explained by the MAP framework is the inconsistency of research
findings on text adjuncts at the time. McDaniel and Einstein noted that several other researchers
at the time called for researchers to consider the relations between assessments used and the kind
of processing occurring during instruction. The MAP framework's explanation is illustrated well
in a prior study by McDaniel, Einstein, Dunay, and Cobb (1986). The investigators increased the

DIFFERENTIAL GRAPHIC ORGANIZER COMPREHENSION 24
difficulty of reading a text in two ways. In one condition, they deleted 18-30% of the letters
throughout a text passage, requiring learners to write in the missing letters as they went. In the
second randomly-assigned condition, other participants read passages comprised of 14-20
randomly-ordered sentences. A separate group reading the original texts without such
manipulations made up a control group. Two kinds of passages were used with each group, one
expository describing geography and one narrative in the form of a fairy tale (two distinct
passages were used of each type). Subjects unscrambling sentences saw no gains in recalling
narrative passages but substantial gains recalling expository passages. The converse was
true for learners filling in letter blanks (McDaniel et al., 1986). Note that these manipulations
significantly increased the time spent processing the material, so it should come as no surprise
that no losses in comprehension were observed relative to the control groups. The authors
reasoned that expository passages do not naturally lead readers to process the relational content
within them due to a lack of familiarity with the organization of individual items. The fairy tales,
on the other hand, follow a familiar, predictable form (1986) with clear causes and effects from
one event to the next (McDaniel & Einstein, 1989). By focusing learners on the information that
would otherwise be more poorly processed, complementary adjuncts increase recall.
McDaniel and Einstein noted a prior focus on the manipulation of encoding difficulty in
itself via added tasks, which was insufficient to explain differing findings with different texts and
different manipulations (1989). The key development of the MAP framework was to account for
differences in efficacy in terms of whether tasks (adjunct materials) forced learners to process
information critical to their comprehension of the text. Given the MAP framework, where
learners would not process important information in a normal reading, appropriate materials
improve recall. The natural corollary is that students that can recall the important information

DIFFERENTIAL GRAPHIC ORGANIZER COMPREHENSION 25
from a normal reading would of course not benefit from an adjunct. In fact, considering the 3- to
6-fold increase in time spent reading with the aforementioned tasks added (1989), these
procedures come with a steep cost even when increasing recall. The issue of time spent on
relevant processing hints at another consideration critical to the present study; information
processing takes place over time and is necessarily limited by it, in combination with the
processing speed of the individual.
Cognitive Load Theory. Cognitive Load Theory (CLT) is primarily concerned with the
nature of complex cognitive learning tasks. CLT posits that anything to be learned has an
intrinsic level of cognitive load that needs to be processed based on the qualities and concepts in
the material itself (Sweller, 2005). This is specifically defined in terms of element interactivity.
Paas, Renkl, & Sweller explain that an important feature of a piece of information is the degree
to which elements within it interact (2003). Materials that require a collective understanding of
multiple elements and their interactions are high element-interactive, and materials where the
constituent pieces of information can be understand separately from each other are low element-
interactive and thus substantially easier to learn (2003). That is, they have a lower intrinsic
cognitive load. A text cannot decrease the amount of intrinsic load present in the information it
attempts to convey. Any "reduction" of intrinsic load involves changing the learning task to a
simpler one (which would in practice be similar in topic but less sophisticated or detailed).
However, the knowledge gained in the less complex task would not be the same and could not
correspond to precisely the same learning goals.
Besides intrinsic load, there are also extrinsic properties of a task that increase the
amount of processing needed to learn a concept in practice (Moreno & Park, 2010). These
include everything from difficult to read text, to poor content organization, to distracting stimuli

DIFFERENTIAL GRAPHIC ORGANIZER COMPREHENSION 26
in the room. Another way of conceptualizing extrinsic load is as the properties of an instructional
method (or text) that require cognitive resources yet do not contribute to the processing of
intrinsic cognitive load. These characteristics of a learning situation are affected by participant
characteristics. Distractible students are affected more by the group activity in the other corner of
the room. In the cases of factors such as the reading level and organization of a text, an important
implication is that more proficient readers are better able to automatically interpret and
ultimately comprehend difficult or poorly written text; that is, extraneous cognitive load is
reduced for stronger readers. Germane cognitive load has been described as load caused by
effective effortful learning on the part of the individual (Sweller, 2005). For instance, examples
increase total cognitive load but are germane to learning outcomes because they increase
material-relevant processing. However, more recent conceptualizations of CLT have ceased to
use the term, preferring “germane resources” to describe cognitive resources that are handling
intrinsic load, as opposed to “extrinsic resources” which are needed to process extrinsic load
(Sweller, Ayres, & Kalyuga, 2011).
CLT suggests that humans rely on the combination of working memory and long-term
memory to process complex cognitive tasks. Because working memory is limited in capacity, we
develop schemas in long-term memory, which are mental constructs that incorporate multiple
pieces of information into a single element. As schemas become more complex, we develop
more powerful tools for processing more sophisticated ideas within our limited working
memories (Paas, Renkl, & Sweller, 2003). However, because our working memories are so
limited in capacity (roughly two or three separate, new ideas at a time; 2003), instructional
materials must be designed in such a way to avoid extraneous cognitive load. Even one simple,
extraneous task can interfere with learning outcomes. For instance, in the spatial contiguity

DIFFERENTIAL GRAPHIC ORGANIZER COMPREHENSION 27
effect, physical separation between materials that must be integrated for understanding (element-
interactive) forces the learner to refer back and forth between materials. Although apparently
trivial on the surface, this separation contributes enough extrinsic load to result in substantially
weaker learning outcomes (e.g., Mayer, 2001).
Essentially, extrinsic load adds material to a learning situation that is not valuable to
learning outcomes. Because humans can only process a finite amount of total cognitive load, any
extrinsic resources take away from germane resources. If half of a learner’s resources are
extrinsic to the task at hand, then they half as many germane resources processing intrinsic load.
This significant reduction would be amplified for highly element-interactive material, because
the strain on working memory means fewer conceptual relationships can be examined at once.
The one exception to the idea that information presented has a set intrinsic load is a
learner-level variable, prior knowledge (Moreno & Park, 2010). Prior knowledge reduces
processing by providing not only the basic information, but a conceptual framework on which to
build the new knowledge; this reduces the effective level of intrinsic demands of a task for the
learner. Thus, in order to measure the amount or quality of learning that takes place, it is
necessary to understand what is already known. This flows naturally from the prior definition of
learning as positive change in knowledge and is the pragmatic application of the CLT idea that
our construction of schemas in long-term memory reduces the load on our working memory by
"chunking" multiple concepts together into a single piece of information.
There are a few major points to draw from CLT for the present investigation of learning.
First, a certain amount of processing is needed intrinsically to achieve any given learning
outcome. Second, humans have a finite processing system and can only handle a limited amount
of information or stimuli at a time, though this specific limit may differ between individuals.

DIFFERENTIAL GRAPHIC ORGANIZER COMPREHENSION 28
Third, external factors may be competing to be processed, which reduces the amount of relevant
material that can be processed in a given time frame. Therefore, by decreasing processing related
to extrinsic factors, more of the relevant material can be learned. These implications are germane
to the CTML. Not all information “entering the mind” is processed, but certain pieces are
selected and organized, then processed in the two systems, verbal and nonverbal. If only one of
the two systems is utilized, the other is not contributing to processing that intrinsic load, leading
to inefficient learning.
Cognitive Theory of Multimedia Learning. These findings are largely integrated into
the Cognitive Theory of Multimedia Learning (CTML). This theory attempts to integrate and
ultimately explain findings related to effective learning from multimedia. The CTML is built
around three core assumptions (Mayer, 2005). First, humans can process information in two
separate channels for auditory and visual information, as established theoretically by Paivio
(1991; Mayer, 2005). Second, our channels are limited in capacity, which is established in
Sweller and colleagues' CLT. The third assumption of the CTML is that learning is accomplished
through active processing of available information. That is, humans do not passively record
information presented in multimedia but attempt to make sense of it and construct a functional
mental representation. Figure 1 (Mayer, Heiser, & Lonn, 2001) is a graphic organizer that
effectively summarizes and organizes this theory as an extension of the information processing
working memory model.

DIFFERENTIAL GRAPHIC ORGANIZER COMPREHENSION 29
Figure 1. The Cognitive Theory of Multimedia Learning. Note. Reproduced based on the graphic
organizer in “Cognitive Constraints on Multimedia Learning: When Presenting More Material
Results in Less Understanding,” by R. E. Mayer, J. Heiser, & S. Lonn, 2001, Journal of
Educational Psychology, 93, p. 190. Copyright 2001 by the American Psychological
Association.
The right half of the working memory box of the CTML model can be viewed as
analogous to a crucial aspect of Baddeley's working memory model. Here, the integration
function bridging prior knowledge with verbal and pictorial models simplifies the functions of
retrieving information from crystallized, or long-term memory systems, the episodic buffer's
integrated store, and the central executive's management of information in the subsystems.
However, unlike Baddeley’s most recent models, the CTML does not differentiate among
retrieval of images, words, or integrated information from long-term memory, and the processes
of selecting, organizing, and integrating are kept separate from an overarching central executive
construct.
A prominent feature of the CTML is a series of evidence-based principles for the design
of instructional multimedia, which are effective in improving learning gains in recall and transfer
when used in the design of such materials. For instance, Issa and colleagues conducted a study
using a control group design with pre- and post-tests to measure learning outcomes for medical
students learning about shock (2011). They found that while both the original and modified

DIFFERENTIAL GRAPHIC ORGANIZER COMPREHENSION 30
curriculum materials were effective, those modified using the CTML's principles were
substantially more so in terms of student recall in this naturalistic setting. However, it is
important to break down each principle and effect separately.
The multimedia principle. The consistent finding that combining words with pictures
results in greater learning than words alone is known as the multimedia principle. Mayer (2008)
summarized 11 experiments in a review of the literature and found a large effect size across
studies, d = 1.39. Likewise, during a test of this principle’s potential interactions with particular
individual differences, Austin (2009) replicated an animation-with-narration versus animation-
with-text study represented in Mayer’s analysis and found that multimedia condition explained
more of the variance in transfer outcomes than working memory skill, general fluid intelligence,
and multimedia comprehension skill combined (23% versus 12%). However, as noted before by
Levin and Mayer, this effect is limited by a number of features of the multimedia in question
(1993). For example, in a more recent study, Sung and Mayer demonstrated that although
irrelevant pictures can increase interest in a text, pictures that involve relevant information can
increase both interest and recall (2012). In the CTML, this general idea serves as a foundational
advantage of multimedia texts explained in terms of the core model’s assumptions of dual
channels with limited capacity. Although this broad principle is useful as a summary, it cannot
be expected to generalize across situations. Instead, keeping in mind the notion of material-
appropriate processing, the particular factors that enhance or reduce this pragmatic effect are
described in detail.
The contiguity principle. A study by Verdi, Kulhavy, Stock, Rittschof, and Johnson
(1996) found that viewing related diagrams prior to reading scientific texts was more effective
than viewing diagrams afterward. Ainsworth and Loizou (2003) found that simultaneously-

DIFFERENTIAL GRAPHIC ORGANIZER COMPREHENSION 31
presented diagrams assisted students in successful elaboration. Another study found large gains
in learning when organizing diagrams were integrated with the text as much as possible
(Betrancourt & Bisseret, 1998), rather than separated in space. These studies demonstrated what
is called the spatial contiguity principle (Holsanova, Holmberg, & Holmqvist, 2009) or the
spatial contiguity effect (Moreno & Mayer, 1999), the idea that linearly-arranged visual
information and verbal information (e.g., a related diagram adjacent to a paragraph) enhances
learning outcomes from a text on both recall and transfer tasks. In fact, visual separation of the
diagram from the text, even if on the same page, significantly reduces the learner's integration of
the visual and verbal information (Holsanova et al., 2009). Mayer's 2008 review found an effect
size of d = 1.12 for the spatial contiguity principle, across 5 studies. It should be noted that those
with low spatial abilities compared to their peers appear less affected by problems with spatial
contiguity (Mayer & Sims, 1994), because they do not have the cognitive resources to take as
much advantage of the graphics to begin.
A related contiguity effect based on degree of separation in time is called the temporal
contiguity effect (Moreno & Mayer, 1999). Moreno and Mayer distinguished between these two
contiguities (1999), which are similar in effect but vary in terms of modality. That is, when
pictures are presented with related text, they should be kept as spatially near each other as
possible or spatially contiguously; likewise, when visual materials are presented together with
related narration, they should be presented simultaneously or as temporally contiguously as
possible.
Elsewhere in the research, particularly that related to Cognitive Load Theory, the
contiguity effect is called the split-attention effect (1999). This description identifies an
information processing explanation for contiguity effects. Specifically, the added cognitive load

DIFFERENTIAL GRAPHIC ORGANIZER COMPREHENSION 32
involved in working with and processing separate materials makes integration more difficult (due
to added extraneous load) based on the degree of effective separation, regardless of the
mechanism responsible for it (e.g., time or space). Chandler and Sweller (1992) describe this
effect in the specific case of working between paper-based computer programming manuals and
actual computers versus an integrated training manual without a computer. In two such
experiments, the students in the integrated condition outperformed those working with
conventionally-separated materials (Chandler & Sweller, 1992), even though individuals in the
integrated condition spent less time on processing. Essentially, the common situation in which
instructional materials are separate from each other and must be integrated by the learner
increases the amount of processing that must be done before the information is learned.
The redundancy effect. Where text and pictorial information sources are material-
redundant, or separately present the same material in two modalities, learning is inhibited
(Sweller & Chandler, 1994). That is, if either text or pictures are sufficient to convey specific
information, the elimination of one of them improves the effectiveness of the materials. Unlike
contiguity, where separated materials are more difficult to understand at once than if they were
integrated, the redundancy effect relates to the unnecessary duplication of information in
multiple forms.
In the one experiment, Kalyuga, Chandler, and Sweller found that adding concurrent,
fully-redundant text to a narrated training animation significantly increased learners' subjective
ratings of cognitive load and decreased scores on an objective follow-up test (2004). In a direct
follow-up comparing narration-only "text" against the same narration combined with fully-
redundant written text, the addition of the redundant written text reduced performance on the
follow-up test (2004). Likewise, Leahy, Chandler, and Sweller found that adding explanatory

DIFFERENTIAL GRAPHIC ORGANIZER COMPREHENSION 33
audio text to a diagram that includes similar written text explanations interfered with learning
despite increasing instructional time (2003). Although not identical in this case, because the
narration was not essential to understanding, it was redundant and reduced the effectiveness of
instruction.
In a series of experiments, Mayer, Heiser, and Lonn explored the redundancy effect in
greater detail (2001). In the first experiment, they replicated the effect by adding redundant on-
screen text to a narrated animation, which inhibited student learning. In the second, they used
two redundant groups, one verbatim and one with a brief text summary instead, and one non-
redundant group with animation and narration only. Although the summaries also tapped all
main ideas tested, the non-redundant group had the superior performance, and the redundant
groups did not significantly differ.
The coherence principle. Related to redundancy, the coherence principle is at core the
notion that irrelevant details should be omitted from a text. It is observed when students learn
better from a presentation of less material than from one containing additional materials. In
summarizing eleven experiments conducted examining this effect, Mayer found that all eleven
found a significant recall advantage for texts following this principle, with a median effect size
of 1.98, while ten found a significant advantage in terms of transfer outcomes, with a median
effect size of 1.17 (Mayer, 2008). Coherence effects are theorized to arise from an overloading of
the working memory channels used for learning (Moreno & Mayer, 2000). That is, to the degree
the learner attends to extraneous details, he or she has fewer cognitive resources dedicated to
processing material germane to the intended learning outcomes.
The coherence effect holds for a variety of different types of added stimuli, including
stories and illustrations that are interesting and topically-related but irrelevant to core content

DIFFERENTIAL GRAPHIC ORGANIZER COMPREHENSION 34
(Harp & Mayer, 1997), quantitative information such as formulas and computations that is
relevant but unnecessary for understanding of the core material (Mayer & Jackson, 2005), details
added to video clips (Mayer, Heiser, & Lonn, 2001), and additional interesting yet irrelevant
video clips (2001).
The seductive details effect. A more specific concept is the seductive details effect, which
is found when adding interesting details to a text results in reduced learning outcomes (Harp &
Mayer, 1998). However, learners are not merely distracted from the details important to learning
outcomes, they are less effective at integrating them into a meaningful model.
In a series of four experiments, Harp and Mayer tested multiple hypotheses for explaining
the mechanism of seductive details (1998). In each, they replicated the effect and then attempted
to minimize it in ways suggested by each hypothesis. In this way, each of three explanations was
used to predict the pattern of effects across experiments, the distraction, disruption, and diversion
hypotheses. The distraction hypothesis suggests seductive details harm learning simply by taking
attention away from main points. The disruption hypothesis attributes the effect to disruptions in
transitions between ideas, which specifically affects the understanding of causal and sequential
relations among ideas. That is, the learner will fail to build well-organized mental representations
of the relations among ideas. The diversion hypothesis maintains that learners still construct
coherent mental representations of ideas in the text but that they organize them around the
seductive details rather than the important ideas relevant to structural relations (1998). In this
way, seductive details affect learning by providing an enticing but inappropriate reference point
for organizing knowledge, which is to say they cause the new information to be integrated with
an inappropriate base of prior knowledge.
DIFFERENTIAL GRAPHIC ORGANIZER COMPREHENSION 35
In the first experiment, Harp and Mayer tested a solution suggested by the distraction
hypothesis. In a 2 x 2 independent samples design, they examined passages with and without
seductive details and with and without highlighting of key points (e.g., bold main ideas). The
results were that seductive details substantially reduced recall and transfer outcomes (Cohen’s d
≈ -1.7 for recall, d ≈ -1.6 for transfer; group sizes in the analysis were not precisely reported, nor
were effect sizes reported directly), and this effect was not reduced by highlighting the important
points. There was also no main effect of highlighting. Because redirecting attention did not
diminish the seductive details effect, the distraction effect was not supported here. However, as
Harp and Mayer point out, it may simply be that highlighting is an ineffective redirector for
college-level students or that the method is to some degree valid but insufficient to counter the
effect.
In their second experiment, Harp and Mayer directly tested an alternative method of
guiding students’ attention to the important ideas in the text (1998). The goal was to rule out this
explanation and better establish whether distraction is a viable hypothesis for explaining the
seductive details effect. To this end, in their second experiment, the researchers manipulated
whether students were given learning objectives, which is hypothesized to assist students in
selecting and attending to important information. Under the distraction hypothesis, this would
diminish the seductive details effect. Results indicated that students given learning objectives
recalled more important points but not more seductive details and also performed better on a
transfer task; although there were significant main effects in terms of recall and transfer from
both seductive details and learning objectives, there was no interaction effect. This means that
redirecting attention to important details is effective but does not diminish the seductive details
effect.

DIFFERENTIAL GRAPHIC ORGANIZER COMPREHENSION 36
Both experiments 1 and 2 were inconsistent with the distraction hypothesis and consistent
with the diversion hypothesis. Although Experiment 2 is not entirely consistent with the
disruption hypothesis, it is also not an adequate test, because the learning objectives did not
specifically direct attention to causal relations among the constructs. It is therefore unclear under
the disruption hypothesis whether the learning objectives would diminish the seductive details
effect or not.
To test a more appropriate hypothesis, in Experiment 3, Harp and Mayer manipulated
two cues together, and some learners were given an outline as an advance organizer that
previews the chain of causal events in the text as well as in-text numbering that draws attention
to the specific chain of events and their order. Based on the disruption hypothesis (and also the
distraction hypothesis), this manipulation is expected to diminish the seductive details effect in
addition to any potential main effect. Results were that the manipulation did not affect recall or
transfer outcomes and also did not affect the number of seductive details recalled. Moreover,
there was no interaction effect, meaning that the seductive details effect was not diminished as
predicted by the disruption hypothesis (1998). This effect is consistent only with the diversion
hypothesis, which would not suggest that the signaling is enough to cue an appropriate
knowledge base for the integration of new information.
As a better challenge to the diversion hypothesis, Experiment 4 investigated four
different conditions. In addition to a control group without seductive details, one group was
given a passage with seductive details interspersed as usual, one group was given all the
seductive details at the beginning, and another was given all seductive details at the end.
According to Harp and Mayer, the distraction hypothesis assumes that distractors will affect
learning regardless of placement (1998). Although perhaps not convincing, because distractors

DIFFERENTIAL GRAPHIC ORGANIZER COMPREHENSION 37
can also be conceptualized as related to contiguity effects, the distraction hypothesis is
nevertheless an ineffective explanation based on earlier experiments. More importantly, the
disruption hypothesis predicts that moving the details to either the beginning or the end will
eliminate their effects, because they will no longer be disrupting transitions between sequential
ideas. Although the diversion hypothesis also predicts moving them to the end will diminish the
effect, it differs from the disruption hypothesis because it predicts moving them to the beginning
will be ineffective in reducing the seductive details effect (1998). Results were that recall and
transfer did not differ between the seductive details first and interspersed groups, meaning that
moving them to the beginning did not diminish the effect. The group without seductive details
and the group with seductive details presented at the end performed better, which did not differ
from each other. This means the seductive details effect was reduced by moving them to the end
but not when moving them to the beginning. Further, the group with seductive details at the end
of the text recalled fewer seductive details than groups with seductive details presented before
and interspersed throughout the text. Overall, results were consistent with the diversion
hypothesis but not with the distraction or disruption hypotheses
Simply put, the seductive details effect was significantly mitigated by moving the details
to the end of the multimedia text. In this way, fewer seductive details were recalled, more of the
important ideas were recalled, and transfer performance improved; this was the inverse of when
seductive details were moved to the beginning or interspersed as usual (1998). Thus, the mere
presence of seductive details is not what causes difficulty learning. Instead, it is the introduction
of their content at points in a text that make them available for influencing processing of other
content. As suggested by the contiguity effect, such distracting details are problematic when they
are provided in a manner that breaks the contiguity of relevant, interrelated materials. In

DIFFERENTIAL GRAPHIC ORGANIZER COMPREHENSION 38
addition, the coherence principle suggests that adding irrelevant information to a text uses up
finite working memory, reducing how much can be learned in a given time frame. The seductive
details effect builds on this, adding that seductive details also affect learning by changing how
learners process and ultimately understand concepts presented in the text.
Although these effects may appear to be common sense in retrospect, it is important to
consider the competing motivational viewpoint, which has been that adding interesting details
increases motivation to learn, which leads to improved learning outcomes in naturalistic settings
(Weiner, 1990). Indeed, this view is evident in many modern texts, which include comics and
other text adjuncts with limited value to the material itself. One of the criticisms of the coherence
effect as a concept is its limited evidence in naturalistic settings. Muller, Lee, and Sharma
attempted to test this criticism in a laboratory setting that avoided pressuring students to actually
complete the study or perform at a high level (2008). To this end, the materials used were online,
anonymous, and explicitly did not require students to complete the study to receive credit (i.e.,
for merely visiting the website, extra credit was given to freshman university students and
homework credit was given to high school students, and students were told this explicitly in their
reading of the informed consent document). The treatment conditions were a concise multimedia
presentation of the physics involved in stellar radiation (7 minutes, 30 seconds) and the same
with added excepts from an interview with an astronomer discussing more exciting topics such
as black hole formation and galaxy collisions (10 minutes, 45 seconds). The study found no
significant differences in recall or transfer outcomes between treatments (Muller, Lee, &
Sharma, 2008). Unfortunately, no survival analysis was included regarding whether either group
was more or less likely to complete the study once begun. Although appropriate data were
gathered, no analysis was reported on time spent on learning activities, and prior knowledge was

DIFFERENTIAL GRAPHIC ORGANIZER COMPREHENSION 39
measured only by grade level (which reduced the effective reliability of learning measures used
as well as overall statistical power). Despite these limitations, it seems clear that in such a
voluntary setting as an anonymous online learning environment with no accountability for
learning or time spent participating, the seductive details effect and the importance of coherence
can be to some degree mitigated when material supplements add interest. However, this does not
necessarily prevent the deleterious effects of seductive details when they divert learners away
from the information useful to constructing appropriate mental models.
The individual differences principle. The individual differences principle refers to a set
of consistent observations that indicate variation at the individual level can affect the importance
of other design principles in the CTML (Mayer, 2001). First, generally-speaking, effects of
following other design principles within CTML are stronger for individuals with low prior
knowledge than for those with high prior knowledge. In addition to having less intrinsic load to
process in the first place, making all effects less detectable, this is predictable based on the
notion that those with greater prior knowledge have more cognitive resources for maintaining
activation of an appropriate knowledge base for integrating new information. Second, and more
important to the present investigation, the effects of CTML principles are stronger for
individuals with high visuo-spatial skills (2001).
Graphic Organizers
In current practice, the vast majority of academic content is presented verbally, through
visual-verbal text or auditory-verbal lecture. Graphic organizers (GO), however, are fairly
common visual representations of content structure that are used to supplement verbal materials
in both textbooks and instructional multimedia, as in Powerpoint lectures and instructional
videos. Generally, GO are images that use spatial arrangement with brief verbal labels to

DIFFERENTIAL GRAPHIC ORGANIZER COMPREHENSION 40
communicate the important relations among concepts presented verbally (Kools et al., 2006).
This kind of framing and organizing text adjunct provides a visual structure for relationships
among mental representations of concepts that are more fully explained in the verbal components
of the text (Griffin & Tulbert, 1995). It is important to delineate which visual adjuncts are
graphic organizers and which are not. Carney and Levin (2002) carefully distinguish various
functions of illustration adjuncts broadly, all of which are the subjects of research within the
CTML. Representational pictures “literally depict” what is described in text, like a circuit
diagram or images showing a person performing stages of the Heimlich maneuver for first aid
training. These are not to be confused with material-irrelevant pictures, such as stock images of
students working. Interpretational pictures are meant to clarify cause-and-effect sequences using
a series of representations of ideas described in text. For instance, a step-by-step sequence of
images representing how to connect and disconnect jumper cables goes beyond representation to
interpretation. A third category defined is transformational, or mnemonic pictures, which are
visual mnemonics offered for the purpose of making recall easier and more effective (2002).
Transformational pictures represent cues for recall but do not directly represent the information
to be learned. Carney and Levin spend little time discussing the nature of organizational pictures,
which correspond to graphic organizers. Indeed, at the time of publication, most of the research
focused on interpretational pictures in the context of the physical sciences (2002), including the
work of Mayer that helped build the foundation for the CTML. Such images are useful for
representing concrete ideas and cause and effect, but they contrast significantly with relatively
abstract organizer adjuncts. Given these broad parameters for an organizing, graphic text adjunct,
they can take many related but distinguishable forms, such as labeled diagrams and flow charts.
The nature of the information to be presented generally dictates the specific form used. For

DIFFERENTIAL GRAPHIC ORGANIZER COMPREHENSION 41
instance, when time or cause and effect are involved, a GO is likely to spatially map related ideas
and use arrows or other indicators to describe the flow from concept to concept. As explained by
Alvermann (1986), outlines and similar adjuncts are distinct from GOs because they lack two-
dimensionality (as cited in Robinson & Kiewra, 1995). That is, only one dimension, spatially,
modifies the linear verbal content, rather than the full two dimensions afforded by print and most
other visual media. This substantially limits the spatial cues that can be used to express
relationships among concepts. Certainly, these “one-dimensional” adjuncts nonetheless organize
information using spatial cues. But because the spatial aspect that forms the core of the GO is
significantly limited in adjuncts such as outlines and lists, it is useful to draw a dividing line
between them.
Graphic organizer effectiveness. A more specific but still quite broad definition of
graphic organizer, the concept map, has been studied for many years in various forms,
representing a great deal of the research on organizational pictures. Concept maps are made up of
labeled nodes arranged and connected spatially that generally do not include complex
representations of concrete objects such as photographs and drawings. In this way, concept maps
can be said to include graphic organizers that represent concept interrelationships in a visual-
nonverbal way but not the concepts that are being organized. Nesbit and Adesope in their 2006
meta-analysis found that studying concept maps across a variety of conditions in 40 studies
resulted in a mean effect size of 0.364, a small to moderate advantage that held against plain,
linear text (verbal) as well as list (verbal) and outline (verbal, organizing) adjuncts. Across
applications, it was recommended that concept maps be used instead of verbal adjuncts where
possible (2006), but the authors noted a lack of research on transfer outcomes as well as a lack of
high quality research examining the nature of the benefit theoretically.

DIFFERENTIAL GRAPHIC ORGANIZER COMPREHENSION 42
In a straightforward test of the benefits of graphic organizers, Kools, van de Wiel, Ruiter,
Crüts, and Kok (2006) used a series of four graphic organizers in a health brochure to see if
students learned more than those with the same text without the GOs. Prior to randomization,
participants were invited because they had low prior knowledge about the health topic (asthma)
based on a quiz given to all freshmen at the university two months prior. Participants read a very
long text in this study, reported as relatively simple material but spanning 12 A4 pages. All
questions were open-ended but objective and involved either recall or transfer based on brief
vignettes. Students who read the version with graphic organizers performed better on both
measures (overall, d = 1.27). Interestingly, students generally rated their comprehension highly,
and there were no differences between groups on this. This means that graphic organizers
appeared to improve comprehension but not subjective ratings of comprehension. This can be
understood using Anderson and Krathwohl’s taxonomy in that no exclusive information
(knowledge) was provided by the organizers, and they were not designed to promote
metacognitive processing. Knowledge of knowledge did not appear to change (best estimate of d
= 0.22, 95% CI: -0.28, 0.62) with the increased knowledge attributable to the GOs, but this could
not be ruled out given the limited statistical power for these estimates.
DiCecco and Gleason conducted a study examining the effects of including a graphic
organizer as a post-reading instructional aid. In the context of 40-minute lessons, a single cause-
effect diagram (a concept map with arrows showing direction of effect) about the effects of
Industrialization on work hours and consumption lead students to freely recall and write over
twice as many relational statements than those without a GO (2002), which represents a transfer
outcome as assessed in the study. It should be noted that the relational elements were specifically
emphasized in verbal materials as well, and instruction time was identical in both groups; the

DIFFERENTIAL GRAPHIC ORGANIZER COMPREHENSION 43
manipulation was simply that a GO was not used for the control group at any point during the
lesson. The sample size was very small for between-subjects comparisons, with only 26 total
participants, so the lack of significance in measures of text base performance is not evidence of a
lack of any effect. All participants were middle school students identified as having a learning
disability (based on IQ-achievement discrepancy). The authors asserted this population has more
difficulty learning relational ideas presented in text, which may mean that they stand to gain the
most from the introduction of GOs that cover relational ideas. Although population differences
are not the focus of the present study, it is important to keep in mind the possibility of
interactions between particular population groups and text adjuncts. However, when appropriate
texts are selected, age and group differences should be minimized. In DiCecco and Gleason’s
study, the type of learning disability was not specified. Therefore, possible group differences in
responsiveness to GOs compared to the general population cannot be attributed to specific skill
strengths and deficits based on this study, as would be most consistent with a CTML individual
differences hypothesis. Overall, this study provides some evidence that graphic organizers are
effective for teaching relations among concepts in comparison to a verbal-only method with the
same emphasis.
Mechanisms for the effects of graphic organizers. An earlier experiment by Robinson
and Kiewra (1995) compared three different text adjunct conditions in the context of study
materials (a 6500-word psychology textbook chapter) rather than instructor-led lessons.
However, both study time and subtest time allotments were controlled. As a separate
experimental factor, half the students completed the objective tests immediately and half after a
two-day delay. It is important to note that at the 45-minute mark during the one-hour study
session, the texts were taken from the students in the adjunct conditions, leaving behind their

DIFFERENTIAL GRAPHIC ORGANIZER COMPREHENSION 44
seven separate adjuncts. Their texts also had added sentences directing them to the GOs or
outlines. This procedure would introduce a contiguity effect, and students reporting feeling
rushed or unable to completely view the materials. The learning outcome measures were split
between items representing material in the organizers as well as material only in the main text,
and items were divided among types of knowledge and application. Across knowledge
categories, no interactions between adjunct condition and delay condition were found, but main
effects were found for different kinds of knowledge. The text-only group performed better on
text-base items not represented in the organizers, as expected, but there was no group difference
on items covering material in both the text and organizers. The graphic organizer group
performed better on the two free recall measures of relational knowledge, identifying contrasting
and coordinating premises between concepts. However, no differences were found for an
objective measure of hierarchical relations, a third measure of relational knowledge in which
students were to recall category names. No main effect of condition was found on the application
task, but there was a significant interaction. The delayed group was observed to be similar
(negligibly higher) between GO subgroups and roughly a standard deviation lower in the text
only and outline subgroups. Otherwise, across measures, immediate testing resulted in higher
scores than a two-day delayed test (Robinson & Kiewra, 1995). This is important because it
suggested that the transfer learning did not appear to decrease with time for learners in the GO
condition, which may be evidence of better elaborated encoding. However, the serious contiguity
effect introduced by the methods for the GO groups leaves the apparent conclusions less certain
in terms of the observed near-equivalence of plain texts and GO texts.
In a second experiment, Robinson and Kiewra attempted to address the time issue using
the same materials. Rather than take away materials or use separate delay conditions, they had all

DIFFERENTIAL GRAPHIC ORGANIZER COMPREHENSION 45
students study for the full hour and then return one day later for a 15-minute study session
followed immediately by the tests. No differences were found among the three conditions for
items represented in the text only, but items represented in both the adjuncts and text were better
answered by each of the adjunct groups. Compared to the other conditions, the GO group
recalled more hierarchical and coordinate relations and also performed better on the application
task. In contrast to the previous experiment, there were no differences in learner perception of
the study time allotted. Only 14 students completed the procedures in each group, so any small or
moderate effects in the population would go undetected here. Although these methods do not
eliminate a potential contiguity effect, such an effect would be expected to selectively decrease
performance for the GO condition. Altogether, this study found positive effects of graphic
organizers on recall and transfer for relatively long abstract science texts, even when study time
is held constant in less-than-ideal conditions. While effect sizes may be artificially reduced by a
contiguity effect, this is falsifying evidence for the hypothesis that GO effects are explained by
an increase in time spent studying the materials. However, it does not rule out effort modulation
or motivation-related hypotheses. Thus, the current conclusions may be prescriptive in terms of
efficacy and efficiency in practice, and they rule out the time-spent hypothesis, but they do not
specify the solution to the basic question of mechanism.
In a more recent study, Shaw and colleagues examined the effects of how a GO is
presented, before or after an otherwise plain, 3380-word text (Shaw, Nihalani, Mayrath, &
Robinson, 2012). The core question here for present purposes is not physical placement itself,
which in practice should be contiguous. Instead, this study examines how GOs best function, as
overviews for introducing text concepts through their relations or as organizers of concept
relations once they are initially learned. In a 2 x 2 design, all conditions viewed three graphic
DIFFERENTIAL GRAPHIC ORGANIZER COMPREHENSION 46
organizers. Two groups did so before the text and two afterward. Additionally, two groups read
the text from a PowerPoint presentation, and two listened to the text as an audio recording
(completing the 2 x 2 group design). All viewed the GO slides equally. Time on each slide for
readers coincided with the duration of the recording for listeners. Outcome measures were both
objective, but one measured text base recall and the other measured transfer to novel situations.
For all analyses, student’s ratings of their prior knowledge, as measured after reading but before
testing, were used as a covariate, allowing a closer quantitative estimate of learning as opposed
to post-test knowledge. There were no interactions with or main effects of text modality, but
because all groups viewed the graphics sequentially, this is not contrary to DCT predictions or its
counterpart in the CTML. No effects were found for the recall measure, but transfer outcomes
were higher in the group that studied the organizers after reading the text. This was interpreted as
supporting the role of GOs as organizers of information recently learned rather than as overviews
that can be learned in advance to organize information during the learning process (2012).
However, the majority of participants were not very familiar with the topic beforehand (70%
indicated no or very little familiarity with the topics). It may be that the GOs used as advance
overviews were not easily learnable because of this lack of knowledge (Shaw et al., 2012). More
specifically, unless already familiar with terms and ideas, organizers showing both new concepts
and their relationships simultaneously would be more challenging than reading a linear text that
covers the same concepts and relationships one by one. Cognitive overload would explain the
reduced learning from the initial presentation. Because the group viewing them afterward has
recently learned these concepts, the organizers are better learned and thus more beneficial to
learning overall, regardless of whether the graphic nature of the adjuncts was important. This
study suggests that GOs fulfill an important role in covering relational information after students

DIFFERENTIAL GRAPHIC ORGANIZER COMPREHENSION 47
learn the associated concepts, but it does not suggest that GOs should not also be used at the
beginning of texts.
An alternate interpretation is suggested by a recent review of 42 picture-text sequencing
studies (Eitel & Scheiter, 2015). Eitel and Scheiter suggest that order of presentation affects
learning outcomes primarily through a recency effect, with the more recently presented material
remembered better regardless of learning outcome type or delays in testing. That is, outcomes are
dependent on these broader factors regardless of whether the graphic adjunct is intended as an
organizer of material in the text or not. Eitel and Scheiter note that more complex material
should be presented after simpler material (2015), but this is important even with plain texts. The
implication here is that graphic organizers and other adjuncts simply present material differently
rather than interacting with (e.g., organizing) a text passage in a fundamentally different way
than another passage of text. However, only three studies in this review compared graphic
organizers used before and after a text.
The first study examined was Shaw and colleagues’ 2012 comparison that found graphic
organizers are more effective at the end of a passage than at the beginning for the transfer
outcome, which is the primary goal of the organizer. Because the graphic organizer used contains
a great deal of verbal information (organizing it in a matrix) and summarizes information
presented in the text, no major difference in recall would be expected under a recency
hypothesis. Likewise, the transfer advantage would be expected for the post-reading GO.
Although not confirmatory, this study’s findings were consistent with a recency hypothesis.
On the other hand, a study by Simmons, Griffin, and Kameenui found that a group given
an organizer ahead of the reading resulted in better performance on a recall test (delayed only;
1988). Although only one of the graphic organizers used in the study was published, this one was

DIFFERENTIAL GRAPHIC ORGANIZER COMPREHENSION 48
poorly chosen. As a concept map, it linked matter to atoms to nuclei and electrons, but a labelled
diagram (representational picture) would have been far simpler and more material-appropriate.
The study also used small, intact groups of 6th grade students for assignment to different
conditions. Recency offers a better yet incomplete explanation for this finding compared to the
use of a GO as a relational organizer, but this conclusion is limited by the study’s
methodological issues. Specifically, the GO was an inappropriate choice of adjunct, and much of
the relational information in text was lost in the graphic. Thus, while there is evidence of efficacy
in practice, this material limitation casts some doubt on the validity of the conclusion that a
recency hypothesis is the better explanation.
Factors confounded with GO effects. Robinson and Kiewra explicitly tested the use of
graphic organizers following a text, finding that student learned relations among text concepts
better, resulting in greater transfer of learning (1995). However, in their study, they noted that
students studying graphic organizers spent a greater amount of time studying overall. Because
this is an instructionally and practically relevant cost, time remains an important factor to
consider when looking at learning from multimedia, even though it does not appear to explain
the effects of GOs.
Alvermann (1980) noted early in the research that the inclusion of graphic organizers
significantly increased reading time for text passages. Because processing of cognitive load
necessarily takes place over time, it should be determined to what degree there are benefits or
drawbacks of graphic organizers due to increased processing time. To be clear, questions here
are distinct from the previously established finding that GOs can be effective when study time is
held constant. To this end, GOs must be examined in more ecologically valid settings, where
students are in control of time spent once they begin a study task. At that point, time spent may

DIFFERENTIAL GRAPHIC ORGANIZER COMPREHENSION 49
be accounted-for to create measures that consider efficiency in addition to overall learning
effects, creating a broader picture of the results of adding GOs to text materials.
Students' attention to key elements (or "selecting" in the CTML, as noted in Figure 1)
should also be considered. It is important to investigate the degree to which graphic organizers
lead to learning gains because they draw attention to particular elements of the text, as signifiers.
For example, advance organizers have been studied as text adjuncts for many years, and these
have some evidence of instructional value in themselves. In a meta-analysis from 1983, Stone
found a median effect size of 0.66 among 112 studies (SD = 0.76). Although such adjuncts used
as pre-reading outlines or overviews (Robinson & Kiewra, 1995) may not be as strong as graphic
organizers, it is worth noting that graphic organizers generally present more information in
practice (Purnell & Solman, 1991) and are likely to result in increased study time. This confound
should be removed as much as possible by adding verbal material to a control condition that is as
alike as possible to the spatial and verbal information included in the graphic organizer, whether
this information is text-redundant or not. A text-based adjunct (inset text box) that fills the same
space as a graphic organizer would allow for a more valid comparison than a text completely
without adjuncts, material-redundant or not. This would help control for both repetition of text
material in adjuncts and the tendency for such information to serve as signifiers, drawing
attention to key features.
Based on the CTML, a graphic organizer would be considered better-suited to this role
than the text adjunct, even if they are informationally-equivalent. Although limited by a single
modality, differences would be seen in learning outcomes due to the concurrent use of the
nonverbal channel, though it would likely also increase time spent as learners examined the
figure via the same visual modality. The time spent on GO adjuncts may or may not be similar to

DIFFERENTIAL GRAPHIC ORGANIZER COMPREHENSION 50
time spent on text adjuncts, and such effects would likely vary. On the other hand, the MAP
framework ignores modality itself as long as the information presented in each format
appropriately provoked the needed relational and item-specific information assessed by the
learning outcomes. Mayer and Johnson found recall but not transfer effects for the inclusion of
text in illustration adjuncts to direct attention to specific elements during verbal instruction
(2008). That is, the change in adjunct directing attention to specific points did precisely that, but
it did not provoke processing toward a more comprehensive and functional understanding. If this
generalizes to self-paced GOs in text, it would be expected that GO adjuncts benefit recall of
specific points in much the same way as verbal adjuncts, by directing additional attention to
them. Therefore, relatively little benefit to recall would be predicted for GOs in this comparison.
However, their two-dimensionality relevant to nonverbal channel processing may still lead to
improved performance, especially with regard to transfer outcomes where the verbal adjuncts
were not clearly effective.
It is commonly believed that repeated, redundant material in alternate form (e.g.,
narration with fully redundant text/transcript) improves learning (Kalyuga, Chandler, & Sweller,
2004). However, Kalyuga, Chandler, and Sweller found in a series of experiments that
simultaneous presentation of redundant verbal material in multiple modes (i.e. text with
narration) confers no benefit or sometimes actual losses when compared to presentation via
either medium alone. The authors cautioned that only non-redundant materials provide learning
advantages when used simultaneously (e.g., narrative with text outline, narrative with
animations). Essentially, it is when learners must integrate information from both forms
presented in order to understand the material that concurrent presentation becomes beneficial.
Although it is not immediately apparent, graphic organizers can play an important role in this

DIFFERENTIAL GRAPHIC ORGANIZER COMPREHENSION 51
arena. The GO can be integrated into a text adjacent to germane information, and the reader
considers both sequentially first, then simultaneously with each in mind. The learner can
understand both at the rate he or she is able by using the relational information in the organizer to
connect the item-specific concepts presented verbally. This implies some skill or strategy use not
necessarily implied by the broader term “reading.” That is, some readers may be prepared to stop
and consider information presented this way, which would be expected to increase both learning
outcomes and study time, especially in the presence of graphic organizers or other adjunct
materials that signal particular pieces of information together.
Overall, consistent with the multimedia principle from the CTML, previous research has
demonstrated that providing these GOs along with expository texts increases learning (e.g.,
Kools et al., 2006), including for children and adolescents with learning disabilities (Dexter &
Hughes, 2011). Although the mechanisms are not yet clear, it is important to keep this general
empirical finding in mind.
Intelligence
The notion that learners proceed differently and achieve different outcomes is not a new
one. This is, after all, the basic premise of intelligence in the modern, normative sense. Although
CLT and the CTML state clearly that humans are limited in the amount of processing they can
perform in a given time, they are both compatible with individual differences in the sense of
intelligence. It stands to reason that a person with greater intelligence in a relevant domain would
be able to handle a greater intrinsic load in a given time frame than others, which would
systematically impact learning outcomes from given materials.
When we speak of measuring an individual’s intelligence, we often mean a single,
overarching concept that describes his or her collective cognitive abilities compared to others.

DIFFERENTIAL GRAPHIC ORGANIZER COMPREHENSION 52
This general intelligence, or “g,” was proposed by Spearman (1927). Since Spearman’s initial
conceptualization of intelligence as an empirically measured construct, researchers have since
distinguished among a variety of separate cognitive abilities. First, the broad concept of g was
split by Raymond Cattell into two parts, Gf and Gc (Bovaird, 2010). These are general fluid
intelligence (Gf) and general crystallized intelligence (Gc). Gf refers to abilities such as
information processing and problem solving, whereas Gc refers to accumulated knowledge and
learned skills.
This framework was later greatly expanded by the independent and collaborative work of
Horn and Carroll (Flanagan & McGrew, 1998), ultimately producing the Cattell-Horn-Carroll
(CHC) theory of intelligence. Supported by factor analysis, this framework identified a number
of specific factors contained in Spearman’s g. This point is critical to the present investigation
because, given that intelligence affects processing, a specific intelligence should affect learning
in specific ways. Therefore, ipsative differences in intelligences could have more complex yet
specifiable effects on learning outcomes depending on how the nature of the materials requires
different intelligences in different measures. This is consistent in principle with the dual channels
of processing inherent to DCT and the CTML. But it has greater implications for the individual
differences principle for the CTML, which is not yet substantially integrated with intelligence
theory.
One of the broader intelligence factors within CHC theory is Visual Processing (i.e.,
visuospatial skill or Gv, referencing g as the standard symbol for intelligence). Gv includes a
number of narrow abilities related to visual and spatial perception and transformation skills (e.g.,
Newton & McGrew, 2010). Because graphic organizers emphasize visuospatial processing and
require such abilities during studying, Gv is of particular interest in the present investigation for

DIFFERENTIAL GRAPHIC ORGANIZER COMPREHENSION 53
predicting and explaining individual differences in the effects of GOs on learning outcomes. Like
other intelligence constructs, this one is measured using sets of performance tasks. One requires
fluency in rotating or simply changing mental representations of objects (spatial relations; SR),
another more complex acts of manipulating mental representations of objects (visualization; Vz),
and a third imagining a set of objects from another perspective (spatial orientation; SO), though
the latter is not universally recognized as a separate sub-ability (Colom, Contreras, Botella, &
Santacreu, 2002). Although a number of subskills have been identified and separated, they are
very strongly correlated, and one-factor models for Gv have been demonstrated to be successful.
Colom and colleagues found that separating these basic subfactors of Gv does not substantially
build on the Gv factor's relationship to narrower abilities. Instead, the single factor demonstrated
a good model fit (e.g., RMSEA = .065) across all performance measures (2002). Therefore, Gv
may be validly measured as a single construct without special consideration of subfactors or
narrower abilities.
It is presently useful that Gv is not strongly related to verbal skills outcomes. Based on an
analysis of the 8818-participant standardization sample for the WJ-III, basic reading skills and
reading comprehension performance are weakly related or unrelated to Gv from ages 6 to 19
(Evans, Floyd, McGrew, & Leforgee, 2002). It is important to note that this age span follows
what the logographic stage of reading acquisition (2002), which may well be reliant on Gv but
falls beyond the scope of the present study. For young adults, it may be expected that any main
effects of Gv on learning outcomes during reading are minimal in the context of plain texts, as it
is measured in the WJ-III. This would not necessarily be expected in the context of texts with
graphic adjuncts, which would theoretically require visuospatial skills and/or accommodate for
visuospatial difficulties.
DIFFERENTIAL GRAPHIC ORGANIZER COMPREHENSION 54
One potentially interacting motivational factor related to Gv is learning preference. This
refers to whether an individual prefers graphical instructional materials (e.g., animations,
diagrams) or verbal ones (e.g., written text, narrations). Although it might be expected to be
dependent on visuospatial skills, such a connection is weak as evidenced by correlation estimates
with tests of visuospatial skill. For instance, among college students, Mayer and Massa found no
correlation with a common card rotation task (r = -.01) and a weak correlation with a paper
folding task (r = .2; 2003). In their study, this was interpreted as evidence that skills in making
use of verbal and visual materials (i.e., Gv) are largely separate from preferences for one or the
other (2003). Nevertheless, in an investigation of participant-level factors moderating learning
effects of multimedia, the relatively simple preference construct might be expected to interact
with motivation or effort and thus learning outcomes attributable to graphic adjuncts. Although
perhaps a seemingly tangential construct in the present study, if preference affects attention to or
effortful processing of graphic adjuncts, it may be an important aspect of learning from such
materials. This could make it an important covariate in a model clarifying a hypothetical
relationship between Gv and learning with graphic organizers.
Intelligence interacting with media. Intelligences have often been found to interact with
the properties of media presented to students. That is, inter-individual differences in intelligences
affect how individuals learn from media with different properties and adjuncts. In the present
investigation, this raises the question of whether adding a graphic organizer to expository text
affects a learner with high Gv differently than an individual with low or average visuospatial
intelligence.
Nesbit and Adesope’s meta-analysis (2006) noted only 5 studies on concept maps that
examined individual differences. Although students with lower levels of abilities in general

DIFFERENTIAL GRAPHIC ORGANIZER COMPREHENSION 55
tended to benefit the most (ES = 0.436 for low verbal ability and 0.369 for low domain ability),
none of the studies considered spatial abilities specifically, and each relied on median-split group
comparisons. Overall, these were consistent with the CTML’s individual differences principle.
The latter limitation likely diminished effect size estimates and precision. But more importantly,
the former prevents the findings from informing the present question of whether GOs
differentially assist students of different visuospatial abilities.
One study likely represents the closest match to the present investigation, offering the
most relevant empirical evidence for establishing predictions. In learning from an animation with
concurrent or successive narration, Mayer and Sims found a clear contiguity effect (concurrent
narration being superior; 1994). A selection of spatial task items from Educational Testing
Service’s (ETS’s) Kit of Factor Referenced Tests for Cognitive Factors were administered to
assess spatial abilities (similar to current tests of Gv), with individual scores determined by total
number of items correct. Those individuals rated as having high spatial abilities appeared to
benefit strongly from temporal contiguity, and those with low spatial abilities showed no
difference between concurrent and successive presentation in terms of later transfer tasks. Mayer
and Sims interpret this as evidence that students with high abilities can easily represent spatial
information, allowing them to devote cognitive resources to use simultaneous narration
effectively, whereas students without high spatial abilities must devote too many cognitive
resources to simply mentally representing spatial material to benefit (1994). Thus, those with
greater visuospatial abilities are able to benefit more from auditory-verbal adjuncts to visual-
nonverbal materials when presented temporally contiguously. This factor of timing is important
in practice but should not be generalized to the presently more common text with static visual

DIFFERENTIAL GRAPHIC ORGANIZER COMPREHENSION 56
adjuncts. When reading from a text, adult students with some metacognitive awareness can
easily self-pace in ways that are not possible with timed materials such as narrations.
Indeed, Harskamp, Mayer, and Suhre (2007) later found that learners who spent the least
amount of time working with learning materials benefitted most from the modality principle. In
their interpretation, text materials overloaded the verbal system, and learners did not spend the
additional time necessary to integrate information from visual-nonverbal materials with visual-
verbal ones. In contrast, when those learners viewed illustrations (not GOs) while listening to the
verbal materials, they performed relatively well. In this modality, the ability to space learning
was removed, but because they were less likely to overload their visual system, the effects were
reduced. On the other hand, learners that spent more time with materials benefitted far less, if at
all, from the switch to multimodal presentation. Given unlimited time, Harskamp and colleagues
argued that printed materials were a clear advantage given the transient nature of the auditory
materials (2007). Whereas the audio may of course be repeated in part or in whole in such a
situation, text materials are generally more fluently navigable by experienced readers, allowing
easier reference and repetitions of specific, targeted information, all of which is laid out spatially
in front of them.
Spatial contiguity with adjuncts remains important with written-text media, and common
reading methods imply (but do not guarantee) temporal contiguity as-read. However, it is unclear
from Mayer and Sims’ study whether the difference in learning outcomes due to a combination
of spatial ability and presentation is wholly an interaction between visuospatial intelligence and
time. For instance, in the present example, would a more slowly-paced presentation allow
students in the study with more average levels of spatial ability to benefit from simultaneous
presentation? Whereas other studies suggest it would be important for intelligence or topical

DIFFERENTIAL GRAPHIC ORGANIZER COMPREHENSION 57
expertise in general (Harskamp et al., 2007), this has not yet been tested with regard to individual
visuospatial skill, specifically, in the presence of differing text adjuncts. Due to this uncertainty
and the potential relationship with the variable presence of GOs, empirical evidence thus far does
not directly determine a specific hypothesis for the effects of spatial ability on the benefits of
graphic organizers presented with a text in absence of time constraints. Specifically, when
processing time is allowed to vary for learning from texts with graphic adjuncts (as in typical
practice), eliminating a processing speed requirement inherent to challenging timed materials,
how does a reader's visuospatial skill interact with the presence of graphic organizers when
predicting learning outcomes?
Present Study
The present study extends previous research on multimedia learning by simultaneously
considering important participant-level factors within the otherwise experimental prediction
model of learning outcomes, including visuospatial abilities, prior knowledge, and reading time.
Additionally, the present study shall attempt to replicate and extend previous findings that the
addition of graphic organizers to text improves college students' performance on both recall and
transfer tasks relative to verbal-only adjuncts lacking such two-dimensional spatial information.
To this end, two different conditions are used: texts with verbal, text-redundant adjuncts
(repeating key relational information from the text in verbal outline form) serve as a comparison
group to the graphic organizer experimental condition, which presents primarily non-verbal, text-
redundant information (repeating key relational information from the text in visuospatial, GO
form). First, students will complete a questionnaire and pretests assessing self-reported and
objective prior topical knowledge before reading each of the expository psychological science
texts, in the form and order assigned at this stage. Each text presented will include graphic

DIFFERENTIAL GRAPHIC ORGANIZER COMPREHENSION 58
organizers or verbal adjuncts but not both. These are chosen such that across two text readings,
each participant reads one on each topic, where one comes with the benefit of graphic organizers
and the other contains the alternate benefit of a verbal organizer, the appropriate type of control
condition for the question at hand. Thus, there will be two experimental groups reflecting the two
possible combinations of text and graphic condition, but the principal research questions are
answered through within-subjects comparisons. Following all of the readings, participants will
complete a test of visuospatial skill followed by the two topical tests that will measure relative
knowledge and transfer outcomes from the readings in concert with the pretests.
Because processing time will no longer be an experimentally-imposed limiting factor for
learners, it is expected that students will benefit from the availability of GOs, regardless of
relative visuospatial ability. However, consistent with Mayer and Sims' findings (1994), an
interaction effect is also expected, where greater levels of visuospatial abilities will predict better
learning outcomes associated with graphic organizers relative to verbal adjuncts, beyond any
main effects of Gv on performance.
It is possible that no such interaction effect will be found, in either direction. As
previously mentioned, this is consistent with interpretations of prior literature that are not clearly
contraindicated thus far. If the expected main effects are found and power is sufficient, a null
result on the interaction may indicate that visuospatial skills do not necessarily contribute to
enhanced learning from graphic organizers relative to a material-appropriate verbal adjunct
(beyond any main effect of Gv). Thus, the mental representations manipulated within visual and
verbal channels may operate together on relational information even if the initial presentation
does not include a specific visuospatial form. However, a substantial reading time difference
(main effect) between conditions may be problematic for this interpretation, because the

DIFFERENTIAL GRAPHIC ORGANIZER COMPREHENSION 59
processing provoked by both materials is assumed to require similar investments of study time
for a given level of cognitive ability (individual) and a given learning outcome.
In the clear absence of a main effect of graphic organizers, the multimedia effect itself
could become theoretically problematic, at least in this context. At the same time, the material-
appropriate processing framework would remain a useful frame for interpretation given that the
material-appropriate verbal adjuncts, as controls, are similarly useful despite lacking the two-
dimensionality of graphic organizers. Another potential hypothesis this suggests would involve
investigating the nature of the content. Are the relatively abstract topics of psychology presented
in visuospatial form comparable to concrete topics presented this way? If not, this seemingly
unlikely outcome would call into question the cross-disciplinary generalizability of findings
regarding separate processing channels for verbal and nonverbal content. From an applied
perspective, this would diminish the usefulness of core CTML predictions in the context of a
science of learning in psychology, necessitating a closer look at the basic theory itself.

DIFFERENTIAL GRAPHIC ORGANIZER COMPREHENSION 60
CHAPTER THREE
Methods
Research Questions
Based on the prior literature, Mayer and Sims’ (1994) question, “For whom is a picture
worth a thousand words?” has been unanswered in the context of text-based materials.
Specifically, when undergraduate students read from textbooks, it is not known whether or how
an individual’s visuospatial skills affect any benefits attributable to the addition of graphic
organizers. To address this question in part, the present study made use of repeated measures,
allowing each participant to learn from both conditions on two different topics. Within this, the
main effects of text and topic, individual prior knowledge related to each, and individual overall
performance were accounted for. In particular, the present study addresses the following
principal research question: does the mixed interaction between individual visuospatial ability
and the presence of a graphic rather than verbal organizer meaningfully predict learning
performance? An observed, positive interaction between the presence of a graphic organizer
adjunct and level of visuospatial ability would indicate these skills moderate the benefit of a
graphic organizer (when compared to a verbal adjunct) in learning from a self-paced, static text,
in a way similar to what Mayer and Sims (1994) found with narrated animations. To be clear,
this is separate from the estimated main effect of visuospatial skill, which is expected to predict
higher scores in general due to its correlation with overall intelligence. Although the present
study uses self-paced materials not fully comparable to the prior work nearest in purpose (e.g.,
Mayer & Sims, 1994), resulting in greater uncertainty, this represents the best available
hypothesis prior to the observed results.

DIFFERENTIAL GRAPHIC ORGANIZER COMPREHENSION 61
An alternative interpretation of the theory suggests that predicting a negative interaction
effect is appropriate. In this interpretation, students with higher visuospatial skill (Gv) are
predicted to benefit less from graphic organizers because they already have an appropriate spatial
mental model created from the text alone. From a Cognitive Load Theory perspective, materials
meant to increase germane processing of intrinsic load would instead be redundant for that
individual and provoke extraneous cognitive load when studied (e.g., Sweller et al., 2011).
Another framing of this effect is to say that students with weaker visuospatial skill have a greater
need for such an adjunct. Without it, they fail to organize their mental model in spatial terms and
thus would benefit relatively little from processing in the non-verbal channel (e.g., Paivio, 1991;
Mayer, 2008). If this hypothesis is confirmed, it is also hypothesized there will be a positive
correlation between the presence of GOs and reading time. If so, this in turn may be moderated
by visuospatial skill. This pattern of results is predicted as a theoretical alternative to the primary
hypothesis. This is useful to test, because the effect of self-pacing on how visuospatial skills are
typically used when reading from texts is still unknown.
Answers to these research questions extend the present body of knowledge and may
suggest specific theoretical hypotheses concerning modifications to cognitive theories of
learning, which would be the topic of future research. Each could affect the models' prescribed
applications in the case of textbooks, the most common independent study materials in current
use.
Additionally, the present study attempted to replicate and extend prior findings on the
pragmatic benefits of graphic organizers, in a more applied sense. Unlike prior research (e.g.,
Kools et al., 2006; Robinson & Kiewra, 1995; Shaw et al., 2012), the present study controls for
individual variability in outcome measures using overall performance across texts as well as

DIFFERENTIAL GRAPHIC ORGANIZER COMPREHENSION 62
individual differences in visuospatial skill. This increases the statistical power of the analysis by
reducing the effects on learning outcomes due to nuisance variables. In particular, because of this
within-participants assessment of learning outcome differences between conditions, verbal skills’
effects on learning performance are meaningfully accounted for without a separate assessment.
This also enabled a more specific analysis of individual response patterns. Rather than simply
examining whether scores tended to be different, as in the previous between-subjects design,
such an analysis can determine whether individuals had more success in one condition than in
another based on visuospatial ability as well as the graphic condition in question. Further, the
present study used material particularly applicable for investigating learning at the college level
and is designed to be more ecologically valid in terms of the wide range of prior knowledge
about psychology. That is, expository texts in psychology courses are often used to reach a
population with variable prior knowledge, and this context was maintained in the present study.
Finally, the present study extends prior research by comparing graphic adjuncts with
verbal adjuncts containing similar relational information, both of which are informationally
redundant with the text. That is, the adjuncts are not strictly necessary for understanding but are
used as tools for organizing critical relational information, as is their common usage in
textbooks. This allowed for a better answer to the question of whether describing construct
relations verbally, through a salient adjunct, is as effective as spatially plotting those construct
relations in a graphic organizer adjunct. Importantly, this formed a more rigorous control group
in comparison to prior studies on graphic organizers, which often used no adjunct or a potentially
distracting image with no meaningful information. This way, any effects that would be
attributable to repeating ideas or drawing extra attention to relational information in the text are
present in all conditions, minimizing alternative interpretations of any observed benefits of

DIFFERENTIAL GRAPHIC ORGANIZER COMPREHENSION 63
graphic organizers. A process-centered answer to the broader, fundamental question of how such
spatial information is actually used in cognition and learning is beyond the scope of the current
study. However, the particular findings here will narrow down the research questions best suited
to addressing it. More directly, the presence or absence of visuospatial-skill-dependent effects
was investigated specifically to produce an important clue and potential factor for models
designed to predict learning outcomes.
Design
Between pretest and posttest administrations, each participant read each of two different
expository texts under each of two different image conditions. One condition inserted into the
text two contiguous graphic organizer adjuncts and the other inserted two equally-contiguous
verbal organizer adjuncts.
Ultimately, there were four possible experimental conditions, including the order of
presentation of the text-adjunct pairs. This was treated as two conditions, not counting order,
which was ultimately not a relevant factor in performance. These four assignment conditions
were counterbalanced and participants randomly assigned to them without replacement using the
Qualtrics random block presentation tool, keeping equal group counts. This way, error due to
potential nuisance variables, such as an order effect in reading, was spread evenly across
conditions to avoid systematic bias. Aside from the assignment to text conditions, all other
elements of the study were identical between participants.
Participants
The final sample of participants were recruited from the psychology participant pool at a
Midwestern university (n = 50) and the educational psychology participant pool at another
Midwestern university (n = 53) from the Spring 2017 semester to the Fall 2017 semester. An a

DIFFERENTIAL GRAPHIC ORGANIZER COMPREHENSION 64
priori power analysis predicted a required sample size of 34 to detect the principal interaction
effect at a hypothesized “moderate” effect size (as specified in Cohen’s guidelines; 1992),
assuming a .5 within-subjects correlation. Thus, the present sample is considered to have
adequate a priori power.
Participants were required to be at least 18 years old (mean age = 20.5 years, s = 4.75,
median age = 19 years), and most identified themselves as college students at the freshman (n =
37), sophomore (n = 36), junior (n = 17), or senior levels (n = 12), with one respondent selecting
“other.” For all participants, the present study was among several options offered for partial
course credit. All students in the sampling frame had access to alternative course requirements if
unwilling or not old enough to participate, and no further compensation was offered in this study.
Consistent with the populations from which the sample was drawn, a wide majority of
participants identified their race as White (n = 90, 87.4%), 4 identified as Multiracial, 3
identified as Black, 2 identified as Asian, 1 identified as American Indian or Alaska Native, and
3 identified as “Other.” The majority of participants were female (n = 78, 75.7%), with 25
identifying as male (24.3%).
Materials
Programs. The supporting program was the Qualtrics survey instrument. This software
administered a complete online consent process, collected all responses including reading time
for each text, and securely stored the data online. Students used their own computers to complete
the survey in their choice of environment. This approach situates students in more naturalistic
studying conditions. Primarily, SPSS 24 was used to manage and analyze data gathered.
Spatial Thinking Ability Test (STAT). To measure Gv, a digital version of the STAT
(Form A) was administered to all participants. The STAT was developed by Lee and Bednarz
DIFFERENTIAL GRAPHIC ORGANIZER COMPREHENSION 65
(2012) as a multiple-choice, objective test of spatial thinking skills based on problem-solving.
Items were developed to cover a range of specific skills, including comprehension of direction
and orientation in space, "comparing map information to graphic information” (i.e., translating
between an overhead spatial perspective and first-person spatial perspective; p. 18), visualization
in 3-D when limited to 2-D information, and combining spatial information from more than one
source. Functionally, these skills are depicted as particular to maps but are dependent on broader
cognitive skills, especially visuospatial skill (Gv). This specific test is of particular value in the
present study because it does not directly measure skill in using abstract graphic organizers,
which presupposes the conclusion, and because it directly measures the ability to use spatial
skills to comprehend and solve complex problems. For example, one item provides a street map
and turn by turn, cardinal directions, requiring examinees to determine the final location.
Another item provides an overhead map of a mountain with a marked location and direction of
view and respondents select the corresponding first-person view of the mountain from among
five options.
Individual items are set within geography-related topics, but the test does not measure
geography expertise. With a sample of 61 geography majors and 184 others, Lee and Bednarz
could not detect a mean difference between geography majors and others (2012). Although
Verma found that students who had taken more geography courses scored more highly on the
measure, they also found that seniors outscored freshmen (2015), which likely covaried. The
bivariate analyses used did not account for such factors, and no effect size estimates or
variability statistics aside from range were reported. Even so, the mean score difference between
students with zero geography classes and those with more than five was less than one item
among 16 (0.56).

DIFFERENTIAL GRAPHIC ORGANIZER COMPREHENSION 66
The STAT was developed using a general sample of students at 4 universities, a high
school, and a junior high school. The test's internal consistency reliability is acceptable based on
four university student samples (i.e., excluding junior high and high school), Cronbach's =
.721 (Lee & Bednarz, 2012). Although lower than what is typically used in individual
assessment, in this context such a level of internal consistency is appropriate given the breadth of
the concept of spatial thinking abilities and its use here as a unitary scale. Unlike some spatial
ability tests (e.g., unitary spatial rotation tasks), the STAT includes a wide range of spatial tasks.
Based on Lee and Bednarz' factor analysis, some items tap multiple previously-identified
visuospatial skills (2012), resulting in a more complex test of this intelligence.
Verbal-Visual Learning Style Rating (VVLSR). The VVLSR is a single-item, self-
report measure of preference for visual (i.e., primarily nonverbal, visuospatial materials) or
verbal materials developed by Mayer and Massa (2003; see Appendix E). Such measures have
been associated with the notion of learning styles in instructional design, which in that sense
have little evidence of importance in instructional practice (e.g., Willingham, Hughes, and
Dobolyi, 2015). Here, the VVLSR was used to efficiently detect potential motivation differences
between conditions. That is, those with a relative preference for visual materials may be more
highly motivated in the GO condition, which could account for some variance otherwise
attributable to GOs and better predict who benefits from them relative to the verbal adjuncts.
Given its present purpose, the single-item measure is more appropriate than longer scales. It also
retains construct validity based on a strong correlation with the Santa Barbara Learning Style
Questionnaire (r = .74; Mayer & Massa, 2003) but does not include content overlapping directly
with Gv, such as perceived skill with verbal and spatial materials.

DIFFERENTIAL GRAPHIC ORGANIZER COMPREHENSION 67
Measures of prior knowledge. Items regarding self-reported knowledge of the
information processing memory model and operant conditioning were developed and asked of
each participant prior to objective measures (e.g., “How well do you feel you understand the
learning process of operant conditioning, including reinforcement, extinction, and
generalization?” with 5-point Likert-type response options; see Appendix A). Specific concepts
within each topic were included in the items to cue participants to consider the scope of their
knowledge more carefully in their self-assessment. This was expected to diminish
inappropriately high ratings, because students with low knowledge who are vaguely familiar
with the subject are likely to fail to recognize one or more of the concepts. Placing self-report
prior to the objective test was to prevent perceived performance on it from factoring into the self-
report measure.
An 8-item multiple-choice scale was designed for each topic (see Appendix A), and both
were administered to all participants combined into a single form with randomized item order.
The item types and general difficulty were designed to match the posttest, even though the items
are not identical and not used in an equivalent pre-test post-test design. Instead, the knowledge
pretests serve as covariates in models of post-test performance outcomes. Identical pretests and
posttests were not used to prevent item-specific processing from being a sufficient study strategy
across content. This would introduce a confound in answering the principal research question in
cases where no group difference is found, because theoretically-expected differences are based
on learners' usage of relational processing tools in different forms, verbal or nonverbal.
After each text was written and edited, items on the pretest were designed to tap
information across the range of ideas represented in each text, with special focus on concepts
relevant to the relational information presented in the verbal and graphical adjunct materials (See

DIFFERENTIAL GRAPHIC ORGANIZER COMPREHENSION 68
Appendices B and C). Given a relevant piece of knowledge to assess, items were designed to
target a middling range of difficulty. In the present sample, items varied from moderate difficulty
(66% correct) to very high difficulty (8% correct on two items), averaging 33% correct
responses. Self-reported knowledge was not correlated with objective performance on the
operant conditioning pretest (Kendall’s tau-b = .05, p = .536) or the modal model pretest
(Kendall’s tau-b = -.001, p = .995). However, participants’ self-reported prior knowledge
estimates for the two topics were correlated with each other, Kendall’s tau-b = .534, p < .001.
Texts and adjuncts. The principal investigator wrote two brief psychological science
texts to serve as learning materials, The Modal Model of Memory and Operant Conditioning. The
content areas were selected as examples of moderately challenging topics in psychological
science with minimal prerequisite scientific knowledge. These lent well to objective outcome
measures, are well-evidenced as theories, and are at similar levels of abstraction. Both topics, as
presented, were amenable to organizing adjuncts. Importantly, it was decided to use these
common topics rather than obscure ones. This provided two distinct advantages in this context.
First, it allowed for a wider, more typical range of prior knowledge to be represented in the
sample. Second, both of these topics are examples of common conceptual challenges for students
in introductory psychology classes. Their use here lends additional ecological validity to the
application of present findings to the teaching of psychology. The author wrote these texts rather
than using existing ones in order to limit the expected duration of participation time and control
the breadth and depth of the content. One way these likely differ from typical college-level texts
is their density. That is, the topic and its elements at this level of depth are presented in fewer
words. This decreased the word count and the likely reading time investment substantially.

DIFFERENTIAL GRAPHIC ORGANIZER COMPREHENSION 69
After initial drafts to cover the breadth and depth of each topic’s content at the
introductory level, the texts were revised to make them more comparable in length and
complexity without compromising the coverage of main ideas. First, they were shown to an
educational psychologist and a graduate assistant in educational psychology, who evaluated them
for clarity, content coverage, and readability. Following feedback, several changes were made. A
brief segment distinguishing between retroactive and proactive interference was removed from
The Modal Model of Memory because the topic relies heavily on item-specific processing at this
level (i.e., memorizing definitions) and is not necessary for addressing the superordinate
construct. Brief segments contrasting classical conditioning, explaining behaviorism, and
outlining pragmatic limitations of punishment were removed from Operant Conditioning to
minimize differences in complexity between the two texts without removing essential material.
Minor edits were made to reduce confusing verbal statements and minimize the challenge of
reading them without increasing the length of the texts with extra exposition or examples.
Finally, additional explanation was added to the topic of attention in The Modal Model of
Memory to make its coverage more complete and comparable between topics. The final version
(see Appendix B) of The Modal Model of Memory was 1071 words, had a Flesch-Kincaid grade
level of 11.4 and reading ease level of 50, and was written with 17.9 words per sentence on
average. Operant Conditioning was 1090 words, had a Flesch-Kincaid grade level of 11.2 and
reading ease level of 49, and was written with 17.9 words per sentence on average. Although not
identical, the texts are similar in complexity and appear to be roughly equally difficult to read
(see Table 1). Following additional review by experts of the content, no further revisions were
suggested. Because student learning outcomes were assessed relative to each other rather than in

DIFFERENTIAL GRAPHIC ORGANIZER COMPREHENSION 70
absolute terms, any unmeasured differences in understandability were considered minor
limitations given sufficient room for variance on both knowledge post-tests.
Table 1.
Descriptive comparisons of the text passages.
Statistic
Modal
Model
Operant
Conditioning
Flesch-Kincaid Grade Level 11.4 11.2
Flesch-Kincaid Reading Ease 50 49
Words 1071 1090
Words per sentence 17.9 17.9
The four graphic organizers and four verbal adjuncts, two of each per text, were
developed to be inserted interchangeably within each text. For each base text, the corresponding
graphic organizers and verbal adjuncts took up the same visual space and were placed in line at
the same points. This was intended to ensure the appropriate positioning to maintain spatial
contiguity given the relational content in the adjuncts (e.g., Mayer, 2008). That is, all adjuncts
were provided at the moment when they are most likely to be useful based on current best
practices. All adjuncts matched the material in the written text, bringing related concepts
together to emphasize specific relational details in an organized form (see Appendix C). None
were intended to provide entirely unique information apart from the text. Participants could
plausibly answer all post-test questions correctly based on the text alone. This design element
was intended to better match the theoretical intent of adjuncts as tools for processing the text and
best reflected common practice in adjunct design. In the terms of Cognitive Load Theory, all
adjuncts add germane load when used but do not impact the intrinsic load of the learning
situation.

DIFFERENTIAL GRAPHIC ORGANIZER COMPREHENSION 71
In keeping with the Material-Appropriate Processing framework (McDaniel, Einstein, &
Waddill, 1990), all adjuncts were designed specifically to promote voluntary relational
processing of information presented in the expository texts, as opposed to item-specific
processing about individual elements explained in the text (e.g., McDaniel & Einstein, 1989).
This would be expected to increase complementary processing (i.e., relational processing added
to the item-specific processing provoked by each idea in the text) and therefore improve learning
outcomes regardless of format (e.g., McDaniel, Einstein, Dunay & Cobb, 1986; McDaniel &
Einstein, 1989). To make the two conditions as information-equivalent as possible, the verbal
adjuncts specify the relational information implied graphically in the graphic organizer adjunct.
The sole substantive manipulation used in the present experiment was the assignment of adjuncts
to the two texts viewed by each participant (MM and OC); for each individual, one text was
assigned the graphic organizer adjuncts and one was assigned the verbal organizers. Because
both adjuncts were designed to provoke relational processing of similar concepts, the particular
relational information presented in each is minimized in its importance to outcomes. Within the
MAP framework, two adjuncts that similarly provoke relational processing would be expected to
result in similar complementary processing of the information in the texts, as a whole. This
would predict similar outcomes between conditions, all else equal. Thus, any differences in
efficacy due to the graphic versus verbal adjunct conditions are more closely attributable to the
differing representations of the information, not the information itself or their relational,
organizational purposes within the text.
Knowledge posttests. Each of the texts corresponded to 10 multiple-choice items
designed for this study (see Appendix D). For each, 5 items required content recall and 5 items
required application of concepts. Like the pretest, items on the posttest were designed to tap

DIFFERENTIAL GRAPHIC ORGANIZER COMPREHENSION 72
information across the range of ideas represented in each text, with some focus on the relational
ideas represented in the adjuncts. Irrespective of assignment condition, all participants completed
all items following a delay created by the administration of the STAT between the readings and
the posttest. All items were presented in one form, in randomized order, mixing both content
areas. Given a relevant piece of knowledge to assess, items were designed to target a middling
range of difficulty. In the present sample, items varied from low difficulty (82% correct) to very
high difficulty (11% correct), averaging 47% correct responses. Reliability estimates were very
low for the OC text, Guttman's λ-2 = .362, Cronbach’s = .311. Likewise, reliability estimates
were low for the MM text, Guttman's λ-2 = .563, Cronbach’s = .543.
Procedure
Upon signing up for the study through their respective institutional media and clicking on
the Qualtrics link sent to them in response, participants were asked to read the consent form. This
form described the basic topic area of the study, the time commitment estimate, the minimal
risks of participation, and a summary of their rights as participants. Upon selecting that they
agreed, they were directed to general instructions, which included a request to complete the study
in one sitting. To minimize the risks of participation and avoid the potential for coercion by
participants' instructors, no identifying information was associated with the study data to
preserve the anonymity of participants.
Each participant was randomly assigned a sequence from the counterbalanced options
generated in Qualtrics, and each completed materials in the corresponding order. Because the
software assigned conditions evenly (i.e., without replacement), the order in which participants
began the study technically affected which conditions were available to be assigned to them.
This means individuals signing up at about the same times were marginally less likely to be

DIFFERENTIAL GRAPHIC ORGANIZER COMPREHENSION 73
assigned the same exact order and condition combination. This deviation from true random
assignment was deemed unlikely to be a threat to validity.
Following the instructions, all participants completed a brief questionnaire, including
demographics, followed by items asking for a self-appraisal of level of knowledge for the modal
model and operant conditioning topics. These were followed by the content pretests. Instructions
then specified that they were to read each text once, for comprehension, and each participant was
presented with the assigned text-adjunct pairs one at a time, in the order and arrangement
determined by their experimental assignment. For each, participants were prompted to indicate
they were ready to read it in one sitting. The first assigned text was displayed on a single page.
Display time was logged discreetly, and participants explicitly indicated whether they completed
the reading in its entirety or not. After participants moved on from the first assigned text-adjunct
pair, the instructions were repeated for the second text along with a comparable readiness
prompt.
Each participant then completed a digital version of the STAT to measure visuospatial
skills. This also served as a natural delay that ensured any knowledge demonstrated on the
posttest was relatively durable. This was immediately followed by the learning posttests. Last, a
brief questionnaire was administered. This assessed a variety of individual characteristics asking
about general participant learning preferences, including the VVLSR item as well as subjective
experiences regarding each specific text and adjunct viewed by that individual. Question text was
set to vary depending on the adjunct presented with each text for that participant. Thus,
participants received items referencing elements from their particular assignment.
The constructs at this stage were the individual's relative knowledge performance (as a z-
score), pretests and posttests, on each scale (transfer, recall, and total) for each topic (MM and

DIFFERENTIAL GRAPHIC ORGANIZER COMPREHENSION 74
OC). The purpose of the pretest measures was to allow a measure better approximating learning
based on multiple measures of knowledge. Absolute quantity of learning attributable to the
readings is not important here, which makes it possible to define an outcome variable as the
change in relative performance (i.e., zpost - zpre for each scale on each topic). However, it is
possible that prior knowledge affects learning outcomes between pre- and posttests by reducing
intrinsic load (e.g., Moreno & Park, 2010). If so, such an effect should be estimated and not
merely subsumed in the definition of outcomes. Pursuant to this, relative pretest performance
was estimated as a covariate.
The overarching predictive model operated on the observations from each posttest
outcome variable (MM and OC) within participants. Variables were at the level of observations
(e.g., graphic condition), at the level of the learners (e.g., visuospatial skill), and interaction
terms between. The outcome variables included relative knowledge posttest, relative transfer
posttest, and relative recall posttest, each of which required a separate statistical model. This
treatment combines the two texts' measures (OC and MM) across instances. The combined
variables refer to the same relative knowledge construct in their respective contexts, and each
participant included in the principal analyses had exactly one calculated score for each. Thus, for
each observation, performance is predicted based on the variables relevant to the present
hypotheses. By definition, all pairs (e.g., MM pretest and OC pretest) have equal means and
equal standard deviations, which allows their comparison given the similar distributions
established earlier. This guarantees a main effect of about 0 in the population, if it were
estimated.
Each of the combined posttest variables (i.e., overall, recall, and transfer) was predicted
based on a total model of other factors, each of which was tested for a significant relationship

DIFFERENTIAL GRAPHIC ORGANIZER COMPREHENSION 75
and estimated. Each relative knowledge posttest's prediction model included the corresponding
relative knowledge pretest, and each participant’s general level of skills and abilities was
included in both conditions. Importantly, these account for a meaningful portion of the random
variance between subjects on the posttests, improving the power in the remainder of the analysis
to detect differences in learning outcomes between conditions.
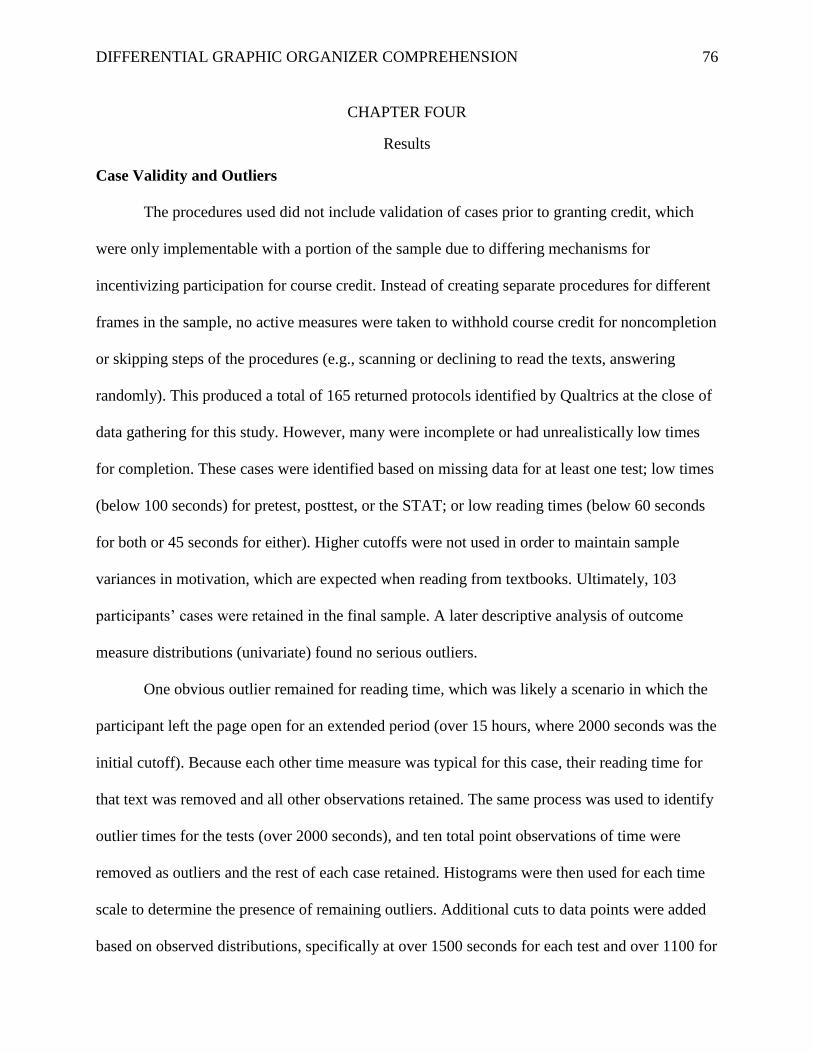
DIFFERENTIAL GRAPHIC ORGANIZER COMPREHENSION 76
CHAPTER FOUR
Results
Case Validity and Outliers
The procedures used did not include validation of cases prior to granting credit, which
were only implementable with a portion of the sample due to differing mechanisms for
incentivizing participation for course credit. Instead of creating separate procedures for different
frames in the sample, no active measures were taken to withhold course credit for noncompletion
or skipping steps of the procedures (e.g., scanning or declining to read the texts, answering
randomly). This produced a total of 165 returned protocols identified by Qualtrics at the close of
data gathering for this study. However, many were incomplete or had unrealistically low times
for completion. These cases were identified based on missing data for at least one test; low times
(below 100 seconds) for pretest, posttest, or the STAT; or low reading times (below 60 seconds
for both or 45 seconds for either). Higher cutoffs were not used in order to maintain sample
variances in motivation, which are expected when reading from textbooks. Ultimately, 103
participants’ cases were retained in the final sample. A later descriptive analysis of outcome
measure distributions (univariate) found no serious outliers.
One obvious outlier remained for reading time, which was likely a scenario in which the
participant left the page open for an extended period (over 15 hours, where 2000 seconds was the
initial cutoff). Because each other time measure was typical for this case, their reading time for
that text was removed and all other observations retained. The same process was used to identify
outlier times for the tests (over 2000 seconds), and ten total point observations of time were
removed as outliers and the rest of each case retained. Histograms were then used for each time
scale to determine the presence of remaining outliers. Additional cuts to data points were added
based on observed distributions, specifically at over 1500 seconds for each test and over 1100 for

DIFFERENTIAL GRAPHIC ORGANIZER COMPREHENSION 77
each reading. Time measures were passively and discretely taken in the background in Qualtrics,
and participants were free to step away from the computers, so the purpose of this stage of outlier
identification was to improve the validity of reading time measure. In contrast with low times,
outliers on the high end were not considered evidence of general response invalidity.
Properties of Scales
Based on a series of histograms, the distributions of scores across scales did not
demonstrate characteristics that rule out a roughly normal population distribution of scores for
parametric procedures. The exception was that minor restriction of range occurred for some
scales of the pretests due to their difficulty and smaller number of items, producing positive
skewness. This was estimated at 0.753, 0.188, 0.298, and 0.470 for the MM recall, MM transfer,
OC recall, and OC transfer subscales with a standard error of .238 and no correction for
familywise error in significance tests (chosen as a conservative approach, critical ratio = 1.96).
Observed skewness was also present in the pretest overall scales (.380 and .469 for the MM and
OC scales, respectively), as would be expected among students with little prior knowledge.
However, no estimate of skewness or excess kurtosis exceeded +/- 1, and no estimate among
posttests and the STAT reached statistically significant deviation from normality. Therefore, the
assumption of approximate normality was retained for all outcome measures. That is, they were
considered sufficiently normally distributed to pose no validity problem when used in parametric
hypothesis tests. Outcome measures were calculated from raw scores according to the procedures
listed in the previous chapter.
Post-hoc analysis revealed some unexpected properties of the STAT as a total measure,
and it was discovered that the response options for the last three items were not correctly
displayed in the online protocol. Thus, those three items were excluded for all analyses. The
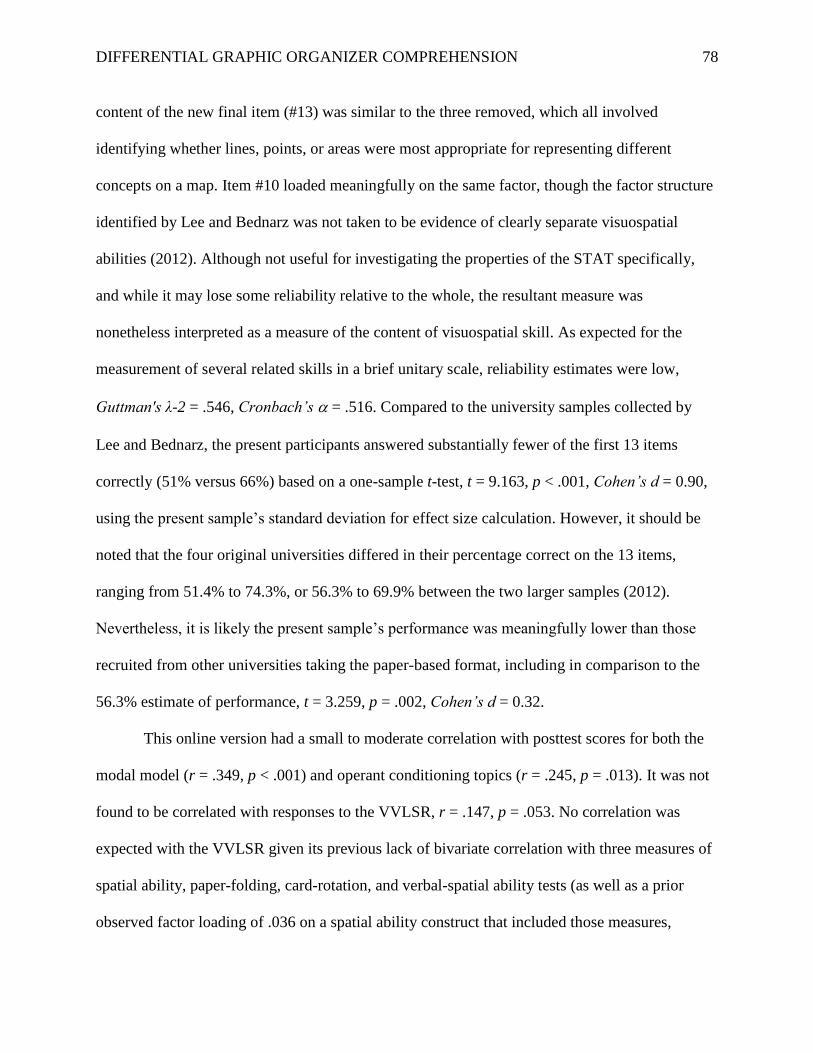
DIFFERENTIAL GRAPHIC ORGANIZER COMPREHENSION 78
content of the new final item (#13) was similar to the three removed, which all involved
identifying whether lines, points, or areas were most appropriate for representing different
concepts on a map. Item #10 loaded meaningfully on the same factor, though the factor structure
identified by Lee and Bednarz was not taken to be evidence of clearly separate visuospatial
abilities (2012). Although not useful for investigating the properties of the STAT specifically,
and while it may lose some reliability relative to the whole, the resultant measure was
nonetheless interpreted as a measure of the content of visuospatial skill. As expected for the
measurement of several related skills in a brief unitary scale, reliability estimates were low,
Guttman's λ-2 = .546, Cronbach’s = .516. Compared to the university samples collected by
Lee and Bednarz, the present participants answered substantially fewer of the first 13 items
correctly (51% versus 66%) based on a one-sample t-test, t = 9.163, p < .001, Cohen’s d = 0.90,
using the present sample’s standard deviation for effect size calculation. However, it should be
noted that the four original universities differed in their percentage correct on the 13 items,
ranging from 51.4% to 74.3%, or 56.3% to 69.9% between the two larger samples (2012).
Nevertheless, it is likely the present sample’s performance was meaningfully lower than those
recruited from other universities taking the paper-based format, including in comparison to the
56.3% estimate of performance, t = 3.259, p = .002, Cohen’s d = 0.32.
This online version had a small to moderate correlation with posttest scores for both the
modal model (r = .349, p < .001) and operant conditioning topics (r = .245, p = .013). It was not
found to be correlated with responses to the VVLSR, r = .147, p = .053. No correlation was
expected with the VVLSR given its previous lack of bivariate correlation with three measures of
spatial ability, paper-folding, card-rotation, and verbal-spatial ability tests (as well as a prior
observed factor loading of .036 on a spatial ability construct that included those measures,

DIFFERENTIAL GRAPHIC ORGANIZER COMPREHENSION 79
following varimax rotation; Mayer & Massa, 2003). One potential validity indicator as well as
limitation for this scale was that male participants outperformed female participants by 0.50
standard deviations, p = .030, 95% CI = 0.05 – 0.94. The sample size for male students was
small (n = 25 versus 78 for female), and this interval estimate includes effect sizes that are
typical in spatial skill gender differences on other measures.
Gender was investigated post hoc to explore this correlation in particular. No difference
in reported textual interest was detected between genders (for the MM and OC texts; Kendall’s
tau-b = .007, .028; p = .938, .759, respectively). Likewise, no difference was found between
male and female participants on the VVLSR, Kendall’s tau-b = .031, p = .729. Note that
Kendall’s tau-b was used to produce measures of association due to the ordinal, non-normal
nature of the VVLSR and interest variables, with gender dummy-coded. Further exploratory
analyses were conducted to rule out other interpretations. Importantly, sampling frames (two
university pools) differed by gender distribution, where male students represented 34% (17 of
50) of one sample and only 15% of the other (8 of 53), X2 = 5.00, p = .025, Phi = .22. The latter
sample, however, did not score lower on the 13-item STAT, with a mean z-difference score of
0.05, p = .799. The two sampling frames had substantially different compositions in terms of
gender as well as academic level, which must also be considered. The university sample with
fewer male participants had substantially more sophomores and seniors and fewer freshmen than
the other, X2 = 18.23, p < .001, Cramer’s V = .423. This reflects the differing distributions of
students served by a psychology program, largely students taking an introductory psychology
course, and an educational psychology program. Thus, to determine the source of the differences
in STAT performance, a univariate general linear model was computed predicting STAT
performance using both academic level and gender. Both were meaningful predictors. Male

DIFFERENTIAL GRAPHIC ORGANIZER COMPREHENSION 80
students outperformed female students on the STAT (z-score estimated marginal mean difference
= 0.439), F = 10.252, p = .002, within a model that included academic level, F = 36.92, p = .007.
An interaction effect was not detected, F = .049, p = .985. This is in agreement with Verma
(2015), who also found the connection between class level and the STAT. Although the gender
difference was clear and observed as larger than was expected, a smaller correlation
representative of previous literature on measurement of visuospatial skills cannot be ruled out.
Because such demographic details were not previously reported, it is unclear whether differences
in proportions of gender, academic level, or other factors caused the observed performance
differences on the STAT among university samples.
Hypothesis Tests
Linear mixed models including relevant covariates were used to test the principal
hypotheses. Separate models predicted overall test performance and performance on the recall
and transfer subtests. Specifically, each model tested the potential effect of graphic condition
(graphic versus verbal organizers), the effect of visuospatial skill as measured by the STAT
items, and the interaction between the two. Each model also estimated relevant covariates. These
included participant gender and academic level, the corresponding content pretest score, and time
taken to read the corresponding text. It was expected that the graphic condition would improve
posttest scores as predicted in these models. It was also expected that performance on the STAT
items would be correlated with posttest scores due to the connection between visuospatial skill
and overall intelligence. Finally, it was hypothesized that visuospatial skill as measured by the
STAT would moderate the effect of the adjunct condition on performance. That is, higher
visuospatial skill would predict increased scores in the graphic condition relative to the verbal
condition for an individual. Descriptive statistics are summarized in Table 2.

DIFFERENTIAL GRAPHIC ORGANIZER COMPREHENSION 81
The primary dependent variable was the relative performance on the knowledge posttests
on each topic, which were all converted to z-scores. This overall performance was broken down
into two components, transfer and recall, which were also used as dependent variables in similar
analyses. Next, reading time was predicted as a dependent variable in a separate model.
Table 2.
Task completion times and mean responses correct on performance measures.
Variable Mean SD
Completion times in seconds
Pretests 394.2 196.8
MM Text 314.9 220.4
OC Text 315.8 244.1
STAT 655.5 247.0
Posttests 423.2 206.7
Items correctly answered
Pretests
MM Pretest (8 items) 2.65 1.38
MM Recall (4 items) 0.95 0.90
MM Transfer (4 items) 1.70 0.93
OC Pretest (8 items) 2.56 1.71
OC Recall (4 items) 1.30 1.01
OC Transfer (4 items) 1.26 1.00
Posttests
MM Posttest (10 items) 5.01 2.10
MM Recall (5 items) 2.63 1.22
MM Transfer (5 items) 2.38 1.27
OC Posttest (10 items) 4.37 1.70
OC Recall (5 items) 2.15 1.20
OC Transfer (5 items) 2.22 1.05
STAT (13 items) 6.60 2.23

DIFFERENTIAL GRAPHIC ORGANIZER COMPREHENSION 82
Descriptive statistics for the STAT, performance subtests, and completion times are summarized
in Table 2. Finally, due to the observed difference in reliability coefficients between posttests, a
univariate general linear model was computed to predict performance on the MM posttest. This
is interpreted as a post hoc check of the findings from the principal analysis when the OC
posttest is not considered.
Following the removal of reading time outliers as described above (after which, n = 96)
and a counterbalanced order of presentation for the two readings, an order effect was detected.
Specifically, reading time for the second text presented to students was shorter than for the first
presented to each student based on a paired samples t-test (MD = -103.2, sD = 207.9, r = .583, t =
4.863, p < .001). While this may indicate decreased processing time, it may also reflect
familiarity with the procedure. Order was unrelated to performance on the corresponding
posttests (r = .343, t = 0.346, p = .730). This was unsurprising given the delay produced by the
STAT administration between the readings and the posttests. This was confirmed in a larger
model post hoc, but a priori models predicting learning outcomes did not estimate an order of
text presentation term.
Overall posttest performance. A linear mixed model was used to test for effects on
learning related to the graphic organizer condition, visuospatial skill, the interaction between
condition and visuospatial skill, gender, academic level, pretest performance, an interaction
between pretest performance and graphic condition, and reading time. Assumptions for this
statistical model were verified. Residuals were approximately normally distributed based on a
quantile-quantile plot (see Appendix F). Residuals also appeared roughly normally distributed
and equivalent between conditions based on histograms of residuals paneled by both
experimental condition and topic (i.e., MM or OC). Based on a scatterplot of residuals across

DIFFERENTIAL GRAPHIC ORGANIZER COMPREHENSION 83
model predicted values, no clear pattern of heteroskedasticity emerged. No patterns in the
distribution of residuals were visible in a scatterplot of residuals across visuospatial skill,
including when split by graphic condition. Results are summarized in Table 3. Effect sizes are
reported in terms of a predicted z-score change of 1 in the posttest score for each unit of change
in the predictor variable. The units for the pretest and STAT were z-scores. Gender and graphic
condition were dummy-coded. The unit for academic level was a change of one category (e.g.,
sophomore to junior). Reading time was measured as a ratio variable in seconds.
No effect of graphic condition on overall relative (z-score) posttest performance was
detected, t = 1.048, p = .296, with an estimated fixed effect for the graphic condition relative to
the verbal of -0.134 (95% CI = -0.387 to 0.119). It can be inferred that the highest not-unlikely
positive effect of graphic organizers (i.e., the maximum in the 95% confidence interval) is small
under these conditions (0.119). However, this estimate is subject to significant attenuation due to
the low reliability of the measures (Schmidt & Hunter, 1996). To minimize bias for the sake of
inference, this figure was disattenuated based on the reliability estimates for the posttest. The
lower observed Cronbach’s for the posttests (i.e., for the OC topic) was chosen as a
straightforward estimate of reliability, and the assignment of conditions was treated as reliable
for the sake of investigating the present case. These procedures result in a conservative effect
size ceiling of 0.214 standard deviations on posttest performance, which would be considered
small in size. In this sense, the observed result was reliably lower than hypothesized, even
though the estimate in itself was too imprecise to confirm an effect.

DIFFERENTIAL GRAPHIC ORGANIZER COMPREHENSION 84
Performance on the STAT items was a positive predictor in the model, t = 2.133, p =
.034, with an estimated effect of a 0.197 z-score increase for each 1 z-score increase on the
STAT items. No interaction with graphic condition was detected along with this main effect, t =
0.900, p = .369, 95% CI = -0.140 to 0.374. In this overall model, gender was not a significant
predictor of performance, t = 1.335, p = .183, but reported academic level was a significant
covariate, t = 2.200, p = .029 (ES = 0.141 per additional academic level, 95% CI = 0.015, 0.268).
Total z-score on the (corresponding) pretest was an important predictor of performance, t =
3.953, p < .001, with an estimated effect of 0.376. No significant interaction was found between
the pretest and graphic condition, t = 1.339, p = .182. Finally, reading time was a meaningful
predictor of performance, t = 3.288, p = .001, with an observed 0.055 z-score increase per minute
Table 3.
Hypothesis tests and effect size estimates for terms predicting overall knowledge performance.
___________________________________________________________________________
Term in Model t p ES point estimate 95%CI of ES
___________________________________________________________________________
Graphic (condition) 1.048 .296 0.134 -0.119, 0.387
STAT 2.133 .034 0.197* 0.015, 0.380
Graphic * STAT 0.900 .369 0.117 -0.140, 0.374
Pretest 3.953 <.001 0.376* 0.188, 0.563
Pretest * Graphic 1.339 .182 -0.176 -0.435, 0.083
Gender 1.335 .183 0.204 -0.097, 0.505
Academic level 2.200 .029 0.141* 0.015, 0.268
Reading time (seconds) 3.288 .001 0.0009* 0.0004, 0.0015
___________________________________________________________________________
Note. ES = effect size, in measured units. The * symbol indicates statistical significance for an estimate. Reading time is here expressed in seconds but was converted to minutes within the body of this manuscript.

DIFFERENTIAL GRAPHIC ORGANIZER COMPREHENSION 85
of reading time for the corresponding text. Estimated marginal means (EMMs) are listed in Table
4.
Table 4.
Estimated marginal means from the full linear mixed model predicting posttest performance.
Mean Standard Error
Condition = Verbal 0.061 0.091
Condition = Graphic -0.071 0.090
Gender = Female 0.045 0.074
Gender = Male -0.159 0.133
Academic = Freshman -0.156 0.094
Academic = Sophomore -0.015 0.064
Academic = Junior 0.127 0.088
Academic = Senior 0.268 0.140 Note: Each EMM was computed with adjustments based on all other terms in the model. Only Academic Level involved a
statistically significant group difference.
Recall and transfer posttest performance. Related linear mixed models were computed
to test the same hypotheses for the two subtest outcome measures, recall and transfer.
Specifically, the goal was to look for any differences in patterns of results that may be due to the
differing cognitive demands required for each task. The recall task was conceptually similar to
recognition tasks in that participants were asked to recall the correct associated details in the
presence of both item- and response-related cues. Because they can be answered better from
item-specific content alone, they are less dependent on the relational information included in the
organizers. Therefore, it was expected that graphic condition and its interaction with visuospatial
skill would be stronger predictors of transfer performance than when used to predict recall
performance.
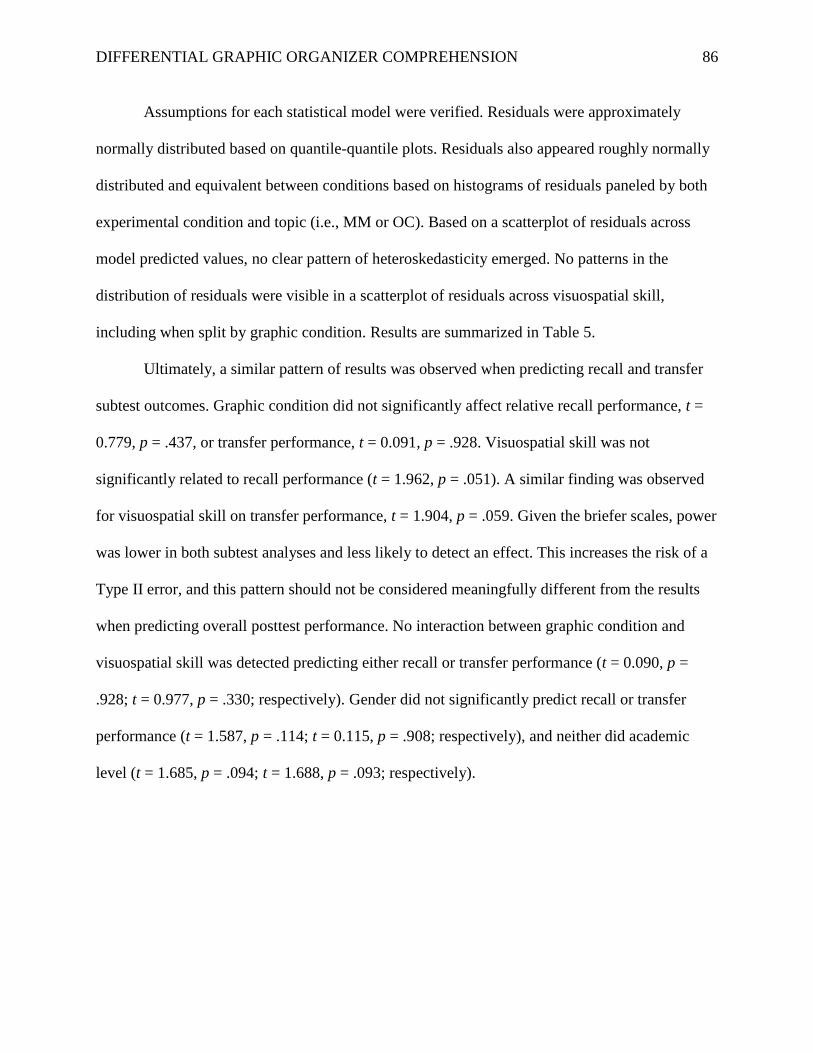
DIFFERENTIAL GRAPHIC ORGANIZER COMPREHENSION 86
Assumptions for each statistical model were verified. Residuals were approximately
normally distributed based on quantile-quantile plots. Residuals also appeared roughly normally
distributed and equivalent between conditions based on histograms of residuals paneled by both
experimental condition and topic (i.e., MM or OC). Based on a scatterplot of residuals across
model predicted values, no clear pattern of heteroskedasticity emerged. No patterns in the
distribution of residuals were visible in a scatterplot of residuals across visuospatial skill,
including when split by graphic condition. Results are summarized in Table 5.
Ultimately, a similar pattern of results was observed when predicting recall and transfer
subtest outcomes. Graphic condition did not significantly affect relative recall performance, t =
0.779, p = .437, or transfer performance, t = 0.091, p = .928. Visuospatial skill was not
significantly related to recall performance (t = 1.962, p = .051). A similar finding was observed
for visuospatial skill on transfer performance, t = 1.904, p = .059. Given the briefer scales, power
was lower in both subtest analyses and less likely to detect an effect. This increases the risk of a
Type II error, and this pattern should not be considered meaningfully different from the results
when predicting overall posttest performance. No interaction between graphic condition and
visuospatial skill was detected predicting either recall or transfer performance (t = 0.090, p =
.928; t = 0.977, p = .330; respectively). Gender did not significantly predict recall or transfer
performance (t = 1.587, p = .114; t = 0.115, p = .908; respectively), and neither did academic
level (t = 1.685, p = .094; t = 1.688, p = .093; respectively).

DIFFERENTIAL GRAPHIC ORGANIZER COMPREHENSION 87
As with the overall performance outcomes presented above, recall and transfer
performance on the pretests were expected to predict eventual performance on the matching
recall or transfer posttests. Recall performance on the pretest predicted recall performance on the
posttest, t = 2.970, p = .003, estimated effect = 0.289, 95% CI = 0.097 to 0.481. However,
Table 5.
Hypothesis tests and effect size estimates for terms predicting recall and transfer outcomes in
separate models.
___________________________________________________________________________
Model
Term in Model t p ES point estimate 95%CI of ES
___________________________________________________________________________
Recall Outcome Predictors
Graphic (condition) 0.779 .437 0.100 -0.153, 0.353
STAT 1.947 .053 0.186 -0.002, 0.374
Graphic * STAT 0.090 .928 0.119 -0.245, 0.269
Pretest 2.970 .003 0.289* 0.097, 0.481
Pretest * Graphic 0.911 .364 0.119 -0.138, 0.376
Gender 1.587 .114 0.245 -0.060, 0.549
Academic level 1.685 .094 0.109 -0.019, 0.238
Reading time (seconds) 3.017 .003 0.0008* 0.0003, 0.0014
Transfer Outcome Predictors
Graphic (condition) 0.144 .886 0.020 -0.251, 0.291
STAT 1.904 .059 0.187 -0.007, 0.382
Graphic * STAT 0.977 .330 0.137 -0.140, 0.414
Pretest 1.644 .102 0.160 -0.032, 0.353
Pretest * Graphic 1.148 .253 -0.161 -0.439, 0.116
Gender 0.115 .908 0.019 -0.301, 0.339
Academic level 1.688 .093 0.116 -0.020, 0.252
Reading time (seconds) 2.317 .022 0.0007* 0.0001, 0.0013
___________________________________________________________________________
Note. ES = effect size, in measured units. The * symbol indicates statistical significance for an estimate. Reading time is here expressed in seconds but was converted to minutes within the body of this manuscript.

DIFFERENTIAL GRAPHIC ORGANIZER COMPREHENSION 88
transfer pretest performance was not a statistically significant predictor for transfer performance
on the posttest (t = 1.644, p = .102, estimated effect = 0.160, 95% CI = -0.032 to 0.353). No
significant interaction between pretest and graphic condition was detected predicting either recall
or transfer outcomes (t = 0.911, p = .364; t = 1.148, p = .253; respectively).
As in the overall model, performance on recall subtests was predicted by the time spent
reading the corresponding text, t = 3.017, p = .003, estimated effect = 0.048 z-score increase per
minute of reading time. Likewise, reading time was predictive of performance on the transfer
task (t = 2.317, p = .022, estimated effect = 0.042 z-score increase per minute of reading time).
Table 6.
EMMs from linear mixed models predicting recall and transfer posttest performance.
Mean Standard Error
Recall
Condition = Verbal 0.052 0.090
Condition = Graphic -0.051 0.091
Gender = Female 0.060 0.074
Gender = Male -0.185 0.133
Academic = Freshman -0.117 0.094
Academic = Sophomore -0.008 0.064
Academic = Junior 0.102 0.088
Academic = Senior 0.211 0.141
Transfer
Condition = Verbal 0.010 0.098
Condition = Graphic -0.009 0.096
Gender = Female 0.005 0.079
Gender = Male -0.014 0.141
Academic = Freshman -0.124 0.100
Academic = Sophomore -0.008 0.069
Academic = Junior 0.108 0.094
Academic = Senior 0.224 0.149
Note: Each EMM was computed with adjustments based on all other terms in the model. No means are
significantly different.

DIFFERENTIAL GRAPHIC ORGANIZER COMPREHENSION 89
Estimated marginal means for recall and transfer performance are listed in Table 6. Note that
none of these terms were statistically significant.
Reading time. It was initially hypothesized that reading time would differ between
conditions if there were a negative interaction effect between visuospatial skill and graphic
condition. This was not observed, as indicated above. Nevertheless, to identify potential
predictors of how long it takes participants to read text passages, a post hoc linear mixed model
was analyzed. This included several factors: graphic condition, text passage (MM or OC),
graphic condition by text, gender, academic level, visuospatial skill, overall pretest performance,
order, order by text, and order by graphic condition. Results were summarized in Table 7. The
same units were used for effect sizes as in the principal analysis, with the addition of order as a
dummy-coded variable.
Table 7.
Hypothesis tests for terms predicting reading time for text passages.
Term t p Estimate
Graphic condition 1.346 .181 74.2
Text 1.221 .224 74.1
Text * Graphic condition 0.045 .964 3.0
Order 2.168 .032 -116.2*
Order * Graphic condition 2.682 .008 -177.2*
Order * Text 1.936 .054 130.3
Gender 0.426 .670 16.9
Academic level 2.268 .025 -37.3*
STAT 1.046 .297 17.6
Pretest 0.699 .486 11.6

DIFFERENTIAL GRAPHIC ORGANIZER COMPREHENSION 90
No effects related to graphic condition, text passage, or graphic condition by text were
detected. Individual characteristics including gender, visuospatial skill, and pretest performance
were not significant. However, higher academic levels predicted lower reading times for each
text by about 37 seconds per increase in academic level, t = 2.268, p = .025.
As described earlier, order was a significant factor in reading time. Within this model, the
presentation of a text second was associated with a 116 second decrease in reading time, t =
2.168, p = .032. An interaction effect between graphic condition and order was also detected, t =
2.682, p = .008. The graphic condition, when presented first, was associated with an additional
177 second increase in reading time. For comparison, the estimate for the main effect of graphic
condition was 74 additional seconds (not significant). The estimate for an interaction effect
between order and text was not statistically significant, t = 1.936, p = .054, estimate = 130
seconds.
Estimated marginal means (Table 8) were computed and evaluated to interpret the
interaction terms related to order of presentation, which supersede the detected main effect of
order when significant. The OC text’s EMMs appeared to differ more noticeably in the sample
relative to the MM text. However, a difference in order effects between texts was not statistically
significant. The more reliable finding here is the main effect, where presentation second was
associated with decreased reading times across texts, regardless of the potential for this effect to
differ depending on unknown factors regarding the text itself. In the verbal condition, EMMs
were similar regardless of order of presentation. However, in the graphic condition, there was a
much more pronounced difference in which presentation first was associated with increased
reading time.

DIFFERENTIAL GRAPHIC ORGANIZER COMPREHENSION 91
Modal Model posttest performance. The OC subtests were less sensitive to differences
among participants based on Guttman's λ-2 (.362 versus .563 in the MM posttest). Due to this
observed difference in reliability coefficients between the two posttests and a potential loss of
sensitivity in the OC materials, a univariate general linear model was run post hoc. This allowed
for a between-subjects model predicting performance on the MM overall posttest, eliminating the
less reliable measure. The model was estimated to evaluate the same parameters as the mixed
linear models, testing the same hypotheses. Specifically, effects on posttest performance due to
the graphic organizer condition and related to the interaction between this condition and
visuospatial skill were computed. Covariates included MM pretest performance, an interaction
Table 8.
Estimated marginal means from the linear mixed model predicting reading time.
EM Mean Standard Error
Condition = Verbal 329 23.58
Condition = Graphic 302 23.68
Text = MM 313 22.75
Text = OC 317 24.32
Text = MM, Order = 1 331.9 31.0
Text = MM, Order = 2 304.3 33.5
Text = OC, Order = 1 407.5 34.5
Text = OC, Order = 2 250.0 31.5
Condition = Verbal, Order = 1 333.3 30.5
Condition = Verbal, Order = 2 329.2 34.7
Condition = Graphic, Order = 1 406.1 34.7
Condition = Graphic, Order = 2 224.7 30.3 Note: Each EMM was computed with adjustments based on all other terms in the model. Only the last set, Order by Adjunct
condition, contains a statistically significant effect.
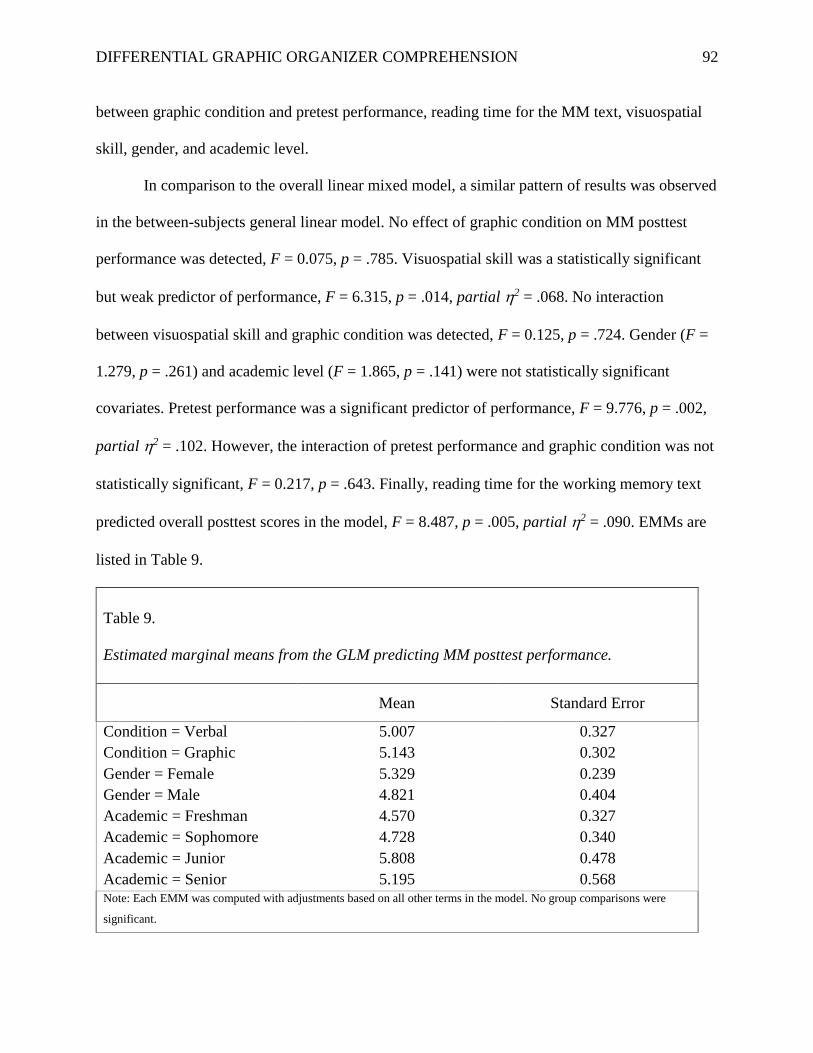
DIFFERENTIAL GRAPHIC ORGANIZER COMPREHENSION 92
between graphic condition and pretest performance, reading time for the MM text, visuospatial
skill, gender, and academic level.
In comparison to the overall linear mixed model, a similar pattern of results was observed
in the between-subjects general linear model. No effect of graphic condition on MM posttest
performance was detected, F = 0.075, p = .785. Visuospatial skill was a statistically significant
but weak predictor of performance, F = 6.315, p = .014, partial 2 = .068. No interaction
between visuospatial skill and graphic condition was detected, F = 0.125, p = .724. Gender (F =
1.279, p = .261) and academic level (F = 1.865, p = .141) were not statistically significant
covariates. Pretest performance was a significant predictor of performance, F = 9.776, p = .002,
partial 2 = .102. However, the interaction of pretest performance and graphic condition was not
statistically significant, F = 0.217, p = .643. Finally, reading time for the working memory text
predicted overall posttest scores in the model, F = 8.487, p = .005, partial 2 = .090. EMMs are
listed in Table 9.
Table 9.
Estimated marginal means from the GLM predicting MM posttest performance.
Mean Standard Error
Condition = Verbal 5.007 0.327
Condition = Graphic 5.143 0.302
Gender = Female 5.329 0.239
Gender = Male 4.821 0.404
Academic = Freshman 4.570 0.327
Academic = Sophomore 4.728 0.340
Academic = Junior 5.808 0.478
Academic = Senior 5.195 0.568 Note: Each EMM was computed with adjustments based on all other terms in the model. No group comparisons were
significant.

DIFFERENTIAL GRAPHIC ORGANIZER COMPREHENSION 93
CHAPTER FIVE
Discussion
As described in the Cognitive Theory of Multimedia Learning (CTML), the multimedia
principle describes the general finding that images and words are better remembered than words
alone (e.g., Mayer, 2008). This theory continues to investigate multimedia design elements that
influence learning. Similarly, research on graphic organizer text adjuncts has consistently found
their inclusion in a text supports more learning in comparison to no adjunct or images that
provide no information (e.g., Griffin & Tulbert, 1995; Kools et al., 2006). This was replicated
and extended in a comparison to outlines, which are similar in visual structure to the verbal
adjuncts used in the present study (Robinson & Kiewra, 1995). However, the present study
investigated a further potential extension in a comparison with informationally-equivalent verbal
organizers. That is, does a graphic adjunct lead to more learning than a verbal adjunct designed
to fulfill the same purpose and present the same essential relational information? While
controlling for reading time, prior knowledge, visuospatial skill (a relevant cognitive ability), and
academic level, such an advantage for graphic presentation was not observed.
Poor estimated reliabilities for the outcome measures may be a sufficient reason for the
failure to detect an effect. However, this cannot itself account for the clear absence of a moderate
or large effect size favoring graphic organizers. The particular source of this result cannot be
precisely ascertained from the present procedures. Fundamentally, there is a limit in the
predictive utility of current theoretical frameworks for evaluating specific instructional materials
prior to observing results across individuals. It has already been understood that not all possible
graphics would cause an improvement in learning, even when compared to no graphic at all (e.g.,
McDaniel & Einstein, 1989). The construction or study of concept maps specifically have been

DIFFERENTIAL GRAPHIC ORGANIZER COMPREHENSION 94
found to benefit learning more modestly (g = 0.364) relative to a range of other learning tasks
(Nesbit & Adesope, 2006). Present evidence remains unclear as to the more specific comparison
between the free study of graphic organizers and informationally-equivalent verbal adjuncts.
However, the effect in the present case is reliably less than that estimated by Nesbit and Adesope
for the typical advantage of such graphic study materials.
One promising theoretical direction for research would be to more closely test the
concordance between the presentation of meaningful bits of information and its later
reproduction or usage. In particular, if variations in presentation or graphic format does not
reliably and substantially affect learning when meaning is held roughly constant, then the
particular meaning evoked by a text or its adjuncts may be the appropriate level of analysis (as
opposed to the kinds of features used to do so). Here, the Material Appropriate Processing
framework, despite its current limitations in prediction of outcomes, may serve as a better
framework than the present CTML for the discovery of meaning- or content-focused principles
in future. As discussed earlier, Taylor and Tversky (1992a) found that learning from a map was
recalled with similar informational structure whether reproduced visually with a drawn diagram
or verbally with written text. Similar results were found with learning from verbal materials, and
participants recalled similar information in similar temporal order through either modality
(Taylor & Tversky, 1992b). However, no attempt was made to compare reproductions between
otherwise-equivalent learning conditions. Although the present study attempts to quantify
learning effects in an overall sense between such conditions, it was based on a larger amount of
plain text and assumptions about element interactivity between the base texts and adjuncts. It
would not be expected to be sensitive to differences in the mental representation of learned
information except if it were indirectly evidenced by differences in objective performance.

DIFFERENTIAL GRAPHIC ORGANIZER COMPREHENSION 95
Mammarella and colleagues found that children with nonverbal learning disabilities
performed worse than students with reading disabilities or no learning disabilities, but only when
a spatial perspective was required for understanding (2009), regardless of whether the spatial
information was presented verbally or nonverbally. This raises the question of whether the
modality is important only when it is essential to the concept or task at hand. That is, when a
concept can be organized either verbally or nonverbally, the approach may be immaterial, which
is consistent with the present results. This would tend to suggest that much of psychology is
amenable to verbal organizers, while graphic and other organizers (perhaps along with other
adjuncts) may retain more purpose in fields where 2- and 3-dimensional constructs are more
literal and poorly understood in the abstract. In this sense, what is important to instruction may
simply be the information at hand and the appropriateness of how it is represented in
instructional materials (e.g., McDaniel & Einstein, 1989), not the type of representational format
universally or its match to particular qualities of the learners (e.g., Pashler et al., 2008).
Visuospatial skill and graphic organizers. It was clear in the present study that
visuospatial skill was correlated with performance irrespective of graphic condition. This was
expected given the known correlation between visuospatial and general intelligence (e.g.,
Flanagan & McGrew, 1998). Thus, while detectable in the overall posttest models, this should
not be interpreted as evidence that visuospatial skill as a distinct cognitive ability uniquely
correlates with learning performance.
Such an interpretation would have been tenable if visuospatial skill moderated an effect
of graphic organizer presentation on learning. However, despite adequate power for detecting a
moderate effect size, no such effect was detected. This should not be interpreted as a
demonstration that no such effect exists.

DIFFERENTIAL GRAPHIC ORGANIZER COMPREHENSION 96
One potential explanation is that graphic organizers may be expected to provide more
benefit to individuals with higher spatial skills only when the comparison is to no adjunct at all
or to another strictly inferior information condition. For example, if verbal descriptions of the
same information are unavailable in the text and learners are constrained to using the graphic
alone, visuospatial skill could be a moderator of learning performance. Or reframed, low
visuospatial skill may cause reduced learning from graphic organizers. In contrast, a verbal
organizer’s effect on learning the same concepts (relative to no adjunct) would be expected to
have little interaction with spatial skills. In the general college student population, a relatively
small number of individuals have very low levels of abilities such that the graphics allow for no
or minimal learning. Thus, when comparing between the more equivalent graphic organizer and
verbal organizer conditions when estimating an interaction, any remaining effect could be small
and difficult to detect, if not negligible. For this reason, a replication with comparison to no
organizer may be better suited to detecting such an effect. Alternatively, a replication in which
the graphic itself is highly complex or contains unique information in its structure that is not
present in the text may better reveal it. However, from an applied perspective, even large effects
attributable to these would merely suggest authors avoid encrypting information into graphics.
This substantially limits potential applicability to practice. After all, organizers are primarily
used as supplemental adjuncts added to a text to integrate material already in it rather than as the
sole mode of presentation for task-critical information. Intentionally poor designs are not
generally useful as comparisons in practice. And more generally, if simply adding verbal
information to a text can sufficiently replace a graphic, the graphic would be said to be
unnecessary. Nevertheless, these appear to be appropriate future approaches for clarifying a
possible role of visuospatial skill in learning from text under certain conditions.

DIFFERENTIAL GRAPHIC ORGANIZER COMPREHENSION 97
Reading time. Reading time was observed to reliably predict performance across
learning outcome models. This is unsurprising given that reading time would be higher when
students put more effort and therefore more processing time into the learning task. Nevertheless,
it is worthwhile to explore the correlates or causes of reading time, which may be both a
meaningful predictor of performance and a useful outcome in its own right. From a CLT
perspective, learning is often evaluated in terms of efficiency. That is, an experimental group
learning the same amount in a shorter time frame is also evidence of a stronger manipulation.
Previous work has found that graphic organizers tend to increase reading time in comparison to
plain text, but such an effect was not found for the comparison between similar graphic and
verbal adjuncts. However, there was an interaction between order of presentation and graphic
condition. Order itself was correlated with reading time, and participants spent an estimated 116
fewer seconds on the second text (for reference, mean reading times were 315 and 316 seconds).
This may be attributable to greater familiarity with the procedures, even though texts were
presented back to back, but it may also be due to decreased effort (or cognitive resources
available or applied) across the duration of the study session. However, the interaction with
graphic condition supersedes this main effect. Where the verbal condition between subjects
showed little variation in reading time correlated with order of presentation (333 and 329
seconds, as estimated), the graphic condition presented first was associated with higher reading
time than when presented second (406 and 225 seconds, as estimated in the full model). This
interaction was unexpected and suggests that the graphic organizer may be used differently by
learners under different conditions. It is not yet clear what those conditions are, and the present
study was not designed to clarify them. However, this suggests new research questions related to
attention and processing of the graphic organizer itself under varying individual conditions. In

DIFFERENTIAL GRAPHIC ORGANIZER COMPREHENSION 98
particular, it may be that graphic organizers are studied less thoroughly when students are
fatigued or bored. These conditions are potentially numerous, including novelty effects and
motivational factors as well as those involving cognitive resources. Moreno’s Cognitive-
Affective Theory of Learning may be instructive here (e.g., Moreno, 2010), but it is beyond the
scope of the present investigation and its results, which is focused on the hypothesized cognitive
rather than affective effects of graphic organizers.
Limitations
Perhaps the foremost limitation of the present study was indicated in its observed power.
Nonsignificant terms in the models do not generally allow for clear inferences. First, the terms
themselves may not be meaningful, in fact, or they may be too small to detect reliably given the
present sample size. Second, the low reliability observed for the posttest measures may have
been a sufficient factor for explaining why the effects were not found. This is not a critical
problem, because other effects were reliably detected. Thus, reliability was high enough to detect
other theoretically-expected factors predicting posttest performance. An analogous post hoc
model that did not rely on the OC posttest’s lower reliability found equivalent results on
hypothesis tests. Finally, measures of internal consistency may underestimate actual reliability
when the construct is multifaceted (Schmidt & Hunter, 1996), as is the case for both broad
visuospatial skill and topic knowledge.
A natural but meaningful limitation in the investigation of learning materials is that they
differ on many factors. Particular materials are subject to idiosyncrasies that limit their
generalizability. For example, it may be that similar procedures and principles used for
developing text adjuncts would show differing patterns if used on a different topic or at a
different level of difficulty. If nothing else, the finding that performance improved with

DIFFERENTIAL GRAPHIC ORGANIZER COMPREHENSION 99
academic level suggests more experienced learners performed better on the learning task, and
this pattern may differ in importance for less densely-written texts. The grade-level-appropriate
text and use of common topics in psychology is important here. The present study illustrates this
known challenge and a limitation in the predictive utility of current theoretical models for
instructional design.
One potential cause of the low reliability estimates is effort. The present study used an
entirely online, remote protocol. Participants were not subject to the demands class-related tests
place on them, including higher stakes for the outcomes. They were also not subjected to social
pressures or oversight which can be produced by classroom and laboratory settings. If the
average participant in the present study put in less effort on multiple choice items than would
otherwise be typical, guessing and haphazard or careless work may be more frequent. This would
help explain the observed difficulty of the measures and the lower than expected performance on
the STAT items. Following the removal of invalid cases, all participants indicated they
completely read both texts. However, beyond this limited baseline, no other measures of effort
were included.
Future Directions
Graphic organizers. A more focused study is suggested to test for differences in
learning due to the graphic or verbal nature of organizing adjuncts. Narrower learning materials
should be used, limited to a handful of highly-interrelated concepts presented in either verbal or
graphic forms. Although this sacrifices some similarity to typical usage in higher education,
constraining the specific material tested would allow for better control of the meaning evoked by
the text and adjuncts and later tested. In turn, this would allow for the greater sensitivity needed
to address the question of whether such graphic representations have an advantage. Outcome

DIFFERENTIAL GRAPHIC ORGANIZER COMPREHENSION 100
measures will need to avoid prescribing which information is recalled or used by learners.
Specifically, free reproduction of content would be useful for assessing relational knowledge,
while more open-ended problem-solving tasks may need to be designed to test for usage
differences or more complex learning outcomes. Each may provide insight, but it will be
necessary to pilot or otherwise test such materials in situations where an effect is already well-
established to ensure sufficient sensitivity. This could be tested by including additional
comparison groups receiving either no meaningful text adjunct or an adjunct containing none of
the same relational content.
The moderating influence of order on the relationship between the graphic organizer
condition and reading time could be a useful subject for follow up. Specifically, future research
that isolates content relevant to each adjunct could look for changes in reading time for pages
that have adjuncts when they are presented at different points in a text or series of texts. Eye
tracking during such tasks would allow for more direct measurement of attention on the graphic,
but that method of measurement is likely to affect this behavior. And as with laboratory settings
in general, it is possible such behaviors would be markedly different from more naturalistic
independent study situations.
Another potential direction for research would be to explicitly compare the effectiveness
of graphic organizers across topics that vary in specific ways, particularly concreteness. As
previously discussed, topics in psychology are relatively abstract compared to physics and other
sciences that have been commonly represented in the CTML literature. In these other topics,
content can be represented more directly and literally in a visual-nonverbal medium. It is
possible that this difference in content limits the role of graphic organizers in the teaching of
psychology among other fields. A study that uses comparable outcome measures relying on

DIFFERENTIAL GRAPHIC ORGANIZER COMPREHENSION 101
similar cognitive skills could compare performance across texts between a graphic adjunct and
other conditions.
Visuospatial skill and graphic condition. In an investigation of graphic organizers, it
remains useful to measure visuospatial skill. Although a main effect of graphics may not be
large, it remains unknown whether visuospatial skill could moderate this. Given the possibility
that graphics may be less effective for some and more effective for others, reducing overall
estimates of their effectiveness, potential moderators should be considered in a more sensitive
analysis. An interaction effect in itself may not result in new recommendations to use graphic
organizers in practice, but more precise estimates could contribute to theories of individual
differences in learning from text.
Effort. Given the observed pattern of results, it would be beneficial to account for other
individual factors that influence learning when attempting to estimate the effects of individual
differences in ability. Because its influence could not be accounted-for or ruled out in the present
study, an attempt should be made to measure effort, in particular. In the study of cognitive and
material-related factors, this may serve as a useful covariate for improving sensitivity when
estimating effects attributable to ability. Alternatively, experimentally provoking greater effort
across tasks across participants may improve the sensitivity of measures. Studies examining
other sorts of factors, such as individual motivation, may find effort to be a meaningful outcome
of design elements such as graphic organizers. However, based on the interaction between
adjunct condition and order of presentation, future researchers are cautioned to also investigate
other factors such as difficulty and duration of tasks, which may interact with effort over time
(e.g., Moreno, 2010) in addition to properties of the materials.

DIFFERENTIAL GRAPHIC ORGANIZER COMPREHENSION 102
References
Ainsworth, A., & Loizou, A. T. (2003). The effects of self-explaining when learning with text or
diagrams. Cognitive Science, 27, 669-681.
Alvermann, D. E. (1986). Graphic organizers: Cueing devices for comprehending and
remembering main ideas. In J. F. Baumann (Ed.), Teaching main idea comprehension
(pp. 210-226), Newark, DE: International Reading Association.
Atkinson, R. C., & Shiffrin, R. M. (1968). Human memory: A proposed system of its control
processes. In K. W. Spence & J. T. Spence (Eds.), Psychology of learning and motivation
(pp. 89-196). New York, NY: Academic Press.
Austin, K. A. (2009). Multimedia learning: Cognitive individual differences and display design
techniques predict transfer learning with multimedia learning modules. Computers and
Education, 53, 1339-1354.
Baddeley, A. D. (1983). Working memory. Philosophical Transactions of the Royal Society of
London, 302, 311-324.
Baddeley, A. D. (2000). The episodic buffer: A new component of working memory? Trends in
Cognitive Science, 4, 417-423.
Baddeley, A. D. (2001). Is working memory still working? American Psychologist, 7, 85-97.
Baddeley, A. D. (2010). Working memory. Current Biology, 20, 136-140.
Baddeley, A. D., & Hitch, G. (1974). Working memory. In G. H. Bower (Ed.), Psychology of
learning and motivation, vol. 8 (pp. 47-90). New York, NY: Academic Press.
Betrancourt, M., & Bisseret, A. (1998). Integrating textual and pictorial information via pop-up
windows: An experimental study. Behavior and Information Technology, 17, 263-273.

DIFFERENTIAL GRAPHIC ORGANIZER COMPREHENSION 103
Bovaird, J. A. (2010). Gf-Gc Model of Intelligence. In C. S. Clauss-Ehlers (Ed.), Encyclopedia
of cross-cultural school psychology (pp. 478-479). New York, NY: Springer.
Brewer, W. F. (1980). Literary theory, rhetoric, and stylistics: Implications for psychology. In R.
J. Spiro, B. C. Bruce, & W. F. Brewer (Eds.), Theoretical issues in reading
comprehension: Perspectives from cognitive psychology, linguistics, artificial
intelligence, and education (pp. 221-243). Hillsdale, NJ: Lawrence Erlbaum Associates.
Carney, R. N., & Levin, J. R. (2002). Pictorial illustrations still improve students’ learning from
text. Educational Psychology Review, 14, 5-26.
Clark, J. M., & Paivio, A. (1991). Dual coding theory and education. Educational Psychology
Review, 3, 149-210.
Clark, R. C., & Mayer, R. E. (2008). Learning by viewing versus learning by doing: Evidence-
based guidelines for principled learning environments. Performance Improvement, 47, 5-
13.
Cohen, J. (1992). A power primer. Psychological Bulletin, 112, 155-159.
Colom, R., Contreras, M. J., Botella, J., & Santacreu, J. (2002). Vehicles of spatial ability.
Personality and Individual Differences, 32, 903-912.
Dexter, D. D., & Hughes, C. A. (2011). Graphic organizers and students with learning
disabilities: A meta-analysis. Learning Disability Quarterly, 34, 51-72.
Evans, J. J., Floyd, R. G., McGrew, K. S., & Leforgee, M. H. (2002). The relations between
measures of Cattell-Horn-Carroll (CHC) cognitive abilities and reading achievement
during childhood and adolescence. School Psychology Review, 31, 246-262.

DIFFERENTIAL GRAPHIC ORGANIZER COMPREHENSION 104
Flanagan, D. P., & McGrew, K. S. (1998). Interpreting intelligence tests from contemporary Gf-
Gc theory: Joint confirmatory factor analysis of the WJ-R and KAIT in a non-White
sample. Journal of School Psychology, 36, 151-182.
Griffin, C. C., & Tulbert, B. L. (1995). The effect of graphic organizers on students'
comprehension and recall of expository text: A review of the research and implications
for practice. Reading and Writing Quarterly: Overcoming Learning Difficulties, 11, 73-
89.
Hamilton, R. J. (2004). Material appropriate processing and elaboration: The impact of balanced
and complimentary types of processing on learning concepts from text. British Journal of
Educational Psychology, 74, 221-237.
Harp, S. F., & Mayer, R. E. (1997). The role of interest in learning from a scientific text and
illustrations: On the distinction between emotional interest and cognitive interest. Journal
of Educational Psychology, 89, 92-102.
Harp, S. F., & Mayer, R. E. (1998). How seductive details do their damage: A theory of
cognitive interest in science learning. Journal of Educational Psychology, 90(3), 414-
434.
Harskamp, E. G., Mayer, R. E., Suhre, C. (2007). Does the modality principle for multimedia
learning apply to science classrooms? Learning and Instruction, 17, 465-477.
Holsanova, J., Holmberg, N., & Holmqvist, K. (2009). Reading information graphics: The role of
spatial contiguity and dual attentional guidance. Applied Cognitive Psychology, 23, 1215-
1226.

DIFFERENTIAL GRAPHIC ORGANIZER COMPREHENSION 105
Issa, N., Schuller, M., Santacaterina, S., Shapiro, M., Wang, E., Mayer, R. E., & DaRosa, D. A.
(2011). Applying multimedia design principles enhances learning in medical education.
Medical Education, 45, 818-826.
Kalyuga, S., Chandler, P., & Sweller, J. (2004). When redundant on-screen text in media
technical instruction can interfere with learning. Human Factors, 46, 567-581.
Khoii, R., & Forouzesh, Z. (2010). Using comic strips with reading texts: Are we making a
mistake? Literacy Information and Computer Education Journal, 1(3).
Kintsch, W. (1994). Text comprehension, memory, and learning. American Psychologist, 29(4),
294-303.
Kintsch, W. (1998). Learning from text. In Comprehension: A paradigm for cognition (pp. 283-
331). Cambridge, United Kingdom: Cambridge University Press.
Kools, M., van de Wiel, M. W. J., Ruiter, R. A C., Crüts, A., & Kok, G. (2006). The effect of
graphic organizers on subjective and objective comprehension of a health education text.
Health Education and Behavior, 33(6), 760-772.
Krathwohl, D. R. (2002). A revision of Bloom’s Taxonomy: An overview. Theory into Practice,
41(4), 212-218.
Leahy, W., Chandler, P., & Sweller, J. (2003). When auditory presentations should and should
not be a component of multimedia instruction. Applied Cognitive Psychology, 17, 401-
418.
Lee, J., & Bednarz, R. (2012). Components of spatial thinking: Evidence from a Spatial Thinking
Ability Test. Journal of Geography, 111, 15-26.

DIFFERENTIAL GRAPHIC ORGANIZER COMPREHENSION 106
Levin, J. R., & Mayer, R. E. (1993). Understanding illustrations in text. In B. K. Britton, A.
Woodward, & M. Binkley (Eds.), Learning from textbooks: Theory and practice (pp. 95-
114). Hillsdale, NJ: Lawrence Erlbaum Associates.
Mammarella, I. C., Meneghetti, C., Pazzaglia, F., Gitti, F., Gomez, C., & Cornoldi, C. (2009).
Representation of survey and route spatial descriptions in children with nonverbal
(visuospatial) learning disabilities. Brain and Cognition, 71, 173-179.
Mayer, R. E. (1987). Instructional variables that influence cognitive processes during reading. In
B. K. Britton and S. M. Glynn (Eds.), Executive control processes in reading (pp. 201-
216). Hillsdale, NJ: Lawrence Erlbaum Associates, Inc.
Mayer, R. E. (2001). Multimedia learning. New York, NY: Cambridge University Press.
Mayer, R. E. (2005). Cognitive Theory of Multimedia Learning. In R. E. Mayer (Ed.), The
Cambridge handbook of multimedia learning (31-48). New York, NY: Cambridge
University Press.
Mayer, R. E. (2008). Applying the science of learning: Evidence-based principles for the design
of multimedia instruction. American Psychologist, 63(8), 760-769.
Mayer, R. E., Heiser, J., & Lonn, S. (2001). Cognitive constraints on multimedia learning: When
presenting more material results in less understanding. Journal of Educational
Psychology, 93(1), 187-198.
Mayer, R. E., & Jackson, J. (2005). The case for coherence in scientific explanations:
Quantitative details can hurt qualitative understanding. Journal of Experimental
Psychology,11, 13-18.
Mayer, R. E., & Johnson, C. I. (2008). Revising the redundancy principle in multimedia learning.
Journal of Educational Psychology, 100(2), 380-386.

DIFFERENTIAL GRAPHIC ORGANIZER COMPREHENSION 107
Mayer, R. E., & Massa, L. J. (2003). Three facets of visual and verbal learners: Cognitive ability,
cognitive style, and learning preference. Journal of Educational Psychology, 95, 833-
846.
Mayer, R. E., & Sims, V. K. (1994). For whom is a picture worth a thousand words? Extensions
of a dual-coding theory of multimedia learning. Journal of Educational Psychology,
86(3), 389-401.
McDaniel, M. A., Einstein, G. O., Dunay, & Cobb (1986). Encoding difficulty and memory:
Toward a unifying theory. Journal of Memory and Language, 25, 645-656.
McDaniel, M. A., & Einstein, G. O. (1989). Material-Appropriate Processing: A contextualist
approach to reading and studying strategies. Educational Psychology Review, 1, 113-145.
Miller, G. A. (1956). The magical number seven, plus or minus two: Some limits on our capacity
for processing information. The Psychological Review, 64, 81-97.
Moreno, R. (2010). Cognitive load theory: More food for thought. Instructional Science, 38,
135-141.
Moreno, R., & Mayer, R. E. (1999). Cognitive principles of multimedia learning: The role of
modality and contiguity. Journal of Educational Psychology, 91, 358-368.
Moreno, R., & Mayer, R. E. (2000). A coherence effect in multimedia learning: The case for
minimizing irrelevant sounds in the design of multimedia instructional messages. Journal
of Educational Psychology, 92, 117-125.
Moreno, R., & Park, B. (2010). Cognitive load theory: Historical development and relation to
other theories. In J. Plass, R. Moreno, & R. Brünken (Eds.), Cognitive load theory (pp. 9–
28). New York: Cambridge University Press.

DIFFERENTIAL GRAPHIC ORGANIZER COMPREHENSION 108
Muller, D. A., Lee, K. J., & Sharma, M. D. (2008). Coherence or interest: Which is most
important in online multimedia learning. Australasian Journal of Educational
Technology, 24, 211-221.
Nesbit, J. C., & Adesope, O. O. (2006). Learning with concept and knowledge maps: A meta-
analysis. Review of Educational Research, 76(3), 413-448.
Newton, J. H. & McGrew, K. S. (2010). Introduction to the Special Issue: Current Research in
Cattel-Horn-Carroll-Based Assessment. Psychology in the Schools, 47(7), 621-634.
Paas, F., Renkl, A., & Sweller, J. (2003). Cognitive Load Theory and instructional design:
Recent developments. Educational Psychologist, 38, 1-4.
Paivio, A. (1991). Dual coding theory: Retrospect and current status. Canadian Journal of
Psychology, 45(3), 255-287.
Paivio, A. (2010). Dual coding theory and the mental lexicon. The Mental Lexicon, 5(2), 205-
230.
Pashler, H., McDaniel, M., Rohrer, D., & Bjork, R. (2008). Learning styles: Concepts and
evidence. Psychological Science in the Public Interest, 9, 105-119.
Purnell, K. N., & Solman, R. T. (1991). The influence of technical illustrations on students’
comprehension in geography. Reading Research Quarterly, 26(3), 277-299.
Robinson, D. H., & Kiewra, K. A. (1995). Visual argument: Graphic organizers are superior to
outlines in improving learning from text. Journal of Educational Psychology, 87(3), 455-
467.
Sadoski, M., & Paivio, A. (2004). A dual coding theoretical model of reading. In R. B. Ruddel,
& N. J. Unrau (Eds.), Theoretical models and processes of reading (5th ed.) (pp. 1329-
1362). Newark, DE: International Reading Association.

DIFFERENTIAL GRAPHIC ORGANIZER COMPREHENSION 109
Schmidt, F. L., & Hunter, J. E. (1996). Measurement error in psychological research: Lessons
from 26 research scenarios. Psychological Methods, 1, 199-223.
Shaw, S., Nihalani, P., Mayrath, M., & Robinson, D. H. (2012). Graphic organizers or graphic
overviews? Presentation order effects with computer-based text. Educational Technology
Research and Development, 60(5), 807-820.
Simmons, D. C., Griffin, C. C., & Kameenui, E. J. (1988). Effects of teacher-constructed pre-
and post-graphic organizer instruction on sixth-grade science students’ comprehension
and recall. Journal of Educational Research, 82, 15-21.
Stone, C. L. (1983). A meta-analysis of advance organizer studies. The Journal of Experimental
Education, 51, 194-199.
Shiffrin, R. M., & Atkinson, R. C. (1969). Storage and retrieval processes in long-term memory.
Psychological Review, 76, 179-193.
Sung, E., & Mayer, R. E. (2012). When graphics improve liking but not learning from online
lessons. Computers in Human Behavior, 28, 1618-1625.
Sweller, J. (2005). Implications of Cognitive Load Theory for multimedia learning. In R. E.
Mayer (Ed.), The Cambridge handbook of multimedia learning (pp. 19-30). New York,
NY: Cambridge University Press.
Sweller, J., Ayres, P., & Kalyuga, S. (2011). Cognitive Load Theory: Explorations in the
learning sciences, instructional systems and performance technologies. New York, NY:
Springer Science+Business Media, LLC.
Taylor, H. A., & Tversky, B. (1992a). Descriptions and depictions of environments. Memory and
Cognition, 20, 483-496.

DIFFERENTIAL GRAPHIC ORGANIZER COMPREHENSION 110
Taylor, H. A., & Tversky, B. (1992b). Spatial mental models derived from survey and route
descriptions. Journal of Memory and Language, 31, 261-292.
Tomaszewski, B., Vodacek, A., Parody, R., & Holt, N. (2015). Spatial thinking ability
assessment in Rwandan secondary schools: Baseline results. Journal of Geography, 114,
39-48.
Verdi, M. P., Kulhavy, R. W., Stock, W. A., Rittschof, K. A., & Johnson, J. T. (1996). Text
learning using scientific diagrams: Implications for classroom use. Contemporary
Educational Psychology, 21, 487-499.
Verma, K. (2015). Influence of academic variables on geospatial skills of undergraduate
students: An exploratory study. The Geographical Bulletin, 56, 41-55.
Weiner, B. (1990). History of motivational research in education. Journal of Educational
Psychology, 82, 616-622.
Willingham, D. T., Hughes, E. M., & Dobolyi, D. G. (2015). The scientific status of learning
styles theories. Teaching of Psychology, 42, 266-271.
Wittrock, M. C. (2010). Learning as a generative process. Educational Psychologist, 45, 40-45.

DIFFERENTIAL GRAPHIC ORGANIZER COMPREHENSION 111
Appendix A
Prior Knowledge Test Items
Self-Report Items
How well do you feel you understand the learning process of operant conditioning, including
reinforcement, extinction, and generalization?
a: Not well at all
b: Slightly well
c: Moderately well
d: Very well
e: Extremely well
How well do you feel you understand the information processing model of memory, including
sensory, working, and long-term memory?
a: Not well at all
b: Slightly well
c: Moderately well
d: Very well
e: Extremely well
The Modal Model of Memory
Long-term memories are:
a: permanent.
b: permanent only if you think of them regularly.
c: only permanent if they are especially important to you.
d: [none of the above]
The process that moves information from sensory to working memory is called:
a: attention.
b: sensation.
c: transference.
d: retrieval.
A specific sensory memory lasts:
a: about as long as if it were a short-term memory
b: a few seconds to a few minutes
c: a fraction of a second to a few seconds
d: longer than a short term memory but not as long as a long-term memory
What does "rehearsal" do in the context of human memory?
a: move information from working memory to long-term memory
b: maintain information in working memory
c: allow us to forget useless information

DIFFERENTIAL GRAPHIC ORGANIZER COMPREHENSION 112
d: move information from sensory memory to long-term memory
Anna is learning a new concept from her father. She encodes it into her long-term memory, but
when her father quizzes her later, she can't remember the answer. Which of the following
explanations is most reasonable?
a: she never learned it in the first place
b: the memory faded and no longer exists
c: she didn't learn a cue for the concept that works in this situation
d: she learned a wrong answer, which means she can't remember the correct one
Fred is working with 20 pigeons in his lab. He tries to learn all their names but often calls one of
them by the name of a pigeon he worked with years ago. What is likely causing this error?
a: interference
b: a decayed memory
c: encoding error
d: apperception
While taking an essay test, George remembers that the technical term he was trying to think of
rhymes with "medieval," but he can't seem to remember it. Why?
a: He didn't encode the word well enough
b: He didn't study the material enough times
c: He didn't use his working memory
d: He didn't use his sensory memory
Liz wasn't listening at all while Patrick talked about his day. Patrick noticed this and asked her if
she knew what he was talking about. Liz was still able to repeat his last sentence word for
word. What system allowed her to do this?
a: long-term memory
b: short-term memory
c: working memory
d: sensory memory
Operant Conditioning
What does punishment do?
a: Decreases reinforcements that drive a behavior.
b: Increases reinforcements that drive a behavior.
c: Causes a behavior to be unlearned.
d: [none of the above]
Which of the following describes the difference between positive and negative reinforcement?
a: Whether something produces a wanted vs. unwanted effect.
b: Whether something is added vs. removed to produce a wanted effect.
c: Whether something produces a known vs. unknown effect.
d: Whether something is rewarded vs. nothing happens.

DIFFERENTIAL GRAPHIC ORGANIZER COMPREHENSION 113
If a behavior usually occurs in a specific situation, that situation is the:
a: function of the behavior.
b: limitation of the behavior.
c: antecedent to the behavior.
d: motivation for the behavior.
A person's emotional reaction to the results of a behavior is a(n):
a: consequence.
b: function.
c: stimulus.
d: operant.
When he is confused during a class session, Brett raises his hand so that the teacher calls on him,
which would allow him to ask a question and have it answered. The chance to be called on is the:
a: antecedent.
b: consequence.
c: function.
d: operant.
When he is confused during a class session, Brett raises his hand so that the teacher calls on him,
which would allow him to ask a question and have it answered. The confusing class session is
part of the:
a: function.
b: antecedent.
c: operant.
d: consequence.
When Anne plays too close to the street, her mother shouts, and Anne becomes less likely to
stray too close. This is an example of:
a: positive reinforcement.
b: negative reinforcement.
c: positive punishment.
d: negative punishment
e: [none of the above]
When a friend cheats to win a game, Lee refuses to play it for the rest of the day. The friend was
very unhappy about this and stops cheating when playing against Lee. This is an example of:
a: positive reinforcement.
b: negative reinforcement.
c: positive punishment.
d: negative punishment
e: [none of the above]

DIFFERENTIAL GRAPHIC ORGANIZER COMPREHENSION 114
Appendix B
Base Texts
The Modal Model of Memory
One of the more important questions considered by psychology today is "How do we
learn?" Although we might commonly talk about our memory as a single ability, it is useful to
think about memory as multiple mental systems all working together. In its simplest form, we
could talk about our short-term memory versus long-term memory. Respectively, this separates
temporarily held information from more permanent knowledge, which can be remembered later.
Modern theories, however, include more processes and details, which can go a long way toward
explaining why we learn something or fail to learn it.
Working Memory
First, the notion of short-term memory can be expanded to working memory. This better
characterizes memory as not just a store for information but a center for processing it. You don't
just hold a fact in your mind, like the sentence "What is 4 +11?" You can work it out in your
working memory such that you're holding the answer in your mind, too. Of course, our working
memory system isn't unlimited. We can only hold so many things at once. This seriously affects
our performance on more complex tasks. Imagine listening to someone asking you out loud
"What is 4+11+17+6?" You might be able to juggle these numbers in your working memory
while calculating the correct answer bit by bit, but by the end, most people would forget one or
more of the original numbers in the question. Even for someone skilled at math calculation, if the
question were a lot longer or more complex, the question could become impossible. But if it
were written out on paper, it wouldn't even be a challenge. This is because the limit of our ability

DIFFERENTIAL GRAPHIC ORGANIZER COMPREHENSION 115
to hold ideas in mind can easily be the factor that prevents us from solving the problem, even
when we’re more than capable of doing the calculations themselves.
Sensory Memory
Our senses take in far more information than we can process, and it's important to
understand how such a limited set of information from the environment ends up in our working
memory. Each sense has its own memory store that includes all of the basic sensory information
we gather from our environment, in real time. Collectively, this is our sensory memory system.
For example, every bit of information in our entire visual field is held in one part of sensory
memory, where it is stored for a fraction of a second. Even one moment of visual information is
far more than we can store in working memory. When playing a "find-the-object" game, you
might notice how you're really only taking in a little at a time, even though the whole image is
visible in front of you. Instead, individual things are noticed one at a time, moment by moment,
through your process of attention. It is your attention processes that take information from
sensory memory and push it into your working memory where you can consciously think about it
or rehearse it.
[Insert assigned Sensory Memory adjunct here]
Holding Information in Working Memory
Once working memory is maxed out, something has to give. The small amount of
information that enters and is stored in working memory is limited in capacity and also in
duration. Information there is not permanent. Some evidence suggests that ideas in working
memory fade over a matter of seconds, or decay. Alternatively, when you pay attention to new
information beyond your working memory capacity, it replaces some or all of what was

DIFFERENTIAL GRAPHIC ORGANIZER COMPREHENSION 116
previously in there. This is called interference. Either way, information forgotten from working
memory is lost permanently.
We do have processes that help us with these memory limitations. To help keep
information in working memory, we can rehearse it. This means going over the information in
your mind, attending to it and repeating it as long as you need it there. This keeps information
from fully decaying during processing and occupies our attention, preventing new ideas from
replacing those currently in working memory. When someone tells you a phone number, you
might rehearse it until you've typed it into your phone or written it down. But just rehearsing
doesn't mean you will memorize it. In fact, you probably forget that phone number right away
even if you rehearsed it a dozen times. If it were information you wanted to memorize, rehearsal
would simply give you more time in which you could store the information in long-term
memory.
Long-term Memory
The process of moving information from temporary working memory to permanent long-
term memory is often called encoding, which is a huge part of what is meant by "learning." This
process of memorizing something is largely a matter of connecting it to prior knowledge and
familiar sensations. This is what makes the new information meaningful, and these connections
allow us to recall information we've memorized. The process of retrieval, bringing information
in long-term memory into working memory, requires us to have cues of some sort that connect
our thinking to the specific bit of memory to be recalled.
[Insert assigned Modal Model adjunct here]
Most students have had the experience of taking a test and not quite remembering the
answer. When we later see the correct answer, we recognize it right away, because it's the perfect

DIFFERENTIAL GRAPHIC ORGANIZER COMPREHENSION 117
cue. The problem was that we hadn't memorized enough of the right cues so that seeing the
question on the test could get us to that bit of memory. If you see the word "desert" and take a
moment to think, that cue might lead you to think of a cactus or sand dunes, which are connected
ideas for many of us. Without seeing "desert," you probably wouldn't bring either of these ideas
to mind. You need a cue from your environment to get you there based on what you already
know. This might seem like an obvious point, but it's very much like that frustrating test
question. Ultimately, we hadn't encoded enough of the right cues to get us from the information
written in the question to the information needed to answer it correctly, even if we had that piece
of information memorized. This isn't necessarily different from saying we didn't understand the
subject well enough. With a few extra cues, we might find ourselves suddenly remembering,
sometimes during the test. Other factors can affect our retrieval, but if we know a topic well
enough, we can come up with the correct answer for all sorts of different questions about it.

DIFFERENTIAL GRAPHIC ORGANIZER COMPREHENSION 118
Operant Conditioning
One of the most important learning processes discovered in psychology is operant
conditioning. This refers to how we learn to take specific actions in different kinds of situations
to cause particular effects. In more general terms, we learn to behave in some way because of the
results we expect from the effort.
Reinforcement and Punishment
In order to understand operant conditioning, it is useful to think about different possible
outcomes from an experience. An important distinction to make is between reinforcement and
punishment, two different learning outcomes. Put simply, after taking an action, punishment
means someone learned to be less likely to take the same action in future, and reinforcement
means they learned to be more likely to do so. In this sense, if there's no change in behavior in
any way, then no operant conditioning happened. From a motivational perspective, behavior
changes when the learner sees that it resulted in a subjectively good or bad outcome. There are
two ways to have a good outcome following a behavior: positively, by gaining a good thing
(positive reinforcement), and negatively, by avoiding a bad thing (negative reinforcement).
Likewise, there are two ways behavior can have a bad outcome, adding a bad thing (positive
punishment) and taking away a good thing (negative punishment). This can get confusing
because the terms positive and negative can sound like they describe the outcome as good or bad.
However, they only describe whether something was added or subtracted to cause the
punishment or reinforcement.
[Insert assigned Learning Outcomes adjunct here]
But remember that we want to talk about is the learning process itself, not just the results
of the learning. And so every single instance of operant conditioning involves an actual, positive

DIFFERENTIAL GRAPHIC ORGANIZER COMPREHENSION 119
thing that was learned. This means that reinforcement and punishment are not opposites, even
though they may seem like it on the surface. There is no "unlearning" here. Both are about
actively learning that the behavior results in specific sorts of outcomes.
When it comes to understanding a specific behavior, arguably the most effective
approach is to analyze it in terms of its function. Basically, you need to understand the actual
purpose of the behavior. It's not enough to hear what the individual thinks the purpose of their
behavior is, and appearances can be deceiving. So it's important to break it down into parts.
Antecedents and Consequences
All behaviors happen in a particular sort of context. So it's vital to determine the situation
prior to the behavior that makes it more likely or triggers the behavior. This is commonly called
the antecedent, which is the combination of stimuli that signal the opportunity for the behavior to
do something. Antecedents often include the general setting, such as sitting in class, and a more
specific trigger, such as the teacher calling your name.
On the other side of the equation, the result of the behavior is going to be a set of stimuli
that appear to follow because of the behavior. This includes any physical results of the behavior
and others' reactions to them, but it also includes the individual's own reactions to what happens.
Together, these results are the consequence of the behavior. For example, if a student tries to
answer a question out loud (behavior) when the teacher calls on them (antecedent), the
consequence would include the teacher's facial expression and verbal response as well as how
those responses make that student feel. Note that multiple outcomes can be learned at once as
part of the consequence. If the teacher's response is "good" but other students' responses are
"bad," the reinforcing side of the consequence may be countered by a punishing side. Whether

DIFFERENTIAL GRAPHIC ORGANIZER COMPREHENSION 120
the student is reinforced overall is determined by their subjective emotional assessment of what
happened. This is a part of the total consequence.
[Insert assigned ABC Model adjunct here]
All punishment can do is suppress a behavior, which does not prevent it from being
reinforcing in other ways. When you want to change a behavior, punishment is usually not
enough. You probably need to stop whatever is reinforcing it or reinforce a behavior that
replaces it. It's important to recognize that if a behavior is stable and recurring, then it is being
reinforced somehow. For instance, if you feel good about a job well done for its own sake, it's
already reinforcing even when there is no clear benefit to you or recognition from others. The
positive feeling alone might be enough of a consequence to drive the behavior when you expect
to be successful.
Extinction and Generalization
Several learning processes support how operant conditioning works in practice, even
though they're not the same process. One of them is called extinction, and it can look a lot like
unlearning or forgetting when you define reinforcement and punishment as an overt change in
behavior. But really, extinction is actively learning that a previously learned behavior does not
produce the expected result anymore. Imagine that you spent 10 minutes training a rat to press a
lever for a food reward. Then you disconnect the lever so it does nothing. Over time, the rat's
behavior of pressing the lever for food would extinguish and become less and less likely with
each new press. But make no mistake: the rat isn't forgetting anything! If the rat happens to press
it later or sees it work even once, you can bet the lever pressing behavior will come back a lot
faster than the 10 minutes it took the first time. In separate learning processes that operate at the
same time, the rat will be distinguishing between when the lever works and when it doesn't. For

DIFFERENTIAL GRAPHIC ORGANIZER COMPREHENSION 121
instance, if there is a faint electrical buzzing sound when the lever is on, the rat will probably
learn to discriminate between the two different situations, with and without the buzzing. Then,
over time, you'd see the rat press the lever almost exclusively when it's actually active. In a
separate process, the rat is probably also learning to generalize between somewhat different
settings. For instance, imagine training the rat in multiple different cages with different smells or
colors or types of levers at different times of day. If they all work, the rat is learning to press
levers across a broader variety of situations. If one of them doesn't work, the rat would
discriminate between it and the other cases. Over time, this refines the antecedent for the
behavior. Ultimately, we take an action in a given context because we have learned to expect that
particular action will result in more positive feelings. And then we update our knowledge based
on what happens.

DIFFERENTIAL GRAPHIC ORGANIZER COMPREHENSION 122
Appendix C
Text Adjuncts
Figure A1.
Modal Model: Attention Verbal Organizer
Figure A2.
Modal Model: Attention Graphic Organizer
Sensory memory capacity can contain many more
things than our working memory capacity.
Attention processes take specific things in sensory
memory and move them to working memory.
This takes the place of information that may have
been in working memory beforehand.
Information in working memory can be attended to
in the process of rehearsal.

DIFFERENTIAL GRAPHIC ORGANIZER COMPREHENSION 123
Figure A3.
Modal Model: Modal Model Verbal Organizer
Figure A4.
Modal Model: Modal Model Graphic Organizer
Sensory Memory -Stimuli enter sensory memory
-Information here decays -Attention moves information from sensory to working mem.
Working Memory -Rehearsal cycles information back into working memory -Interference results in memory loss
Long-Term Memory -Encoding moves information from working mem. to LTM -Retrieval recalls long-term memories into working mem. -Interference in LTM results in memory loss, or forgetting

DIFFERENTIAL GRAPHIC ORGANIZER COMPREHENSION 124
Figure A5.
Operant Conditioning: Learning Outcomes Graphic Organizer
Figure A6.
Operant Conditioning: Learning Outcomes Verbal Organizer
Reinforcement
Positive Reinforcement adds a pleasant stimulus
Negative Reinforcement removes an unpleasant stimulus
Punishment
Positive Punishment adds an unpleasant stimulus
Negative Punishment removes a pleasant stimulus
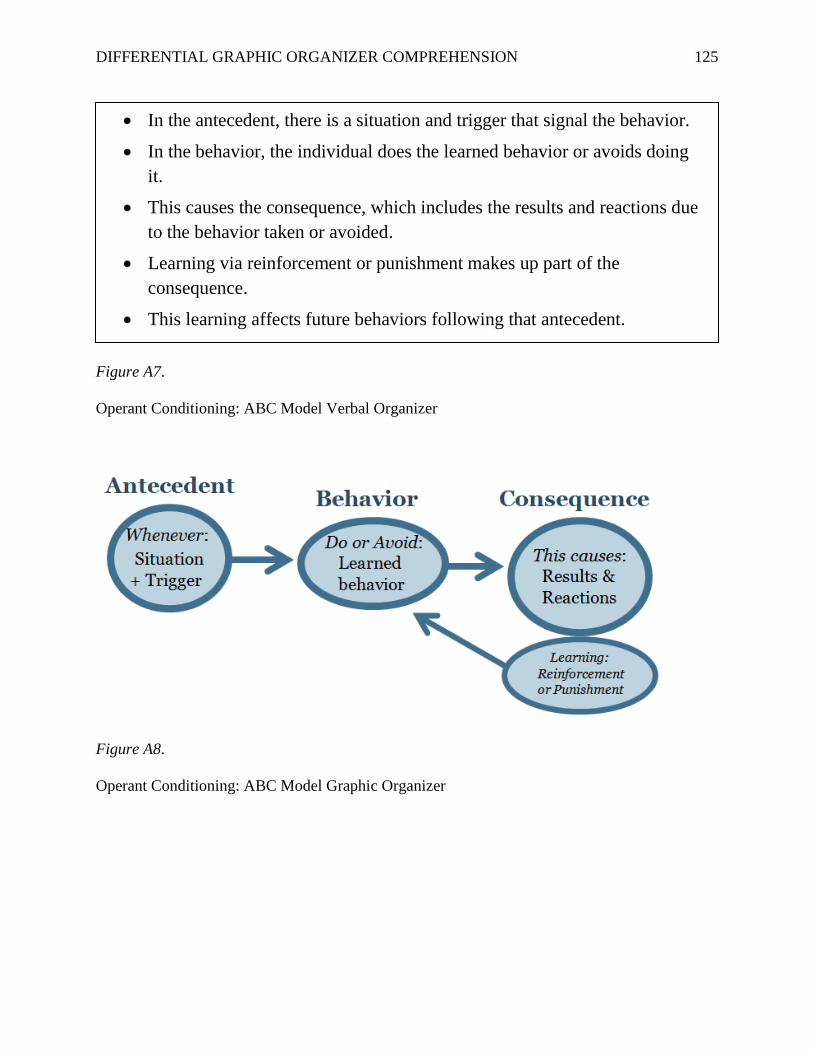
DIFFERENTIAL GRAPHIC ORGANIZER COMPREHENSION 125
Figure A7.
Operant Conditioning: ABC Model Verbal Organizer
Figure A8.
Operant Conditioning: ABC Model Graphic Organizer
In the antecedent, there is a situation and trigger that signal the behavior.
In the behavior, the individual does the learned behavior or avoids doing
it.
This causes the consequence, which includes the results and reactions due
to the behavior taken or avoided.
Learning via reinforcement or punishment makes up part of the
consequence.
This learning affects future behaviors following that antecedent.

DIFFERENTIAL GRAPHIC ORGANIZER COMPREHENSION 126
Appendix D
Posttests
The Modal Model of Memory
Our process of attention:
a: moves information from sensory to working memory.
b: moves information from working to long-term memory.
c: moves information from long-term to working memory.
d: moves information from the environment to sensory memory.
What process helps us prevent the loss of information from working memory?
a: retrieval
b: rehearsal
c: stimulation
d: attention
Dan is being questioned about a police suspect. A videotape clearly shows the suspect walk past
Dan in the street, who looks in his direction and moves on. But Dan can't remember any details
about the man. Even though the suspect was fully represented in his ________ memory, Dan
didn't pay any attention to details the police want, so they were completely forgotten.
a: sensory
b: working
c: long-term
d: encoding
Cues are necessary for:
a: attention.
b: working memory.
c: retrieval.
d: representation.
Geoff was just beginning to teach a class about statistical models, and he wasn't sure one of his
students was really listening. He waited in silence for three seconds before asking a question
about the most recent idea in the lesson. The student was able to answer correctly. Which of the
following are we pretty sure about?
a: The student had the information in sensory memory while answering.
b: The student had the information in working memory while answering.
c: The student had the information in long-term memory.
d: [all of the above]

DIFFERENTIAL GRAPHIC ORGANIZER COMPREHENSION 127
In order to be considered in working memory, information must be:
a: attended to.
b: retrieved.
c: encoded.
d: attended to or retrieved.
e: encoded and retrieved.
When Penny studies, she thinks about the new idea and tries to connect it to familiar ideas, while
her friend does not. All else equal, what advantage is Penny likely to have when taking a test?
a: She will be better able to identify the key elements of a question in sensory memory.
b: She will be able to hold the information in working memory for longer.
c: She will more easily retrieve the needed information.
d: [all of the above]
Janice asked a local student for street directions to the student center. She used a notepad to
quickly write down each turn's direction, left or right, but didn't have time to write down the
name of each street. She only heard the directions once, but this was just enough to be able to
successfully navigate to the student center using the turn directions and her memory of street
names. How did writing down the directions help her?
a: By providing a visual aid.
b: By increasing the amount of information stored in sensory memory.
c: By cuing retrieval of street names she now associates with the directions.
d: By decreasing the number of things she had to hold in working memory.
What does "rehearsal" do in the context of human memory?
a: move information from working memory to long-term memory
b: maintain information in working memory
c: allow us to forget useless information
d: move information from sensory memory to long-term memory
While taking an essay test, George remembers that the technical term he was trying to think of
rhymes with "medieval," but he can't seem to remember it. Why?
a: he didn't encode the word well enough
b: he didn't study the material enough times
c: he didn't use his working memory
d: he didn't use his sensory memory
DIFFERENTIAL GRAPHIC ORGANIZER COMPREHENSION 128
Operant Conditioning
Todd throws a tantrum in the store to get his mother to buy him a piece of candy, but she
completely ignores him. He's frustrated and cries louder before giving up and stopping. This is
an example of:
a: positive reinforcement.
b: negative reinforcement.
c: positive punishment.
d: negative punishment
e: [none of the above]
Fred the pigeon previously learned he could peck a single red disk to get food while in the
special testing cage. In a new cage with several disks, Fred learns that packing the green and blue
disks does nothing, and he stops pecking them. But the red ones produce food, so he soon only
pecks the red. What is this more recent learning process called?
a: extinction
b: generalization
c: discrimination
d: punishment
Which of the following describes what happens following punishment?
a: Reinforcements driving a behavior are reduced.
b: Reinforcements driving a behavior are increased.
c: The behavior is forgotten or unlearned.
d: [none of the above]
Following the effects of a specific behavior, a person's emotional reaction to them is part of the
________.
a: function
b: consequence
c: operant
d: stimulus
When Max the dog's owner holds a ball and waits, Max takes off running, after which his owner
throws the ball across the yard. This is always exciting and fun for Max, who brings it back right
away. The ball being thrown is part of the:
a: antecedent
b: operant
c: consequence
d: function

DIFFERENTIAL GRAPHIC ORGANIZER COMPREHENSION 129
When Max the dog's owner holds a ball and waits, Max takes off running, after which his owner
throws the ball across the yard. This is always exciting and fun for Max, who brings it back right
away. The owner's arm holding the ball and waiting is the:
a: situation
b: trigger
c: behavior
d: consequence
When Max the dog's owner holds a ball and waits, Max takes off running, after which his owner
throws the ball across the yard. This is always exciting and fun for Max, who brings it back right
away. The ball flying through the air across the yard is the:
a: situation
b: trigger
c: behavior
d: consequence
If your action allows you to avoid something aversive (painful, for example), it is likely to be:
a: positively reinforcing.
b: negatively reinforcing.
c: positively punishing.
d: negatively punishing.
e: [none of the above]
If your action leads to something you enjoy being taking away, this is likely to cause:
a: positive reinforcement.
b: negative reinforcement.
c: positive punishment.
d: negative punishment.
e: [none of the above]
If a behavior usually occurs in a specific situation, that situation is the:
a: function of the behavior.
b: limitation of the behavior.
c: antecedent to the behavior.
d: motivation for the behavior.

DIFFERENTIAL GRAPHIC ORGANIZER COMPREHENSION 130
Appendix E
Verbal-Visual Learning Style Rating (VVLSR, Version 1.0, online version)
In a learning situation sometimes information is presented verbally (e.g., with printed or spoken
words) and sometimes information is presented visually (e.g., with labeled illustrations, graphs,
or narrated animations). Please select your learning preference.
a. Strongly more verbal than visual
b. Moderately more verbal than visual
c. Slightly more verbal than visual
d. Equally verbal and visual
e. Slightly more visual than verbal
f. Moderately more visual than verbal
g. Strongly more visual than verbal
Copyright 2002 by Richard E. Mayer. Reprinted by permission. Note: Original version was
paper-based, and the final sentence of the item stem was written “Please place a check mark
indicating your learning preference.”

DIFFERENTIAL GRAPHIC ORGANIZER COMPREHENSION 131
Appendix F
Statistical Assumption Charts for the Principal Analysis
Figure A9. Quantile-quantile plot of all residuals from the principal analysis.
Figure A10. Histograms of principal analysis residuals paneled by graphic condition and topic,
respectively.

DIFFERENTIAL GRAPHIC ORGANIZER COMPREHENSION 132
Figure A11. Scatterplots of principal analysis residuals across predicted values, paneled by
graphic condition and topic, respectively.