Seasonal Response of Grasslands to Climate Change on the Tibetan Plateau
Upload
independentCategory
view
4download
0
Developing a Cost-Effective Fire Management Plan for California's Kern Plateau JASON M. GREENLEE and CARL C. WILSON
The Kern Plateau in Sequoia National Forest was selected as a pilot study area for the development and application of a new fire management planning process.
WE WERE GIVEN a unique opportunity in 1978 to develop a prototype cost-effective fire management system for the valuable Kern
Plateau of the Sequoia National Forest in California. The main objective was to design a practical plan using existing technology and meeting the requirements of the Forest Service's new fire management policy.
KERN PLATEAU
The Kern Plateau covers an area of about 400,000 acres and is located between the main fork on the Kern River and U.S. Highway 395. The Plateau is a portion of the Cannell Meadow District of the Sequoia National Forsest. The Ranger District Headquarters is at Kernsville, and there is a fire station located at Blackrock in the north central section of the Plateau. A second fire station is located at Chimney Peak Station within the 25,OOO-acre portion of the Kern Plateau managed and protected by the Bureau of Land Management. The Plateau has many unique features such as the granite dome-like shapes located throughout the Domeland Wilderness in the southern section. The vegetation varies from that found in the high desert (pinyon. juniper, and shrubs) to dense mixed-conifer forests. The Plateau has varied terrain from flat and gently rolling country to steep mountain slopes. which is dotted with numerous meadows. The wide variety of animals and birds in the Plateau includes bear. deer. coyote, chipmunk. marmot. and squirrel. red-tailed hawk, and bald eagle. Even the
NOTE: Jason M. Greenlee is President of Fire and Land Management Enterynses (FLAME). Boulder Creek. California. Carl C. Wilson was formerly National Fire Specialist for the Forest Service, USDA. and is now a Forest Fire Consultant at Berkeley, California.
165

166 Fire Technology
condor can be seen occasionally over the Plateau. German Brown trout, Rainbow, and the native Golden Trout can be found in the streams.
There are four major campgrounds on the Plateau. Kermedy Meadows. Fish Creek, and Troy Meadows Campgrounds are located on the east side, and Horse Meadow is on the west side. Primitive recreation and solitude are available in the Domeland and Golden Trout Wildernesses.
The Kern Plateau is a prime watershed area. Most of the precipitation occurs in the form of snow. But. there are high intensity thunder showers during the summer months. which can cause surface erosion in areas burned by wildfires.
There are eight cattle grazing allotments in the Plateau. and these provide direct benefits to the owners of twelve ranches. About 3,000 cattle graze on 354,000 acres of rangeland.
During 1978. there were four major timber sales in the Plateau. In addition. there are a number of small timber operations. About 35 million board feet of timber are cut per year. Fuelwood permits are issued during the summer months.
FIRE PROBLEMS
The number of fires and the acreage burned in the Plateau by unwanted fires have been increasing. Table 1 shows the incidence of lightning and man-caused fires in the Kern Plateau since 1941. With rare exceptions. lightning fires in the Plateau have been held to relatively small acreage. One such exception occurred during the 1977 "lightning bust" in northern and central California when the disastrous Marble-Cone and Scarface fires were burning. Earlier. in 1975, the destructive Flat fire blackened an area of about 17.000 acres. It was started by a careless camper and spread uphill into the Plateau from the Forks of the Kern River.
Increased recreational use can account for the increase in the number of man-caused fires. but why has there been a 500 percent increase in the lightningfire~since the 1940s? Are more fires discovered now, or were some fires then considered to be nonthreats and allowed to burn out pockets of dead fuels? Or. are fires occurring in cutover areas where the fire climate has been worsened. and more dead fuels are available for ignition? In any case. the potential for large and destructive fires is increased with the number of ignitions. particularly if multiple fires occur during dry lightning storms or critical weather conditions.
FIRE MANAGEMENT POLICY
The past goals of fire management on the National Forests were usually directed at reducing the number of acres burned in management units. Specific acreages were identified as limiting criteria. It was increasingly obvious that these goals needed to be reevaluated. A burned area goal ignores many facts. Reducing acreage burned. without considering benefits, may

KemPlateau 167
result in benefits averted rather than damage averted (Gorte and Gorte 1977). Prevention of damage does not necessarily involve stopping a fire at a given line; burned acreage is often unrelated to value losses (Zivnuska 1972). Reducing acreage burned should not go beyond the point where the cost of averting loss is greater than the potential loss (Gorte and Gorte 1977).
Goals are far better tied directly to the issue of economics rather than to the intermediary of acreage burned. This release will allow the inclusion of prescribed burning. modified suppression strategies, and natural fire management into integrated fire management planning.
In response to a new atmosphere created by the concept of integrated fire management. a revised fire management policy became effective in February, 1978 (Davis 1979). It states that:
The basic fire management policy on National Forest System land is to provide well planned and executed fire protection and fire use programs that are cost-effective and responsive to land and resource management goals and objectives. and supportive of the 1974 Forest and Rangeland Renewable Resources Planning Act resource outputs.
Success in implementing this new policy is most likely to be assured by making available a wide range of professional expertise on special planning units. Pilot projects, such as the Kern plateau, are essential to demonstrate the value of new approaches in fire management. In turn, this will help create confidence in the widespread application of integrated fire management concepts.
TABLE L Incidents of Unwanted Fires in Kern Plateau Since 1941
Decade No. lightning fires No. man-caused fires 1941-1950 84 12 1951-1959 180 8 1960-1969 200+ 24 1970-1977 466+ 35
The Sequoia and San Bernardino Forests in the Pacific Southwestern Region and two forests, each from other Forest Service Regions, were selected to develop a planning process that would lead to implementation of the new policy. We arranged with the Sequoia Forest to develop the process for implementing the new directive and to test the approach on fire management areas within the Kern Plateau Planning Unit. Our main goal was to develop and test a planning process that could be used to evaluate fire management alternatives and to establish fire management areas which would help minimize fire damages. The final product was a cost-effective initial attack strategy for each dispatch zone and a cost-effective suppression strategy in case initial attack failed.

168 Fire Technology
DEVELOPING THE PLAN
In developing the fire management plan for the Kern Plateau, we took the following successive steps: First, we divided the Plateau into fire management areas (Figure 1). These are intended to represent homogeneous resource values. Second. we mapped weather zones (Figure 2) and fire danger rating (fire behavior) compartments (Figure 3) for dispatching purposes. Each compartment contains homogeneous fuel type and slope classes, so that fires will tend to behave uniformly throughout the compartment. Third. we developed initial attack plans for specified fire weather conditions for each fire management area. Fourth, we developed optimum suppression strategy for fires that escaped FOCUS initial attacks. In this approach. we simulated a large fire in each fire management area. Fifth, we worked with resource managers in the Sequoia Forest to estimate the damages andior benefits in terms of specific units (board feet. AUMs. etc.), and these were then recorded in dollars. Sixth, based on the above procedures. we determined "allowable burn areas" for each fire management area in coordination with the resource managers.
SELECTING FIRE MANAGEMENT AREAS
The Kern Plateau was divided into fourteen fire management areas (Figure I), which are discrete areas of relatively homogeneous resource values. Each value area has its own dispatch plan and suppression strategy, while the entire Plateau was used in an analysis to determine the best mix of alternative fire management activities.
Proper selection of fire management areas is essential to their usefulness in the analysis for appropriate fire suppression strategies. Each area must be defined in such a way that a selected fire strategy would apply to most fires in the area. This preattack planning is the primary purpose for selecting fire management areas.
The following criteria were set for a fire management area delineation: • There must be enough areas to resolve differences in resource values.
management objectives, and initial attack and suppression strategies. • Areas must be logical assessment and planning units. The area must
have reasonably homogeneous resource values. If for example. one part of an area has high timber values, and the other part has no commercial timber value. the area would usually be divided into two areas.
• The fire management area must constitute a relatively tight fire compartment. In the same manner that ships contain compartments separated by bulkheads. fire management areas should be fairly isolated by fuel breaks. ridges. or natural breaks in fuels.
• Fire management areas correspond in some cases to preattack units (USDA, FS Preattack Handbook, 1970). Also they may conform with the landscape architect's concept of .•character type." an area of land with common distinguishing visual characteristics (USDA 1977).

169 KemPlateau
•
Figure 1. Fourteen fire management areas were sekcted for the Kern Plateau,

170 Fire Technology
• The selection of the unit should also be based on fire history, intensity of planning, special problem areas, and field utility.
These criteria often lead to watersheds or basins being designated as fire management areas.
LOCATING WEATHER ZONES AND STATIONS
Dispatch systems are presently handicapped because available data poorly represent the dispatch zones. However, Fosberg and Furman (1973), in an effort to identify a process that could be used to select fire weather zones, used a complex system employing the equilibrium moisture content adjusted for the fuel moisture of living material. They concluded, however, that both elevation and broad vegetation types correspond well with the climate types that resulted. Fosberg (1978) suggested that broad vegetation types be used to get a first approximation of the fire climate types in the area. They recommended using a broad vegetation map to determine the weather station locations. This analysis may reveal unneeded stations and misplaced stations (Figure 2).
MAPPING FIRE DANGER RATING COMPARTMENTS
Each fire management area was divided into fire behavior compartments for dispatching purposes (Figure 3). Each compartment contains a homogeneous fuel type and slope class, so fires are assumed to behave uniformly over the compartment. The minimum size of a compartment is 600 acres, because dispatchers occasionally have difficulty locating a fire within one-half mile on the initial report.
Fire behavior was calculated for each fire danger rating compartment; and dispatching levels, resource values, and optimum suppression strategies were calculated for the large fire management areas.
INITIAL ATTACK PLANNING
Initial attack planning must be done for specified fire weather conditions. An initial attack plan for average or moderate weather conditions would fail under severe fire weather, and a plan designed for extreme conditions would be too costly to be feasible under normal weather conditions. The standard solution is to have forces available or on reserve to handle most conditions and to cancel leaves and increase manning levels on ex' treme fire danger days. Faith in reserves has led to catastrophic situations in cases where forests called for reserves from other forests when these were committed at home. Such conditions are purported to have occurred about once each q.ecade. the last such occurrence being in 1970.

171 Kern Plateau
_ ......- .- -~ ~.' ;. ..,:,~.~.~ . .r r=-~_ r:~~~~:?:~ ~ "-- - ;; ...:.-..:!~~~
. / "'to' . '!"
'J. ~__ •...,'
-'- : . .;.
-.
h-:'-.~·· :: :0;'<' ..~-- - -.-
-~.
Figure 2. Weather zones, developed using vegetation maps, were used to determine if weather stations were properly located. Kernville weather area is bounded by the shaded border, while Bald Mountain is bounded by the ruled border. 42 = conifer forest; 32 = chaparral; JP = Jeffrey pine; BF = red fir; BS = basin sagebrush; PJ = pinyon juniper; CA = chamise.

172 Fire TechnologJ
Figure 3. The plateau was divided into fire: behavior compartments for dispatching '.,,.,.,, • fires.

Kern Plateau 173
In the process tested. FOCUS· is used to determine the optimal allocations and distributions of initial attack forces. Four alternative allocations are recommended for testing with FOCUS: (1) attack forces as they were in 1978. (2) attack forces as they were in a 1972 plan. (3) the better of (1) or (2), but without air attack, and (4) the best of (1), (2), or (3) with any small specific changes that local managers desire to test. FOCUS outputs will give initial attack costs, with damages and/or enhanced values calculated from the acreage burned. Most of these alternatives will have fires that escaped initial attack.
Next. suppression costs and damages of the initial attack (from FOCUS) and of the suppression efforts Urom fire modeling) are summed, and the enhanced values are subtracted to generate the total cost of each alternative. The alternatives are then ranked in order of cost. Damages averted and suppression cost averted for each alternative are then determined by subtracting costs from the next most expensive alternative. The best alternative is the one with the highest value of (enhanced values + damages averted + suppression cost averted) - (suppression costs + damages).
If FOCUS is not available to use in testing manning levels. then a process should be used that integrates fuel. locations, weather, and resource value data. Fuel and weather data are first combined to yield a fire danger rating. The process for generating the rating, which is displayed in Tables 2 and 3. is based on a system that is currently being revised. but serves as a guide. The fire danger rating is next weighed against the resource value per acre to determine the initial dispatch. The dispatch is planned separately for each dispatch zone (Table 4).
SUPPRESSION PLANNING FOR LARGE FIRES
Ideally, the technique chosen to find the optimum strategy would utilize a large file of data on fire occurrence. behavior. damages, and costs. However, these data are not currently available for any management units in the National Forest System, primarily due to the problem of assigning costs to damages. As a substitute for such data. the concept of the stylized situation (Mills 1978) was used in this study. In this approach, a large fire was simulated in each fire management area. Several alternative strategies that could be used in the suppression of that fire were modeled. and the optimum strategy was selected. based on economic models.
Modeling fires combined a variety of skills and areas of expertise. The work began in the field with mapping fuel types, resistance to control. and weather zones. A weather fuel/slope map was next made. separating fuel
·FOCUS (Fire Operational Characteristics Using Simulationl. is a unique computerized fire planning program developed by the Forest Service at the Riverside Fire Laboratory. The data base of the program consists of the locations. spread rates. fuel types. and j5I'0wth rates for historical fires. The program allows the fire manager to test any combination of attack forces at any desired basis through simulation.

174 Fire Technology
TABLE 2. Derivation of Plan Number
Plan Fuel Mochl number A B C D G
1 0-1 0-IS 0-2 0-7 O-S 2 2-3 19-30 3-S S-14 9-16 3 4-S 31-37 9-14 15-19 17-25 4 9+ 3S-44 15-1S 20-23 26-31 5 45+ 19+ 24+ 32+
1. Find burning index 1197S NFDR, for fuel model 2. Determine plan number 3. Go to Table 3
types by slope classes. Fiftieth and Nintieth percentile fire weather conditions were determined using several years of fire season observations, processed by FIRDAT.
Next, Albini monographs (Albini 1976) were used to determine the spread rates of headfires, and the R-5 computer wheel was used to determine the spread rates of backing fires. Spread rates of fires backing downhill were determined by changing settings on the R-5 computer wheel, but spread rates for fires backing against the wind were first converted to effective negative slopes using charts developed by Albini. To model the attack on a fire, a table was made that displayed the number of men available each new hour after detection. A second table was developed, based on Region 5 fireline handbook production rate charts, that showed the production rate of these men in each category of resistance to control
Points of origin of fires to be modeled were selected based on points that would spread into large fires. Fire spread rates under specific slope, fuel, and wind conditions were obtained from the spread rate tables and were used to generate fire perimeters through the use of vectors. The first vectors originated from the point of origin, and succeeding vectors originated from the subsequent fire perimeters. The fireline production table rates were used to model fireline construction progress around the burn perimeter as the fire advanced. Where applicable, no time was taken in constructing line along natural or man-made barriers. The Fireline Handbook (USDA 1975) was used to determine line production rates for bulldozers. The fireline was advanced around the fire until the fire was contained or until reinforcements arrived from outside the forest, whichever happened first.
TABLE 3. Derivation of FiN! Danger Rating
Ignition Component
1.'00",. Tn. PT
1 2 Plan Number Based on Bl
3 4 5
0-45 L L M H H 46-65 L M H H H 66-S0 SI+
M M
M H
H H
H H
H H
Use Plan Number from Table 2 and Ignition Component to determine Fire Danger Rating: L = Low. M =Medium, H == High.

Kern Plateau 175
Man hours on the fire and on mop-up were tallied and transferred to a costing table. Rehabilitation costs were included in mop-up costs. The number of acres burned was determined with a dot grid. The probability of success was determined through the addition of four weighted factors. Suppression costs, area of bum, and probability of success were transferred to a summary table.
Maps of the areas burned in each strategy (Figure 4) were included in a questionnaire, which was given to resource managers of the Sequoia. who were asked to estimate damages and benefits in terms of units (board feet, etc.). The damage and benefit estimates from these questionnaires were given dollar values using value guides presented in reports on the Resources Planning Act. The values of damages and benefits were transferred to a summary table. A least-cost-plus-Ioss model was then used to evaluate the costs and benefits of each alternative fire strategy. and the most costeffective strategy was selected for each fire management area (Table 4).
DETERMINING ALLOWABLE BURN ACREAGE
One of the objectives of this study was to develop a process for determining the number of acres that could be allowed to burn in each fire management area. The term "allowable burn" can be interpreted in two ways. First,
TAB1.E 4. Dispatch Prescriptions for Each Fire Management Area
Dispatch Adjective
Low Medium High
Fire Management Area
Initial Suppres· attack sion
strategy' strategy
Initial attack
strategy
Suppres· sian
strategy
Initial attack
stra.tegy
Suppres· sion
stra.tegy
Baker M' B M B F A Basin F' A F A F A Beach F A F A F A Brush M B M B F' B Clover F A F A F A Curlis F A F A F' C Cyrus Domelands
F M
A B
F M
A B
F M
A B
Golden Trout M B M B F' C Horse F A F A F A Lookout M B M B F' C Rim M B M B F C Smith M C M C F' C True M C M C F' C
I Three strategies were modeled IA = direct, B = indirect. C = combination of direct and indirect I. The fll-vored strategy was the cost-effective strategy that had the maximum benefits·minus-costs. Low and Medium dispatch strategies were modeled under 50th percentile weather conditions. while High dispatch was modeled with 90th percentile weather.
, M = Modified initial attack. i.e. no air tankers. • F = Full capability initial attack. , Although the modeling incidstes that these fire management areas have lower priority,
full attack is recommended through a trial phase of this plan.

176 Fire Technology
.,... -
t.
/'.fr. \.'L,_'
"/ " fr;;.; ..':. .~ .~--....
.f).' ~., "-., . ~
'.,
Figure 4. Forest fires were modeled in each fire management zone to allow resource managers an opportunity to assess thR probable damage and costs that would occur. Damages and costs were not related to the size of the bum, but to the resources in each management zone. Triangular symbols represent the origin of fire. Fire-burned areas are outlined by shaded borders. Overlapping fi1'fl' bum areas are defined by the ruled areas.
I
Kern Plat.eau 177
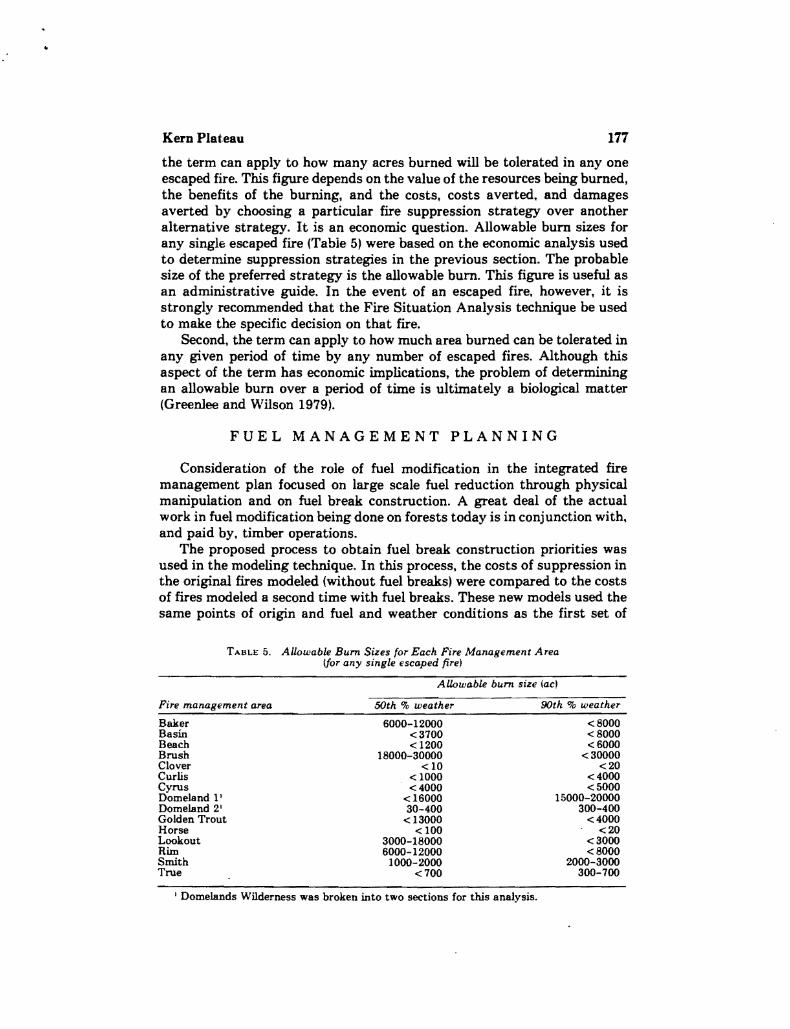
the term can apply to how many acres burned will be tolerated in anyone escaped fire. This figure depends on the value of the resources being burned, the benefits of the burning, and the costs, costs averted. and damages averted by choosing a particular fire suppression strategy over another alternative strategy. It is an economic question. Allowable burn sizes for any single escaped fire (Tabie 5) were based on the economic analysis used to determine suppression strategies in the previous section. The probable size of the preferred strategy is the allowable burn. This figure is useful as an administrative guide. In the event of an escaped fire. however, it is strongly recommended that the Fire Situation Analysis technique be used to make the specific decision on that fire.
Second, the term can apply to how much area burned can be tolerated in any given period of time by any number of escaped fires. Although this aspect of the term has economic implications. the problem of determining an allowable burn over a period of time is ultimately a biological matter (Greenlee and Wilson 1979).
FUEL MANAGEMENT PLANNING
Consideration of the role of fuel modification in the integrated fire management plan focused on large scale fuel reduction through physical manipulation and on fuel break construction. A great deal of the actual work in fuel modification being done on forests today is in conjunction with, and paid by, timber operations.
The proposed process to obtain fuel break construction priorities was used in the modeling technique. In this process, the costs of suppression in the original fires modeled (without fuel breaks) were compared to the costs of fires modeled a second time with fuel breaks. These new models used the same points of origin and fuel and weather conditions as the first set of
TABLE 6. AUowable Bum Sizes for Each Fire Management Area (for any single escaped fire)
AUowable bum size lacl
Fire management area 50th % weather 90th % weather
Baker Basin Beach Brush Clover Curlis Cyrus Domeland I' Domeland 2' Golden Trout Horse Lookout Rim Smith True
6000-12000 <3700 <1200
18000-30000 <10
<1000 <4000
< 16000 30-400
<13000 < 100
3000-18000 6000-12000
1000-2000 <700
<8000 <8000 <6000
<30000 <20
<4000 <5000
16000-20000 300-400
<4000 <20
<3000 <8000
2000-3000 300-700
Domelands Wilderness was broken into two sections for this analysis.

178 Fire Technology
models. The total value of benefits-minus-costs of the new models was added. to the cost of fuel break construction and this total was added. to the total costs of the first set of models. If fuel break construction reduced costs, then that fuel break was given a high priority.
Fuel modification is the real key to dollar savings in the long-run in fire management. Prescribed burning is gaining in popularity as a modification tool as the savings become more apparent. Per acre values developed through this planning process were used to decide fuel management priorities (Table 6).
Before National Forests were established, natural fires were prevalent in many areas, particularly at high elevations. In the early part of this century, indiscriminate burning by settlers led to a suppression policy. This policy was inconsistent in wilderness areas because the Wilderness Act states wilderness should be "protected and managed so as to preserve its natural conditions."
The process of selecting areas for wilderness fire management can be aided by the use of fire modeling. Models can indicate how large fires could become, which portions of the wilderness boundaries may be breached by fires within, and whether fuel modification may be needed near or, if policy permits, within the boundary.
FIRE PREVENTION PLANS
We recommend that fire management areas be used as a basis for fire prevention planning. The resource values per acre used to prioritize fuel modification in each fire management area should also be used. to guide fire prevention priorities. In addition. a new system for prevention action programs being developed at the Riverside Fire Laboratory (CROSSTABS) should be used to identify potential fire prevention problem areas. Prevention materials should mention the constructive uses of fire including both prescribed. burning and prescribed natural fires.
TABLE 6. Prevention and Fuel Reduction Priorities
Fire management Resource value Prevention and fuel area per acre ($1 reduction priority
Lookout 355.22 1 True 198.99 2 Smith 160.92 3 Beach 160.06 4 Brush 103.54 5 Cyrus Golden Trout
89.24 62.15
6 7
Basin 44.89 8 Horse 22.58 9 Rim (and Bakerl Domelands
7.92 4.84
10 and 11 12
Curlis 5.65 13 Clover 3LSO 14

KemPlateau 179
FIRE DETECTION PLANS
We recommend that fire management areas be used as a basis for fire detection planning. Seen-area maps should be periodically revised in order to evaluate recent and planned logging operations, new fuel data and changes in fuel with time. Blind spots with high fuel hazards should receive additional detection. Lightning detection systems, such as those being in· stalled by BLM Bishop, California and Las Vegas, Nevada, may be of value in detecting cloud-to-ground strikes in high value fire management areas.
BEST MIX OF FIRE MANAGEMENT ACTIVITIES
Fire managers should allocate their budgets to the various fire management activities (prevention, detection, initial attack, large fire suppression, fuel management, and natural fire management). so that a cost-effective combination of activity levels is utilized. The best criterion of success would be the maximization of benefits-minus-costs. Optimization can be done by using marginal analysis. but production functions are not available at present for prevention and detection. However, we did use the optimization model to get the best mix of initial attack, suppression, and fuel modification based on the FOCUS simulation approach.
One of the most serious problems in ascertaining the best mix occurs because fuel modification funds are so scarce. In general, prefire funds for the National Forests are limited. Yet, when fires escape initial attack. suppression funds seem unlimited. As Kourtz (1972) pointed out, adequate prefire funds will, in the long run, result in substantial savings of fire fighting funds to the American taxpayer.
As with any study that uses existing technology to develop a process, we made a few assumptions, which should be considered in evaluating the results. Here are the most important:
• Costs of fuel modification and suppression were derived from local experience and the Forest Service Handbook.
• Weather conditions were not based on probabilistic or a variancebased model. but were derived from the ninetieth and fiftieth percentile fire weather conditions.
• Resource values were adopted from the Resource Planning Act materials.
• All costs and benefits are present value, and the timing of various impacts, expenses, and benefits is ignored.
• A simple model was constructed to determine the probability of fire containment, and suppression modeling relied on certain arrival times for available forces.

180 Fire Technology
SUMMARY AND CONCLUSIONS
We found that it was feasible to develop a prototype cost-effective fire management system for a fairly typical resource management unit of the Sierra Nevada. Existing technology was used in developing a plan that would meet the requirements of the Forest Service's revised fire management policy, which became effective in early 1978.
We divided the high value Kern Plateau Planning Unit into logical fire management areas and weather zones. These are intended to represent homogeneous resource values. Fire danger rating (fire behavior) compartments containing homogeneous fuels and slopes were mapped. Initial attack plans were developed for each fire management area using FOCUS. Then, for fires that escaped FOCUS initial attacks, we developed optimum suppression strategies. Finally, we worked closely with resource managers of the Sequoia National Forest in estimating the potential damages or benefits of fires in each fire management area and determined the "allowable burn areas."
By no means is the process we developed for designing cost-effective plans for the Kern Plateau the final answer. Yet, we believe that other management units in the National Forest System could utilize the approach to good advantage and reduce overall fire management costs.
Finally, there needs to be additional research and development on the prevention and detection elements of the fire management system, so that reliable production functions can be used in the fire planning process.
REFERENCES Albini, F. A., "Estimating Wildfire Behavior and Effects." General Technical Report
INT-30, Intennountain Forest and Range Experiment Station. Forest Service, USDA, Ogden, UT 11976). 92 pp.
Bolander, D., Carter, J., Dyrland, D., Erwin, B., and Gordon. B., Brush14nd Management Guide for Economic Analysis: A First Appro:cimation of the Re14tive Economics ofProgramAlternatives, Region 5, Forest Service. USDA. 1972. 62 pp.
Countryman. C. M.• "Old Growth Conversion Also Converts Fire Climate." Proceedings of the Society of American Foresters Annual Meeting, Portland. Oregon. 1955.
Davis. J. B .. "A New Fire Management Policy on Forest Service Lands," Fire Technology, Vol. 15. No.1 (1979), pp. 43-50.
Fosberg, M. A .• personal communication. Riverside Fire Laboratory, Forest Service. USDA. Riverside, CA. 1978.
Fosberg, M. A. and Funnan. R. W., "Fire Climates in the Southwest," Agricultural Meteorology, Vol. 12 (1973), pp. 17-34.
Gorte, J. K. and Gorte, R. W., "The Economic Implications of Integrating Fire Management and Land Use Planning: A Problem Analysis," draft manuscript, Intennountain Forest and Range Experiment Station, Forest Service, USDA. Ogden. UT (1977). 33 PI?,.
Greenlee. J. M. and Wilson. C. C., "Cost-Effective Fire Management: A Pilot Study," Forest Service. USDA, Sequoia National Forest. Proterville. CA (1979). 279 pp.
Kourtz, P. H .• "Modern Technology and Fire Control." Fire in the Environment Symposium Proceedings, May 1-5. 1972. Denver. CO. Forest Service. USDA. pp. 115-120.
Mills. T .• "Fire Management Planning and Economics," Pacific Southwest Project PSW· RWU-2111, Riverside Fire Laboratory. Forest Service. USDA. Riverside. CA. 1978. 11 pp.
Policy Analysis Staff. "Evaluation of Fire Management Activities on National Forests," Policy Analysis Staff Report, Forest Service, USDA, Washington. DC. 1977. 127 pp.
Fireline Handbook. Region 5. Forest Service. USDA. San Francisco, CA. 1975. National Forest Landscape Management. Volume 2. Forest Service. USDA. 1977.
Superintendent of Documents. U.S. Government Printing Office, Washington. DC, 47 pp. Zivnuska, J. A .• "Economic Tradeoffs in Fire Management." Fire in the Environment
Symposium Proceedings, May 1-5. 1972. Denver. CO, Forest Service. USDA, pp. 69-74.
Copyright © 2022 FDOKUMEN