Determination of a worst-case product for RTH 258
82
Advanced master Industrial Pharmacy Academic year 2016-2017 Delphine STEYAERT Academic promotor Prof. Dr. Apr. Guy Van den Mooter Industrial promotor Apr. Frank De Buysser Supervisor Apr. Katrien Aerts Commissioners Prof. Dr. Apr. Thomas De Beer Prof. Dr. Apr. Bart De Spiegeleer Prof. Dr. Apr. Roger Kemel Prof. Dr. Filip Kiekens Prof. Dr. Apr. Guy Van den Mooter Prof. Dr. Apr. Yvan Vander Heyden Cleaning validation of biologicals: Determination of a worst-case product for RTH 258
-
Upload
khangminh22 -
Category
Documents
-
view
0 -
download
0
Transcript of Determination of a worst-case product for RTH 258

Advanced master Industrial Pharmacy
Academic year 2016-2017
Delphine STEYAERT
Academic promotor
Prof. Dr. Apr. Guy Van den Mooter
Industrial promotor
Apr. Frank De Buysser
Supervisor
Apr. Katrien Aerts
Commissioners
Prof. Dr. Apr. Thomas De Beer Prof. Dr. Apr. Bart De Spiegeleer
Prof. Dr. Apr. Roger Kemel Prof. Dr. Filip Kiekens
Prof. Dr. Apr. Guy Van den Mooter Prof. Dr. Apr. Yvan Vander Heyden
Cleaning validation of biologicals:
Determination of a worst-case product for RTH 258

Deze pagina is niet beschikbaar omdat ze persoonsgegevens bevat.Universiteitsbibliotheek Gent, 2021.
This page is not available because it contains personal information.Ghent University, Library, 2021.

ABSTRACT
Before pharmaceutical companies can produce a product several validation studies have to be done,
such as cleaning validation. The main objective of cleaning validation is to minimize the risk of cross-
contamination, a topic which has become more relevant due to the evolution of medicines. During the
last decades, more potent and complex drugs, such as biologicals, have been developed in which
pharmaceutical companies show increasing interest. In order to test new compounds or drugs in the
context of cleaning validation, large amounts of these valuable and expensive products would be lost.
Therefore, alternatives to these molecules are looked for and used as worst-case product. Moreover,
if one worst-case product is found for several products, one cleaning validation of the worst-case
product can cover the validation of the rest of the products, saving time and money.
The goal of this thesis is to find a good alternative to use as worst-case product for the cleaning
validation of brolucizumab (formerly RTH 258), a potentially new drug for the treatment of wet age-
related macular degeneration. The following products were investigated as possible worst-case
product: four vegetable proteins, namely soy peptone, brown rice protein, pea protein isolate, whey
protein isolate and one chemical substance riboflavin. Afterwards, the cleaning validation of reactor
88, which can be used for the production of the RTH 258 formulation, with the predetermined worst-
case product was done.
In order to determine a worst-case product for RTH 258, cleanability and solubility tests were
performed for the five candidate worst-case products. Such a worst-case product should be harder to
clean than the reference product by the investigated conditions, so as to obtain cleaning settings that
assure an acceptable cleaning of the reference product. Based on the results of the cleanability tests
it can be concluded that all of the products are harder to clean than RTH 258, except for soy peptone
no conclusive statements can be made. In addition, a worst-case product should be less soluble in the
investigated cleaning agent than the reference product, indicating a more difficult cleaning by the
investigated conditions. For all of the five products, the solubility in water was lower than the solubility
of RTH 258 in water. Combining the results of the cleanability and solubility experiments, riboflavin,
‘whey protein isolate/riboflavin’, pea protein isolate and brown rice protein show to be the best
candidates to use as worst-case product for RTH 258. However, the final ease of cleaning should also
be taken into account in order to choose the ultimate, most suitable product. Therefore it might be
better to select riboflavin or ‘whey protein isolate/riboflavin’ as worst-case product, since their
cleanability results are less different from RTH 258 than the other two products. To work more
efficiently only one substance should be used, therefore it probably is better to choose for riboflavin

alone. Moreover, riboflavin has the advantage of being easily detectable due to its fluorescent
character.
The cleaning validation of reactor 88, which can be used for the production of the RTH 258 formulation,
was performed using soy peptone. The choice for this protein resulted from the fact that an ELISA kit
specific for soy proteins was already available in-house at the start of the project. First, the recovery
of soy was determined on stainless steel (68.20%) and on glass (75.84%). The criterion determining the
acceptable amount of residue was calculated by the ‘Permitted Daily Exposure’ principle and resulted
in a brown solution, which is not useful: if a rinsing sample would have this color, one would never
conclude that the reactor is clean. The criterion determining the acceptable amount of residue, as
calculated by the 1/1000 principle, gave low results. Therefore, a more specific analysis method such
as ELISA is necessary, instead of the non-specific analysis method, TOC. Since the first cleaning did not
give satisfying results the cleaning procedure was modified. More favorable results were obtained
after the second cleaning, however, some samples still exceeded their limits. The results from the third
cleaning were doubtful and therefore neglected. Furthermore, the results of the fourth cleaning are
unreliable due to high results of the blank samples. It could be concluded that a more specific analysis
method is required to analyze the contribution of soy to the result of the sample. TOC is a non-specific
method and will also include other substances. ELISA could be a good alternative for TOC, however
some problems were experienced (Master thesis, Van de Voorde - Onderbeke Julie, 2017).
In conclusion, no conclusive statements can be made about the cleanability of soy peptone, extra tests
should be performed to conclude if soy is suitable as worst-case product for RTH 258 or not. However
the other four products could be used as worst-case product for RTH 258 based on the obtained
information. Nevertheless, we contend that the analysis method should change to a more specific
method to measure the exact amount of soy residue in order to obtain more reliable results. Moreover,
cleaning validation has to be done by three acceptable cleaning cycles, which has not occurred due to
a lack of time.

ACKNOWLEDGEMENT
First of all I want to thank Prof. Dr. Apr. Guy Van den Mooter to support my master
thesis and to give some useful advice.
Moreover I would like to thank Apr. Frank De Buysser for giving me the chance to
perform my master thesis in the facilities of Alcon, Puurs. I have learned a lot during the
few weeks I was here.
I definitely want to thank my supervisor, Apr. Katrien Aerts for all of the support during
the project. In an enthusiastic way she guided me through my first experiences in the
industry. I learned a lot about the project, but also about how a company works due to
multiple tours around the company. Without her I would never could have achieved
this.
Furthermore I want to thank the other colleagues of the department of Validation at
Alcon for all the sweets and the pleasant environment. Everybody was always helpful
and encouraging.
Special thanks for Julie Van de Voorde – Onderbeke for all the fun times we have
experienced and the encouragement during our project.
I also want to thank all of my friends for the pep talks during this experience.
Special thanks for Stijn to help me complete this thesis. Thank you for listening to me
and give me advice. You always knew a way to make me happy and let me forget all of
my worries for a while. I love you.
At least I also want to thank my parents and brother for all of the support and
encouragement.

Table of contents
1. Introduction ..................................................................................................................................... 1
1.1. Biologicals ................................................................................................................................ 1
1.1.1. Biologicals for the treatment of age-related macular degeneration ...................... 2
1.1.1.1. Disease mechanism ................................................................................................. 2
1.1.1.2. VEGF inhibitors: working mechanism and history................................................... 3
1.2. Cleaning validation .................................................................................................................. 6
1.2.1. Important steps during cleaning validation ............................................................ 7
1.2.1.1. Residue identification .............................................................................................. 7
1.2.1.2. Equipment characterization .................................................................................... 8
1.2.1.3. Product and equipment grouping ........................................................................... 8
1.2.1.4. Selection of the cleaning agent, SOP development and training ............................ 9
1.2.1.5. Identification of the sampling site and sampling method ..................................... 11
1.2.1.6. Determination of limits ......................................................................................... 12
1.2.1.7. Analysis selection and validation ........................................................................... 15
1.2.2. Microbiological contamination ............................................................................. 16
1.2.3. Clean hold time - Dirty hold time .......................................................................... 16
1.2.4. Cleaning validation of biologicals .......................................................................... 16
1.2.5. Determination of a worst-case product ................................................................ 17
1.3. Alternatives to biologicals for cleaning validation ................................................................ 19
1.3.1. Theoretical discussion ........................................................................................... 19
1.3.2. Substances to be investigated ............................................................................... 20
1.3.2.1. Soy peptone ........................................................................................................... 20
1.3.2.2. Brown rice protein ................................................................................................. 20
1.3.2.3. Pea protein isolate ................................................................................................. 20
1.3.2.4. Whey protein isolate ............................................................................................. 20
1.3.2.5. Riboflavin ............................................................................................................... 20
2. Objectives ...................................................................................................................................... 21
3. Materials and Methods ................................................................................................................. 22
3.1. Materials ................................................................................................................................ 22
3.1.1. Reagents ................................................................................................................ 22
3.1.2. Supplies.................................................................................................................. 22
3.1.3. Equipment ............................................................................................................. 22
3.2. Methods ................................................................................................................................ 23
3.2.1. Molybdenum test .................................................................................................. 23

3.2.2. Determination of the cleanability ......................................................................... 23
3.2.3. Determination of the solubility ............................................................................. 24
3.2.4. Cleaning validation ................................................................................................ 25
3.2.4.1. Risk assessment ..................................................................................................... 25
3.2.4.2. Determination of the recovery of swabbing ......................................................... 25
3.2.4.3. Recalculation of the criteria for sampling ............................................................. 27
3.2.4.4. Determination of the worst-case places of the reactor ........................................ 31
3.2.4.5. Schematic overview of a cleaning cycle ................................................................ 31
3.2.4.6. Soiling of the reactor ............................................................................................. 32
3.2.4.7. Cleaning of the reactor .......................................................................................... 32
3.2.4.8. Chemical and microbiological sampling ................................................................ 33
4. Results and discussion ................................................................................................................... 36
4.1. Molybdenum test .................................................................................................................. 36
4.2. Determination of the cleanability ......................................................................................... 36
4.2.1. RTH 258 ................................................................................................................. 36
4.2.2. Soy peptone ........................................................................................................... 36
4.2.3. Brown rice protein ................................................................................................. 37
4.2.4. Pea protein isolate ................................................................................................. 38
4.2.5. Whey protein isolate ............................................................................................. 39
4.2.6. Riboflavin ............................................................................................................... 39
4.2.7. Overall conclusion cleanability .............................................................................. 40
4.3. Determination of the solubility ............................................................................................. 41
4.3.1. Soy peptone ........................................................................................................... 41
4.3.2. Brown rice protein ................................................................................................. 41
4.3.3. Pea protein isolate ................................................................................................. 42
4.3.4. Whey protein isolate ............................................................................................. 43
4.3.5. Riboflavin ............................................................................................................... 43
4.3.6. Overall conclusion solubility .................................................................................. 44
4.4. Cleaning validation ................................................................................................................ 45
4.4.1. Determination of the recovery of swabbing on stainless steel and glass ............. 45
4.4.2. Recalculation of the criteria for sampling ............................................................. 46
4.4.3. Chemical and microbiological sampling ................................................................ 47
4.4.3.1. Cleaning 1 .............................................................................................................. 47
4.4.3.2. Cleaning 2 .............................................................................................................. 49
4.4.3.3. Cleaning 3 .............................................................................................................. 50
4.4.3.4. Cleaning 4 .............................................................................................................. 52

4.4.3.5. Overall conclusion cleaning validation .................................................................. 53
5. Conclusion ..................................................................................................................................... 54
6. References ..................................................................................................................................... 57
7. Appendix ........................................................................................................................................ 59
7.1. Brinox Reactor 88 .................................................................................................................. 59
7.2. Calculation of the surface of reactor 88 ................................................................................ 59
7.3. Sampling plan of reactor 88 .................................................................................................. 61
7.4. Cleanability results ................................................................................................................ 62
7.4.1. Time lapse images of ‘RTH 258/riboflavin’ on the stainless steel tube................. 62
7.4.2. Time lapse images of ‘soy peptone/riboflavin’ on stainless steel tube ................ 63
7.4.3. Time lapse images of ‘brown rice protein/riboflavin’ on the stainless steel tube 64
7.4.4. Time lapse images of ‘pea protein isolate/riboflavin’ on the stainless steel tube 65
7.4.5. Time lapse images of ‘whey protein isolate/riboflavin’ on the stainless steel ........
tube ....................................................................................................................... 66
7.4.6. Time lapse images of riboflavin on the stainless steel tube .................................. 67
7.5. Solubility – calibration curve ................................................................................................. 68
7.5.1. Soy peptone ........................................................................................................... 68
7.5.2. Brown rice protein ................................................................................................. 69
7.5.3. Pea protein isolate ................................................................................................. 70
7.5.4. Whey protein isolate ............................................................................................. 71
7.5.5. Riboflavin ............................................................................................................... 72

LIST OF ABBREVIATIONS
AMD Age-related Macular Degeneration
API Active Pharmaceutical Product
BSE Bovine Spongiform Encephalopathy
BSL Bulk Syringe Line
CFU Colony Forming Units
CIP Clean-In-Place
CNV Choroidal Neovascularization
FTIR Fourier Transform Infrared
HPLC High Performance Liquid Chromatography
INN International Nonproprietary Names
MS Mass Spectrometry
NaOH Sodium hydroxide
P Octanol-water partition coefficient
PDE Permitted Daily Exposure
SOP Standard Operating Procedure
TACT Time, Action, Concentration/Chemistry, Temperature
TOC Total Organic Carbon
VEGF Vascular Endothelial Growth Factor
WHO World Health Organization
WINS Water, Individual, Nature of the soil, Surface
λmax Wavelength giving maximal absorbance
Brolucizumab = RTH 258
1
1. Introduction
1.1. Biologicals
Biologicals, commonly referred to as biopharmaceuticals or biologics, are medicinal products that are
manufactured in or extracted from biological sources. One of the first examples is insulin, previously
extracted from animals, but now more produced using modern molecular biology technology. The
interest in biologicals strongly increased in the last decade, due to the discovery of many targets as a
result of the expanding genetic knowledge and the growing understanding of cell processes and
diseases. In this way, recently discovered biologicals provided new perspectives for the treatment of
cancer, cystic fibrosis and diabetes [1].
Despite most drugs being manufactured by chemical synthesis, biologicals form a group of medicines
that are produced in a living system, such as microorganisms or plant and animal derived cells. The
production of many biologicals involves the use of recombinant DNA technology, a fast growing field
based on combining DNA from different organisms in order to produce the product of interest [2]. To
do so, a certain DNA fragment is isolated from human cells and inserted into a suitable expression
vector, which is then be introduced into a bacterial or mammalian cell system. The cells containing the
vector will thereupon express the gene of interest, after which the recombinant protein can be
conducted to further downstream processing steps [1].
The enormous interest in biologicals is mainly due to their high selectivity and potent therapeutic
efficacy, resulting in limited side effects. Furthermore, their behavior is easier to predict under in vivo
conditions. Unfortunately, there are also disadvantages associated with biologicals. Short plasma half-
lives compel the patients to take the drug several times a day, resulting in poor patient compliance.
Biologicals are typically very large and complex molecules, hence, there is a greater chance for an
immune response. The immune system will consider the biological as foreign and will eliminate the
drug. The size of the drug will also limit the route of administration to injection or infusion [1].
Moreover, in contrast to chemical drugs which are generally more pure, better characterized and easy
to produce, the production process of biologics is more complex, therefore giving rise to smaller
quantities. Finally, physical conditions need to be fixed on behalf of the stability of the biological
molecules, resulting in an increased price tag.
A few examples of biologicals are peptides, proteins, antibodies, small interfering RNAs and enzymes
[3]. Three monoclonal antibodies will be discussed below.

2
1.1.1. Biologicals for the treatment of age-related macular degeneration
1.1.1.1. Disease mechanism
The most important cause of severe, irreversible vision loss among people with the age of fifty and
older is age-related macular degeneration (AMD). This condition is characterized by degeneration of
the oval-shaped pigmented region near the center of the retina, the macula, responsible for observing
the central part of our field of vision, which is important for ordinary daily activities such as reading,
driving and recognizing faces (Figure 1.1). The macula consists of millions of photoreceptors, most of
which are cones providing detail and color. These photoreceptors continuously capture light signals,
which are translated into electrical signals by the retina. These electrical signals are sent through the
optic nerve to the brain, where they are translated into the image what is called our vision.
Fig. 1.1: The anatomy of the eye, with the macula framed in red [4]
When the macula is damaged, the central region of the field of view will be blurry, deformed and dark,
as can be seen in Figure 1.2 [5]. The term AMD comprises two different pathologies, a dry and wet
form. The dry form of AMD, affecting almost 90% of AMD patients, is characterized by yellow protein
deposits in the macula. In more advanced stages of dry AMD, the layers of the macula get progressively
thinner and less functional leading to geographic atrophy and blind spots in the center of the vision.
The exact cause of dry AMD is unknown and neither does an approved treatment exist, although
several clinical trials are underway [6]. The wet form of AMD is characterized by choroidal
neovascularization (CNV) or the growth of new, pathologic blood vessels from under the retina toward
the macula. Wet AMD develops more quickly and severely than the dry form, affecting almost 10-15%
of AMD patients. However, almost 90% of cases who suffer from severe vision loss are due to wet
AMD. One of the most critical and thoroughly studied activators of angiogenesis in wet AMD is the
vascular endothelial growth factor (VEGF) [7].

3
Fig. 1.2: The effect of wet AMD on your vision [8]
The standard treatment for wet AMD is VEGF inhibitors. Nevertheless, the disease can also be treated
using several other biologicals and drugs, such as tyrosine kinase inhibitors, pigment epithelium-
derived factor, nicotinic acetylcholine receptor antagonists, small interfering RNA and sirulimus.
1.1.1.2. VEGF inhibitors: working mechanism and history
VEGF inhibitors or anti-VEGF drugs inhibit the effect of VEGF by binding to the protein itself. Due to
the competitive inhibition of VEGF, the growth factor is no longer able to bind its receptors VEGFR-1
and VEGFR-2, thus, preventing VEGF of stimulating angiogenesis and leakage from blood vessels, the
main causes of wet AMD. VEGF inhibitors are injected into the vitreous by a qualified ophthalmologist
where it binds VEGF (Figure 1.3) [9].
Fig. 1.3: The mode of action of VEGF inhibitors [10]
Examples of VEGF inhibitors used in the treatment of wet AMD are ranibizumab, bevacizumab and
brolucizumab. The suffix -zumab, according to the guidelines for International Nonproprietary Names
(INN) by the World Health Organization (WHO), indicates that these molecules are humanized
monoclonal antibodies, with humanized signifying a 90-95% human nature of the molecules making
them therefore less likely to elicit an immune response. Other INN suffixes are -momab, which

4
indicates that the monoclonal antibodies are 100% murine, -iximab, where 60-70% of the antibodies
is human, and -mumab for antibodies that are 100% human [11].
Ranibizumab (Lucentis®, Genentech), on the Belgian market since 2007 by Novartis, was the first drug
approved for the treatment of wet AMD [12]. The drug is a humanized monoclonal antibody fragment
which is produced in Escherichia coli cells by recombinant DNA technology and has a high affinity
towards the VEGF-A isoforms, such as VEGF110, VEGF121 and VEGF165. Patients suffering from wet AMD
need one injection per month until maximum visual acuity is obtained and/or until signs of disease
activity have disappeared. For most patients, three or more consecutive, monthly injections are initially
needed. Studies have shown that 30-40% of the patients experience visual improvement, the best of
which were determined in patients with non-advanced wet AMD and younger patients [13].
Despite the promising results for the patients, the high cost of Lucentis® (€686 per syringe [14]) forced
scientists to look for a low-cost alternative, resulting in the discovery of bevacizumab (Avastin®,
Genentech). This drug is approved for the treatment of certain metastatic cancers, such as colon
cancer, lung cancer and ovarian cancer. However, ophthalmologists use bevacizumab off-label, since
the drug has not yet been approved by the Food and Drug Administration for the treatment of wet
AMD [2]. Although bevacizumab differs from ranibizumab in structure, molecular size and half-life,
research has shown comparable efficiency and safety. Moreover, Avastin® (€327 per syringe [14]) costs
more than 50% less than Lucentis® [15, 16].
Currently, phase 3 clinical trials for brolucizumab (formerly RTH 258), a potentially new drug for the
treatment of wet AMD, are ongoing. The anti-VEGF antibody fragment is developed by ESBAtech
(Schlieren, Switzerland) and evaluated in a series of clinical trials by Novartis. Brolucizumab and
ranibizumab have a similar mode of action, therapeutic dose, mode of administration, binding kinetics
and other kinetic specifications. It is a fusion protein with a molecular weight of 26.3 kDa, making it
the smallest VEGF inhibitor (Figure 1.4). Its small size results in an outstanding tissue penetration and
the ability to administer a higher dose of the drug, potentially leading to a longer effect, which in turn
is positive in the context of patient compliance due to the reduction of treatment frequency [9, 17].
Fig. 1.4: Comparison of structure and molecular size between ranibizumab and brolucizumab [9]

5
Some physicochemical properties of brolucizumab are already known. It has an isoelectric point of 5.25
and a solubility of 60 mg/mL in 15 mM citrate, 6.75% sucrose, 0.05% Tween 80 when the pH is adjusted
to 6.75 with hydrochloric acid. Furthermore, it has a solubility of 300mg/mL in water. The composition
of the formulation is represented in Table 1.1 [18].
Table 1.1: Composition of the formulation of brolucizumab. The quantities of each component are not determined at this moment. [18]
Chemical name Weight percentage (%) Function
RTH 258 = brolucizumab 12 Active ingredient
Citric acid (Monohydrate) - Buffering agent
Trisodium citrate (Dihydrate) - Buffering agent
Sucrose - Tonicity agent
Polysorbate 80 - Solubilizing agent
Hydrochloric Acid - pH adjust
Sodium Hydroxide - pH adjust
Water for injection q.s. 100 Vehicle

6
1.2. Cleaning validation
Although cleaning has always been a part of GMP regulations, it has received little attention in the
past. In 1996 however, the FDA suggested revisions to the GMPs in order to redefine the
manufacturing process, beginning with the cleaning process. One aspect of this process is cleaning
validation, a topic that people commonly know the least about [19, 20]. The FDA’s requirement
regarding cleaning validation is the necessity to have documented evidence to guarantee removal of
residues to predetermined levels of acceptability. Therefore, a minimum of usually three consecutive
successful trials are needed.
Cleaning validation is a multidisciplinary activity, where one has to define the equipment, understand
the properties of the drug and describe the analytical methods. Moreover, how to sample and collect
residues from surfaces has to be known. This requires expertise of different disciplines and lots of
interdisciplinary cooperation. An orderly approach to cleaning validation is needed in order to support
all activities in a scientific way, a flow chart is shown in Figure 1.5.
Fig. 1.5: Cleaning validation process flow chart [21]

7
The main objective of cleaning validation is to minimize the risk of cross-contamination, a topic which
has become more relevant due to the evolution of medicines. During the last decades, more potent
and complex drugs have been developed in which pharmaceutical companies show increasing interest.
The complexity of these medicines, however, produce a greater risk of interactions between these
products, resulting in damaging effects to patients [20].
1.2.1. Important steps during cleaning validation
1.2.1.1. Residue identification
The identification of residues is the first step in performing a cleaning validation, which will determine
the consecutive steps of the validation process. One has to take into account the potential presence
of a variety of residues, ranging from Active Pharmaceutical Products (API(s)), excipients of the
formulation and metabolites to cleaning agents, precursors or starting material and buffers.
As a first screening, nonspecific methods, such as Total Organic Carbon (TOC), determination of the pH
and conductivity, can be used to look for all types of residues. Next, specific methods, such as High
Performance Liquid Chromatography (HPLC), Mass Spectrometry (MS) and Fourier Transform Infrared
(FTIR) spectroscopy, are able to identify specific residue(s) of interest, although requiring more time
and money.
The most important residues are APIs, precursors, cleaning agents, and preservatives, since they could
potentially harm patients. API and precursors exhibit a certain activity while cleaning agents are not
intended for consumption and preservatives could be toxic. During cleaning validation, it is preferred
to consider all possible residues and choose the most important ones for further investigation.
To determine whether a residue is important or not five selection criteria are defined:
Residues that define the dosage form or process.
Residues that are the most active or toxic.
Residues that would damage the quality, purity, efficacy and appearance of the next batch.
Residues that would damage the next process.
Residues that are the hardest to remove.
During the cleaning process, it is important to realize that cleaning could potentially change properties
of the residues. Physicochemical changes of residues on the surface can take place due to alkaline or
acid conditions, the presence of air or heat during cleaning. Therefore, the influence of these
degradation products or denatured materials on the cleaning process has to be kept in mind [19, 20].

8
For example, in the case of biotechnological products degradation is a common issue during cleaning
validation. Proteins will degrade into smaller fragments or larger molecules can be formed. This
degradation is the result of hot, aqueous, alkaline or acidic cleaning conditions. Several specific
methods exist for the identification of such degradants [21].
1.2.1.2. Equipment characterization
Besides the removal of residues, it is essential that all the pieces of the equipment associated with the
process have been cleaned to acceptable levels in a reliable and reproducible way. Therefore the
design of the equipment has to be well understood. The following two marks are examples of
applications which are helpful for the characterization of the equipment. Firstly, locations that are hard
to clean and locations with a high risk of contamination have to be identified in order to select sample
sites [20] (Figure 1.6). For example, rough surfaces increase the area for soil contact which makes it
more difficult for cleaning agents to penetrate through. Moreover, residues can attach to surfaces due
to van der Waals forces, electrostatic effects and other forces. [21]
Fig. 1.6: Examples of difficult to clean locations [22]
Secondly, it is important to verify the compatibility of the cleaning procedures (cleaning agent,
temperature) with the materials of construction, in order to minimize the influence on the materials
[20].
1.2.1.3. Product and equipment grouping
The following step includes the grouping of products and equipment, which means that products or
equipment with similar characteristics or purposes in the context of cleaning validation are put
together. It is important that cleaning validation must always be carried out to meet the lowest limit

9
of the total product group. Furthermore, the surface area used in residue calculation must be the
largest of all the equipment.
A few reasons to group products are:
Products that are cleaned with the same cleaning agent
Products that are manufactured on the same equipment group
Products cleaned with the same cleaning procedure
Products with similar formulations and manufacturing processes
Products with similar patient risk levels
A few arguments to group equipment are:
Equipment used to produce products from the same product group
Equipment cleaned with the same cleaning agent
Equipment cleaned with the same cleaning method
Equipment that has an equivalent role in manufacturing processes
Equipment that has a similar functionality and design [20]
1.2.1.4. Selection of the cleaning agent, SOP development and training
Cleaning processes are based on the principle of TACT-WINS: Time, Action, Concentration/Chemistry,
Temperature - Water, Individual, Nature of the soil, Surface. This acronym summarizes the parameters
that have to be controlled in any cleaning procedure (TACT) and those that affect the soil’s removal
from the surface (WINS).
Time represents the contact time on the surface being cleaned. Action is defined as the mechanism
used to administer the cleaning agent, such as scrubbing, soaking or turbulent flow. Scrubbing and
soaking are mostly used for manual cleaning, while automated cleaning will use a turbulent flow.
Concentration/Chemistry refers to the concentration of a specifically selected type of cleaning agent,
which will determine the effectiveness of the cleaning process. On the one hand, the cleaning process
could fail as a result of an insufficient amount of detergent used. On the other hand, the use of an
excessive amount of cleaning agent could result in the presence of detergent residues after cleaning,
requiring extra rinsing steps. Moreover, there exist different cleaning chemistries, divided into four
broad categories, which will be elaborated more in depth later in this paragraph. Temperature
indicates that for each step of the cleaning process, the optimal temperature has to be chosen. During
rinsing, for instance, ambient temperatures are set to minimize denaturing effects on proteins and
maximize dilution effects. However, the effectiveness of cleaning agents increases with higher

10
temperature [21]. In order to apply TACT, proper knowledge and understanding of WINS is required,
since each WINS parameter can affect the action of the TACT parameters. Furthermore, adjustment of
one of the these parameters might influence one another, making it of great importance to find the
optimal balance between the TACT parameters [20].
Cleaning agents are generally divided into four classes: water, organic solvents, commodity chemicals
and formulated cleaning agents. Water is a universal solvent which is cheap and non-invasive. If the
product can be adequately cleaned without undue time or physical labor, water alone should be used.
In contrast, solvents are mostly used in processes where solvents are already used for manufacturing.
However, it is recommended to reduce solvent use due to environmental reasons. Commodity
chemicals, such as sodium hydroxide (NaOH), are used for cleaning due to their high alkalinity, making
them capable of stimulating oxidation and reduction of soils. Still, they do not have a good cleaning
capacity. Furthermore, they are sometimes difficult to rinse out and need a larger amount of water
than formulated cleaning agents. These formulated cleaning agents are the biggest group of cleaning
agents, including solvent-based formulations and aqueous formulations. Most of these products
contain alkalinity or acidity sources, surfactants, chelants and either a solvent or water. They are often
produced in such a way that they have a low-foaming capacity and therefore are more easily rinsable
and suitable to be used in high turbulence cleaning [19, 20].
To select an appropriate cleaning agent, there are a few parameters that have to be well understood,
such as the properties of the soil and surface, the availability of cleaning methods and utilities, safety
considerations and effluent properties. It is important to look at the formulation as a whole and not
only at the API to choose a cleaning agent, because excipients determine the biggest part of the
formulation as well as the rate to release the API, thus affecting the API’s solubility. Furthermore, the
detergent has to be completely removed after cleaning, an additional aspect which has to be taking
into account [20].
When the cleaning agent is chosen, a cleaning method must be determined. There are three different
cleaning methods, namely manual, semi-automated and automated cleaning. For manual cleaning an
operator will use a brush or hose to clean the equipment. Multiple operators will not clean on the
exact same way, therefore it will be hard to obtain reproducible cleaning cycles. A tool to minimize
these changes is to compose a detailed cleaning procedure and checklist based on the available
standard operating procedures (SOPs). For (semi)- and automated cleaning processes there are part
washers and Clean-In-Place (CIP) systems available. The reproducibility of these cleaning cycles will be
better, however there is more concern about human interfaces with the system, for example loading
of the parts washer, breaking connections, etc [20].

11
Another critical aspect of cleaning validation is the training of personnel regarding cleaning. It is
necessary to discuss the importance of cleaning with operators, since they must understand each
cleaning step that they perform and have to guarantee that cleaning procedures are properly
sequenced, so to avoid contamination of locations that have already been cleaned. This familiarization
of personnel with suitable techniques is a big advantage for cleaning validation, in particular for manual
cleaning. For example, visual inspection is a valuable asset, because it gives a global image of the whole
equipment and not only of the sampling sites. Operators have to know where they have to look and
how they have to recognize residues on the surfaces [19, 20].
1.2.1.5. Identification of the sampling site and sampling method
After cleaning it is important to validate the effectiveness of the cleaning process. Therefore, samples
are taken and examined for the presence of soil. Several specific areas of the equipment make up
interesting sample sites, which are selected by the difficulty of cleaning and on the intended sampling
methods. For example, inaccessible and difficult to clean geometries of the equipment, areas that are
expected to become filthy during manufacturing, areas that are important to be cleaned in order to
avoid contamination to the next batch and areas which might experience recirculation of soils during
cleaning. Additionally, the variety of affinity of materials to soils also has to be considered.
Several tools exist to help select sampling sites: reviews of the equipment characterization, such as
geometry and material of construction, and cleaning SOPs for potential areas of weakness both provide
an important source of information for the characterization of interesting sampling sites. In addition,
interviews with instrument operators might also be helpful to check on their experience.
Swab sampling and rinse sampling are the two sampling methods most commonly used for cleaning
validation, with the preference for swab sampling. The first technique involves the use of an absorptive
swab used to physically wipe the surface and recover the analyte. Sampling sites have to be accessible
to reach with the human hand or arm. The swab can be used in combination with a diluent, such as
water or a solvent, which has to be compatible with the analyte. It will improve the physical removal
of the residue and help to dissolve it. The swab can also be used in its dry state. There are multiple
swab techniques, one of which is shown in Figure 1.7. The second technique comprises the collection
of fluid which has been in contact with the surface. The solvent used for rinse sampling has to be
compatible with the residue. Most often, rinse water is used [19, 20].

12
Fig 1.7: An example of a swabmethod1
Recovery studies are performed to evaluate the performance of sampling methods by the
determination of the residue’s recovery from the surface. A specific amount of residue of interest will
be spiked onto the surface. After a drying period, mimicking the dirty hold time, the sampling method
will be carried out. The sample is then analyzed and compared to a reference with the used amount of
residue. Finally, the amount of recovery can be calculated. In general, a recovery greater than 50% is
required, however most companies accept a recovery greater than 75%. [20]
1.2.1.6. Determination of limits2
Limits for cleaning validation have to be defined by the manufacturers and will depend on the specific
situation. These limits represent the dosage that is safe for cleaning carry-over, therefore cleaning has
to be continued until these acceptable limits are reached. Although most of the time only the API is of
great importance to determine these limits, there is little guidance to determine limits for cleaning
agents or other intermediate products that were not intended to be in the final product administered
to patients. A formula for pharmaceutical manufacturers is worked out to determine limits in
accordance with some well-documented mathematical standards. This formula consists of a
combination of limits which guarantees that surfaces are visibly clean and safety limits are achieved
by minimizing the total contamination towards the next batch. The following qualifications have to be
met: first of all, the surfaces have to be visibly clean. Secondly, not more than 1/1000th of a therapeutic
dose should arrive in the next batch. Lastly, not more than 10 ppm should enter the next batch. The
lowest limit of the last two has to be followed. The limit of 1/1000th is chosen because at this level the
product would no longer have a pharmacological effect on the next patient. The most basic formula to
determine the limit is given as follows [20]:
1 Figure obtained by Alcon 2 Formulae obtained by Alcon

13
𝑀𝐴𝐶 = 𝐿𝑇𝐷 ∗ 𝐵 ∗ 𝑆𝐹
𝑀𝑇𝐷
MAC: Maximum Allowable Carry-over (mg)
LTD: Lowest therapeutic dose considered for the product that has to be cleaned (mg/day)
B: Minimal size batch of the next product (mL)
SF: Safety Factor (typically 1/1000)
MTD: The largest daily dose considered for the next product (mL/day)
Nevertheless, these limits are very conservative and not based on a scientific background, since every
product is treated in the same way, despite their toxicological differences. Therefore, the concept of
Permitted Daily Exposure (PDE) was introduced, representing a substance-specific dose that is unlikely
to cause an adverse effect if one is exposed to this or a lower dose every day for a lifetime [23]. PDE
can be calculated by the following formula:
𝑃𝐷𝐸 =𝑁𝑂𝐴𝐸𝐿 ∗ 𝐵𝑊
𝑈𝐹𝑐 ∗ 𝑀𝐹 ∗ 𝑃𝐾
PDE: Permitted daily exposure (mg/day)
NOAEL: No Observed Adverse Effect Level (mg/kg/day)
BW: The weight of an average adult (e.g. 70 kg)
UFc: Composite Uncertainty Factor: Combination of factors which reflect the interindividual
variability, interspecies differences, sub-chronic-to-chronic extrapolation, LOEL-to-NOEL
extrapolation, database completeness
MF: Modifying factor: a factor to address uncertainties not covered by the other factors
PK: Pharmacokinetic adjustments [24]
Based on the definition of PDE a limit of maximum carry-over after cleaning is given in the following
formula:
𝐿𝑖𝑚𝑖𝑡 (𝑚𝑔) =𝑃𝐷𝐸 ∗ 𝐵
𝐿
PDE: Permitted daily exposure (mg/day)
B: Minimal size batch of the next product (mg)
L: Maximum daily dose of the next product (mg/day)

14
More specific limits, based on both concepts, depend on the way of sampling. For example, if a
homogeneous distribution on all surfaces of the equipment is assumed, which is usually not the case,
a recommended value for the content in a swab after swab sampling can be set [24].
Formula based on the safety factor (1/1000):
𝑀𝐴𝐶 (𝑚𝑔
𝑚𝐿) =
𝐿𝑇𝐷 ∗ 𝐵 ∗ 𝐴𝑠𝑤𝑎𝑏 ∗ 𝑆𝐹 ∗ 𝑅 𝑖𝑡𝑒𝑚
𝐴𝑡𝑜𝑡 ∗ 𝑀𝑇𝐷 ∗ 𝑉𝑠𝑤𝑎𝑏
LTD: Lowest therapeutic dose (mg/day)
B: Minimal size batch of the next product (mL)
Aswab: Swabbed surface (cm²)
SF: Safety factor (0.001)
Ritem: Recovery of the product to be investigated on a specific type of surface
Atot: The entire surface of the equipment train (cm²)
MTD: Maximum therapeutic dose (mL/day)
Vswab: Volume to dissolve the swab sample (mL)
Formula based on the PDE concept:
𝐶𝑟𝑖𝑡𝑒𝑟𝑖𝑜𝑛 (𝑚𝑔
𝑚𝐿) =
𝑃𝐷𝐸 ∗ 𝐵 ∗ 𝐴 𝑠𝑤𝑎𝑏 ∗ 𝑅 𝑖𝑡𝑒𝑚
𝐿 ∗ 𝐴𝑡𝑜𝑡 ∗ 𝑉 𝑠𝑤𝑎𝑏
PDE: Permitted Daily Exposure (mg/day) of the API of the worst-case product
B : Minimal size batch of the next product (mg)
Aswab: Swabbed surface (cm²)
Ritem: Recovery of the product to be investigated on a specific type of surface
L: Maximum daily dose of the next product (mg/day)
Atot: The entire surface of the equipment train (cm²)
Vswab: Volume to dissolve the swab sample (mL)
Furthermore, in the case of rinse samples, a limit for cleaning validation can be calculated by the
following formula [24].
Formula based on the safety factor:
𝑀𝐴𝐶 (𝑚𝑔
𝑚𝐿) =
𝐿𝑇𝐷 ∗ 𝐵 ∗ 𝑆𝐹 ∗ 𝐴𝑟𝑖𝑛𝑠𝑒 𝑠𝑎𝑚𝑝𝑙𝑒
𝐴𝑡𝑜𝑡 ∗ 𝑀𝑇𝐷 ∗ 𝑉

15
LTD: Lowest therapeutic dose (mg/day)
B: Minimal size batch of the next product (mL)
SF: Safety factor (0.001)
Arinse sample: Rinsed surface (cm²)
Atot: The entire surface of the equipment train (cm²)
MTD: Maximum therapeutic dose (mL/day)
V: Volume of rinsate (mL)
Formula based on the PDE concept:
𝐶𝑟𝑖𝑡𝑒𝑟𝑖𝑜𝑛 (𝑚𝑔
𝑚𝐿) =
𝑃𝐷𝐸 ∗ 𝐵 ∗ 𝐴𝑟𝑖𝑛𝑠𝑒 𝑠𝑎𝑚𝑝𝑙𝑒
𝑉 ∗ 𝐿 ∗ 𝐴𝑡𝑜𝑡
PDE: Permitted Daily Exposure (mg/day) of the API of the worst-case product
B: Minimal size batch of the next product (mg)
Arinse sample: Rinsed surface (cm²)
V: Volume of rinsate (mL)
L: Maximum daily dose of the next product (mg/day)
Atot: The entire surface of the equipment train (cm²)
1.2.1.7. Analysis selection and validation
As mentioned earlier, there are two kinds of analysis methods: specific or direct methods and
nonspecific or indirect methods. Direct methods, such as HPLC, MS and FTIR, will identify the analyte
by its specific composition. Indirect methods will measure a general property of the residue. For
example TOC, the measurement of pH and conductivity will respectively measure the carbon content,
the acid-base character or the ion strength. Of these indirect methods, TOC is most often used for
cleaning validation, because it generates results rapidly [19, 20]. Figure 1.8 gives an overview of the
properties of the most common analysis methods [20].
These methods must be validated, which is done in a similar way as or any other validation. The
validation includes accuracy, precision, linearity, robustness, specificity and range. The quantification
limit and detection limit are also important, because after cleaning only residues will remain. Other
considerations included in the ICH standards must be observed, namely system suitability, standards
& controls and robustness [20].

16
Fig. 1.8: Comparison of the most common analysis methods [20]
1.2.2. Microbiological contamination
Besides assuring the chemical cleanliness, microbiological contamination needs to be considered. All
areas of equipment that have direct contact with the raw material need to be examined.
Microbiological samples have to be taken before and after the cleaning procedure to determine the
efficacy of the detergents and disinfectants. For non-sterile production microbiological cleanliness
should be less than 100 CFU/mL, while for sterile production the level of microbiological contamination
of the rinse water should be 10 CFU/100 mL. Sampling should take place in triplicate [19, 25].
1.2.3. Clean hold time - Dirty hold time
Clean hold time and dirty hold time are two concepts that are part of cleaning validation. Clean hold
time is the time between cleaning and the start of the subsequent manufacturing operation. It is
obvious that clean equipment has a higher chance of becoming soiled when the clean hold time
increases. Dirty hold time is defined as the time between the end of manufacturing and the initiation
of the cleaning process. The longer the dirty hold time, the harder it will be to clean the equipment
[26].
1.2.4. Cleaning validation of biologicals
Cleaning validation of biologicals has more strict requirements due to their inherent characteristics,
such as the stickiness of proteins, parenteral product purity obligation, the complexity of the used
equipment and many materials that have to be cleaned. Specific analysis methods are recommended
for cleaning validation in general, however for biologicals product-specific assays such as
17
immunoassays may not be adequate: a negative result can be the result of denaturation of the protein.
Therefore product-specific assays should be coupled with the non-specific method TOC to detect
protein residues. Large amounts of these valuable and expensive products are necessary to perform a
cleaning validation. Therefore, alternatives to these molecules are looked for and used as worst-case
product [27].
1.2.5. Determination of a worst-case product
The concept of grouping was already explained in section 1.2.1.3. Products that are similar regarding
their cleaning can be assigned to one group, for which it is possible to determine a worst-case product.
This is the substance that is the most difficult to remove during cleaning, representing all other
materials in its group. This approach minimizes the number of required validation runs. The conditions
to clean this worst-case product, will definitely be good enough to remove the other products [20].
To determine the worst-case product, it is important to analyze its solubility and degradation, since
these affect the selection of a cleaning agent, procedure design and method. Solubility is important
because at one point the residue has to be dissolved, emulsified or suspended to a certain level by the
cleaning agent. A product’s solubility will depend on the difficulty of solvating dislodged molecules,
where the concept of ‘like dissolves like’ is valid. Moreover, the difficulty of dislodging solute molecules
from the crystal structure must be taken into account. Important parameters, such as
hydrophilicity/lipophilicity, ionizability, temperature effects and surface activity that will influence the
solvation will be further explained.
Hydrophilic substances, also known as water-loving molecules, exhibit high polarity and intermix well
with water molecules. This mixture is stabilized by dipole-dipole, dipole-charge, or hydrogen bonding
interactions. Conversely, the introduction of hydrophobic substances, also known as fat-loving
molecules, into water forces the water molecules to take a less random orientation, because the
possibility of hydrogen bonds are reduced. Non-polar molecules dissolve more readily in non-polar
solvents. The hydrophilicity/lipophilicity of a molecule can be characterized by its octanol-water
partition coefficient (P), which is defined as the ratio of concentrations of a non-ionized molecule
dissolved in octanol and water, two immiscible phases, at equilibrium [28]. This coefficient is often
described in its logarithmic form (log P).
𝑃 = [𝑋]𝑜𝑐𝑡𝑎𝑛𝑜𝑙
[𝑋]𝑤𝑎𝑡𝑒𝑟

18
The ionization of molecules will greatly increase their solubility in water, because ions are far more
polar than non-ionized substances. Many APIs contain regions in their molecular structure that can
dissociate when dissolved in water, forming positively and negatively charged ions. Since the pH of the
solution has a great impact on the dissolution and solubilization of many drug substances, the
modification of the solution’s pH is an easy way to enhance the solubilization of poorly soluble
substances.
Higher temperatures generally increase the solubility of molecules. However, in some cases the
solubility will decrease with an increase in temperature. An example of this last group are proteins. At
higher temperatures protein denaturation occurs, because heat will cause the disruption of hydrogen
bonds and non-polar hydrophobic interactions, resulting in a lower solubility.
Lastly, some APIs and formulation excipients are surface-active, i.e. their molecular structure contains
a non-polar and a polar part. These surface-active substances, also called surfactants, promote
wetting, emulsification and dispersion of solids to enable cleaning [28].
Besides solubility, the degradation of molecules is also an important aspect to determine a worst-case
product. Unlike chemical degradation, referring to the conversion of the molecular structure resulting
in degradation products that may not be detectable using an analytical method designed to quantify
the API, physical degradation especially affects the ease or difficulty of removing the API from the
surface. Physical degradation indicates the change of the physical form and the change in physical
properties of a solid. This is relevant for cleaning since several properties such as solubility,
hygroscopicity, chemical stability, and others might be influenced. Solid phase transition can for
instance alter the cleanability if a water soluble solid is converted into a less water soluble form. It is
essential to understand how APIs and excipients may degrade during cleaning in order to develop a
reliable cleaning process.
Although solubility and degradation will determine the chemical cleaning mechanisms, residues can
also be removed in a physical way. Physical removal depends on the size of the residue and its degree
of adhesion to the equipment surface [21]. Normally, API candidates have a sufficient chemical and
physical stability so that they can be produced and marketed. During cleaning operations, however,
they are exposed to an environment capable of changing their properties, therefore potentially
changing the ease of cleaning, which is a crucial aspect to understand in the context of cleaning
validation [28, 29].

19
1.3. Alternatives to biologicals for cleaning validation
In order to test new compounds or drugs in the context of cleaning validation, large amounts of these
valuable and expensive products would be lost. Therefore, alternatives to these molecules are looked
for and used as worst-case product. The goal of this thesis is to find a good alternative vegetable
protein to use as worst-case product for the cleaning validation of brolucizumab [30].
Below, a short theoretical discussion is given about vegetable proteins. Afterwards the vegetable
proteins that will be used during this project are discussed in order to compare their properties.
Besides these vegetable proteins, riboflavin has also been investigated as a potential candidate, due
to its poor solubility and ease of detection.
1.3.1. Theoretical discussion
Proteins are the building blocks of all forms of life. They are in fact a sequence of amino acids which
fold into a structurally complex and functionally active product. Proteins can be classified by their
origin. For example, milk and egg proteins belong to the animal proteins, while fish and crustacean
proteins are part of the marine proteins. The group of plant proteins, which will be focused on in this
project, can be further subdivided in three different classes, an overview of which is given in Table 1.2.
Table 1.2: Overview of plant proteins
Class Source
Vegetable proteins Pea, potato
Cereal proteins Wheat, barley, rye, oat, maize, rice
Seed proteins Soy, peanut, bean, sunflower seeds, cotton seed
Brolucizumab is a monoclonal antibody, i.e. an immunoglobulin consisting of four amino acid chains.
Therefore it was decided to work with proteins instead of small chemicals because the structure of
proteins and their associated properties determining the ease of cleaning, are more related to those
of brolucizumab. Vegetable proteins are preferable because of their low price and low risk. In contrast,
animal proteins are less suitable, since they contain the risk of being contaminated with viral and
bovine spongiform encephalopathy (BSE). The same holds for human proteins, which, moreover, are
too expensive to use as worst-case product.
Food proteins are mostly difficult to remove in a cleaning process, because they can be very sticky after
denaturation. Therefore these vegetable proteins can be chosen as possible worst-case product to
perform a cleaning validation for a biological product [31, 32].

20
1.3.2. Substances to be investigated
1.3.2.1. Soy peptone
Soy is derived from the soybean plant and consists of 11S or glycinin and 7S or β-conglycinin. Glycinin
is the most important component, responsible for adhesion strength and water resistance [33]. Soy
proteins have an isoelectric point around 4.5. Their charged groups give rise to a good solubility in
water, while basic conditions improve their solubility even more. β-conglycinin is more sensitive to
heat than glycinin and has a denaturation temperature of 70°C and 80°C [33].
1.3.2.2. Brown rice protein
Rice mainly consists of albumin, globulin, prolamin and glutelin [34]. Albumin is the most soluble
protein followed by globulin. Prolamin and glutelin show a lower solubility as a result of their lower
aspartic acid and glycine content. Rice proteins have an isoelectric point between 4 and 6, which has
an influence on their solubility when the pH changes. Rice protein isolate has a denaturation
temperature around 83.4°C [35].
1.3.2.3. Pea protein isolate
Pea protein isolate mainly consist of 11S legumin and 7S vicilin. It has a poor solubility in water due to
its hydrophobic surface structure and low surface charge [36]. No stability data are available in
literature.
1.3.2.4. Whey protein isolate
Whey proteins belong to a group of milk proteins classified as globular proteins consisting of mainly
lactoglobulin and α-lactalbumin. They have a good water solubility over a wide range of pH values.
However, whey proteins are sensitive to heat denaturation at temperatures above 70°C, resulting in
protein aggregation [37].
1.3.2.5. Riboflavin
Riboflavin, also known as vitamin B12, is a yellow-orange solid substance with poor water solubility,
when compared to other B vitamins. The protein has a high stability at high temperatures and in acidic
media. Riboflavin is often used as tracer due to its fluorescence under UV light. The vitamin however
is very sensitive to visible light [38].

21
2. Objectives
The interest in biologicals has strongly increased in the last decade due to the discovery of many
targets, as a result of the expanding genetic knowledge and the growing understanding of cell
processes and diseases. Pharmaceutical companies are also focusing more on biologicals in order to
replace the pipeline of chemical molecules, which is getting increasingly smaller. In general, the
enormous interest in biologicals is due to their high selectivity and potent therapeutic efficacy,
resulting in limited side effects. Furthermore, their behavior is easier to predict under in vivo
conditions.
Before pharmaceutical companies can produce a product several validation studies have to be done,
such as cleaning validation. The main objective of cleaning validation is to minimize the risk of cross-
contamination, a topic which has become more relevant due to the evolution of medicines. During the
last decades, more potent and complex drugs have been developed in which pharmaceutical
companies show increasing interest. In order to test new compounds or drugs in the context of
cleaning validation, large amounts of these valuable and expensive products would be lost. Therefore,
alternatives to these molecules are looked for and used as worst-case product. Moreover, if one worst-
case product is found for several products, one cleaning validation of the worst-case product can cover
the validation of the rest of the products, saving time and money.
The goal of this thesis is to find a good alternative to use as worst-case product for the cleaning
validation of brolucizumab (formerly RTH 258), a potentially new drug for the treatment of wet age-
related macular degeneration. Currently, phase 3 clinical trials for brolucizumab are ongoing. This anti-
VEGF antibody fragment is developed by ESBAtech (Schlieren, Switzerland) and evaluated in a series
of clinical trials by Novartis. The molecule is a monoclonal antibody, i.e. an immunoglobulin consisting
of four amino acid chains. Therefore it was decided to work with proteins instead of small chemicals
because the structure of proteins and their associated properties determining the ease of cleaning, are
more related to those of brolucizumab. Vegetable proteins are preferable because of their low price
and low risk. In contrast, animal proteins are less suitable, since they contain the risk of being
contaminated with viral and bovine spongiform encephalopathy (BSE). The same holds for human
proteins, which, moreover, are too expensive to use as worst-case product.
In the present thesis, the following products were investigated as possible worst-case product: four
vegetable proteins, namely soy peptone, brown rice protein, pea protein isolate and whey protein
isolate and one chemical substance, riboflavin. Afterwards, the cleaning validation of reactor 88 with
the predetermined worst-case product was done. In this reactor, the production of the formulation of
brolucizumab can occur.

22
3. Materials and Methods
3.1. Materials
3.1.1. Reagents
Oxoid VGO300 Veggietones GMO-free soya peptone (Oxoid, Basingstoke, United Kingdom)
Bulk Powders super pea pea protein isolate (Bulk Powders, Colchester, United Kingdom)
Bulk Powders pure whey isolateTM 97 unflavored (Bulk Powders, Colchester, United Kingdom)
Bulk Powders brown rice protein 80% unflavored (Bulk Powders, Colchester, United Kingdom)
Riboflavin (Sigma-aldrich, St. Louis, United States of America)
Sucrose (Obtained by Alcon)
Demi water (Obtained by Alcon)
Destil water (Obtained by Alcon)
3.1.2. Supplies
Small & large low TOC swabs (small & large) (Texwipe, Kernersville, United States of America)
BBL™ RODAC™ plates (BD, Franklin Lakes, USA)
OPTIMAX™ 365 UV-A LED Inspection Flashlight (Spectronics corporation, Westburry, United
States of America)
Molybdenum test kit (Ironhaven BV, Hoofddorp, the Netherlands)
3.1.3. Equipment
Brinox REA 88 (Brinox Process Systems, Medvode, Slovenia) (More information: see appendix 7.1
and 7.2)
Total Organic Carbon Analyzer Sievers 900 Series (GE instruments, Boulder, USA)
UV-1650PC spectrophotometer (Shimadzu, Kyoto, Japan)

23
3.2. Methods
3.2.1. Molybdenum test
The molybdenum test kit allows to quickly and easily determine whether stainless steel contains
molybdenum or not. To compare the type of stainless steel between the reactor and the tubes used
for the determination of the cleanability, the test was conducted on both materials as follows: after
shaking the reagent, one or two drops were applied on the surface. A color change was observed if the
investigated stainless steel contained molybdenum. This type of stainless steel was categorized as
stainless steel 316. If no color change was observed, the stainless steel contained no molybdenum and
was categorized as stainless steel 304. Afterwards, the surfaces were rinsed with water [39].
3.2.2. Determination of the cleanability
In order to determine a worst-case product for RTH 258, the cleanability of the five products (soy
peptone, brown rice protein, pea protein isolate, whey protein isolate and riboflavin) was compared
with RTH 258. Therefore, testing mixtures of the five products were prepared. Specifically, 12 g of the
product was dissolved in 100 mL cooled distilled water. To allow a similar detection, 5 g riboflavin was
added to the solutions of the proteins. Riboflavin has a yellow color and is fluorescent, therefore it is
more accurate to determine if the stainless steel tube is visually clean. In addition, 3 mL of the
commercial stock solution of RTH 258 (12% w/v) was mixed with 150 mg riboflavin to obtain the same
riboflavin concentration as the other samples. In this way, solutions of the five products and RTH 258
were obtained with a concentration of 12% w/v.
For each of the five products, three spots of 300 µL were applied on the stainless steel tube at a uniform
distance. After overnight drying of the spots, the test was performed: first, a flow of 150 ± 5 mL/min
was set by collecting cold demineralized water in a graduated cylinder and determining the amount of
water in the cylinder after 3 minutes. Next, a small tab was attached to the tube, to connect the tube
and the water tap. As soon as the water hit the first spot, the chronometer was started. A visual control
of the cleanliness was done at the following times:
0 to 30 minutes: every minute
30 to 60 minutes: every five minutes
From 60 minutes: every fifteen minutes
An additional check of cleanliness was done using a UV light. Finally, the time was noted when visual
cleanliness was reached. The longer the time, the harder to clean the product, indicating a better
choice as worst-case product.
24
3.2.3. Determination of the solubility
The equilibrium solubility of the five products was determined by the shake-flask method. Three
independent shake flask experiments were carried out for each product. A solution with a solid excess
of the sample was made by adding the desired product to 100 mL of water in a flask. These flasks were
placed on a stirring plate for 24 hours at room temperature. After centrifugation, three aliquots of
supernatant were taken from the saturated solution and measured by UV/VIS spectrophotometry [40].
The proteins were measured at a wavelength of 280 nm, based on the absorbance of UV light by the
aromatic amino acids, tryptophan and tyrosine, and by cysteine in protein solutions [41]. While for
riboflavin, the wavelength giving maximal absorbance (λmax) was first determined by measuring the
whole absorption spectrum, after which, the riboflavin samples were measured at the found λmax.
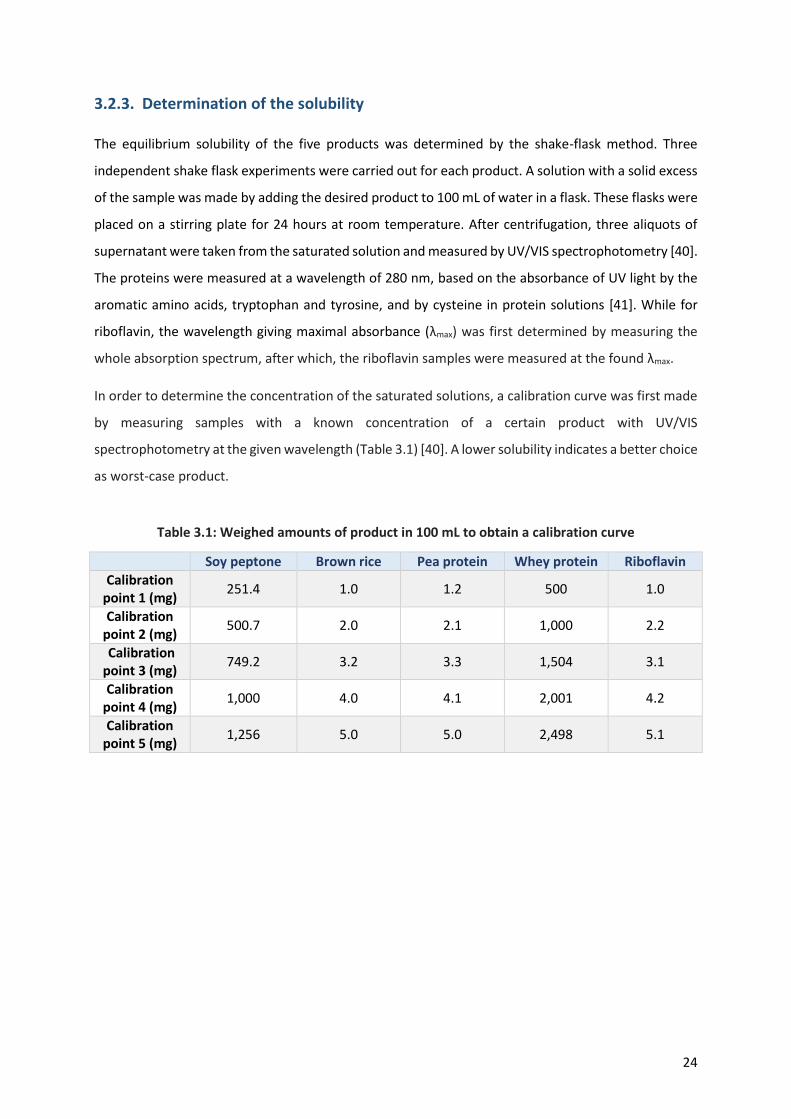
In order to determine the concentration of the saturated solutions, a calibration curve was first made
by measuring samples with a known concentration of a certain product with UV/VIS
spectrophotometry at the given wavelength (Table 3.1) [40]. A lower solubility indicates a better choice
as worst-case product.
Table 3.1: Weighed amounts of product in 100 mL to obtain a calibration curve
Soy peptone Brown rice Pea protein Whey protein Riboflavin
Calibration point 1 (mg)
251.4 1.0 1.2 500 1.0
Calibration point 2 (mg)
500.7 2.0 2.1 1,000 2.2
Calibration point 3 (mg)
749.2 3.2 3.3 1,504 3.1
Calibration point 4 (mg)
1,000 4.0 4.1 2,001 4.2
Calibration point 5 (mg)
1,256 5.0 5.0 2,498 5.1

25
3.2.4. Cleaning validation
The cleaning validation of reactor 88, which can eventually be used for the production of the RTH 258
formulation, was performed using soy peptone. The choice for this protein resulted from the fact that
an ELISA kit specific for soy proteins was already available in-house at the start of the project. This
ELISA kit can replace the unspecific TOC method to analyze the samples of remnants of soy. To prove
a reproducible and effective cleaning, the manual cleaning was done in triplicate.
3.2.4.1. Risk assessment
Fig. 3.1: Risk assessment of the manual cleaning of reactor 88
3.2.4.2. Determination of the recovery of swabbing
Calculation of the criterion
In order to calculate the criterion for biologicals, PDE was used using the following formula from
section 1.2.1.6. The equipment train consists of two Biological-reactors (2 x 10,000 cm²) and the Bulk
Syringe Line (BSL) (5,000 cm²), making a surface of 25,000 cm². To obtain a more worst-case situation
a surface of 30,000 cm² is used to calculate the criterion. This initial criterion, used for the recovery
studies, was based on early research on RTH 258. However, after obtaining more information and
change of reactor a recalculation of the criterion was done in section 3.2.4.4.

26
𝐶𝑟𝑖𝑡𝑒𝑟𝑖𝑜𝑛 (𝑚𝑔
𝑚𝐿) =
𝑃𝐷𝐸 ∗ 𝐵 ∗ 𝐴 𝑠𝑤𝑎𝑏
𝐿 ∗ 𝐴𝑡𝑜𝑡 ∗ 𝑉 𝑠𝑤𝑎𝑏∗ 𝑅 𝑖𝑡𝑒𝑚
𝐶𝑟𝑖𝑡𝑒𝑟𝑖𝑜𝑛 (𝑚𝑔
𝑚𝐿) =
0.003 ∗ 2,000 ∗ 100
0.2 ∗ 30,000 ∗ 1∗ 0.50 = 0.05
Table 3.2: Explanation of the formula to calculate the criteria for to perform the recovery test
Factor Explanation of the factor Amount
PDE Permitted daily exposure (mg/day) of RTH 258 0.003
B Minimal size batch of the next product (mL) 2,000
Aswab Swabbed surface (cm²) 100
Ritem Fixed recovery during recovery studies to calculate the criterion 0.05
L Maximum daily dose of the next product = RTH 258 (mg/day) 0.2
Atot The entire surface of the equipment train (cm²) 30,000
Vswab Volume to dissolve the swab sample (mL) 1
Based on this criterion, a stock solution of 0.05 mg/mL of soy peptone was prepared for the recovery
study.
Performing of the test
To determine the recovery of soy peptone on stainless steel, five different samples were analyzed, all
tested in triplicate, thus using three different plates of stainless steel type 316. A schematic
representation of the four reference samples is given in Figure 3.2. A positive control was made by
adding 1 mL of the stock solution to a TOC vial with 39 mL cooled distilled water. The diluent control
consisted of the water used to prepare the samples. Therefore a TOC vial was filled with cooled distilled
water. The swab control was prepared by adding the top of a swab to 40 mL of cooled distilled water
in a TOC vial. The coupon control was made by swabbing a clean surface of the stainless steel plate,
that will be used for the test sample. The swabbing technique was shown earlier in Figure 1.7. The top
of the swab was cut and placed in a TOC vial filled with 40 mL cooled distilled water. To obtain the test
sample, the plates of stainless steel were first cleaned and dried. Then, 1 mL of the stock solution (0.05
mg/mL) was spotted on a plate and a TOC vial was filled with 40 mL cooled distilled water. The swab
was moistened by dipping the swab in the TOC tube. Finally, the plate was swabbed in a manner
described by Figure 1.7 (section 1.2.1.5.), followed by cutting the top of the swab into the TOC vial.
After sonication of the samples for five minutes, TOC measurements were performed. Based on the
obtained results, the recovery was calculated by the following formula:
𝑅𝑒𝑐𝑜𝑣𝑒𝑟𝑦 =𝑠𝑤𝑎𝑏 𝑟𝑒𝑠𝑢𝑙𝑡 − 𝑐𝑜𝑢𝑝𝑜𝑛 𝑐𝑜𝑛𝑡𝑟𝑜𝑙
𝑝𝑜𝑠𝑖𝑡𝑖𝑣𝑒 𝑐𝑜𝑛𝑡𝑟𝑜𝑙 − 𝑑𝑖𝑙𝑢𝑒𝑛𝑡 𝑐𝑜𝑛𝑡𝑟𝑜𝑙∗ 100%

27
To determine the recovery on glass, the same test was also performed on glass instead of on stainless
steel.
Fig. 3.2: Reference samples for the determination of the recovery of swabbing for TOC analysis3
3.2.4.3. Recalculation of the criteria for sampling
After change of reactor, used to perform the cleaning validation of RHT 258, and results from the
recovery study, a new criterion for the cleaning validation of reactor 88 was calculated in two ways: 1)
criterion based on 1/1000 limit and 2) criterion based on the PDE concept by the two formulae given
in section 1.2.1.6. The entire surface of the equipment train consists of the reactor surface (36,925
cm²) (calculation of the reactor surface is presented in Appendix 7.2.) and the BSL (5,000 cm²). The
most strict criterion will be applied during cleaning validation. Solutions with the corresponding
concentrations were made for analysis by TOC in order to obtain the corresponding TOC values. No
swab was added to the solutions representing the criteria for swab samples, in order to obtain a worst-
case value. With these data it is possible to compare the TOC results of the test samples, obtained after
cleaning, and the criterion to conclude if the cleaning was acceptable or not.
3 Figure obtained by Alcon

28
Criteria for swab samples on stainless steel
PDE concept
𝐶𝑟𝑖𝑡𝑒𝑟𝑖𝑜𝑛 (𝑚𝑔
𝑚𝐿) =
𝑃𝐷𝐸 ∗ 𝐵 ∗ 𝐴 𝑠𝑤𝑎𝑏 ∗ 𝑅 𝑖𝑡𝑒𝑚
𝐿 ∗ 𝐴𝑡𝑜𝑡 ∗ 𝑉 𝑠𝑤𝑎𝑏
𝐶𝑟𝑖𝑡𝑒𝑟𝑖𝑜𝑛 (𝑚𝑔
𝑚𝐿) =
𝑂. 𝑂𝑂3𝑚𝑔𝑑𝑎𝑦
∗ 52,935,000 𝑚𝑔 ∗ 100 𝑐𝑚2 ∗ 0.682
𝑂. 2𝑚𝑔𝑑𝑎𝑦
∗ 41,495 𝑐𝑚2 ∗ 40 𝑚𝐿= 32.63 𝑚𝑔/𝑚𝐿
Table 3.3: Explanation of the formula to calculate the criteria for swab samples on stainless steel via the PDE concept
Factor Explanation of the factor Amount
PDE Permitted daily exposure (mg/day) of RTH 258 0.003
B Minimal size batch of the next product (mg) 52,935,000*
Aswab Swabbed surface (cm²) 100
Ritem Recovery of soy peptone on stainless steel 0.682
L Maximum daily dose of the next product (RTH 258) (mg/day) 0.2
Atot The entire surface of the equipment train (cm²) 41,495
Vswab Volume to dissolve the swab sample (mL) 40 *corresponds with 50 L of the current formulation of RTH 258 with a density of 1.0587 g/mL:
𝑏𝑎𝑡𝑐ℎ 𝑠𝑖𝑧𝑒 (𝑚𝑔) = 50, 000 𝑚𝑙 ∗ 1.0587𝑔
𝑚𝑙∗ 1000 = 52,935,000 𝑚𝑔
Table 3.4: Corresponding criteria based on the PDE concept for the sampling locations
Sampling location Swabbed Surface
(cm²) Corresponding criterion (mg/mL)
Wall of the reactor 100 32.63
Bottom of the reactor 100 32.63
Bottom of the stirrer 122.7 40.03
Endings of the bottom piping 107.4 35.04
Connection 1 on the top of the vessel 75.39 24.60
Connection 2 on the top of the vessel 94.24 30.75
Connection 3 on the top of the vessel 94.24 30.75
Inside of the lid 100 32.75
1/1000 limit
𝐿𝑖𝑚𝑖𝑡 (𝑚𝑔
𝑚𝐿) =
𝐿𝑇𝐷 ∗ 𝐵 ∗ 𝐴𝑠𝑤𝑎𝑏 ∗ 𝑆𝐹 ∗ 𝑅 𝑖𝑡𝑒𝑚
𝐴𝑡𝑜𝑡 ∗ 𝑀𝑇𝐷 ∗ 𝑉𝑠𝑤𝑎𝑏
𝐿𝑖𝑚𝑖𝑡 (𝑚𝑔
𝑚𝐿) =
0.1𝑚𝑔𝑑𝑎𝑦
∗ 50,000 𝑚𝐿 ∗ 100 𝑐𝑚2 ∗ 0.001 ∗ 0.682
41,495 𝑐𝑚2 ∗ 1.67𝑚𝐿𝑑𝑎𝑦
∗ 40 𝑚𝐿= 1.230 ∗ 10−4 𝑚𝑔/𝑚𝐿

29
Table 3.5: Explanation of the formula to calculate the criteria for swab samples on stainless steel via the 1/1000 limit
Factor Explanation of the factor Amount
LTD Lowest therapeutic dose of RTH 258 (mg/day) 0.1
B Minimal size batch of the next product (mL) 50,000
Aswab Swabbed surface (cm²) 100
SF Safety factor 0.001
Ritem Recovery of soy peptone on stainless steel 0.682
Atot The entire surface of the equipment train (cm²) 41,495
MTD Maximum therapeutic dose of RTH 258 (mL/day) 1.67
Vswab Volume to dissolve the swab sample (mL) 40
Table 3.6: Corresponding criteria based on the 1/1000 limit for sampling locations
Sampling location Swabbed surface
(cm²) Corresponding criterion (mg/mL)
Wall of the reactor 100 1.230 * 10-4
Bottom of the reactor 100 1.230 * 10-4
Bottom of the stirrer 122.7 1.509 * 10-4
Endings of the bottom piping 107.4 1.292 * 10-4
Connection 1 on the top of the vessel 75.39 0.9273 * 10-4
Connection 2 on the top of the vessel 94.24 1.159 * 10-4
Connection 3 on the top of the vessel 94.24 1.159 * 10-4
Inside of the lid 100 1.230 * 10-4
Criteria for swab samples on glass
PDE concept
𝐶𝑟𝑖𝑡𝑒𝑟𝑖𝑜𝑛 (𝑚𝑔
𝑚𝐿) =
𝑃𝐷𝐸 ∗ 𝐵 ∗ 𝐴 𝑠𝑤𝑎𝑏 ∗ 𝑅 𝑖𝑡𝑒𝑚
𝐿 ∗ 𝐴𝑡𝑜𝑡 ∗ 𝑉 𝑠𝑤𝑎𝑏
𝐶𝑟𝑖𝑡𝑒𝑟𝑖𝑜𝑛 (𝑚𝑔
𝑚𝐿) =
𝑂. 𝑂𝑂3𝑚𝑔𝑑𝑎𝑦
∗ 52,935,000 𝑚𝑔 ∗ 38.46 𝑐𝑚2 ∗ 0.7584
𝑂. 2𝑚𝑔𝑑𝑎𝑦
∗ 41,495 𝑐𝑚2 ∗ 40 𝑚𝐿= 13.95 𝑚𝑔/𝑚𝐿
Table 3.7: Explanation of the formula to calculate the criteria for swab samples on glass via the PDE concept
Factor Explanation of the factor Amount
PDE Permitted daily exposure (mg/day) of RTH 258 0.003
B Minimal size batch of the next product (mg) 52,935,000*
Aswab Swabbed surface = surface of the window of reactor 88 (cm²) 38.46
Ritem Recovery of soy peptone on glass 0.7584
L Maximum daily dose of the next product (RTH 258) (mg/day) 0.2
Atot The entire surface of the equipment train (cm²) 41,495
Vswab Volume to dissolve the swab sample (mL) 40 *corresponds with 50 L of the current formulation of RTH 258 with a density of 1.0587 g/mL:
𝑏𝑎𝑡𝑐ℎ 𝑠𝑖𝑧𝑒 (𝑚𝑔) = 50, 000 𝑚𝑙 ∗ 1.0587𝑔
𝑚𝑙∗ 1000 = 52,935,000 𝑚𝑔

30
1/1000 limit
𝐿𝑖𝑚𝑖𝑡 (𝑚𝑔
𝑚𝐿) =
𝐿𝑇𝐷 ∗ 𝐵 ∗ 𝐴𝑠𝑤𝑎𝑏 ∗ 𝑆𝐹 ∗ 𝑅 𝑖𝑡𝑒𝑚
𝐴𝑡𝑜𝑡 ∗ 𝑀𝑇𝐷 ∗ 𝑉𝑠𝑤𝑎𝑏
𝐿𝑖𝑚𝑖𝑡 (𝑚𝑔
𝑚𝐿) =
0.1𝑚𝑔𝑑𝑎𝑦
∗ 50,000 𝑚𝐿 ∗ 38.46 𝑐𝑚2 ∗ 0.001 ∗ 0.7584
41,495 𝑐𝑚2 ∗ 1.67𝑚𝐿𝑑𝑎𝑦
∗ 40 𝑚𝐿= 5.261 ∗ 10−5 𝑚𝑔/𝑚𝐿
Table 3.8: Explanation of the formula to calculate the criteria for swab samples on glass via the 1/1000 limit
Factor Explanation of the factor Amount
LTD Lowest therapeutic dose of RTH 258 (mg/day) 0.1
B Minimal size batch of the next product (mL) 50,000
Aswab Swabbed surface = surface of the window of reactor 88 (cm²) 38.46
SF Safety factor 0.001
Ritem Recovery of soy peptone on glass 0.7584
Atot The entire surface of the equipment train (cm²) 41,495
MTD Maximum therapeutic dose of RTH 258 (mL/day) 1.67
Vswab Volume to dissolve the swab sample (mL) 40
Criteria for rinse samples4
PDE concept
𝐶𝑟𝑖𝑡𝑒𝑟𝑖𝑜𝑛 (𝑚𝑔
𝑚𝐿) =
𝑃𝐷𝐸 ∗ 𝐵 ∗ 𝐴𝑟𝑖𝑛𝑠𝑒 𝑠𝑎𝑚𝑝𝑙𝑒
𝑉 ∗ 𝐿 ∗ 𝐴𝑡𝑜𝑡
𝐶𝑟𝑖𝑡𝑒𝑟𝑖𝑜𝑛 (𝑚𝑔
𝑚𝐿) =
0.003𝑚𝑔𝑑𝑎𝑦
∗ 52,935,000 𝑚𝑔 ∗ 36,925 𝑐𝑚²
5,000 𝑚𝐿 ∗ 0.2𝑚𝑔𝑑𝑎𝑦
∗ 41,495 𝑐𝑚2= 141.3 𝑚𝑔/𝑚𝐿
Table 3.9: Explanation of the formula to calculate the criteria for rinse samples via the PDE concept
Factor Explanation of the factor Amount
PDE Permitted daily exposure (mg/day) of RTH 258 0.003
B Minimal size batch of the next product (mg) 52,935,000*
Arinse sample Rinsed surface = total surface of reactor 88 (cm²) 36,925
V Volume of rinsate (mL) 5,000
L Maximum daily dose of the next product (RTH 258) (mg/day) 0.2
Atot The entire surface of the equipment train (cm²) 41,495 *corresponds with 50 L of the current formulation of RTH 258 with a density of 1.0587 g/mL:
𝑏𝑎𝑡𝑐ℎ 𝑠𝑖𝑧𝑒 (𝑚𝑔) = 50, 000 𝑚𝑙 ∗ 1.0587𝑔
𝑚𝑙∗ 1000 = 52,935,000 𝑚𝑔
4 Recovery studies are not required for rinse samples

31
1/1000 limit
𝐿𝑖𝑚𝑖𝑡 (𝑚𝑔
𝑚𝐿) =
𝐿𝑇𝐷 ∗ 𝐵 ∗ 𝑆𝐹 ∗ 𝐴𝑟𝑖𝑛𝑠𝑒 𝑠𝑎𝑚𝑝𝑙𝑒
𝐴𝑡𝑜𝑡 ∗ 𝑀𝑇𝐷 ∗ 𝑉
𝐿𝑖𝑚𝑖𝑡 (𝑚𝑔
𝑚𝐿) =
0.1𝑚𝑔𝑑𝑎𝑦
∗ 50,000 𝑚𝐿 ∗ 0.001 ∗ 36,925 𝑐𝑚2
41,495 𝑐𝑚2 ∗ 1.67𝑚𝐿𝑑𝑎𝑦
∗ 5,000 𝑚𝐿= 5.329 ∗ 10−4 𝑚𝑔/𝑚𝐿
Table 3.10: Explanation of the formula to calculate the criteria for rinse samples via the 1/1000
limit
Factor Explanation of the factor Amount
LTD Lowest therapeutic dose of RTH 258 (mg/day) 0.1
B Minimal size batch of the next product (mL) 50,000
SF Safety factor 0.001
Arinse sample Rinsed surface = total surface of reactor 88 (cm²) 36,925
Atot The entire surface of the equipment train (cm²) 41,495
MTD Maximum therapeutic dose of RTH 258 (mL/day) 1.67
Vswab Volume to dissolve the swab sample (mL) 40
3.2.4.4. Determination of the worst-case places of the reactor
The sampling plan is presented in Appendix 7.3. A list of the sampling places is given in Table 3.11.
Table 3.11: Worst-case places of the reactor where samples will be taken
Number Sampling location Statement
1 Wall of the reactor Representative area for the reactor
2 Bottom of the reactor Representative area for the reactor
3 Bottom of the stirrer Difficult to clean
4 Endings of the bottom piping Difficult to clean
5 Window Other kind of material (glass)
6 Connection 1 on the top of the vessel Difficult to reach
7 Connection 2 on the top of the vessel Difficult to reach
8 Connection 3 on the top of the vessel Difficult to reach
9 Inside of the lid Risk of contamination
3.2.4.5. Schematic overview of a cleaning cycle
Fig. 3.3: Schematic overview of a cleaning cycle expressed in number of days

32
3.2.4.6. Soiling of the reactor
The content of soy peptone in the soiling batch was chosen such that the concentration of soy should
be higher than the concentration of RTH 258 (12%) making it a worst-case batch. Moreover sucrose
was added to the batch as viscosity enhancer to make it more worst-case. A concentration of 10% is
chosen, because the currently investigated formulation of RTH 258 contains 10% of sucrose. Thus, a
soiling batch of 15% soy peptone and 10% sucrose was made by adding 300 g soy peptone and 200 g
sucrose to a total volume of 2 L cooled distilled water. Finally, the solution was transferred to a non-
transparent bottle to protect the protein-solution from light and denaturation. Moreover, the solution
was stored in the refrigerator. No riboflavin was added as visual tracer because it would interfere the
ELISA analysis. The reactor was soiled by painting it with a brush after dipping the brush into the
solution. Every area, where a sample would be taken after cleaning, was covered with the solution.
Finally, a dirty hold time of minimum 3 days was taken into account.
3.2.4.7. Cleaning of the reactor
Procedure
In advance of the start of the first cleaning a cleaning-procedure was drawn up. When the results were
out of specifications and corrective actions were needed, a revision of the cleaning procedure was
written. A plan of the reactor is shown in Appendix 7.3.
- Preparation:
After moving reactor 88 to the cleanroom, two tubes were connected to a water tap: the first one was
connected to demineralized water, the second one to distilled water. A third tube was connected to
the drain point of tap 38 and the sewerage. Finally, bottom tap 14 was opened.
Before cleaning, the lid of the reactor was opened to perform a visual control. Irregularities were
reported to the supervisor.
- Cleaning of the connection to tap 38:
To clean the connection to tap 38, tap 37 was closed and tap 38 was opened. The tube connected to
demineralized water was connected to drain point of tap 37. It was rinsed with demineralized water
for 55 seconds. Next, the same cycle was performed with distilled water by connecting the tube
attached to distilled water to drain point of tap 37. In this way the bottom line was cleaned underneath.

33
- Cleaning of the inside of the reactor:
Firstly, a flow of 0,390 L/s was set via a flow meter. This flow was chosen, because it is worst-case to
the flow used in routine cleaning. On this way cleaning is executed under worst-case circumstances.
Next, the lid of the reactor was opened and the seal of the lid was removed and cleaned for 55 seconds
with demineralized water and afterwards for 55 seconds with distilled water.
The lid, the mixing baffle and the inside of the reactor were then cleaned four times with demineralized
water for 55 seconds. Between each rinse, one had to wait until the reactor was empty. Afterwards, a
visual control of cleanliness was done. If the reactor was not clean, an extra cleaning cycle was
performed. Additionally, the lid, the mixing baffle and the inside of the reactor were cleaned two times
with distilled water for 55 seconds. Between each rinse, one had to wait until the reactor was empty.
Lastly, the cleaned seal was attached to the lid of the reactor before the lid and bottom tap 14 were
closed.
- Cleaning of bottom tap 14:
The drain point connected to bottom tap 14 and bottom tap 14 itself were opened. The tap was
cleaned for 55 seconds with demineralized water and 55 seconds with distilled water. The reactor was
not dried to obtain a worst-case scenario for microbiological growth during the clean hold time of 3
days.
Revision 1
After receiving the results of the first cleaning run, the following changes to the procedure were
implemented in order to obtain better cleaning results. Firstly, the connection to tap 38 was cleaned
at the end of the cleaning run. Secondly, an extra cleaning cycle was introduced: the attachments on
the top of the reactor for automatic cleaning were cleaned with demineralized water for 15 seconds
followed by cleaning with distilled water for 15 seconds.
3.2.4.8. Chemical and microbiological sampling
Chemical sampling
Before sampling, visual inspection of the cleanliness of the reactor was performed by two certified
persons. Extra attention was given to the critical sites of the reactor. After cleaning a rinse sample was
taken, whereas swab samples and microbiological samples were taken after three days of clean hold
time.

34
1. Rinse sample
A rinse sample was taken by rinsing the lid and the inside of the reactor with approximately 5 L of
distilled water. The sample was collected in a clean, sterile glass bottle at tap 38. Then 40 mL was taken
and analyzed by TOC to evaluate the water quality. If the result was lower than 500 ppb, a European
standard for the quality of water [25], indicating an effective cleaning, the remaining sample was
divided in three clean, sterile glass bottles. These bottles were given at the appropriate laboratories
for the analysis of pH and conductivity and compared to their specifications recorded by the “European
Pharmacopeia 9.0 – Water for injections” [42]. Furthermore, the amount of particles was analyzed and
compared to their specifications recorded by the “USP – Particulate matter in ophthalmic solutions”
[43]. The specifications for the acceptable amount of particles for the cleaning validation of RTH 258
are more strict, namely 50% of the amount of particles recorded by the USP for ophthalmic solutions,
to assure an acceptable amount of particles in the final product. A summary of the specifications is
given in Table 3.12.
Afterwards, the content of the rinse sample was determined by TOC. In order to decide whether the
content of the rinse sample was acceptable, the result of the rinse sample obtained with TOC was
compared with the TOC result of a sample containing a concentration equal to the calculated criterion
in section 3.2.4.3.
Table 3.12: Summary of the specifications of the chemical analysis of the rinse sample
Chemical analysis TOC water Particle analysis pH Conductivity
Specification 500 ppb > 10 µm
> 25 µm
> 50 µm 5 -7 < 1.3 µS/cm
25/mL* 2/mL* 1/mL* *50% of the amount of particles recorded by the USP for ophthalmic solutions
2. Swab sample
After a minimum of three days of clean hold time, swab samples were taken at the predetermined
places, in the same way as explained in section 3.2.3.1. These samples were analyzed by TOC.
In order to determine whether the content of the swab sample was acceptable, the result of each swab
sample obtained with TOC was compared with the TOC result of a sample containing a concentration
equal to the calculated criterion presented in section 1.2.1.6.

35
Microbiological sampling
After three days of clean hold time, but preceding the swab sampling, a microbiological rinse sample
was taken. In this way, the rinse sample was not affected by the swabs. Rinse samples were taken by
rinsing the lid and the inside of the reactor with approximately 800 mL of distilled water and collecting
the fluid in a clean, sterile glass bottle with a 0.9% w/v saline solution. After analysis the results were
compared with its specification (100 CFU/100mL), which is 100 times smaller than the specification for
water described in the European Pharmacopeia (100 CFU/mL) to control any microbiological
contamination.
After taking microbiological rinse samples and swab samples, additional contact surface samples were
taken. Therefore the bottom of the stirrer, the wall, the bottom and the lid of the reactor were sampled
using RODAC plates, which were then incubated to determine the total colony forming units (CFU).
After analysis, the results were compared with the specifications managed by Alcon for class C units.
A summary of the specifications is given in Table 3.13.
Table 3.13: Summary of the specifications of the microbiological analysis
Microbiological analysis Specification
Rinse sample < 100 CFU/100mL
RODAC plate < 1 CFU/cm²

36
4. Results and discussion
4.1. Molybdenum test
The molybdenum test was carried out on the reactor and the tubes used for the determination of the
cleanability. Both tests resulted in a red color, meaning that the reactor as well as the tubes contain
molybdenum and thus consist of stainless steel 316. Therefore, it can be concluded that the results of
the cleanability are representative for the reactor.
4.2. Determination of the cleanability
4.2.1. RTH 258
After five minutes, every spot was rinsed away. When a UV lamp was used, however, some fluorescent
residues were seen for 25 minutes. As with the other samples, the third part of the tube remained
dirty for a longer period than the other parts, because water was already soiled when it had reached
the last part. It seems that RTH 258 prevents adhesion of riboflavin to the tube, because it was harder
to clean riboflavin alone. It can be concluded that RTH 258 was the most easy product to clean, when
the results were compared to those from the other products. A time lapse image of ‘RTH
258/riboflavin’ is given in Appendix 7.4.1.
Table 4.1: Flow before and after the experiment and time for complete removal of RTH 258
Flow before (mL/min) Flow after (mL/min) Time for complete removal (min)
1 154.7 152.3 25
2 152.3 152.6 25
3 152.6 152.3 25
4.2.2. Soy peptone
Before the start of the test, a separation between soy and riboflavin was noticed at the spots on the
stainless steel tube, shown in Appendix 7.4.2. The same observation was made with the stock solution
of soy, shown in Figure 4.1. Therefore it can be concluded that soy and riboflavin possibly are
immiscible. Within the first two minutes after the test was started, all the spots were already
disappeared, however, when a UV lamp was used, some residues were still visible. These residues
probably derive from riboflavin, because the mixture ‘soy peptone/riboflavin’ has a similar time of
complete removal as riboflavin alone. It is a little bit shorter than riboflavin, probably due to a smaller
content of riboflavin (5%) in the mixture ‘soy peptone/riboflavin’ than riboflavin alone (12%). It is

37
assumed that soy peptone was already cleaned after approximately five minutes in the absence of
riboflavin, which could be tested in the future. Due to the immiscibility of soy and riboflavin no
conclusive statements can be made of the cleanability results of soy, but probably soy peptone on its
own has a less or similar cleanability than RTH 258, indicating that soy probably will not be applicable
as worst-case product. However, extra tests are necessary to conclude if soy could be used as worst-
case product for RTH 258 or not.
Fig. 4.1.: Stock solution of soy before, directly after and one hour after adding riboflavin
Table 4.2: Flow before and after the experiment and time for complete removal for soy peptone
Flow before (mL/min) Flow after (mL/min) Time for complete removal (min)
1 145.7 146.3 90
2 148.0 145.8 60
3 150.3 149.2 60
4.2.3. Brown rice protein
Before the start chapped, hard spots were observed, as shown in Appendix 7.4.3. When the spots were
observed in detail, one can see that brown rice protein was partially separated from riboflavin.
However, the precipitated stock solution of the mixture ‘brown rice/riboflavin’ did not show any
separation of the two substances, as was observed with soy. One hour of rinsing resulted in the
disappearance of the yellow spots, however fluorescent residues were seen for two hours and 25
minutes. Brown rice probably inhibits the cleaning of riboflavin since fluorescent residues were seen
for a longer time than when riboflavin alone was applied. The third part of the tube remained dirty for
a longer time than the other parts, because water was already soiled when it had reached the last part
of the tube. Eventually, white spots remained on the tube until the end, as shown in Figure 4.2. Brown
rice protein probably has a strong adhesion strength on stainless steel, therefore one can conclude
that it is hard to clean brown rice by these conditions. Perhaps by other conditions, such as the addition
of a detergent or a faster flow, cleaning would be easier. When comparing the results with those of

38
RTH 258, it can be concluded that brown rice protein is a potential worst-case product candidate,
because it is harder to clean than RTH 258 at these conditions.
Fig. 4.2.: White spot after cleaning
Table 4.3: Flow before and after the experiment and time for complete removal of brown rice
Flow before (mL/min) Flow after (mL/min) Time for complete removal (h)
1 145.5 145.7 > 6
2 146.6 150.8 > 6
3 155.9 151.2 > 6
4.2.4. Pea protein isolate
The stock solution of pea protein isolate was more viscous than the other solutions, therefore the small
spots were not spread on the tube. Overnight drying resulted in porous and crumbling spots. After five
minutes of rinsing, the contour of the spots was still visible. Even after thirty minutes, some residues
of the spots were still noticeable. The third part of the tube remained dirty for a longer time than the
other parts, because water was already soiled when it reached the last part of the tube. After one hour,
residues were still detectable with a UV light and white spots remained on the tube until the end, as
was seen earlier with brown rice protein. Thus, similar results were obtained for pea protein isolate
and brown rice protein, concluding that pea protein isolate is also a potential worst-case product
candidate. A time lapse image of ‘pea protein isolate/riboflavin’ is given in Appendix 7.4.4.
Table 4.4: Flow before and after the experiment and time for complete removal for pea protein
Flow before (mL/min) Flow after (mL/min) Time for complete removal (h)
1 153.3 148.1 > 6
2 151.7 149.4 > 6
3 151.5 153.2 > 6

39
4.2.5. Whey protein isolate
The stock solution of whey protein isolate was, just like soy, not precipitated. After five minutes all
spots were disappeared, however, when a UV lamp was used, some residues were still visible for one
hour, as shown in the time lapse image of ‘whey protein isolate/riboflavin’ given in Appendix 7.4.5.
These residues probably derive from riboflavin, because it has similar results as riboflavin alone.
However this statement cannot be certified. Some interactions between the two substances could
have occurred. The time for complete removal is a little bit shorter than riboflavin alone, probably due
to a smaller content of riboflavin (5%) in the mixture ‘whey protein isolate/riboflavin’ than riboflavin
alone (12%). Thus, one cannot conclude with certainty that this result was only determined by
riboflavin. Therefore only conclusions can be taken about the mixture: ‘whey protein isolate/riboflavin’
is harder to clean than ‘RTH 258/riboflavin’ and could be used as worst-case product by these
conditions. As with the other samples, the third part of the tube remained dirty for a longer time than
the other parts, because water was already soiled when it reached the last part of the tube.
Table 4.5: Flow before and after the experiment and time for complete removal of whey protein
Flow before (mL/min) Flow after (mL/min) Time for complete removal (min)
1 154.2 153.4 60
2 145.0 151.7 75
3 147.2 153.1 60
4.2.6. Riboflavin
After five minutes all the spots were disappeared, however, when a UV lamp was used, some residues
were still visible for one hour. As with the other samples, the third part of the tube remained dirty for
a longer time than the other parts, because water was already soiled when it had reached the last part
of the tube. When the results are compared with those of RTH 258, it can be concluded that it is harder
to clean riboflavin indicating that riboflavin is a potential worst-case product candidate. A time lapse
image of riboflavin is given in Appendix 7.4.6.
Table 4.6: Flow before and after the experiment and time for complete removal of riboflavin
Flow before (mL/min) Flow after (mL/min) Time for complete removal (min)
1 153.0 154.0 90
2 151.2 153.9 90
3 151.2 153.4 90

40
4.2.7. Overall conclusion cleanability
An overall scheme of the cleanability of the six mixtures under the investigated conditions is given in
Figure 4.3. Up to now, potential candidates for the worst-case product of RTH 258 are riboflavin, ‘whey
protein isolate/riboflavin’, ‘pea protein isolate/riboflavin’ and ‘brown rice protein/riboflavin’.
Fig. 4.3: Scheme of the cleanability results of the six products at the investigated conditions

41
4.3. Determination of the solubility
4.3.1. Soy peptone
To obtain a calibration curve, samples with a predetermined concentration were measured by UV/VIS
spectrophotometry. The results and the calibration curve are represented in Appendix 7.5.1. The
unknown concentration of the samples with an excess of soy can be calculated by the Lambert-Beer
law:
𝐸 = 𝜀 ∗ 𝑐 ∗ 𝑙
E: Extinction
𝜀 : Molar extinction coefficient (L/(mol*cm))
c : Concentration (mol/L)
l : Path length through the sample (cm)
It can be concluded that soy has a solubility of approximately 6.580 g/100 mL in water at room
temperature, presented in Table 4.7. Thus, soy has a lower solubility in water than RTH 258
(30 g/100mL) which indicates that soy peptone can be used as worst-case product for RTH 258 in terms
of solubility in water.
Table 4.7: Calculation of the concentration of the samples with an excess of soy
Sample Absorbance 1/100 diluted concentration (mg/100mL)
Concentration (g/100mL)
Mean concentration (g/100mL) ±
stdev
Total mean concentration (g/100mL) ±
stdev
Excess 1
0.541 64.9 6.493
6.509 ± 0.03125
6.580 ± 0.1
0.540 64.8 6.481
0.546 65.5 6.552
Excess 2
0.537 64.5 6.445
6.521 ± 0.05353 0.546 65.5 6.552
0.547 65.6 6.564
Excess 3
0.555 66.6 6.660
6.711 ± 0.03923 0.560 67.2 6.719
0.563 67.5 6.755
4.3.2. Brown rice protein
A calibration curve was made by measuring samples with a predetermined concentration by UV/VIS
spectrophotometry. The results and the calibration curve are represented in Appendix 7.5.2. The
unknown concentration of the samples with an excess of brown rice protein are calculated by the
Lambert-Beer law. The results are presented in Table 4.8, concluding that brown rice protein has a

42
solubility of 6.774 mg/100 mL in water at room temperature. Brown rice has thus a lower solubility in
water than RTH 258 (30 g/100mL) indicating that brown rice protein could be a good worst-case
product for RTH 258 while cleaning is performed using water.
Table 4.8: Calculation of the concentration of the samples with an excess of brown rice
Sample Absorbance Concentration (mg/100mL)
Mean concentration (mg/100mL) ±
stdev
Total mean concentration (mg/100mL) ±
stdev
Excess 1
0.043 7.945
7.764 ± 0.2571
6.774 ± 0.7576
0.043 7.945
0.040 7.400
Excess 2
0.034 6.309
6.248 ± 0.3736 0.036 6.673
0.031 5.764
Excess 3
0.035 6.491
6.309 ± 0.1485 0.033 6.127
0.034 6.309
4.3.3. Pea protein isolate
A calibration curve, made in the same way as for the other products, together with the results is
represented in Appendix 7.5.3. The unknown concentration of the samples with an excess of pea
protein was calculated. The results are presented in Table 4.9, indicating that pea protein isolate has a
solubility of 183.3 mg/100 mL in water at room temperature. Thus, pea protein has a lower solubility
in water than RTH 258 (30 g/100mL) indicating that pea protein isolate could be a good worst-case
product for RTH 258 in terms of solubility in water.
Table 4.9: Calculation of the concentration of the samples with an excess of pea protein
Samples Absorbance
Calculated 1/10 diluted
concentration (mg/100mL)
Calculated concentration (mg/100mL)
Mean concentration (mg/100mL) ±
stdev
Total mean concentration (mg/100mL) ±
stdev
Excess 1
0.221 11.39 113.9
116.5 ± 1.910
183.3 ± 48.39
0.228 11.73 117.3
0.230 11.83 118.3
Excess 2
0.456 23.02 230.2
229.5 ± 0.6174 0.455 22.97 229.7
0.453 22.87 228.7
Excess 3
0.401 20.30 203.0
204.0 ± 0.8084 0.403 20.40 204.0
0.405 20.50 205.0

43
4.3.4. Whey protein isolate
A calibration curve was made in the same way as the other products. The calibration curve and results
are represented in Appendix 7.5.4. The unknown concentration of the samples with an excess of whey
protein was calculated. The results are presented in Table 4.10, concluding that whey protein isolate
has a solubility of 5.559 g/100 mL in water at room temperature. Thus, whey protein has a lower
solubility in water than RTH 258 (30 g/100mL) indicating that whey protein isolate can be used as
worst-case product for RTH 258 in terms of solubility in water.
Table 4.10: Calculation of the concentration of the samples with an excess of whey protein
Samples Absorbance
Calculated 1/100 diluted concentration
(g/100mL)
Calculated concentration
(g/100mL)
Mean concentration (g/100mL) ±
stdev
Total mean concentration (g/100mL) ±
stdev
Excess 1
0.586 0.057 5.688 5.622 ± 0.06169
5.559 ± 0.2960
0.581 0.056 5.639
0.571 0.055 5.540
Excess 2
0.559 0.054 5.421
5.503 ± 1.057 0.568 0.055 5.510
0.575 0.056 5.579
Excess 3
0.570 0.055 5.530 5.553 ± 0.02032
0.572 0.055 5.550
0.575 0.056 5.579
4.3.5. Riboflavin
First the wavelength giving maximal absorbance (λmax) was determined by measuring the whole
absorption spectrum of riboflavin, given in Appendix 7.5.5. The highest absorbance was found at λ =
223 nm. Thus, first the samples for obtaining the calibration curve were measured at this wavelength,
presented in Appendix 7.5.5. Next, the samples with an excess of riboflavin were measured at the same
wavelength, giving the results shown in Table 4.11. It can be concluded that riboflavin has a solubility
14.25 mg/100 mL at room temperature. Thus, riboflavin has a lower solubility in water than RTH 258
(30 g/100mL) indicating that riboflavin could be a good worst-case product for RTH 258 in terms of
solubility in water.

44
Table 4.11: Calculation of the concentration of the samples with an excess of riboflavin
Samples Absorbance
Calculated 1/10 diluted
concentration (mg/100mL)
Calculated concentration (mg/100mL)
Mean concentration (mg/100mL) ±
stdev
Total mean concentration (mg/100mL)
± stdev
Excess 1
0.896 1.380 13.80
13.86 ± 0.1131
14.25 ± 14.25
0.910 1.402 14.02
0.894 1.377 13.77
Excess 2
0.950 1.466 14.66
14.48 ± 0.1300 0.935 1.442 14.42
0.931 1.435 14.35
Excess 3
0.934 1.440 14.40
14.40 ± 0.02596 0.936 1.443 14.43
0.932 1.437 14.37
4.3.6. Overall conclusion solubility
Using UV/VIS spectrophotometry, the investigated products were ranked from low to high solubility in
water. The less soluble, the more worst-case. Thus brown rice protein is the most worst-case product
in terms of solubility in water.
Fig. 4.4: Scheme of the results of the solubility in water at room temperature of the six products ranked from low to high solubility in water

45
4.4. Cleaning validation
4.4.1. Determination of the recovery of swabbing on stainless steel and glass
Stainless steel
A stock solution of soy peptone (0.05 mg/mL) was spotted on three different stainless steel plates with
a surface area of 100 cm². Next, the recovery experiment was performed as was told in section 3.2.4.2.
The results of the experiment are presented in Table 4.12. The recovery was calculated by formula
given in section 3.2.4.2. All values are situated above 50% and do not differ more than 5% of the
average. Therefore, it can be concluded that the average recovery of soy peptone on stainless steel
equals 68.20%.
The obtained recovery is lower than the recovery most of the companies ask (75%), however it was
acceptable for Alcon, because research was still ongoing to determine if soy peptone could be used as
worst-case product for RTH 258. Therefore this swab method and TOC analysis are accepted to use for
the cleaning validation of soy peptone. However, in the future, when soy peptone would be elected as
worst-case product, extra recovery studies can be performed to obtain a higher recovery, meaning
that the cleaning validation must be performed again.
Table 4.12: Calculation of the recovery of soy peptone on stainless steel
Sample Result (ppb) Mean result (ppb) Recovery (%)
Positive control 574 584 585 581 -
Diluent control 63.2 66.3 63.6 64.37 -
Swab control 89.8 96.2 96.9 94.3 -
Coupon control 1 160 167 168 165 -
Coupon control 2 162 168 165 165 -
Coupon control 3 158 165 172 165 -
Test 1 508 506 511 508.3 66.46
Test 2 528 528 528 528.0 70.26
Test 3 507 521 519 515.7 67.88
Mean recovery (%) 68.20
Glass
A stock solution of soy (0.05 mg/mL) was spotted on three different glass plates with a surface area of
100 cm². The results of the recovery experiment (section 3.2.4.2) are presented in Table 4.13. The
recovery was calculated by the formula given in section 3.2.4.2. All values are situated above 50% and
do not differ more than 5% of the average. Therefore, it can be concluded that the average recovery
of soy peptone on glass equals 75.84%. This value is acceptable, meaning that the swab method and
analysis by TOC are suitable for the cleaning validation of soy peptone.

46
Table 4.13: Calculation of the recovery of soy peptone on glass
Sample Result (ppb) Mean result (ppb) Recovery (%)
Positive control 495 495 495 495.00 -
Diluent control 67.5 67.6 67.5 67.53 -
Swab control 120 121 121 120.67 -
Coupon control 1 232 232 232 232.00 -
Coupon control 2 261 268 261 263.62 -
Coupon control 3 261 258 258 259.00 -
Test 1 566 567 567 566.67 78.29
Test 2 587 590 576 584.33 75.02
Test 3 572 581 576 576.33 74.21
Mean recovery (%) 75.84
4.4.2. Recalculation of the criteria for sampling
Criterion for swab samples on stainless steel
PDE concept
Due to the brown color of the solution, as shown in Figure 4.5, and to avoid damage to the TOC
apparatus, the samples were not measured by TOC. Visual inspection can be done in order to compare
the color of the samples taken during cleaning validation with the corresponding criterion.
Nevertheless, the color of the samples is doubtful: if a rinsing sample would have this color, one would
in no case conclude that the reactor is clean. Furthermore since the 1/1000 criterion is more strict, the
1/1000 criterion will be used during cleaning validation.
Fig. 4.5: Solutions with a concentration (mg/mL) of the criterion
1/1000 limit
A low corresponding TOC result was measured for every sample, due to the low criterion based on the
1/1000 limit. These values are more strict than the specification of water after cleaning (500 ppb).
Therefore a specific analysis method, such as ELISA, is recommended, because it will be hard to obtain
lower results, since water and the swab itself will also contribute to the obtained value.

47
Table 4.14: TOC results based on the 1/1000 limit for every sampling location
Sampling location Surface (cm²)
Corresponding criterion (mg/mL)
Corresponding TOC result (ppb)
Wall of the reactor 100 1.230 * 10-4 205
Bottom of the reactor 100 1.230 * 10-4 205
Bottom of the stirrer 122.7 1.509 * 10-4 173
Endings of the bottom piping 107.4 1.292 * 10-4 187
Connection 1 on the top of the vessel 75.39 0.9273 * 10-4 224
Connection 2 on the top of the vessel 94.24 1.159 * 10-4 184
Connection 3 on the top of the vessel 94.24 1.159 * 10-4 184
Inside of the lid 100 1.230 * 10-4 205
Criterion for swab samples on glass
Table 4.15: TOC result of the criterion for the swab sample on glass for the window of the
reactor
Concentration (mg/mL) Corresponding TOC result (ppb)
PDE 13.95 Brown color - not measured
1/1000 limit 5.261 * 10-5 180
Criterion for rinse samples
Table 4.16: TOC results of the criterion for rinse samples
Concentration (mg/mL) Corresponding TOC result (ppb)
PDE 141.3 Brown color - not measured
1/1000 limit 5.329 * 10-4 385
4.4.3. Chemical and microbiological sampling
4.4.3.1. Cleaning 1
After cleaning it can be concluded that the reactor was visible clean. The results of the water analysis
by TOC, particle analysis, analysis of the pH and conductivity, and the result of the rinse sample are
acceptable, as presented in Table 4.17 and 4.19. However, higher values were obtained for the swab
samples at the endings of the bottom piping and the three connections on the top of the vessel, shown
in Table 4.18 marked in red. Therefore the procedure was changed. Firstly, the connection to tab 38
was cleaned at the end of the cleaning procedure instead of at the beginning, because during the whole
cleaning procedure soiled water passes these endings of the bottom piping making them dirty again.
Secondly, an extra cleaning cycle was introduced to clean the attachments alone. The result of the
inside of the lid does not differ a lot from the TOC value of the corresponding criterion, therefore no

48
change was made for this location. However, extra attention was given to the inside of the lid in the
next cleaning cycles.
Table 4.17: Results of the chemical analysis of the first cleaning (part I)
Chemical analysis TOC water Particle analysis pH Conductivity
Specification 500 ppb > 10 µm
> 25 µm
> 50 µm 5 -7 < 1.3 µS/cm
25/mL 2/mL 1/mL
Result 277 ppb 3/mL 0/mL 0/mL 5.790 0.92 µS/cm
Table 4.18: Results of the chemical analysis of the first cleaning (part II)
Chemical analysis: Content swab samples
Sampling places Specification (ppb) Result (ppb)
Wall of the reactor 205 88.9
Bottom of the reactor 205 115
Bottom of the stirrer 173 149
Endings of the bottom piping 187 1060
Window 180 106
Connection 1 224 214
Connection 2 184 4140
Connection 3 184 2870
Inside of the lid 205 241
Blank water - 49.9
Blank + swab - 66.6
Table 4.19: Results of the chemical analysis of the first cleaning (part III)
Chemical analysis: Content rinse sample
Specification (ppb) Result (ppb)
385 227
The microbiological samples do not exceed their corresponding criteria as is shown in Table 4.20 and
4.21.
Table 4.20: Results of the microbiological analysis of the first cleaning (part I)
Microbiological analysis Rinse sample
Specification < 100 CFU/100mL
Result Test 10 CFU/100mL
Blank 1 CFU/100mL
Table 4.21: Results of the microbiological analysis of the first cleaning (part II)
Microbiological analysis RODAC plate
Specification < 1 CFU/cm²
Result
Lid 0 CFU/cm²
Bottom of the stirrer 0.04 CFU/cm²
Wall 0 CFU/cm²
Bottom 0.16 CFU/cm²

49
4.4.3.2. Cleaning 2
After cleaning it can be concluded that the reactor was visible clean. Furthermore, better results were
obtained after revision of the cleaning procedure, with the exception of the rinse sample, although
these values do not exceed the limit of water (500 ppb) as shown in Table 4.22 - 4.24. A possible
explanation could be that the same soiling batch as in the first cleaning cycle was used and was not
always stored in the refrigerator. For the next cleaning procedures a new soiling batch will be made
immediately before soiling of the reactor. Moreover a more specific analysis method is required to
analyze the contribution of soy to the result of the sample. ELISA could be a good alternative for TOC,
however a few problems were experienced (Master thesis, Van de Voorde - Onderbeke Julie, 2017).
Although the results of the three connections do not exceed their specifications anymore, the result
of the endings of the bottom piping is lower than the previous cleaning, but still exceeds its
specification. Similar results were obtained for the inside of the lid. Extra attention will be given at
these locations during the following cleaning cycle. Furthermore, the result of the bottom of the
reactor exceeded its specification. During sampling, a person was standing on the bottom of the
reactor, which could explain this high value. During the following cleaning, the swab sample of the
bottom of the reactor will be taken first.
Table 4.22: Results of the chemical analysis of the second cleaning (part I)
Chemical analysis TOC water Particle analysis pH Conductivity
Specification 500 ppb > 10 µm
> 25 µm
> 50 µm 5 -7 < 1.3 µS/cm
25/mL 2/mL 1/mL
Result 454 ppb 13/mL 0/mL 0/mL 5.761 1.28 µS/cm
Table 4.23: Results of the chemical analysis of the second cleaning (part II)
Chemical analysis: Content swab samples
Sampling places Specification (ppb) Result (ppb)
Wall of the reactor 205 128
Bottom of the reactor 205 264
Bottom of the stirrer 173 117
Endings of the bottom piping 187 460
Window 180 114
Connection 1 224 112
Connection 2 184 134
Connection 3 184 147
Inside of the lid 205 247
Blank water - 61.2
Blank + swab - 78.9

50
Table 4.24: Results of the chemical analysis of the second cleaning (part III)
Chemical analysis: Content rinse sample
Specification (ppb) Result (ppb)
385 454
Although the same explanation as for the swab sample taken at the bottom of the reactor could
be given for the higher result of the RODAC plate taken at the bottom of the reactor, it does not
exceed its specification. RODAC samples were taken after the swab samples to prevent
contamination of the sampling place, thus it is not possible to take this sample in the beginning.
But the first microbiological sample will be taken at the bottom of the reactor in the following
cleaning cycle. The results are given in Table 4.25 and 4.26.
Table 4.25: Results of the microbiological analysis of the second cleaning (part I)
Microbiological analysis Rinse sample
Specifications < 100 CFU/100mL
Result Test 36.5 CFU/100mL
Blank 3 CFU/100mL
Table 4.26: Results of the microbiological analysis of the second cleaning (part II)
Microbiological analysis RODAC plate
Specification < 1 CFU/cm²
Result
Lid 0 CFU/cm²
Bottom of the stirrer 0 CFU/cm²
Wall 0 CFU/cm²
Bottom 0.24 CFU/cm²
4.4.3.3. Cleaning 3
After cleaning it can be concluded that the reactor was visible clean. The results of the water analysis
by TOC, particle analysis, analysis of the pH and conductivity, and the rinse sample are acceptable, as
presented in Table 4.27 and 4.29. Despite the fact that higher results of the swab samples were
obtained after the third cleaning cycle, every result is lower than the specification of water (500 ppb),
as shown in Table 4.28. According to the available analysis methods this cleaning cycle is not conform
to the specifications, however there is a need for a more specific analysis method to analyze the
contribution of soy to the result of the sample. TOC is a non-specific method and will also include other
substances. ELISA could be a good alternative for TOC, although a few problems were experienced
(Master thesis, Van de Voorde - Onderbeke Julie, 2017).

51
Table 4.27: Results of the chemical analysis of the third cleaning (part I)
Chemical analysis TOC water Particle analysis pH Conductivity
Specification 500 ppb > 10 µm
> 25 µm
> 50 µm 5 -7 < 1.3 µS/cm
25/mL 2/mL 1/mL
Result 252 ppb 7/mL 0/mL 0/mL 6.003 0.93 µS/cm
Table 4.28: Results of the chemical analysis of the third cleaning (part II)
Chemical analysis: Content swab samples
Sampling places Specification (ppb) Result (ppb)
Wall of the reactor 205 240
Bottom of the reactor 205 208
Bottom of the stirrer 173 487
Endings of the bottom piping 187 462
Window 180 278
Connection 1 224 349
Connection 2 184 386
Connection 3 184 160
Inside of the lid 205 251
Blank water - 28.0
Blank + swab - 34.0
Table 4.29: Results of the chemical analysis of the third cleaning (part III)
Chemical analysis: Content rinse sample
Specification (ppb) Result (ppb)
385 252
The microbiological rinse sample exceeded its specifications (Table 4.30), in contrast to the RODAC
samples which were acceptable (Table 4.31). An explanation for the difference between the results of
the samples could be due to the small piping at the bottom of the reactor with ‘dead points’ were the
rinse sample passes, but the RODAC samples do not have any contact with this part of the reactor.
These pipings probably will be more moist and more sensitive to microbial growth. Another
explanation could be to question the sampling material and method: Was the bottle sterilized? Were
there gloves used? Etc. To explain the exceedance of the specification of the microbiological rinse
sample, an early event should be reported. After the second cleaning, the soiling batch of already two
weeks old, was used to soil the reactor. The reactor had to be cleaned after three days of dirty hold
time, but an excess of fungus was observed when the reactor was opened. The reactor was cleaned
thoroughly with demineralized and distilled water. In addition the reactor was sanitized with steam to
assure a fungus free reactor. However, no validation was done of the microbiological cleanliness due
to a lack of time. Afterwards a new soiling batch was made to soil the reactor to start the third cleaning.
Therefore it could be that there were still some remnants of fungus, although no visual growth was

52
seen after three days of dirty hold time. In order to prevent microbial growth, an extra drying step
could have been included, however, no time remained to validate this.
Table 4.30: Results of the microbiological analysis of the third cleaning (part I)
Microbiological analysis Rinse sample
Specification < 100 CFU/100mL
Result Test Overgrowth
Blank 3 CFU/100mL
Table 4.31: Results of the microbiological analysis of the third cleaning (part II)
Microbiological analysis RODAC plate
Specification < 1 CFU/cm²
Result
Lid 0 CFU/cm²
Bottom of the stirrer 0 CFU/cm²
Wall 0 CFU/cm²
Bottom 0.12 CFU/cm²
4.4.3.4. Cleaning 4
After cleaning it can be concluded that the reactor was visible clean. Similar results as the third cleaning
cycle were obtained. The results of the blank solution and the blank + swab solution however were
higher than 100 ppb, making these results unreliable. The results are presented in Table 4.32 - 4.34.
Table 4.32: Results of the chemical analysis of the fourth cleaning (part I)
Chemical analysis TOC water Particle analysis pH Conductivity
Specification 500 ppb > 10 µm
> 25 µm
> 50 µm 5 -7 < 1.3 µS/cm
25/mL 2/mL 1/mL
Result 212 ppb 1/mL 0/mL 0/mL 6.046 1.0 µS/cm
Table 4.33: Results of the chemical analysis of the fourth cleaning (part II)
Chemical analysis: Content swab samples
Sampling places Specification (ppb) Result (ppb)
Wall of the reactor 205 121
Bottom of the reactor 205 215
Bottom of the stirrer 173 280
Endings of the bottom piping 187 104
Window 180 213
Connection 1 224 211
Connection 2 184 157
Connection 3 184 420
Inside of the lid 205 114
Blank water - 115
Blank + swab - 156

53
Table 4.34: Results of the chemical analysis of the fourth cleaning (part III)
Chemical analysis: Content rinse sample
Specification (ppb) Result (ppb)
385 212
The microbiological samples did not exceed its specifications, as shown in Table 4.35 and 4.36. A
slightly higher value was observed for the RODAC sample taken at the bottom of the reactor, an
explanation for which was already given in the earlier sections.
Table 4.35: Results of the microbiological analysis of the fourth cleaning (part I)
Microbiological analysis Rinse sample
Specification < 100 CFU/100mL
Result Test 11 CFU/100mL
Blank 3 CFU/100mL
Table 4.36: Results of the microbiological analysis of the fourth cleaning (part I)
Microbiological analysis RODAC plate
Specification < 1 CFU/cm²
Result
Lid 0 CFU/cm²
Bottom of the stirrer 0 CFU/cm²
Wall 0 CFU/cm²
Bottom 0.2 CFU/cm²
4.4.3.5. Overall conclusion cleaning validation
A summary of the results of the four cleaning cycles is given in Figure 4.6. According to the available
analysis methods these cleaning cycles are not conform to the specifications, however there is a need
for a more specific analysis method to analyze the exact amount of soy residue in order to obtain more
reliable results. However, product-specific assays for biologicals, such as immunoassays, may not be
adequate when they are used alone: a negative result can be the result of denaturation of the protein.
Therefore product-specific assays should be coupled with the non-specific method TOC to detect
protein residues. Moreover, cleaning validation has to be done by three acceptable cleaning cycles.
Fig. 4.6: Summary of the results of the four cleaning cycles, with C.A.: Chemical Analysis and M.A.: Microbiological analysis and a blue line indicating the revision after cleaning cycle 1

54
5. Conclusion
In order to determine a worst-case product for RTH 258, cleanability and solubility tests were
performed for five candidate worst-case products: soy peptone, brown rice protein, pea protein
isolate, whey protein isolate and riboflavin. Such a worst-case product should be harder to clean than
the reference product by the investigated conditions, so as to obtain cleaning settings that assure an
acceptable cleaning of the reference product.
Based on the results of the cleanability of riboflavin it can be concluded that riboflavin is harder to
clean than RTH 258 with demineralized water at a flow of approximately 150 ± 5 mL/min. Soy peptone
and riboflavin demonstrated to be immiscible, therefore no conclusive statements could be made of
the cleanability results of soy itself, but soy peptone on its own probably has a less or similar
cleanability than RTH 258, however extra tests are necessary to conclude if soy is a potential worst-
case product for RTH 258 or not. For Whey protein isolate conclusions can only be made about the
mixture ‘whey protein isolate/riboflavin’: the cleanability results of the mixture demonstrate a longer
time for complete removal than RTH 258. Thus, the mixture could be used as worst-case product. The
results of the cleanability experiments of brown rice protein and pea protein isolate indicate that
these two products are the most difficult products to clean by the used conditions. Judging from the
cleanability experiments, riboflavin, the mixtures ‘whey protein isolate/riboflavin’, ‘brown rice
protein/riboflavin’ and ‘pea protein isolate/riboflavin’ are the best candidates to use as worst-case
product for RTH 258.
In addition, a worst-case product should be less soluble in the investigated cleaning agent than the
reference product, indicating a more difficult cleaning by the investigated conditions. For all of the five
products, the solubility was lower than RTH 258 (30 g/100 mL): riboflavin (14.25 mg/100 mL), soy
peptone (6.58 g/100 mL), whey protein isolate (5.56 g/100 mL), pea protein isolate (183.3 mg/100 mL)
and brown rice protein (6.77 mg/100 mL). Based on the criterion of solubility, all of the five tested
products demonstrate to be potential candidates to use as worst-case product for RTH 258.
Combining the results of the cleanability and solubility experiments, riboflavin, ‘whey protein
isolate/riboflavin’, pea protein isolate and brown rice protein show to be the best candidates to use as
worst-case product for RTH 258. However, the final ease of cleaning should also be taken into account
in order to choose the ultimate, most suitable product. In this context, brown rice protein and pea
protein isolate have the most extreme results, indicating good worst-case product characteristics.
However, it must still be possible to clean the reactor with acceptable settings at all. Therefore it might
be better to select riboflavin or ‘whey protein isolate/riboflavin’ as worst-case product, since their
cleanability results are less different from RTH 258 than the other two products. To work more

55
efficiently only one substance should be used, therefore it probably is better to choose for riboflavin
alone. Moreover, riboflavin has the advantage of being easily detectable due to its fluorescent
character.
The cleaning validation of reactor 88, which can be used for the production of the RTH 258 formulation,
was performed using soy peptone. The choice for this protein resulted from the fact that an ELISA kit
specific for soy proteins was already available in-house at the start of the project. First, the recovery
of soy was determined on stainless steel (68.20%) and on glass (75.84%). The criterion determining the
acceptable amount of residue was calculated by the PDE principle and resulted in a brown solution.
Visual inspection can be done by comparing the color of the samples taken during cleaning validation
with the corresponding criterion. However, the color of the samples was doubtful: if a rinsing sample
would have this color, one would never conclude that the reactor is clean. The criterion determining
the acceptable amount of residue, as calculated by the 1/1000 principle, gave low results. Therefore,
a more specific analysis method such as ELISA is necessary. However, product-specific assays for
biologicals, such as immunoassays, may not be adequate when they are used alone: a negative result
can be the result of denaturation of the protein. Therefore product-specific assays should be coupled
with the non-specific method TOC to detect protein residues.
Since the first cleaning did not give satisfying results for the swab samples taken at the endings of the
bottom piping, connection 2 & 3 and the inside of the lid, the cleaning procedure was modified. Firstly,
the connection to tab 38 was cleaned at the end of the cleaning procedure instead of at the beginning,
because during the whole cleaning procedure soiled water passes these endings of the bottom piping
making them again dirty. Secondly, an extra cleaning cycle was introduced to clean the connections
alone. The result of the inside of the lid did not differ a lot from the TOC value of the corresponding
criterion, therefore no change was made for this location. More favorable results were obtained after
the second cleaning, however, some samples still exceeded their limits. The results from the third
cleaning were doubtful and therefore neglected. Furthermore, the results of the fourth cleaning are
unreliable due to high results of the blank samples. It could be concluded that a more specific analysis
method is required to analyze the contribution of soy to the result of the sample. TOC is a non-specific
method and will also include other substances. ELISA could be a good alternative for TOC, however
some problems were experienced (Master thesis, Van de Voorde - Onderbeke Julie, 2017).
In conclusion, extra cleanability tests for soy peptone are necessary to conclude if soy is suitable as
worst-case product for RTH 258 or not, however riboflavin, ‘whey protein isolate/riboflavin’, pea
protein isolate and brown rice protein are, with riboflavin being the best worst-case product candidate.
Nevertheless, we contend that the analysis method should change to a more specific method to

56
measure the exact amount of soy residue in order to obtain more reliable results. Moreover, cleaning
validation has to be done by three acceptable cleaning cycles, which has not occurred due to a lack of
time.

57
6. References
1. Morrow, T.H.F.L., Defining the difference what makes biologics unique. Biotechnology Health Care, 2004.
2. FDA. [cited 2016 26 oktober]; http://www.fda.gov/AboutFDA/Transparency/Basics/ucm194516.htm].
3. Skalko-Basnet, N., Biologics: the role of delivery systems in improved therapy. Biologics, 2014. 8: p. 107-14.
4. Medicinet, I. Picture of Eye Anatomy Detail. 2004; Available from: http://www.medicinenet.com/image-collection/eye_anatomy_detail_picture/picture.htm.
5. https://nei.nih.gov/. [cited 2016 29 oktober]; https://nei.nih.gov/health/maculardegen/armd_facts].
6. Michalska-Małecka, K., et al., Age related macular degeneration – challenge for future: Pathogenesis and new perspectives for the treatment. European Geriatric Medicine, 2015. 6(1): p. 69-75.
7. Veritti, D., V. Sarao, and P. Lanzetta, Neovascular age-related macular degeneration. Ophthalmologica, 2012. 227 Suppl 1: p. 11-20.
8. Wet Age Related Macular Degeneration Effect. Available from: http://glaznoy-doctor.ru/prochie-zabolevaniya/lechenie-suxoj-i-vlazhnoj-formy-vozrastnoj-makulyarnoj-degeneracii-setchatki.html.
9. Chexal, S.G., I. Berger, B. Jhaveri, C., A novel compound for the treatment of wet AMD. Retina Today, 2016: p. 72 - 78.
10. Genentech. The mechanism of action of Avastin. 2017 [cited 2017 2th of February]; Available from: https://www.avastin-hcp.com/about-avastin/proposed-moa.html.
11. www.who.int. [cited 2016 29 oktober 2016]; http://www.who.int/medicines/services/inn/en/].
12. FDA. FDA Approves New Biologic Treatment for Wet Age-Related Macular Degeneration. 2006 [cited 2017 12th of march]; Available from: https://www.fda.gov/NewsEvents/Newsroom/PressAnnouncements/2006/ucm108685.htm.
13. Agency, E.M., EPAR_Ranibizumab. EMA, 2007: p. 146. 14. Informatie, B.C.v.F. 2016 [cited 2016 2nd of november]; Available from:
http://www.bcfi.be/nl/start. 15. Alyamac Sukgen, E., et al., The Process of Retinal Vascularization after Anti-VEGF Treatment in
Retinopathy of Prematurity: A Comparison Study between Ranibizumab and Bevacizumab. Ophthalmologica, 2016.
16. Comparison of Age-related Macular Degeneration Treatments Trials Research, G., et al., Five-Year Outcomes with Anti-Vascular Endothelial Growth Factor Treatment of Neovascular Age-Related Macular Degeneration: The Comparison of Age-Related Macular Degeneration Treatments Trials. Ophthalmology, 2016. 123(8): p. 1751-61.
17. AG, N.P., Health Hazard Assessment Monograph - RTH258. 2016: p. 18. 18. Mayo, A., Process Selection Summary: ESBA1008 IVT (A00740). 2014: Alcon. p. 10. 19. Nassani, M., Cleaning Validation in the Pharmaceutical Industry. Journal of Validation
Technology, 2005: p. 58. 20. Agalloco, J.C., F., Validation of Pharmaceutical Processes third edition. 2007: Informa. 760. 21. Bicksler, R.C., J.; Ektefaie, E.; Guyader, M.; Hentschel, N.; LeBlanc, D.; Levy, P.; Rathore, A.;
Sillivan, D.; Stevens, B., Points to consider for biotechnology cleaning validation - technical reports no. 49. 2010: Parenteral Drug Association.
22. Das, S. Cleaning Validation. 2014 [cited 2016 2nd of november]; Available from: https://www.slideshare.net/SambhujyotiDas/cleaning-validation-a-complete-know-how.
23. Agency, E.M., Guidance on setting health based exposure limits for use in risk identification in the manufacture of different medicinal products in shared facilities. 2014: p. 11.

58
24. (APIC), A.P.I.C., Guidance on aspects of cleaning validation in active pharmaceutical ingredient plants. 2014: p. 55.
25. European Pharmacopeia (Ph.Eur. 9th edition). 26. Forsyth, R.J., Equipment hold time for cleaning validation. Pharmaceutical Technology, 2008.
32(4). 27. Asgharian, R.H., F.; Heydari, A., Step by Step How to Do Cleaning Validation. International
journal of pharmacy & life sciences, 2014. 5(3): p. 3345 - 3366. 28. Porter, R., Impact of API physicochemical properties on cleaning method design and cleaning
validation. Journal of Validation Technology, 2011: p. 96. 29. Pluta, L.S., R., Avoiding Pitfalls of Cleaning Validation. Journal of GSX Compliance, 2010. 14(3):
p. 62. 30. Solutions, R.P. A cost-effective approach to cleaning validation and verification
[cited 2017 19th of march]; Available from: http://www.ropack.com/2015/10/20/a-cost-effective-approach-to-cleaning-validation-and-verification/.
31. Nehete, J.Y., et al., Natural proteins: Sources, isolation, characterization and applications. Pharmacogn Rev, 2013. 7(14): p. 107-16.
32. Jackson, L.A.-t., F., Moorman, M.; Devries, J.; Tippett, R.; Swanson K.; Fu, T.; Salter, R.; Dunaif, G.; Estes, S.; Albills, S.; Gendel, S., Cleaning and other control and validation strategies to prevent allergen cross-contact in food-processing operations. Journal of food protection, 2007. 71(2): p. 458.
33. Hettiarachchy, N.S. and U. Kalapathy, Functional Properties of Soy Proteins. 1998. 708: p. 80-95.
34. Prakash, J., Rice bran proteins: properties and food uses. Crit Rev Food Sci Nutr, 1996. 36(6): p. 537-52.
35. Wang, C., et al., Physico-chemical and structural properties of four rice bran protein fractions based on the multiple solvent extraction method. Czech Journal of Food Sciences, 2016. 33(No. 3): p. 283-291.
36. Tamnak, S., et al., Physicochemical properties, rheological behavior and morphology of pectin-pea protein isolate mixtures and conjugates in aqueous system and oil in water emulsion. Food Hydrocolloids, 2016. 56: p. 405-416.
37. Teo, A., et al., Physicochemical properties of whey protein, lactoferrin and Tween 20 stabilised nanoemulsions: Effect of temperature, pH and salt. Food Chem, 2016. 197(Pt A): p. 297-306.
38. Bou, R., S. Cofrades, and F. Jiménez-Colmenero, Physicochemical properties and riboflavin encapsulation in double emulsions with different lipid sources. LWT - Food Science and Technology, 2014. 59(2): p. 621-628.
39. b.v., S.J., Molybdeen test 960 voor Roestvaststaal. The Netherlands. p. 2. 40. Baka, E., J.E. Comer, and K. Takacs-Novak, Study of equilibrium solubility measurement by
saturation shake-flask method using hydrochlorothiazide as model compound. J Pharm Biomed Anal, 2008. 46(2): p. 335-41.
41. Simonian, M.H., Spectrophotometric determination of protein concentration Current protocols in cell biology (A.3B.1 - 1.3B.7), 2002.
42. European Pharmacopeia (Ph. Eur.) 9th Edition: water for injections (01/2009:0169). Vol. 1. 2017.
43. USP 36: Physical tests / Particulate matter in Ophtalmic Solutions. 2013.

59
7. Appendix
7.1. Brinox Reactor 88
7.2. Calculation of the surface of reactor 88

60
Diameter cylinder d 988 cm²
Height cylinder h 585 cm²
Height lid h1 185 cm²
Truncated cylinder h2 105 cm²
Height bottom h3 97 cm²
Diameter manhole d1 350 cm²
Height manhole h4 97 cm²
Length mixing baffle
h6 910 cm²
Diameter mixing baffle
d2 125 cm²
Diameter agitator shaft
d3 35 cm²
Length bottom line l 858 cm²
Diameter cone k 584 cm²
Part of the reactor Calculation Area (cm²)
Top of the reactor = π*((d/2)²+h1²) 8742
Bottom of the reactor = π*((d/2)²+h3²) 7962
Manhole elevation = π*d1*h4 1067
Mixing baffle = π*d3*h6 1001
Agitator shaft =2π*(d2/2)² 245
Bottom line = π*dia*l 701
Manhole lid = π*((d1/2)²+h5²) 962
Truncated cylinder = ((d+k)/2)* π*sqr(h²+((d-
k)/2)²) 15282
Side of the truncated cylinder = (π*k*h2)/2 963
Total 36925

61
7.3. Sampling plan of reactor 88
Figure 7.7: Sampling places indicated at reactor 88

62
7.4. Cleanability results
7.4.1. Time lapse images of ‘RTH 258/riboflavin’ on the stainless steel tube

63
7.4.2. Time lapse images of ‘soy peptone/riboflavin’ on stainless steel tube

64
7.4.3. Time lapse images of ‘brown rice protein/riboflavin’ on the stainless steel tube

65
7.4.4. Time lapse images of ‘pea protein isolate/riboflavin’ on the stainless steel
tube

66
7.4.5. Time lapse images of ‘whey protein isolate/riboflavin’ on the stainless steel
tube

67
7.4.6. Time lapse images of riboflavin on the stainless steel tube

68
7.5. Solubility – calibration curve
7.5.1. Soy peptone
Table 7.1.: Measurement of the absorbance of the samples of soy peptone to create a calibration curve
Concentration (mg/100mL)
1/100 diluted concentration (mg/100mL)
Absorbance
0 0 0
251.4 2.514
0.018
0.016
0.019
500.7 5.007
0.038
0.038
0.037
749.2 7.492
0.056
0.054
0.056
1000.0 10.00
0.073
0.075
0.074
1256.0 12.56
0.108
0.105
0.107
Fig. 7.1: Calibration curve of soy peptone obtained by UV/VIS spectrophotometry
y = 0,0084x - 0,0044R² = 0,9853
-0,02
0
0,02
0,04
0,06
0,08
0,1
0,12
0 2 4 6 8 10 12 14
Ab
sorb
ance
Concentration (mg/100mL)
Absorbance Soy Peptone

69
7.5.2. Brown rice protein
Table 7.2.: Measurement of the absorbance of the samples of brown rice protein to create a calibration curve
Concentration (mg/100mL)
Absorbance
0 0
1.00
0.006
0.005
0.004
2.00
0.010
0.009
0.010
3.2
0.018
0.016
0.015
4.0
0.020
0.022
0.023
5.0
0.025
0.027
0.028
Fig. 7.2: Calibration curve of brown rice protein obtained by UV/VIS spectrophotometry
y = 0,0055x - 0,0007R² = 0,9832
-0,005
0,000
0,005
0,010
0,015
0,020
0,025
0,030
0,00 1,00 2,00 3,00 4,00 5,00 6,00
Ab
sorb
ance
Concentration (mg/100mL)
Absorbance Brown Rice

70
7.5.3. Pea protein isolate
Table 7.3.: Measurement of the absorbance of the samples of pea protein isolate to create a calibration curve
Concentration (mg/100mL)
Absorbance
0 0
1.2
0.016
0.013
0.016
2.1
0.029
0.028
0.032
3.3
0.05
0.055
0.06
4.1
0.07
0.077
0.079
5.00
0.09
0.096
0.097
Fig. 7.3: Calibration curve of pea protein isolate obtained by UV/VIS spectrophotometry
y = 0,0202x - 0,009R² = 0,9802
-0,020
0,000
0,020
0,040
0,060
0,080
0,100
0,120
0,00 1,00 2,00 3,00 4,00 5,00 6,00
Ab
sorb
ance
Concentration (mg/100mL)
Absorbance Pea Protein

71
7.5.4. Whey protein isolate
Table 7.4.: Measurement of the absorbance of the samples of whey protein isolate to create a calibration curve
Concentration (g/100mL)
1/50 diluted concentration (g/100mL)
Absorbance
0 0 0
0.500 0.01
0.082
0.087
0.090
1.000 0.0200
0.259
0.258
0.263
1.504 0.0301
0.299
0.305
0.310
2.001 0.0400
0.417
0.423
0.412
2.498 0.0500
0.507
0.510
0.505
Fig. 7.4: Calibration curve of whey protein isolate obtained by UV/VIS spectrophotometry
y = 10,109x + 0,011R² = 0,9765
0
0,1
0,2
0,3
0,4
0,5
0,6
0 0,01 0,02 0,03 0,04 0,05 0,06
Ab
sorb
ance
Concentration (g/100mL)
Absorbance Whey protein

72
7.5.5. Riboflavin
Fig. 7.5: Absorbance spectrum of riboflavin
Table 7.5.: Measurement of the absorbance of the samples of riboflavin to create a calibration curve
Concentration (g/100mL)
1/5 diluted concentration (g/100mL)
Absorbance
0 0 0
1.00 0.20
0.142
0.149
0.149
2.20 0.44
0.308
0.324
0.317
3.1 0.62
0.432
0.435
0.440
4.2 0.84
0.553
0.566
0.577
5.1 1.02
0.645
0.649
0.650

73
Fig. 7.6: Calibration curve of riboflavin obtained by UV/VIS spectrophotometry
y = 0,6291x + 0,028R² = 0,9931
0
0,1
0,2
0,3
0,4
0,5
0,6
0,7
0,8
0 0 , 2 0 , 4 0 , 6 0 , 8 1 1 , 2
AB
SOR
BA
NC
E
CONCENTRATION (MG/100ML)
ABSORBANCE RIBOFLAVIN