
Experimental Investigation of Flow Models Applied to Worst ...
58
Experimental Investigation of Flow Models Applied to Worst-Case- Discharge Calculations New Orleans, LA – Workshop #2 - Sept 28, 2016
-
Upload
khangminh22 -
Category
Documents
-
view
2 -
download
0
Transcript of Experimental Investigation of Flow Models Applied to Worst ...
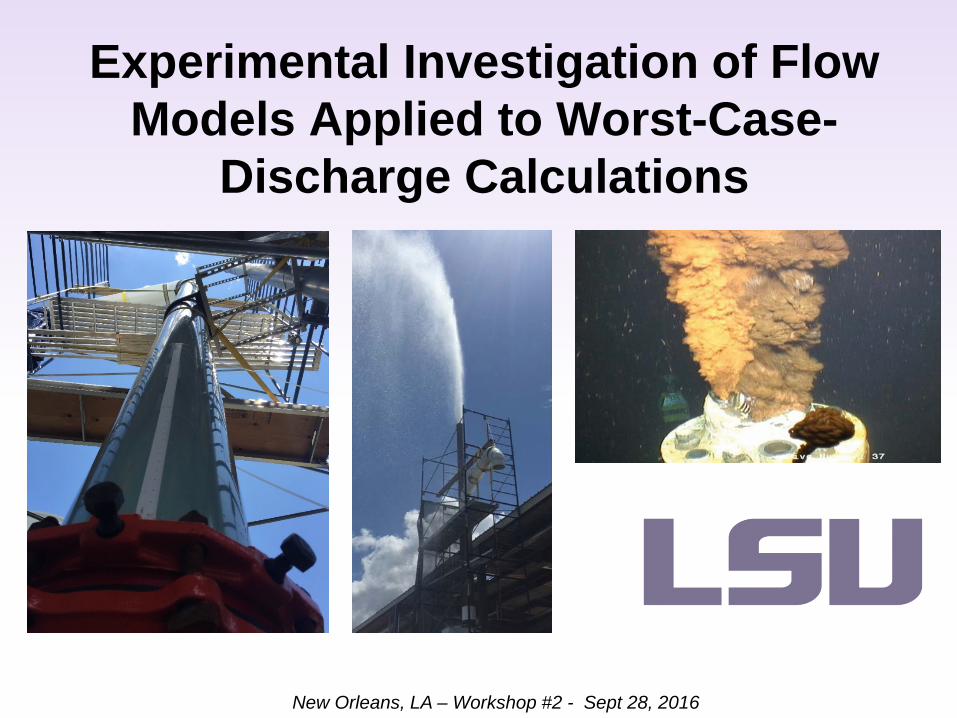
Experimental Investigation of Flow Models Applied to Worst-Case-
Discharge Calculations
New Orleans, LA – Workshop #2 - Sept 28, 2016

LSU Team – Principal Investigators
Paulo Waltrich, PhD. (PI Team Lead) Assistant Professor
Richard Hughes, PhD. Professional in Residence
PhD in Petroleum Engineering
PhD in Petroleum Engineering
Mayank Tyagi, PhD. Associate Professor
PhD in Mechanical Eng.

LSU Team – Principal Investigators
Seung Kam, PhD. Associate Professor
PhD in Petroleum Engineering
Wesley Williams, PhD. Professional in Residence
PhD in Nuclear Engineering

LSU Team – Post-Doc and Graduate Students
Muhammad Zulqarnain, PhD. Post-Doc
Woochan Lee, MSc. PhD Graduate Student
PhD in Petroleum Engineering
MSc. in Petroleum Engineering
Matheus Capovila, BS PhD Graduate Student
BS in Mechanical Engineering
Outline Overview of Project Objectives and Deliverables
Literature Review Findings and Conclusions
Experimental Investigation
Evaluation of Flow Models to Predict Experimental Data
Comparison of Flow Models Applied to WCD Calculations
Conclusions
Future Projects

Project Motivation [1] Blowouts Happen!
For effective contingency plans, we need accurate oil spill predictions!
For accurate predictions, we need reliable models!
Industry and regulatory agencies need guidance from unbiased experts (universities and research institutions)
Improvement is needed to avoid future large environmental and economical impacts
Source: TAMU – Pemex Offshore Drilling

Project Motivation [2] “Most flow correlations were developed for small diameter pipe, so their applicability to larger-diameter pipe and open hole is uncertain.”
“The committee proposes that further research and development be conducted on appropriate correlations for high-rate flow in large diameter pipe.”

Statement of the Problem [1]
after SPE Technical Report (2015)

Statement of the Problem [2]
WCD predictions are directly dependent to flowing bottomhole pressure of the well:
Pwf (psi)
q (STB/D)
Different Wellbore models (TPR) for the same WCD scenario
Reservoir model (IPR)
WCD2 WCD1

Statement of the Problem [3] q is calculated using reservoir and fluid properties, and pwf :
pwf is obtained from wellbore flow correlations and wellhead conditions:
𝒒𝒒 ∝ 𝑘𝑘𝑘(𝑝𝑝𝑒𝑒 − 𝒑𝒑𝒘𝒘𝒘𝒘)
𝐵𝐵𝑜𝑜𝜇𝜇 𝑙𝑙𝑙𝑙 𝑟𝑟𝑒𝑒𝑟𝑟𝑤𝑤
𝒑𝒑𝒘𝒘𝒘𝒘 = 𝑝𝑝𝑤𝑤ℎ + �𝒅𝒅𝒑𝒑𝒅𝒅𝒛𝒛
𝑑𝑑𝑧𝑧𝐿𝐿
0
reservoir and fluid properties
(for pwf > pbp)
generic pressure gradient equation
• Flow regimes
• Superficial velocities
• Pressure & temperature
• Fluid properties

Statement of the Problem [4] The use of flow correlations for large diameter
pipes is NOT well understood:
Two-Phase flow in a vertical pipe (ID = 10 in)
Well configuration for typical WCD calculation scenario
Ali (2009)
12”
10”
7.5”
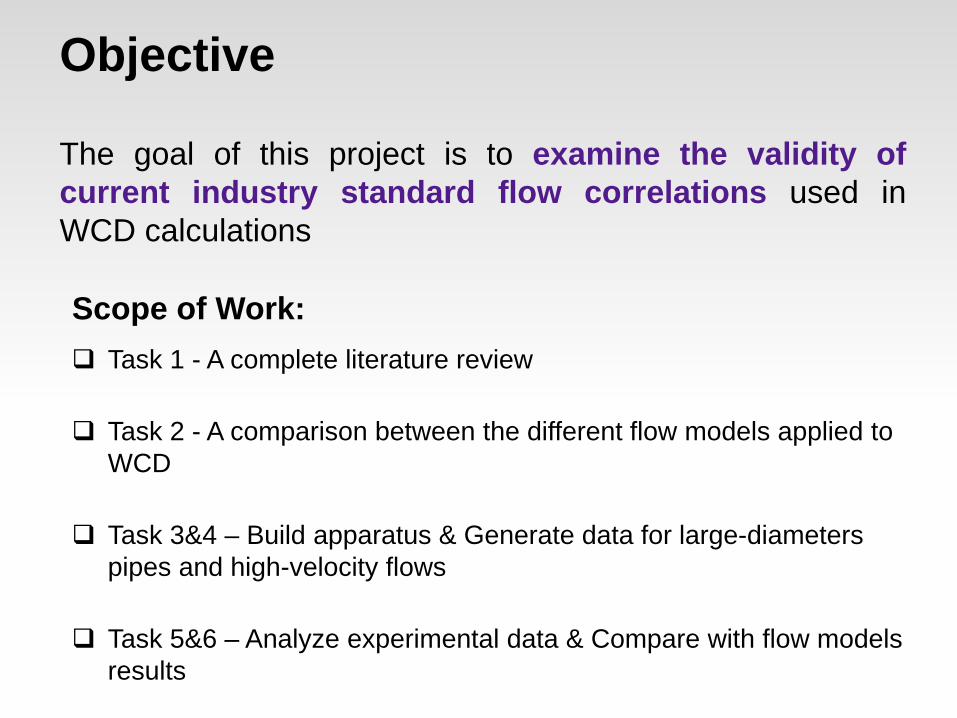
Objective
The goal of this project is to examine the validity of current industry standard flow correlations used in WCD calculations
Scope of Work: Task 1 - A complete literature review
Task 2 - A comparison between the different flow models applied to WCD
Task 3&4 – Build apparatus & Generate data for large-diameters pipes and high-velocity flows
Task 5&6 – Analyze experimental data & Compare with flow models results

Literature Review (Task 1)
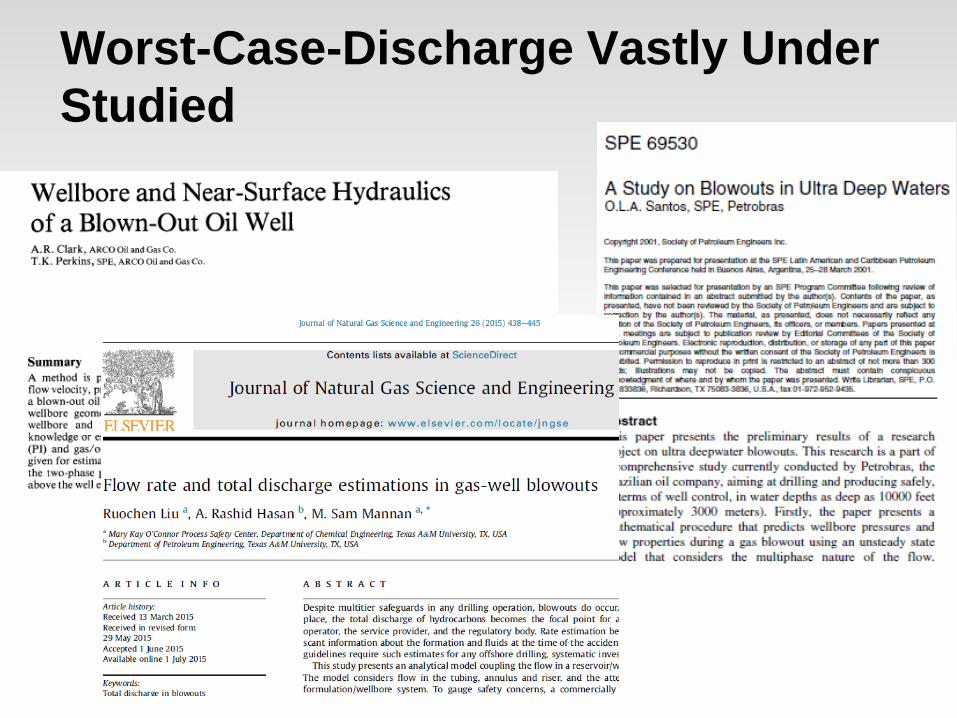
Worst-Case-Discharge Vastly Under Studied
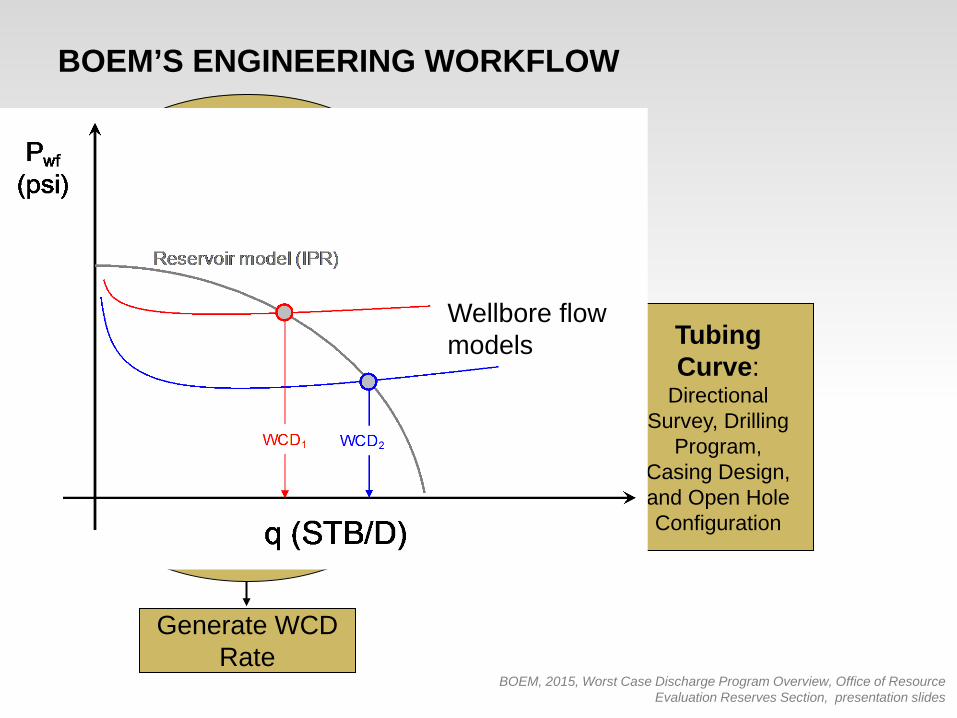
BOEM’S ENGINEERING WORKFLOW
Tubing Curve:
Directional Survey, Drilling
Program, Casing Design, and Open Hole Configuration
Generate WCD Rate
Reservoir Simulator: Enter Rock and Fluid Properties to determine Absolute Open Flow
at Reservoir
Nodal Analysis: Enter Fluid Parameters
Reservoir Simulator: Incorporate Tubing Curves for
Well Head Flow
BOEM, 2015, Worst Case Discharge Program Overview, Office of Resource Evaluation Reserves Section, presentation slides
Wellbore flow models

PRESSURE DROP (ΔP) PREDICTION MODELS
Empirical Correlations (strongly based on data)
Drift-Flux models (additional physics but still based on data)
Mechanistic Models (1D solution of conservation equations but also uses empirical correlations)
CFD Models (3D-transient solution of conservation equations but needs calibration and computationally expensive)

SOURCES OF ERRORS ON FLOW MODELS [1]
ERRORS IN FLUID PROPERTIES & CALCULATION DIRECTION

Review of Conditions Used to Develop Flow Models
SOURCES OF ERRORS ON FLOW MODELS [2]

Review of Databases Used to Develop Flow Models
SOURCES OF ERRORS ON FLOW MODELS [3]

Takacs (2001)
Review of Flow Rates Used to Develop Flow Models
SOURCES OF ERRORS ON FLOW MODELS [4]
Ql < 2,500 STB/D
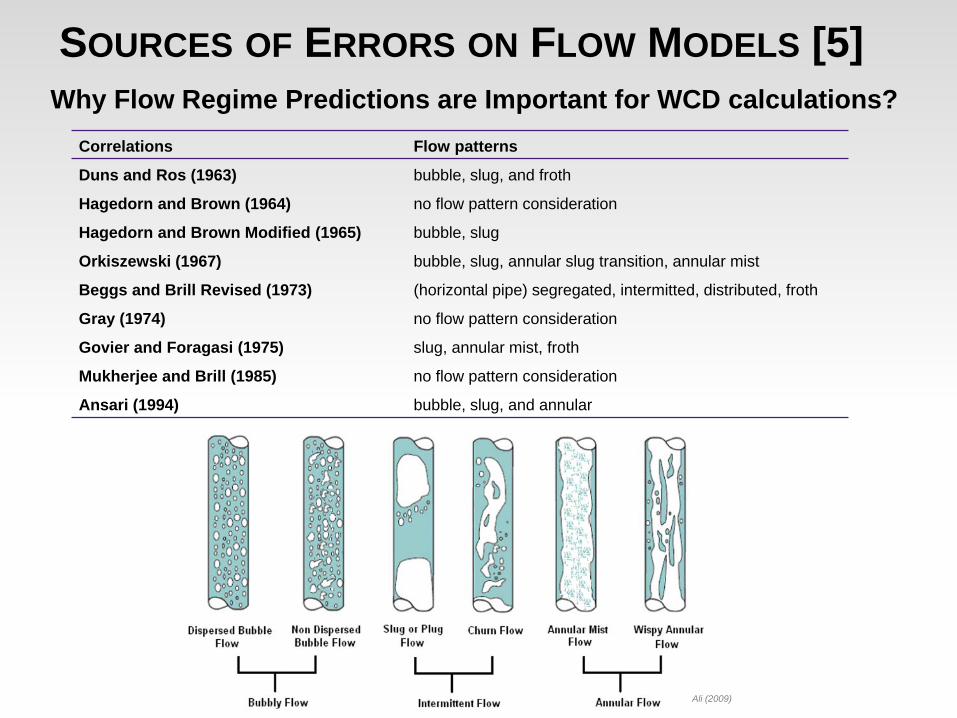
Why Flow Regime Predictions are Important for WCD calculations? Correlations Flow patterns
Duns and Ros (1963) bubble, slug, and froth
Hagedorn and Brown (1964) no flow pattern consideration
Hagedorn and Brown Modified (1965) bubble, slug
Orkiszewski (1967) bubble, slug, annular slug transition, annular mist
Beggs and Brill Revised (1973) (horizontal pipe) segregated, intermitted, distributed, froth
Gray (1974) no flow pattern consideration
Govier and Foragasi (1975) slug, annular mist, froth
Mukherjee and Brill (1985) no flow pattern consideration
Ansari (1994) bubble, slug, and annular
Ali (2009)
SOURCES OF ERRORS ON FLOW MODELS [5]

Flow Regime Maps for Large-Diameter Pipes
Study Qo, BBL/D
Ql, GPM
ID, in
Usl, m/s
GLR, SCF/STB
Qg, MMSCF/D
Qg, SCFM
Usg, m/s
Ali 30,300 883 10 1.1 41 0.350 243 2.3
Ali (2009) - Experimental conditions tested

Zabaras (2013) - Experimental conditions tested
Study Qo, BBL/D
Ql, GPM
ID, in
Usl, m/s
GLR, SCF/STB
Qg, MMSCF/D
Qg, SCFM
Usg, m/s
Zabaras 5140 150 11 0.15 2640 2.97 2063 15.9
Evaluation of Using CFD models for Multiphase flow in Large Pipe Diameters

0 20,000 40,000 60,000
Ohnuki and Akimoto (1996)Ohnuki and Akimoto (2000)
Yoneda et al. (2002)Prasser et al. (2002)
Shen et al. (2005)Shen et al. (2006)
Omebere et al. (20 bar) (2007)Omebere et al. (90 bar) (2007)
Ali (2009)Schlegel et al. (2012)Zabaras et al. (2013)
Liquid production rate, STB/D 0 10 20 30 40 50
Gas production rate, MMSCF/D
Gaps in Studies for Large-Diameter Pipes [1]
Review of Studies on Two-Phase Flows for ID > 6 in
Only study with high-gas/liquid flow rates, but only discloses 2 runs of pressure measurements

Gap in Studies for Large-Diameter Pipes [2]

Conclusions from Literature Review
Flow correlations were originally developed and are still NOT verified for LARGE-diameters (ID < 8 in)
Lack of studies on Two-Phase Flows in large-diameters (ID > 6) and high liquid/gas flow rates (Ql > 30,000 bbl/d)
“Non-standard” flow correlations should be evaluated to be used in WCD models
WCD models vastly under studied
Models specifically developed for WCD scenarios ARE NEEDED!

Experimental Investigation (Task 3-5)

Experimental Apparatus
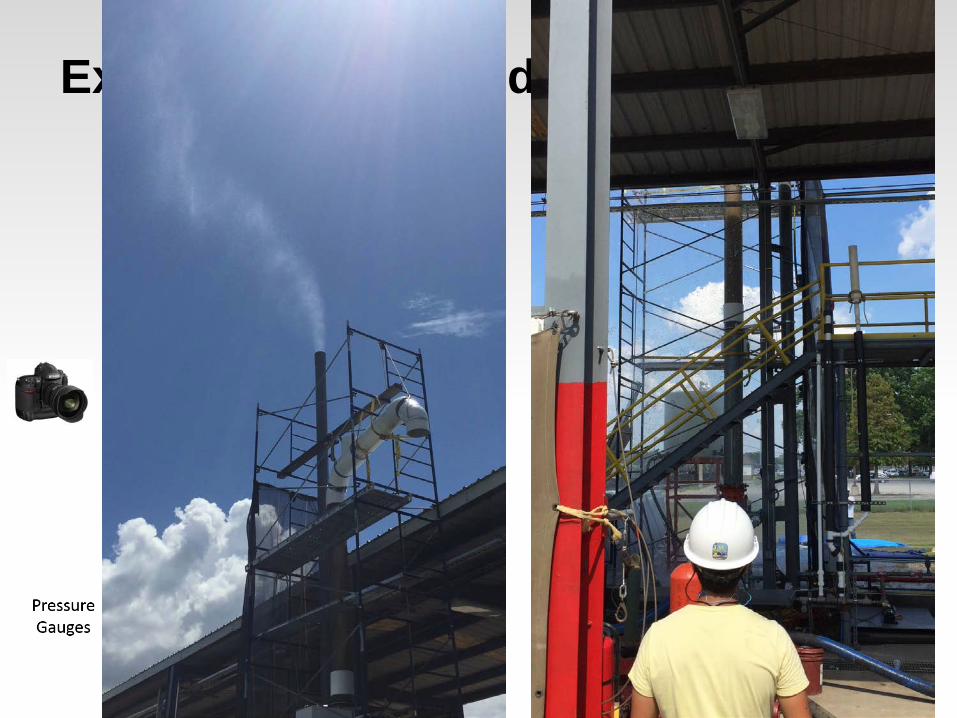
Experimental Procedure
Pressure gradient measurement
Liquid holdup measurement

Flow Regime Observations [1]
𝐷𝐷∗ =𝐷𝐷
𝜎𝜎𝜌𝜌𝐿𝐿 − 𝜌𝜌𝑔𝑔 𝑔𝑔
𝐷𝐷∗ > 30 (D > ~4 in)
No Slug Flow for:

Flow Regime Observations [2]

Liquid Holdup Measurements [1]
1.53𝑔𝑔 𝜌𝜌𝐿𝐿 − 𝜌𝜌𝑔𝑔 𝜎𝜎
𝜌𝜌𝐿𝐿2
0.25
1 − 𝛼𝛼 0.5sin 𝜃𝜃 =𝑢𝑢𝑠𝑠𝑔𝑔𝛼𝛼
− 1.2 𝑢𝑢𝑠𝑠𝑠𝑠 + 𝑢𝑢𝑠𝑠𝑔𝑔

Liquid Holdup Measurements [2]

Liquid Holdup Measurements [3]

Δp/Δz Measurements [1]
{ 44 344 21434 21onaccelerati
cm
friction
c
m
nalgravitatioc z
guDguf
gg
dzdp
∆∆
++=)2/(2 22
ρρρ
�̅�𝜌 = 𝐻𝐻𝑠𝑠𝜌𝜌𝑠𝑠 + (1 − 𝐻𝐻𝑠𝑠)𝜌𝜌𝑔𝑔
Wellbore flow models

Δp/Δz Measurements [2] B
ubbl
y/no
n-bu
bbly
tran
sitio
n zo
ne
{ 44 344 21434 21onaccelerati
cm
friction
c
m
nalgravitatioc z
guDguf
gg
dzdp
∆∆
++=)2/(2 22
ρρρ
�̅�𝜌 = 𝐻𝐻𝑠𝑠𝜌𝜌𝑠𝑠 + (1 − 𝐻𝐻𝑠𝑠)𝜌𝜌𝑔𝑔

Δp/Δz Measurements [3]
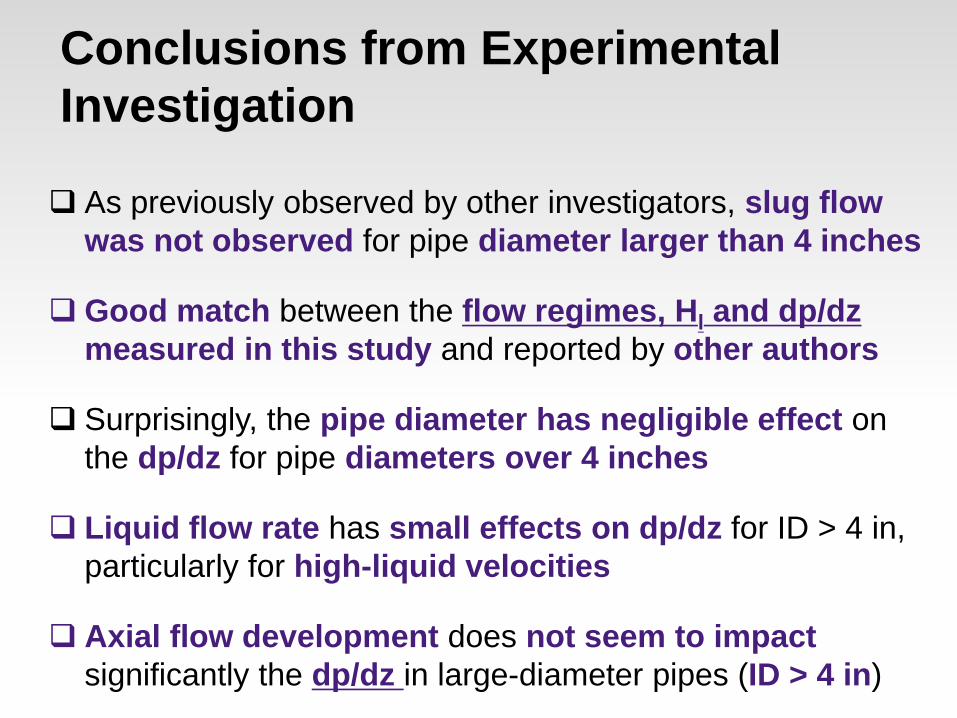
Conclusions from Experimental Investigation
As previously observed by other investigators, slug flow was not observed for pipe diameter larger than 4 inches
Good match between the flow regimes, Hl and dp/dz measured in this study and reported by other authors
Surprisingly, the pipe diameter has negligible effect on the dp/dz for pipe diameters over 4 inches
Liquid flow rate has small effects on dp/dz for ID > 4 in, particularly for high-liquid velocities
Axial flow development does not seem to impact significantly the dp/dz in large-diameter pipes (ID > 4 in)

Evaluation of Flow Models with Experimental Data (Task 6)

Methodology for Comparison of Flow Models
• Common models available in commercial packages
• Models available in PIPESIM at LSU
• Include different model approaches (empirical, mechanistic, CFD)
Wellbore flow model Nomenclature
Ansari (1994) ANS Beggs and Brill (1973) BB
Beggs and Brill Revised (1979) BBR Duns and Ross (1963) DR
Govier, Aziz, and Fogarasi (1972) GA Gray Original (1974) GO
Gray modified (PipeSim 2011) GM Hagedorn and Brown (1964) HB
Hagedorn and Brown with Duns and Ross map (PipeSim 2011) HBDR
Mukherjee and Brill (1985) MB No Slip (PipeSim 2011) NS
Orkiszewski (1967) OR OLGA-S 2000 V.6.7.2 OLGA
Computational Fluid Dynamics (Fluent) CFD
Number of data points generated at LSU: 122 points
Pipe diameters: 2, 4, 8, 12 inches
Liquid flow rates: up to 28,000 BBL/D
Gas Lfow rates: up to 2MMSCF/D
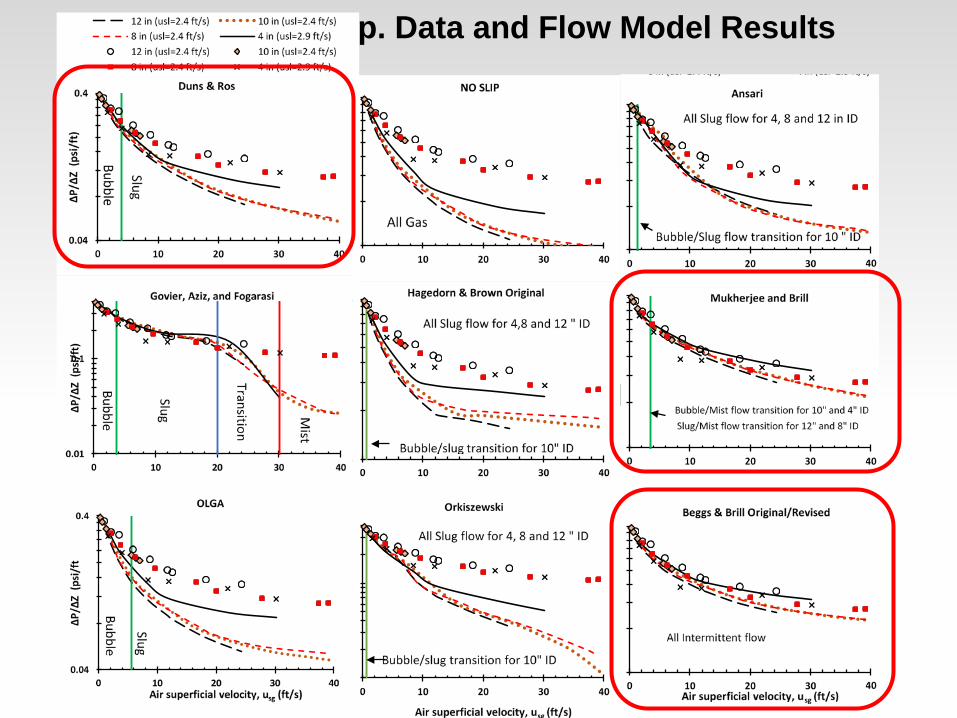
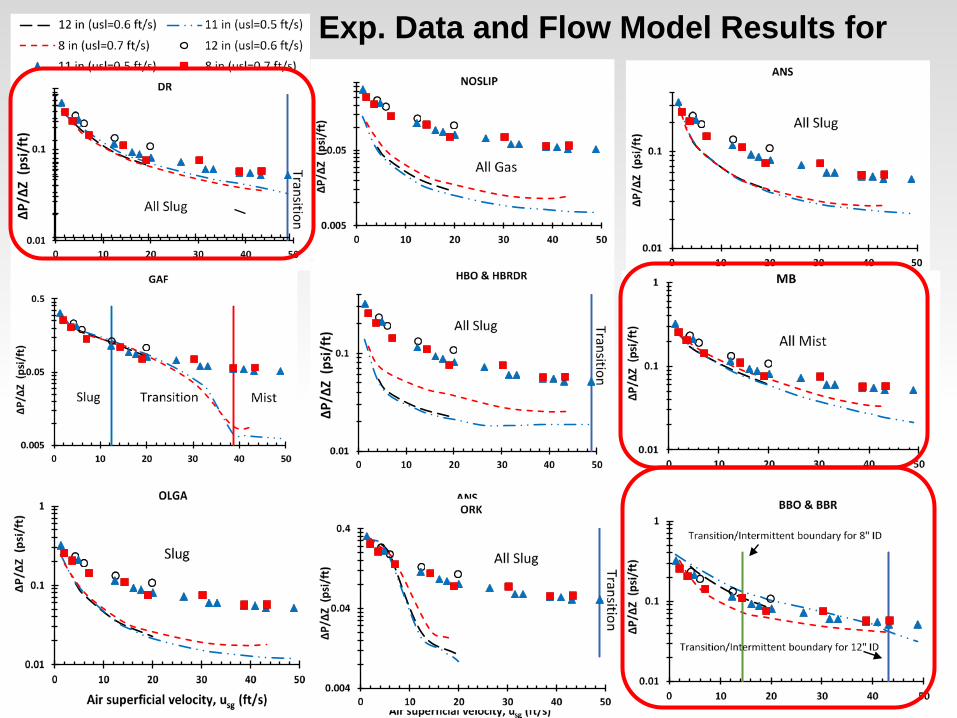
Comparison and Exp. Data and Flow Model Results for Δp/Δz [1]
Comparison and Exp. Data and Flow Model Results for Δp/Δz [2]
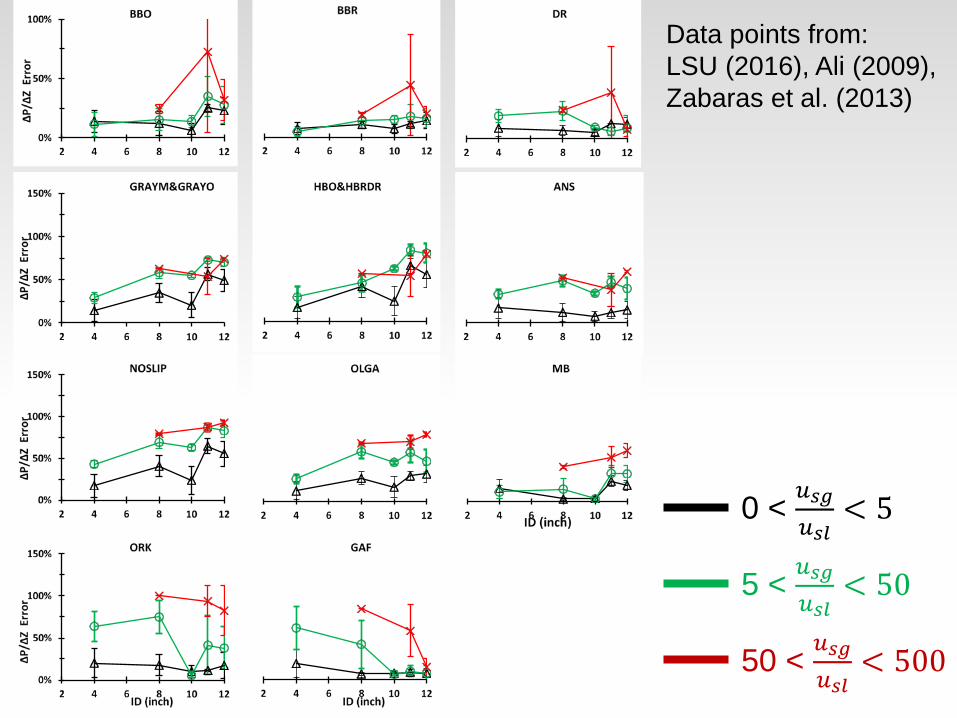
0 < 𝑢𝑢𝑠𝑠𝑠𝑠𝑢𝑢𝑠𝑠𝑠𝑠
< 5
5 < 𝑢𝑢𝑠𝑠𝑠𝑠𝑢𝑢𝑠𝑠𝑠𝑠
< 50
50 < 𝑢𝑢𝑠𝑠𝑠𝑠𝑢𝑢𝑠𝑠𝑠𝑠
< 500
Data points from: LSU (2016), Ali (2009), Zabaras et al. (2013)


Comparison of Flow Models Applied to WCD (Task 2)

Results for WCD Calculations for Different Wellbore Flow Models Fluid
Sample
Reservoir depth
(ft)
Reservoir pressure
(psi)
Reservoir Temp.
(°F)
GOR (scf/stb)
pbp (psi)
ρo (API)
μo (cp)
PI (STB/D/psi)
Base Case 16,726 11,305 210 1,700 6,306 28 0.8 19.05 BO1 19,426 10,391 166 1,190 7,693 25.3 1.49 19.05 BO2 19,553 12,523 251 1,562 5,192 34.5 0.173 19.05

Effect of Fluid Type
Fluid Sample
Reservoir measured
depth (ft)
Reservoir pressure
(psi)
Reservoir Temperature
(°F)
GOR (scf/stb)
Oil gravity (API)
PI (STB/D/psi)
Base Case 16,726 11,305 210 1,700 28 19.05 VO3 14,374 11,009 261 3,803 42.1 19.05

Effect of Roughness [1]

Effect of Roughness [2]

Results for Flow Regime Prediction for Base Case

Final Remarks
We have done a significant amount of work in 12 months.
Pipe diameter has a significantly smaller effect on the pressure gradient for ID over 4 inches than in pipe diameter smaller than 4 inches.
Most flow models show better results for the 4-inch diameter pipe than for larger diameters.
Flow models and laboratory experiments discrepancy is likely caused by the use of the slug flow regime, instead of churn flow (which is observed experimentally)

Final Remarks Different methods may be suggested for different fluid
and flow conditions, making the recommended practice field specific depending on reservoir and fluid properties
Variation of reservoir fluid properties (pbp, GOR, ρo, μo) has a relatively small effect (up to 10%) on WCD rate estimates for black oil and volatile oil reservoirs, for the well conditions examined
Further investigations of benchmarking and calibration of exiting WCD models against representative field and fluid WCD conditions is needed!
Based on preliminary comparisons, significant improvement can be achieved on wellbore flow models for WCD calculations

Suggestion for Future Projects Five-year Research Plan (LSU WCD Group)
“ To foster safety on the development of new oil and gas reserves in the Gulf-of-Mexico”
Establish a WCD Research Center at LSU
Organize a Industry Advisory Committee (IAC) for the WCD group
Create a Priority List for topics to address challenges on WCD
Organize a Joint-Industry-Project (JIP) on the validation and development of a Open-Source model for WCD calculations
Create a Handbook/Manual/Standard and Training Courses for WCD calculations (standardization)
Disseminate information from LSU WCD group among industry and regulatory agencies

LSU WCD Research Center
Center of Excellence in WCD
PERTT Lab Facility
Field Scale Research
Modeling Solutions
JIPs on WCD
Lab Scale Research
Training Courses

Preliminary Priority List of Topics [1] Experimental work for large pipe diameters
and inclined pipe! (No well is truly vertical!!!)
40-6
0 ft
Old Inclinable flow loop
New design under development (Investment of ~$150,000)

Flow tests for different pressures and fluid types (fluids other than water and air)
Preliminary Priority List of Topics [2]
Large-diameter pipe
~15-
20 ft
Industry investment already made of about ~$ 2,000,000 Closed-loop that allow use of different fluid types (oil, gas, water, nitrogen...) Allow use of pressures up to 1,200 psi Allow tests with high-liquid rates (15,000 BBL/D) and high-gas rates (4 MMSCFD)

0
5
10
15
OLGA 7 GRAY(1974)
THISSTUDY
DUNS ANDROS (1963)
ANSARI ETAL. (1994)
LSU MODEL
0
5
10
15
20
25
30
35
40
THISSTUDY
OLGA 7 GRAY(1974)
ANSARI ETAL. (1994)
DUNS ANSROS (1963)
Abs
olut
e av
erag
e er
ror f
or d
p/dz
, %
LSU MODEL
Development of a Flow Models dedicated to WCD calculations
Development of a web tool to provide unbiased and accurate WCD calculations
Preliminary Priority List of Topics [3]
Validation with 24 wells – Reinicke et al. (1987)
Pipe ID ~ 4 in Pipe ID ~ 2 in
Validation with 12 wells – Facher and Brown (1963)

58