Extent, intensity and drivers of mammal defaunation - Nature
Upload
khangminh22Category
view
0download
0
US Atlantic and Gulf of Mexico Marine Mammal Stock Assessments - 2018
US DEPARTMENT OF COMMERCE National Oceanic and Atmospheric Administration
National Marine Fisheries Service Northeast Fisheries Science Center
Woods Hole, Massachusetts June 2019
NOAA Technical Memorandum NMFS-NE-258
US Atlantic and Gulf of Mexico Marine Mammal Stock Assessments - 2018
by Sean A Hayes1, Elizabeth Josephson1, Katherine Maze-Foley6,
and Patricia E Rosel3, Editors
with contributions from (listed alphabetically)
Barbie Byrd4, Samuel Chavez-Rosales1, Timothy VN Cole1, Lance P Garrison6, Joshua Hatch1, Allison Henry1, Stacey C Horstman5, Jenny Litz6, Marjorie C Lyssikatos1, Keith D Mullin2, Christopher Orphanides1,
Richard M Pace1, Debra L Palka1, Jessica Powell5, and Frederick W Wenzel1.
1NOAA Fisheries, Northeast Fisheries Science Center, 166 Water St, Woods Hole, MA 02543 2NOAA Fisheries, P.O. Drawer 1207, Pascagoula, MS 39568
3NOAA Fisheries, 646 Cajundome Blvd. Suite 234, Lafayette, LA 70506 4NOAA Fisheries, 101 Pivers Island, Beaufort, NC 28516
5NOAA Fisheries, 263 13th Ave. South, St. Petersburg, FL 33701 6NOAA Fisheries, 75 Virginia Beach Drive, Miami, FL 33149
US DEPARTMENT OF COMMERCE Wilbur L Ross, Secretary
National Oceanic and Atmospheric Administration Neil Jacobs, Under Secretary
National Marine Fisheries Service Chris Oliver, Assistant Administrator for Fisheries
Northeast Fisheries Science Center Woods Hole, Massachusetts
June 2019
NOAA Technical Memorandum NMFS-NE-258 This series represents a secondary level of scientific publishing. All issues employ thorough internal scientific review; some issues employ external scientific review. Reviews are transparent collegial reviews, not anonymous peer reviews. All issues may be cited in formal scientific communications.

Editorial Notes Information Quality Act Compliance: In accordance with section 515 of Public Law 106-554, the Northeast Fisheries Science Center completed both technical and policy reviews for this report. These predissemination reviews are on file at the NEFSC Editorial Office. Species Names: The NEFSC Editorial Office’s policy on the use of species names in all technical communications is generally to follow the American Fisheries Society’s lists of scientific and common names for fishes, mollusks, and decapod crustaceans and to follow the Society for Marine Mammalogy's guidance on scientific and common names for marine mammals. Exceptions to this policy occur when there are subsequent compelling revisions in the classifications of species, resulting in changes in the names of species. Statistical Terms: The NEFSC Editorial Office’s policy on the use of statistical terms in all technical communications is generally to follow the International Standards Organization’s handbook of statistical methods. Internet Availability: This issue of the NOAA Technical Memorandum NMFS-NE series is being as a paper and Web document in HTML (and thus searchable) and PDF formats and can be accessed at: http://www.nefsc.noaa.gov/nefsc/publications/. Editorial Treatment: To distribute this report quickly, it has not undergone the normal technical and copy editing by the Northeast Fisheries Science Center's (NEFSC's) Editorial Office as have most other issues in the NOAA Technical Memorandum NMFS-NE series. Other than the covers and first two preliminary pages, all writing and editing have been performed by – and all credit for such writing and editing rightfully belongs to – those so listed on the title page.
i
ACKNOWLEDGMENTS
The authors wish to acknowledge advice, comments and valuable contributions provided by the Northeast Fisheries Science Center Fisheries Sampling Branch; members of the Northeast and Southeast Marine Mammal Stranding Networks; Mendy Garron, Amanda Johnson, David Gouveia, and Allison Rosner of the Northeast Regional Office; Sabrina Bowen-Stevens, John Carlson, Ruth Ewing, LaGena Fantroy, Wayne Hoggard, Aleta Hohn, Alyssa Mathers, Blair Mase, Wayne McFee, Gina Rappucci, Elizabeth Scott-Denton, and Elizabeth Stratton of the Southeast Fisheries Science Center; Jarita Davis, Michael Simpkins, and Jon Hare of the Northeast Fisheries Science Center; Laura Engleby of the Southeast Regional Office; Brian Balmer, Todd Speakman, and Lori Schwacke of the National Ocean Service; William McLellan of University of North Carolina Wilmington; Reny Tyson and Randall Wells of Chicago Zoological Society's Sarasota Dolphin Research Program; and James Gilbert, Robert Kenney, Jack Lawson, Michael Moore, Genny Nesslage, James ‘Buddy’ Powell, Andy Read, Randall Wells, Trent McDonald, Chris Clark, Erin Summers and Sharon Young of the Atlantic Scientific Review Group. We also thank the Marine Mammal Commission, the Maine Lobstermen’s Association and the Humane Society of the United States for their constructive comments and advice.
ii
EXECUTIVE SUMMARY Under the 1994 amendments of the Marine Mammal Protection Act (MMPA), the National Marine Fisheries Service (NMFS) and the United States Fish and Wildlife Service (USFWS) were required to generate stock assessment reports (SARs) for all marine mammal stocks in waters within the U.S. Exclusive Economic Zone (EEZ). The first reports for the Atlantic (includes the Gulf of Mexico) were published in July 1995 (Blaylock et al. 1995). The MMPA requires NMFS and USFWS to review these reports annually for strategic stocks of marine mammals and at least every 3 years for stocks determined to be non-strategic. Included in this report as appendices are: 1) a summary of serious injury/mortality estimates of marine mammals in observed U.S. fisheries (Appendix I), 2) a summary of NMFS records of large whale human-caused serious injury and mortality (Appendix II), 3) detailed fisheries information (Appendix III), 4) summary tables of abundance estimates generated over recent years and the surveys from which they are derived (Appendix IV), a summary of observed fisheries bycatch (Appendix V), and a list of reports not updated in the current year (Appendix VI). Table 1 contains a summary, by species, of the information included in the stock assessments, and also indicates those that have been revised since the 2017 publication. Most of the changes incorporate new information into sections on population size and/or mortality estimates. A total of 17 of the Atlantic and Gulf of Mexico stock assessment reports were revised for 2018. The revised SARs include 27 strategic and 15 non-strategic stocks (25 strategic stocks and 1 non-strategic stock are included in the Northern Gulf of Mexico bay, sound and estuary stocks of bottlenose dolphins report). This report was prepared by staff of the Northeast Fisheries Science Center (NEFSC) and Southeast Fisheries Science Center (SEFSC). NMFS staff presented the reports at the February 2018 meeting of the Atlantic Scientific Review Group (ASRG), and subsequent revisions were based on their contributions and constructive criticism. This is a working document and individual stock assessment reports will be updated as new information becomes available and as changes to marine mammal stocks and fisheries occur. The authors solicit any new information or comments which would improve future stock assessment reports.
iii
INTRODUCTION Section 117 of the 1994 amendments to the Marine Mammal Protection Act (MMPA) requires that an annual stock assessment report (SAR) for each stock of marine mammals that occurs in waters under USA jurisdiction, be prepared by the National Marine Fisheries Service (NMFS) and the U.S. Fish and Wildlife Service (USFWS), in consultation with regional Scientific Review Groups (SRGs). The SRGs are a broad representation of marine mammal and fishery scientists and members of the commercial fishing industry mandated to review the marine mammal stock assessments and provide advice to the NOAA Assistant Administrator for Fisheries. The reports are then made available on the Federal Register for public review and comment before final publication.
The MMPA requires that each SAR contain several items, including: (1) a description of the stock, including its geographic range; (2) a minimum population estimate, a maximum net productivity rate, and a description of current population trend, including a description of the information upon which these are based; (3) an estimate of the annual human-caused mortality and serious injury of the stock, and, for a strategic stock, other factors that may be causing a decline or impeding recovery of the stock, including effects on marine mammal habitat and prey; (4) a description of the commercial fisheries that interact with the stock, including the estimated number of vessels actively participating in the fishery and the level of incidental mortality and serious injury of the stock by each fishery on an annual basis; (5) a statement categorizing the stock as strategic or not, and why; and (6) an estimate of the potential biological removal (PBR) level for the stock, describing the information used to calculate it. The MMPA also requires that SARs be updated annually for stocks which are specified as strategic stocks, or for which significant new information is available, and once every three years for non-strategic stocks.
Following enactment of the 1994 amendments, the NMFS and USFWS held a series of workshops to develop guidelines for preparing the SARs. The first set of stock assessments for the Atlantic Coast (including the Gulf of Mexico) were published in July 1995 in the NOAA Technical Memorandum series (Blaylock et al. 1995). In April 1996, the NMFS held a workshop to review proposed additions and revisions to the guidelines for preparing SARs (Wade and Angliss 1997). Guidelines developed at the workshop were followed in preparing the 1996 through 2015 SARs. In 1997 and 2004 SARs were not produced.
In this document, major revisions and updating of the SARs were completed for stocks for which significant new information was available. These are identified by the April 2018 date-stamp at the top right corner at the beginning of each report. Stocks not updated in 2017 are listed in Appendix VI.
REFERENCES
Blaylock, R.A., J.W. Hain, L.J. Hansen, D.L. Palka and G.T. Waring 1995. U.S. Atlantic and Gulf of Mexico marine mammal stock assessments. NOAA Tech. Memo. NMFS-SEFSC-363, 211 pp.
Wade, P.R. and R.P. Angliss 1997. Guidelines for assessing marine mammal stocks: Report of the GAMMS workshop April 3-5, 1996, Seattle, Washington. NOAA Tech. Memo. NMFS-OPR-12, 93 pp.

1
TABLE of CONTENTS
Executive Summary ................................................................................................................................................................ ............................................................................... ii
Introduction ................................................................................................................................................................................................ ............................................................. iii
TABLE 1. A Summary (including footnotes) of Atlantic Marine Mammal Stock Assessment Reports for Stocks of Marine Mammals under NMFS Authority that Occupy Waters under USA Jurisdiction ............................................................................................................................................................. 3
North Atlantic Right Whale (Eubalaena glacialis): Western Atlantic Stock ................................................................................................................................. 14
Humpback Whale (Megaptera novaeangliae): Gulf of Maine Stock ................................................................................................................................................. 30
Fin Whale (Balaenoptera physalus): Western North Atlantic Stock ................................................................................................................................................ 50
Minke Whale (Balaenoptera acutorostrata acutorostrata): Canadian East Coast Stock ......................................................................................................... 58
Risso's Dolphin (Grampus griseus): Western North Atlantic Stock ................................................................................................................................................. 69
Long-Finned Pilot Whale (Globicephala melas): Western North Atlantic Stock ......................................................................................................................... 75
Short-finned Pilot Whale (Globicephala macrorhynchus): Western North Atlantic Stock .................................................................................................... 83
White-Sided Dolphin (Lagenorhynchus acutus): Western North Atlantic Stock ........................................................................................................................ 92
Short-Beaked Common Dolphin (Delphinus delphis delphis): Western North Atlantic Stock ............................................................................................ 100
Rough-Toothed Dolphin (Steno bredanensis): Western North Atlantic Stock .......................................................................................................................... 109
Harbor Porpoise (Phocoena phocoena): Gulf of Maine/Bay of Fundy Stock ............................................................................................................................. 114
Harbor Seal (Phoca vitulina vitulina): Western North Atlantic Stock .......................................................................................................................................... 123
Gray Seal (Halichoerus grypus atlantica): Western North Atlantic Stock .................................................................................................................................. 131
Harp Seal (Pagophilus groenlandicus): Western North Atlantic Stock ........................................................................................................................................ 141
Hooded Seal (Cystophora cristata): Western North Atlantic Stock............................................................................................................................................... 147
Common Bottlenose Dolphin (Tursiops truncatus truncatus):Terrebonne-Timbalier Bay Estuarine System Stock ............................................... 151
Common Bottlenose Dolphin (Tursiops truncatus truncatus): Northern Gulf of Mexico Bay, Sound, and Estuary Stocks ................................... 164

2
APPENDIX I: Estimated serious injury and mortality (SI&M) of Western North Atlantic marine mammals listed by U.S. observed fisheries. ................................................................................................................................................................ ................................................................................................................... 185
APPENDIX II: Summary of the confirmed anecdotal human-caused mortality and serious injury (SI) events. ........................................................ 189
Appendix III: Fishery Descriptions................................................................................................................................................................ ............................................. 190
APPENDIX IV: Surveys and Abundance Estimates ............................................................................................................................................................................. 243
APPENDIX V: Fishery Bycatch Summaries ................................................................................................................................................................ ............................ 267
APPENDIX VI: Reports not updated in 2018 .......................................................................................................................................................................................... 296

3
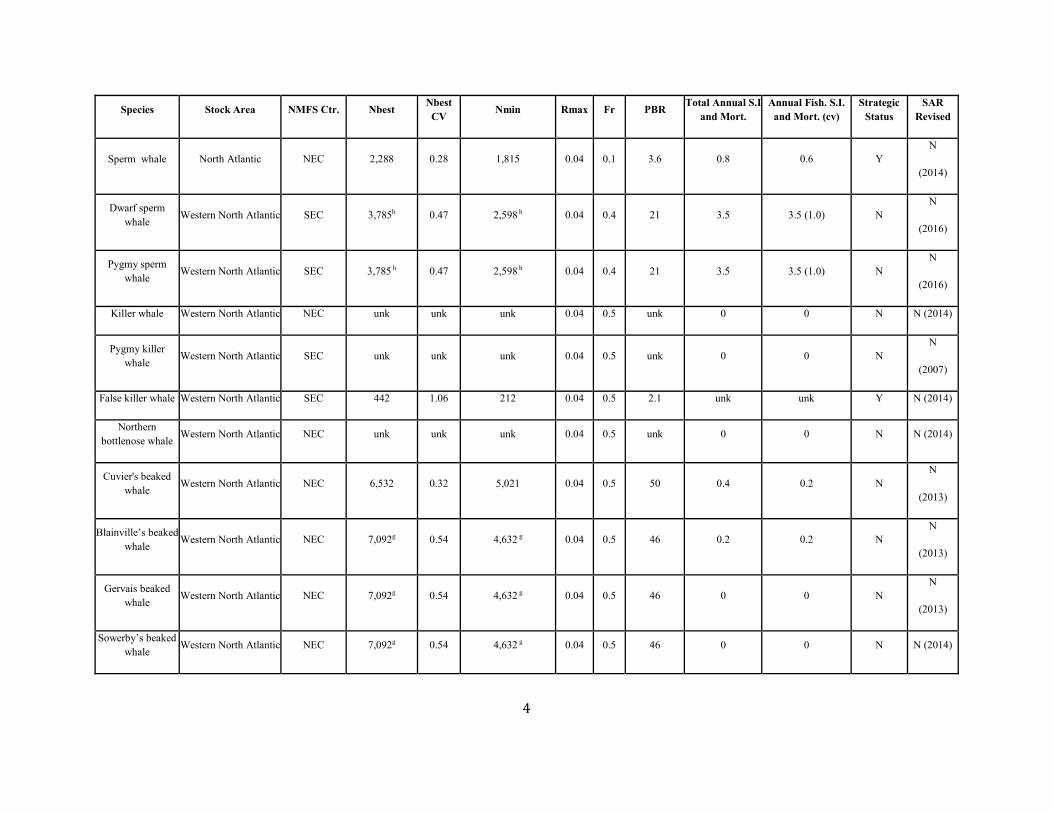
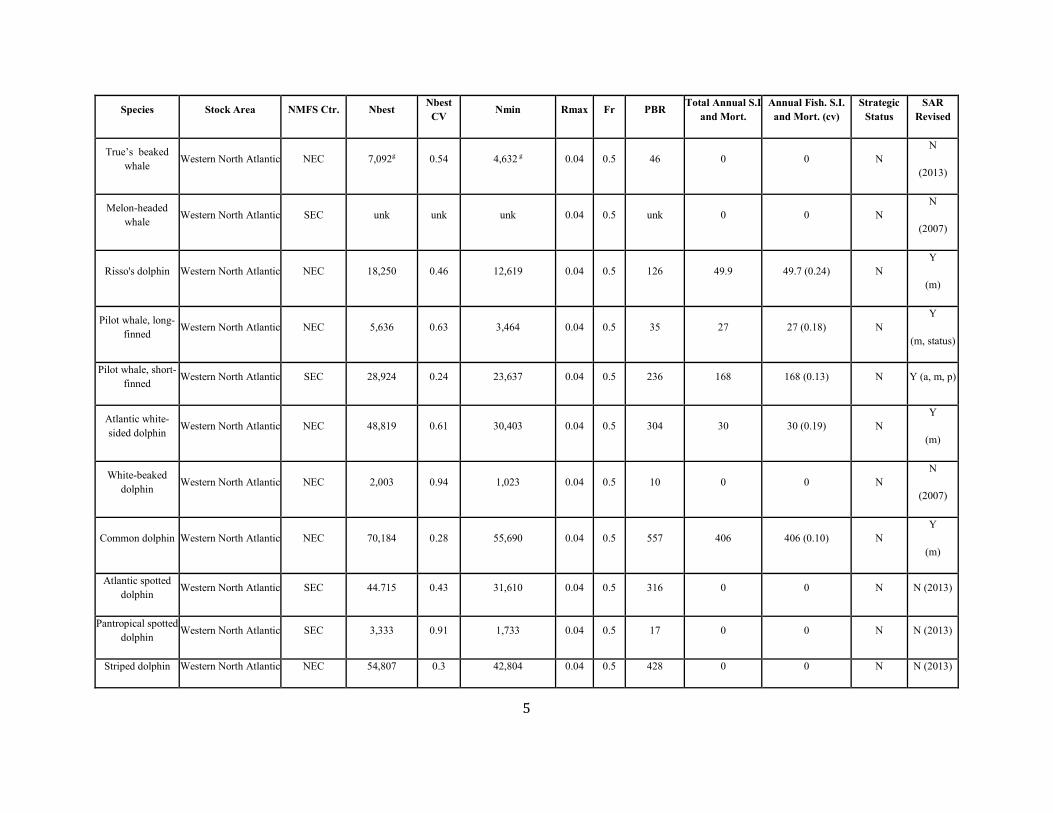
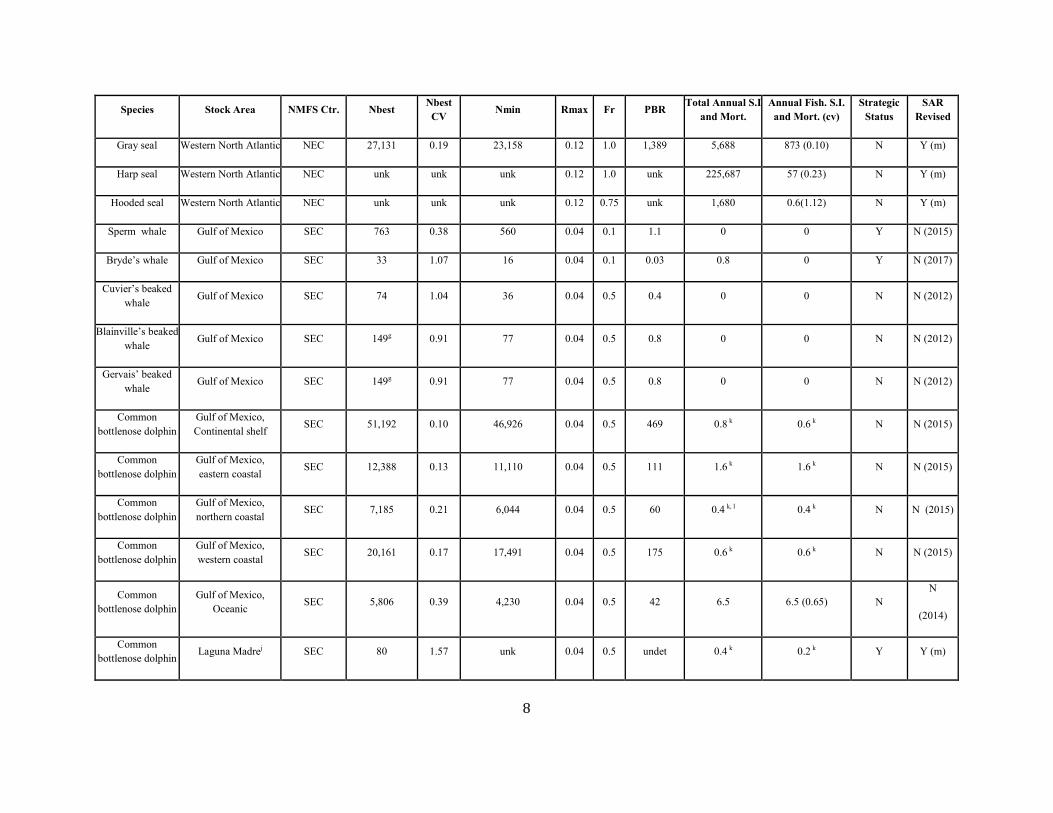
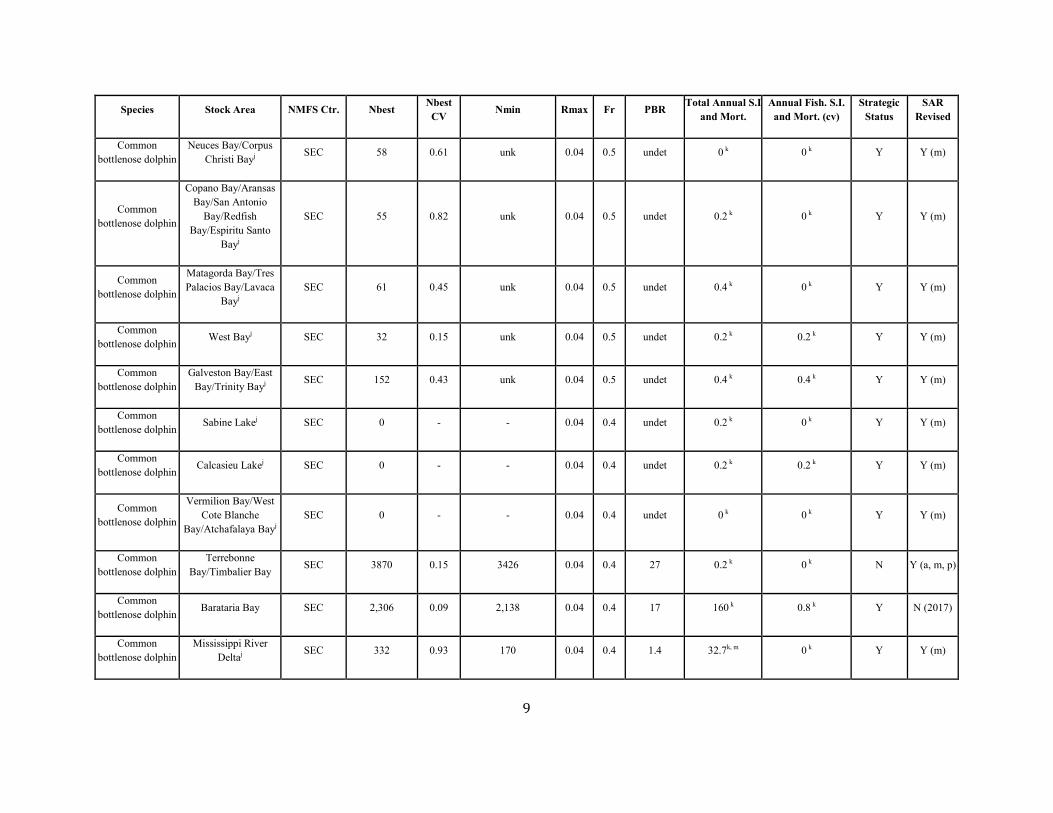
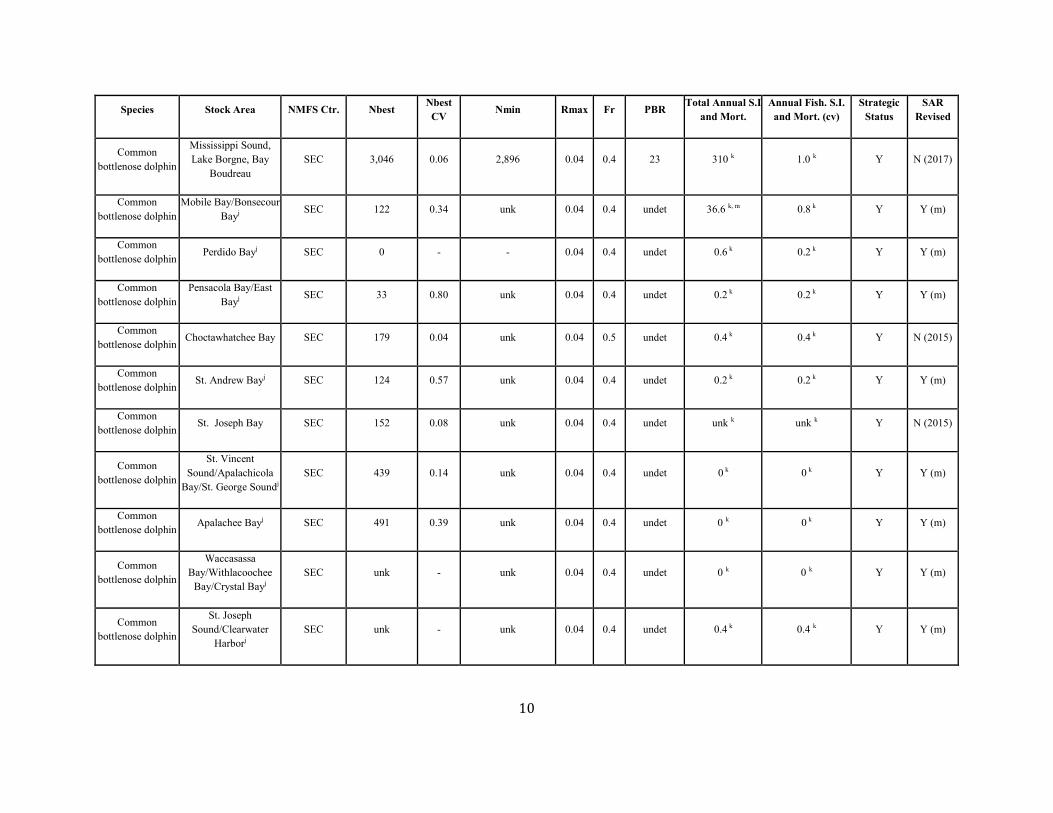
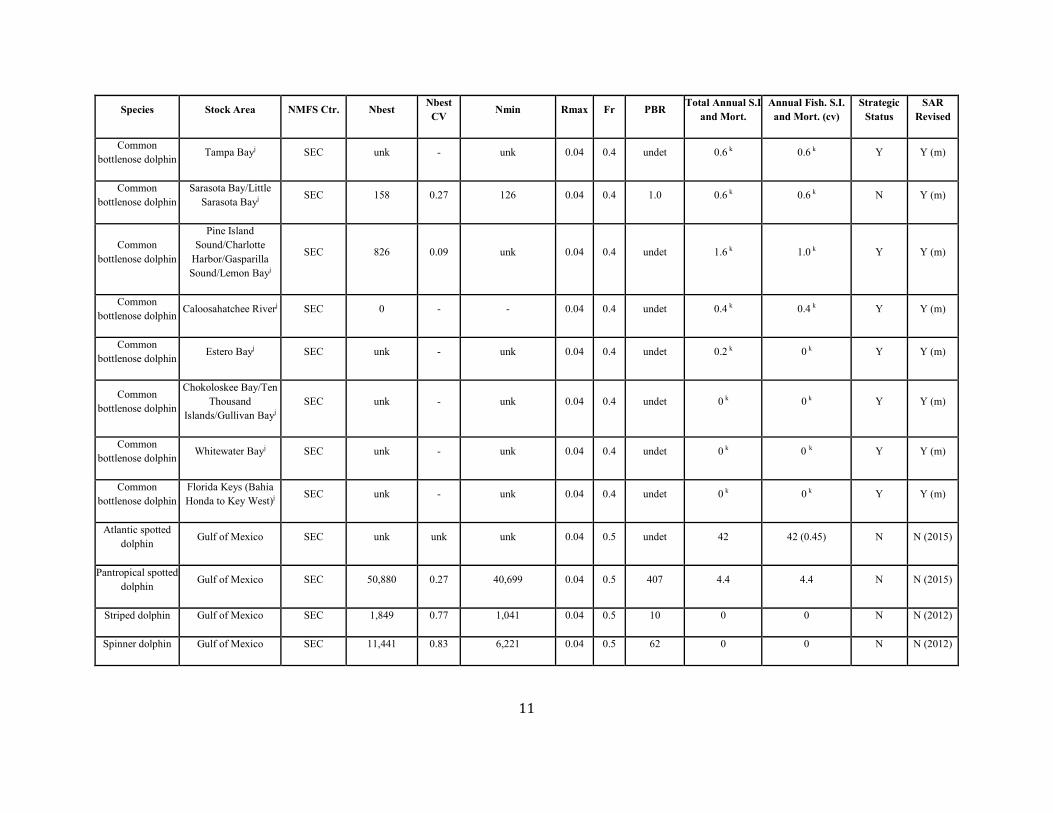
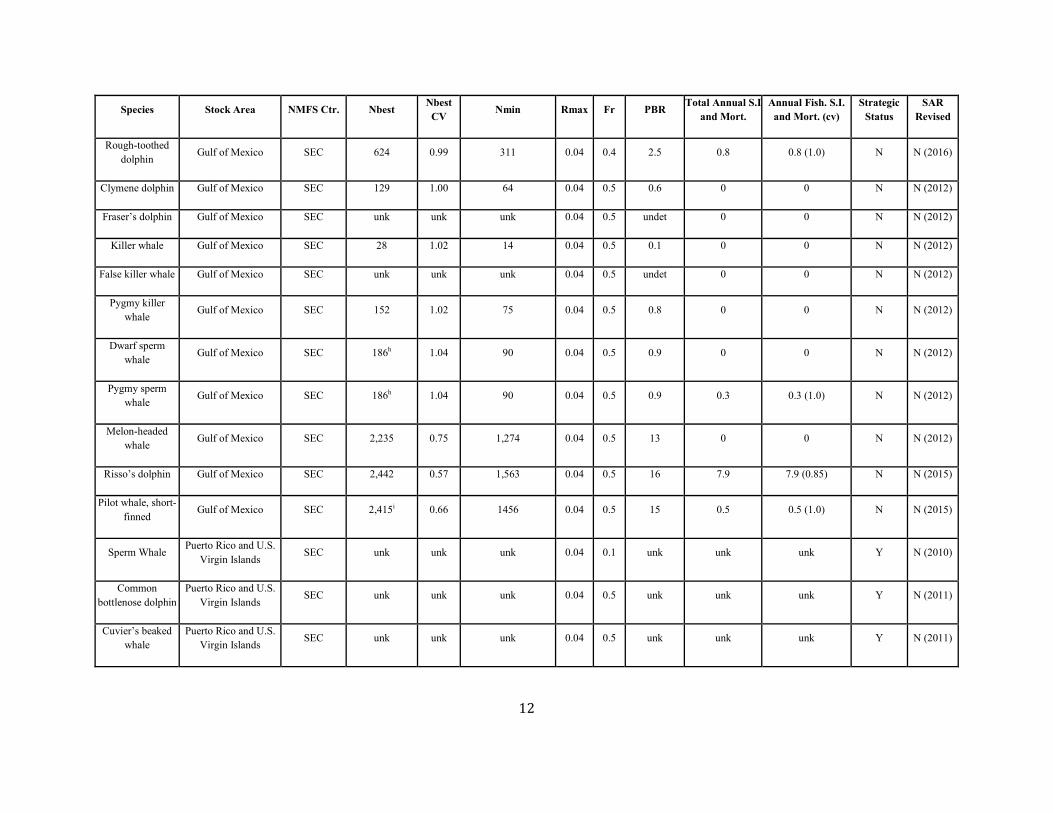
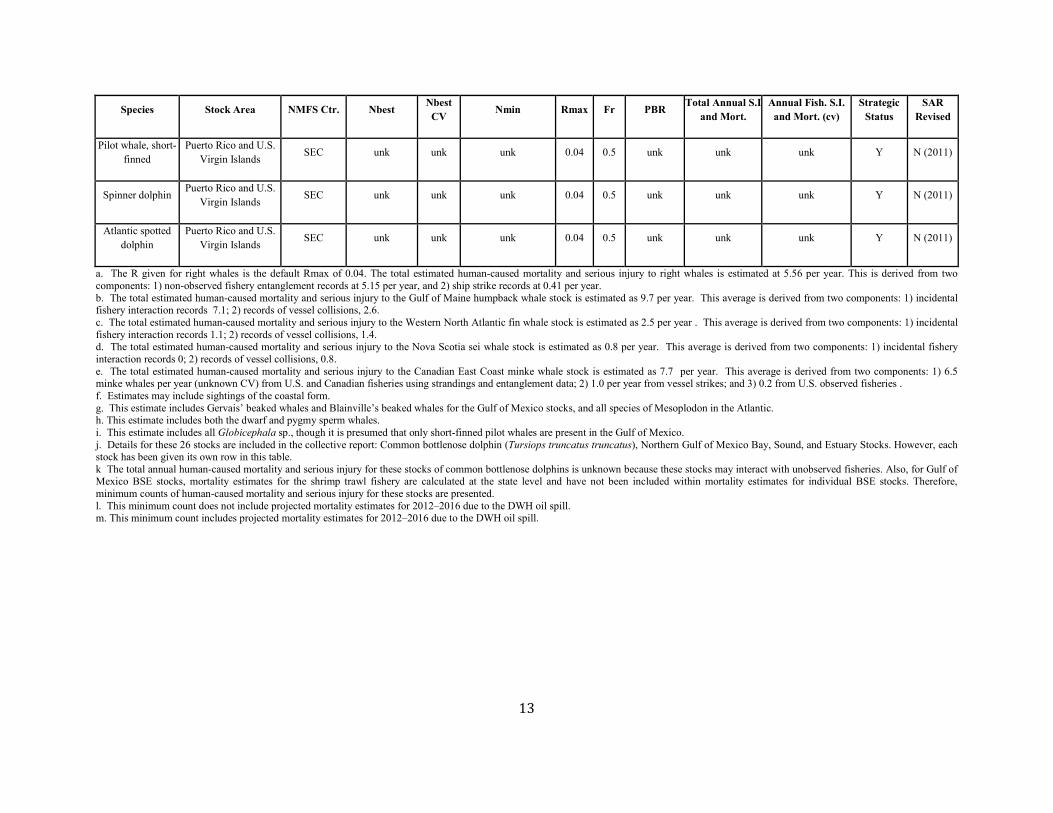
TABLE 1. A SUMMARY (including footnotes) OF ATLANTIC MARINE MAMMAL STOCK ASSESSMENT REPORTS FOR STOCKS OF MARINE MAMMALS UNDER NMFS AUTHORITY
THAT OCCUPY WATERS UNDER USA JURISDICTION. Total Annual S.I. (serious injury) and Mortality and Annual Fisheries S.I. and Mortality are mean annual figures for the period 2012-2016. The “SAR revised” column indicates 2018 stock assessment reports that have been revised relative to the 2017 reports (Y=yes, N=no). If abundance, mortality, PBR or status have been revised, they are indicated with the letters “a”, “m”, “p” and “status” respectively. For those species not updated in this edition, the year of last revision is indicated. Unk = unknown and undet=undetermined (PBR for species with outdated abundance estimates is considered "undetermined").
Species Stock Area NMFS Ctr. Nbest Nbest CV Nmin Rmax Fr PBR Total Annual S.I
and Mort. Annual Fish. S.I.
and Mort. (cv) Strategic
Status SAR
Revised
North Atlantic right whale Western North Atlantic NEC 451 0 445 0.04a 0.1 0.9 5.56a 5.15a Y
Y
(a, m, p)
Humpback whale Gulf of Maine NEC 896 0 896 0.065 0.5 14.6 9.7b 7.1b N
Y
(a, m, p, status)
Fin whale Western North Atlantic NEC 1,618 0.33 1,234 0.04 0.1 2.5 2.5c 1.1c Y Y
(m)
Sei whale Nova Scotia NEC 357 0.52 236 0.04 0.1 0.5 0.8d 0 d Y N
(2016)
Minke whale Canadian east coast NEC 2,591 0.81 1,425 0.04 0.5 14 7.7e 6.7 e N Y
(m)
Blue whale Western North Atlantic NEC unk unk 440 0.04 0.1 0.9 unk unk Y N
(2010)
4
Species Stock Area NMFS Ctr. Nbest Nbest CV Nmin Rmax Fr PBR Total Annual S.I
and Mort. Annual Fish. S.I.
and Mort. (cv) Strategic
Status SAR
Revised
Sperm whale North Atlantic NEC 2,288 0.28 1,815 0.04 0.1 3.6 0.8 0.6 Y N
(2014)
Dwarf sperm whale Western North Atlantic SEC 3,785h 0.47 2,598 h 0.04 0.4 21 3.5 3.5 (1.0) N
N
(2016)
Pygmy sperm whale Western North Atlantic SEC 3,785 h 0.47 2,598 h 0.04 0.4 21 3.5 3.5 (1.0) N
N
(2016)
Killer whale Western North Atlantic NEC unk unk unk 0.04 0.5 unk 0 0 N N (2014)
Pygmy killer whale Western North Atlantic SEC unk unk unk 0.04 0.5 unk 0 0 N
N
(2007)
False killer whale Western North Atlantic SEC 442 1.06 212 0.04 0.5 2.1 unk unk Y N (2014)
Northern bottlenose whale Western North Atlantic NEC unk unk unk 0.04 0.5 unk 0 0 N N (2014)
Cuvier's beaked whale Western North Atlantic NEC 6,532 0.32 5,021 0.04 0.5 50 0.4 0.2 N
N
(2013)
Blainville’s beaked whale Western North Atlantic NEC 7,092g 0.54 4,632 g 0.04 0.5 46 0.2 0.2 N
N
(2013)
Gervais beaked whale Western North Atlantic NEC 7,092g 0.54 4,632 g 0.04 0.5 46 0 0 N
N
(2013)
Sowerby’s beaked whale Western North Atlantic NEC 7,092g 0.54 4,632 g 0.04 0.5 46 0 0 N N (2014)
5
Species Stock Area NMFS Ctr. Nbest Nbest CV Nmin Rmax Fr PBR Total Annual S.I
and Mort. Annual Fish. S.I.
and Mort. (cv) Strategic
Status SAR
Revised
True’s beaked whale Western North Atlantic NEC 7,092g 0.54 4,632 g 0.04 0.5 46 0 0 N
N
(2013)
Melon-headed whale Western North Atlantic SEC unk unk unk 0.04 0.5 unk 0 0 N
N
(2007)
Risso's dolphin Western North Atlantic NEC 18,250 0.46 12,619 0.04 0.5 126 49.9 49.7 (0.24) N Y
(m)
Pilot whale, long-finned Western North Atlantic NEC 5,636 0.63 3,464 0.04 0.5 35 27 27 (0.18) N
Y
(m, status)
Pilot whale, short-finned Western North Atlantic SEC 28,924 0.24 23,637 0.04 0.5 236 168 168 (0.13) N Y (a, m, p)
Atlantic white-sided dolphin Western North Atlantic NEC 48,819 0.61 30,403 0.04 0.5 304 30 30 (0.19) N
Y
(m)
White-beaked dolphin Western North Atlantic NEC 2,003 0.94 1,023 0.04 0.5 10 0 0 N
N
(2007)
Common dolphin Western North Atlantic NEC 70,184 0.28 55,690 0.04 0.5 557 406 406 (0.10) N Y
(m)
Atlantic spotted dolphin Western North Atlantic SEC 44.715 0.43 31,610 0.04 0.5 316 0 0 N N (2013)
Pantropical spotted dolphin Western North Atlantic SEC 3,333 0.91 1,733 0.04 0.5 17 0 0 N N (2013)
Striped dolphin Western North Atlantic NEC 54,807 0.3 42,804 0.04 0.5 428 0 0 N N (2013)

6
Species Stock Area NMFS Ctr. Nbest Nbest CV Nmin Rmax Fr PBR Total Annual S.I
and Mort. Annual Fish. S.I.
and Mort. (cv) Strategic
Status SAR
Revised
Fraser’s dolphin Western North Atlantic SEC unk unk unk 0.04 0.5 unk 0 0 N N (2007)
Rough-toothed dolphin Western North Atlantic SEC 136 1.0 67 0.04 0.5 0.7 0 0 N Y (a, p)
Clymene dolphin Western North Atlantic SEC unk unk unk 0.04 0.5 undet 0 0 N N (2013)
Spinner dolphin Western North Atlantic SEC unk unk unk 0.04 0.5 unk 0 0 N N (2013)
Common bottlenose dolphin
Western North Atlantic, offshore SEC 77,532 f 0.40 56,053j 0.04 0.5 561 39.4 39.4 (0.29) N N (2016)
Common bottlenose dolphin
Western North Atlantic, northern migratory coastal
SEC 6,639 0.41 4,759 0.04 0.5 48 6.1-13.2 k 6.1-13.2 k Y N (2017)
Common bottlenose dolphin
Western North Atlantic, southern migratory coastal
SEC 3,751 .060 2,353 0.04 0.5 23 0-14.3 k 0-14.3 k Y N (2017)
Common bottlenose dolphin
Western North Atlantic, S.
Carolina/Georgia coastal
SEC 6,027 0.34 4,569 0.04 0.5 46 1.4-1.6 k 1.0-1.2 k Y N (2017)
Common bottlenose dolphin
Western North Atlantic, northern
Florida coastal SEC 877 0.49 595 0.04 0.5 6.0 0.6 k 0 k Y N (2017)
Common bottlenose dolphin
Western North Atlantic, central Florida coastal
SEC 1,218 0.35 913 0.04 0.5 9.1 0.4 k 0.4 k Y N (2017)
Common bottlenose dolphin
Northern North Carolina Estuarine
System SEC 823 0.06 782 0.04 0.5 7.8 0.8-18.2 k 0.2-17.6 k Y N (2017)

7
Species Stock Area NMFS Ctr. Nbest Nbest CV Nmin Rmax Fr PBR Total Annual S.I
and Mort. Annual Fish. S.I.
and Mort. (cv) Strategic
Status SAR
Revised
Common bottlenose dolphin
Southern North Carolina Estuarine
System SEC unk unk unk 0.04 0.5 undet 0.4-0.6 k 0.4-0.6 k Y N (2017)
Common bottlenose dolphin
Northern South Carolina Estuarine
System SEC unk unk unk 0.04 0.5 unk 0.2 k 0.2 k Y N (2015)
Common bottlenose dolphin
Charleston Estuarine System SEC unk unk unk 0.04 0.5 undet unkk unkk Y N (2015)
Common bottlenose dolphin
Northern Georgia/ Southern South
Carolina Estuarine System
SEC unk unk unk 0.04 0.5 unk 1.4 k 1.4 k Y N (2015)
Common bottlenose dolphin
Central Georgia Estuarine System SEC 192 0.04 185 0.04 0.5 1.9 unkk unkk Y N (2015)
Common bottlenose dolphin
Southern Georgia Estuarine System SEC 194 0.05 185 0.04 0.5 1.9 unkk unkk Y N (2015)
Common bottlenose dolphin
Jacksonville Estuarine System SEC unk unk unk 0.04 0.5 unk 1.2 k 1.2 k Y N (2015)
Common bottlenose dolphin
Indian River Lagoon Estuarine System SEC unk unk unk 0.04 0.5 unk 4.4 k 4.4 k Y N (2015)
Common bottlenose dolphin Biscayne Bay SEC unk unk unk 0.04 0.5 unk unk k unk k Y N (2013)
Common bottlenose dolphin Florida Bay SEC unk unk unk 0.04 0.5 undet unk k unk k N N (2013)
Harbor porpoise Gulf of Maine/Bay of Fundy NEC 79,833 0.32 61,415 0.046 0.5 706 256 256 (0.18) N Y (m)
Harbor seal Western North Atlantic NEC 75,834 0.15 66,884 0.12 0.5 2,006 345 333 (0.12) N Y (m)
8
Species Stock Area NMFS Ctr. Nbest Nbest CV Nmin Rmax Fr PBR Total Annual S.I
and Mort. Annual Fish. S.I.
and Mort. (cv) Strategic
Status SAR
Revised
Gray seal Western North Atlantic NEC 27,131 0.19 23,158 0.12 1.0 1,389 5,688 873 (0.10) N Y (m)
Harp seal Western North Atlantic NEC unk unk unk 0.12 1.0 unk 225,687 57 (0.23) N Y (m)
Hooded seal Western North Atlantic NEC unk unk unk 0.12 0.75 unk 1,680 0.6(1.12) N Y (m)
Sperm whale Gulf of Mexico SEC 763 0.38 560 0.04 0.1 1.1 0 0 Y N (2015)
Bryde’s whale Gulf of Mexico SEC 33 1.07 16 0.04 0.1 0.03 0.8 0 Y N (2017)
Cuvier’s beaked whale Gulf of Mexico SEC 74 1.04 36 0.04 0.5 0.4 0 0 N N (2012)
Blainville’s beaked whale Gulf of Mexico SEC 149g 0.91 77 0.04 0.5 0.8 0 0 N N (2012)
Gervais’ beaked whale
Gulf of Mexico SEC 149g 0.91 77 0.04 0.5 0.8 0 0 N N (2012)
Common bottlenose dolphin
Gulf of Mexico, Continental shelf
SEC 51,192 0.10 46,926 0.04 0.5 469 0.8 k 0.6 k N N (2015)
Common bottlenose dolphin
Gulf of Mexico, eastern coastal
SEC 12,388 0.13 11,110 0.04 0.5 111 1.6 k 1.6 k N N (2015)
Common bottlenose dolphin
Gulf of Mexico, northern coastal
SEC 7,185 0.21 6,044 0.04 0.5 60 0.4 k, l 0.4 k N N (2015)
Common bottlenose dolphin
Gulf of Mexico, western coastal
SEC 20,161 0.17 17,491 0.04 0.5 175 0.6 k 0.6 k N N (2015)
Common bottlenose dolphin
Gulf of Mexico, Oceanic SEC 5,806 0.39 4,230 0.04 0.5 42 6.5 6.5 (0.65) N
N
(2014)
Common bottlenose dolphin Laguna Madrej SEC 80 1.57 unk 0.04 0.5 undet 0.4 k 0.2 k Y Y (m)
9
Species Stock Area NMFS Ctr. Nbest Nbest CV Nmin Rmax Fr PBR Total Annual S.I
and Mort. Annual Fish. S.I.
and Mort. (cv) Strategic
Status SAR
Revised
Common bottlenose dolphin
Neuces Bay/Corpus Christi Bayj SEC 58 0.61 unk 0.04 0.5 undet 0 k 0 k Y Y (m)
Common bottlenose dolphin
Copano Bay/Aransas Bay/San Antonio
Bay/Redfish Bay/Espiritu Santo
Bayj
SEC 55 0.82 unk 0.04 0.5 undet 0.2 k 0 k Y Y (m)
Common bottlenose dolphin
Matagorda Bay/Tres Palacios Bay/Lavaca
Bayj SEC 61 0.45 unk 0.04 0.5 undet 0.4 k 0 k Y Y (m)
Common bottlenose dolphin West Bayj SEC 32 0.15 unk 0.04 0.5 undet 0.2 k 0.2 k Y Y (m)
Common bottlenose dolphin
Galveston Bay/East Bay/Trinity Bayj SEC 152 0.43 unk 0.04 0.5 undet 0.4 k 0.4 k Y Y (m)
Common bottlenose dolphin Sabine Lakej SEC 0 - - 0.04 0.4 undet 0.2 k 0 k Y Y (m)
Common bottlenose dolphin Calcasieu Lakej SEC 0 - - 0.04 0.4 undet 0.2 k 0.2 k Y Y (m)
Common bottlenose dolphin
Vermilion Bay/West Cote Blanche
Bay/Atchafalaya Bayj SEC 0 - - 0.04 0.4 undet 0 k 0 k Y Y (m)
Common bottlenose dolphin
Terrebonne Bay/Timbalier Bay SEC 3870 0.15 3426 0.04 0.4 27 0.2 k 0 k N Y (a, m, p)
Common bottlenose dolphin Barataria Bay SEC 2,306 0.09 2,138 0.04 0.4 17 160 k 0.8 k Y N (2017)
Common bottlenose dolphin
Mississippi River Deltaj SEC 332 0.93 170 0.04 0.4 1.4 32.7k, m 0 k Y Y (m)
10
Species Stock Area NMFS Ctr. Nbest Nbest CV Nmin Rmax Fr PBR Total Annual S.I
and Mort. Annual Fish. S.I.
and Mort. (cv) Strategic
Status SAR
Revised
Common bottlenose dolphin
Mississippi Sound, Lake Borgne, Bay
Boudreau SEC 3,046 0.06 2,896 0.04 0.4 23 310 k 1.0 k Y N (2017)
Common bottlenose dolphin
Mobile Bay/Bonsecour Bayj SEC 122 0.34 unk 0.04 0.4 undet 36.6 k, m 0.8 k Y Y (m)
Common bottlenose dolphin Perdido Bayj SEC 0 - - 0.04 0.4 undet 0.6 k 0.2 k Y Y (m)
Common bottlenose dolphin
Pensacola Bay/East Bayj SEC 33 0.80 unk 0.04 0.4 undet 0.2 k 0.2 k Y Y (m)
Common bottlenose dolphin
Choctawhatchee Bay SEC 179 0.04 unk 0.04 0.5 undet 0.4 k 0.4 k Y N (2015)
Common bottlenose dolphin
St. Andrew Bayj SEC 124 0.57 unk 0.04 0.4 undet 0.2 k 0.2 k Y Y (m)
Common bottlenose dolphin
St. Joseph Bay SEC 152 0.08 unk 0.04 0.4 undet unk k unk k Y N (2015)
Common bottlenose dolphin
St. Vincent Sound/Apalachicola
Bay/St. George Soundj SEC 439 0.14 unk 0.04 0.4 undet 0 k 0 k Y Y (m)
Common bottlenose dolphin Apalachee Bayj SEC 491 0.39 unk 0.04 0.4 undet 0 k 0 k Y Y (m)
Common bottlenose dolphin
Waccasassa Bay/Withlacoochee
Bay/Crystal Bayj SEC unk - unk 0.04 0.4 undet 0 k 0 k Y Y (m)
Common bottlenose dolphin
St. Joseph Sound/Clearwater
Harborj SEC unk - unk 0.04 0.4 undet 0.4 k 0.4 k Y Y (m)
11
Species Stock Area NMFS Ctr. Nbest Nbest CV Nmin Rmax Fr PBR Total Annual S.I
and Mort. Annual Fish. S.I.
and Mort. (cv) Strategic
Status SAR
Revised
Common bottlenose dolphin Tampa Bayj SEC unk - unk 0.04 0.4 undet 0.6 k 0.6 k Y Y (m)
Common bottlenose dolphin
Sarasota Bay/Little Sarasota Bayj SEC 158 0.27 126 0.04 0.4 1.0 0.6 k 0.6 k N Y (m)
Common bottlenose dolphin
Pine Island Sound/Charlotte
Harbor/Gasparilla Sound/Lemon Bayj
SEC 826 0.09 unk 0.04 0.4 undet 1.6 k 1.0 k Y Y (m)
Common bottlenose dolphin Caloosahatchee Riverj SEC 0 - - 0.04 0.4 undet 0.4 k 0.4 k Y Y (m)
Common bottlenose dolphin Estero Bayj SEC unk - unk 0.04 0.4 undet 0.2 k 0 k Y Y (m)
Common bottlenose dolphin
Chokoloskee Bay/Ten Thousand
Islands/Gullivan Bayj SEC unk - unk 0.04 0.4 undet 0 k 0 k Y Y (m)
Common bottlenose dolphin Whitewater Bayj SEC unk - unk 0.04 0.4 undet 0 k 0 k Y Y (m)
Common bottlenose dolphin
Florida Keys (Bahia Honda to Key West)j SEC unk - unk 0.04 0.4 undet 0 k 0 k Y Y (m)
Atlantic spotted dolphin Gulf of Mexico SEC unk unk unk 0.04 0.5 undet 42 42 (0.45) N N (2015)
Pantropical spotted dolphin Gulf of Mexico SEC 50,880 0.27 40,699 0.04 0.5 407 4.4 4.4 N N (2015)
Striped dolphin Gulf of Mexico SEC 1,849 0.77 1,041 0.04 0.5 10 0 0 N N (2012)
Spinner dolphin Gulf of Mexico SEC 11,441 0.83 6,221 0.04 0.5 62 0 0 N N (2012)
12
Species Stock Area NMFS Ctr. Nbest Nbest CV Nmin Rmax Fr PBR Total Annual S.I
and Mort. Annual Fish. S.I.
and Mort. (cv) Strategic
Status SAR
Revised
Rough-toothed dolphin Gulf of Mexico SEC 624 0.99 311 0.04 0.4 2.5 0.8 0.8 (1.0) N N (2016)
Clymene dolphin Gulf of Mexico SEC 129 1.00 64 0.04 0.5 0.6 0 0 N N (2012)
Fraser’s dolphin Gulf of Mexico SEC unk unk unk 0.04 0.5 undet 0 0 N N (2012)
Killer whale Gulf of Mexico SEC 28 1.02 14 0.04 0.5 0.1 0 0 N N (2012)
False killer whale Gulf of Mexico SEC unk unk unk 0.04 0.5 undet 0 0 N N (2012)
Pygmy killer whale Gulf of Mexico SEC 152 1.02 75 0.04 0.5 0.8 0 0 N N (2012)
Dwarf sperm whale Gulf of Mexico SEC 186h 1.04 90 0.04 0.5 0.9 0 0 N N (2012)
Pygmy sperm whale Gulf of Mexico SEC 186h 1.04 90 0.04 0.5 0.9 0.3 0.3 (1.0) N N (2012)
Melon-headed whale Gulf of Mexico SEC 2,235 0.75 1,274 0.04 0.5 13 0 0 N N (2012)
Risso’s dolphin Gulf of Mexico SEC 2,442 0.57 1,563 0.04 0.5 16 7.9 7.9 (0.85) N N (2015)
Pilot whale, short-finned
Gulf of Mexico SEC 2,415i 0.66 1456 0.04 0.5 15 0.5 0.5 (1.0) N N (2015)
Sperm Whale Puerto Rico and U.S. Virgin Islands
SEC unk unk unk 0.04 0.1 unk unk unk Y N (2010)
Common bottlenose dolphin
Puerto Rico and U.S. Virgin Islands
SEC unk unk unk 0.04 0.5 unk unk unk Y N (2011)
Cuvier’s beaked whale
Puerto Rico and U.S. Virgin Islands SEC unk unk unk 0.04 0.5 unk unk unk Y N (2011)
13
Species Stock Area NMFS Ctr. Nbest Nbest CV Nmin Rmax Fr PBR Total Annual S.I
and Mort. Annual Fish. S.I.
and Mort. (cv) Strategic
Status SAR
Revised
Pilot whale, short-finned
Puerto Rico and U.S. Virgin Islands SEC unk unk unk 0.04 0.5 unk unk unk Y N (2011)
Spinner dolphin Puerto Rico and U.S. Virgin Islands SEC unk unk unk 0.04 0.5 unk unk unk Y N (2011)
Atlantic spotted dolphin
Puerto Rico and U.S. Virgin Islands SEC unk unk unk 0.04 0.5 unk unk unk Y N (2011)
a. The R given for right whales is the default Rmax of 0.04. The total estimated human-caused mortality and serious injury to right whales is estimated at 5.56 per year. This is derived from two components: 1) non-observed fishery entanglement records at 5.15 per year, and 2) ship strike records at 0.41 per year. b. The total estimated human-caused mortality and serious injury to the Gulf of Maine humpback whale stock is estimated as 9.7 per year. This average is derived from two components: 1) incidental fishery interaction records 7.1; 2) records of vessel collisions, 2.6. c. The total estimated human-caused mortality and serious injury to the Western North Atlantic fin whale stock is estimated as 2.5 per year . This average is derived from two components: 1) incidental fishery interaction records 1.1; 2) records of vessel collisions, 1.4. d. The total estimated human-caused mortality and serious injury to the Nova Scotia sei whale stock is estimated as 0.8 per year. This average is derived from two components: 1) incidental fishery interaction records 0; 2) records of vessel collisions, 0.8. e. The total estimated human-caused mortality and serious injury to the Canadian East Coast minke whale stock is estimated as 7.7 per year. This average is derived from two components: 1) 6.5 minke whales per year (unknown CV) from U.S. and Canadian fisheries using strandings and entanglement data; 2) 1.0 per year from vessel strikes; and 3) 0.2 from U.S. observed fisheries . f. Estimates may include sightings of the coastal form. g. This estimate includes Gervais’ beaked whales and Blainville’s beaked whales for the Gulf of Mexico stocks, and all species of Mesoplodon in the Atlantic. h. This estimate includes both the dwarf and pygmy sperm whales. i. This estimate includes all Globicephala sp., though it is presumed that only short-finned pilot whales are present in the Gulf of Mexico. j. Details for these 26 stocks are included in the collective report: Common bottlenose dolphin (Tursiops truncatus truncatus), Northern Gulf of Mexico Bay, Sound, and Estuary Stocks. However, each stock has been given its own row in this table. k The total annual human-caused mortality and serious injury for these stocks of common bottlenose dolphins is unknown because these stocks may interact with unobserved fisheries. Also, for Gulf of Mexico BSE stocks, mortality estimates for the shrimp trawl fishery are calculated at the state level and have not been included within mortality estimates for individual BSE stocks. Therefore, minimum counts of human-caused mortality and serious injury for these stocks are presented. l. This minimum count does not include projected mortality estimates for 2012–2016 due to the DWH oil spill. m. This minimum count includes projected mortality estimates for 2012–2016 due to the DWH oil spill.
14
February 2019
NORTH ATLANTIC RIGHT WHALE (Eubalaena glacialis): Western Atlantic Stock
STOCK DEFINITION AND GEOGRAPHIC RANGE
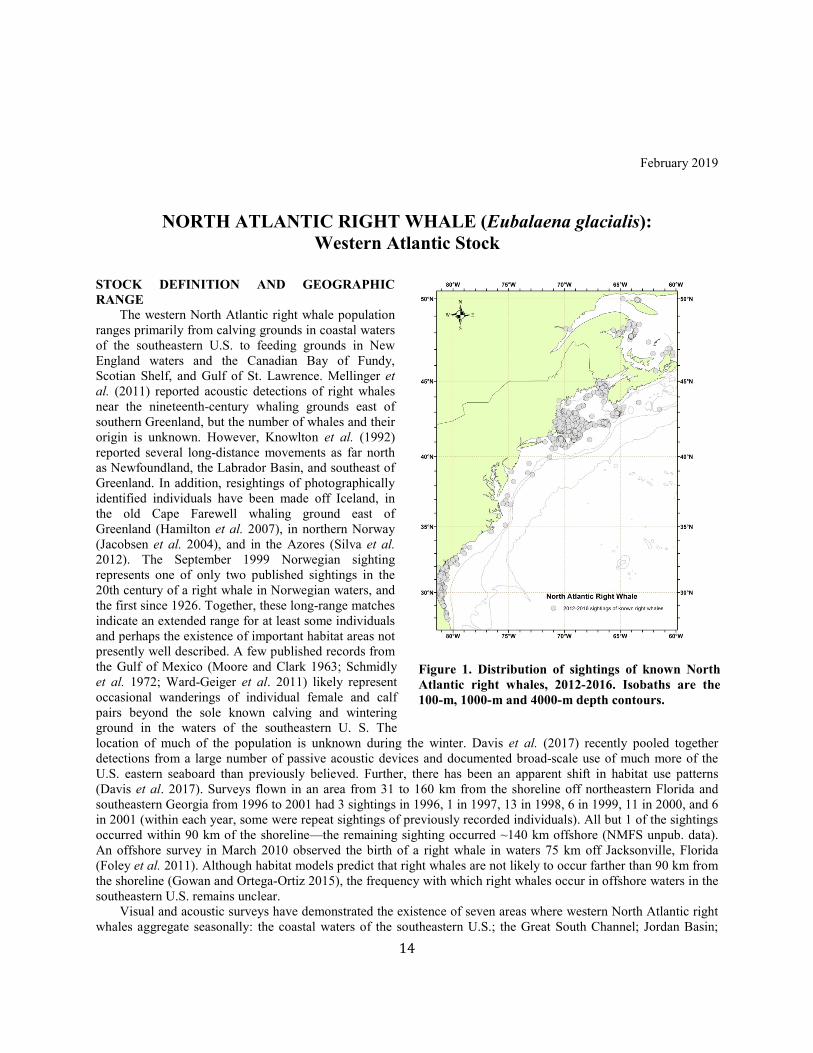
The western North Atlantic right whale population ranges primarily from calving grounds in coastal waters of the southeastern U.S. to feeding grounds in New England waters and the Canadian Bay of Fundy, Scotian Shelf, and Gulf of St. Lawrence. Mellinger et al. (2011) reported acoustic detections of right whales near the nineteenth-century whaling grounds east of southern Greenland, but the number of whales and their origin is unknown. However, Knowlton et al. (1992) reported several long-distance movements as far north as Newfoundland, the Labrador Basin, and southeast of Greenland. In addition, resightings of photographically identified individuals have been made off Iceland, in the old Cape Farewell whaling ground east of Greenland (Hamilton et al. 2007), in northern Norway (Jacobsen et al. 2004), and in the Azores (Silva et al. 2012). The September 1999 Norwegian sighting represents one of only two published sightings in the 20th century of a right whale in Norwegian waters, and the first since 1926. Together, these long-range matches indicate an extended range for at least some individuals and perhaps the existence of important habitat areas not presently well described. A few published records from the Gulf of Mexico (Moore and Clark 1963; Schmidly et al. 1972; Ward-Geiger et al. 2011) likely represent occasional wanderings of individual female and calf pairs beyond the sole known calving and wintering ground in the waters of the southeastern U. S. The location of much of the population is unknown during the winter. Davis et al. (2017) recently pooled together detections from a large number of passive acoustic devices and documented broad-scale use of much more of the U.S. eastern seaboard than previously believed. Further, there has been an apparent shift in habitat use patterns (Davis et al. 2017). Surveys flown in an area from 31 to 160 km from the shoreline off northeastern Florida and southeastern Georgia from 1996 to 2001 had 3 sightings in 1996, 1 in 1997, 13 in 1998, 6 in 1999, 11 in 2000, and 6 in 2001 (within each year, some were repeat sightings of previously recorded individuals). All but 1 of the sightings occurred within 90 km of the shoreline—the remaining sighting occurred ~140 km offshore (NMFS unpub. data). An offshore survey in March 2010 observed the birth of a right whale in waters 75 km off Jacksonville, Florida (Foley et al. 2011). Although habitat models predict that right whales are not likely to occur farther than 90 km from the shoreline (Gowan and Ortega-Ortiz 2015), the frequency with which right whales occur in offshore waters in the southeastern U.S. remains unclear. Visual and acoustic surveys have demonstrated the existence of seven areas where western North Atlantic right whales aggregate seasonally: the coastal waters of the southeastern U.S.; the Great South Channel; Jordan Basin;
Figure 1. Distribution of sightings of known North Atlantic right whales, 2012-2016. Isobaths are the 100-m, 1000-m and 4000-m depth contours.

15
Georges Basin along the northeastern edge of Georges Bank; Cape Cod and Massachusetts Bays; the Bay of Fundy; and the Roseway Basin on the Scotian Shelf (Brown et al. 2001; Cole et al. 2013). Passive acoustic studies of right whales have demonstrated their year-round presence in the Gulf of Maine (Morano et al. 2012; Bort et al. 2015), New Jersey (Whitt et al. 2013), and Virginia (Salisbury et al. 2016). Additionally, right whales were acoustically detected off Georgia and North Carolina in 7 of 11 months monitored (Hodge et al. 2015). All of this work further demonstrates the highly mobile nature of right whales. Movements within and between habitats are extensive, and the area off the mid-Atlantic states is an important migratory corridor. In 2000, one whale was photographed in Florida waters on 12 January, then again 11 days later (23 January) in Cape Cod Bay, less than a month later off Georgia (16 February), and back in Cape Cod Bay on 23 March, effectively making the round-trip migration to the Southeast and back at least twice during the winter season (Brown and Marx 2000). Results from satellite-tagging studies clearly indicate that sightings separated by perhaps two weeks should not necessarily be assumed to indicate a stationary or resident animal. Instead, telemetry data have shown rather lengthy excursions, including into deep water off the continental shelf (Mate et al. 1997; Baumgartner and Mate 2005). Systematic visual surveys conducted off the coast of North Carolina during the winters of 2001 and 2002 sighted 8 calves, suggesting the calving grounds may extend as far north as Cape Fear (W.A. McLellan, Univ. of North Carolina Wilmington, pers. comm.). Four of those calves were not sighted by surveys conducted farther south. One of the females photographed was new to researchers, having effectively eluded identification over the period of its maturation. In 2016 the Southeastern U.S. Calving Area Critical Habitat was expanded north to Cape Fear, North Carolina. There is also at least one case of a calf apparently being born in the Gulf of Maine (Patrician et al. 2009) and another newborn was detected in Cape Cod Bay in 2012 (Center for Coastal Studies, Provincetown, MA USA, unpub. data). Right whale calls have been detected by autonomous passive acoustic sensors deployed between 2005 and 2010 at three sites (Massachusetts Bay, Stellwagen Bank, and Jeffreys Ledge) in the southern Gulf of Maine (Morano et al. 2012, Mussoline et al. 2012). Comparisons between detections from passive acoustic recorders and observations from aerial surveys in Cape Cod Bay between 2001 and 2005 demonstrated that aerial surveys found whales on approximately two-thirds of the days during which acoustic monitoring detected whales (Clark et al. 2010). These data suggest that the current understanding of the distribution and movements of right whales in the Gulf of Maine and surrounding waters is incomplete. Additionally, the aforementioned apparent shift in habitat use patterns since 2010, highlighted by Davis et al. (2017), includes an increased use of Cape Cod Bay (Mayo et al. 2018) and decreased use of the Great South Channel. New England waters are important feeding habitats for right whales, where they feed primarily on copepods (largely of the genera Calanus and Pseudocalanus). Right whales must locate and exploit extremely dense patches of zooplankton to feed efficiently (Mayo and Marx 1990). These dense zooplankton patches are likely a primary characteristic of the spring, summer, and fall right whale habitats (Kenney et al. 1986, 1995). While feeding in the coastal waters off Massachusetts has been better studied than in other areas, right whale feeding has also been observed on the margins of Georges Bank, in the Great South Channel, in the Gulf of Maine, in the Bay of Fundy, and over the Scotian Shelf (Baumgartner et al. 2007). The characteristics of acceptable prey distribution in these areas are beginning to emerge (Baumgartner et al. 2003; Baumgartner and Mate 2003). The National Marine Fisheries Service (NMFS) and Center for Coastal Studies aerial surveys during springs of 1999–2006 found right whales along the Northern Edge of Georges Bank, in the Great South Channel, in Georges Basin, and in various locations in the Gulf of Maine including Cashes Ledge, Platts Bank, and Wilkinson Basin. Analysis of the sightings data has shown that utilization of these areas has a strong seasonal component (Pace and Merrick 2008). Although right whales are consistently found in these locations, studies also highlight the high interannual variability in right whale use of some habitats (Pendleton et al. 2009). In 2016, the Northeastern U.S. Foraging Area Critical Habitat was expanded to include nearly all U.S. waters of the Gulf of Maine (81 FR 4837, 26 February 2016). In the most recent years (2012–2015), surveys have detected fewer individuals in the Great South Channel and the Bay of Fundy, indicating an important shift in habitat use patterns. In addition, late winter use of a region south of Martha’s Vineyard and Nantucket Islands was recently described (Leiter et al. 2017). A large increase in aerial surveys of the Gulf of St. Lawrence documented at least 36 and 117 unique individuals using the region, respectively, during the summers of 2015 and 2017 (NMFS unpublished data). Genetic analyses based upon direct sequencing of mitochondrial DNA (mtDNA) have identified 7 mtDNA haplotypes in the western North Atlantic right whale, including heteroplasmy that led to the declaration of the seventh haplotype (Malik et al. 1999, McLeod and White 2010). Schaeff et al. (1997) compared the genetic variability of North Atlantic and southern right whales (E. australis), and found the former to be significantly less diverse, a finding broadly replicated by Malik et al. (2000). The low diversity in North Atlantic right whales might
16
be indicative of inbreeding, but no definitive conclusion can be reached using current data. Modern and historic genetic population structures were compared using DNA extracted from museum and archaeological specimens of baleen and bone. This work suggested that the eastern and western North Atlantic populations were not genetically distinct (Rosenbaum et al. 1997, 2000). However, the virtual extirpation of the eastern stock and its lack of recovery in the last hundred years strongly suggest population subdivision over a protracted (but not evolutionary) timescale. Genetic studies concluded that the principal loss of genetic diversity occurred prior to the 18th century (Waldick et al. 2002). However, revised conclusions that nearly all the remains in the North American Basque whaling archaeological sites were bowhead whales (Balaena mysticetus) and not right whales (Rastogi et al. 2004; McLeod et al. 2008) contradict the previously held belief that Basque whaling during the 16th and 17th centuries was principally responsible for the loss of genetic diversity. High-resolution (i.e., using 35 microsatellite loci) genetic profiling has been completed for 75% of all identified North Atlantic right whales. This work has improved our understanding of genetic variability, number of reproductively active individuals, reproductive fitness, parentage, and relatedness of individuals (Frasier et al. 2009). One emerging result of the genetic studies is the importance of obtaining biopsy samples from calves on the calving grounds. Between 1990 and 2010, only about 60% of all known calves were seen with their mothers in summering areas when their callosity patterns are stable enough to reliably make a photo-ID match later in life. The remaining 40% were not seen on a known summering ground. Because the calf’s genetic profile is the only reliable way to establish parentage, if the calf is not sampled when associated with its mother early on, then it is not possible to link it with a calving event or to its mother, and information such as age and familial relationships is lost. From 1980 to 2001, there were 64 calves born that were not sighted later with their mothers and thus unavailable to provide age-specific mortality information (Frasier et al. 2007). An additional interpretation of paternity analyses is that the population size may be larger than was previously thought. Fathers for only 45% of known calves have been genetically determined. However, genetic profiles were available for 69% of all photo-identified males (Frasier 2005). The conclusion was that the majority of these calves must have different fathers that cannot be accounted for by the unsampled males, therefore the population of males must be larger (Frasier 2005). The author considers that additional animals that have never been captured photographically and/or genetically suggests the existence of potentially important undescribed breeding habitats or stocks. Although the existence of more than one breeding stock of North Atlantic right whales cannot be ruled out, limitations in existing sampling processes and additional breeding strategies also may explain unsampled males.
POPULATION SIZE The western North Atlantic minimum stock size is based on a published state-space model of the sighting histories of individual whales identified using photo-identification techniques (Pace et al. 2017). Sightings histories were constructed from the photo-ID recapture database as it existed in October 2017. A hierarchical, state-space Bayesian open population model of these histories produced a median abundance value of 451 individuals (95% credible intervals 434–464). North Atlantic right whales represent one of the most intensely studied populations of cetaceans in the world, with effort supported by a rigorously maintained individual sightings database and considerable survey effort throughout its range. As with any statistically-based estimation process, uncertainties exist in the estimation of Nmin because it is based on a probabilistic model that makes certain assumptions about the structure of the data. Because the statistically-based uncertainty is asymmetric about N, the credible interval is used above to characterize that uncertainty (as opposed to a cv that may appear in other stock assessment reports),
Historical Abundance An estimate of pre-exploitation population size is not available. Basque whalers were thought to have taken right whales during the 1500s in the Strait of Belle Isle region (Aguilar 1986), however, genetic analysis has shown that nearly all of the remains found in that area are, in fact, those of bowhead whales (Rastogi et al. 2004; Frasier et al. 2007). The stock of right whales may have already been substantially reduced by the time whaling was begun by colonists in Massachusetts in the 1600s (Reeves et al. 2001, 2007). A modest but persistent whaling effort along the coast of the eastern U.S. lasted three centuries, and the records include one report of 29 whales killed in Cape Cod Bay in a single day during January 1700. Reeves et al. (2007) calculated that a minimum of 5500 right whales were taken in the western North Atlantic between 1634 and 1950, with nearly 80% taken in a 50-year period between 1680 and 1730. They concluded “there were at least a few thousand whales present in the mid-1600s.” The authors cautioned, however, that the record of removals is incomplete, the results were preliminary, and refinements are required. Based on back calculations using the present population size and growth rate, the population may have numbered fewer than 100 individuals by 1935 when international protection for right whales came into effect (Hain 1975; Reeves et al. 1992; Kenney et al. 1995). However, little is known about the population dynamics of right

17
whales in the intervening years.
Minimum Population Estimate The minimum population estimate is the lower limit of the two-tailed 60% credible interval about the median of the posterior abundance estimates using the methods of Pace et al. (2017). This is roughly equivalent to the 20th percentile of the log-normal distribution as specified by Wade and Angliss (1997). The median estimate of abundance for western North Atlantic right whales is 451. The minimum population estimate is 445.
Current Population Trend The population growth rate reported for the period 1986–1992 by Knowlton et al. (1994) was 2.5% (CV=0.12), suggesting that the stock was recovering slowly, but that number may have been influenced by discovery phenomenon as existing whales were recruited to the catalog. Work by Caswell et al. (1999) suggested that crude survival probability declined from about 0.99 in the early 1980s to about 0.94 in the late 1990s. The decline was statistically significant. Additional work conducted in 1999 was reviewed by the IWC workshop on status and trends in this population (IWC. 2001); the workshop concluded based on several analytical approaches that survival had indeed declined in the 1990s. Although capture heterogeneity could negatively bias survival estimates, the workshop concluded that this factor could not account for the entire observed decline, which appeared to be particularly marked in adult females. Another workshop was convened by NMFS in September 2002, and it reached similar conclusions regarding the decline in the population (Clapham 2002). At the time, the early part of the recapture series had not been examined for excessive retrospective recaptures which had the potential to positively bias the earliest estimates of survival as the catalog was being developed. An increase in carcass detections in 2004 and 2005 was cause for serious concern (Kraus et al. 2005). Of those mortalities, six were adult females, three of which were carrying near-term fetuses. Furthermore, four of these females were just starting to bear calves, losing their complete lifetime reproduction potential. Calculations based on demographic data through 1999 (Fujiwara and Caswell 2001) indicated that this mortality rate increase would reduce population growth by approximately 10% per year (Kraus et al. 2005). Strong evidence for flat or negative growth exists in the time series of minimum number alive during 1998–2000, which coincided with very low calf production in 2004. However, the population continued to grow since that apparent interval of decline until the most recent years included in this analysis (Figure 2). Examination of the abundance estimates for the years 1990–2011 (Figure 2) suggests that abundance increased at about 2.8% per annum from posterior median point estimates of 270 individuals in 1990 to 481 in 2011, but that there was a 99.99% chance that abundance declined from 2011 to 2016 when the final estimate was 451 individuals . As noted above, there seems to have been a considerable change in right whale habitat use patterns in areas where most of the population has been observed in previous years. This apparent change in habitat use has the effect that, despite relatively constant effort to find whales, the chance of seeing an individual that is alive has decreased. However, the methods in Pace et al. (2017) account for changes in capture probability.
Figure 2. (A) Abundance estimates for North Atlantic right whales. Estimates are the median values of a posterior distribution from modeled capture histories. Also shown are sex-specific abundance estimates. Cataloged whales may include some but not all calves produced each year. (B) Crude annual growth rates from the abundance values.
(A) (B)
18
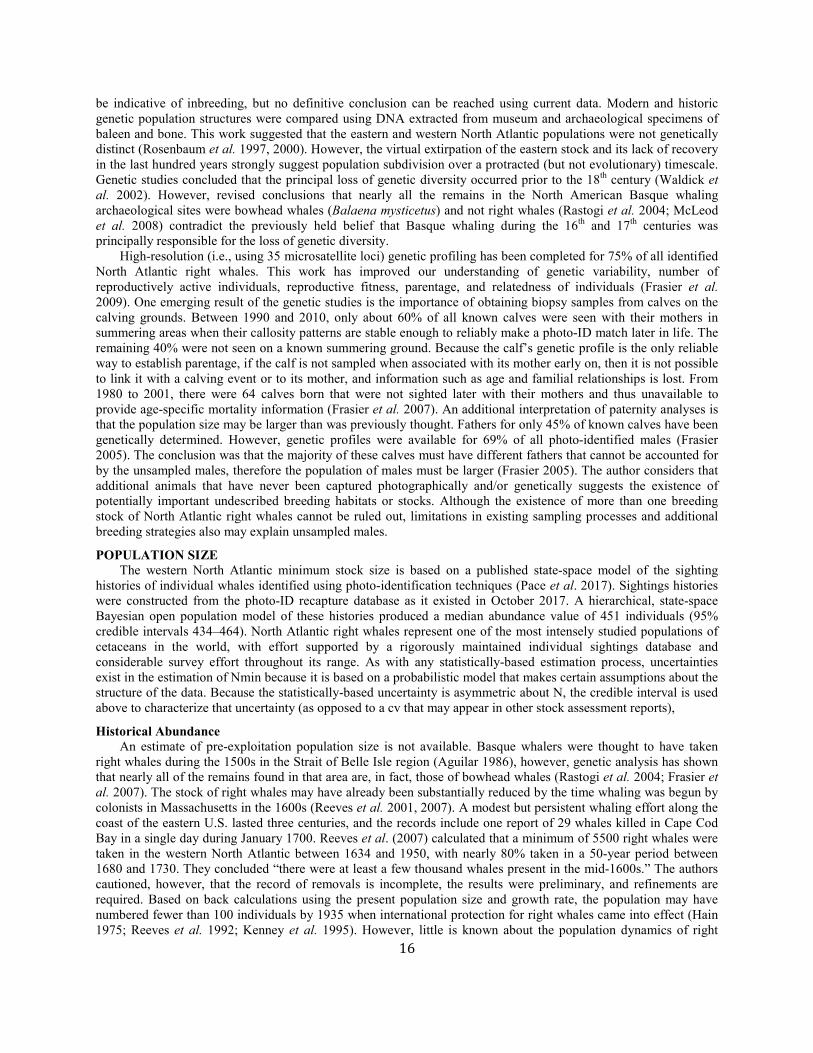
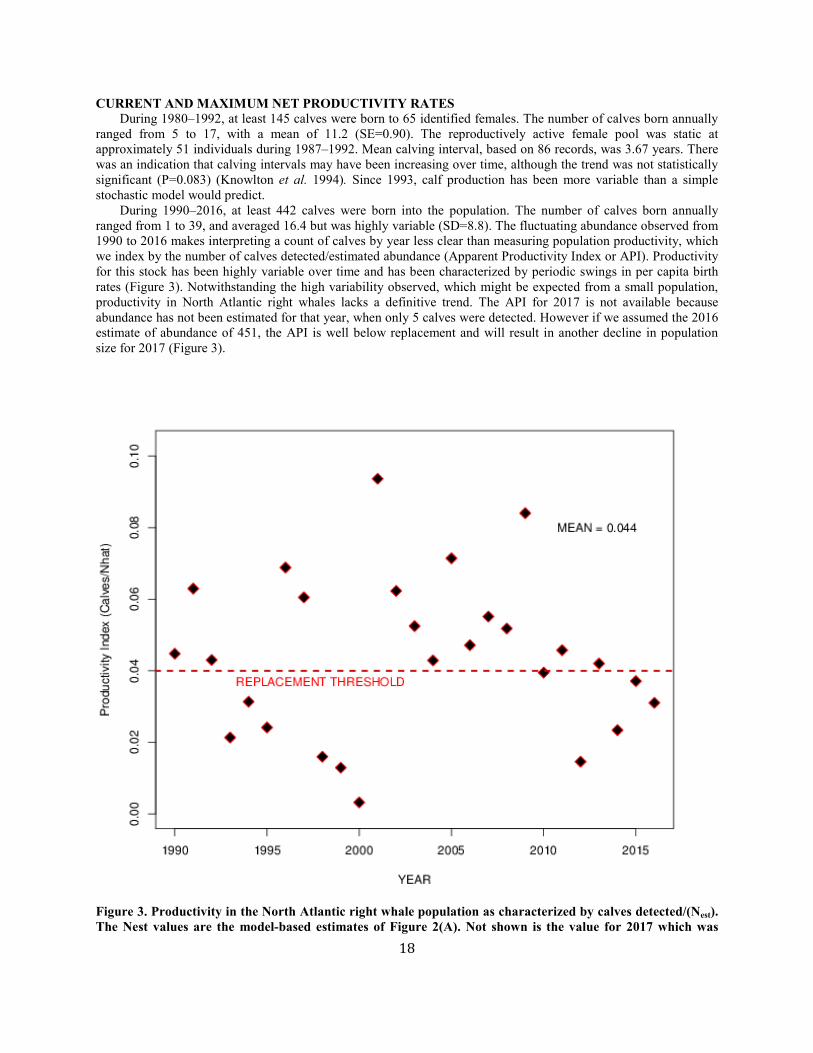
CURRENT AND MAXIMUM NET PRODUCTIVITY RATES During 1980–1992, at least 145 calves were born to 65 identified females. The number of calves born annually ranged from 5 to 17, with a mean of 11.2 (SE=0.90). The reproductively active female pool was static at approximately 51 individuals during 1987–1992. Mean calving interval, based on 86 records, was 3.67 years. There was an indication that calving intervals may have been increasing over time, although the trend was not statistically significant (P=0.083) (Knowlton et al. 1994). Since 1993, calf production has been more variable than a simple stochastic model would predict. During 1990–2016, at least 442 calves were born into the population. The number of calves born annually ranged from 1 to 39, and averaged 16.4 but was highly variable (SD=8.8). The fluctuating abundance observed from 1990 to 2016 makes interpreting a count of calves by year less clear than measuring population productivity, which we index by the number of calves detected/estimated abundance (Apparent Productivity Index or API). Productivity for this stock has been highly variable over time and has been characterized by periodic swings in per capita birth rates (Figure 3). Notwithstanding the high variability observed, which might be expected from a small population, productivity in North Atlantic right whales lacks a definitive trend. The API for 2017 is not available because abundance has not been estimated for that year, when only 5 calves were detected. However if we assumed the 2016 estimate of abundance of 451, the API is well below replacement and will result in another decline in population size for 2017 (Figure 3).
Figure 3. Productivity in the North Atlantic right whale population as characterized by calves detected/(Nest). The Nest values are the model-based estimates of Figure 2(A). Not shown is the value for 2017 which was
19
calculated using the 2016 estimate of abundance of 451.
North Atlantic right whales have thinner blubber than southern right whales off South Africa (Miller et al. 2011). Blubber thickness of male North Atlantic right whales (males were selected to avoid the effects of pregnancy and lactation) varied with Calanus abundance in the Gulf of Maine (Miller et al. 2011). Sightings of North Atlantic right whales correlated with satellite-derived sea-surface chlorophyll concentration (as a proxy for productivity), and calving rates correlated with chlorophyll concentration prior to gestation (Hlista et al. 2009). On a regional scale, observations of North Atlantic right whales correlate well with copepod concentrations (Pendleton et al. 2009). The available evidence suggests that at least some of the observed variability in the calving rates of North Atlantic right whales is related to variability in nutrition and possibly increased energy expenditures related to non-lethal entanglements (Rolland et al. 2016; van der Hoop 2017). An analysis of the age structure of this population suggests that it contains a smaller proportion of juvenile whales than expected (Hamilton et al. 1998; IWC 2001), which may reflect lowered recruitment and/or high juvenile mortality. Calf and perinatal mortality was estimated by Browning et al. (2010) to be between 17 and 45 animals during the period 1989 and 2003. In addition, it is possible that the apparently low reproductive rate is due in part to an unstable age structure or to reproductive dysfunction in some females. However, few data are available on either factor and senescence has not been documented for any baleen whale. The maximum net productivity rate is unknown for this stock. For purposes of this assessment, the maximum net productivity rate was assumed to be the default value of 0.04. This value is based on theoretical modeling showing that cetacean populations may not grow at rates much greater than 4% given the constraints of their reproductive life history (Barlow et al. 1995). Single year production has exceeded 0.04 in this population several times, but those outputs are not likely sustainable given the 3-year minimum interval required between successful calving events and the small fraction of reproductively active females. This is likely related to synchronous calving that can occur in capital breeders under variable environmental conditions. Hence, uncertainty exists as to whether the default value is representative of maximum net productivity for this stock, but it is unlikely that it is much higher than the default.
POTENTIAL BIOLOGICAL REMOVAL Potential biological removal (PBR) is the product of minimum population size, one-half the maximum net productivity rate and a recovery factor for endangered, depleted, threatened stocks, or stocks of unknown status relative to OSP (MMPA Sec. 3. 16 U.S.C. 1362; Wade and Angliss 1997). The recovery factor for right whales is 0.10 because this species is listed as endangered under the Endangered Species Act (ESA). The minimum population size is 445. The maximum productivity rate is 0.04, the default value for cetaceans. PBR for the Western Atlantic stock of the North Atlantic right whale is 0.9.
ANNUAL HUMAN-CAUSED SERIOUS INJURY AND MORTALITY For the period 2012 through 2016, the minimum rate of annual human-caused mortality and serious injury to right whales averaged 5.56 per year. This is derived from two components: 1) incidental fishery entanglement records at 5.15 per year, and 2) vessel strike records at 0.41 per year. Early analyses of the effectiveness of the ship strike rule were reported by Silber and Bettridge (2012). Recently, van der Hoop et al. (2015) concluded that large whale mortalities due to vessel strikes decreased inside active seasonal management areas (SMAs) and increased outside inactive SMAs. Analysis by Laist et al. (2014) incorporated an adjustment for drift around areas regulated under the ship strike rule and produced weak evidence that the rule was effective inside the SMAs. Although PBR analyses in this SAR reflect data collected through 2016, it should be noted that an additional 17 right whale mortalities were observed in 2017 (Daoust et al. 2017). This number exceeds the largest estimated mortality rate during the past 25 years. Further, despite the usual extensive survey effort, only 5 and 0 calves were detected in 2017 and 2018, respectively. Therefore, the decline in the right whale population will continue for at least an additional 2 years. Beginning with the 2001 Stock Assessment Report, Canadian records have been incorporated into the mortality and serious injury rates to reflect the effective range of this stock. It is important to stress that serious injury determinations are made based upon the best available information; these determinations may change with the availability of new information (Henry et al. in press). For the purposes of this report, discussion is limited to those records considered confirmed human-caused mortalities or serious injuries. Annual rates calculated from detected mortalities should be considered a low-biased accounting of human-caused mortality; they represent a definitive lower bound. Detections are haphazard, incomplete, and not the result of a designed sampling scheme. A key uncertainty is the fraction of the actual human-caused mortality represented by the detected serious injuries and
20
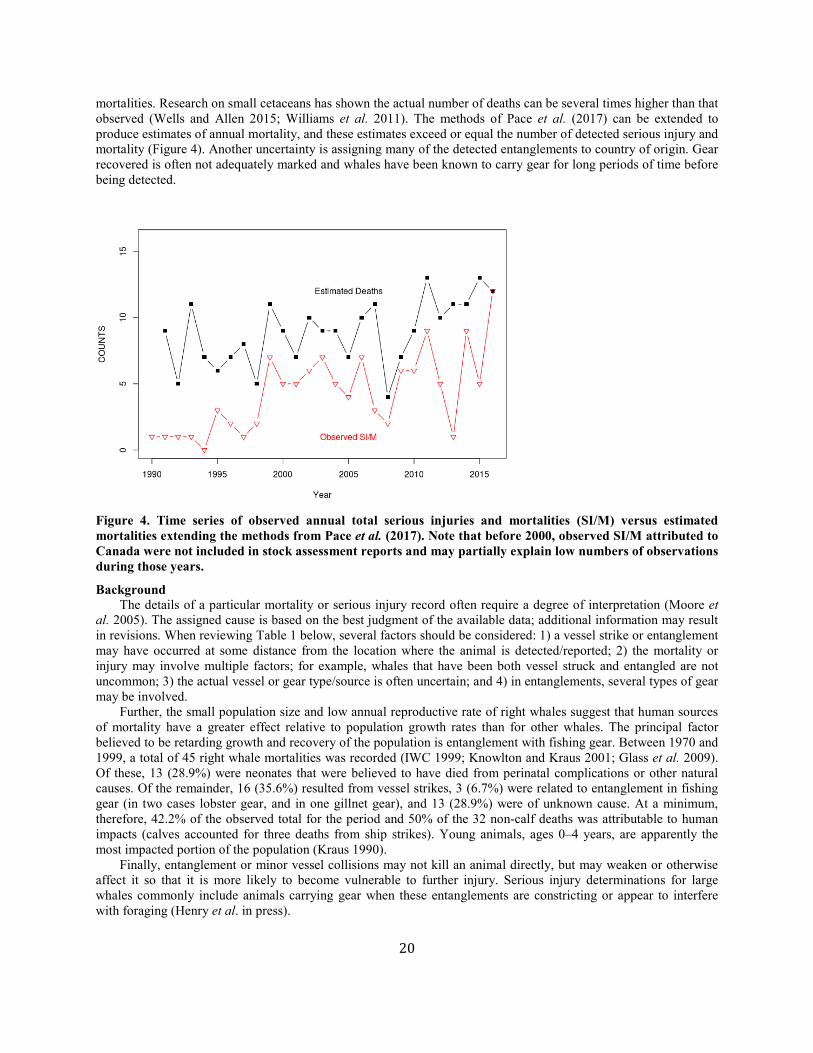
mortalities. Research on small cetaceans has shown the actual number of deaths can be several times higher than that observed (Wells and Allen 2015; Williams et al. 2011). The methods of Pace et al. (2017) can be extended to produce estimates of annual mortality, and these estimates exceed or equal the number of detected serious injury and mortality (Figure 4). Another uncertainty is assigning many of the detected entanglements to country of origin. Gear recovered is often not adequately marked and whales have been known to carry gear for long periods of time before being detected.
Figure 4. Time series of observed annual total serious injuries and mortalities (SI/M) versus estimated mortalities extending the methods from Pace et al. (2017). Note that before 2000, observed SI/M attributed to Canada were not included in stock assessment reports and may partially explain low numbers of observations during those years.
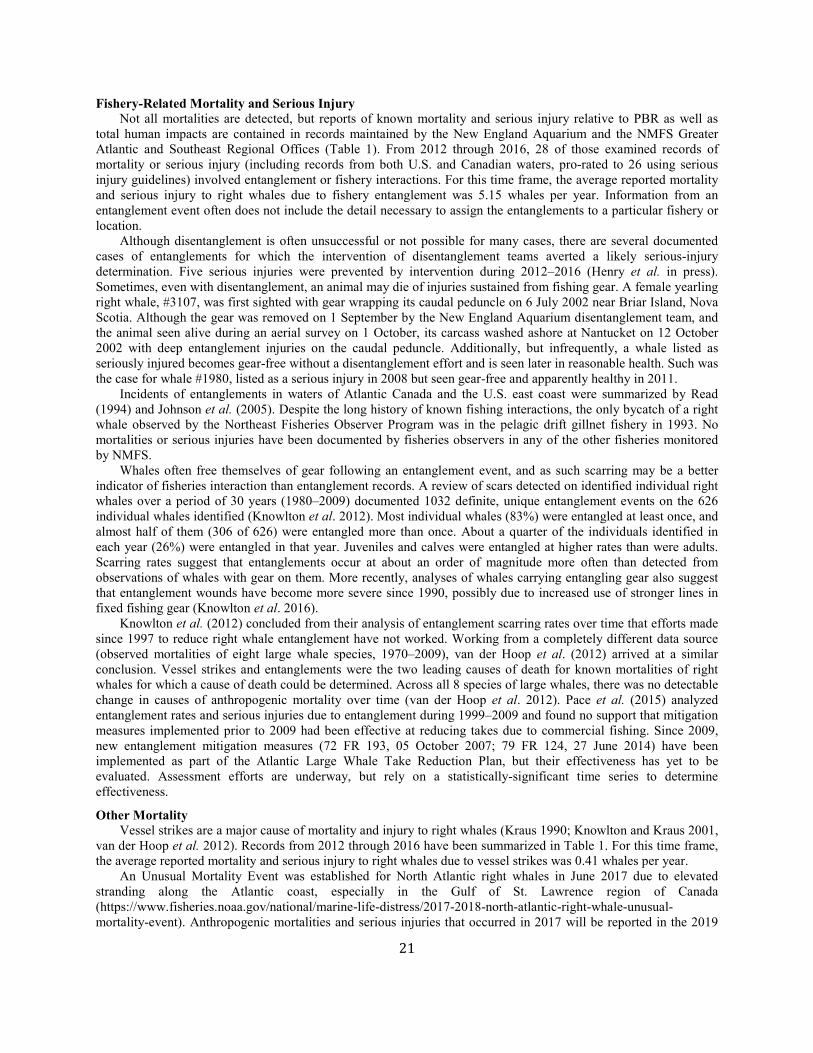
Background The details of a particular mortality or serious injury record often require a degree of interpretation (Moore et al. 2005). The assigned cause is based on the best judgment of the available data; additional information may result in revisions. When reviewing Table 1 below, several factors should be considered: 1) a vessel strike or entanglement may have occurred at some distance from the location where the animal is detected/reported; 2) the mortality or injury may involve multiple factors; for example, whales that have been both vessel struck and entangled are not uncommon; 3) the actual vessel or gear type/source is often uncertain; and 4) in entanglements, several types of gear may be involved. Further, the small population size and low annual reproductive rate of right whales suggest that human sources of mortality have a greater effect relative to population growth rates than for other whales. The principal factor believed to be retarding growth and recovery of the population is entanglement with fishing gear. Between 1970 and 1999, a total of 45 right whale mortalities was recorded (IWC 1999; Knowlton and Kraus 2001; Glass et al. 2009). Of these, 13 (28.9%) were neonates that were believed to have died from perinatal complications or other natural causes. Of the remainder, 16 (35.6%) resulted from vessel strikes, 3 (6.7%) were related to entanglement in fishing gear (in two cases lobster gear, and in one gillnet gear), and 13 (28.9%) were of unknown cause. At a minimum, therefore, 42.2% of the observed total for the period and 50% of the 32 non-calf deaths was attributable to human impacts (calves accounted for three deaths from ship strikes). Young animals, ages 0–4 years, are apparently the most impacted portion of the population (Kraus 1990). Finally, entanglement or minor vessel collisions may not kill an animal directly, but may weaken or otherwise affect it so that it is more likely to become vulnerable to further injury. Serious injury determinations for large whales commonly include animals carrying gear when these entanglements are constricting or appear to interfere with foraging (Henry et al. in press).
21
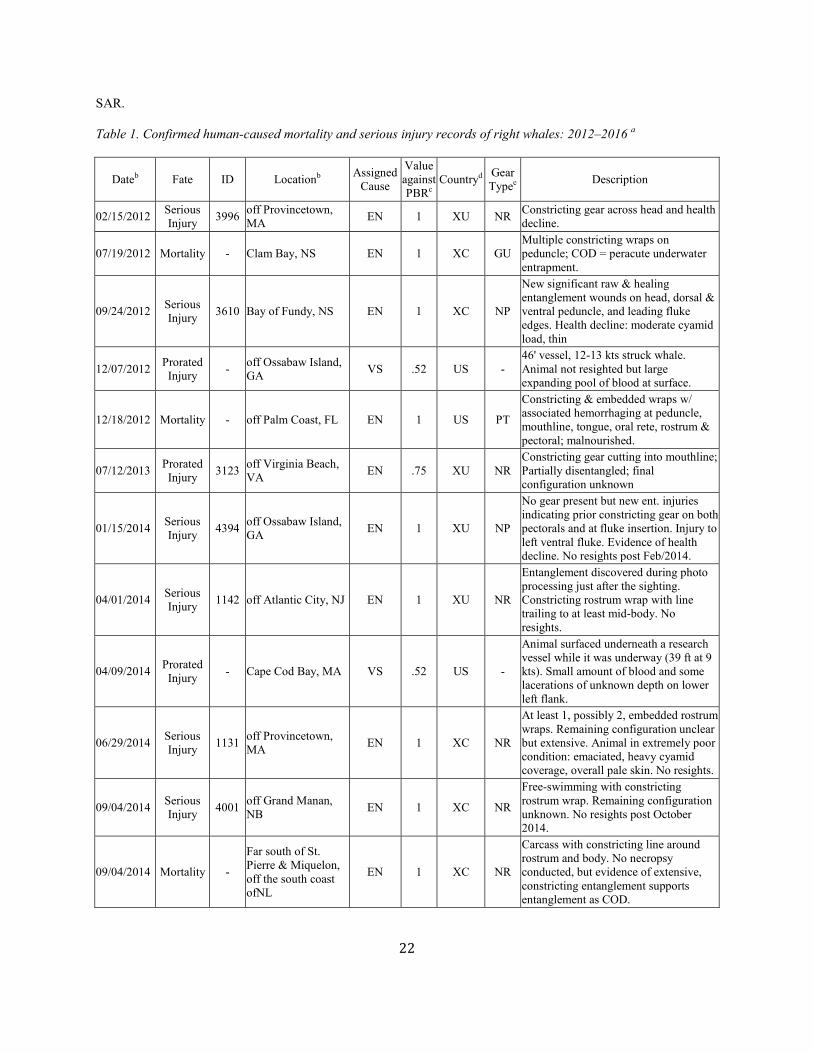
Fishery-Related Mortality and Serious Injury Not all mortalities are detected, but reports of known mortality and serious injury relative to PBR as well as total human impacts are contained in records maintained by the New England Aquarium and the NMFS Greater Atlantic and Southeast Regional Offices (Table 1). From 2012 through 2016, 28 of those examined records of mortality or serious injury (including records from both U.S. and Canadian waters, pro-rated to 26 using serious injury guidelines) involved entanglement or fishery interactions. For this time frame, the average reported mortality and serious injury to right whales due to fishery entanglement was 5.15 whales per year. Information from an entanglement event often does not include the detail necessary to assign the entanglements to a particular fishery or location. Although disentanglement is often unsuccessful or not possible for many cases, there are several documented cases of entanglements for which the intervention of disentanglement teams averted a likely serious-injury determination. Five serious injuries were prevented by intervention during 2012–2016 (Henry et al. in press). Sometimes, even with disentanglement, an animal may die of injuries sustained from fishing gear. A female yearling right whale, #3107, was first sighted with gear wrapping its caudal peduncle on 6 July 2002 near Briar Island, Nova Scotia. Although the gear was removed on 1 September by the New England Aquarium disentanglement team, and the animal seen alive during an aerial survey on 1 October, its carcass washed ashore at Nantucket on 12 October 2002 with deep entanglement injuries on the caudal peduncle. Additionally, but infrequently, a whale listed as seriously injured becomes gear-free without a disentanglement effort and is seen later in reasonable health. Such was the case for whale #1980, listed as a serious injury in 2008 but seen gear-free and apparently healthy in 2011. Incidents of entanglements in waters of Atlantic Canada and the U.S. east coast were summarized by Read (1994) and Johnson et al. (2005). Despite the long history of known fishing interactions, the only bycatch of a right whale observed by the Northeast Fisheries Observer Program was in the pelagic drift gillnet fishery in 1993. No mortalities or serious injuries have been documented by fisheries observers in any of the other fisheries monitored by NMFS. Whales often free themselves of gear following an entanglement event, and as such scarring may be a better indicator of fisheries interaction than entanglement records. A review of scars detected on identified individual right whales over a period of 30 years (1980–2009) documented 1032 definite, unique entanglement events on the 626 individual whales identified (Knowlton et al. 2012). Most individual whales (83%) were entangled at least once, and almost half of them (306 of 626) were entangled more than once. About a quarter of the individuals identified in each year (26%) were entangled in that year. Juveniles and calves were entangled at higher rates than were adults. Scarring rates suggest that entanglements occur at about an order of magnitude more often than detected from observations of whales with gear on them. More recently, analyses of whales carrying entangling gear also suggest that entanglement wounds have become more severe since 1990, possibly due to increased use of stronger lines in fixed fishing gear (Knowlton et al. 2016). Knowlton et al. (2012) concluded from their analysis of entanglement scarring rates over time that efforts made since 1997 to reduce right whale entanglement have not worked. Working from a completely different data source (observed mortalities of eight large whale species, 1970–2009), van der Hoop et al. (2012) arrived at a similar conclusion. Vessel strikes and entanglements were the two leading causes of death for known mortalities of right whales for which a cause of death could be determined. Across all 8 species of large whales, there was no detectable change in causes of anthropogenic mortality over time (van der Hoop et al. 2012). Pace et al. (2015) analyzed entanglement rates and serious injuries due to entanglement during 1999–2009 and found no support that mitigation measures implemented prior to 2009 had been effective at reducing takes due to commercial fishing. Since 2009, new entanglement mitigation measures (72 FR 193, 05 October 2007; 79 FR 124, 27 June 2014) have been implemented as part of the Atlantic Large Whale Take Reduction Plan, but their effectiveness has yet to be evaluated. Assessment efforts are underway, but rely on a statistically-significant time series to determine effectiveness.
Other Mortality Vessel strikes are a major cause of mortality and injury to right whales (Kraus 1990; Knowlton and Kraus 2001, van der Hoop et al. 2012). Records from 2012 through 2016 have been summarized in Table 1. For this time frame, the average reported mortality and serious injury to right whales due to vessel strikes was 0.41 whales per year. An Unusual Mortality Event was established for North Atlantic right whales in June 2017 due to elevated stranding along the Atlantic coast, especially in the Gulf of St. Lawrence region of Canada (https://www.fisheries.noaa.gov/national/marine-life-distress/2017-2018-north-atlantic-right-whale-unusual-mortality-event). Anthropogenic mortalities and serious injuries that occurred in 2017 will be reported in the 2019
22
SAR. Table 1. Confirmed human-caused mortality and serious injury records of right whales: 2012–2016 a
Dateb Fate ID Locationb Assigned Cause
Value against PBRc
Countryd Gear Typee Description
02/15/2012 Serious Injury 3996 off Provincetown,
MA EN 1 XU NR Constricting gear across head and health decline.
07/19/2012 Mortality - Clam Bay, NS EN 1 XC GU Multiple constricting wraps on peduncle; COD = peracute underwater entrapment.
09/24/2012 Serious Injury 3610 Bay of Fundy, NS EN 1 XC NP
New significant raw & healing entanglement wounds on head, dorsal & ventral peduncle, and leading fluke edges. Health decline: moderate cyamid load, thin
12/07/2012 Prorated Injury - off Ossabaw Island,
GA VS .52 US - 46' vessel, 12-13 kts struck whale. Animal not resighted but large expanding pool of blood at surface.
12/18/2012 Mortality - off Palm Coast, FL EN 1 US PT
Constricting & embedded wraps w/ associated hemorrhaging at peduncle, mouthline, tongue, oral rete, rostrum & pectoral; malnourished.
07/12/2013 Prorated Injury 3123 off Virginia Beach,
VA EN .75 XU NR Constricting gear cutting into mouthline; Partially disentangled; final configuration unknown
01/15/2014 Serious Injury 4394 off Ossabaw Island,
GA EN 1 XU NP
No gear present but new ent. injuries indicating prior constricting gear on both pectorals and at fluke insertion. Injury to left ventral fluke. Evidence of health decline. No resights post Feb/2014.
04/01/2014 Serious Injury 1142 off Atlantic City, NJ EN 1 XU NR
Entanglement discovered during photo processing just after the sighting. Constricting rostrum wrap with line trailing to at least mid-body. No resights.
04/09/2014 Prorated Injury - Cape Cod Bay, MA VS .52 US -
Animal surfaced underneath a research vessel while it was underway (39 ft at 9 kts). Small amount of blood and some lacerations of unknown depth on lower left flank.
06/29/2014 Serious Injury 1131 off Provincetown,
MA EN 1 XC NR
At least 1, possibly 2, embedded rostrum wraps. Remaining configuration unclear but extensive. Animal in extremely poor condition: emaciated, heavy cyamid coverage, overall pale skin. No resights.
09/04/2014 Serious Injury 4001 off Grand Manan,
NB EN 1 XC NR
Free-swimming with constricting rostrum wrap. Remaining configuration unknown. No resights post October 2014.
09/04/2014 Mortality -
Far south of St. Pierre & Miquelon, off the south coast ofNL
EN 1 XC NR
Carcass with constricting line around rostrum and body. No necropsy conducted, but evidence of extensive, constricting entanglement supports entanglement as COD.
23
Dateb Fate ID Locationb Assigned Cause
Value against PBRc
Countryd Gear Typee Description
09/17/2014 Serious Injury 3279 off Grand Manan,
NB EN 1 XC NR
Free-swimming with heavy, green line overhead cutting into nares. Remaining config. unk. In poor overall condition: heavy cyamids on head and blowholes. Left blowhole appears compromised. No resights.
09/27/2014 Mortality - off Nantucket, MA EN 1 US NR
Fresh carcass with multiple lines wrapping around head, pectoral, and peduncle. Appeared to be anchored. No necropsy conducted, but extensive, constricting entanglement supports entanglement as COD.
12/18/2014 Serious Injury 3670 off Sapelo Sound,
GA EN 1 XU NP
No gear present but new, healing entanglement injuries. Severe injuries to lip, peduncle and fluke edges. Poss. damage to right pectoral. Resights indicate health decline.
04/06/2015 Serious Injury
CT04CCB1
4 Cape Cod Bay, MA EN 1 XU NP
Encircling laceration at fluke insertion with potential to affect major artery. Source of injury likely constricting entanglement. No gear present. Evidence of health decline. No resights.
06/13/2015 Prorated Injury off Westport, NS EN .75 XC NR
Line through mouth, trailing 300-400m ending in 2 balloon-type buoys. Full entanglement configuration unknown. No resights.
09/28/2015 Prorated Injury
off Cape Elizabeth, ME EN .75 XU NR
Unknown amount of line trailing from flukes. Attachment point(s) and configuration unknown. No resights.
11/29/2015 Serious Injury 3140 off Truro, MA EN 1 XU NR
New, significant ent. injuries indicating constricting wraps. No gear visible. In poor cond. with grey skin and heavy cyamid coverage. No resights.
1/29/2016 Serious Injury 1968 off Jupiter Inlet, FL EN 1 XU NP
No gear present, but evidence of recent entanglement of unknown configuration. Significant health decline:emaciated, heavy cyamid coverage, damaged baleen. No resights post February 2016.
5/19/2016 Serious Injury 3791 off Chatham, MA EN 1 XU NP
New entanglement injuries on peduncle. Left pectoral appears compromised. No gear seen. Significant health decline: emaciated with heavy cyamid coverage. No resights post August 2016.
5/03/2016 Mortality 4681 Morris Island, MA VS 1 US -
Fresh carcass with 9 deep ventral lacerations. Multiple shorn and/or fractured vertebral and skull bones. Destablized thorax. Edema, blood clots, and hemorrhage associated with injuries. Proximate COD=sharp trauma. Ultimate COD= exsanguination.
7/26/2016 Serious Injury 1427 Gulf of St Lawrence,
QC EN 1 XC NP
No gear present, but new entanglement injuries on peduncle and fluke insertions. No gear present. Resights show subsequent health decline: gray skin, rake marks, cyamids.

24
Dateb Fate ID Locationb Assigned Cause
Value against PBRc
Countryd Gear Typee Description
8/1/2016 Serious Injury 3323 Bay of Fundy, NS EN 1 XC NP
No gear present, but new, severe entanglement injuries on peduncle, fluke insertions, and leading edges of flukes. No gear present. Significant health decline: emaciated, cyamids patches, peeling skin. No resights.
8/13/2016 Serious Injury 4057 Bay of Fundy, NS EN 1 CN PT
Free-swimming with extensive entanglement. Two heavy lines through mouth, multiple loose body wraps, multiple constricting wraps on both pectorals with lines across the chest, jumble of gear by left shoulder. Partially disentangled: left with line through mouth and loose wraps at right flipper that are expected to shed. Significant health decline: extensive cyamid coverage. Current entanglement appears to have exacerbated injuries from previous entanglement (see 16Feb2014 event). No resights.
8/16/2016 Prorated Injury 1152 off Baccaro, NS EN 0.75 XC NR
Free-swimming with line and buoy trailing from unknown attachment point(s). No resights.
8/28/2016 Serious Injury 2608 off Brier Island, NS EN 1 XC NR
Free-swimming with constricting wraps around rostrum and right pectoral. Line trails 50 ft aft of flukes. Significant health decline: heavy cyamid coverage and indication of fluke deformity. No resights.
8/31/2016 Mortality 4320 Sable Island, NS EN 1 CN PT
Decomposed carcass with multiple constricting wraps on pectoral with associated bone damage consistent with chronic entanglement.
9/23/2016 Mortality 3694 off Seguin Island, MA EN 1 XU GU
Fresh, floating carcass with extensive, constricting entanglement. Thin blubber layer and other findings consistent with prolonged stress due to chronic entanglement.
12/04/2016 Prorated Injury 3405 off Sandy Hook, NJ EN 0.75 XU NR
Lactating female. Free-swimming with netting crossing over blowholes and one line over back. Full configuration unknown. Calf not present, possibly already weaned. No resights.
Assigned Cause Five-year mean (US/CN/XU/XC)
Vessel strike 0.41 ( 0.41/ 0.00/ 0.00/ 0.00)
Entanglement 5.15 ( 0.4/ 0.4/ 2.25/ 2.1) a. For more details on events please see Henry et al. in press. b. The date sighted and location provided in the table are not necessarily when or where the serious injury or mortality occurred; rather, this information indicates when and where the whale was first reported beached, entangled, or injured. c. Mortality events are counted as 1 against PBR. Serious injury events have been evaluated using NMFS guidelines (NOAA 2012). d. CN=Canada, US=United States, XC=Unassigned 1st sight in CN, XU=Unassigned 1st sight in US. e. H=hook, GN=gillnet, GU=gear unidentifiable, MF=monofilament, NP=none present, NR=none recovered/received, PT=pot/trap, WE=weir.
25
STATUS OF STOCK The size of this stock is considered to be extremely low relative to OSP in the U.S. Atlantic EEZ. This species is listed as endangered under the ESA and has been declining since 2011 (see Pace et al. 2017). The North Atlantic right whale is considered one of the most critically endangered populations of large whales in the world (Clapham et al. 1999). A status review by the National Marine Fisheries Service affirms endangered status (NMFS 2017). The total level of human-caused mortality and serious injury is unknown, but the reported (and clearly biased low) human-caused mortality and serious injury was a minimum of 5.56 right whales per year from 2012 through 2016. Given that PBR has been calculated as 0.9, human-caused mortality or serious injury for this stock must be considered significant. This is a strategic stock because the average annual human-related mortality and serious injury exceeds PBR, and also because the North Atlantic right whale is an endangered species. All ESA-listed species are classified as strategic by definition; therefore, any uncertainties discussed above will not affect the status of stock.
REFERENCES CITED Aguilar, A. 1986. A review of old Basque whaling and its effect on the right whales of the North Atlantic. Rep. Int.
Whal. Comm. (Special Issue) 10:191–199. Barlow, J., S.L. Swartz, T.C. Eagle and P.R. Wade. 1995. U.S. marine mammal stock assessments: Guidelines for
preparation, background, and a summary of the 1995 assessments. NOAA Tech. Memo. NMFS-OPR-6. 73 pp.
Baumgartner, M.F., T.V.N. Cole, R.G. Campbell, G.J. Teegarden and E.G. Durbin. 2003. Associations between North Atlantic right whales and their prey, Calanus finmarchicus, over diel and tidal time scales. Mar. Ecol. Prog. Ser. 264:155–166.
Baumgartner, M.F. and B.R. Mate. 2003. Summertime foraging ecology of North Atlantic right whales. Mar. Ecol. Prog. Ser. 264:123–135.
Baumgartner, M.F. and B.R. Mate. 2005. Summer and fall habitat of North Atlantic right whales (Eubalaena glacialis) inferred from satellite telemetry. Can. J. Fish. Aq. Sci. 62:527–543.
Baumgartner, M.F., C.A. Mayo and R.D. Kenney. 2007. Enormous carnivores, microscopic food and a restaurant that’s hard to find. Pages 138–171 in: S.D. Kraus and R.M. Rolland (eds.) The urban whale: North Atlantic right whales at the crossroads. Harvard University Press, Cambridge, MA.
Bort, J., S. Van Parijs, P. Stevick, E. Summers and S. Todd. 2015. North Atlantic right whale Eubalaena glacialis vocalization patterns in the central Gulf of Maine from October 2009 through October 2010. Endanger. Spec. Res. 26:271–280.
Brown, M.W., P.K. Hamilton, R.D. Kenney, A.R. Knowlton, M.K. Marx, C.A. Mayo, C.K. Slay, S.D. Kraus, and S. Brault. 2001. Sighting heterogeneity of right whales in the western North Atlantic: 1980-1992. J. Cetacean Res. Manage. (Special Issue) 2:245–250.
Brown, M.W., S.D. Kraus, C.K. Slay, and L.P. Garrison. 2007. Surveying for discovery, science and management. Pages 105–137 in: S.D. Kraus and R.M. Rolland, (eds.) The urban whale: North Atlantic right whales at the crossroads. Harvard University Press, Cambridge, MA.
Brown, M.W., D. Fenton, K. Smedbol, C. Merriman, K. Robichaud-Leblanc and J.D. Conway. 2009. Recovery strategy for the North Atlantic right whale (Eubalaena glacialis) in Atlantic Canadian waters [Final]. Species at Risk Act Recovery Strategy Series. Fisheries and Oceans Canada, vi + 66 pp. https://www.sararegistry.gc.ca/virtual_sara/files/plans/rs_north_atl_right_whale_0609_e.pdf
Brown, M.W. and M.K. Marx. 2000. Surveillance, monitoring and management of North Atlantic right whales, Eubalaena glacialis, in Cape Cod Bay, Massachusetts: January to Mid-May, 2000. Final report. Division of Marine Fisheries, Boston, Massachusetts, 52 pp.
http://www.mass.gov/eea/docs/dfg/dmf/programsandprojects/rwhale00.pdf Browning, C.L., R.M. Rolland and S.D. Kraus. 2010. Estimated calf and perinatal mortality in western North
Atlantic right whales (Eubalaena glacialis). Mar. Mamm. Sci. 26:648–662. Caswell, H., S. Brault and M. Fujiwara. 1999. Declining survival probability threatens the North Atlantic right
whale. Proc. Natl. Acad. Sci. USA 96:3308–3313. Clapham, P.J. (ed.) 2002. Report of the working group on survival estimation for North Atlantic right whales.
Available from the Northeast Fisheries Science Center, 166 Water Street, Woods Hole, MA 02543. Clapham, P.J., S.B. Young and R.L. Brownell, Jr. 1999. Baleen whales: conservation issues and the status of the
most endangered populations. Mammal Rev. 29:35–60.
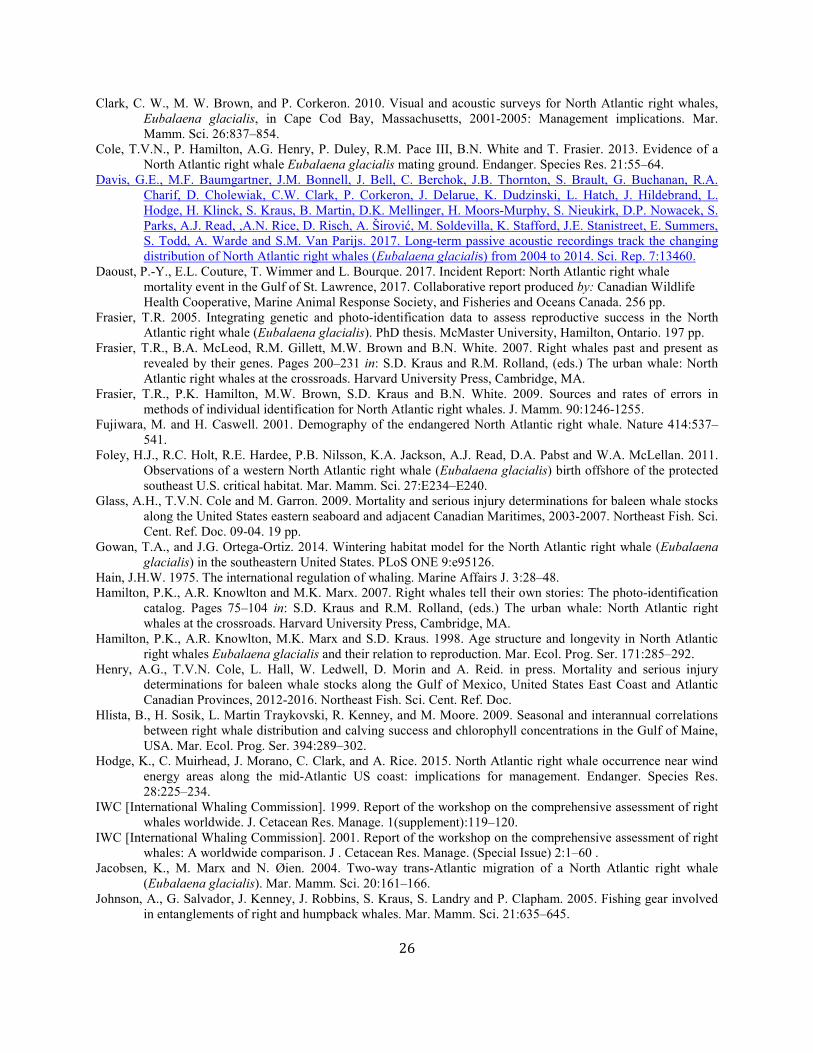
26
Clark, C. W., M. W. Brown, and P. Corkeron. 2010. Visual and acoustic surveys for North Atlantic right whales, Eubalaena glacialis, in Cape Cod Bay, Massachusetts, 2001-2005: Management implications. Mar. Mamm. Sci. 26:837–854.
Cole, T.V.N., P. Hamilton, A.G. Henry, P. Duley, R.M. Pace III, B.N. White and T. Frasier. 2013. Evidence of a North Atlantic right whale Eubalaena glacialis mating ground. Endanger. Species Res. 21:55–64.
Davis, G.E., M.F. Baumgartner, J.M. Bonnell, J. Bell, C. Berchok, J.B. Thornton, S. Brault, G. Buchanan, R.A. Charif, D. Cholewiak, C.W. Clark, P. Corkeron, J. Delarue, K. Dudzinski, L. Hatch, J. Hildebrand, L. Hodge, H. Klinck, S. Kraus, B. Martin, D.K. Mellinger, H. Moors-Murphy, S. Nieukirk, D.P. Nowacek, S. Parks, A.J. Read, ,A.N. Rice, D. Risch, A. Širović, M. Soldevilla, K. Stafford, J.E. Stanistreet, E. Summers, S. Todd, A. Warde and S.M. Van Parijs. 2017. Long-term passive acoustic recordings track the changing distribution of North Atlantic right whales (Eubalaena glacialis) from 2004 to 2014. Sci. Rep. 7:13460.
Daoust, P.-Y., E.L. Couture, T. Wimmer and L. Bourque. 2017. Incident Report: North Atlantic right whale mortality event in the Gulf of St. Lawrence, 2017. Collaborative report produced by: Canadian Wildlife Health Cooperative, Marine Animal Response Society, and Fisheries and Oceans Canada. 256 pp.
Frasier, T.R. 2005. Integrating genetic and photo-identification data to assess reproductive success in the North Atlantic right whale (Eubalaena glacialis). PhD thesis. McMaster University, Hamilton, Ontario. 197 pp.
Frasier, T.R., B.A. McLeod, R.M. Gillett, M.W. Brown and B.N. White. 2007. Right whales past and present as revealed by their genes. Pages 200–231 in: S.D. Kraus and R.M. Rolland, (eds.) The urban whale: North Atlantic right whales at the crossroads. Harvard University Press, Cambridge, MA.
Frasier, T.R., P.K. Hamilton, M.W. Brown, S.D. Kraus and B.N. White. 2009. Sources and rates of errors in methods of individual identification for North Atlantic right whales. J. Mamm. 90:1246-1255.
Fujiwara, M. and H. Caswell. 2001. Demography of the endangered North Atlantic right whale. Nature 414:537–541.
Foley, H.J., R.C. Holt, R.E. Hardee, P.B. Nilsson, K.A. Jackson, A.J. Read, D.A. Pabst and W.A. McLellan. 2011. Observations of a western North Atlantic right whale (Eubalaena glacialis) birth offshore of the protected southeast U.S. critical habitat. Mar. Mamm. Sci. 27:E234–E240.
Glass, A.H., T.V.N. Cole and M. Garron. 2009. Mortality and serious injury determinations for baleen whale stocks along the United States eastern seaboard and adjacent Canadian Maritimes, 2003-2007. Northeast Fish. Sci. Cent. Ref. Doc. 09-04. 19 pp.
Gowan, T.A., and J.G. Ortega-Ortiz. 2014. Wintering habitat model for the North Atlantic right whale (Eubalaena glacialis) in the southeastern United States. PLoS ONE 9:e95126.
Hain, J.H.W. 1975. The international regulation of whaling. Marine Affairs J. 3:28–48. Hamilton, P.K., A.R. Knowlton and M.K. Marx. 2007. Right whales tell their own stories: The photo-identification
catalog. Pages 75–104 in: S.D. Kraus and R.M. Rolland, (eds.) The urban whale: North Atlantic right whales at the crossroads. Harvard University Press, Cambridge, MA.
Hamilton, P.K., A.R. Knowlton, M.K. Marx and S.D. Kraus. 1998. Age structure and longevity in North Atlantic right whales Eubalaena glacialis and their relation to reproduction. Mar. Ecol. Prog. Ser. 171:285–292.
Henry, A.G., T.V.N. Cole, L. Hall, W. Ledwell, D. Morin and A. Reid. in press. Mortality and serious injury determinations for baleen whale stocks along the Gulf of Mexico, United States East Coast and Atlantic Canadian Provinces, 2012-2016. Northeast Fish. Sci. Cent. Ref. Doc.
Hlista, B., H. Sosik, L. Martin Traykovski, R. Kenney, and M. Moore. 2009. Seasonal and interannual correlations between right whale distribution and calving success and chlorophyll concentrations in the Gulf of Maine, USA. Mar. Ecol. Prog. Ser. 394:289–302.
Hodge, K., C. Muirhead, J. Morano, C. Clark, and A. Rice. 2015. North Atlantic right whale occurrence near wind energy areas along the mid-Atlantic US coast: implications for management. Endanger. Species Res. 28:225–234.
IWC [International Whaling Commission]. 1999. Report of the workshop on the comprehensive assessment of right whales worldwide. J. Cetacean Res. Manage. 1(supplement):119–120.
IWC [International Whaling Commission]. 2001. Report of the workshop on the comprehensive assessment of right whales: A worldwide comparison. J . Cetacean Res. Manage. (Special Issue) 2:1–60 .
Jacobsen, K., M. Marx and N. Øien. 2004. Two-way trans-Atlantic migration of a North Atlantic right whale (Eubalaena glacialis). Mar. Mamm. Sci. 20:161–166.
Johnson, A., G. Salvador, J. Kenney, J. Robbins, S. Kraus, S. Landry and P. Clapham. 2005. Fishing gear involved in entanglements of right and humpback whales. Mar. Mamm. Sci. 21:635–645.
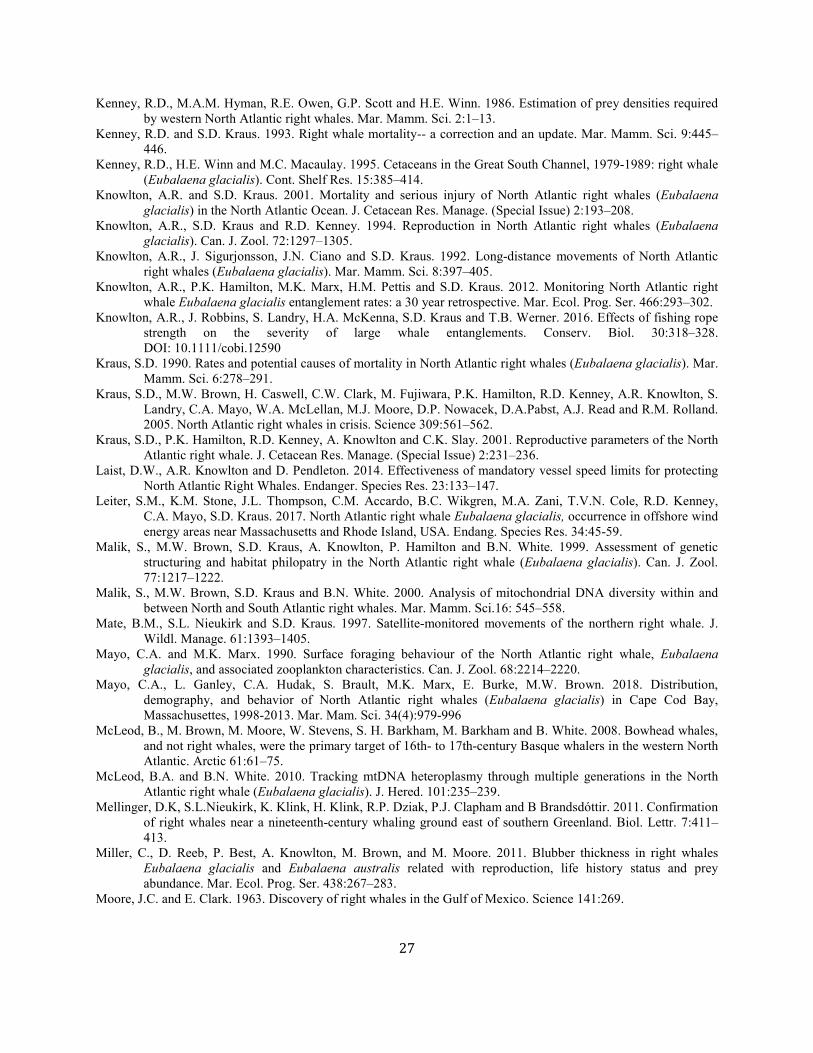
27
Kenney, R.D., M.A.M. Hyman, R.E. Owen, G.P. Scott and H.E. Winn. 1986. Estimation of prey densities required by western North Atlantic right whales. Mar. Mamm. Sci. 2:1–13.
Kenney, R.D. and S.D. Kraus. 1993. Right whale mortality-- a correction and an update. Mar. Mamm. Sci. 9:445–446.
Kenney, R.D., H.E. Winn and M.C. Macaulay. 1995. Cetaceans in the Great South Channel, 1979-1989: right whale (Eubalaena glacialis). Cont. Shelf Res. 15:385–414.
Knowlton, A.R. and S.D. Kraus. 2001. Mortality and serious injury of North Atlantic right whales (Eubalaena glacialis) in the North Atlantic Ocean. J. Cetacean Res. Manage. (Special Issue) 2:193–208.
Knowlton, A.R., S.D. Kraus and R.D. Kenney. 1994. Reproduction in North Atlantic right whales (Eubalaena glacialis). Can. J. Zool. 72:1297–1305.
Knowlton, A.R., J. Sigurjonsson, J.N. Ciano and S.D. Kraus. 1992. Long-distance movements of North Atlantic right whales (Eubalaena glacialis). Mar. Mamm. Sci. 8:397–405.
Knowlton, A.R., P.K. Hamilton, M.K. Marx, H.M. Pettis and S.D. Kraus. 2012. Monitoring North Atlantic right whale Eubalaena glacialis entanglement rates: a 30 year retrospective. Mar. Ecol. Prog. Ser. 466:293–302.
Knowlton, A.R., J. Robbins, S. Landry, H.A. McKenna, S.D. Kraus and T.B. Werner. 2016. Effects of fishing rope strength on the severity of large whale entanglements. Conserv. Biol. 30:318–328. DOI: 10.1111/cobi.12590
Kraus, S.D. 1990. Rates and potential causes of mortality in North Atlantic right whales (Eubalaena glacialis). Mar. Mamm. Sci. 6:278–291.
Kraus, S.D., M.W. Brown, H. Caswell, C.W. Clark, M. Fujiwara, P.K. Hamilton, R.D. Kenney, A.R. Knowlton, S. Landry, C.A. Mayo, W.A. McLellan, M.J. Moore, D.P. Nowacek, D.A.Pabst, A.J. Read and R.M. Rolland. 2005. North Atlantic right whales in crisis. Science 309:561–562.
Kraus, S.D., P.K. Hamilton, R.D. Kenney, A. Knowlton and C.K. Slay. 2001. Reproductive parameters of the North Atlantic right whale. J. Cetacean Res. Manage. (Special Issue) 2:231–236.
Laist, D.W., A.R. Knowlton and D. Pendleton. 2014. Effectiveness of mandatory vessel speed limits for protecting North Atlantic Right Whales. Endanger. Species Res. 23:133–147.
Leiter, S.M., K.M. Stone, J.L. Thompson, C.M. Accardo, B.C. Wikgren, M.A. Zani, T.V.N. Cole, R.D. Kenney, C.A. Mayo, S.D. Kraus. 2017. North Atlantic right whale Eubalaena glacialis, occurrence in offshore wind energy areas near Massachusetts and Rhode Island, USA. Endang. Species Res. 34:45-59.
Malik, S., M.W. Brown, S.D. Kraus, A. Knowlton, P. Hamilton and B.N. White. 1999. Assessment of genetic structuring and habitat philopatry in the North Atlantic right whale (Eubalaena glacialis). Can. J. Zool. 77:1217–1222.
Malik, S., M.W. Brown, S.D. Kraus and B.N. White. 2000. Analysis of mitochondrial DNA diversity within and between North and South Atlantic right whales. Mar. Mamm. Sci.16: 545–558.
Mate, B.M., S.L. Nieukirk and S.D. Kraus. 1997. Satellite-monitored movements of the northern right whale. J. Wildl. Manage. 61:1393–1405.
Mayo, C.A. and M.K. Marx. 1990. Surface foraging behaviour of the North Atlantic right whale, Eubalaena glacialis, and associated zooplankton characteristics. Can. J. Zool. 68:2214–2220.
Mayo, C.A., L. Ganley, C.A. Hudak, S. Brault, M.K. Marx, E. Burke, M.W. Brown. 2018. Distribution, demography, and behavior of North Atlantic right whales (Eubalaena glacialis) in Cape Cod Bay, Massachusettes, 1998-2013. Mar. Mam. Sci. 34(4):979-996
McLeod, B., M. Brown, M. Moore, W. Stevens, S. H. Barkham, M. Barkham and B. White. 2008. Bowhead whales, and not right whales, were the primary target of 16th- to 17th-century Basque whalers in the western North Atlantic. Arctic 61:61–75.
McLeod, B.A. and B.N. White. 2010. Tracking mtDNA heteroplasmy through multiple generations in the North Atlantic right whale (Eubalaena glacialis). J. Hered. 101:235–239.
Mellinger, D.K, S.L.Nieukirk, K. Klink, H. Klink, R.P. Dziak, P.J. Clapham and B Brandsdóttir. 2011. Confirmation of right whales near a nineteenth-century whaling ground east of southern Greenland. Biol. Lettr. 7:411–413.
Miller, C., D. Reeb, P. Best, A. Knowlton, M. Brown, and M. Moore. 2011. Blubber thickness in right whales Eubalaena glacialis and Eubalaena australis related with reproduction, life history status and prey abundance. Mar. Ecol. Prog. Ser. 438:267–283.
Moore, J.C. and E. Clark. 1963. Discovery of right whales in the Gulf of Mexico. Science 141:269.
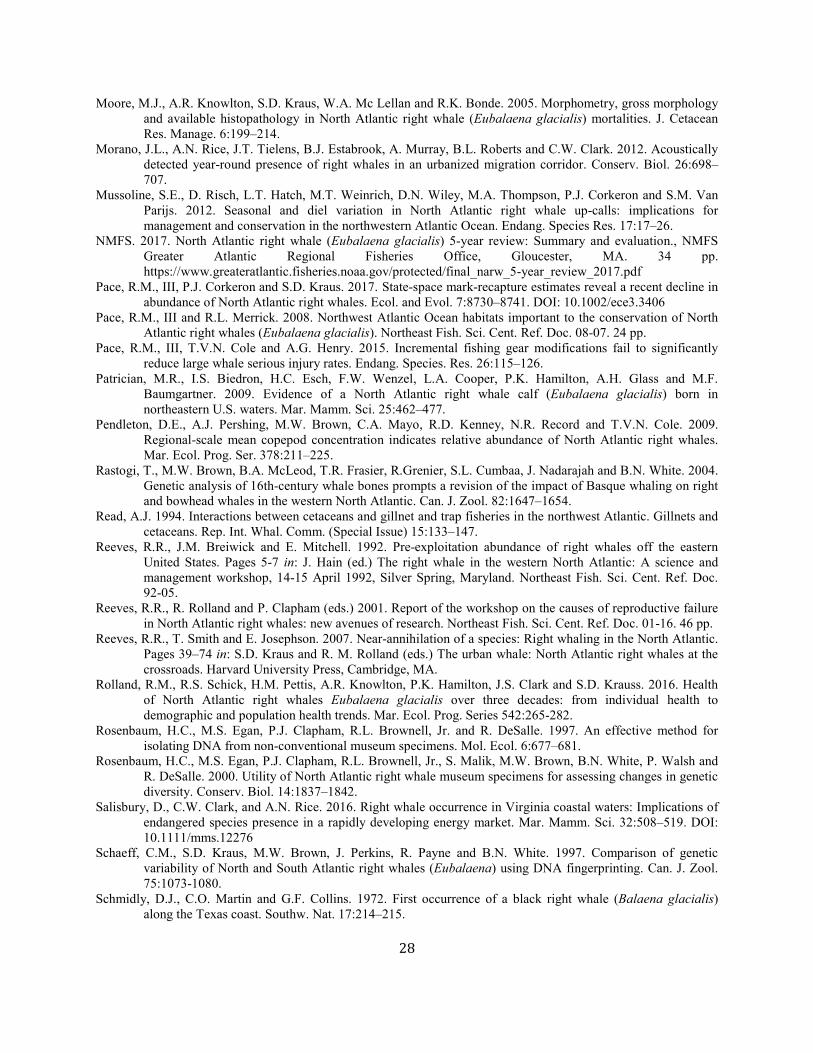
28
Moore, M.J., A.R. Knowlton, S.D. Kraus, W.A. Mc Lellan and R.K. Bonde. 2005. Morphometry, gross morphology and available histopathology in North Atlantic right whale (Eubalaena glacialis) mortalities. J. Cetacean Res. Manage. 6:199–214.
Morano, J.L., A.N. Rice, J.T. Tielens, B.J. Estabrook, A. Murray, B.L. Roberts and C.W. Clark. 2012. Acoustically detected year-round presence of right whales in an urbanized migration corridor. Conserv. Biol. 26:698–707.
Mussoline, S.E., D. Risch, L.T. Hatch, M.T. Weinrich, D.N. Wiley, M.A. Thompson, P.J. Corkeron and S.M. Van Parijs. 2012. Seasonal and diel variation in North Atlantic right whale up-calls: implications for management and conservation in the northwestern Atlantic Ocean. Endang. Species Res. 17:17–26.
NMFS. 2017. North Atlantic right whale (Eubalaena glacialis) 5-year review: Summary and evaluation., NMFS Greater Atlantic Regional Fisheries Office, Gloucester, MA. 34 pp. https://www.greateratlantic.fisheries.noaa.gov/protected/final_narw_5-year_review_2017.pdf
Pace, R.M., III, P.J. Corkeron and S.D. Kraus. 2017. State-space mark-recapture estimates reveal a recent decline in abundance of North Atlantic right whales. Ecol. and Evol. 7:8730–8741. DOI: 10.1002/ece3.3406
Pace, R.M., III and R.L. Merrick. 2008. Northwest Atlantic Ocean habitats important to the conservation of North Atlantic right whales (Eubalaena glacialis). Northeast Fish. Sci. Cent. Ref. Doc. 08-07. 24 pp.
Pace, R.M., III, T.V.N. Cole and A.G. Henry. 2015. Incremental fishing gear modifications fail to significantly reduce large whale serious injury rates. Endang. Species. Res. 26:115–126.
Patrician, M.R., I.S. Biedron, H.C. Esch, F.W. Wenzel, L.A. Cooper, P.K. Hamilton, A.H. Glass and M.F. Baumgartner. 2009. Evidence of a North Atlantic right whale calf (Eubalaena glacialis) born in northeastern U.S. waters. Mar. Mamm. Sci. 25:462–477.
Pendleton, D.E., A.J. Pershing, M.W. Brown, C.A. Mayo, R.D. Kenney, N.R. Record and T.V.N. Cole. 2009. Regional-scale mean copepod concentration indicates relative abundance of North Atlantic right whales. Mar. Ecol. Prog. Ser. 378:211–225.
Rastogi, T., M.W. Brown, B.A. McLeod, T.R. Frasier, R.Grenier, S.L. Cumbaa, J. Nadarajah and B.N. White. 2004. Genetic analysis of 16th-century whale bones prompts a revision of the impact of Basque whaling on right and bowhead whales in the western North Atlantic. Can. J. Zool. 82:1647–1654.
Read, A.J. 1994. Interactions between cetaceans and gillnet and trap fisheries in the northwest Atlantic. Gillnets and cetaceans. Rep. Int. Whal. Comm. (Special Issue) 15:133–147.
Reeves, R.R., J.M. Breiwick and E. Mitchell. 1992. Pre-exploitation abundance of right whales off the eastern United States. Pages 5-7 in: J. Hain (ed.) The right whale in the western North Atlantic: A science and management workshop, 14-15 April 1992, Silver Spring, Maryland. Northeast Fish. Sci. Cent. Ref. Doc. 92-05.
Reeves, R.R., R. Rolland and P. Clapham (eds.) 2001. Report of the workshop on the causes of reproductive failure in North Atlantic right whales: new avenues of research. Northeast Fish. Sci. Cent. Ref. Doc. 01-16. 46 pp.
Reeves, R.R., T. Smith and E. Josephson. 2007. Near-annihilation of a species: Right whaling in the North Atlantic. Pages 39–74 in: S.D. Kraus and R. M. Rolland (eds.) The urban whale: North Atlantic right whales at the crossroads. Harvard University Press, Cambridge, MA.
Rolland, R.M., R.S. Schick, H.M. Pettis, A.R. Knowlton, P.K. Hamilton, J.S. Clark and S.D. Krauss. 2016. Health of North Atlantic right whales Eubalaena glacialis over three decades: from individual health to demographic and population health trends. Mar. Ecol. Prog. Series 542:265-282.
Rosenbaum, H.C., M.S. Egan, P.J. Clapham, R.L. Brownell, Jr. and R. DeSalle. 1997. An effective method for isolating DNA from non-conventional museum specimens. Mol. Ecol. 6:677–681.
Rosenbaum, H.C., M.S. Egan, P.J. Clapham, R.L. Brownell, Jr., S. Malik, M.W. Brown, B.N. White, P. Walsh and R. DeSalle. 2000. Utility of North Atlantic right whale museum specimens for assessing changes in genetic diversity. Conserv. Biol. 14:1837–1842.
Salisbury, D., C.W. Clark, and A.N. Rice. 2016. Right whale occurrence in Virginia coastal waters: Implications of endangered species presence in a rapidly developing energy market. Mar. Mamm. Sci. 32:508–519. DOI: 10.1111/mms.12276
Schaeff, C.M., S.D. Kraus, M.W. Brown, J. Perkins, R. Payne and B.N. White. 1997. Comparison of genetic variability of North and South Atlantic right whales (Eubalaena) using DNA fingerprinting. Can. J. Zool. 75:1073-1080.
Schmidly, D.J., C.O. Martin and G.F. Collins. 1972. First occurrence of a black right whale (Balaena glacialis) along the Texas coast. Southw. Nat. 17:214–215.

29
Silber, G. K. and S. Bettridge. 2012. An assessment of the final rule to implement vessel speed restrictions to reduce the threat of vessel collisions with North Atlantic right whales. NOAA Tech. Memo. NMFS-OPR-48. 114 pp.
Silva, M.A., L. Steiner, I. Cascão, M.J. Cruz, R. Prieto, T. Cole, P.K. Hamilton and M.F. Baumgartner. 2012. Winter sighting of a known western North Atlantic right whale in the Azores. J. Cetacean Res. Manage. 12:65–69.
van der Hoop, J.M., M.J. Moore, S.G. Barco, T.V. Cole, P.Y. Daoust, A.G. Henry, D.F. McAlpine, W.A. McLellan, T. Wimmer and A.R. Solow. 2013. Assessment of management to mitigate anthropogenic effects on large whales. Conserv. Biol. 27:121–133.
van der Hoop, J.M., A.S.M. Vanderlaan, T.V.N. Cole, A.G. Henry, L. Hall, B. Mase-Guthrie, T. Wimmer and M.J. Moore. 2015. Vessel strikes to large whales before and after the 2008 Ship Strike Rule. Conserv. Lett. 8:24–32.
van der Hoop, J.M., P. Corkeron, and M.J. Moore. 2017. Entanglement is a costly life‐history stage in large whales. Ecol. and Evol.7:92–106. DOI: 10.1002/ece3.2615.
Wade, P.R. and R.P. Angliss. 1997. Guidelines for assessing marine mammal stocks: Report of the GAMMS Workshop April 3-5, 1996, Seattle, Washington. NOAA Tech. Memo. NMFS-OPR-12. 93 pp.
Wells, R.S. and J.B. Allen. 2015 Carcass-recovery rates for resident bottlenose dolphins in Sarasota Bay, Florida. Mar. Mamm. Sci. 31:355–368.
Waldick, R.C., S.D. Kraus, M. Brown and B.N. White. 2002. Evaluating the effects of historic bottleneck events: An assessment of microsatellite variability in the endangered, North Atlantic right whale. Mol. Ecol. 11: 2241–2250.
Ward-Geiger, L.I., A.R. Knowlton, A.F. Amos, T.D. Pitchford, B. Mase-Guthrie and B.J. Zoodsma. 2011. Recent sightings of the North Atlantic right whale in the Gulf of Mexico. Gulf Mex. Sci. 29:74–78.
Whitt, A.D., K. Dudzinski and J.R. Laliberté. 2013. North Atlantic right whale distribution and seasonal occurrence in nearshore waters off New Jersey, USA, and implications for management. Endanger. Species Res. 20:59–69.
Williams, R., S. Gero, L. Bejder, J. Calambokidis, S.D. Kraus, D. Lusseau, A.J. Read and J. Robbins. 2011. Underestimating the damage: Interpreting cetacean carcass recoveries in the context of the Deepwater Horizon/BP incident. Conserv. Lett. 4:228–233.
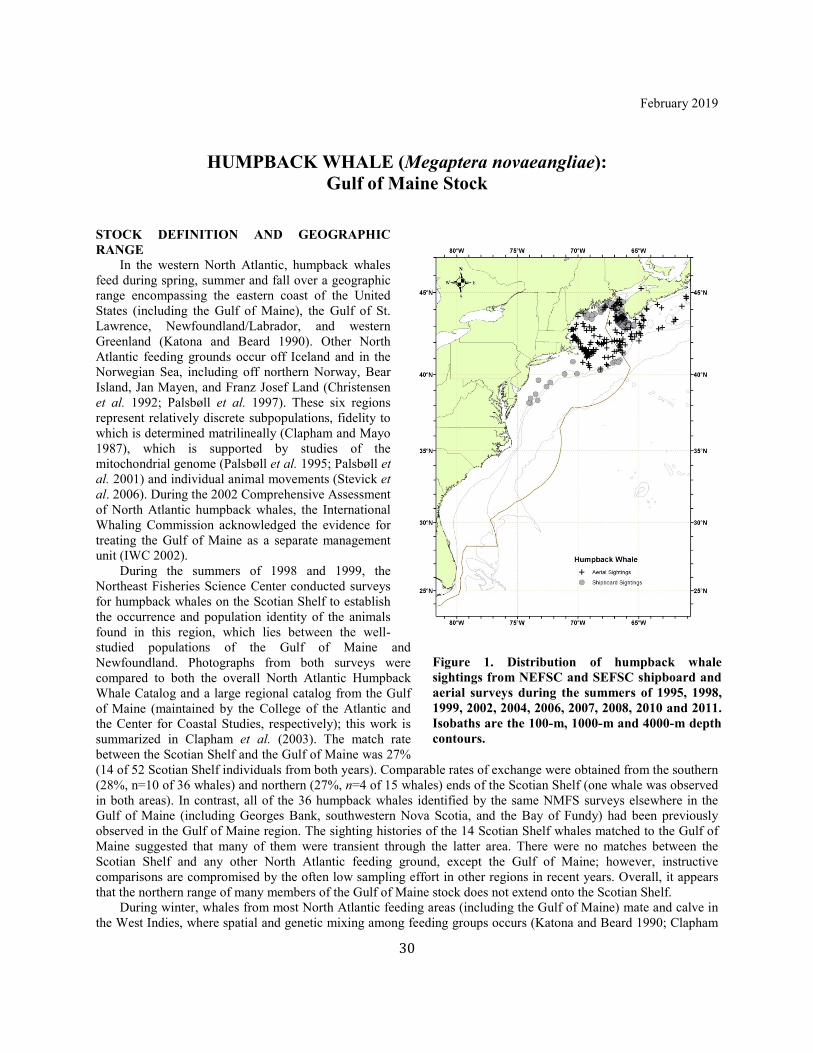
30
February 2019
HUMPBACK WHALE (Megaptera novaeangliae): Gulf of Maine Stock
STOCK DEFINITION AND GEOGRAPHIC RANGE In the western North Atlantic, humpback whales feed during spring, summer and fall over a geographic range encompassing the eastern coast of the United States (including the Gulf of Maine), the Gulf of St. Lawrence, Newfoundland/Labrador, and western Greenland (Katona and Beard 1990). Other North Atlantic feeding grounds occur off Iceland and in the Norwegian Sea, including off northern Norway, Bear Island, Jan Mayen, and Franz Josef Land (Christensen et al. 1992; Palsbøll et al. 1997). These six regions represent relatively discrete subpopulations, fidelity to which is determined matrilineally (Clapham and Mayo 1987), which is supported by studies of the mitochondrial genome (Palsbøll et al. 1995; Palsbøll et al. 2001) and individual animal movements (Stevick et al. 2006). During the 2002 Comprehensive Assessment of North Atlantic humpback whales, the International Whaling Commission acknowledged the evidence for treating the Gulf of Maine as a separate management unit (IWC 2002). During the summers of 1998 and 1999, the Northeast Fisheries Science Center conducted surveys for humpback whales on the Scotian Shelf to establish the occurrence and population identity of the animals found in this region, which lies between the well-studied populations of the Gulf of Maine and Newfoundland. Photographs from both surveys were compared to both the overall North Atlantic Humpback Whale Catalog and a large regional catalog from the Gulf of Maine (maintained by the College of the Atlantic and the Center for Coastal Studies, respectively); this work is summarized in Clapham et al. (2003). The match rate between the Scotian Shelf and the Gulf of Maine was 27% (14 of 52 Scotian Shelf individuals from both years). Comparable rates of exchange were obtained from the southern (28%, n=10 of 36 whales) and northern (27%, n=4 of 15 whales) ends of the Scotian Shelf (one whale was observed in both areas). In contrast, all of the 36 humpback whales identified by the same NMFS surveys elsewhere in the Gulf of Maine (including Georges Bank, southwestern Nova Scotia, and the Bay of Fundy) had been previously observed in the Gulf of Maine region. The sighting histories of the 14 Scotian Shelf whales matched to the Gulf of Maine suggested that many of them were transient through the latter area. There were no matches between the Scotian Shelf and any other North Atlantic feeding ground, except the Gulf of Maine; however, instructive comparisons are compromised by the often low sampling effort in other regions in recent years. Overall, it appears that the northern range of many members of the Gulf of Maine stock does not extend onto the Scotian Shelf. During winter, whales from most North Atlantic feeding areas (including the Gulf of Maine) mate and calve in the West Indies, where spatial and genetic mixing among feeding groups occurs (Katona and Beard 1990; Clapham
Figure 1. Distribution of humpback whale sightings from NEFSC and SEFSC shipboard and aerial surveys during the summers of 1995, 1998, 1999, 2002, 2004, 2006, 2007, 2008, 2010 and 2011. Isobaths are the 100-m, 1000-m and 4000-m depth contours.
31
et al. 1993; Palsbøll et al. 1997; Stevick et al. 1998). Some whales using eastern North Atlantic feeding areas migrate to the Cape Verde Islands (Reiner et al. 1996; Wenzel et al. 2009; Stevick et al. 2016), and some individuals have been recorded in both the Cape Verde Islands and the Caribbean (Stevick et al. 2016). In the West Indies, the majority of whales are found in the waters of the Dominican Republic, notably on Silver Bank and Navidad Bank, and in Samana Bay (Balcomb and Nichols 1982; Whitehead and Moore 1982; Mattila et al. 1989, 1994). Humpback whales also are found at much lower densities throughout the remainder of the Antillean arc (Winn et al. 1975; Levenson and Leapley 1978; Price 1985; Mattila and Clapham 1989). Although recognition of 2 breeding areas for North Atlantic humpbacks is the prevailing model, our knowledge of breeding season distribution is far from complete (see Smith and Pike 2009; Stevick et al. 2016). Not all whales from this stock migrate to the West Indies every winter, because significant numbers of animals are found in mid- and high-latitude regions at this time (Clapham et al. 1993; Swingle et al. 1993) and some individuals have been sighted repeatedly within the same winter season (Clapham et al. 1993; Robbins 2007). Acoustic recordings made within the Massachusetts Bay area detected some level of humpback song and non-song sounds in almost all months, with two prominent periods, March through May and September through December (Clark and Clapham 2004; Vu et al. 2012; Murray et al. 2013). This pattern of acoustic occurrence, especially for song, confirms the presence of male humpback whales in the area (a mid-latitude feeding ground) during periods that bracket male occurrence in the Caribbean region, where singing is highest during winter months. A complementary pattern of humpback singer occurrence was observed during the January–May period in deep-ocean regions north and west of the Caribbean and to the east of Bermuda during April (Clark and Gagnon 2002). These acoustic observations from both coastal and deep-ocean regions support the conclusion that at least male humpbacks are seasonally distributed throughout broad regions of the western North Atlantic. In addition, photographic records from Newfoundland have shown a number of adult humpbacks remain there year-round, particularly on the island’s north coast. In collaboration with colleagues in the French islands of St. Pierre and Miquelon, a new photographic catalogue and concurrent matching effort is being undertaken for this region (J. Lawson, DFO, pers. comm.). Within the U.S. Atlantic EEZ, humpback whales have been sighted well away from the Gulf of Maine. Sightings of humpback whales in the vicinity of the Chesapeake and Delaware Bays occurred in 1992 (Swingle et al. 1993). Wiley et al. (1995) reported that 38 humpback whale strandings occurred during 1985–1992 in the U.S. mid-Atlantic and southeastern states. Humpback whale strandings increased, particularly along the Virginia and North Carolina coasts, and most stranded animals were sexually immature; in addition, the small size of many of these whales strongly suggested that they had only recently separated from their mothers. Wiley et al. (1995) concluded that these areas were becoming an increasingly important habitat for juvenile humpback whales and that anthropogenic factors may negatively impact whales in this area. For the period 2011–2015, there are records of 43 humpback whale strandings between New York and Florida in the Marine Mammal Health and Stranding Response database (accessed 17 May 2017). There have also been a number of wintertime humpback sightings in coastal waters of the southeastern U.S. Whether the increased numbers of sightings represent a distributional change, or are simply due to an increase in sighting effort and/or whale abundance, is unknown. Other sightings of note include 46 sightings of humpbacks in the New York-New Jersey Harbor Estuary documented between 2011 and 2016 (Brown et al. 2017). Multiple humpbacks were observed feeding off Long Island during July of 2016 (https://www.greateratlantic.fisheries.noaa.gov/mediacenter/2016/july/26_humpback_whales_visit_new_york.html, accessed 28 April 2017) and there were sightings during November–December 2016 near New York City (https://www.greateratlantic.fisheries.noaa.gov/mediacenter/2016/december/09_humans_and_humpbacks_of_new_york_2.html, accessed 28 April 2017). A key question with regard to humpback whales off the southeastern and mid-Atlantic states is their stock identity. This topic was investigated using fluke photographs of living and dead whales observed in the region (Barco et al. 2002). In this study, photographs of 40 whales (alive or dead) were of sufficient quality to be compared to catalogs from the Gulf of Maine (i.e., the closest feeding ground) and other areas in the North Atlantic. Of 21 live whales, 9 (43%) matched to the Gulf of Maine, 4 (19%) to Newfoundland, and 1 (4.8%) to the Gulf of St Lawrence. Of 19 dead humpbacks, 6 (31.6%) were known Gulf of Maine whales. Although the population composition of the mid-Atlantic is apparently dominated by Gulf of Maine whales, lack of photographic effort in Newfoundland makes it likely that the observed match rates under-represent the true presence of Canadian whales in the region. Barco et al. (2002) suggested that the mid-Atlantic region primarily represents a supplemental winter feeding ground used by humpbacks. In New England waters, feeding is the principal activity of humpback whales, and their distribution in this region has been largely correlated to abundance of prey species, although behavior and bathymetry are factors influencing foraging strategy (Payne et al. 1986, 1990). Humpback whales are frequently piscivorous when in New
32
England waters, feeding on herring (Clupea harengus), sand lance (Ammodytes spp.), and other small fishes. In the northern Gulf of Maine, euphausiids are also frequently taken (Paquet et al. 1997). Humpback whales were densest over the sandy shoals in the southwestern Gulf of Maine favored by the sand lance during much of the late 1970s and early 1980s, and humpback distribution appeared to have shifted to this area (Payne et al. 1986). An apparent reversal began in the mid-1980s, and herring and mackerel increased as sand lance again decreased (Fogarty et al. 1991). Humpback whale abundance in the northern Gulf of Maine increased markedly during 1992–1993, along with a major influx of herring (P. Stevick, pers. comm.). Humpback whales were few in nearshore Massachusetts waters in the 1992–1993 summer seasons. They were more abundant in the offshore waters of Cultivator Shoal, the Northeast Peak of Georges Bank, and Jeffreys Ledge; these latter areas are traditional locations of herring occurrence. In 1996 and 1997, sand lance and therefore humpback whales were once again abundant in the Stellwagen Bank area. However, unlike previous cycles, when an increase in sand lance corresponded to a decrease in herring, herring remained relatively abundant in the northern Gulf of Maine, and humpbacks correspondingly continued to occupy this portion of the habitat, where they also fed on euphausiids (Weinrich et al. 1997). Diel patterns in humpback foraging behavior have been shown to correlate with diel patterns in sand lance behavior (Friedlaender et al. 2009). The key uncertainty in the stock definition for the Gulf of Maine stock of humpback whales is where along the Scotian shelf stock boundaries are drawn in a relatively contiguous range. Exact placement of the boundary should have little effect on conservation status because the whales along the southern Scotian shelf represent a relatively small fraction of either the Gulf of Maine or Labrador stocks.
POPULATION SIZE
Gulf of Maine stock - Earlier estimates Please see Appendix IV for earlier estimates. As recommended in the 2016 guidelines for preparing stock assessment reports (NMFS 2016), estimates older than eight years are deemed unreliable and should not be used for PBR determinations.
Gulf of Maine Stock - Recent surveys and abundance estimates Humpback whales are uniquely identifiable based primarily on coloration patterns of the ventral side of the fluke and identification can be augmented by other features such as dorsal fin shape, scars and genetic data (Smith et al. 1999). A recent count of the minimum number alive (MNA) for 2015 was produced by counting the number of unique individuals seen in 2015 in the Gulf of Maine stock area as well as seen both before and after 2015 (data provided by J. Robbins, Center for Coastal Studies, Provincetown, MA, USA). The humpback MNA for 2015 was 896 and includes not only cataloged whales but some calves born in 2015 but not yet identifiable. By comparison, an abundance of 335 (CV=0.42) humpback whales was estimated from a line-transect survey conducted during June–August 2011 by ship and plane (Palka 2012). The aerial portion that contributed to the abundance estimate covered 5,313 km of tracklines over waters north of New Jersey and shallower than the 100-m depth contour through the U.S. and Canadian Gulf of Maine and up to and including the lower Bay of Fundy. The shipboard portion covered 3,107 km of tracklines in waters deeper than the 100-m depth contour out to beyond the U.S. EEZ. Both sighting platforms used a two-simultaneous-team data collection procedure, which allows estimation of abundance corrected for perception bias (Laake and Borchers 2004). Estimation of abundance was based on the independent-observer approach assuming point independence (Laake and Borchers 2004) and calculated using the mark-recapture distance sampling option in the computer program Distance (version 6.0, release 2, Thomas et al. 2009). This estimate did not include the portion of the Scotian Shelf that is known to be part of the range used by Gulf of Maine humpback whales. This estimate should not be compared to previous estimates that were derived using a different methodology. The now-outdated estimate of 823 humpbacks in the Gulf of Maine and Bay of Fundy in 2008 was based on a minimum number alive calculation. While that type of estimate is generally more accurate than one derived from line-transect survey, the 2016 GAMMS guidelines (NMFS 2016) notes the decline of confidence in the reliability of abundance estimates older than eight years.
Minimum Population Estimate For statistically-based estimates, the minimum population estimate is the lower limit of the two-tailed 60% confidence interval of the log-normally distributed best abundance estimate. This is equivalent to the 20th percentile of the log-normal distribution as specified by Wade and Angliss (1997). However, MNA is a rigorous accounting of individuals and has no associated CV. It is both more recent and larger than the 2011 line transect estimate and has zero probability of overestimating abundance. Hence Nmin for purposes of this assessment is 896.
33
Table 1. Summary of abundance estimates for Gulf of Maine humpback whales with month, year, and area covered during each abundance survey, and resulting abundance estimate (Nbest) and coefficient of variation (CV).
Month/Year
Type
Nbest
CV
Jun–Aug 2011 Virginia to lower Bay of Fundy 335 0.42
Jun–Oct 2015 Gulf of Maine and Bay of Fundy 896 0
Current Population Trend As detailed below, previous analyses concluded that the Gulf of Maine humpback whale stock is characterized by a positive trend in abundance. This was consistent with an estimated average trend of 3.1% (SE=0.005) in the North Atlantic population overall for the period 1979–1993 (Stevick et al. 2003), although there are no feeding-area-specific estimates. An analysis of demographic parameters for the Gulf of Maine (Clapham et al. 2003) suggested a lower rate of increase than the 6.5% reported by Barlow and Clapham (1997), but results may have been confounded by distribution shifts. Whether the reported positive trends continued into the current evaluation period is uncertain. NMFS is working with J. Robbins (Center of Coastal Studies) to provide an evaluation of trend in the next stock assessment report.
CURRENT AND MAXIMUM NET PRODUCTIVITY RATES Zerbini et al. (2010) reviewed various estimates of maximum productivity rates for humpback whale populations, and, based on simulation studies, they proposed that 11.8% be considered as the maximum rate at which the species could grow. Barlow and Clapham (1997), applying an interbirth interval model to photographic mark-recapture data, estimated the population growth rate of the Gulf of Maine humpback whale stock at 6.5% (CV=0.012). Maximum net productivity is unknown for this population, although a theoretical maximum for any humpback population can be calculated using known values for biological parameters (Brandão et al. 2000; Clapham et al. 2001). For the Gulf of Maine stock, data supplied by Barlow and Clapham (1997) and Clapham et al. (1995) give values of 0.96 for survival rate, 6 years as mean age at first parturition, 0.5 as the proportion of females, and 0.42 for annual pregnancy rate. From this, a maximum population growth rate of 0.072 is obtained according to the method described by Brandão et al. (2000). This suggests that the observed rate of 6.5% (Barlow and Clapham 1997) is close to the maximum for this stock. Clapham et al. (2003) updated the Barlow and Clapham (1997) analysis using data from the period 1992 to 2000. The population growth estimate was either 0% (for a calf survival rate of 0.51) or 4.0% (for a calf survival rate of 0.875). Although uncertainty was not strictly characterized by Clapham et al. (2003), their work might reflect a decline in population growth rates from the earlier study period. More recent work by Robbins (2007) places apparent survival of calves at 0.664 (95% CI: 0.517-0.784), a value between those used by Barlow and Clapham (1997) and in addition found productivity to be highly variable and well less than maximum. Despite the uncertainty accompanying the more recent estimates of observed population growth rate for the Gulf of Maine stock, the maximum net productivity rate was assumed to be 6.5% calculated by Barlow and Clapham (1997) because it represents an observation greater than the default of 0.04 for cetaceans (Barlow et al. 1995) but is conservative in that it is well below the results of Zerbini et al. (2010).
POTENTIAL BIOLOGICAL REMOVAL Potential Biological Removal (PBR) is the product of minimum population size, one-half the maximum productivity rate, and a recovery factor (MMPA Sec. 3. 16 U.S.C. 1362; Wade and Angliss 1997). The minimum population size for the Gulf of Maine stock is 896 whales. The maximum productivity rate is 0.065. In the 2015 and prior SARs, the recovery factor was 0.10 because this stock was listed as an endangered species under the Endangered Species Act. The 2016 revision to the ESA listing of humpback whales concluded that the West Indies Distinct Population Segment (of which the Gulf of Maine stock is a part) did not warrant listing (81 FR 62259, September 8, 2016). Consequently, in the 2016 SAR the recovery factor was revised to 0.5, the default value for stocks of unknown status relative to OSP (Wade and Angliss 1997). PBR for the Gulf of Maine humpback whale stock is 14.6 whales.
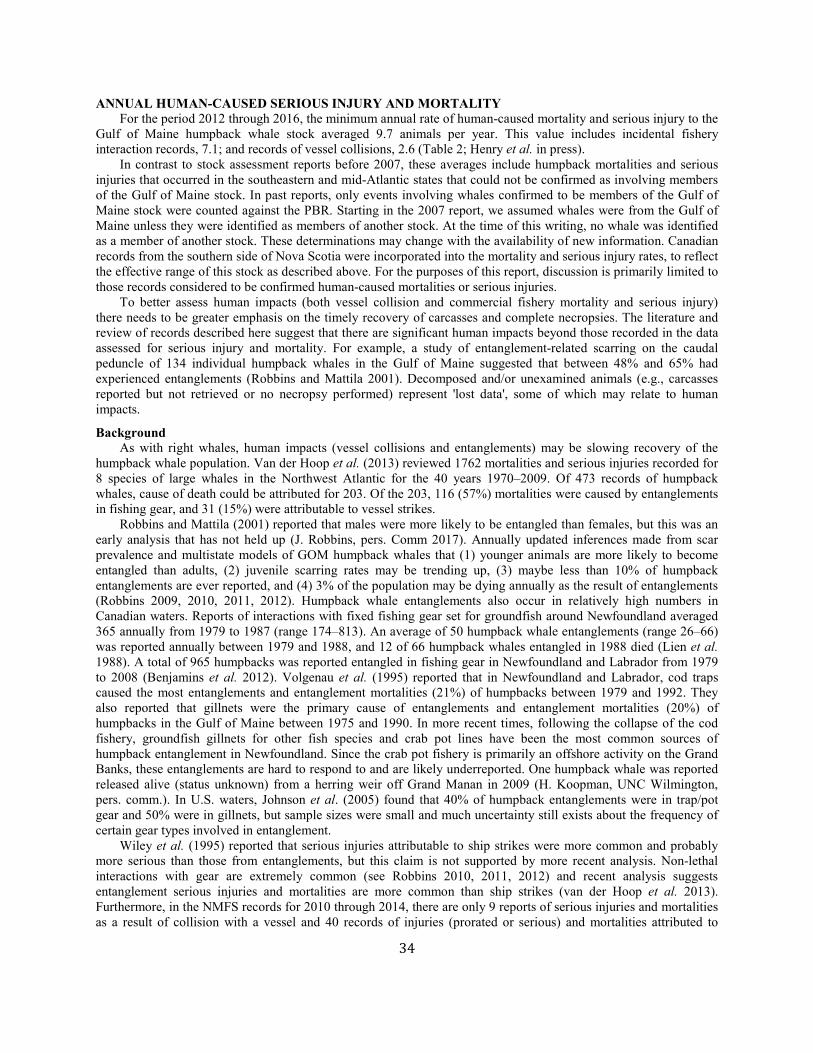
34
ANNUAL HUMAN-CAUSED SERIOUS INJURY AND MORTALITY For the period 2012 through 2016, the minimum annual rate of human-caused mortality and serious injury to the Gulf of Maine humpback whale stock averaged 9.7 animals per year. This value includes incidental fishery interaction records, 7.1; and records of vessel collisions, 2.6 (Table 2; Henry et al. in press). In contrast to stock assessment reports before 2007, these averages include humpback mortalities and serious injuries that occurred in the southeastern and mid-Atlantic states that could not be confirmed as involving members of the Gulf of Maine stock. In past reports, only events involving whales confirmed to be members of the Gulf of Maine stock were counted against the PBR. Starting in the 2007 report, we assumed whales were from the Gulf of Maine unless they were identified as members of another stock. At the time of this writing, no whale was identified as a member of another stock. These determinations may change with the availability of new information. Canadian records from the southern side of Nova Scotia were incorporated into the mortality and serious injury rates, to reflect the effective range of this stock as described above. For the purposes of this report, discussion is primarily limited to those records considered to be confirmed human-caused mortalities or serious injuries. To better assess human impacts (both vessel collision and commercial fishery mortality and serious injury) there needs to be greater emphasis on the timely recovery of carcasses and complete necropsies. The literature and review of records described here suggest that there are significant human impacts beyond those recorded in the data assessed for serious injury and mortality. For example, a study of entanglement-related scarring on the caudal peduncle of 134 individual humpback whales in the Gulf of Maine suggested that between 48% and 65% had experienced entanglements (Robbins and Mattila 2001). Decomposed and/or unexamined animals (e.g., carcasses reported but not retrieved or no necropsy performed) represent 'lost data', some of which may relate to human impacts.
Background As with right whales, human impacts (vessel collisions and entanglements) may be slowing recovery of the humpback whale population. Van der Hoop et al. (2013) reviewed 1762 mortalities and serious injuries recorded for 8 species of large whales in the Northwest Atlantic for the 40 years 1970–2009. Of 473 records of humpback whales, cause of death could be attributed for 203. Of the 203, 116 (57%) mortalities were caused by entanglements in fishing gear, and 31 (15%) were attributable to vessel strikes. Robbins and Mattila (2001) reported that males were more likely to be entangled than females, but this was an early analysis that has not held up (J. Robbins, pers. Comm 2017). Annually updated inferences made from scar prevalence and multistate models of GOM humpback whales that (1) younger animals are more likely to become entangled than adults, (2) juvenile scarring rates may be trending up, (3) maybe less than 10% of humpback entanglements are ever reported, and (4) 3% of the population may be dying annually as the result of entanglements (Robbins 2009, 2010, 2011, 2012). Humpback whale entanglements also occur in relatively high numbers in Canadian waters. Reports of interactions with fixed fishing gear set for groundfish around Newfoundland averaged 365 annually from 1979 to 1987 (range 174–813). An average of 50 humpback whale entanglements (range 26–66) was reported annually between 1979 and 1988, and 12 of 66 humpback whales entangled in 1988 died (Lien et al. 1988). A total of 965 humpbacks was reported entangled in fishing gear in Newfoundland and Labrador from 1979 to 2008 (Benjamins et al. 2012). Volgenau et al. (1995) reported that in Newfoundland and Labrador, cod traps caused the most entanglements and entanglement mortalities (21%) of humpbacks between 1979 and 1992. They also reported that gillnets were the primary cause of entanglements and entanglement mortalities (20%) of humpbacks in the Gulf of Maine between 1975 and 1990. In more recent times, following the collapse of the cod fishery, groundfish gillnets for other fish species and crab pot lines have been the most common sources of humpback entanglement in Newfoundland. Since the crab pot fishery is primarily an offshore activity on the Grand Banks, these entanglements are hard to respond to and are likely underreported. One humpback whale was reported released alive (status unknown) from a herring weir off Grand Manan in 2009 (H. Koopman, UNC Wilmington, pers. comm.). In U.S. waters, Johnson et al. (2005) found that 40% of humpback entanglements were in trap/pot gear and 50% were in gillnets, but sample sizes were small and much uncertainty still exists about the frequency of certain gear types involved in entanglement. Wiley et al. (1995) reported that serious injuries attributable to ship strikes were more common and probably more serious than those from entanglements, but this claim is not supported by more recent analysis. Non-lethal interactions with gear are extremely common (see Robbins 2010, 2011, 2012) and recent analysis suggests entanglement serious injuries and mortalities are more common than ship strikes (van der Hoop et al. 2013). Furthermore, in the NMFS records for 2010 through 2014, there are only 9 reports of serious injuries and mortalities as a result of collision with a vessel and 40 records of injuries (prorated or serious) and mortalities attributed to

35
entanglement. Because it has never been shown that serious injuries and mortalities related to ships or to fisheries interactions are equally detectable, it is unclear as to which human source of mortality is more prevalent. A major aspect of vessel collision that will be cryptic as a serious injury is blunt trauma; when lethal it is usually undetectable from an external exam (Moore et al. 2013). No whale involved in the recorded vessel collisions had been identified as a member of a stock other than the Gulf of Maine stock at the time of this writing (Henry et al. 2016).
Fishery-Related Serious Injuries and Mortalities A description of fisheries is provided in Appendix III. See Appendix V for more information on historical takes. In 2012 there was an observed interaction with a humpback whale in mid-Atlantic gillnet gear (non-serious injury). A recent review (Cassoff et al. 2011) describes in detail the types of injuries that baleen whales, including humpbacks, suffer as a result of entanglement in fishing gear. Confirmed human-caused mortalities and serious injuries from the last five years reported to the NMFS Greater Atlantic and Southeast regional offices and to Atlantic Canadian Maritime stranding networks (Henry et al., in press) are listed in Table 2. When there was no evidence to the contrary, events were assumed to involve members of the Gulf of Maine stock. While these records are not statistically quantifiable in the same way as observer fishery records, they provide some indication of the minimum frequency of entanglements. Specifically to this stock, if the calculations of Robbins (2011, 2012) are reasonable then the 3% mortality due to entanglement that she calculates equates to a minimum average rate of 25. Although disentanglement is often unsuccessful or not possible for many cases, there are several documented cases of entanglements for which the intervention of disentanglement teams averted a likely serious-injury determination. Twenty-nine serious injuries were prevented by intervention during 2012–2016 (Henry et al. in press).
Table 2. Confirmed human-caused mortality and serious injury records of humpback whales (Megaptera novaeangliae) where the cause was assigned as either an entanglement (EN) or a vessel strike (VS): 2012–2016 a
Dateb
Injury Determinati
on ID Locationb Assigned
Cause
Value against PBRc Countryd
Gear Typee Description
29-Apr-12 Serious Injury
- off Chatham, MA EN 1 US NR SI based on description of body position, which indicates anchored
29-Jul-12 Serious Injury - off Gloucester,
MA EN 1 XU NR Calf w/ line cutting into peduncle
4-Aug-12 Serious Injury
Aphid off Provincetown, MA
EN 1 XU NR
Line exiting both sides of mouth, under flippers, twisting together aft of the dorsal fin & trailing 75 ft past flukes; no wraps. Health decline: thin w/ graying skin.
21-Aug-12 Prorated Injury
2011 Calf of Wizard
off Provincetown, MA EN 0.75 XU MF Full configuration
unknown
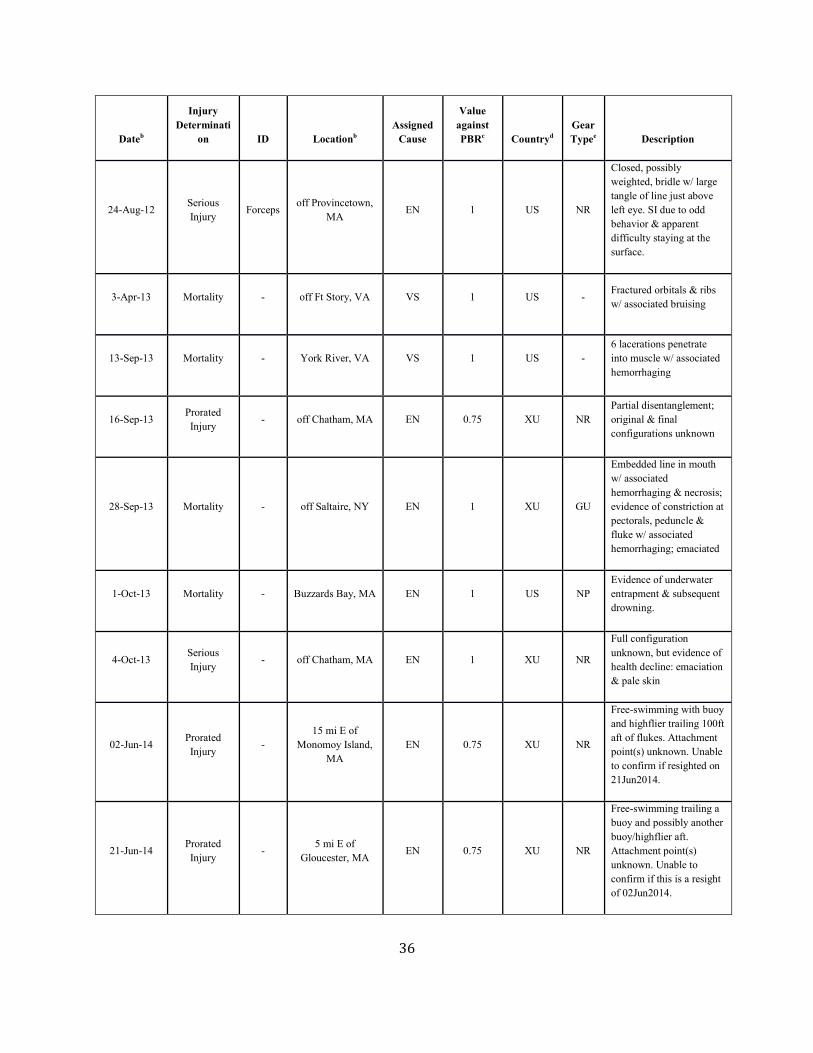
36
Dateb
Injury Determinati
on ID Locationb Assigned
Cause
Value against PBRc Countryd
Gear Typee Description
24-Aug-12 Serious Injury Forceps off Provincetown,
MA EN 1 US NR
Closed, possibly weighted, bridle w/ large tangle of line just above left eye. SI due to odd behavior & apparent difficulty staying at the surface.
3-Apr-13 Mortality - off Ft Story, VA VS 1 US - Fractured orbitals & ribs w/ associated bruising
13-Sep-13 Mortality - York River, VA VS 1 US - 6 lacerations penetrate into muscle w/ associated hemorrhaging
16-Sep-13 Prorated Injury - off Chatham, MA EN 0.75 XU NR
Partial disentanglement; original & final configurations unknown
28-Sep-13 Mortality - off Saltaire, NY EN 1 XU GU
Embedded line in mouth w/ associated hemorrhaging & necrosis; evidence of constriction at pectorals, peduncle & fluke w/ associated hemorrhaging; emaciated
1-Oct-13 Mortality - Buzzards Bay, MA EN 1 US NP Evidence of underwater entrapment & subsequent drowning.
4-Oct-13 Serious Injury - off Chatham, MA EN 1 XU NR
Full configuration unknown, but evidence of health decline: emaciation & pale skin
02-Jun-14 Prorated Injury -
15 mi E of Monomoy Island,
MA EN 0.75 XU NR
Free-swimming with buoy and highflier trailing 100ft aft of flukes. Attachment point(s) unknown. Unable to confirm if resighted on 21Jun2014.
21-Jun-14 Prorated Injury
- 5 mi E of Gloucester, MA
EN 0.75 XU NR
Free-swimming trailing a buoy and possibly another buoy/highflier aft. Attachment point(s) unknown. Unable to confirm if this is a resight of 02Jun2014.

37
Dateb
Injury Determinati
on ID Locationb Assigned
Cause
Value against PBRc Countryd
Gear Typee Description
18-Jul-14 Serious Injury -
Provincetown Harbor, MA EN 1 XU NR
Free-swimming, trailing short amount of line from left side of mouth. No other gear noted, but evidence of previously more complicated, constricting entanglement. Current configuration deemed non-life threatening. Unsuccessful disentanglement attempt. In poor condition - emaciated with some cyamids. No resights
09/03/2014 Prorated Injury off Long Island
Beach, NJ EN .75 XU NR
Full/final config. unknown. Seen with new vessel strike lacerations on 14Aug2014. No resights. Previously reported as being gear free (SI value=0) but gear status determined to be unconfirmed.
11-Sep-14 Mortality Spinna
ker 10 nm SE of
Frenchboro, ME EN 1 XU GN
Free-swimming with gillnet gear. Found anchored on 12Sep2014. Gillnet panel lodged in mouth and tightly wrapping forward part of body. Panel entangled in pots with 20+ wraps of pot lines around flukes and peduncle. Mostly disentangled--left with short section of gillnet in mouth expecting to shed. Animal entangled again (14May2015 - anchored and disentangled). Carcass found 11Jun2015. Necropsy revealed gillnet from 2014 entanglement embedded deep into the maxilla and through the vomer. Bone had started to grow around the line. Gillnet is unknown origin. Pot/trap is US gear.
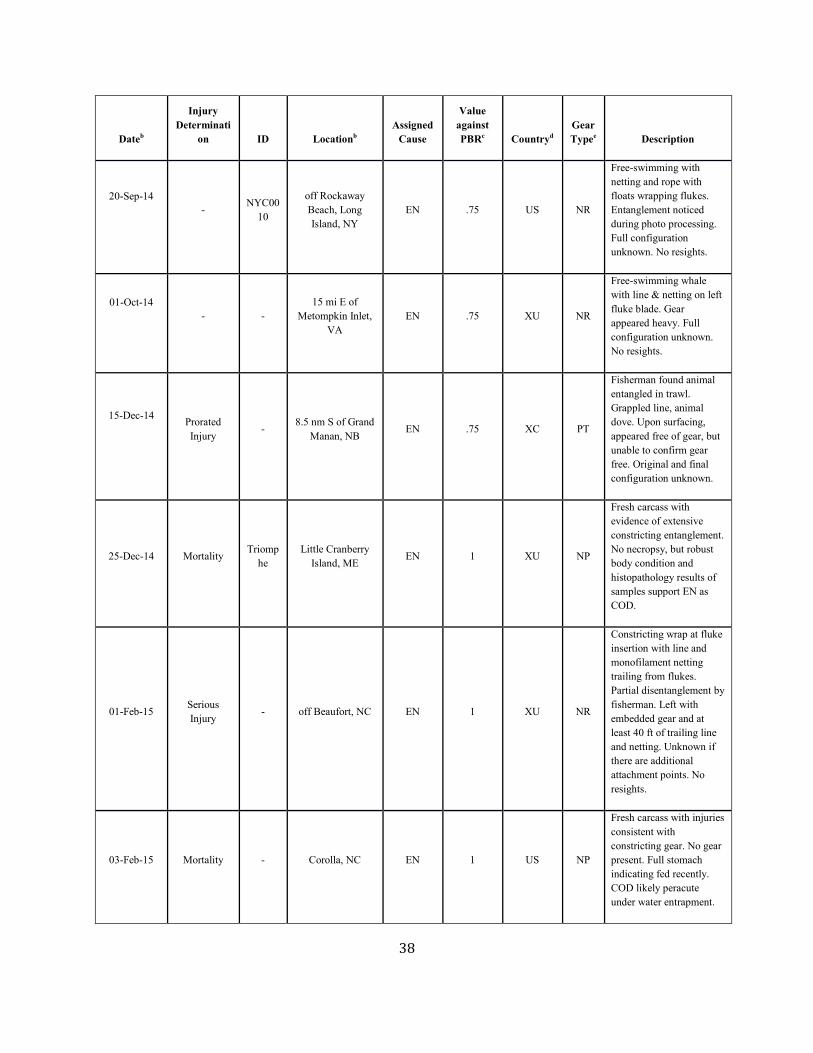
38
Dateb
Injury Determinati
on ID Locationb Assigned
Cause
Value against PBRc Countryd
Gear Typee Description
20-Sep-14
- NYC00
10
off Rockaway Beach, Long Island, NY
EN .75 US NR
Free-swimming with netting and rope with floats wrapping flukes. Entanglement noticed during photo processing. Full configuration unknown. No resights.
01-Oct-14
- -
15 mi E of Metompkin Inlet,
VA EN .75 XU NR
Free-swimming whale with line & netting on left fluke blade. Gear appeared heavy. Full configuration unknown. No resights.
15-Dec-14
Prorated Injury
- 8.5 nm S of Grand Manan, NB
EN .75 XC PT
Fisherman found animal entangled in trawl. Grappled line, animal dove. Upon surfacing, appeared free of gear, but unable to confirm gear free. Original and final configuration unknown.
25-Dec-14 Mortality Triomphe
Little Cranberry Island, ME EN 1 XU NP
Fresh carcass with evidence of extensive constricting entanglement. No necropsy, but robust body condition and histopathology results of samples support EN as COD.
01-Feb-15 Serious Injury
- off Beaufort, NC EN 1 XU NR
Constricting wrap at fluke insertion with line and monofilament netting trailing from flukes. Partial disentanglement by fisherman. Left with embedded gear and at least 40 ft of trailing line and netting. Unknown if there are additional attachment points. No resights.
03-Feb-15 Mortality - Corolla, NC EN 1 US NP
Fresh carcass with injuries consistent with constricting gear. No gear present. Full stomach indicating fed recently. COD likely peracute under water entrapment.
39
Dateb
Injury Determinati
on ID Locationb Assigned
Cause
Value against PBRc Countryd
Gear Typee Description
13-Apr-15 Mortality - off Fire Island, NY VS 1 US -
Extensive bruising and hemorrhaging at left gape and pectoral, throat, and right and left lateral thorax.
18-Apr-15 Mortality - Smith Point, NY VS 1 US - Multifocal hemorrhage and edema in right lateral abdomen.
29-Jun-15 Mortality - Fire Island, NY VS 1 US -
Extensive fracturing of cranial bones with associated bruising. Additional extensive bruising along dorsal and right lateral body.
09-Jul-15 Prorated Injury - off Sandy Hook,
NJ EN 0.75 XU NR
High flier trailing 30 ft aft of flukes. Attachment point(s) and configuration unknown. No resights.
02-Aug-15 Serious Injury - off Race Point,
Provincetown, MA EN 1 XU GN
Free-swimming with two sets of gear through its mouth: Primary gear=a closed bridle of gillnet joining mid-belly and trailing just past flukes and restricting movement; Secondary gear=an open bridle with one end leading to a buoy and the other to a pot. Disentangled from both sets of gear. Left with very short amount of gillnet through mouth that is expected to shed. Emaciated. No resights. Gillnet is primary cause of injury and of unknown origin. Pot/trap is US gear.
02-Aug-15 Prorated Injury - off Chatham, MA EN 0.75 XU NR
Calf with line around tail leading to buoys 4 ft aft of flukes. Full configuration unknown. No resights post 22Aug2015.
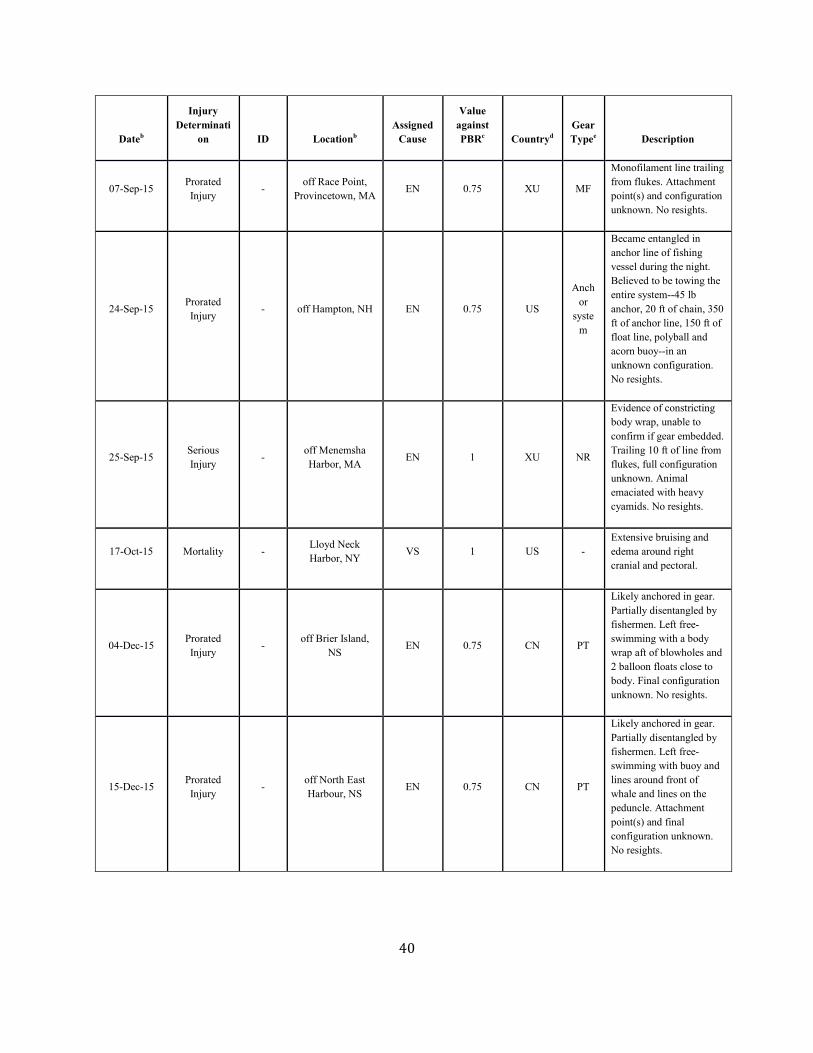
40
Dateb
Injury Determinati
on ID Locationb Assigned
Cause
Value against PBRc Countryd
Gear Typee Description
07-Sep-15 Prorated Injury - off Race Point,
Provincetown, MA EN 0.75 XU MF
Monofilament line trailing from flukes. Attachment point(s) and configuration unknown. No resights.
24-Sep-15 Prorated Injury - off Hampton, NH EN 0.75 US
Anchor
system
Became entangled in anchor line of fishing vessel during the night. Believed to be towing the entire system--45 lb anchor, 20 ft of chain, 350 ft of anchor line, 150 ft of float line, polyball and acorn buoy--in an unknown configuration. No resights.
25-Sep-15 Serious Injury - off Menemsha
Harbor, MA EN 1 XU NR
Evidence of constricting body wrap, unable to confirm if gear embedded. Trailing 10 ft of line from flukes, full configuration unknown. Animal emaciated with heavy cyamids. No resights.
17-Oct-15 Mortality - Lloyd Neck Harbor, NY VS 1 US -
Extensive bruising and edema around right cranial and pectoral.
04-Dec-15 Prorated Injury - off Brier Island,
NS EN 0.75 CN PT
Likely anchored in gear. Partially disentangled by fishermen. Left free-swimming with a body wrap aft of blowholes and 2 balloon floats close to body. Final configuration unknown. No resights.
15-Dec-15 Prorated Injury
- off North East Harbour, NS
EN 0.75 CN PT
Likely anchored in gear. Partially disentangled by fishermen. Left free-swimming with buoy and lines around front of whale and lines on the peduncle. Attachment point(s) and final configuration unknown. No resights.
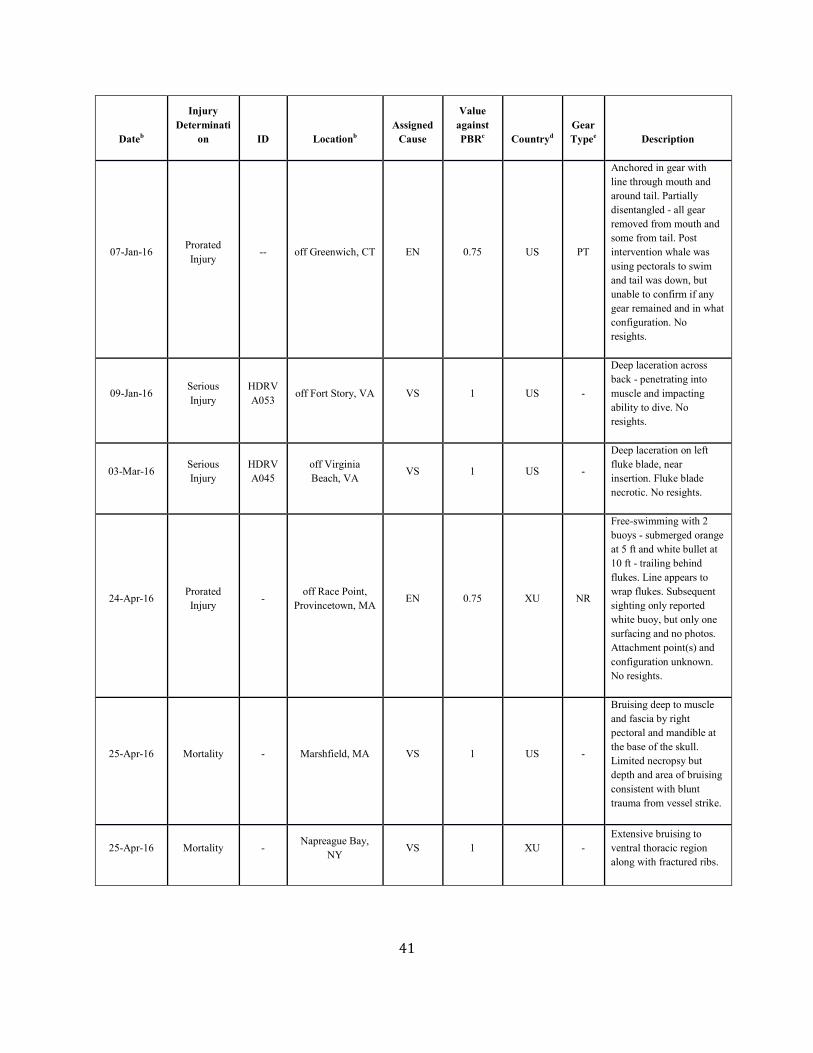
41
Dateb
Injury Determinati
on ID Locationb Assigned
Cause
Value against PBRc Countryd
Gear Typee Description
07-Jan-16 Prorated Injury
-- off Greenwich, CT EN 0.75 US PT
Anchored in gear with line through mouth and around tail. Partially disentangled - all gear removed from mouth and some from tail. Post intervention whale was using pectorals to swim and tail was down, but unable to confirm if any gear remained and in what configuration. No resights.
09-Jan-16 Serious Injury
HDRVA053 off Fort Story, VA VS 1 US -
Deep laceration across back - penetrating into muscle and impacting ability to dive. No resights.
03-Mar-16 Serious Injury
HDRVA045
off Virginia Beach, VA VS 1 US -
Deep laceration on left fluke blade, near insertion. Fluke blade necrotic. No resights.
24-Apr-16 Prorated Injury - off Race Point,
Provincetown, MA EN 0.75 XU NR
Free-swimming with 2 buoys - submerged orange at 5 ft and white bullet at 10 ft - trailing behind flukes. Line appears to wrap flukes. Subsequent sighting only reported white buoy, but only one surfacing and no photos. Attachment point(s) and configuration unknown. No resights.
25-Apr-16 Mortality - Marshfield, MA VS 1 US -
Bruising deep to muscle and fascia by right pectoral and mandible at the base of the skull. Limited necropsy but depth and area of bruising consistent with blunt trauma from vessel strike.
25-Apr-16 Mortality - Napreague Bay, NY VS 1 XU -
Extensive bruising to ventral thoracic region along with fractured ribs.
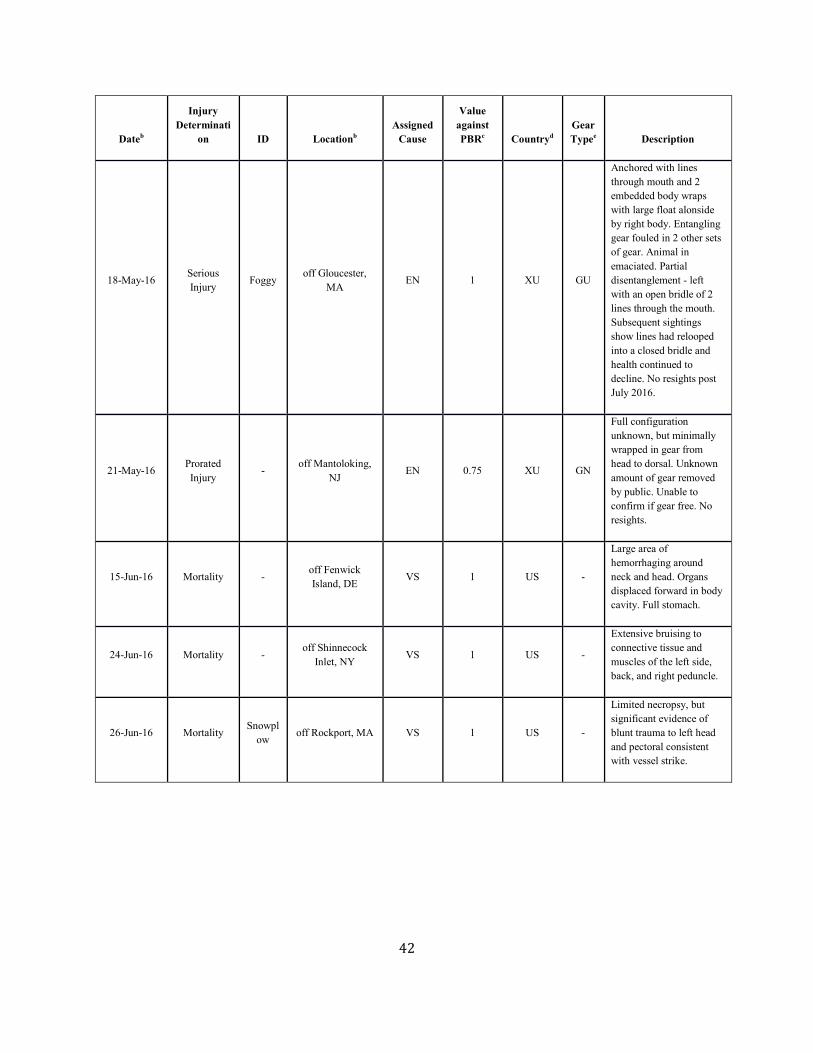
42
Dateb
Injury Determinati
on ID Locationb Assigned
Cause
Value against PBRc Countryd
Gear Typee Description
18-May-16 Serious Injury Foggy off Gloucester,
MA EN 1 XU GU
Anchored with lines through mouth and 2 embedded body wraps with large float alonside by right body. Entangling gear fouled in 2 other sets of gear. Animal in emaciated. Partial disentanglement - left with an open bridle of 2 lines through the mouth. Subsequent sightings show lines had relooped into a closed bridle and health continued to decline. No resights post July 2016.
21-May-16 Prorated Injury
- off Mantoloking, NJ
EN 0.75 XU GN
Full configuration unknown, but minimally wrapped in gear from head to dorsal. Unknown amount of gear removed by public. Unable to confirm if gear free. No resights.
15-Jun-16 Mortality - off Fenwick Island, DE VS 1 US -
Large area of hemorrhaging around neck and head. Organs displaced forward in body cavity. Full stomach.
24-Jun-16 Mortality - off Shinnecock
Inlet, NY VS 1 US -
Extensive bruising to connective tissue and muscles of the left side, back, and right peduncle.
26-Jun-16 Mortality Snowplow off Rockport, MA VS 1 US -
Limited necropsy, but significant evidence of blunt trauma to left head and pectoral consistent with vessel strike.
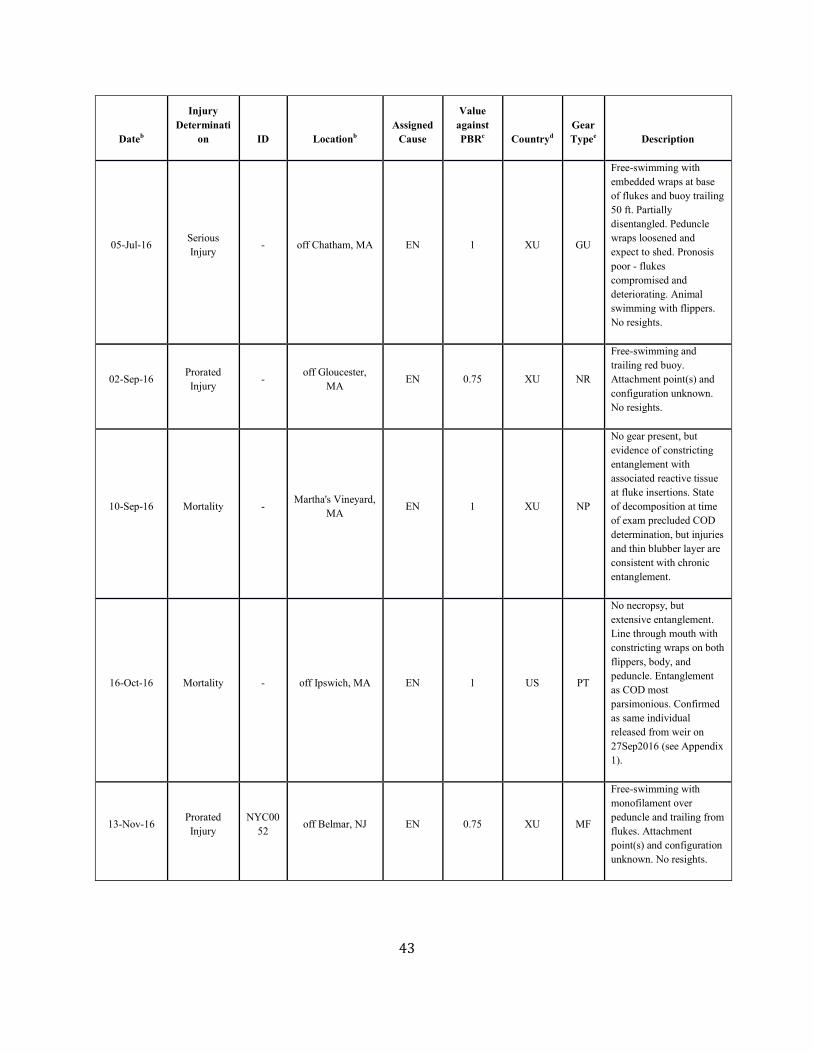
43
Dateb
Injury Determinati
on ID Locationb Assigned
Cause
Value against PBRc Countryd
Gear Typee Description
05-Jul-16 Serious Injury - off Chatham, MA EN 1 XU GU
Free-swimming with embedded wraps at base of flukes and buoy trailing 50 ft. Partially disentangled. Peduncle wraps loosened and expect to shed. Pronosis poor - flukes compromised and deteriorating. Animal swimming with flippers. No resights.
02-Sep-16 Prorated Injury - off Gloucester,
MA EN 0.75 XU NR
Free-swimming and trailing red buoy. Attachment point(s) and configuration unknown. No resights.
10-Sep-16 Mortality - Martha's Vineyard, MA EN 1 XU NP
No gear present, but evidence of constricting entanglement with associated reactive tissue at fluke insertions. State of decomposition at time of exam precluded COD determination, but injuries and thin blubber layer are consistent with chronic entanglement.
16-Oct-16 Mortality - off Ipswich, MA EN 1 US PT
No necropsy, but extensive entanglement. Line through mouth with constricting wraps on both flippers, body, and peduncle. Entanglement as COD most parsimonious. Confirmed as same individual released from weir on 27Sep2016 (see Appendix 1).
13-Nov-16 Prorated Injury
NYC0052 off Belmar, NJ EN 0.75 XU MF
Free-swimming with monofilament over peduncle and trailing from flukes. Attachment point(s) and configuration unknown. No resights.
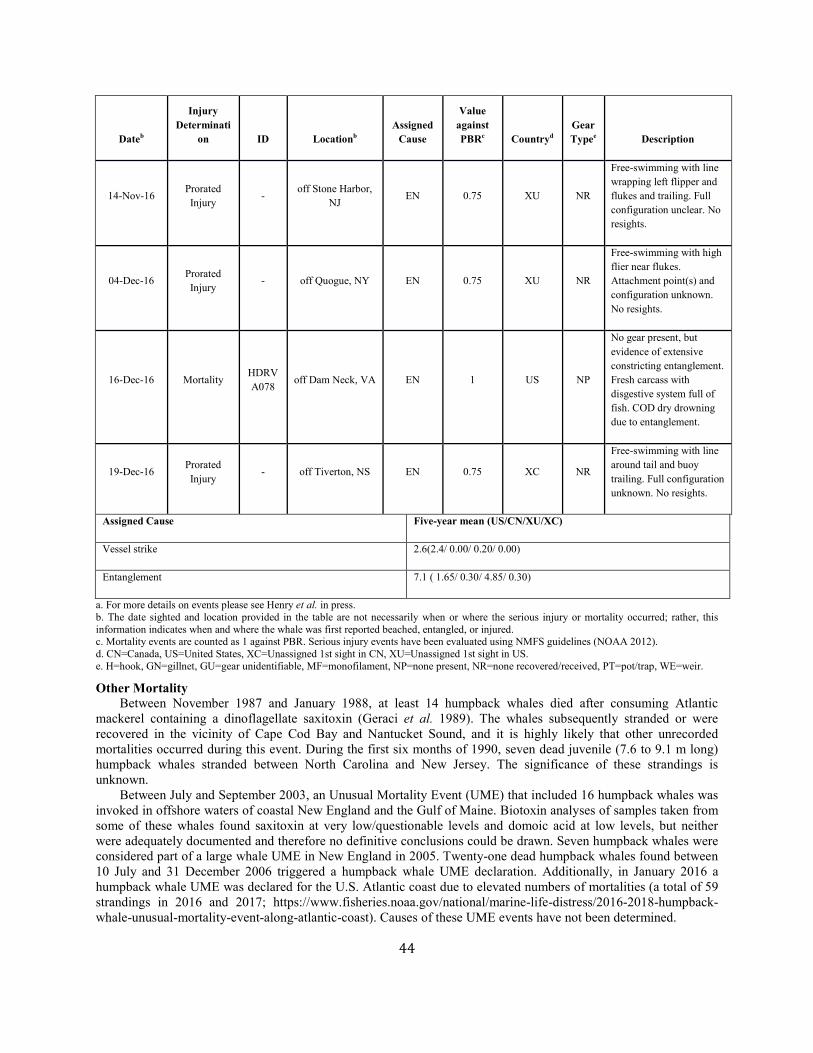
44
Dateb
Injury Determinati
on ID Locationb Assigned
Cause
Value against PBRc Countryd
Gear Typee Description
14-Nov-16 Prorated Injury - off Stone Harbor,
NJ EN 0.75 XU NR
Free-swimming with line wrapping left flipper and flukes and trailing. Full configuration unclear. No resights.
04-Dec-16 Prorated Injury - off Quogue, NY EN 0.75 XU NR
Free-swimming with high flier near flukes. Attachment point(s) and configuration unknown. No resights.
16-Dec-16 Mortality HDRVA078 off Dam Neck, VA EN 1 US NP
No gear present, but evidence of extensive constricting entanglement. Fresh carcass with disgestive system full of fish. COD dry drowning due to entanglement.
19-Dec-16 Prorated Injury
- off Tiverton, NS EN 0.75 XC NR
Free-swimming with line around tail and buoy trailing. Full configuration unknown. No resights.
Assigned Cause Five-year mean (US/CN/XU/XC)
Vessel strike 2.6(2.4/ 0.00/ 0.20/ 0.00)
Entanglement 7.1 ( 1.65/ 0.30/ 4.85/ 0.30)
a. For more details on events please see Henry et al. in press. b. The date sighted and location provided in the table are not necessarily when or where the serious injury or mortality occurred; rather, this information indicates when and where the whale was first reported beached, entangled, or injured. c. Mortality events are counted as 1 against PBR. Serious injury events have been evaluated using NMFS guidelines (NOAA 2012). d. CN=Canada, US=United States, XC=Unassigned 1st sight in CN, XU=Unassigned 1st sight in US. e. H=hook, GN=gillnet, GU=gear unidentifiable, MF=monofilament, NP=none present, NR=none recovered/received, PT=pot/trap, WE=weir.
Other Mortality Between November 1987 and January 1988, at least 14 humpback whales died after consuming Atlantic mackerel containing a dinoflagellate saxitoxin (Geraci et al. 1989). The whales subsequently stranded or were recovered in the vicinity of Cape Cod Bay and Nantucket Sound, and it is highly likely that other unrecorded mortalities occurred during this event. During the first six months of 1990, seven dead juvenile (7.6 to 9.1 m long) humpback whales stranded between North Carolina and New Jersey. The significance of these strandings is unknown. Between July and September 2003, an Unusual Mortality Event (UME) that included 16 humpback whales was invoked in offshore waters of coastal New England and the Gulf of Maine. Biotoxin analyses of samples taken from some of these whales found saxitoxin at very low/questionable levels and domoic acid at low levels, but neither were adequately documented and therefore no definitive conclusions could be drawn. Seven humpback whales were considered part of a large whale UME in New England in 2005. Twenty-one dead humpback whales found between 10 July and 31 December 2006 triggered a humpback whale UME declaration. Additionally, in January 2016 a humpback whale UME was declared for the U.S. Atlantic coast due to elevated numbers of mortalities (a total of 59 strandings in 2016 and 2017; https://www.fisheries.noaa.gov/national/marine-life-distress/2016-2018-humpback-whale-unusual-mortality-event-along-atlantic-coast). Causes of these UME events have not been determined.
45
STATUS OF STOCK NMFS conducted a global status review of humpback whales (Bettridge et al. 2015) and recently revised the ESA listing of the species (81 FR 62259, September 8, 2016). The Distinct Population Segments (DPSs) that occur in waters under U.S. jurisdiction, as established in the Final Rule, do not necessarily equate to the existing MMPA stocks. NMFS is evaluating the stock structure of humpback whales under the MMPA, but no changes to current stock structure are proposed at this time. As noted within the humpback whale ESA-listing Final Rule, in the case of a species or stock that achieved its depleted status solely on the basis of its ESA status, such as the humpback whale, the species or stock would cease to qualify as depleted under the terms of the definition set forth in MMPA Section 3(1) if the species or stock is no longer listed as threatened or endangered. The final rule indicated that until the stock delineations are reviewed in light of the DPS designations, NMFS would consider stocks that do not fully or partially coincide with a listed DPS as not depleted for management purposes. Therefore, the Gulf of Maine stock is considered not depleted because it does not coincide with any ESA-listed DPS. The detected level of U.S. fishery-caused mortality and serious injury derived from the available records, which is surely biased low, does not exceed the calculated PBR and, therefore, this is not a strategic stock if the recovery factor is set at 0.5. Because both the abundance determination and the accounting of human caused mortality are biased low, the uncertainties associated with this assessment may have produced an incorrect determination of strategic status.
46
REFERENCES CITED Balcomb, K.C. and G. Nichols. 1982. Humpback whale censuses in the West Indies. Rep. Int. Whal. Comm.
32:401–406. Barco, S.G., W.A. McLellan, J.M. Allen, R.A. Asmutis-Silvia, R. Mallon-Day, E.M. Meagher, D.A. Pabst, J.
Robbins, R.E. Seton, W.M. Swingle, M.T. Weinrich and P.J. Clapham. 2002. Population identity of humpback whales (Megaptera novaeangliae) in the waters of the U.S. mid-Atlantic states. J. Cetacean Res. Manage. 4:135–141.
Barlow, J. and P.J. Clapham. 1997. A new birth-interval approach to estimating demographic parameters of humpback whales. Ecology 78:535–546.
Barlow, J., S.L. Swartz, T.C. Eagle and P.R. Wade. 1995. U.S. marine mammal stock assessments: Guidelines for preparation, background, and a summary of the 1995 assessments. NOAA Tech. Memo. NMFS-OPR-6. 73 pp.
Benjamins, S., W. Ledwell, J. Huntington and A.R. Davidson. 2012. Assessing changes in numbers and distribution of large whale entanglements in Newfoundland and Labrador, Canada. Mar. Mamm. Sci. 28:579–601.
Bettridge, S., C.S. Baker, J. Barlow, P.J. Clapham, M. Ford, D. Gouveia, D.K. Mattila, R.M. Pace III, P.E. Rosel, G.K. Silber and P.R.Wade. 2015. Status review of the humpback whale (Megaptera novaeangliae) under the Endangered Species Act. NOAA Tech. Memo. NMFS-SWFSC-540. 263 pp.
Brandão, A., D.S. Butterworth and M.R. Brown. 2000. Maximum possible humpback whale increase rates as a function of biological parameter values. J. Cetacean Res. Manage. 2 (supplement):192–193.
Brown, D.M., J. Robbins, P.L. Sieswerda, R. Schoelkopf and E.C.M. Parsons. 2017. Humpback whale (Megaptera novaeangliae) sightings in the New York-New Jersey harbor estuary. Mar. Mamm. Sci. 34:250-257.
Cassoff, R., K. Moore, W. McLellan, S. Barco, D. Rotstein and M. Moore. 2011. Lethal entanglement in baleen whales. Dis. Aquat. Org. 96:175–185.
Christensen, I., T. Haug and N. Øien. 1992. Seasonal distribution, exploitation and present abundance of stocks of large baleen whales (Mysticeti) and sperm whales (Physeter macrocephalus) in Norwegian and adjacent waters. ICES J. Mar. Sci. 49:341–355.
Clapham, P.J., L.S. Baraff, C.A. Carlson, M.A. Christian, D.K. Mattila, C.A. Mayo, M.A. Murphy and S. Pittman. 1993. Seasonal occurrence and annual return of humpback whales, Megaptera novaeangliae, in the southern Gulf of Maine. Can. J. Zool. 71:440–443.
Clapham, P.J., J. Barlow, M. Bessinger, T. Cole, D. Mattila, R. Pace, D. Palka, J. Robbins and R. Seton. 2003. Abundance and demographic parameters of humpback whales from the Gulf of Maine, and stock definition relative to the Scotian Shelf. J. Cetacean Res. Manage. 5:13–22.
Clapham, P.J., M.C. Bérubé and D.K. Mattila. 1995. Sex ratio of the Gulf of Maine humpback whale population. Mar. Mamm. Sci. 11:227–231.
Clapham, P.J. and C.A. Mayo. 1987. Reproduction and recruitment of individually identified humpback whales, Megaptera novaeangliae, observed in Massachusetts Bay, 1979-1985. Can. J. Zool. 65:2853–2863.
Clapham, P.J., J. Robbins, M. Brown, P. Wade and K. Findlay. 2001. A note on plausible rates of population growth for humpback whales. J. Cetacean Res. Manage. 3 (suppl.):196–197.
Clark, C.W. and P.J. Clapham. 2004. Acoustic monitoring on a humpback whale (Megaptera novaeangliae) feeding ground shows continual singing into late Spring. Proc. R. Soc. Lond., B. 271:1051–1057.
Clark, C.W. and G.C. Gagnon. 2002. Low-frequency vocal behaviors of baleen whales in the North Atlantic: Insights from IUSS detections, locations and tracking from 1992 to 1996. J. Underwater Acoust. (USN) 52:609–640.
Fogarty, M.J., E.B. Cohen, W.L. Michaels and W.W. Morse. 1991. Predation and the regulation of sand lance populations: An exploratory analysis. ICES Mar. Sci. Symp. 193:120–124.
Friedlaender, A., E. Hazen, D. Nowacek, P. Halpin, C. Ware, M. Weinrich, T. Hurst and D. Wiley. 2009. Diel changes in humpback whale Megaptera novaeangliae feeding behavior in response to sand lance Ammodytes spp. behavior and distribution. Mar. Ecol. Prog. Ser. 395:91–100.
Geraci, J.R., D.M. Anderson, R.J. Timperi, D.J.S. Aubin, G.A. Early, J.H. Prescott and C.A. Mayo. 1989. Humpback whales (Megaptera novaeangliae) fatally poisoned by dinoflagellate toxins. Can. J. Fish. Aquat. Sci. 46:1895–1898.
Henry, A.G., T.V.N. Cole, L. Hall, W. Ledwell, D. Morin and A. Reid. in press. Mortality and Serious Injury determinations for baleen whale stocks along the Gulf of Mexico, United States East Coast and Atlantic Canadian Provinces, 2012–2016, Northeast Fish. Sci. Cent. Ref. Doc.
47
IWC [International Whaling Commission]. 2002. Report of the Scientific Committee. Annex H: Report of the Sub-committee on the Comprehensive Assessment of North Atlantic humpback whales. J. Cetacean Res. Manage. 4 (supplement):230–260.
Johnson, A., G. Salvador, J. Kenney, J. Robbins, S. Kraus, S. Landry and P. Clapham. 2005. Fishing gear involved in entanglements of right and humpback whales. Mar. Mamm. Sci. 21:635–645.
Katona, S.K. and J.A. Beard. 1990. Population size, migrations, and feeding aggregations of the humpback whale (Megaptera novaeangliae) in the western North Atlantic Ocean. Rep. Int. Whal. Comm. (Special Issue) 12:295–306.
Katona, S.K. and Whitehead, H.P. 1981. Identifying humpback whales using their natural markings. Polar Record 20:439-444.
Laake, J.L. and D.L. Borchers 2004. Methods for incomplete detection at distance zero. Pages 108–189 in: Advanced distance sampling, edited by S.T. Buckland, D.R. Andersen, K.P. Burnham, J.L. Laake, and L. Thomas. Oxford University Press, New York, NY.
Larsen, A.H., J. Sigurjónsson, N. Øien, G. Vikingsson and P.J. Palsbøll. 1996. Population genetic analysis of mitochondrial and nuclear genetic loci in skin biopsies collected from central and northeastern North Atlantic humpback whales (Megaptera novaeangliae): population identity and migratory destinations. Proc. R. Soc. London, B 263:1611–1618.
Levenson, C. and W.T. Leapley. 1978. Distribution of humpback whales (Megaptera novaeangliae) in the Caribbean determined by a rapid acoustic method. J. Fish. Res. Board Can. 35:1150–1152.
Lien, J., W. Ledwell and J. Naven. 1988. Incidental entrapment in inshore fishing gear during 1988: A preliminary report to the Newfoundland and Labrador Department of Fisheries and Oceans. St. John's, Newfoundland, Canada. 15 pp.
Mattila, D.K. and P.J. Clapham. 1989. Humpback whales and other cetaceans on Virgin Bank and in the northern Leeward Islands, 1985 and 1986. Can. J. Zool. 67:2201–2211.
Mattila, D.K., P.J. Clapham, S.K. Katona and G.S. Stone. 1989. Population composition of humpback whales on Silver Bank. Can. J. Zool. 67:281–285.
Moore, M., J. van der Hoop, S. Barco, A. Costidis, F. Gulland, P. Jepson, K. Moore, S. Raverty and W. McLellan. 2013. Criteria and case definitions for serious injury and death of pinnipeds and cetaceans caused by anthropogenic trauma. Dis. Aquat. Org. 103:229–264.
Murray, A., A. Rice and C. Clark. 2014. Extended seasonal occurrence of humpback whales in Massachusetts Bay. J. Mar. Biol. Assoc. U.K. 94:1117–1125.
NMFS [National Marine Fisheries Service]. 2016. Guidelines for preparing stock assessment reports pursuant to the 1994 amendments to the MMPA. NMFS Instruction 02-204-01. 24 pp. https://www.fisheries.noaa.gov/national/marine-mammal-protection/guidelines-assessing-marine-mammal-stocks
Palsbøll, P.J., J. Allen, T.H. Anderson, M. Bérubé, P.J. Clapham, T.P. Feddersen, N. Friday, P. Hammond, H. Jørgensen, S.K. Katona, A.H. Larsen, F. Larsen, J. Lien, D.K. Mattila, F.B. Nygaard, J. Robbins, R. Sponer, R. Sears, J. Sigurjónsson, T.D. Smith, P.T. Stevick, G. Vikingsson and N. Øien. 2001. Stock structure and composition of the North Atlantic humpback whale, Megaptera novaeangliae. Scientific Committee meeting document SC/53/NAH11. International Whaling Commission, Cambridge, UK.
Palsbøll, P.J., J. Allen, M. Berube, P. Clapham, T. Feddersen, P. Hammond, R. Hudson, H. Jorgensen, S. Katona, A.H. Larsen, F. Larsen, J. Lien, D. Mattila, J. Sigurjonsson, R. Sears, T. Smith, R. Sponer, P. Stevick and N. Oien. 1997. Genetic tagging of humpback whales. Nature 388:767–769.
Palsbøll, P.J., P.J. Clapham, D.K. Mattila, F. Larsen, R. Sears, H.R. Siegismund, J. Sigurjónsson, O. Vásquez and P. Arctander. 1995. Distribution of mtDNA haplotypes in North Atlantic humpback whales: the influence of behavior on population structure. Mar. Ecol. Prog. Ser. 116:1–10.
Paquet, D., C. Haycock and H. Whitehead. 1997. Numbers and seasonal occurrence of humpback whales (Megaptera novaeangliae) off Brier Island, Nova Scotia. Can. Field-Nat. 111:548–552.
Payne, P.M., J.R. Nicholas, L. O'Brien and K.D. Powers. 1986. The distribution of the humpback whale, Megaptera novaeangliae, on Georges Bank and in the Gulf of Maine in relation to densities of the sand eel, Ammodytes americanus. Fish. Bull. 84:271–277.
Payne, P.M., D.N. Wiley, S.B. Young, S. Pittman, P.J. Clapham and J.W. Jossi. 1990. Recent fluctuations in the abundance of baleen whales in the southern Gulf of Maine in relation to changes in selected prey. Fish. Bull. 88:687–696.
Price, W.S. 1985. Whaling in the Caribbean: historical perspective and update. Rep. Int. Whal. Comm. 35:413–420.
48
Reiner, F., M.E.D. Santos and F.W. Wenzel. 1996. Cetaceans of the Cape Verde archipelago. Mar. Mamm. Sci. 12:434–443.
Robbins, J. 2007. Structure and dynamics of the Gulf of Maine humpback whale population. Ph.D. dissertation. University of St. Andrews, Aberdeen, Scotland.
Robbins, J. 2009. Scar-based inference into Gulf of Maine Humpback whale entanglement: 2003-2006. Report to the Northeast Fisheries Science Center, National Marine Fisheries Service, Woods Hole, Massachusetts, USA. http://www.nefsc.noaa.gov/psb/docs/HUWHScarring%28Robbins2009%29.pdf
Robbins, J. 2010. Scar-based inference into Gulf of Maine Humpback whale entanglement: 2008. Report to the Northeast Fisheries Science Center, National Marine Fisheries Service, Woods Hole, Massachusetts, USA.
Robbins, J. 2011. Scar-based inference into Gulf of Maine Humpback whale entanglement: 2009. Report to the Northeast Fisheries Science Center, National Marine Fisheries Service, Woods Hole, Massachusetts, USA. http://www.nefsc.noaa.gov/psb/docs/HUWHScarring%28Robbins2011%29.pdf
Robbins, J. 2012. Scar-based inference into Gulf of Maine Humpback whale entanglement: 2010. Report to the Northeast Fisheries Science Center, National Marine Fisheries Service, Woods Hole, Massachusetts, USA. http://www.nefsc.noaa.gov/psb/docs/HUWHScarring%28Robbins2012%29.pdf
Robbins, J. and D.K. Mattila. 2001. Monitoring entanglements of humpback whales (Megaptera novaeangliae) in the Gulf of Maine on the basis of caudal peduncle scarring. Scientific Committee meeting document SC/53/NAH25.International Whaling Commission, Cambridge, UK.
Smith, T.D., J. Allen, P.J. Clapham, P.S. Hammond, S. Katona, F. Larsen, J. Lien, D. Mattila, P.J. Palsboll, J. Sigurjonsson, P.T. Stevick and N. Øien. 1999. An ocean-basin-wide mark-recapture study of the North Atlantic humpback whale (Megaptera novaeangliae). Mar. Mamm. Sci. 15:1–32.
Smith, T.D. and D.G. Pike. 2009. The enigmatic humpback whale. NAMMCO Sci. Publ. 7:161–178. Stevick, P., N. Øien and D.K. Mattila. 1998. Migration of a humpback whale between Norway and the West Indies.
Mar. Mamm. Sci. 14:162–166. Stevick, P.T., J. Allen, P.J. Clapham, N. Friday, S.K. Katona, F. Larsen, J. Lien, D.K. Mattila, P.J. Palsbøll, J.
Sigurjónsson, T.D. Smith, N. Øien and P.S. Hammond. 2003. North Atlantic humpback whale abundance and rate of increase four decades after protection from whaling. Mar. Ecol. Prog. Ser. 258:263–273.
Stevick, P.T., J. Allen, P.J. Clapham, S.K. Katona, F. Larsen, J. Lien, D.K. Mattila, P.J. Palsbøll, R. Sears, J. Sigurjónsson, T.D. Smith, G. Vikingsson, N. Øien and P.S. Hammond. 2006. Population spatial structuring on the feeding grounds in North Atlantic humpback whales (Megaptera novaeangliae). J. Zool. 270:244–255.
Stevick P.T., S.D. Berrow, M. Bérubé, L. Bouveret, F. Broms, B. Jann, A. Kennedy, P. López Suárez, M. Meunier, C. Ryan and F. Wenzel. 2016 There and back again: multiple and return exchange of humpback whales between breeding habitats separated by an ocean basin. J. Mar. Biol. Assoc. U.K., special issue 4:885–890. doi:10.1017/S0025315416000321
Swingle, W.M., S.G. Barco, T.D. Pitchford, W.A. McLellan and D.A. Pabst. 1993. Appearance of juvenile humpback whales feeding in the nearshore waters of Virginia. Mar. Mamm. Sci. 9:309–315.
Thomas L, J.L. Laake, E. Rexstad, S. Strindberg, F.F.C. Marques, S.T. Buckland, D.L. Borchers, D.R. Anderson, K.P. Burnham, M.L. Burt, S.L. Hedley, J.H. Pollard, J.R.B. Bishop and T.A. Marques. 2009. Distance 6.0. Release 2. [Internet]. University of St. Andrews, Research Unit for Wildlife Population Assessment. St. Andrews, UK. Available from: http://distancesampling.org/Distance/.
van Der Hoop, J.M., M.J. Moore, S.G. Barco, T.V.N. Cole, P.-Y. Daoust, A.G. Henry, D.F. McAlpine, W.A. McLellan, T. Wimmer and A.R. Solow. 2013. Assessment of management to mitigate anthropogenic effects on large whales. Conserv. Biol. 27:121–133.
Volgenau, L., S.D. Kraus and J. Lien. 1995. The impact of entanglements on two substocks of the western North Atlantic humpback whale, Megaptera novaeangliae. Can. J. Zool. 73:1689–1698.
Vu, E.T., D. Risch, C.W. Clark, S. Gaylord, L.T. Hatch, M.A. Thompson, D.N. Wiley and S.M. Van Parijs. 2012. Humpback whale song occurs extensively on feeding grounds in the western North Atlantic Ocean. Aquat. Biol. 14:175–183.
Wade, P.R. and R.P. Angliss 1997. Guidelines for assessing marine mammal stocks: Report of the GAMMS Workshop April 3–5, 1996, Seattle, Washington. NOAA Tech. Memo. NMFS-OPR-12. 93 pp.
Waring, G.T., D.L. Palka, P.J. Clapham, S. Swartz, M.C. Rossman, T.V.N. Cole, K.D. Bisack, and L.J. Hansen, eds. 1999. U.S. Atlantic marine mammal stock assessments – 1998. NOAA Tech. Memo. NMFS-NE-116. 182 pp.

49
Waring, G.T., J.M. Quintal, and S.L. Swartz, eds. 2000. U.S. Atlantic and Gulf of Mexico marine mammal stock assessments – 2000. NOAA Tech. Memo. NMFS-NE-162. ix +197 pp. +3 app.
Weinrich, M., M. Martin, R. Griffiths, J. Bove and M. Schilling. 1997. A shift in distribution of humpback whales, Megaptera novaeangliae, in response to prey in southern Gulf of Maine. Fish. Bull. 95:826–836.
Wenzel, F.W., J. Allen, S. Berrow, C.J. Hazevoet, B. Jann, R.E. Seton, L. Steiner, P. Stevick, P.L. Suárez and P. Whooley. 2009. Current knowledge on the distribution and relative abundance of humpback whales (Megaptera novangliae) off the Cape Verdes Islands, eastern North Atlantic. Aquat. Mamm. 35:502–510.
Wiley, D.N., R.A. Asmutis, T.D. Pitchford and D.P. Gannon. 1995. Stranding and mortality of humpback whales, Megaptera novaeangliae, in the mid-Atlantic and southeast United States, 1985-1992. Fish. Bull. 93:196–205.
Winn, H.E., R.K. Edel and A.G. Taruski. 1975. Population estimate of the humpback whale (Megaptera novaeangliae) in the West Indies by visual and acoustic techniques. J. Fish. Res. Board Can. 32:499–506.
Zerbini, A.N., P.J. Clapham and P.R. Wade. 2010. Assessing plausible rates of population growth in humpback whales from life-history data. Mar. Biol. 157:1225–1236.
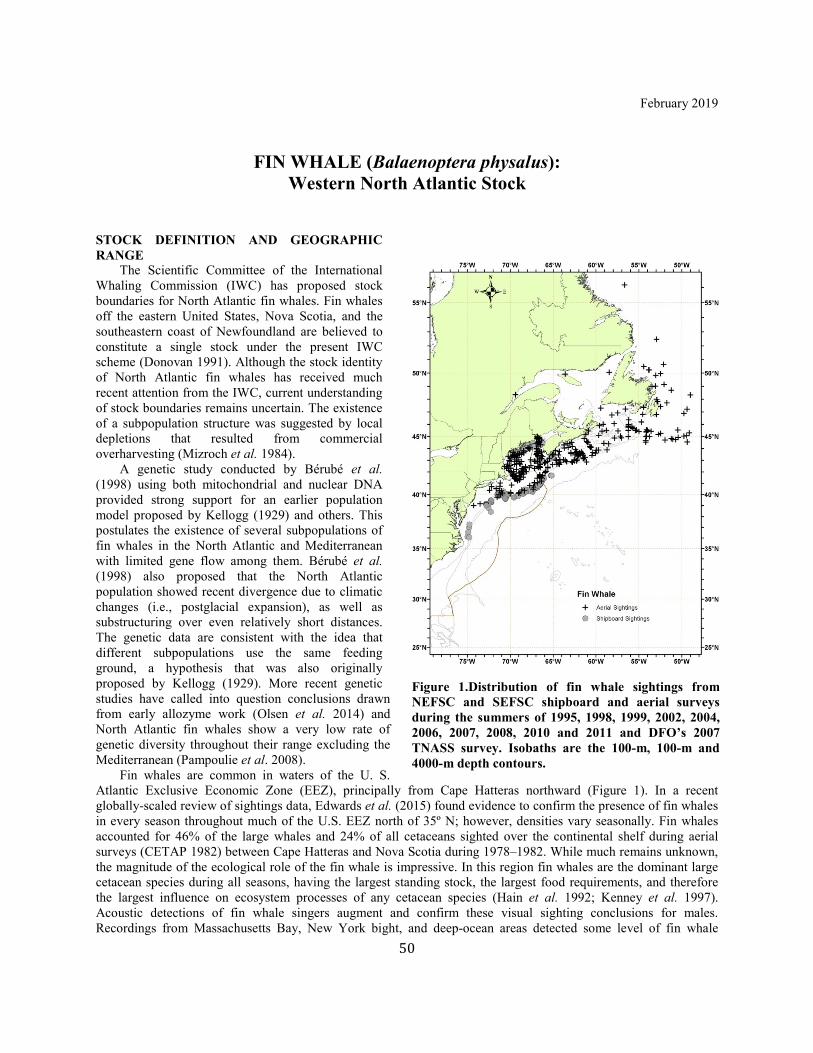
50
February 2019
FIN WHALE (Balaenoptera physalus): Western North Atlantic Stock
STOCK DEFINITION AND GEOGRAPHIC RANGE The Scientific Committee of the International Whaling Commission (IWC) has proposed stock boundaries for North Atlantic fin whales. Fin whales off the eastern United States, Nova Scotia, and the southeastern coast of Newfoundland are believed to constitute a single stock under the present IWC scheme (Donovan 1991). Although the stock identity of North Atlantic fin whales has received much recent attention from the IWC, current understanding of stock boundaries remains uncertain. The existence of a subpopulation structure was suggested by local depletions that resulted from commercial overharvesting (Mizroch et al. 1984). A genetic study conducted by Bérubé et al. (1998) using both mitochondrial and nuclear DNA provided strong support for an earlier population model proposed by Kellogg (1929) and others. This postulates the existence of several subpopulations of fin whales in the North Atlantic and Mediterranean with limited gene flow among them. Bérubé et al. (1998) also proposed that the North Atlantic population showed recent divergence due to climatic changes (i.e., postglacial expansion), as well as substructuring over even relatively short distances. The genetic data are consistent with the idea that different subpopulations use the same feeding ground, a hypothesis that was also originally proposed by Kellogg (1929). More recent genetic studies have called into question conclusions drawn from early allozyme work (Olsen et al. 2014) and North Atlantic fin whales show a very low rate of genetic diversity throughout their range excluding the Mediterranean (Pampoulie et al. 2008). Fin whales are common in waters of the U. S. Atlantic Exclusive Economic Zone (EEZ), principally from Cape Hatteras northward (Figure 1). In a recent globally-scaled review of sightings data, Edwards et al. (2015) found evidence to confirm the presence of fin whales in every season throughout much of the U.S. EEZ north of 35º N; however, densities vary seasonally. Fin whales accounted for 46% of the large whales and 24% of all cetaceans sighted over the continental shelf during aerial surveys (CETAP 1982) between Cape Hatteras and Nova Scotia during 1978–1982. While much remains unknown, the magnitude of the ecological role of the fin whale is impressive. In this region fin whales are the dominant large cetacean species during all seasons, having the largest standing stock, the largest food requirements, and therefore the largest influence on ecosystem processes of any cetacean species (Hain et al. 1992; Kenney et al. 1997). Acoustic detections of fin whale singers augment and confirm these visual sighting conclusions for males. Recordings from Massachusetts Bay, New York bight, and deep-ocean areas detected some level of fin whale
Figure 1.Distribution of fin whale sightings from NEFSC and SEFSC shipboard and aerial surveys during the summers of 1995, 1998, 1999, 2002, 2004, 2006, 2007, 2008, 2010 and 2011 and DFO’s 2007 TNASS survey. Isobaths are the 100-m, 100-m and 4000-m depth contours.

51
singing from September through June (Watkins et al. 1987, Clark and Gagnon 2002, Morano et al. 2012). These acoustic observations from both coastal and deep-ocean regions support the conclusion that male fin whales are broadly distributed throughout the western North Atlantic for most of the year. New England waters represent a major feeding ground for fin whales. There is evidence of site fidelity by females, and perhaps some segregation by sexual, maturational, or reproductive class in the feeding area (Agler et al. 1993). Hain et al. (1992) showed that fin whales measured photogrammetrically off the northeastern U.S., after deleting all individuals smaller than 14.6 m (the smallest whale taken in Iceland), were significantly smaller (mean length=16.8 m; P<0.001) than fin whales taken in Icelandic whaling (mean=18.3 m). Seipt et al. (1990) reported that 49% of identified fin whales sighted on the Massachusetts Bay area feeding grounds were resighted within the same year, and 45% were resighted in multiple years. The authors suggested that fin whales on these grounds exhibited patterns of seasonal occurrence and annual return that in some respects were similar to those shown for humpback whales. This was reinforced by Clapham and Seipt (1991), who showed maternally-directed site fidelity for fin whales in the Gulf of Maine. Despite the suggested similarity in patterns of seasonal occurrence with humpback whales, the U.S. currently recognizes one stock of fin whales in the western North Atlantic. Hain et al. (1992), based on an analysis of neonate stranding data, suggested that calving takes place during October to January in latitudes of the U.S. mid-Atlantic region; however, it is unknown where calving, mating, and wintering occur for most of the population. Results from the Navy's SOSUS program (Clark 1995; Clark and Gagnon 2002) indicated a substantial deep-ocean distribution of fin whales. It is likely that fin whales occurring in the U.S. Atlantic EEZ undergo migrations into Canadian waters, open-ocean areas, and perhaps even subtropical or tropical regions (Edwards et al. 2015). However, the popular notion that entire fin whale populations make distinct annual migrations like some other mysticetes has questionable support in the data; in the North Pacific, year-round monitoring of fin whale calls found no evidence for large-scale migratory movements (Watkins et al. 2000).
POPULATION SIZE The best abundance estimate available for the western North Atlantic fin whale stock is 1,618 (CV=0.33). This is the estimate derived from the 2011 NOAA shipboard and aerial surveys and is considered best because it represents the only current data in spite of the survey not including all of the stock's range. A key uncertainty in the current abundance estimate is the number of animals in Canadian waters. The northern part of the stock’s range was not surveyed in the 2011 shipboard survey (Palka 2012). This abundance estimate largely represents only the U.S. portion of this stock, and a small portion in Canadian waters. Additionally, the current abundance estimate does not account for availability bias due to submerged animals. Without a correction for this bias, the abundance estimate is likely biased low. Finally, since the most current estimate dates from a survey done in 2011, the ability for that estimate to accurately represent the present population size has become increasingly uncertain.
Earlier abundance estimates Please see Appendix IV for earlier abundance estimates. As recommended in the guidelines for preparing Stock Assessment Reports (NMFS 2016), estimates older than eight years are deemed unreliable for the determination of a current PBR.
Recent surveys and abundance estimates An abundance estimate of 1,595 (CV=0.33) fin whales was generated from a shipboard and aerial survey conducted during June–August 2011 (Palka 2012). The aerial portion that contributed to the abundance estimate covered 5,313 km of tracklines that were over waters north of New Jersey from the coastline to the 100-m depth contour, through the U.S. and Canadian Gulf of Maine and up to and including the lower Bay of Fundy. The shipboard portion covered 3,107 km of tracklines that were in waters offshore of North Carolina to Massachusetts (waters that were deeper than the 100-m depth contour out to beyond the U.S. EEZ). Both sighting platforms used a double-platform data collection procedure, which allows estimation of abundance corrected for perception bias of the detected species (Laake and Borchers 2004). Estimation of the abundance was based on the independent observer approach assuming point independence (Laake and Borchers 2004) and calculated using the multiple-covariate distance sampling option in the computer program Distance (version 6.0, release 2, Thomas et al. 2009).The abundance estimates of fin whales include a percentage of the estimate of animals identified as fin/sei whales (the two species being sometimes hard to distinguish).The percentage used is the ratio of positively identified fin whales to the total number of positively identified fin whales and positively identified sei whales; the CV of the abundance estimate includes the variance of the estimated fraction. An abundance estimate of 23 (CV=0.87) fin whales was generated from a shipboard survey conducted
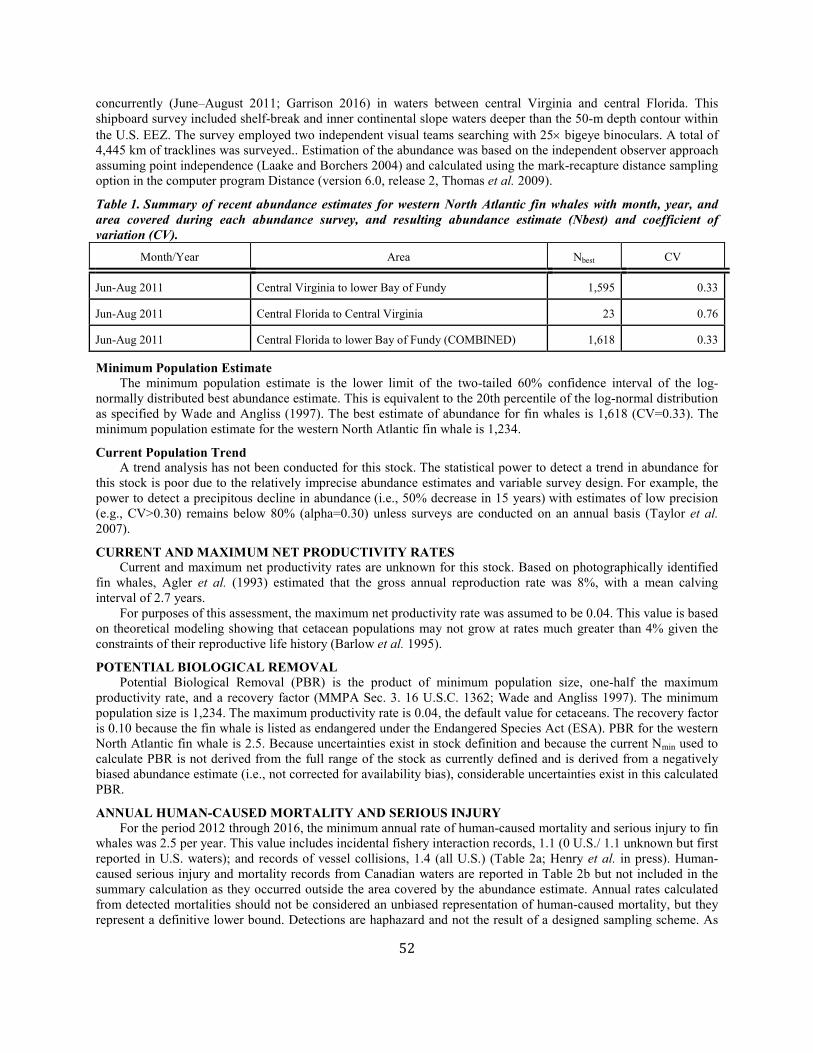
52
concurrently (June–August 2011; Garrison 2016) in waters between central Virginia and central Florida. This shipboard survey included shelf-break and inner continental slope waters deeper than the 50-m depth contour within the U.S. EEZ. The survey employed two independent visual teams searching with 25× bigeye binoculars. A total of 4,445 km of tracklines was surveyed.. Estimation of the abundance was based on the independent observer approach assuming point independence (Laake and Borchers 2004) and calculated using the mark-recapture distance sampling option in the computer program Distance (version 6.0, release 2, Thomas et al. 2009).
Table 1. Summary of recent abundance estimates for western North Atlantic fin whales with month, year, and area covered during each abundance survey, and resulting abundance estimate (Nbest) and coefficient of variation (CV).
Month/Year Area Nbest CV
Jun-Aug 2011 Central Virginia to lower Bay of Fundy 1,595 0.33
Jun-Aug 2011 Central Florida to Central Virginia 23 0.76
Jun-Aug 2011 Central Florida to lower Bay of Fundy (COMBINED) 1,618 0.33
Minimum Population Estimate The minimum population estimate is the lower limit of the two-tailed 60% confidence interval of the log-normally distributed best abundance estimate. This is equivalent to the 20th percentile of the log-normal distribution as specified by Wade and Angliss (1997). The best estimate of abundance for fin whales is 1,618 (CV=0.33). The minimum population estimate for the western North Atlantic fin whale is 1,234.
Current Population Trend A trend analysis has not been conducted for this stock. The statistical power to detect a trend in abundance for this stock is poor due to the relatively imprecise abundance estimates and variable survey design. For example, the power to detect a precipitous decline in abundance (i.e., 50% decrease in 15 years) with estimates of low precision (e.g., CV>0.30) remains below 80% (alpha=0.30) unless surveys are conducted on an annual basis (Taylor et al. 2007).
CURRENT AND MAXIMUM NET PRODUCTIVITY RATES Current and maximum net productivity rates are unknown for this stock. Based on photographically identified fin whales, Agler et al. (1993) estimated that the gross annual reproduction rate was 8%, with a mean calving interval of 2.7 years. For purposes of this assessment, the maximum net productivity rate was assumed to be 0.04. This value is based on theoretical modeling showing that cetacean populations may not grow at rates much greater than 4% given the constraints of their reproductive life history (Barlow et al. 1995).
POTENTIAL BIOLOGICAL REMOVAL Potential Biological Removal (PBR) is the product of minimum population size, one-half the maximum productivity rate, and a recovery factor (MMPA Sec. 3. 16 U.S.C. 1362; Wade and Angliss 1997). The minimum population size is 1,234. The maximum productivity rate is 0.04, the default value for cetaceans. The recovery factor is 0.10 because the fin whale is listed as endangered under the Endangered Species Act (ESA). PBR for the western North Atlantic fin whale is 2.5. Because uncertainties exist in stock definition and because the current Nmin used to calculate PBR is not derived from the full range of the stock as currently defined and is derived from a negatively biased abundance estimate (i.e., not corrected for availability bias), considerable uncertainties exist in this calculated PBR.
ANNUAL HUMAN-CAUSED MORTALITY AND SERIOUS INJURY For the period 2012 through 2016, the minimum annual rate of human-caused mortality and serious injury to fin whales was 2.5 per year. This value includes incidental fishery interaction records, 1.1 (0 U.S./ 1.1 unknown but first reported in U.S. waters); and records of vessel collisions, 1.4 (all U.S.) (Table 2a; Henry et al. in press). Human-caused serious injury and mortality records from Canadian waters are reported in Table 2b but not included in the summary calculation as they occurred outside the area covered by the abundance estimate. Annual rates calculated from detected mortalities should not be considered an unbiased representation of human-caused mortality, but they represent a definitive lower bound. Detections are haphazard and not the result of a designed sampling scheme. As
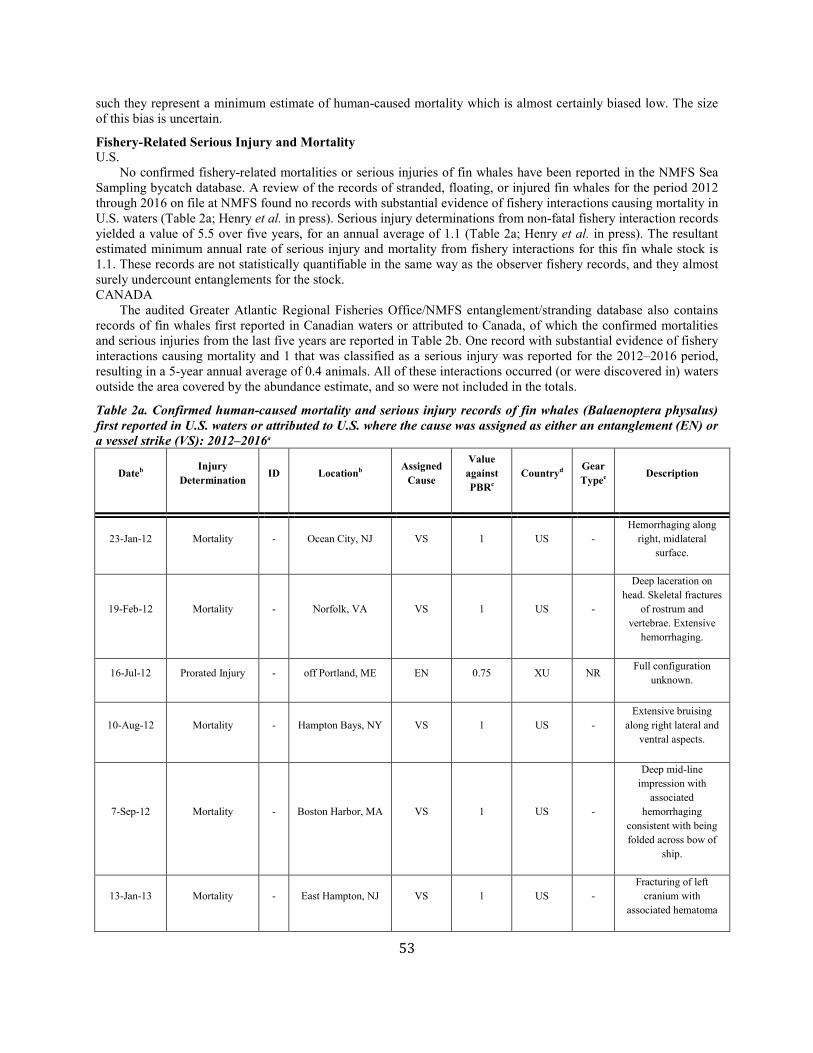
53
such they represent a minimum estimate of human-caused mortality which is almost certainly biased low. The size of this bias is uncertain.
Fishery-Related Serious Injury and Mortality U.S. No confirmed fishery-related mortalities or serious injuries of fin whales have been reported in the NMFS Sea Sampling bycatch database. A review of the records of stranded, floating, or injured fin whales for the period 2012 through 2016 on file at NMFS found no records with substantial evidence of fishery interactions causing mortality in U.S. waters (Table 2a; Henry et al. in press). Serious injury determinations from non-fatal fishery interaction records yielded a value of 5.5 over five years, for an annual average of 1.1 (Table 2a; Henry et al. in press). The resultant estimated minimum annual rate of serious injury and mortality from fishery interactions for this fin whale stock is 1.1. These records are not statistically quantifiable in the same way as the observer fishery records, and they almost surely undercount entanglements for the stock. CANADA The audited Greater Atlantic Regional Fisheries Office/NMFS entanglement/stranding database also contains records of fin whales first reported in Canadian waters or attributed to Canada, of which the confirmed mortalities and serious injuries from the last five years are reported in Table 2b. One record with substantial evidence of fishery interactions causing mortality and 1 that was classified as a serious injury was reported for the 2012–2016 period, resulting in a 5-year annual average of 0.4 animals. All of these interactions occurred (or were discovered in) waters outside the area covered by the abundance estimate, and so were not included in the totals.
Table 2a. Confirmed human-caused mortality and serious injury records of fin whales (Balaenoptera physalus) first reported in U.S. waters or attributed to U.S. where the cause was assigned as either an entanglement (EN) or a vessel strike (VS): 2012–2016a
Dateb Injury
Determination ID Locationb Assigned
Cause
Value against PBRc
Countryd Gear Typee Description
23-Jan-12 Mortality - Ocean City, NJ VS 1 US - Hemorrhaging along
right, midlateral surface.
19-Feb-12 Mortality - Norfolk, VA VS 1 US -
Deep laceration on head. Skeletal fractures
of rostrum and vertebrae. Extensive
hemorrhaging.
16-Jul-12 Prorated Injury - off Portland, ME EN 0.75 XU NR Full configuration unknown.
10-Aug-12 Mortality - Hampton Bays, NY VS 1 US - Extensive bruising
along right lateral and ventral aspects.
7-Sep-12 Mortality - Boston Harbor, MA VS 1 US -
Deep mid-line impression with
associated hemorrhaging
consistent with being folded across bow of
ship.
13-Jan-13 Mortality - East Hampton, NJ VS 1 US - Fracturing of left
cranium with associated hematoma
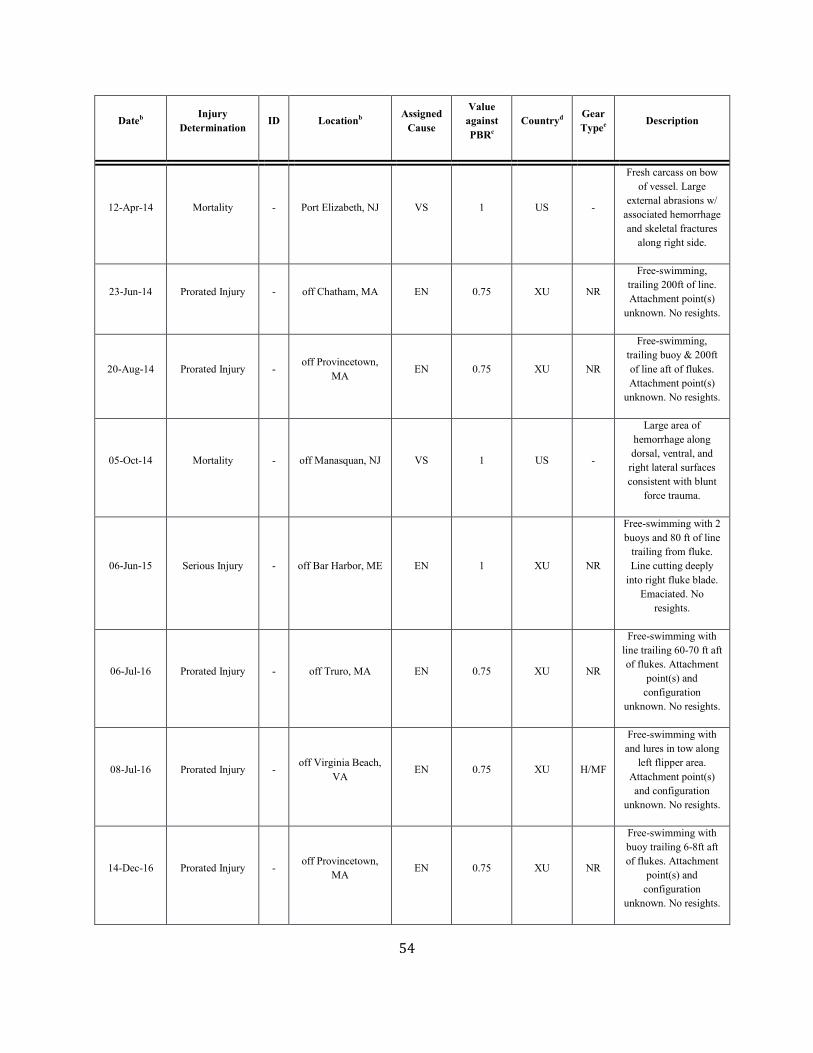
54
Dateb Injury Determination
ID Locationb Assigned Cause
Value against PBRc
Countryd Gear Typee
Description
12-Apr-14 Mortality - Port Elizabeth, NJ VS 1 US -
Fresh carcass on bow of vessel. Large
external abrasions w/ associated hemorrhage and skeletal fractures
along right side.
23-Jun-14 Prorated Injury - off Chatham, MA EN 0.75 XU NR
Free-swimming, trailing 200ft of line. Attachment point(s)
unknown. No resights.
20-Aug-14 Prorated Injury - off Provincetown,
MA EN 0.75 XU NR
Free-swimming, trailing buoy & 200ft of line aft of flukes. Attachment point(s)
unknown. No resights.
05-Oct-14 Mortality - off Manasquan, NJ VS 1 US -
Large area of hemorrhage along dorsal, ventral, and
right lateral surfaces consistent with blunt
force trauma.
06-Jun-15 Serious Injury - off Bar Harbor, ME EN 1 XU NR
Free-swimming with 2 buoys and 80 ft of line
trailing from fluke. Line cutting deeply
into right fluke blade. Emaciated. No
resights.
06-Jul-16 Prorated Injury - off Truro, MA EN 0.75 XU NR
Free-swimming with line trailing 60-70 ft aft of flukes. Attachment
point(s) and configuration
unknown. No resights.
08-Jul-16 Prorated Injury - off Virginia Beach,
VA EN 0.75 XU H/MF
Free-swimming with and lures in tow along
left flipper area. Attachment point(s) and configuration
unknown. No resights.
14-Dec-16 Prorated Injury - off Provincetown, MA EN 0.75 XU NR
Free-swimming with buoy trailing 6-8ft aft of flukes. Attachment
point(s) and configuration
unknown. No resights.
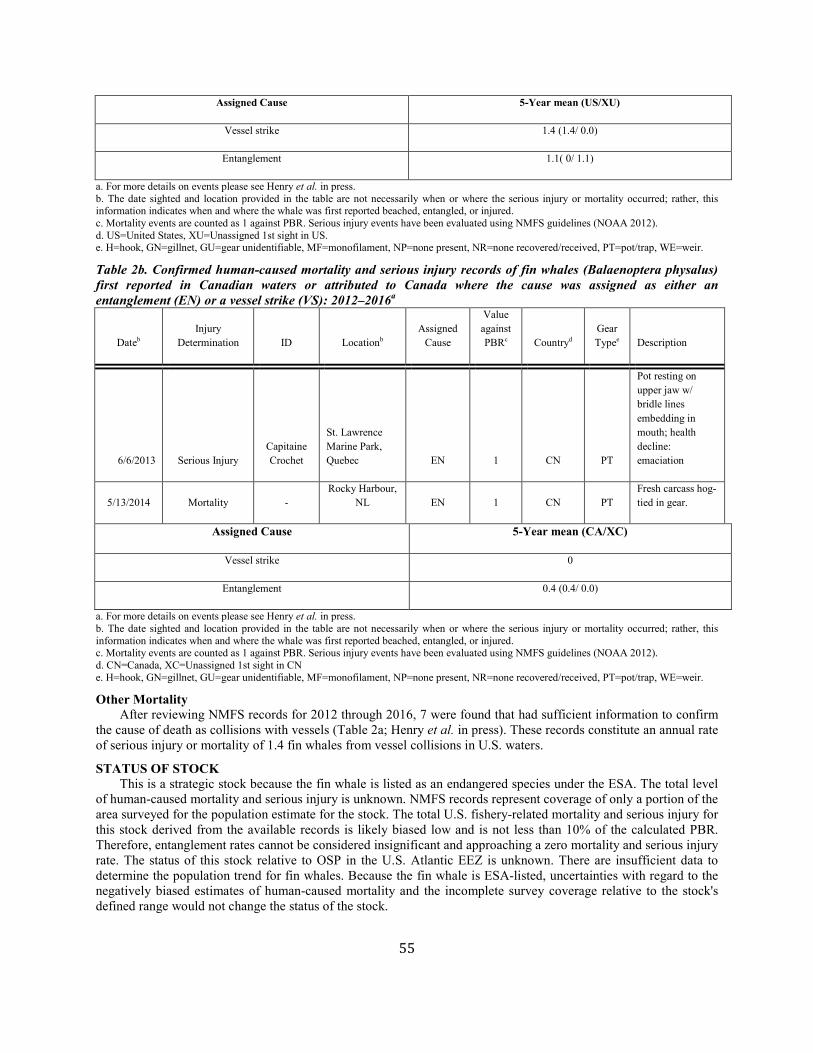
55
Assigned Cause 5-Year mean (US/XU)
Vessel strike 1.4 (1.4/ 0.0)
Entanglement 1.1( 0/ 1.1)
a. For more details on events please see Henry et al. in press. b. The date sighted and location provided in the table are not necessarily when or where the serious injury or mortality occurred; rather, this information indicates when and where the whale was first reported beached, entangled, or injured. c. Mortality events are counted as 1 against PBR. Serious injury events have been evaluated using NMFS guidelines (NOAA 2012). d. US=United States, XU=Unassigned 1st sight in US. e. H=hook, GN=gillnet, GU=gear unidentifiable, MF=monofilament, NP=none present, NR=none recovered/received, PT=pot/trap, WE=weir.
Table 2b. Confirmed human-caused mortality and serious injury records of fin whales (Balaenoptera physalus) first reported in Canadian waters or attributed to Canada where the cause was assigned as either an entanglement (EN) or a vessel strike (VS): 2012–2016a
Dateb Injury
Determination ID Locationb Assigned
Cause
Value against PBRc Countryd
Gear Typee Description
6/6/2013 Serious Injury Capitaine Crochet
St. Lawrence Marine Park, Quebec EN 1 CN PT
Pot resting on upper jaw w/ bridle lines embedding in mouth; health decline: emaciation
5/13/2014 Mortality - Rocky Harbour,
NL EN 1 CN PT Fresh carcass hog-tied in gear.
Assigned Cause 5-Year mean (CA/XC)
Vessel strike 0
Entanglement 0.4 (0.4/ 0.0)
a. For more details on events please see Henry et al. in press. b. The date sighted and location provided in the table are not necessarily when or where the serious injury or mortality occurred; rather, this information indicates when and where the whale was first reported beached, entangled, or injured. c. Mortality events are counted as 1 against PBR. Serious injury events have been evaluated using NMFS guidelines (NOAA 2012). d. CN=Canada, XC=Unassigned 1st sight in CN e. H=hook, GN=gillnet, GU=gear unidentifiable, MF=monofilament, NP=none present, NR=none recovered/received, PT=pot/trap, WE=weir.
Other Mortality After reviewing NMFS records for 2012 through 2016, 7 were found that had sufficient information to confirm the cause of death as collisions with vessels (Table 2a; Henry et al. in press). These records constitute an annual rate of serious injury or mortality of 1.4 fin whales from vessel collisions in U.S. waters.
STATUS OF STOCK This is a strategic stock because the fin whale is listed as an endangered species under the ESA. The total level of human-caused mortality and serious injury is unknown. NMFS records represent coverage of only a portion of the area surveyed for the population estimate for the stock. The total U.S. fishery-related mortality and serious injury for this stock derived from the available records is likely biased low and is not less than 10% of the calculated PBR. Therefore, entanglement rates cannot be considered insignificant and approaching a zero mortality and serious injury rate. The status of this stock relative to OSP in the U.S. Atlantic EEZ is unknown. There are insufficient data to determine the population trend for fin whales. Because the fin whale is ESA-listed, uncertainties with regard to the negatively biased estimates of human-caused mortality and the incomplete survey coverage relative to the stock's defined range would not change the status of the stock.
56
REFERENCES CITED Agler, B.A., R.L. Schooley, S.E. Frohock, S.K. Katona and I.E. Seipt. 1993. Reproduction of photographically
identified fin whales, Balaenoptera physalus, from the Gulf of Maine. J. Mamm. 73:577–587. Barlow, J., S.L. Swartz, T.C. Eagle and P.R. Wade. 1995. U.S. marine mammal stock assessments: Guidelines for
preparation, background, and a summary of the 1995 assessments. NOAA Tech. Memo. NMFS-OPR-6. 73 pp.
Bérubé, M., A. Aguilar, D. Dendanto, F. Larsen, G.N.di Sciara, R. Sears, J. Sigurjónsson, J. Urban-R. and P.J. Palsbøll. 1998. Population genetic structure of North Atlantic, Mediterranean and Sea of Cortez fin whales, Balaenoptera physalus (Linnaeus 1758): analysis of mitochondrial and nuclear loci. Mol. Ecol. 15:585–599.
CETAP. 1982. A characterization of marine mammals and turtles in the mid- and North Atlantic areas of the U.S. outer continental shelf, final report, Cetacean and Turtle Assessment Program, University of Rhode Island. Bureau of Land Management, Washington, DC. #AA551-CT8-48. 576 pp.
Clapham, P.J. and I.E. Seipt. 1991. Resightings of independent fin whales, Balaenoptera physalus, on maternal summer ranges. J. Mamm. 72:788–790.
Clark, C.W. 1995. Application of U.S. Navy underwater hydrophone arrays for scientific research on whales. Rep. Int. Whal. Comm. 45:210–212.
Clark, C.W., and Gagnon, G.C. 2002. Low-frequency vocal behaviors of baleen whales in the North Atlantic: Insights from IUSS detections, locations and tracking from 1992 to 1996. J. Underwater Acoust. (US Navy), 52 (3):609-640.
Donovan, G.P. 1991. A review of IWC stock boundaries. Rep. Int. Whal. Comm. (Special Issue) 13:39–68. Edwards, E.F., C. Hall, T.J. Moore, C. Sheredy and J. Redfern. 2015. Global distribution of fin whales
(Balaenoptera physalus) in the post-whaling era (1980 to 2012). Mammal Rev. 45:197–214 Garrison, L.P. 2016. Abundance of marine mammals in waters of the U.S. East Coast during summer
2011. Southeast Fisheries Science Center, Protected Resources and Biodiversity Division, 75 Virginia Beach Dr., Miami, FL 33140. PRBD Contribution # PRBD-2016-08, 21 pp.
Hain, J.H.W., M.J. Ratnaswamy, R.D. Kenney and H.E. Winn. 1992. The fin whale, Balaenoptera physalus, in waters of the northeastern United States continental shelf. Rep. Int. Whal. Comm. 42:653–669.
Henry, A.G., T.V.N. Cole, L. Hall, W. Ledwell, D. Morin, and A. Reid. in press. Mortality determinations for baleen whale stocks along the Gulf of Mexico, United States East Coast and Atlantic Canadian Provinces, 2012–2016. Northeast Fish. Sci. Cent. Ref. Doc. xx-xx. xx pp.
Kellogg, R. 1929. What is known of the migration of some of the whalebone whales. Ann. Rep. Smithsonian Inst. 1928:467–494.
Kenney, R.D., G.P. Scott, T.J. Thompson and H.E. Winn. 1997. Estimates of prey consumption and trophic impacts of cetaceans in the USA northeast continental shelf ecosystem. J. Northw. Atl. Fish. Sci. 22:155–171.
Laake, J.L., J. Calambokidis, S.D. Osmek and D.J. Rugh. 1997. Probability of detecting harbor porpoise from aerial surveys: estimating g (0). J. Wildl. Manage. 61:63–75.
Laake, J.L., and D.L. Borchers. 2004. Methods for incomplete detection at distance zero, Pages 108-189 in: S.T. Buckland, D.R. Andersen, K.P. Burnham, J.L. Laake and L. Thomas (eds.), Advanced distance sampling, Oxford University Press, New York, NY.
Lawson, J.W., and J.-F. Gosselin. 2009. Distribution and preliminary abundance estimates for cetaceans seen during Canada’s Marine Megafauna Survey - A component of the 2007 TNASS. Can. Sci. Advisory Sec. Res. Doc. 2009/031. 33 pp.
Lawson, J.W., and J.-F. Gosselin 2011. Fully-corrected cetacean abundance estimates from the Canadian TNASS survey. Working Paper 10. National Marine Mammal Peer Review Meeting. Ottawa, Canada. 28 pp.
Mizroch, S.A., D.W. Rice and J.M. Breiwick. 1984. The fin whale, Balaenoptera physalus. Mar. Fish. Rev. 46:20–24.
Morano, J.L., D.P. Salisbury, A.N. Rice, K.L. Conklin, K.L. Falk and C.W. Clark. 2012. Seasonal changes in fin whale (Balaenoptera physalus) 20-Hz song in the Western North Atlantic Ocean. J. Acoust. Soc. Am. 132:1207–1212.
Olsen, M. T., C. Pampoulie, A.K. Daníelsdóttir, E. Lidh, M. Bérubé, G.A. Víkingsson, and P.J. Palsbøll. 2014. Fin whale MDH-1 and MPI allozyme variation is not reflected in the corresponding DNA sequences. Ecol. Evol. 4:1787–1803. doi: 10.1002/ece3.1046

57
NMFS (National Marine Fisheries Service). 2016. Guidelines for preparing stock assessment reports pursuant to the 1994 amendments to the Marine Mammal Protection Act. 23 p. Available online: http://www.nmfs.noaa.gov/pr/sars/pdf/gamms2016.pdf. Accessed July 2017.
Palka, D.L. 2012. Cetacean abundance estimates in US northwestern Atlantic Ocean waters from summer 2011 line transect survey. Northeast Fish. Sci. Cent. Ref. Doc. 12-29. 37 pp.
http://www.nefsc.noaa.gov/nefsc/publications/crd/crd1229/ Palka, D.L., and P.S. Hammond. 2001. Accounting for responsive movement in line transect estimates of
abundance. Can. J. Fish. Aquat. Sci 58:777–787. Pampoulie, C., A. Danielsdottir, M. Berube, P. Palsbøll, A. Arnarson, T. Gunnlaugsson, D. Olafsdottir, N. Øien, L.
Witting and G. Vikingsson. 2008. Lack of genetic divergence among samples of the north Atlantic fin whale collected at feeding grounds; congruence among microsatellite loci and mtDNA in the new Icelandic dataset. Unpublished Scientific Committee meeting document SC/60/PFI11. International Whaling Commission, Cambridge, UK.
Seipt, I.E., P.J. Clapham, C.A. Mayo and M.P. Hawvermale. 1990. Population characteristics of individually identified fin whales Balaenoptera physalus in Massachusetts Bay. Fish. Bull. 88:271–278.
Taylor, B.L., M. Martinez, T. Gerrodette, J. Barlow and Y.N. Hrovat. 2007. Lessons from monitoring trends in abundance in marine mammals. Mar. Mamm. Sci. 23:157–175.
Thomas L, J.L. Laake, E. Rexstad, S. Strindberg, F.F.C. Marques, S.T. Buckland, D.L. Borchers, D.R. Anderson, K.P. Burnham, M.L. Burt, S.L. Hedley, J.H. Pollard, J.R.B. Bishop and T.A. Marques. 2009. Distance 6.0. Release 2. [Internet]. University of St. Andrews, Research Unit for Wildlife Population Assessment, St. Andrews, UK. Available from: http://distancesampling.org/Distance/.
Wade, P.R., and R.P. Angliss. 1997. Guidelines for assessing marine mammal stocks: Report of the GAMMS Workshop April 3-5, 1996, Seattle, Washington. NOAA Tech. Memo. NMFS-OPR-12. 93 pp.
Watkins, W.A., P. Tyack,K.E. Moore and J.E. Bird. 1987. The 20-Hz signals of finback whales (Balaenoptera physalus). J. Acoust. Soc. Am. 82:1901–1912.
Watkins, W.A., M.A. Daher, G.M. Reppucci, J.E. George, D.L. Martin, N.A. DiMarzio and D.P. Gannon. 2000. Seasonality and distribution of whale calls in the North Pacific. Oceanography 13:62–67.

58
February 2019
COMMON MINKE WHALE (Balaenoptera acutorostrata acutorostrata): Canadian East Coast Stock
STOCK DEFINITION AND GEOGRAPHIC RANGE Minke whales have a cosmopolitan distribution in temperate, tropical and high-latitude waters. They are common and widely distributed within the U.S. Atlantic Exclusive Economic Zone (EEZ) (CETAP 1982). There appears to be a strong seasonal component to minke whale distribution on both the continental shelf and in deeper, off-shelf waters. Spring to fall are times of relatively widespread and common acoustic occurrence on the shelf (e.g., Risch et al. 2013), while September through April is the period of highest acoustic occurrence in deep-ocean waters throughout most of the western North Atlantic (Clark and Gagnon 2002; Risch et al. 2014). In New England waters the whales are most abundant during the spring-fall period. Records based on visual sightings and summarized by Mitchell (1991) hinted at a possible winter distribution in the West Indies, and in the mid-ocean south and east of Bermuda, a suggestion that has been validated by acoustic detections throughout broad ocean areas off the Caribbean from late September through early June (Clark and Gagnon 2002; Risch et al. 2014). In the North Atlantic, there are four recognized populations—Canadian East Coast, west Greenland, central North Atlantic, and northeastern North Atlantic (Donovan 1991). These divisions were defined by examining segregation by sex and length, catch distributions, sightings, marking data, and pre-existing ICES boundaries. However, there were very few data from the Canadian East Coast population. Anderwald et al. (2011) found no evidence for geographic structure comparing these putative populations but did, using individual genotypes and likelihood assignment methods, identify two cryptic stocks distributed across the North Atlantic. Until better information is available, common minke whales off the eastern coast of the United States are considered to be part of the Canadian East Coast stock, which inhabits the area from the western half of the Davis Strait (45ºW) to the Gulf of Mexico. In summary, key uncertainties about stock structure are due to the limited understanding of the distribution, movements, and genetic structure of this stock. It is unknown whether the stock may contain multiple demographically independent populations that should be separate stocks. To date, no analyses of stock structure within this stock have been performed.
Figure 1. Distribution of minke whale sightings from NEFSC and SEFSC shipboard and aerial surveys during the summers of 1995, 1998, 1999, 2002, 2004, 2006, 2007, 2008, 2010, and 2011and DFO’s 2007 TNASS survey. Isobaths are the 100-m, 1000-m and 4000-m depth contours.
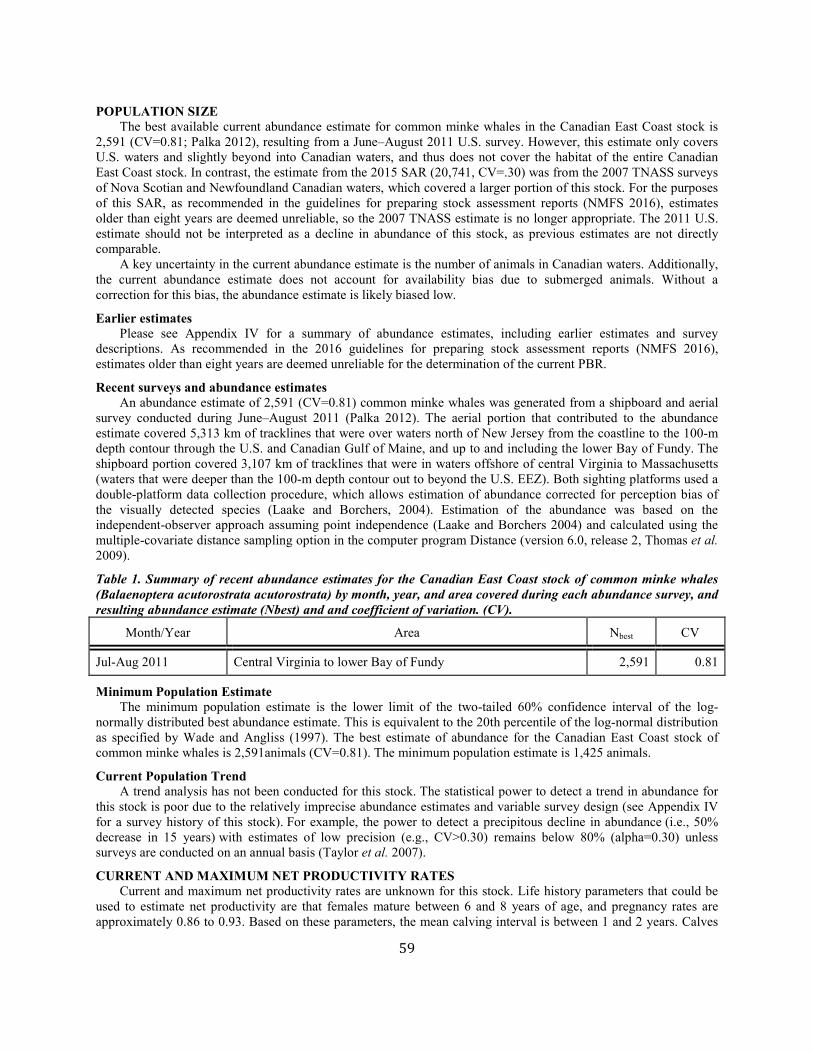
59
POPULATION SIZE The best available current abundance estimate for common minke whales in the Canadian East Coast stock is 2,591 (CV=0.81; Palka 2012), resulting from a June–August 2011 U.S. survey. However, this estimate only covers U.S. waters and slightly beyond into Canadian waters, and thus does not cover the habitat of the entire Canadian East Coast stock. In contrast, the estimate from the 2015 SAR (20,741, CV=.30) was from the 2007 TNASS surveys of Nova Scotian and Newfoundland Canadian waters, which covered a larger portion of this stock. For the purposes of this SAR, as recommended in the guidelines for preparing stock assessment reports (NMFS 2016), estimates older than eight years are deemed unreliable, so the 2007 TNASS estimate is no longer appropriate. The 2011 U.S. estimate should not be interpreted as a decline in abundance of this stock, as previous estimates are not directly comparable. A key uncertainty in the current abundance estimate is the number of animals in Canadian waters. Additionally, the current abundance estimate does not account for availability bias due to submerged animals. Without a correction for this bias, the abundance estimate is likely biased low.
Earlier estimates Please see Appendix IV for a summary of abundance estimates, including earlier estimates and survey descriptions. As recommended in the 2016 guidelines for preparing stock assessment reports (NMFS 2016), estimates older than eight years are deemed unreliable for the determination of the current PBR.
Recent surveys and abundance estimates An abundance estimate of 2,591 (CV=0.81) common minke whales was generated from a shipboard and aerial survey conducted during June–August 2011 (Palka 2012). The aerial portion that contributed to the abundance estimate covered 5,313 km of tracklines that were over waters north of New Jersey from the coastline to the 100-m depth contour through the U.S. and Canadian Gulf of Maine, and up to and including the lower Bay of Fundy. The shipboard portion covered 3,107 km of tracklines that were in waters offshore of central Virginia to Massachusetts (waters that were deeper than the 100-m depth contour out to beyond the U.S. EEZ). Both sighting platforms used a double-platform data collection procedure, which allows estimation of abundance corrected for perception bias of the visually detected species (Laake and Borchers, 2004). Estimation of the abundance was based on the independent-observer approach assuming point independence (Laake and Borchers 2004) and calculated using the multiple-covariate distance sampling option in the computer program Distance (version 6.0, release 2, Thomas et al. 2009).
Table 1. Summary of recent abundance estimates for the Canadian East Coast stock of common minke whales (Balaenoptera acutorostrata acutorostrata) by month, year, and area covered during each abundance survey, and resulting abundance estimate (Nbest) and and coefficient of variation. (CV).
Month/Year Area Nbest CV
Jul-Aug 2011 Central Virginia to lower Bay of Fundy 2,591 0.81
Minimum Population Estimate The minimum population estimate is the lower limit of the two-tailed 60% confidence interval of the log-normally distributed best abundance estimate. This is equivalent to the 20th percentile of the log-normal distribution as specified by Wade and Angliss (1997). The best estimate of abundance for the Canadian East Coast stock of common minke whales is 2,591animals (CV=0.81). The minimum population estimate is 1,425 animals.
Current Population Trend A trend analysis has not been conducted for this stock. The statistical power to detect a trend in abundance for this stock is poor due to the relatively imprecise abundance estimates and variable survey design (see Appendix IV for a survey history of this stock). For example, the power to detect a precipitous decline in abundance (i.e., 50% decrease in 15 years) with estimates of low precision (e.g., CV>0.30) remains below 80% (alpha=0.30) unless surveys are conducted on an annual basis (Taylor et al. 2007).
CURRENT AND MAXIMUM NET PRODUCTIVITY RATES Current and maximum net productivity rates are unknown for this stock. Life history parameters that could be used to estimate net productivity are that females mature between 6 and 8 years of age, and pregnancy rates are approximately 0.86 to 0.93. Based on these parameters, the mean calving interval is between 1 and 2 years. Calves

60
are probably born during October to March after 10 to 11 months gestation and nursing lasts for less than 6 months. Maximum ages are not known, but for Southern Hemisphere minke whales maximum age appears to be about 50 years (IWC 1991). For purposes of this assessment, the maximum net productivity rate was assumed to be 0.04. This value is based on theoretical modeling showing that cetacean populations may not grow at rates much greater than 4% given the constraints of their reproductive life history (Barlow et al. 1995). Key uncertainties about the maximum net productivity rate are due to the limited understanding of the stock-specific life history parameters; thus the default value was used.
POTENTIAL BIOLOGICAL REMOVAL Potential Biological Removal (PBR) is the product of minimum population size, one-half the maximum productivity rate, and a recovery factor (MMPA Sec. 3. 16 U.S.C. 1362; Wade and Angliss 1997). The minimum population size is 1,425. The maximum productivity rate is 0.04, the default value for cetaceans. The recovery factor is 0.5, the default value for stocks of unknown status relative to OSP and with the CV of the average mortality estimate less than 0.3 (Wade and Angliss 1997). PBR for the Canadian east coast common minke whale is 14.
ANNUAL HUMAN-CAUSED MORTALITY AND SERIOUS INJURY During 2012 to 2016, the average annual minimum detected human-caused mortality and serious injury was 7.7 minke whales per year, which is the sum of 6.5 (1.5 U.S./2.35 Canada/2.3 unassigned but first reported in the U.S./0.35 unassigned but first reported in Canada) minke whales per year (unknown CV) from U.S. and Canadian fisheries using strandings and entanglement data, 1.0 (0.6 U.S./0.4 Canada) per year from vessel strikes, and 0.2 takes in observed U.S. fishing gear. Data to estimate the mortality and serious injury of common minke whales come from the Northeast Fisheries Science Center Observer Program, the At-Sea Monitor Program, and from records of strandings and entanglements in U.S. and Canadian waters. For the purposes of this report, mortalities and serious injuries from reports of strandings and entanglements considered to be confirmed human-caused mortalities or serious injuries are shown in Table 2 while those recorded by the Observer or At-Sea Monitor Programs are shown in Table 3. A key uncertainty in the estimate of the annual human-caused mortality and serious injury for this stock, along with other large whales, is due to using strandings and entanglement data as the primary data source. Detected interactions in the strandings and entanglement data should not be considered an unbiased representation of human-caused mortality. Detections are haphazard and not the result of a designed sampling scheme. As such they represent a minimum estimate, which is almost certainly biased low.
Fishery Information Detailed fishery information is reported in Appendix III.
Earlier Interactions See Appendix V for information on historical takes. U.S.
Northeast Mid-water Trawl Fishery (Including Pair Trawl) In July 2013, one minke whale was observed dead in the mid-water otter trawl fishery on Georges Bank. This animal was too decomposed to have been taken in a haul that was only 3 hours long. Annual average estimated minke whale mortality and serious injury from the mid-Atlantic mid-water trawl (including pair trawl) during 2012 to 2016 was 0.
Mid-Atlantic Gillnet In December 2016 one minke whale mortality was observed mid-Atlantic gillnet gear. Annual average estimated minke whale mortality and serious injury from the mid-Atlantic sink gillnet during 2012 to 2016 was 0.2.
Other Fisheries Confirmed mortalities and serious injuries of common minke whales in the last five years as recorded in the audited Greater Atlantic Regional Office/NMFS entanglement/stranding database are reported in Table 2. During 2012 to 2016, as determined from stranding and entanglement records confirmed to be of U.S. origin or first sighted in U.S. waters, yielded a minimum detected average annual mortality and serious injury of 3.8 common minke whales per year in U.S. fisheries (Table 2a). Most cases in which gear was recovered and identified involved gillnet or pot/trap gear.
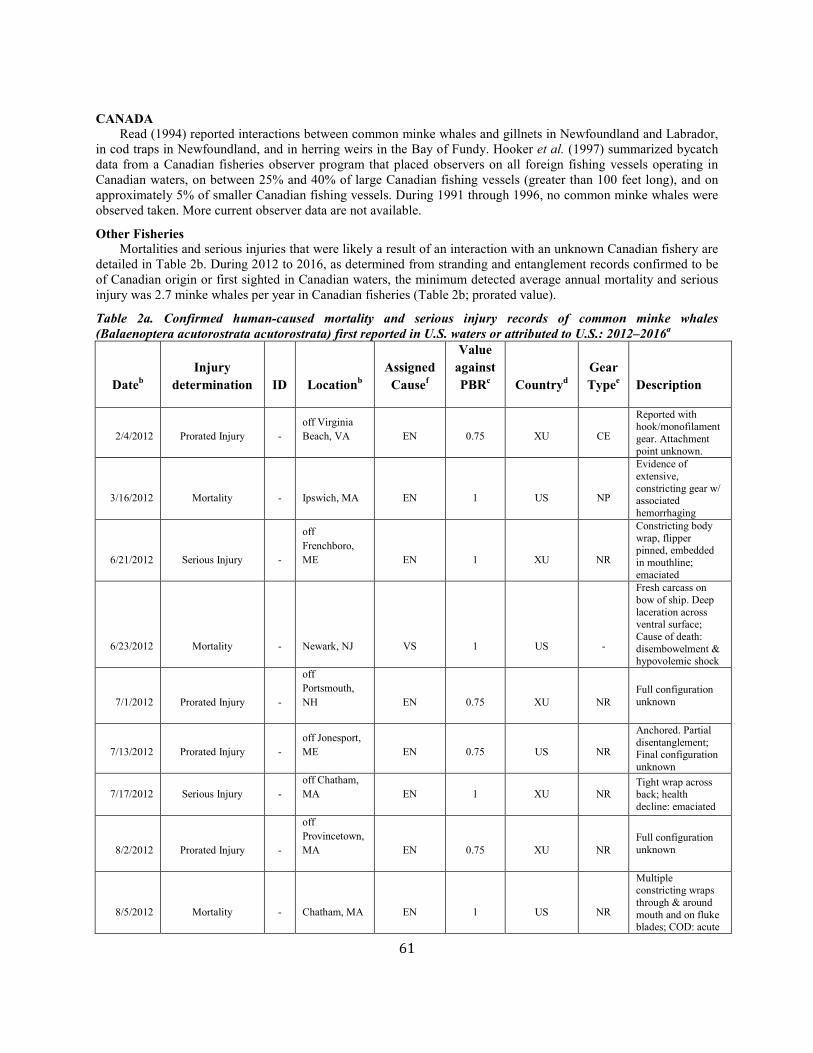
61
CANADA Read (1994) reported interactions between common minke whales and gillnets in Newfoundland and Labrador, in cod traps in Newfoundland, and in herring weirs in the Bay of Fundy. Hooker et al. (1997) summarized bycatch data from a Canadian fisheries observer program that placed observers on all foreign fishing vessels operating in Canadian waters, on between 25% and 40% of large Canadian fishing vessels (greater than 100 feet long), and on approximately 5% of smaller Canadian fishing vessels. During 1991 through 1996, no common minke whales were observed taken. More current observer data are not available.
Other Fisheries Mortalities and serious injuries that were likely a result of an interaction with an unknown Canadian fishery are detailed in Table 2b. During 2012 to 2016, as determined from stranding and entanglement records confirmed to be of Canadian origin or first sighted in Canadian waters, the minimum detected average annual mortality and serious injury was 2.7 minke whales per year in Canadian fisheries (Table 2b; prorated value).
Table 2a. Confirmed human-caused mortality and serious injury records of common minke whales (Balaenoptera acutorostrata acutorostrata) first reported in U.S. waters or attributed to U.S.: 2012–2016a
Dateb Injury
determination ID Locationb Assigned
Causef
Value against PBRc Countryd
Gear Typee Description
2/4/2012 Prorated Injury - off Virginia Beach, VA EN 0.75 XU CE
Reported with hook/monofilament gear. Attachment point unknown.
3/16/2012 Mortality - Ipswich, MA EN 1 US NP
Evidence of extensive, constricting gear w/ associated hemorrhaging
6/21/2012 Serious Injury -
off Frenchboro, ME EN 1 XU NR
Constricting body wrap, flipper pinned, embedded in mouthline; emaciated
6/23/2012 Mortality - Newark, NJ VS 1 US -
Fresh carcass on bow of ship. Deep laceration across ventral surface; Cause of death: disembowelment & hypovolemic shock
7/1/2012 Prorated Injury -
off Portsmouth, NH EN 0.75 XU NR
Full configuration unknown
7/13/2012 Prorated Injury - off Jonesport, ME EN 0.75 US NR
Anchored. Partial disentanglement; Final configuration unknown
7/17/2012 Serious Injury - off Chatham, MA EN 1 XU NR
Tight wrap across back; health decline: emaciated
8/2/2012 Prorated Injury -
off Provincetown, MA EN 0.75 XU NR
Full configuration unknown
8/5/2012 Mortality - Chatham, MA EN 1 US NR
Multiple constricting wraps through & around mouth and on fluke blades; COD: acute

62
Dateb Injury
determination ID Locationb Assigned
Causef
Value against PBRc Countryd
Gear Typee Description
underwater entrapment
10/4/2012 Mortality - Cliff Island, ME EN 1 US NR
Evidence of constricting gear at mouthline, across ventral pleats, & at peduncle
7/23/2013 Prorated Injury - off Newport, RI EN 0.75 XU NR Full configuration
unknown
8/17/2013 Serious Injury -
off Newburyport, MA EN 1 XU NR
Constricting rostrum wrap cutting into upper lip
10/04/2013 Prorated Injury - off Seal Harbor, ME EN 0.75 US NR
Anchored, partially disentangled, final configuration unknown
6/9/2014 Mortality -
off Truro, MA EN 1 US PT Fresh carcass anchored, hog-tied in gear. COD: peracute underwater entrapment.
7/10/2014 Prorated Injury -
S of Bristol, ME EN 0.75 XU NR
Free-swimming, trailing 2 buoys. Attachment point(s) unknown.
7/12/2014 Serious Injury
-
South Shinnecock Inlet, NY
EN 1 XU NR
Free-swimming with yellow plastic strapping cutting into top and sides of rostrum. No trailing gear.
7/17/2014 Mortality
-
South Addison, ME EN 1 XU NP
Fresh carcass with line impression across ventral surface & evidence of constricting gear around peduncle and fluke insertion. Bruising evident at fluke injuries. No gear present.
12/24/2014 Mortality
-
Dam Neck, VA
VS 1 US -
Fresh carcass with broken ribs & fractured vertebrae w/ extensive hemorrhage & edema.
03/26/2015 Serious Injury - off Cape Canaveral, FL EN 1 XU NR
Evidence of constricting rostrum wrap, but unable to determine if gear still present. Emaciated.
05/09/2015 Mortality - Duck, NC EN 1 XU GU
Live stranded and euthanized. Embedded gear cutting into bone of mandible. Emaciated.

63
Dateb Injury
determination ID Locationb Assigned
Causef
Value against PBRc Countryd
Gear Typee Description
Proximate COD: entanglement. Ultimate COD: euthanasia.
06/06/2015 Mortality - Coney Island, NY VS 1 US -
Fresh carcass with deep lacerations to throat area and head missing. Large area of bruising on dorsal surface.
06/14/2015 Prorated Injury - off Chatham, MA
EN .75 XU NR
Free-swimming with acorn buoy trailing 20-30 ft. Attachment point(s) and configuration unknown.
09/01/2015 Mortality - Gloucester, MA EN 1 US NP
Evidence of extensive, constricting gear with associated hemorrhaging. No gear present.
03-May-16 Mortality - Biddeford, ME EN 1 US PT
Carcass in gear. Line through mouth and evidence of constricting wraps on ventral pleats and peduncle with associated hemorrhaging.
Assigned Cause 5-Year mean (US/XU)
Vessel strike (US/ XU) 0.6 (0.6/ 0.00)
Entanglement (US/ XU) 3.8 (1.5/ 2.3)
a. For more details on events please see Henry et al. in press. b. The date sighted and location provided in the table are not necessarily when or where the serious injury or mortality occurred; rather, this information indicates when and where the whale was first reported beached, entangled, or injured. c. Mortality events are counted as 1 against PBR. Serious injury events have been evaluated using NMFS guidelines (NOAA 2012). d. US=United States, XU=Unassigned 1st sight in US. e. H=hook, GN=gillnet, GU=gear unidentifiable, MF=monofilament, NP=none present, NR=none recovered/received, PT=pot/trap, WE=weir. f. Assigned cause: EN=entanglement, VS=vessel strike, ET=entrapment (summed with entanglement).
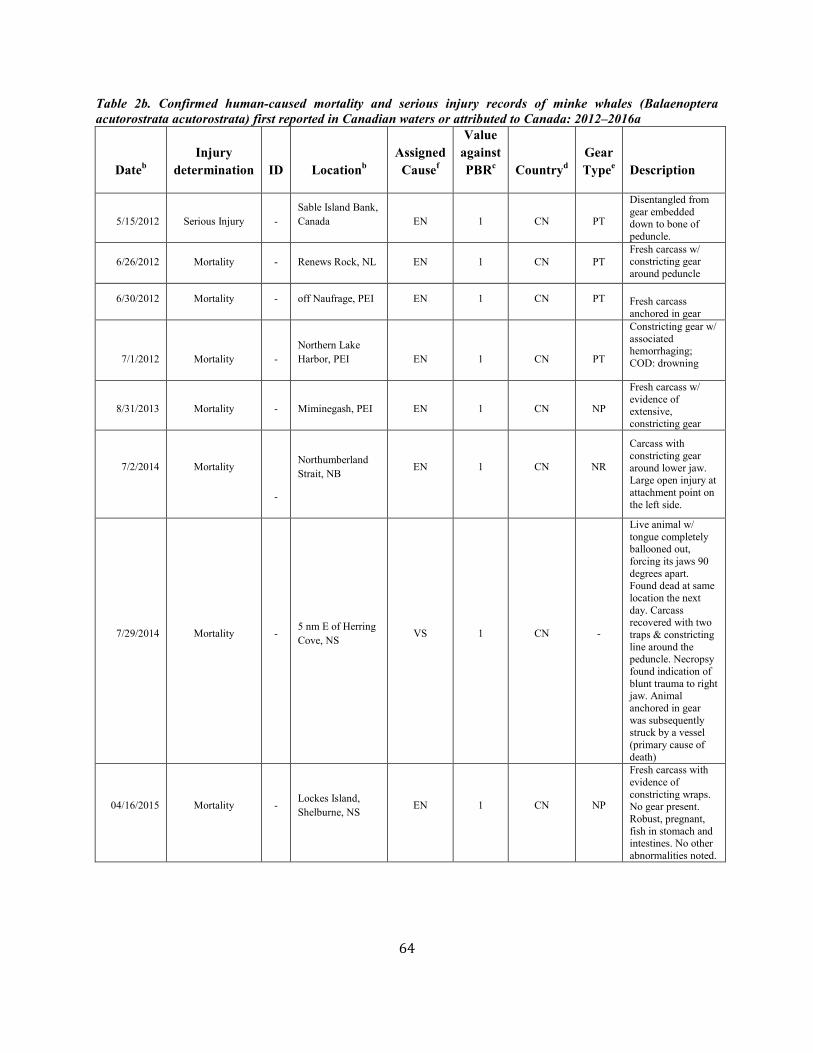
64
Table 2b. Confirmed human-caused mortality and serious injury records of minke whales (Balaenoptera acutorostrata acutorostrata) first reported in Canadian waters or attributed to Canada: 2012–2016a
Dateb Injury
determination ID Locationb Assigned
Causef
Value against PBRc Countryd
Gear Typee Description
5/15/2012 Serious Injury - Sable Island Bank, Canada EN 1 CN PT
Disentangled from gear embedded down to bone of peduncle.
6/26/2012 Mortality - Renews Rock, NL EN 1 CN PT Fresh carcass w/ constricting gear around peduncle
6/30/2012 Mortality - off Naufrage, PEI EN 1 CN PT Fresh carcass anchored in gear
7/1/2012 Mortality - Northern Lake Harbor, PEI EN 1 CN PT
Constricting gear w/ associated hemorrhaging; COD: drowning
8/31/2013 Mortality - Miminegash, PEI EN 1 CN NP
Fresh carcass w/ evidence of extensive, constricting gear
7/2/2014 Mortality
-
Northumberland Strait, NB EN 1 CN NR
Carcass with constricting gear around lower jaw. Large open injury at attachment point on the left side.
7/29/2014 Mortality - 5 nm E of Herring Cove, NS VS 1 CN -
Live animal w/ tongue completely ballooned out, forcing its jaws 90 degrees apart. Found dead at same location the next day. Carcass recovered with two traps & constricting line around the peduncle. Necropsy found indication of blunt trauma to right jaw. Animal anchored in gear was subsequently struck by a vessel (primary cause of death)
04/16/2015 Mortality - Lockes Island, Shelburne, NS EN 1 CN NP
Fresh carcass with evidence of constricting wraps. No gear present. Robust, pregnant, fish in stomach and intestines. No other abnormalities noted.
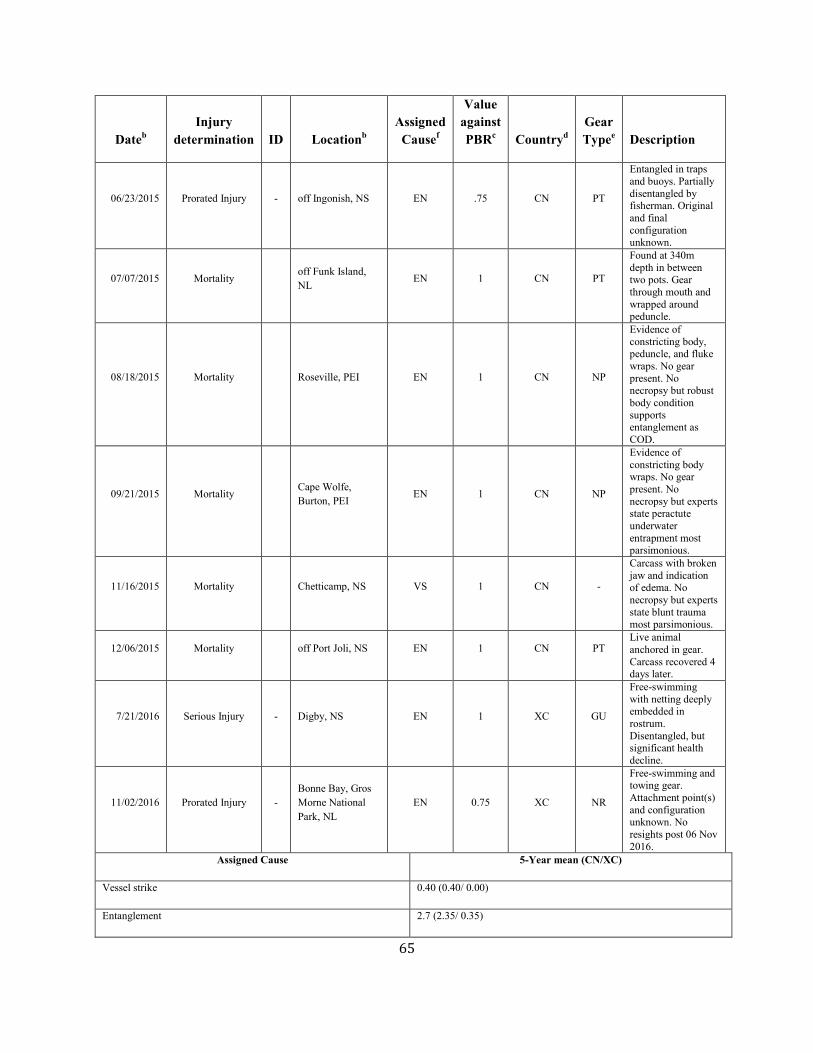
65
Dateb Injury
determination ID Locationb Assigned
Causef
Value against PBRc Countryd
Gear Typee Description
06/23/2015 Prorated Injury - off Ingonish, NS EN .75 CN PT
Entangled in traps and buoys. Partially disentangled by fisherman. Original and final configuration unknown.
07/07/2015 Mortality off Funk Island, NL EN 1 CN PT
Found at 340m depth in between two pots. Gear through mouth and wrapped around peduncle.
08/18/2015 Mortality Roseville, PEI EN 1 CN NP
Evidence of constricting body, peduncle, and fluke wraps. No gear present. No necropsy but robust body condition supports entanglement as COD.
09/21/2015 Mortality Cape Wolfe, Burton, PEI EN 1 CN NP
Evidence of constricting body wraps. No gear present. No necropsy but experts state peractute underwater entrapment most parsimonious.
11/16/2015 Mortality Chetticamp, NS VS 1 CN -
Carcass with broken jaw and indication of edema. No necropsy but experts state blunt trauma most parsimonious.
12/06/2015 Mortality off Port Joli, NS EN 1 CN PT Live animal anchored in gear. Carcass recovered 4 days later.
7/21/2016 Serious Injury - Digby, NS EN 1 XC GU
Free-swimming with netting deeply embedded in rostrum. Disentangled, but significant health decline.
11/02/2016 Prorated Injury - Bonne Bay, Gros Morne National Park, NL
EN 0.75 XC NR
Free-swimming and towing gear. Attachment point(s) and configuration unknown. No resights post 06 Nov 2016.
Assigned Cause 5-Year mean (CN/XC)
Vessel strike 0.40 (0.40/ 0.00)
Entanglement 2.7 (2.35/ 0.35)
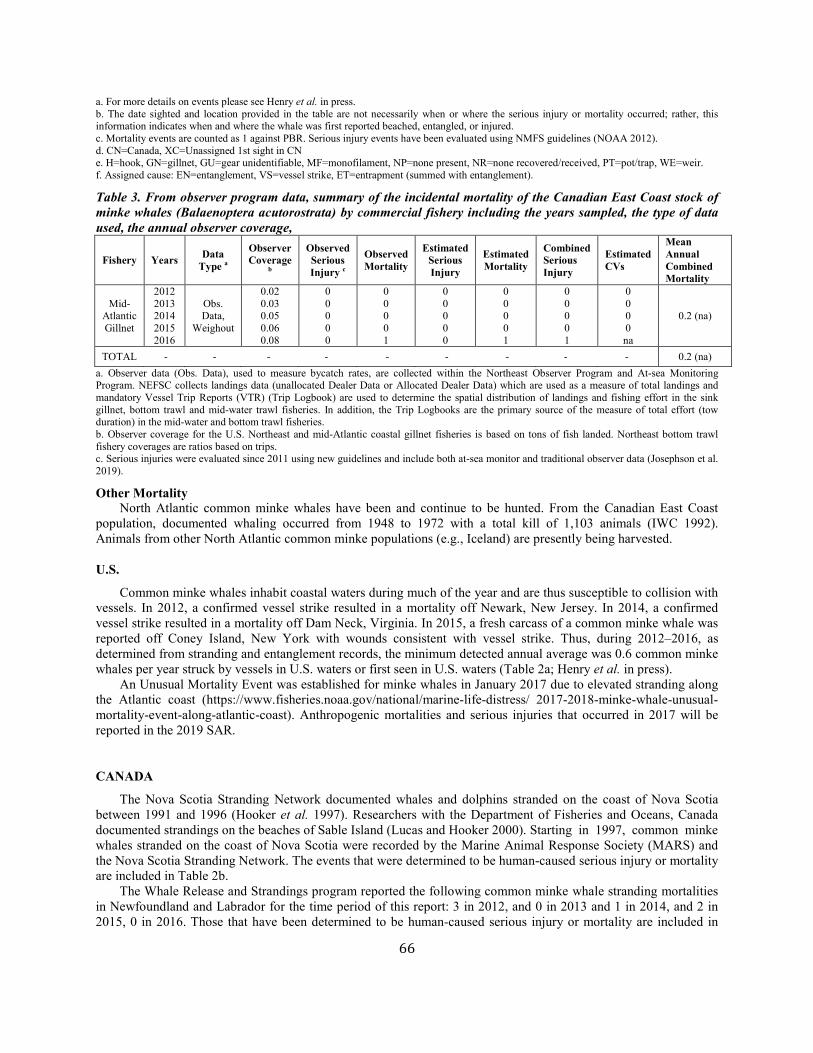
66
a. For more details on events please see Henry et al. in press. b. The date sighted and location provided in the table are not necessarily when or where the serious injury or mortality occurred; rather, this information indicates when and where the whale was first reported beached, entangled, or injured. c. Mortality events are counted as 1 against PBR. Serious injury events have been evaluated using NMFS guidelines (NOAA 2012). d. CN=Canada, XC=Unassigned 1st sight in CN e. H=hook, GN=gillnet, GU=gear unidentifiable, MF=monofilament, NP=none present, NR=none recovered/received, PT=pot/trap, WE=weir. f. Assigned cause: EN=entanglement, VS=vessel strike, ET=entrapment (summed with entanglement).
Table 3. From observer program data, summary of the incidental mortality of the Canadian East Coast stock of minke whales (Balaenoptera acutorostrata) by commercial fishery including the years sampled, the type of data used, the annual observer coverage,
Fishery Years Data Type a
Observer Coverage
b
Observed Serious Injury c
Observed Mortality
Estimated Serious Injury
Estimated Mortality
Combined Serious Injury
Estimated CVs
Mean Annual Combined Mortality
Mid-Atlantic Gillnet
2012 2013 2014 2015 2016
Obs. Data,
Weighout
0.02 0.03 0.05 0.06 0.08
0 0 0 0 0
0 0 0 0 1
0 0 0 0 0
0 0 0 0 1
0 0 0 0 1
0 0 0 0 na
0.2 (na)
TOTAL - - - - - - - - - 0.2 (na) a. Observer data (Obs. Data), used to measure bycatch rates, are collected within the Northeast Observer Program and At-sea Monitoring Program. NEFSC collects landings data (unallocated Dealer Data or Allocated Dealer Data) which are used as a measure of total landings and mandatory Vessel Trip Reports (VTR) (Trip Logbook) are used to determine the spatial distribution of landings and fishing effort in the sink gillnet, bottom trawl and mid-water trawl fisheries. In addition, the Trip Logbooks are the primary source of the measure of total effort (tow duration) in the mid-water and bottom trawl fisheries. b. Observer coverage for the U.S. Northeast and mid-Atlantic coastal gillnet fisheries is based on tons of fish landed. Northeast bottom trawl fishery coverages are ratios based on trips. c. Serious injuries were evaluated since 2011 using new guidelines and include both at-sea monitor and traditional observer data (Josephson et al. 2019).
Other Mortality North Atlantic common minke whales have been and continue to be hunted. From the Canadian East Coast population, documented whaling occurred from 1948 to 1972 with a total kill of 1,103 animals (IWC 1992). Animals from other North Atlantic common minke populations (e.g., Iceland) are presently being harvested. U.S.
Common minke whales inhabit coastal waters during much of the year and are thus susceptible to collision with vessels. In 2012, a confirmed vessel strike resulted in a mortality off Newark, New Jersey. In 2014, a confirmed vessel strike resulted in a mortality off Dam Neck, Virginia. In 2015, a fresh carcass of a common minke whale was reported off Coney Island, New York with wounds consistent with vessel strike. Thus, during 2012–2016, as determined from stranding and entanglement records, the minimum detected annual average was 0.6 common minke whales per year struck by vessels in U.S. waters or first seen in U.S. waters (Table 2a; Henry et al. in press). An Unusual Mortality Event was established for minke whales in January 2017 due to elevated stranding along the Atlantic coast (https://www.fisheries.noaa.gov/national/marine-life-distress/ 2017-2018-minke-whale-unusual-mortality-event-along-atlantic-coast). Anthropogenic mortalities and serious injuries that occurred in 2017 will be reported in the 2019 SAR. CANADA
The Nova Scotia Stranding Network documented whales and dolphins stranded on the coast of Nova Scotia between 1991 and 1996 (Hooker et al. 1997). Researchers with the Department of Fisheries and Oceans, Canada documented strandings on the beaches of Sable Island (Lucas and Hooker 2000). Starting in 1997, common minke whales stranded on the coast of Nova Scotia were recorded by the Marine Animal Response Society (MARS) and the Nova Scotia Stranding Network. The events that were determined to be human-caused serious injury or mortality are included in Table 2b. The Whale Release and Strandings program reported the following common minke whale stranding mortalities in Newfoundland and Labrador for the time period of this report: 3 in 2012, and 0 in 2013 and 1 in 2014, and 2 in 2015, 0 in 2016. Those that have been determined to be human-caused serious injury or mortality are included in

67
Table 2b (Ledwell and Huntington 2012a, 2012b, 2013, 2014, 2015). During 2012–2016, as determined from stranding and entanglement records, the minimum detected annual average was 0.4 common minke whales per year struck by vessels in Canadian waters or first seen in Canadian waters (Table 2b; Henry et al. in press).
STATUS OF STOCK Common minke whales are not listed as threatened or endangered under the Endangered Species Act, and the Canadian East Coast stock is not considered strategic under the Marine Mammal Protection Act. The total U.S. fishery-related mortality and serious injury for this stock is not less than 10% of the calculated PBR and, therefore, cannot be considered to be insignificant and approaching zero mortality and serious injury rate. The status of common minke whales relative to OSP in the U.S. Atlantic EEZ is unknown. It is expected that the uncertainties described above will have little effect on the designation of the status of the entire stock. Even though the estimate of human-caused mortality and serious injury in this assessment is negatively biased due to using strandings and entanglement data as the primary source, the abundance estimate is a very negatively-biased estimate for the entire stock as it only includes the U.S. portion of the Canadian East Coast common minke whale stock’s habitat. If the current PBR representing only the U.S. portion of the stock (9.4) is compared to only the negatively-biased U.S. mortalities and serious injuries (5.8), the stock would still be designated as not strategic. However, this designation may be reversed if the negative bias in the mortality estimate is large. Thus, key uncertainties that need to be resolved include the stock structure, particularly as it is influenced by movement patterns between U.S. and Canadian waters, and the estimated human-caused mortalities and serious injuries.
REFERENCES CITED Anderwald, P., A.K. Daníelsdóttir, T. Haug, F. Larsen, V. Lesage, R.J. Reid, G.A. Víkingsson and A.R. Hoelzel.
2011. Possible cryptic stock structure for minke whales in the North Atlantic: Implications for conservation and management. Biol. Cons. 144(10):2479–2489.
Barlow, J., S.L. Swartz, T.C. Eagle and P.R. Wade. 1995. U.S. marine mammal stock assessments: Guidelines for preparation, background, and a summary of the 1995 assessments. NOAA Tech. Memo. NMFS-OPR-6. 73 pp.
CETAP 1982. A characterization of marine mammals and turtles in the mid- and North Atlantic areas of the U.S. outer continental shelf, final report, Cetacean and Turtle Assessment Program, University of Rhode Island. Bureau of Land Management, Washington, DC. #AA551-CT8-48. 576 pp.
Clark, C.W., and Gagnon, G.C. 2002. Low-frequency vocal behaviors of baleen whales in the North Atlantic: Insights from IUSS detections, locations and tracking from 1992 to 1996. J. Underwater Acoust. (USN), 52(3):609–640.
Donovan, G.P. 1991. A review of IWC stock boundaries. Rep. Int. Whal. Comm. (Special Issue) 13:39–68. Henry, A.G., T.V.N. Cole, L. Hall, W. Ledwell, D. Morin and A. Reid. in press. Mortality and Serious Injury
determinations for baleen whale stocks along the Gulf of Mexico, United States East Coast and Atlantic Canadian Provinces, 2012-2016, NEFSC Reference Document
Hooker, S.K., R.W. Baird and M.A. Showell. 1997. Cetacean strandings and bycatches in Nova Scotia, eastern Canada, 1991–1996. Meeting document SC/49/O5 submitted to the 1997 International Whaling Commission Scientific Committee meeting in Bournemouth, UK.
IWC 1991. Appendix 11. Biological parameters of North Atlantic minke whales. In Annex F, report of the sub-committee on North Atlantic minke whales. Rep. Int. Whal. Comm. 41:160.
IWC 1992. Annex K. Report of the working group on North Atlantic minke trials. Rep. Int. Whal. Comm. 42:246–251.
Laake, J.L. and D.L. Borchers. 2004. Methods for incomplete detection at distance zero, Pages 108–189 in: Advanced distance sampling, S.T. Buckland, D.R. Andersen, K.P. Burnham, J.L. Laake, and L. Thomas, (eds.), Oxford University Press, New York.
Ledwell, W. and J. Huntington. 2012a. Incidental entanglements of cetacean and leatherback sea turtles in fishing gear reported during 2011–2012 and a summary of the Whale Release and Strandings Group activities. Report to the Department of Fisheries and Oceans Canada, St. John's, Newfoundland, Canada. 17 pp.
Ledwell, W. and J. Huntington 2012b. Incidental entrapments in fishing gear and stranding reported to and responded to by the Whale Release and Strandings Group in Newfoundland and Labrador and a summary of the Whale Release and Strandings program during 2012. Report to the Department of Fisheries and Oceans Canada, St. John's, Newfoundland, Canada. 18 pp.

68
Ledwell, W., J. Huntington and E. Sacrey 2013. Incidental entrapments in fishing gear and stranding reported to and responded to by the Whale Release and Strandings Group in Newfoundland and Labrador and a summary of the Whale Release and Strandings program during 2013. Report to the Department of Fisheries and Oceans Canada, St. John's, Newfoundland, Canada. 19 pp.
Ledwell, W. and J. Huntington 2014. Incidental entrapments and entanglements of cetaceans and leatherback sea turtles, strandings, ice entrapments reported to the Whale Release and Strandings Group in Newfoundland and Labrador and a summary of the Whale Release and Strandings program during 2014. Report to the Department of Fisheries and Oceans Canada, St. John's, Newfoundland, Canada. 23 pp.
Ledwell, W. and J. Huntington 2015. Incidental entrapments and entanglements of cetaceans and leatherback sea turtles, strandings, ice entrapments reported to the Whale Release and Strandings Group in Newfoundland and Labrador and a summary of the Whale Release and Strandings program during 2015. Report to the Department of Fisheries and Oceans Canada, St. John's, Newfoundland, Canada. 22 pp.
Ledwell, W. and J. Huntington 2017. Incidental entrapments and entanglements of cetaceans and leatherback sea turtles, strandings, ice entrapments reported to the Whale Release and Strandings Group in Newfoundland and Labrador and a summary of the Whale Release and Strandings program during 2016. Report to the Department of Fisheries and Oceans Canada, St. John's, Newfoundland, Canada. 22 pp.
Lucas, Z.N. and S.K. Hooker 2000. Cetacean strandings on Sable Island, Nova Scotia, 1970-1998. Can. Field-Nat. 114(1):46–61.
Mitchell, E.D. 1991. Winter records of the minke whale (Balaenoptera acutorostrata Lacepede 1804) in the southern North Atlantic. Rep. Int. Whal. Comm. 41:455–457.
National Marine Fisheries Service (NMFS). 2016. Guidelines for preparing stock assessment reports pursuant to the 1994 amendments to the Marine Mammal Protection Act. 23 pp. Available online: https://www.fisheries.noaa.gov/national/marine-mammal-protection/guidelines-assessing-marine-mammal-stocks. Accessed July 2017.
Palka, D.L. 2012. Cetacean abundance estimates in US northwestern Atlantic Ocean waters from summer 2011 line transect survey. Northeast Fish. Sci. Cent. Ref. Doc. 12-29. 37 pp.
http://www.nefsc.noaa.gov/nefsc/publications/crd/crd1229/ Read, A.J. 1994. Interactions between cetaceans and gillnet and trap fisheries in the northwest Atlantic. Rep. Int.
Whal. Comm. (Special Issue) 15:133–147. Risch, D., C.W. Clark, P.J. Dugan, M. Popescu, U. Siebert and S.M. VanParijs 2013. Minke whale acoustic
behavior and multi-year seasonal and diel vocalization patterns in Massachusetts Bay, USA. Mar. Ecol. Prog. Ser. 489:279–295.
Risch, D., M. Castellote, C.W. Clark, G.E. Davis, P.J. Dugan, L.E.W. Hodge, A. Kumar, K. Lucke, D.K. Mellinger, S.L. Nieukirk, C.M. Popescu, C. Ramp, A.J. Read, A.N. Rice, M.A. Silva, U. Siebert, K.M. Stafford, H. Verdaat, S.M. VanParijs. 2014. Seasonal migrations of North Atlantic minke whales: novel insights from large-scale passive acoustic monitoring networks. Movement Ecol. 2:24.
Taylor, B.L., M. Martinez, T. Gerrodette, J. Barlow and Y.N. Hrovat. 2007. Lessons from monitoring trends in abundance in marine mammals. Mar. Mamm. Sci. 23(1):157–175.
Thomas L, J.L. Laake, E. Rexstad, S. Strindberg, F.F.C. Marques, S.T. Buckland, D.L. Borchers, D.R. Anderson, K.P. Burnham, M.L. Burt, S.L. Hedley, J.H. Pollard, J.R.B. Bishop and T.A. Marques. 2009. Distance 6.0. Release 2. [Internet]. University of St. Andrews (UK): Research Unit for Wildlife Population Assessment. Available from: http://distancesampling.org/Distance/
Wade, P.R. and R.P. Angliss 1997. Guidelines for assessing marine mammal stocks: Report of the GAMMS Workshop April 3-5, 1996, Seattle, Washington. NOAA Tech. Memo. NMFS-OPR-12. 93 pp.

69
February 2019
RISSO'S DOLPHIN (Grampus griseus): Western North Atlantic Stock
STOCK DEFINITION AND GEOGRAPHIC RANGE Risso's dolphins are distributed worldwide in tropical and temperate seas (Jefferson et al. 2008, 2014), and in the Northwest Atlantic occur from Florida to eastern Newfoundland (Leatherwood et al. 1976; Baird and Stacey 1991). Off the northeastern U.S. coast, Risso's dolphins are distributed along the continental shelf edge from Cape Hatteras northward to Georges Bank during spring, summer, and autumn (CETAP 1982; Payne et al. 1984) (Figure 1). In winter, the range is in the mid-Atlantic Bight and extends outward into oceanic waters (Payne et al. 1984). In general, the population occupies the mid-Atlantic continental shelf edge year round, and is rarely seen in the Gulf of Maine (Payne et al. 1984). During 1990, 1991 and 1993, spring/summer surveys conducted along the continental shelf edge and in deeper oceanic waters sighted Risso's dolphins associated with strong bathymetric features, Gulf Stream warm-core rings, and the Gulf Stream north wall (Waring et al. 1992, 1993; Hamazaki 2002). There is no information on stock structure of Risso's dolphin in the western North Atlantic, or to determine if separate stocks exist in the Gulf of Mexico and Atlantic. Thus, it is plausible that the stock could actually contain multiple demographically independent populations that should themselves be stocks, because the current stock spans multiple eco-regions (Longhurst 1998; Spalding et al. 2007). In 2006, a rehabilitated adult male Risso’s dolphin stranded and released in the Gulf of Mexico off Florida was tracked via satellite-linked tag to waters off Delaware (Wells et al. 2009). The Gulf of Mexico and Atlantic stocks are currently being treated as two separate stocks.
POPULATION SIZE The best abundance estimate for Risso’s dolphins is the sum of the estimates from the 2011 surveys—18,250 (CV = 0.46: Table 1). The current abundance estimate did not account for availability bias due to submergence of animals. Without a correction for availability bias, the abundance estimate is expected to be biased low. Additionally, since the most current estimate dates from a survey done in 2011, the ability for that estimate to accurately represent the present population size has become increasingly uncertain.
Earlier abundance estimates Please see Appendix IV for a summary of abundance estimates, including earlier estimates and survey descriptions. As recommended in the GAMMS II Workshop Report (Wade and Angliss 1997), estimates older than eight years are deemed unreliable for the determination of the current PBR.
Recent surveys and abundance estimates An abundance estimate of 15,197 (CV = 0.55) Risso’s dolphins was generated from a shipboard and aerial survey conducted during June–August 2011 (Palka 2012). The aerial portion that contributed to the abundance
Figure 1. Distribution of Risso’s dolphin sightings from NEFSC and SEFSC shipboard and aerial surveys during the summers of 1995, 1998, 1999, 2002, 2004, 2006, 2007, 2008 2010 and 2011. Isobaths are the 100-m, 1,000-m, and 4,000-m depth contours.
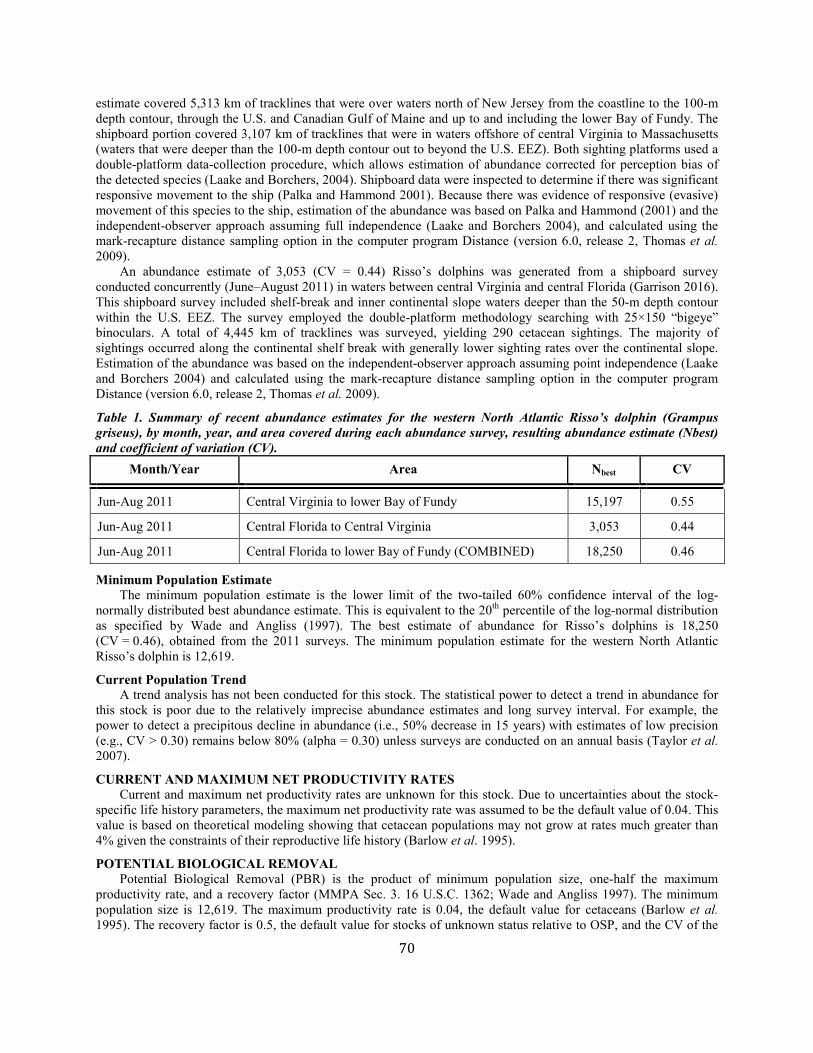
70
estimate covered 5,313 km of tracklines that were over waters north of New Jersey from the coastline to the 100-m depth contour, through the U.S. and Canadian Gulf of Maine and up to and including the lower Bay of Fundy. The shipboard portion covered 3,107 km of tracklines that were in waters offshore of central Virginia to Massachusetts (waters that were deeper than the 100-m depth contour out to beyond the U.S. EEZ). Both sighting platforms used a double-platform data-collection procedure, which allows estimation of abundance corrected for perception bias of the detected species (Laake and Borchers, 2004). Shipboard data were inspected to determine if there was significant responsive movement to the ship (Palka and Hammond 2001). Because there was evidence of responsive (evasive) movement of this species to the ship, estimation of the abundance was based on Palka and Hammond (2001) and the independent-observer approach assuming full independence (Laake and Borchers 2004), and calculated using the mark-recapture distance sampling option in the computer program Distance (version 6.0, release 2, Thomas et al. 2009). An abundance estimate of 3,053 (CV = 0.44) Risso’s dolphins was generated from a shipboard survey conducted concurrently (June–August 2011) in waters between central Virginia and central Florida (Garrison 2016). This shipboard survey included shelf-break and inner continental slope waters deeper than the 50-m depth contour within the U.S. EEZ. The survey employed the double-platform methodology searching with 25×150 “bigeye” binoculars. A total of 4,445 km of tracklines was surveyed, yielding 290 cetacean sightings. The majority of sightings occurred along the continental shelf break with generally lower sighting rates over the continental slope. Estimation of the abundance was based on the independent-observer approach assuming point independence (Laake and Borchers 2004) and calculated using the mark-recapture distance sampling option in the computer program Distance (version 6.0, release 2, Thomas et al. 2009).
Table 1. Summary of recent abundance estimates for the western North Atlantic Risso’s dolphin (Grampus griseus), by month, year, and area covered during each abundance survey, resulting abundance estimate (Nbest) and coefficient of variation (CV).
Month/Year Area Nbest CV
Jun-Aug 2011 Central Virginia to lower Bay of Fundy 15,197 0.55
Jun-Aug 2011 Central Florida to Central Virginia 3,053 0.44
Jun-Aug 2011 Central Florida to lower Bay of Fundy (COMBINED) 18,250 0.46
Minimum Population Estimate The minimum population estimate is the lower limit of the two-tailed 60% confidence interval of the log-normally distributed best abundance estimate. This is equivalent to the 20th percentile of the log-normal distribution as specified by Wade and Angliss (1997). The best estimate of abundance for Risso’s dolphins is 18,250 (CV = 0.46), obtained from the 2011 surveys. The minimum population estimate for the western North Atlantic Risso’s dolphin is 12,619.
Current Population Trend A trend analysis has not been conducted for this stock. The statistical power to detect a trend in abundance for this stock is poor due to the relatively imprecise abundance estimates and long survey interval. For example, the power to detect a precipitous decline in abundance (i.e., 50% decrease in 15 years) with estimates of low precision (e.g., CV > 0.30) remains below 80% (alpha = 0.30) unless surveys are conducted on an annual basis (Taylor et al. 2007).
CURRENT AND MAXIMUM NET PRODUCTIVITY RATES Current and maximum net productivity rates are unknown for this stock. Due to uncertainties about the stock-specific life history parameters, the maximum net productivity rate was assumed to be the default value of 0.04. This value is based on theoretical modeling showing that cetacean populations may not grow at rates much greater than 4% given the constraints of their reproductive life history (Barlow et al. 1995).
POTENTIAL BIOLOGICAL REMOVAL Potential Biological Removal (PBR) is the product of minimum population size, one-half the maximum productivity rate, and a recovery factor (MMPA Sec. 3. 16 U.S.C. 1362; Wade and Angliss 1997). The minimum population size is 12,619. The maximum productivity rate is 0.04, the default value for cetaceans (Barlow et al. 1995). The recovery factor is 0.5, the default value for stocks of unknown status relative to OSP, and the CV of the
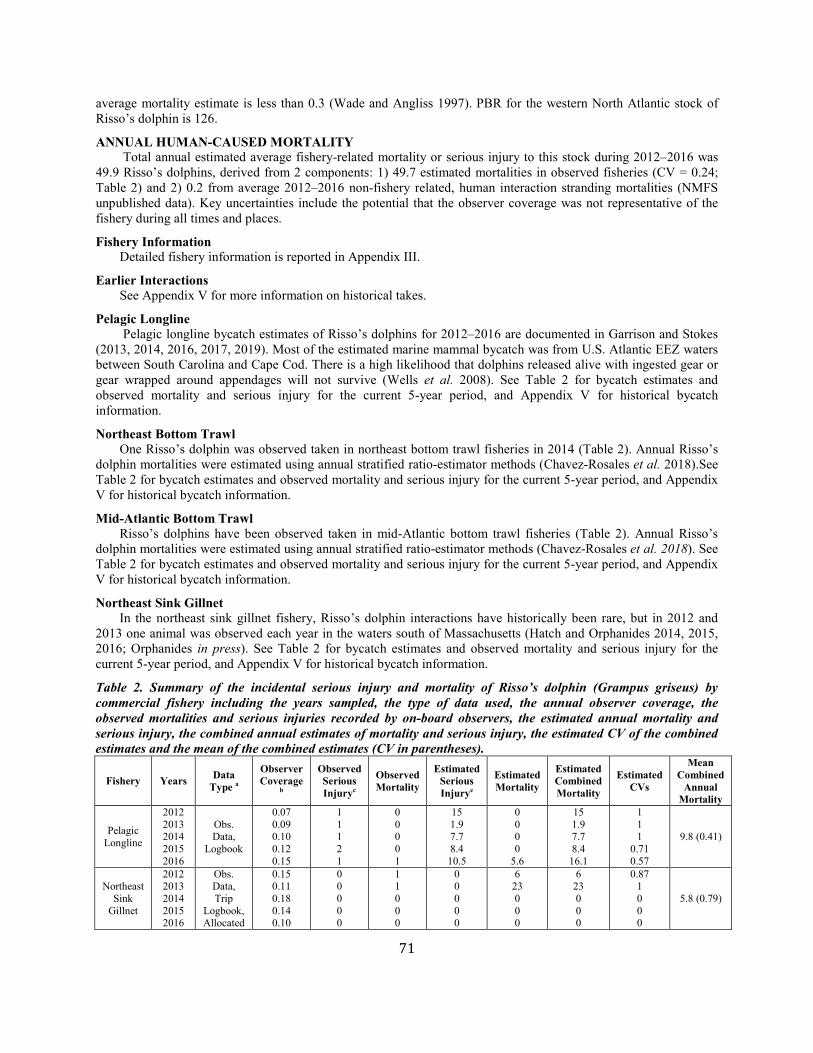
71
average mortality estimate is less than 0.3 (Wade and Angliss 1997). PBR for the western North Atlantic stock of Risso’s dolphin is 126.
ANNUAL HUMAN-CAUSED MORTALITY Total annual estimated average fishery-related mortality or serious injury to this stock during 2012–2016 was 49.9 Risso’s dolphins, derived from 2 components: 1) 49.7 estimated mortalities in observed fisheries (CV = 0.24; Table 2) and 2) 0.2 from average 2012–2016 non-fishery related, human interaction stranding mortalities (NMFS unpublished data). Key uncertainties include the potential that the observer coverage was not representative of the fishery during all times and places.
Fishery Information Detailed fishery information is reported in Appendix III.
Earlier Interactions See Appendix V for more information on historical takes.
Pelagic Longline Pelagic longline bycatch estimates of Risso’s dolphins for 2012–2016 are documented in Garrison and Stokes (2013, 2014, 2016, 2017, 2019). Most of the estimated marine mammal bycatch was from U.S. Atlantic EEZ waters between South Carolina and Cape Cod. There is a high likelihood that dolphins released alive with ingested gear or gear wrapped around appendages will not survive (Wells et al. 2008). See Table 2 for bycatch estimates and observed mortality and serious injury for the current 5-year period, and Appendix V for historical bycatch information.
Northeast Bottom Trawl One Risso’s dolphin was observed taken in northeast bottom trawl fisheries in 2014 (Table 2). Annual Risso’s dolphin mortalities were estimated using annual stratified ratio-estimator methods (Chavez-Rosales et al. 2018).See Table 2 for bycatch estimates and observed mortality and serious injury for the current 5-year period, and Appendix V for historical bycatch information.
Mid-Atlantic Bottom Trawl Risso’s dolphins have been observed taken in mid-Atlantic bottom trawl fisheries (Table 2). Annual Risso’s dolphin mortalities were estimated using annual stratified ratio-estimator methods (Chavez-Rosales et al. 2018). See Table 2 for bycatch estimates and observed mortality and serious injury for the current 5-year period, and Appendix V for historical bycatch information.
Northeast Sink Gillnet In the northeast sink gillnet fishery, Risso’s dolphin interactions have historically been rare, but in 2012 and 2013 one animal was observed each year in the waters south of Massachusetts (Hatch and Orphanides 2014, 2015, 2016; Orphanides in press). See Table 2 for bycatch estimates and observed mortality and serious injury for the current 5-year period, and Appendix V for historical bycatch information.
Table 2. Summary of the incidental serious injury and mortality of Risso’s dolphin (Grampus griseus) by commercial fishery including the years sampled, the type of data used, the annual observer coverage, the observed mortalities and serious injuries recorded by on-board observers, the estimated annual mortality and serious injury, the combined annual estimates of mortality and serious injury, the estimated CV of the combined estimates and the mean of the combined estimates (CV in parentheses).
Fishery Years Data Type a
Observer Coverage
b
Observed Serious Injuryc
Observed Mortality
Estimated Serious Injurye
Estimated Mortality
Estimated Combined Mortality
Estimated CVs
Mean Combined
Annual Mortality
Pelagic Longline
2012 2013 2014 2015 2016
Obs. Data,
Logbook
0.07 0.09 0.10 0.12 0.15
1 1 1 2 1
0 0 0 0 1
15 1.9 7.7 8.4
10.5
0 0 0 0
5.6
15 1.9 7.7 8.4
16.1
1 1 1
0.71 0.57
9.8 (0.41)
Northeast Sink
Gillnet
2012 2013 2014 2015 2016
Obs. Data, Trip
Logbook, Allocated
0.15 0.11 0.18 0.14 0.10
0 0 0 0 0
1 1 0 0 0
0 0 0 0 0
6 23 0 0 0
6 23 0 0 0
0.87 1 0 0 0
5.8 (0.79)

72
Fishery Years Data Type a
Observer Coverage
b
Observed Serious Injuryc
Observed Mortality
Estimated Serious Injurye
Estimated Mortality
Estimated Combined Mortality
Estimated CVs
Mean Combined
Annual Mortality
Dealer Data
Northeast Bottom Trawl
2012 2013 2014 2015 2016
Obs. Data,
Weighout 0.17
0 0 0 0 0
0 0 1 0 2
0 0 0 0 0
0 0
4.2 0
17
0 0
4.2 0
17
0 0
0.91 0
0.88
4.2 (0.73)
Mid-Atlantic Bottom Trawl
2012 2013 2014 2015 2016
Obs. Data,
Dealer Data
0.05 0.06 0.08 0.09 0.10
0 0 0 2 0
1 4 2 1 4
0 0 0
27 0
7.6 42 21 13 39
7.6 42 21 40 39
1 0.71 0.93 0.63 0.56
30 (.33)
TOTAL - - - - - - - - - 49.7 (0.24) a Observer data (Obs. Data) are used to measure bycatch rates and the data are collected within the Northeast Fisheries Observer Program. NEFSC collects landings data (unallocated Dealer Data and Allocated Dealer Data) which are used as a measure of total landings and mandatory Vessel Trip Reports (VTR) (Trip Logbook) are used to determine the spatial distribution of landings and fishing effort. Total landings are used as a measure of total effort for the coastal gillnet fishery. b The observer coverages for the northeast and mid-Atlantic sink gillnet fishery are ratios based on tons of fish landed. Northeast bottom trawl, mid-Atlantic bottom trawl, northeast mid-water and mid-Atlantic mid-water trawl fishery coverages are ratios based on trips. Total observer coverage reported for gillnet and bottom trawl gear include samples collected from traditional fisheries observers in addition to fishery at-sea monitors through the Northeast Fisheries Observer Program (NEFOP). c Serious injuries were evaluated for the 2012–2016 period and include both at-sea monitor and traditional observer data (Josephson et al. 2019).
Other Mortality From 2012 to 2016, 24 Risso’s dolphin strandings were recorded along the U.S. Atlantic coast (NOAA National Marine Mammal Health and Stranding Response Database unpublished data, accessed 03 November 2017). Three animals had confirmed indications of human interaction, 2 of which were fishery interactions. Indications of human interaction are not necessarily the cause of death (Table 3).
Table 3. Risso’s dolphin (Grampus griseus) reported strandings along the U.S. Atlantic coast and Puerto Rico, 2012–2016.
STATE 2012 2013 2014 2015 2016 TOTALS
Massachusettsa 0 3 2 1 2 8
New York 0 2 0 2 0 4
Maryland 0 1 0 0 0 1
Virginiab 0 0 1 0 0 1
North Carolinac 2 1 1 0 0 4
Florida 2 2 0 0 2 6
TOTAL 4 9 4 4 4 24
a. One animal in 2014 was classified as CBD for human interaction due to signs of ear trauma. b. One animal in 2014 classified as HI due to plastic ingestion. c. Two animals in 2012 showed signs of fishery interaction. Stranding data probably underestimate the extent of fishery-related mortality and serious injury because all of the marine mammals that die or are seriously injured may not wash ashore, nor will all of those that do wash ashore necessarily show signs of entanglement or other fishery-interaction. Finally, the level of technical expertise among stranding network personnel varies widely as does the ability to recognize signs of fishery interaction.
STATUS OF STOCK Risso’s dolphins are not listed as threatened or endangered under the Endangered Species Act and the Western

73
North Atlantic stock is not considered strategic under the Marine Mammal Protection Act. The 2012–2016 average annual human-related mortality does not exceed PBR. The total U.S. fishery mortality and serious injury for this stock is not less than 10% of the calculated PBR and, therefore, cannot be considered to be insignificant and approaching a zero mortality and serious injury rate. The status of Risso's dolphins relative to OSP in the U.S. Atlantic EEZ is unknown. Population trends for this species have not been investigated. Based on the low levels of uncertainties described in the above sections, it expected these uncertainties will have little effect on the designation of the status of this stock.
REFERENCES CITED Baird, R.W. and P.J. Stacey. 1990. Status of Risso's dolphin, Grampus griseus, in Canada. Can. Field-Nat. 105:
233–242. Barlow, J., S.L. Swartz, T.C. Eagle and P.R. Wade. 1995. U.S. marine mammal stock assessments: Guidelines for
preparation, background, and a summary of the 1995 assessments. NOAA Tech. Memo. NMFS-OPR-6. 73 pp.
CETAP. 1982. A characterization of marine mammals and turtles in the mid- and North Atlantic areas of the U.S. outer continental shelf, final report, Cetacean and Turtle Assessment Program, University of Rhode Island. Bureau of Land Management, Washington, DC. #AA551-CT8-48. 576 pp.
Chavez-Rosales, S., M.C. Lyssikatos, and J. Hatch. 2018. Estimates of cetacean and pinniped bycatch in northeast and mid-Atlantic bottom trawl fisheries, 2012-2016. NOAA Tech. Memo NMFS-NE-250. 29pp.
Garrison, L.P. and L. Stokes 2013. Estimated bycatch of marine mammals and sea turtles in the U.S. Atlantic pelagic longline fleet during 2012. NOAA Tech Memo NMFS-SEFSC-655 62 pp.
Garrison, L.P. and L. Stokes. 2014. Estimated bycatch of marine mammals and sea turtles in the U.S. Atlantic pelagic longline fleet during 2013. NOAA Tech. Memo. NMFS-SEFSC-667 61pp.
Garrison, L.P. and L. Stokes. 2016. Estimated bycatch of marine mammals and sea turtles in the U.S. Atlantic pelagic longline fleet during 2014. NOAA Tech. Memo. NMFS-SEFSC-696 62 pp.
Garrison, L.P. 2016. Abundance of marine mammals in waters of the U.S. East Coast during summer 2011. Southeast Fisheries Science Center, Protected Resources and Biodiversity Division, 75 Virginia Beach Dr., Miami, FL 33140. PRBD Contribution # PRBD-2016-08, 21 pp.
Garrison, L.P. and L. Stokes. 2017. Estimated bycatch of marine mammals and sea turtles in the U.S. Atlantic pelagic longline fleet during 2015. NOAA Tech. Memo. NMFS-SEFSC-709 67 pp.
Garrison, L.P. and L. Stokes. 2019. Estimated bycatch of marine mammals and sea turtles in the U.S. Atlantic pelagic longline fleet during 2016. Southeast Fisheries Science Center, Protected Resources and Biodiversity Division, 75 Virginia Beach Dr., Miami, FL 33140. PRBD Contribution # PRBD-2019-01. 62 pp.
Hamazaki, T. 2002. Spatiotemporal prediction models of cetacean habitats in the mid-western North Atlantic Ocean (from Cape Hatteras, No. Carolina, USA to Nova Scotia, Canada). Mar. Mamm. Sci. 18(4): 920-939.
Hatch, J.M. and C.D. Orphanides. 2014 Estimates of cetacean and pinniped bycatch in the 2012 New England sink gillnet and mid-Atlantic gillnet fisheries. Northeast Fish. Sci. Cent. Ref. Doc. 14-02. 20 pp.
Hatch, J.M. and C.D. Orphanides. 2015. Estimates of cetacean and pinniped bycatch in the 2013 New England sink gillnet and mid-Atlantic gillnet fisheries. Northeast Fish. Sci. Cent. Ref. Doc. 15-15. 33 pp.
Hatch, J.M. and C.D. Orphanides. 2016. Estimates of cetacean and pinniped bycatch in the 2014 New England sink gillnet and mid-Atlantic gillnet fisheries. Northeast Fish. Sci. Cent. Ref. Doc. 16-05. 22 pp.
Jefferson, T.A., M.A. Webber and R.L. Pitman. 2008. Marine mammals of the world. Elsevier, Amsterdam. 573 pp. Jefferson, T.A., C.R. Weir, R.C. Anderson, L.T. Balance, J. Barlow, R.D. Kenney, and J.J. Kiszka. 2014. Global
distribution of Risso’s dolphin Grampus griseus: A review and critical evaluation. Mamm. Rev. 44: 56–68. Josephson, E. Wenzel F, and M.C. Lyssikatos. 2019. Serious injury determinations for small cetaceans and
pinnipeds caught in commercial fisheries off the northeast U.S. coast, 2012-2016. Northeast Fish. Sci. Cent. Ref. Doc. 19-05, 27 pp.
Laake, J.L., and D.L. Borchers. 2004. Methods for incomplete detection at distance zero. Pages 108-189 in: Advanced distance sampling, S.T. Buckland, D.R. Andersen, K.P. Burnham, J.L. Laake, and L. Thomas, (eds.), Oxford University Press, New York.

74
Leatherwood, S., D.K. Caldwell and H.E. Winn. 1976. Whales, dolphins, and porpoises of the western North
Atlantic. A guide to their identification. NOAA Tech. Rep. NMFS Circ. 396. 176 pp. Longhurst, A.R. 1998. Ecological geography of the sea, Second Edition., Elsevier Academic Press. 560 pp. Lucas, Z.N. and S.K. Hooker. 2000. Cetacean strandings on Sable Island, Nova Scotia, 1970-1998. Can. Field-Nat.
114(1): 46-61. Orphanides, C.D. and J. Hatch. 2017. Estimates of cetacean and pinniped bycatch in the 2015 New England Sink
Gillnet fishery and mid-Atlantic gillnet fisheries. Northeast Fish. Sci. Cent. Ref. Doc. 17-18. 21 pp. Orphanides, C.D. 2019. Estimates of cetacean and pinniped bycatch in the 2016 New England Sink Gillnet fishery
and mid-Atlantic gillnet fisheries. Northeast Fish. Sci. Cent. Ref. Doc.19-04, 12 pp. Palka, D.L. 2012. Cetacean abundance estimates in US northwestern Atlantic Ocean waters from summer 2011 line
transect survey. Northeast Fish. Sci. Cent. Ref. Doc. 12-29. 37 pp. http://www.nefsc.noaa.gov/nefsc/publications/crd/crd1229/ Palka, D.L. and P.S. Hammond. 2001. Accounting for responsive movement in line transect estimates of abundance.
Can. J. Fish. Aquat. Sci 58: 777-787. Payne, P.M., L.A. Selzer and A.R. Knowlton. 1984. Distribution and density of cetaceans, marine turtles and
seabirds in the shelf waters of the northeast U.S., June 1980 - Dec. 1983, based on shipboard observations. National Marine Fisheries Service, Woods Hole. NA81FAC00023: 245.
Spalding, M.D., H.E. Fox, G.R. Allen, N. Davidson, Z.A. Ferdaña, M. Finlayson, B.S. Halpern, M.A. Jorge, A. Lombana, S.A. Lourie, K.D. Martin, E. McManus, J. Molnar, C.A. Recchia and J. Robertson. 2007. Marine ecoregions of the world: a bioregionalization of coastal and shelf areas. BioScience 57(7):573–583.
Taylor, B.L., M. Martinez, T. Gerrodette, J. Barlow and Y.N. Hrovat. 2007. Lessons from monitoring trends in abundance in marine mammals. Mar. Mamm. Sci. 23(1): 157–175.
Thomas L, J.L. Laake, E. Rexstad, S. Strindberg, F.F.C. Marques, S.T. Buckland, D.L. Borchers, D.R. Anderson, K.P. Burnham, M.L. Burt, S.L. Hedley, J.H. Pollard, J.R.B. Bishop and T.A. Marques. 2009. Distance 6.0. Release 2. [Internet]. University of St. Andrews (UK): Research Unit for Wildlife Population Assessment. Available from: http://distancesampling.org/Distance/.
Wade, P.R. and R.P. Angliss. 1997. Guidelines for assessing marine mammal stocks: Report of the GAMMS Workshop April 3-5, 1996, Seattle, Washington. NOAA Tech. Memo. NMFS-OPR-12. 93 pp.
Waring, G.T., C.P. Fairfield, C.M. Ruhsam and M. Sano. 1992. Cetaceans associated with Gulf Stream features off the northeastern USA Shelf. ICES [Int. Counc. Explor. Sea] C.M. 1992/N:12.
Waring, G.T., C.P. Fairfield, C.M. Ruhsam and M. Sano. 1993. Sperm whales associated with Gulf Stream features off the northeastern USA shelf. Fish. Oceanogr. 2(2): 101–105.
Wells, R.S., J.B. Allen, S. Hofmann, K. Bassos-Hull, D.A. Fauquier, N.B. Barros, R.E. DeLynn, G. Sutton, V. Socha and M.D. Scott. 2008. Consequences of injuries on survival and reproduction of common bottlenose dolphins (Tursiops truncatus) along the west coast of Florida. Mar. Mamm. Sci. 24: 774–794.
Wells, R.S., C.A. Manire, L. Byrd, D.R. Smith, J.G. Gannon, D. Fauquier and K.D. Mullin. 2009. Movements and dive patterns of a rehabilitated Risso's dolphin, Grampus griseus, in the Gulf of Mexico and Atlantic Ocean. Mar. Mamm. Sci. 25(2): 420–429.
Yeung, C. 2001. Estimates of marine mammal and marine turtle bycatch by the U.S. Atlantic pelagic longline fleet in 1999-2000. NOAA Tech. Memo. NMFS-SEFSC-467. 43 pp.
Yeung, C., S. Epperly and C.A. Brown. 2000. Preliminary revised estimates of marine mammal and marine turtle bycatch by the U.S. Atlantic pelagic longline fleet, 1992–1999. PRD Contribution Number 99/00-13. National Marine Fisheries Service, Miami, FL. 58 pp.
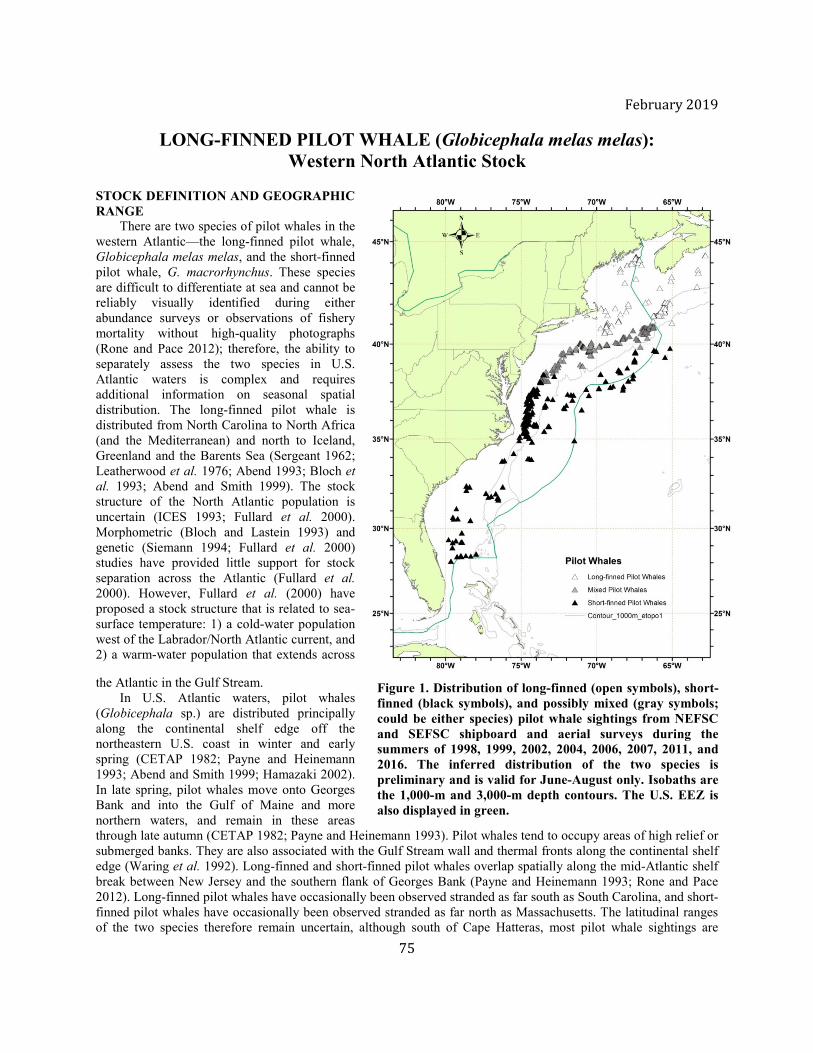
75
February 2019
LONG-FINNED PILOT WHALE (Globicephala melas melas): Western North Atlantic Stock
STOCK DEFINITION AND GEOGRAPHIC RANGE
There are two species of pilot whales in the western Atlantic—the long-finned pilot whale, Globicephala melas melas, and the short-finned pilot whale, G. macrorhynchus. These species are difficult to differentiate at sea and cannot be reliably visually identified during either abundance surveys or observations of fishery mortality without high-quality photographs (Rone and Pace 2012); therefore, the ability to separately assess the two species in U.S. Atlantic waters is complex and requires additional information on seasonal spatial distribution. The long-finned pilot whale is distributed from North Carolina to North Africa (and the Mediterranean) and north to Iceland, Greenland and the Barents Sea (Sergeant 1962; Leatherwood et al. 1976; Abend 1993; Bloch et al. 1993; Abend and Smith 1999). The stock structure of the North Atlantic population is uncertain (ICES 1993; Fullard et al. 2000). Morphometric (Bloch and Lastein 1993) and genetic (Siemann 1994; Fullard et al. 2000) studies have provided little support for stock separation across the Atlantic (Fullard et al. 2000). However, Fullard et al. (2000) have proposed a stock structure that is related to sea-surface temperature: 1) a cold-water population west of the Labrador/North Atlantic current, and 2) a warm-water population that extends across
the Atlantic in the Gulf Stream. In U.S. Atlantic waters, pilot whales (Globicephala sp.) are distributed principally along the continental shelf edge off the northeastern U.S. coast in winter and early spring (CETAP 1982; Payne and Heinemann 1993; Abend and Smith 1999; Hamazaki 2002). In late spring, pilot whales move onto Georges Bank and into the Gulf of Maine and more northern waters, and remain in these areas through late autumn (CETAP 1982; Payne and Heinemann 1993). Pilot whales tend to occupy areas of high relief or submerged banks. They are also associated with the Gulf Stream wall and thermal fronts along the continental shelf edge (Waring et al. 1992). Long-finned and short-finned pilot whales overlap spatially along the mid-Atlantic shelf break between New Jersey and the southern flank of Georges Bank (Payne and Heinemann 1993; Rone and Pace 2012). Long-finned pilot whales have occasionally been observed stranded as far south as South Carolina, and short-finned pilot whales have occasionally been observed stranded as far north as Massachusetts. The latitudinal ranges of the two species therefore remain uncertain, although south of Cape Hatteras, most pilot whale sightings are
Figure 1. Distribution of long-finned (open symbols), short-finned (black symbols), and possibly mixed (gray symbols; could be either species) pilot whale sightings from NEFSC and SEFSC shipboard and aerial surveys during the summers of 1998, 1999, 2002, 2004, 2006, 2007, 2011, and 2016. The inferred distribution of the two species is preliminary and is valid for June-August only. Isobaths are the 1,000-m and 3,000-m depth contours. The U.S. EEZ is also displayed in green.

76
expected to be short-finned pilot whales, while north of ~42°N most pilot whale sightings are expected to be long-finned pilot whales (Figure 1).
POPULATION SIZE The best available estimate for long-finned pilot whales in the western North Atlantic is 5,636 (CV=0.63; Table 1; Palka 2012). This estimate is from summer 2011 surveys covering waters from central Virginia to the lower Bay of Fundy. It should be noted, however, that these surveys did not include areas of the Scotian Shelf where the highest densities of pilot whales were observed in the summer of 2006, therefore they represent an underestimate of the overall abundance of this stock. Because long-finned and short-finned pilot whales are difficult to distinguish at sea, sightings data are reported as Globicephala sp. These survey data have been combined with an analysis of the spatial distribution of the 2 species based on genetic analyses of biopsy samples to derive separate abundance estimates (Garrison and Rosel 2017).
Earlier estimates Please see appendix IV for a summary of abundance estimates including earlier estimates and survey descriptions. As recommended in the GAMMS II Workshop Report (Wade and Angliss 1997), estimates older than eight years are deemed unreliable for the determination of the current PBR. Due to changes in survey methodology, these historical data should not be used to make comparisons with more current estimates.
Recent surveys and abundance estimates for Globicephala sp. An abundance estimate of 11,865 (CV=0.57) Globicephala sp. was generated from aerial and shipboard surveys conducted during June–August 2011 between central Virginia and the lower Bay of Fundy (Palka 2012). The aerial portion covered 6,850 km of tracklines over waters north of New Jersey between the coastline and the 100-m depth contour through the U.S. and Canadian Gulf of Maine, and up to and including the lower Bay of Fundy. Pilot whales were not observed during the aerial portion of the survey. The shipboard portion covered 3,811 km of tracklines between central Virginia and Massachusetts in waters deeper than the 100-m depth contour out to beyond the U.S. Exclusive Economic Zone (EEZ). Both sighting platforms used a double-platform data-collection procedure, which allows estimation of abundance corrected for perception bias of the detected species (Laake and Borchers 2004). Estimation of the abundance was based on the independent-observer approach assuming point independence (Laake and Borchers 2004) and calculated using the mark-recapture distance sampling option in the computer program Distance (version 6.0, release 2, Thomas et al. 2009). The vessel portion of this survey included habitats where both short-finned and long-finned pilot whales occur. A logistic regression (see next section) was used to estimate the abundance of long-finned pilot whales from this survey as 5,636 (CV=0.63). An abundance estimate of 16,946 (CV=0.43) Globicephala sp. was generated from a shipboard survey conducted concurrently (June–August 2011) in waters between central Virginia and central Florida (Garrison 2016). This shipboard survey included shelf-break and inner continental slope waters deeper than the 50-m depth contour within the U.S. EEZ. The survey employed two independent visual teams searching with 25× bigeye binoculars. A total of 4,445 km of tracklines was surveyed, yielding 290 cetacean sightings. The majority of sightings occurred along the continental shelf break north of Cape Hatteras, North Carolina, with a lower number of sightings over the continental slope in the southern portion of the survey. Estimation of pilot whale abundance was based on the independent-observer approach assuming point independence (Laake and Borchers 2004) and calculated using the mark-recapture distance sampling option in the computer program Distance (version 6.0, release 2, Thomas et al. 2009). This survey included habitats where only short-finned pilot whales are expected to occur.
Spatial Distribution and Abundance Estimates for Globicephala melas Biopsy samples from pilot whales were collected during summer months (June–August) from South Carolina to the southern flank of Georges Bank between 1998 and 2007. These samples were identified to species using phylogenetic analysis of mitochondrial DNA sequences Stranded specimens that were morphologically identified to species were used to assign clades in the phylogeny to species and thereby identify all samples. The probability of a sample being from a long-finned (or short-finned) pilot whale was evaluated as a function of sea-surface temperature, latitude, and month using a logistic regression. This analysis indicated that the probability of a sample coming from a long-finned pilot whale was near 1 at water temperatures <22°C, and near 0 at temperatures >25°C. The probability of a long-finned pilot whale also increased with increasing latitude. Spatially, during summer months, this regression model predicted that all pilot whales observed in offshore waters near the Gulf Stream are most likely short-finned pilot whales. The area of overlap between the two species occurs primarily along the shelf break off the coast of New Jersey between 38°N and 40°N latitude (Garrison and Rosel 2017). This model was used to partition the abundance estimates from surveys conducted during the summer of 2011. The sightings from the
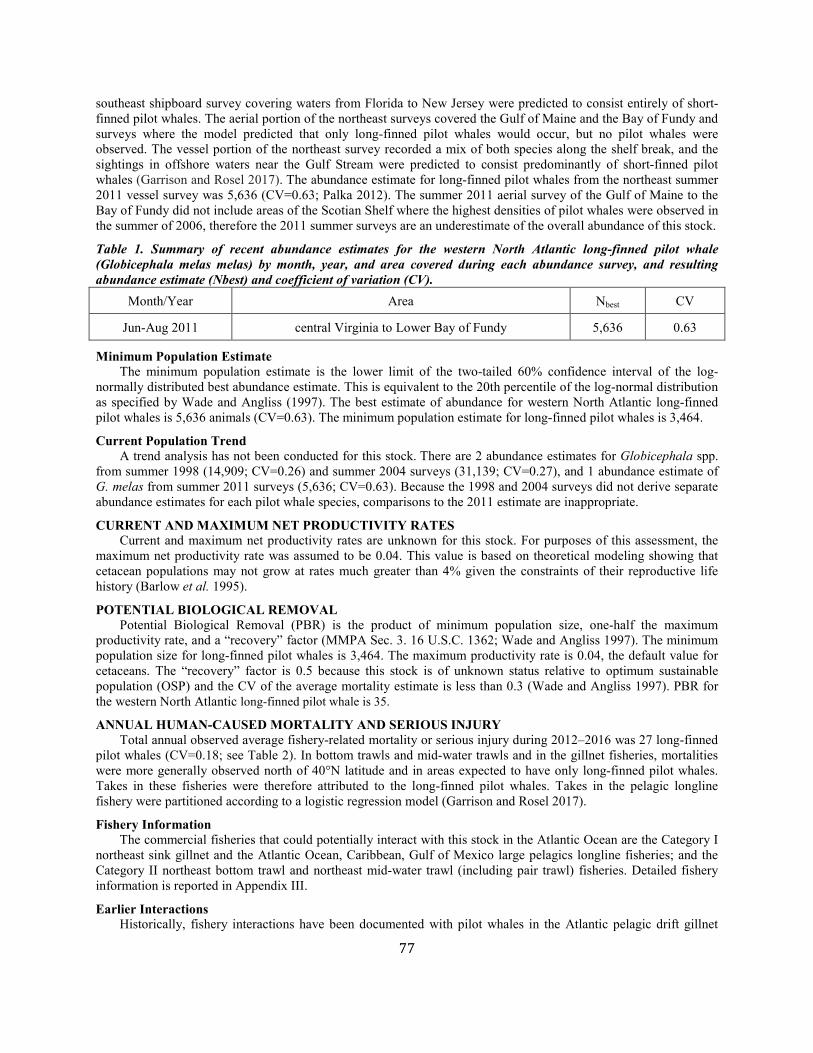
77
southeast shipboard survey covering waters from Florida to New Jersey were predicted to consist entirely of short-finned pilot whales. The aerial portion of the northeast surveys covered the Gulf of Maine and the Bay of Fundy and surveys where the model predicted that only long-finned pilot whales would occur, but no pilot whales were observed. The vessel portion of the northeast survey recorded a mix of both species along the shelf break, and the sightings in offshore waters near the Gulf Stream were predicted to consist predominantly of short-finned pilot whales (Garrison and Rosel 2017). The abundance estimate for long-finned pilot whales from the northeast summer 2011 vessel survey was 5,636 (CV=0.63; Palka 2012). The summer 2011 aerial survey of the Gulf of Maine to the Bay of Fundy did not include areas of the Scotian Shelf where the highest densities of pilot whales were observed in the summer of 2006, therefore the 2011 summer surveys are an underestimate of the overall abundance of this stock.
Table 1. Summary of recent abundance estimates for the western North Atlantic long-finned pilot whale (Globicephala melas melas) by month, year, and area covered during each abundance survey, and resulting abundance estimate (Nbest) and coefficient of variation (CV).
Month/Year Area Nbest CV
Jun-Aug 2011 central Virginia to Lower Bay of Fundy 5,636 0.63
Minimum Population Estimate The minimum population estimate is the lower limit of the two-tailed 60% confidence interval of the log-normally distributed best abundance estimate. This is equivalent to the 20th percentile of the log-normal distribution as specified by Wade and Angliss (1997). The best estimate of abundance for western North Atlantic long-finned pilot whales is 5,636 animals (CV=0.63). The minimum population estimate for long-finned pilot whales is 3,464.
Current Population Trend A trend analysis has not been conducted for this stock. There are 2 abundance estimates for Globicephala spp. from summer 1998 (14,909; CV=0.26) and summer 2004 surveys (31,139; CV=0.27), and 1 abundance estimate of G. melas from summer 2011 surveys (5,636; CV=0.63). Because the 1998 and 2004 surveys did not derive separate abundance estimates for each pilot whale species, comparisons to the 2011 estimate are inappropriate.
CURRENT AND MAXIMUM NET PRODUCTIVITY RATES Current and maximum net productivity rates are unknown for this stock. For purposes of this assessment, the maximum net productivity rate was assumed to be 0.04. This value is based on theoretical modeling showing that cetacean populations may not grow at rates much greater than 4% given the constraints of their reproductive life history (Barlow et al. 1995).
POTENTIAL BIOLOGICAL REMOVAL Potential Biological Removal (PBR) is the product of minimum population size, one-half the maximum productivity rate, and a “recovery” factor (MMPA Sec. 3. 16 U.S.C. 1362; Wade and Angliss 1997). The minimum population size for long-finned pilot whales is 3,464. The maximum productivity rate is 0.04, the default value for cetaceans. The “recovery” factor is 0.5 because this stock is of unknown status relative to optimum sustainable population (OSP) and the CV of the average mortality estimate is less than 0.3 (Wade and Angliss 1997). PBR for the western North Atlantic long-finned pilot whale is 35.
ANNUAL HUMAN-CAUSED MORTALITY AND SERIOUS INJURY Total annual observed average fishery-related mortality or serious injury during 2012–2016 was 27 long-finned pilot whales (CV=0.18; see Table 2). In bottom trawls and mid-water trawls and in the gillnet fisheries, mortalities were more generally observed north of 40°N latitude and in areas expected to have only long-finned pilot whales. Takes in these fisheries were therefore attributed to the long-finned pilot whales. Takes in the pelagic longline fishery were partitioned according to a logistic regression model (Garrison and Rosel 2017).
Fishery Information The commercial fisheries that could potentially interact with this stock in the Atlantic Ocean are the Category I northeast sink gillnet and the Atlantic Ocean, Caribbean, Gulf of Mexico large pelagics longline fisheries; and the Category II northeast bottom trawl and northeast mid-water trawl (including pair trawl) fisheries. Detailed fishery information is reported in Appendix III.
Earlier Interactions Historically, fishery interactions have been documented with pilot whales in the Atlantic pelagic drift gillnet
78
fishery, Atlantic tuna pair trawl and tuna purse seine fisheries, northeast and mid-Atlantic gillnet fisheries, northeast and mid-Atlantic bottom trawl fisheries, northeast midwater trawl fishery, and the pelagic longline fishery. See Appendix V for more information on historical takes.
Longline Most of the estimated marine mammal bycatch in the U.S. pelagic longline fishery was recorded in U.S. Atlantic EEZ waters between South Carolina and Cape Cod (Garrison 2007). During 2010–2013, all observed interactions and estimated bycatch in the pelagic longline fishery was assigned to the short-finned pilot whale stock because the observed interactions all occurred at times and locations where available data indicated that long-finned pilot whales were very unlikely to occur. Specifically, the highest bycatch rates of undifferentiated pilot whales were observed during September–November along the mid-Atlantic coast (south of 40°N; Garrison 2007), and biopsy data collected in this area during October–November 2011 indicated that only short-finned pilot whales occurred in this region (Garrison and Rosel 2017). Similarly, all genetic data collected from interactions in the pelagic longline fishery have indicated interactions with short-finned pilot whales. During 2014–2016, pilot whale interactions (all serious injuries) were apportioned between the short-finned and long-finned pilot whale stocks according to a logistic regression model (described above in 'Spatial Distribution and Abundance Estimates for Globicephala melas') (Garrison and Rosel 2017). See Table 2 for bycatch estimates and observed mortality and serious injury for the current 5-year period, and Appendix V for historical bycatch information.
Northeast Bottom Trawl In addition to takes observed by fisheries observers, the Marine Mammal Authorization Program (MMAP) (http://www.nmfs.noaa.gov/pr/interactions/mmap/) included 2 self-reported incidental takes (mortalities) in trawl gear off Maine and Rhode Island during 2011. Self-reported takes were not used in the estimation process and are not reported in Table 2. Fishery-related bycatch rates for years 2012–2016 were estimated using an annual stratified ratio-estimator (Lyssikatos 2015). See Table 2 for bycatch estimates and observed mortality and serious injury for the current 5-year period, and Appendix V for historical bycatch information.
Northeast Mid-Water Trawl (Including Pair Trawl) One pilot whale was taken in the northeast mid-water trawl fishery in 2012. Three were taken in 2013 near the western edge of Georges Bank. Four were taken in 2014 and 3 during 2016. Using model-based predictions and at-sea identification, these takes have all been assigned as long-finned pilot whales. Expanded estimates of fishery mortality for 2012- 2016 are not available, and so for those years the raw number is provided. See Table 2 for bycatch estimates and observed mortality and serious injury for the current 5-year period, and Appendix V for historical bycatch information. CANADA Unknown numbers of long-finned pilot whales have been taken in Newfoundland, Labrador, and Bay of Fundy groundfish gillnets; Atlantic Canada and Greenland salmon gillnets; and Atlantic Canada cod traps (Read 1994).

79
Table 2. Summary of the incidental mortality and serious injury of long-finned pilot whales (Globicephala melas melas.) by commercial fishery including the years sampled (Years), the type of data used (Data Type), the annual observer coverage coverage (Observer Coverage), the observed mortalities and serious injuries recorded by on-board observers, the estimated annual mortality and serious injury, the combined annual estimates of mortality and serious injury (Estimated Combined Mortality), the estimated CV of the combined estimates (Est. CVs) and the mean of the combined estimates (CV in parentheses). These are minimum observed counts as expanded estimates are not available.
Fishery Years Data Type a
Observer Coverage
b
Observed Serious Injuryc
Observed Mortality
Estimated Serious Injurye
Estimated Mortality
Estimated Combined Mortality
Estimated CVs
Mean Combined
Annual Mortality
Northeast Bottom Trawl
2012 2013 2014 2015 2016
Obs. Data,
Logbook
0.17 0.15 0.17 0.19 0.12
3 0 1 0 0
7 4 5 0 4
10 0 6 0 0
23 16 25 0
29
33 16 32 0
29
0.32 0.42 0.44 na
0.58
22 (0.22)
Northeast Mid-Water
Trawl - Including
Pair Trawl c
2012 2013 2014 2015 2016
Obs. Data,
Dealer Data, VTR Data
0.45 0.37 0.42 0.08 0.27
0 0 0 0 0
1 3 4 0 3
0 0 0 0 0
1 3 4 0 3
1 3 4 0 3
na na na na na
2.2 (na)
Pelagic Longline Fishery
2012 2013 2014 2015 2016
Obs. Data,
Logbook Data
0.07 0.09 0.1
0.12 0.15
0 0 1 1 1
0 0 0 0 0
0 0
9.6 2.2 1.1
0 0 0 0 0
0 0
9.6 2.2 1.1
na na
0.43 0.49 0.6
2.6 (0.34)
TOTAL - - - - - - - - - 27 (0.18) a Observer data (Obs. Data) are used to measure bycatch rates and the data are collected within the Northeast Fisheries Observer Program (NEFOP). NEFSC collects landings data (unallocated Dealer Data and Allocated Dealer Data) which are used as a measure of total landings and mandatory Vessel Trip Reports (VTR) (Trip Logbook) are used to determine the spatial distribution of landings and fishing effort. Total landings are used as a measure of total effort for the coastal gillnet fishery. b The observer coverages for the northeast sink gillnet fishery are ratios based on tons of fish landed. Northeast bottom trawl and northeast mid-water trawl fishery coverages are ratios based on trips. Total observer coverage reported for gillnet and bottom trawl gear in the years starting in 2010 include samples collected from traditional fisheries observers in addition to fishery at-sea monitors through the Northeast Fisheries Observer Program (NEFOP). c Expanded estimates for 2012–2016 are not available for this fishery. d Serious injuries were evaluated for the 2012–2016 period and include both at-sea monitor and traditional observer data (Josephson et al. 2019).
Other Mortality Pilot whales have a propensity to mass strand throughout their range, but the role of human activity in these events is unknown. From 2012 to 2016, 20 long-finned pilot whales (Globicephala melas melas), and 1 pilot whale not specified to the species level (Globicephala sp.) were reported stranded between Maine and Florida, including the EEZ (Table 3; NOAA National Marine Mammal Health and Stranding Response Database, accessed 03 November 2017). Long-finned pilot whales have been reported stranded as far south as Florida, where 2 long-finned pilot whales were reported stranded in November 1998, though their flukes had been apparently cut off, so it is unclear where these animals actually may have died. One additional long-finned pilot whale stranded in South Carolina in 2003, though the confidence in the species identification at the time was only moderate. A genetic sample from this animal has subsequently been sequenced and mitochondrial DNA analysis supports the long-finned pilot whale identification. During 2012–2016, 1 human interaction was documented in stranded pilot whales within the U.S. EEZ. One long-finned pilot whale in 2014 in Maine was classified as a human interaction.
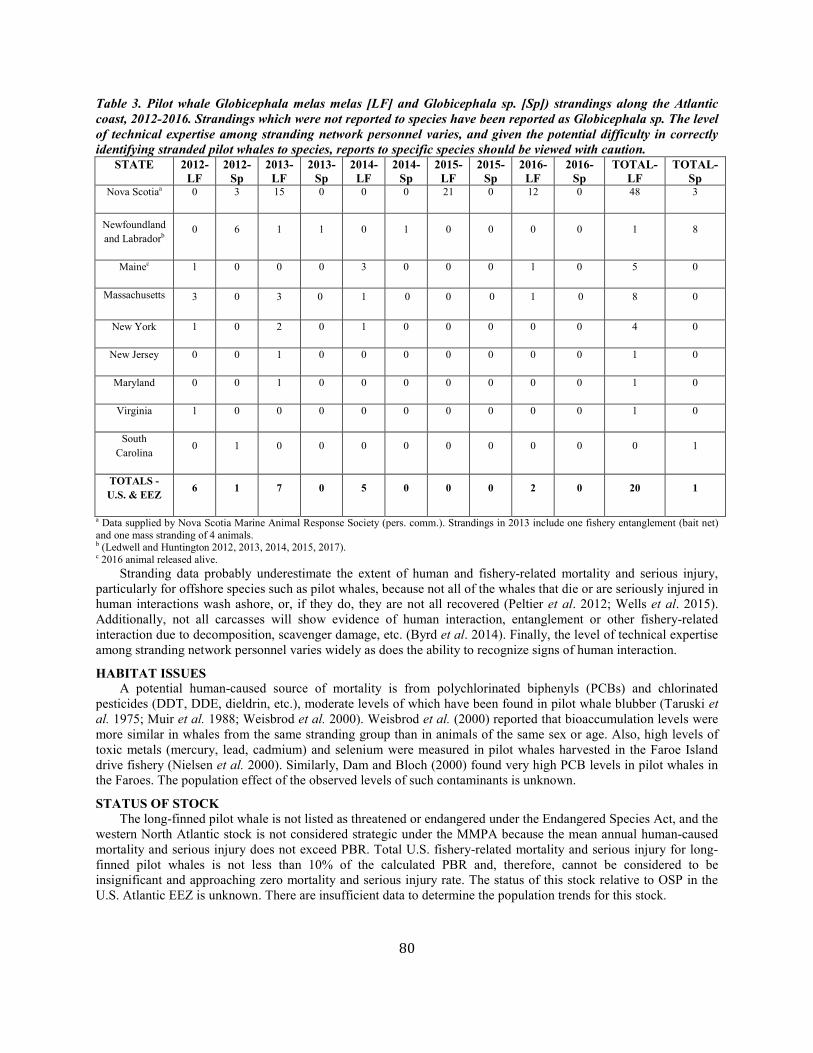
80
Table 3. Pilot whale Globicephala melas melas [LF] and Globicephala sp. [Sp]) strandings along the Atlantic coast, 2012-2016. Strandings which were not reported to species have been reported as Globicephala sp. The level of technical expertise among stranding network personnel varies, and given the potential difficulty in correctly identifying stranded pilot whales to species, reports to specific species should be viewed with caution.
STATE 2012-LF
2012-Sp
2013-LF
2013-Sp
2014-LF
2014-Sp
2015-LF
2015-Sp
2016-LF
2016-Sp
TOTAL-LF
TOTAL-Sp
Nova Scotiaa 0 3 15 0 0 0 21 0 12 0 48 3
Newfoundland and Labradorb
0 6 1 1 0 1 0 0 0 0 1 8
Mainec 1 0 0 0 3 0 0 0 1 0 5 0
Massachusetts 3 0 3 0 1 0 0 0 1 0 8 0
New York 1 0 2 0 1 0 0 0 0 0 4 0
New Jersey 0 0 1 0 0 0 0 0 0 0 1 0
Maryland 0 0 1 0 0 0 0 0 0 0 1 0
Virginia 1 0 0 0 0 0 0 0 0 0 1 0
South Carolina
0 1 0 0 0 0 0 0 0 0 0 1
TOTALS - U.S. & EEZ 6 1 7 0 5 0 0 0 2 0 20 1
a Data supplied by Nova Scotia Marine Animal Response Society (pers. comm.). Strandings in 2013 include one fishery entanglement (bait net) and one mass stranding of 4 animals. b (Ledwell and Huntington 2012, 2013, 2014, 2015, 2017). c 2016 animal released alive. Stranding data probably underestimate the extent of human and fishery-related mortality and serious injury, particularly for offshore species such as pilot whales, because not all of the whales that die or are seriously injured in human interactions wash ashore, or, if they do, they are not all recovered (Peltier et al. 2012; Wells et al. 2015). Additionally, not all carcasses will show evidence of human interaction, entanglement or other fishery-related interaction due to decomposition, scavenger damage, etc. (Byrd et al. 2014). Finally, the level of technical expertise among stranding network personnel varies widely as does the ability to recognize signs of human interaction.
HABITAT ISSUES A potential human-caused source of mortality is from polychlorinated biphenyls (PCBs) and chlorinated pesticides (DDT, DDE, dieldrin, etc.), moderate levels of which have been found in pilot whale blubber (Taruski et al. 1975; Muir et al. 1988; Weisbrod et al. 2000). Weisbrod et al. (2000) reported that bioaccumulation levels were more similar in whales from the same stranding group than in animals of the same sex or age. Also, high levels of toxic metals (mercury, lead, cadmium) and selenium were measured in pilot whales harvested in the Faroe Island drive fishery (Nielsen et al. 2000). Similarly, Dam and Bloch (2000) found very high PCB levels in pilot whales in the Faroes. The population effect of the observed levels of such contaminants is unknown.
STATUS OF STOCK The long-finned pilot whale is not listed as threatened or endangered under the Endangered Species Act, and the western North Atlantic stock is not considered strategic under the MMPA because the mean annual human-caused mortality and serious injury does not exceed PBR. Total U.S. fishery-related mortality and serious injury for long-finned pilot whales is not less than 10% of the calculated PBR and, therefore, cannot be considered to be insignificant and approaching zero mortality and serious injury rate. The status of this stock relative to OSP in the U.S. Atlantic EEZ is unknown. There are insufficient data to determine the population trends for this stock.
81
REFERENCES CITED Abend, A. 1993. Long-finned pilot whale distribution and diet as determined from stable carbon and nitrogen ratio
isotope tracers. M.S. thesis, University of Massachusetts, Amherst, MA. 147 pp. Abend, A.G. and T.D. Smith. 1999. Review of distribution of the long-finned pilot whale (Globicephala melas) in
the North Atlantic and Mediterranean. NOAA Tech. Memo. NMFS-NE-117. 22 pp. Barlow, J., S.L. Swartz, T.C. Eagle and P.R. Wade. 1995. U.S. marine mammal stock assessments: Guidelines for
preparation, background, and a summary of the 1995 assessments. NOAA Tech. Memo. NMFS-OPR-6. 73 pp.
Bloch, D. and L. Lastein. 1993. Morphometric segregation of long-finned pilot whales in eastern and western North Atlantic. Ophelia 38: 55-68.
Bloch, D., M. Zachariassen and P. Zachariassen. 1993. Some external characters of the long-finned pilot whale off Faroe Island and a comparison with the short-finned pilot whale. Rep. Int. Whal. Comm. (Special Issue) 14: 117-135.
Byrd, B.L., A.A. Hohn, G.N. Lovewell, K.M. Altman, S.G. Barco, A. Friedlaender, C.A. Harms, W.A. McLellan, K.T. Moore, P.E. Rosel and V.G. Thayer. 2014. Strandings illustrate marine mammal biodiversity and human impacts off the coast of North Carolina, USA. Fish. Bull. 112: 1-23.
CETAP. 1982. A characterization of marine mammals and turtles in the mid- and North Atlantic areas of the U.S. outer continental shelf, final report, Cetacean and Turtle Assessment Program, University of Rhode Island. #AA551-CT8-48. Bureau of Land Management, Washington, DC. 576 pp.
Dam, M. and D. Bloch. 2000. Screening of mercury and persistent organochlorine pollutants in long-finned pilot whale (Globicephala melas) in the Faroe Islands. Mar. Poll. Bull. 40: 1090-1099.
Fullard, K.J., G. Early, M.P. Heide-Jorgensen, D. Bloch, A. Rosing-Asvid and W. Amos 2000. Population structure of long-finned pilot whales in the North Atlantic: a correlation with sea surface temperature? Mol. Ecol. 9: 949-958.
Garrison, L.P. 2007. Interactions between marine mammals and longline fishing gear in the U.S. Atlantic Ocean between 1992 and 2004. Fish. Bull. 105: 408-417.
Garrison, L.P. 2016. Abundance of marine mammals in waters of the U.S. East Coast during summer 2011. Southeast Fisheries Science Center, Protected Resources and Biodiversity Division, 75 Virginia Beach Dr., Miami, FL 33140. PRBD Contribution # PRBD-2016-08, 21 pp.
Garrison, L.P. and P.E. Rosel. 2017. Partitioning short-finned and long-finned pilot whale bycatch estimates using habitat and genetic information. Southeast Fisheries Science Center, Protected Resources and Biodiversity Division, 75 Virginia Beach Dr., Miami, FL 33140. PRBD Contribution # PRBD-2016-17, 24 pp.
Hamazaki, T. 2002. Spatiotemporal prediction models of cetacean habitats in the mid-western North Atlantic Ocean (from Cape Hatteras, No. Carolina, USA to Nova Scotia, Canada). Mar. Mamm. Sci. 18(4): 920-939.
ICES. 1993. Report of the study group on long-finned pilot whales, Copenhagen, Denmark, ICES [International Council for the Exploration of the Sea], 30 August - 3 September 1993. CM 1993/N:5.
Laake, J.L. and D.L. Borchers. 2004. Methods for incomplete detection at distance zero. Pages 108–189 in: Advanced distance sampling, S.T. Buckland, D.R. Andersen, K.P. Burnham, J.L. Laake, and L. Thomas, (eds.), Oxford University Press, New York.
Leatherwood, S., D.K. Caldwell and H.E. Winn. 1976. Whales, dolphins, and porpoises of the western North Atlantic. A guide to their identification. NOAA Tech. Rep. NMFS CIRC-.396. 176 pp.
Ledwell, W. and J. Huntington. 2012. Incidental entanglements of cetaceans and leatherback sea turtles in fishing gear reported during 2011-2012 and a summary of the Whale Release and Strandings Group activities. Report to the Department of Fisheries and Oceans Canada, St. John's, Newfoundland, Canada. 17 pp.
Ledwell, W. and J. Huntington. 2012b. Incidental entrapments in fishing gear and stranding reported to and responded to by the Whale Release and Strandings Group in Newfoundland and Labrador and a summary of the Whale Release and Strandings program during 2012. Report to Fisheries and Oceans Canada, St. John's, Newfoundland, Canada. 18 pp.
Ledwell, W. and J. Huntington. 2013. Incidental entrapments in fishing gear and stranding reported to and responded to by the Whale Release and Strandings Group in Newfoundland and Labrador and a summary of the Whale Release and Strandings program during 2013. Report to Fisheries and Oceans Canada, St. John's, Newfoundland, Canada. 19 pp.
Ledwell, W. and J. Huntington. 2014. Incidental entrapments in fishing gear and stranding reported to and responded to by the Whale Release and Strandings Group in Newfoundland and Labrador and a summary

82
of the Whale Release and Strandings program during 2014. Report to Fisheries and Oceans Canada, St. John's, Newfoundland, Canada. 19 pp.
Ledwell, W. and J. Huntington. 2015. Incidental entrapments in fishing gear and stranding reported to and responded to by the Whale Release and Strandings Group in Newfoundland and Labrador and a summary of the Whale Release and Strandings program during 2015. Report to Fisheries and Oceans Canada, St. John's, Newfoundland, Canada. 22 pp.
Ledwell, W. and J. Huntington. 2017. Incidental entrapments in fishing gear and stranding reported to and responded to by the Whale Release and Strandings Group in Newfoundland and Labrador and a summary of the Whale Release and Strandings program during 2016. Report to Fisheries and Oceans Canada, St. John's, Newfoundland, Canada. 23 pp.
Lyssikatos, M. 2015. Estimates of Cetacean and Pinniped Bycatch in Northeast and mid-Atlantic bottom trawl fisheries, 2008-2013. Northeast Fish Sci Cent Ref Doc. 15-19. 20 p. Available at http://www.nefsc.noaa.gov/publications/.Muir, D.C.G., R. Wagemann, N.P. Grift, R.J. Norstrom, M. Simon and J. Lien. 1988. Organochlorine chemical and heavy metal contaminants in white-beaked dolphins (Lagenorhynchus albirostris) and pilot whales (Globicephala melaena) from the coast of Newfoundland, Canada. Arch. Environ. Contam. Toxicol. 17(5): 613-629.
Nielsen, J.B., F. Nielsen, P.-J. Jorgensen and P. Grandjean. 2000. Toxic metals and selenium in blood from pilot whales (Globicephala melas) and sperm whales (Physeter catodon). Mar. Poll. Bull. 40: 348-35.
http://www.nefsc.noaa.gov/nefsc/publications/crd/crd0603/crd0603.pdf Palka, D. 2012. Cetacean abundance estimates in US northwestern Atlantic Ocean waters from summer 2011 line
transect survey. Northeast Fish. Sci. Cent. Ref. Doc. 12-29, 37 pp. Available from: http://www.nefsc.noaa.gov/nefsc/publications/
Payne, P.M. and D.W. Heinemann 1993. The distribution of pilot whales (Globicephala sp.) in shelf/shelf edge and slope waters of the northeastern United States, 1978-1988. Rep. Int. Whal. Comm. (Special Issue) 14: 51-68.
Peltier, H., W. Dabin, P. Daniel, O. Van Canneyt, G. Dorémus, M. Huon and V. Ridoux. 2012. The significance of stranding data as indicators of cetacean populations at sea: modelling the drift of cetacean carcasses. Ecol. Indic. 18: 278–290.
Read, A.J. 1994. Interactions between cetaceans and gillnet and trap fisheries in the northwest Atlantic. Rep. Int. Whal. Comm. (Special Issue) 15: 133-147.
Rone, B.K. and R.M. Pace, III. 2012. A simple photograph-based approach for discriminating between free-ranging long-finned (Globicephala melas) and short-finned (G. macrorhynchus) pilot whales off the east coast of the United States. Mar. Mamm. Sci. 28(2): 254-275.
Sergeant, D.E. 1962. The biology of the pilot or pothead whale (Globicephala melaena (Traill)) in Newfoundland waters. Bull. Fish. Res. Bd. Can 132: 1-84.
Siemann, L. 1994. Mitochondrial DNA sequence variation in North Atlantic long-finned pilot whales, Globicephala melas. Ph.D. thesis, Massachusetts Institute of Technology/ Woods Hole Oceanographic Institution.
Taruski, A.G., C.E. Olney and H.E. Winn 1975. Chlorinated hydrocarbons in cetaceans. J. Fish. Res. Brd. Can. 32(11): 2205-2209.
Thomas, L., J.L. Laake, E. Rexstad, S. Strindberg, F.F.C. Marques, S.T. Buckland, D.L. Borchers, D.R. Anderson, K.P. Burnham, M.L. Burt, S.L. Hedley, J.H. Pollard, J.R.B. Bishop and T.A. Marques 2009. Distance 6.0. Release 2. [Internet]. University of St. Andrews (UK): Research Unit for Wildlife Population Assessment. Available from: http://distancesampling.org/Distance/.
Wade, P.R. and R.P. Angliss 1997. Guidelines for assessing marine mammal stocks: Report of the GAMMS Workshop April 3-5, 1996, Seattle, Washington. NOAA Tech. Memo. NMFS-OPR-12. 93 pp.
Waring, G.T., C.P. Fairfield, C.M. Ruhsam and M. Sano 1992. Cetaceans associated with Gulf Stream features off the northeastern USA Shelf. ICES [Int. Counc. Explor. Sea] C.M. 1992/N:12.
Weisbrod, A.V., D. Shea, M.J. Moore and J.J. Stegeman 2000. Bioaccumulation patterns of polychlorinated biphenyls and chlorinated pesticides in northwest Atlantic pilot whales. Environ. Toxicol. Chem. 19: 667-677.
Wells, R.S., J.B. Allen, G. Lovewell, J. Gorzelany, R.E. Delynn, D.A. Fauquier and N.B. Barros. 2015. Carcass-recovery rates for resident bottlenose dolphins in Sarasota Bay, Florida. Mar. Mamm. Sci. 31(1): 355-368.
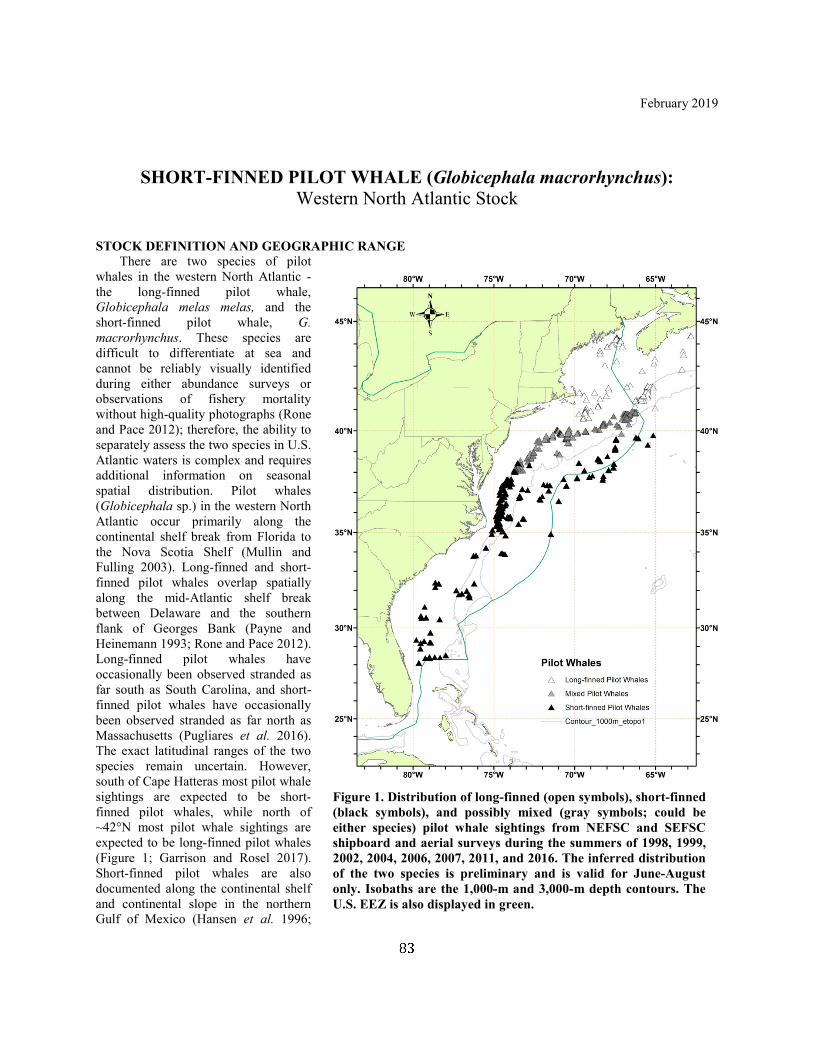
83
February 2019
SHORT-FINNED PILOT WHALE (Globicephala macrorhynchus):
Western North Atlantic Stock STOCK DEFINITION AND GEOGRAPHIC RANGE There are two species of pilot whales in the western North Atlantic - the long-finned pilot whale, Globicephala melas melas, and the short-finned pilot whale, G. macrorhynchus. These species are difficult to differentiate at sea and cannot be reliably visually identified during either abundance surveys or observations of fishery mortality without high-quality photographs (Rone and Pace 2012); therefore, the ability to separately assess the two species in U.S. Atlantic waters is complex and requires additional information on seasonal spatial distribution. Pilot whales (Globicephala sp.) in the western North Atlantic occur primarily along the continental shelf break from Florida to the Nova Scotia Shelf (Mullin and Fulling 2003). Long-finned and short-finned pilot whales overlap spatially along the mid-Atlantic shelf break between Delaware and the southern flank of Georges Bank (Payne and Heinemann 1993; Rone and Pace 2012). Long-finned pilot whales have occasionally been observed stranded as far south as South Carolina, and short-finned pilot whales have occasionally been observed stranded as far north as Massachusetts (Pugliares et al. 2016). The exact latitudinal ranges of the two species remain uncertain. However, south of Cape Hatteras most pilot whale sightings are expected to be short-finned pilot whales, while north of ~42°N most pilot whale sightings are expected to be long-finned pilot whales (Figure 1; Garrison and Rosel 2017). Short-finned pilot whales are also documented along the continental shelf and continental slope in the northern Gulf of Mexico (Hansen et al. 1996;
Figure 1. Distribution of long-finned (open symbols), short-finned (black symbols), and possibly mixed (gray symbols; could be either species) pilot whale sightings from NEFSC and SEFSC shipboard and aerial surveys during the summers of 1998, 1999, 2002, 2004, 2006, 2007, 2011, and 2016. The inferred distribution of the two species is preliminary and is valid for June-August only. Isobaths are the 1,000-m and 3,000-m depth contours. The U.S. EEZ is also displayed in green.

84
Mullin and Hoggard 2000; Mullin and Fulling 2003), and are known from the wider Caribbean (Bernard and Riley 1999). Five short-finned pilot whales tagged in the Great Bahama Canyon, northern Bahamas, were tracked into the Gulf Stream and moved north to deep waters off the coast of central and northern Florida (Claridge et al. 2015), suggesting the potential for connectivity between pilot whales in the southern U.S. range of this stock and the Caribbean. However, none of the tagged whales moved north of South Carolina (Claridge et al. 2015) which could suggest multiple populations in the stock range (e.g., a northern and a southern population), or simply that tag duration was too short to detect broader movements. Two tagged and released individuals from a May 2011 mass stranding of 23 short-finned pilot whales in the Florida Keys travelled to waters off South Carolina, and one subsequently moved to waters between Cuba and Haiti (Wells et al. 2013). Short-finned pilot whales tagged during a 1977 mass stranding near Jacksonville were recovered off South Carolina (Irvine et al. 1979). It is not known how representative of normal species patterns any of these movements are. An analysis of stock structure within the western North Atlantic Stock has not been completed so there are insufficient data to determine whether there are multiple demographically-independent populations within this stock. Continued studies to evaluate genetic population structure in short-finned pilot whales throughout the region will improve understanding of stock structure. Pending these results, the Globicephala macrorhynchus population occupying U.S. Atlantic waters is considered separate from both the northern Gulf of Mexico stock and short-finned pilot whales occupying Caribbean waters.
POPULATION SIZE The best available estimate for short-finned pilot whales in the western North Atlantic is 28,924 (CV=0.24; Table 1; Palka 2012; Garrison 2016; Garrison and Rosel 2017; Garrison and Palka 2018). This estimate is from summer 2016 surveys covering waters from central Florida to Georges Bank. Pilot whale sightings from vessel surveys were strongly concentrated along the continental shelf break; however, pilot whales were also observed over the continental slope in waters associated with the Gulf Stream (Figure 1). The best available abundance estimates are from shipboard surveys conducted during the summer of 2016 because these are the most recent surveys covering the full range of short-finned pilot whales in U.S. Atlantic waters. Because long-finned and short-finned pilot whales are difficult to distinguish at sea, sightings data are reported as Globicephala sp. These survey data have been combined with an analysis of the spatial distribution of the two pilot whale species based on genetic analyses of biopsy samples to derive separate abundance estimates for each species (Garrison and Rosel 2017).
Earlier Estimates Please see Appendix IV for a summary of abundance estimates including earlier estimates and survey descriptions. Due to changes in survey methodology, these historical data should not be used to make comparisons with more current estimates. In addition, as recommended in the GAMMS II Workshop Report (Wade and Angliss 1997), estimates older than eight years are deemed unreliable for the determination of a current PBR.
Recent surveys and abundance estimates for Globicephala sp. For waters between central Virginia and the lower Bay of Fundy, an abundance estimate of 11,865 (CV=0.57) Globicephala sp. was generated from aerial and shipboard surveys conducted during June–August 2011 (Palka 2012). The aerial portion covered 6,850 km of trackline over waters north of New Jersey between the coastline and the 100-m depth contour through the U.S. and Canadian Gulf of Maine, and up to and including the lower Bay of Fundy. Pilot whales were not observed during the aerial portion of the survey. The shipboard portion covered 3,811 km of trackline between central Virginia and Massachusetts in waters deeper than the 100-m depth contour out to beyond the U.S. Exclusive Economic Zone (EEZ). Estimation of abundance was based on the independent observer approach, which allows estimation of abundance corrected for perception bias of the detected species, assuming point independence (Laake and Borchers 2004) and calculated using the mark-recapture distance sampling option in the computer program Distance (version 6.0, release 2, Thomas et al. 2009). The vessel portion of this survey included habitats where both short-finned and long-finned pilot whales occur. Short-finned pilot whales are not predicted to occur north of Georges Bank. A logistic regression (see next section) was used to estimate the abundance of short-finned pilot whales from this survey as 4,569 (CV=0.57). For waters between central Virginia and central Florida, an abundance estimate of 16,946 (CV=0.43) Globicephala sp. was generated from a shipboard survey conducted during June–August 2011 (Garrison 2016). This shipboard survey included shelf-break and inner continental slope waters deeper than the 50-m depth contour within the U.S. EEZ. The survey employed two independent visual teams searching with 25x150 “bigeye” binoculars. A total of 4,445 km of trackline was surveyed. The majority of pilot whale sightings occurred along the continental shelf break north of Cape Hatteras, North Carolina, with a lower number of sightings over the continental slope in

85
the southern portion of the survey. Estimation of pilot whale abundance was based on the independent observer approach, which allows estimation of abundance corrected for perception bias of the detected species, assuming point independence (Laake and Borchers 2004) and calculated using the mark-recapture distance sampling option in the computer program Distance (version 6.0, release 2, Thomas et al. 2009). A logistic regression (see next section) was used to estimate the abundance of short-finned pilot whales from this survey. The regression indicated this survey included habitats expected to exclusively contain short-finned pilot whales resulting in an abundance estimate of 16,946 (CV=0.43) short-finned pilot whales from this survey. Abundance estimates of 8,166 (CV=0.31) and 25,114 (CV=0.27) Globicephala sp. were generated from vessel surveys conducted in the northeast and southeast U.S., respectively, during the summer of 2016. The Northeast survey was conducted during 27 June – 25 August and consisted of 5,354 km of on-effort trackline. The majority of the survey was conducted in waters north of 38ºN latitude and included tracklines along the shelf break and offshore to the U.S. EEZ. Pilot whale sightings were concentrated along the shelf-break between the 1,000-m and 2,000-m isobaths and along Georges Bank (NMFS 2017). The Southeast vessel survey covered waters from Central Florida to approximately 38ºN latitude between the 100-m isobaths and the U.S. EEZ during 30 June – 19 August. A total of 4,399 km of trackline was covered on effort. Pilot whales were observed in high densities along the shelf-break between Cape Hatteras and New Jersey and also in waters further offshore in the mid-Atlantic and off the coast of Florida (NMFS 2017; Garrison and Palka 2018). Both the Northeast and Southeast surveys utilized two visual teams and an independent observer approach to estimate detection probability on the trackline (Laake and Borchers 2004). Mark-recapture distance sampling was used to estimate abundance. A logistic regression model (see next section) was used to estimate the abundance of short-finned pilot whales from these surveys. For the northeast survey, this resulted in an abundance estimate of 3,810 (CV=0.42) short-finned pilot whales. In the southeast, the model indicated that this survey included habitats expected to exclusively contain short-finned pilot whales resulting in an abundance estimate of 25,114 (CV=0.27).
Spatial Distribution and Abundance Estimates for Globicephala macrorhynchus Pilot whale biopsy samples were collected during summer months (June–August) from South Carolina to the southern flank of Georges Bank between 1998 and 2007. These samples were identified to species using phylogenetic analysis of mitochondrial DNA sequences. Samples from stranded specimens that were morphologically identified to species were used to assign clades in the phylogeny to species and thereby identify all survey samples. The probability of a sample being from a short-finned (or long-finned) pilot whale was evaluated as a function of sea surface temperature, latitude, and month using a logistic regression. This analysis indicated that the probability of a sample coming from a short-finned pilot whale was near zero at water temperatures <22°C, and near one at temperatures >25°C. The probability of being a short-finned pilot whale also decreased with increasing latitude. Spatially, during summer months, this regression model predicted that all pilot whales observed in offshore waters near the Gulf Stream are most likely short-finned pilot whales. The area of overlap between the two species occurs primarily along the shelf break between 38°N and 40°N latitude (Garrison and Rosel 2017). This model was used to partition the abundance estimates from surveys conducted during the summers of 2011 and 2016. The sightings from the shipboard surveys covering waters from Florida to New Jersey were predicted to consist entirely of short-finned pilot whales. The vessel portion of the northeast surveys from New Jersey to the southern flank of Georges Bank included waters along the shelf break and waters further offshore extending to the U.S. EEZ. Pilot whales were observed in both areas during the survey. Along the shelf break, the model predicted a mixture of both species, but the sightings in offshore waters near the Gulf Stream were again predicted to consist predominantly of short-finned pilot whales (Garrison and Rosel 2017). The best abundance estimate for short-finned pilot whales is thus the sum of the southeast survey estimate (25,114; CV=0.27) and the estimated number of short-finned pilot whales from the northeast vessel survey (3,810; CV=0.42). The best available abundance estimate is thus 28,924 (CV=0.24).
Table 1. Summary of recent abundance estimates for the western North Atlantic short-finned pilot whale (Globicephala macrorhynchus) by month, year, and area covered during each abundance survey, and resulting abundance estimate (Nbest) and coefficient of variation (CV).
Month/Year Area Nbest CV
Jun–Aug 2011 central Virginia to Georges Bank 4,569 0.57
Jun–Aug 2011 central Florida to central Virginia 16,946 0.43

86
Month/Year Area Nbest CV
Jun–Aug 2011 central Florida to Georges Bank (COMBINED) 21,515 0.37
Jun–Aug 2016 New Jersey to Georges Bank 3,810 0.42
Jun–Aug 2016 central Florida to New Jersey 25,114 0.27
Jun–Aug 2016 central Florida to Georges Bank (COMBINED) 28,924 0.24
Minimum Population Estimate The minimum population estimate is the lower limit of the two-tailed 60% confidence interval of the log-normally distributed best abundance estimate. This is equivalent to the 20th percentile of the log-normal distribution as specified by Wade and Angliss (1997). The best estimate of abundance for western North Atlantic Globicephala macrorhnychus is 28,924 animals (CV=0.24). The minimum population estimate is 23,637.
Current Population Trend There are three available coastwide abundance estimates for short-finned pilot whales from the summers of 2004, 2011, and 2016. Each of these is derived from vessel surveys with similar survey designs and all three used the two-team independent observer approach to estimate abundance. The southeast component of these surveys all were expected to contain exclusively short-finned pilot whales, and the logistic regression model was used to partition pilot whale sightings from the northeast portion of the survey between the short-finned and long-finned species based upon habitat characteristics. The resulting estimates were 24,674 (CV=0.52) in 2004, 21,515 (CV=0.36) in 2011, and 28,924 (CV=0.24) in 2016 (Garrison and Palka 2018). A generalized linear model indicated no significant trend in these abundance estimates. The key uncertainty is the assumption that the logistic regression model accurately represents the relative distribution of short-finned vs. long-finned pilot whales in each year.
CURRENT AND MAXIMUM NET PRODUCTIVITY RATES Current and maximum net productivity rates are unknown for this stock. For purposes of this assessment, the maximum net productivity rate was assumed to be 0.04. This value is based on theoretical modeling showing that cetacean populations may not grow at rates much greater than 4% given the constraints of their reproductive life history (Barlow et al. 1995).
POTENTIAL BIOLOGICAL REMOVAL Potential Biological Removal (PBR) is the product of minimum population size, one-half the maximum productivity rate, and a “recovery” factor (MMPA Sec. 3. 16 U.S.C. 1362; Wade and Angliss 1997). The minimum population size for short-finned pilot whales is 23,637. The maximum productivity rate is 0.04, the default value for cetaceans. The “recovery” factor is 0.5 because the stock's status relative to optimum sustainable population (OSP) is unknown and the CV of the average mortality estimate is less than 0.3 (Wade and Angliss 1997). PBR for the western North Atlantic short-finned pilot whale is 236.
ANNUAL HUMAN-CAUSED MORTALITY AND SERIOUS INJURY The total annual human-caused mortality and serious injury for this stock during 2012–2016 is unknown. The estimated mean annual fishery-related mortality and serious injury during 2012–2016 due to the pelagic longline fishery was 168 short-finned pilot whales (CV=0.13; Table 2). Uncertainty in this estimate arises because it incorporates a logistic regression model to predict the species of origin (long-finned or short-finned pilot whale) for each bycaught whale. The statistical uncertainty in the assignment to species is incorporated into the abundance estimates; however, the analysis assumes that the collected biopsy samples adequately represent the distribution of the two species and that the resulting model correctly predicts shifts in distribution in response to changes in environmental conditions. In addition to observed takes in the pelagic longline fishery, there was a self-reported take in 2013 in the unobserved hook and line fishery. This unobserved take renders the estimate of total annual fishery-caused mortality and serious injury an underestimate. In bottom trawl, mid-water trawl, and gillnet fisheries, pilot whale mortalities were observed north of 40°N latitude in areas expected to have only long-finned pilot whales. Takes and bycatch estimates for these fisheries are therefore attributed to the long-finned pilot whale stock.
87
Fishery Information There are four commercial fisheries that interact, or that potentially could interact, with this stock in the Atlantic Ocean. These include two Category I fisheries (Atlantic Ocean, Caribbean, Gulf of Mexico large pelagics longline and Atlantic Highly Migratory Species longline fisheries) and two Category III fisheries (U.S. Atlantic tuna purse seine and Atlantic Ocean, Gulf of Mexico, Caribbean commercial passenger fishing vessel (hook and line) fisheries). All recent gillnet and trawl interactions have been assigned to long-finned pilot whales using model-based predictions. Detailed fishery information is reported in Appendix III.
Earlier Interactions See Appendix V for information on historical takes.
Longline The Atlantic Ocean, Caribbean, Gulf of Mexico large pelagics longline fishery operates in the U.S. Atlantic (including Caribbean) and Gulf of Mexico EEZ, and pelagic swordfish, tunas and billfish are the target species. The estimated annual average serious injury and mortality attributable to the Atlantic Ocean large pelagics longline fishery for the five-year period from 2012 to 2016 was 168 short-finned pilot whales (CV=0.13; Table 2). During 2012–2016, 92 serious injuries were observed in the following fishing areas of the North Atlantic: Florida East Coast, Mid-Atlantic Bight, Northeast Coastal, and South Atlantic Bight. During 2012–2016, one mortality was observed (in 2016) in the Florida East Coast fishing area (Garrison and Stokes 2013; 2014; 2016; 2017; 2019). Prior to 2014, estimated bycatch in the pelagic longline fishery was assigned to the short-finned pilot whale stock because the observed interactions all occurred at times and locations where available data indicated that long-finned pilot whales were very unlikely to occur. Specifically, the highest bycatch rates of undifferentiated pilot whales were observed during September–November along the mid-Atlantic coast (south of 38°N; Garrison 2007), and biopsy data collected in this area during October–November 2011 indicated that only short-finned pilot whales occurred in this region (Garrison and Rosel 2017). Similarly, all genetic data collected from interactions in the pelagic longline fishery have indicated interactions with short-finned pilot whales. However, during 2014–2016, pilot whale interactions (including serious injuries) were observed further north and along the southern flank of Georges Bank. Therefore, the logistic regression model (described above in 'Spatial Distribution and Abundance Estimates for Globicephala macrorhynchus') was applied to estimate the probability that these interactions were from short-finned vs. long-finned pilot whales (Garrison and Rosel 2017). Due to high water temperatures (ranging from 22 to 25ºC) at the time of the observed takes, these interactions were estimated to have a >90% probability of coming from short-finned pilot whales. The estimated probability was used to apportion the estimated serious injury and mortality from 2014 to 2016 in the pelagic longline fishery between the short-finned and long-finned pilot whale stocks (Garrison and Stokes 2016; 2017; 2019). Between 1992 and 2004, most of the marine mammal bycatch in the U.S. pelagic longline fishery was recorded in U.S. Atlantic EEZ waters between South Carolina and Cape Cod (Garrison 2007). From January to March, observed bycatch was concentrated on the continental shelf edge northeast of Cape Hatteras, North Carolina. During April–June, bycatch was recorded in this area as well as north of Hydrographer Canyon in water over 1,000 fathoms (1830 m) deep. During the July–September period, observed takes occurred on the continental shelf edge east of Cape Charles, Virginia, and on Block Canyon slope in over 1,000 fathoms of water. October–December bycatch occurred between the 20- and 50-fathom (37- and 92-m) isobaths between Barnegat Bay, New Jersey, and Cape Hatteras, North Carolina. The Atlantic Highly Migratory Species longline fishery operates outside the U.S. EEZ. No takes of short-finned pilot whales within high seas waters of the Atlantic Ocean have been observed or reported thus far. See Table 2 for bycatch estimates and observed mortality and serious injury for the current five-year period, and Appendix V for historical estimates of annual mortality and serious injury.

88
Table 2. Summary of the incidental mortality and serious injury of short-finned pilot whales (Globicephala macrorhynchus) by the pelagic longline commercial fishery including the years sampled (Years), the number of vessels active within the fishery (Vessels), the type of data used (Data Type), the annual observer coverage (Observer Coverage), the annual observed serious injury and mortality recorded by on-board observers, the annual estimated serious injury and mortality, the combined annual estimates of serious injury and mortality (Estimated Combined Mortality), the estimated CV of the combined annual mortality estimates (Est. CVs) and the mean of the combined mortality estimates (CV in parentheses).
a Number of vessels in the fishery is based on vessels reporting effort to the pelagic longline logbook. b Observer data (Obs. Data) are used to measure bycatch rates and the data are collected within the Northeast Fisheries Observer Program (NEFOP) and the Southeast Pelagic Longline Observer Program. c Percentage of sets observed
Hook and Line During 2012–2016, there was one self-reported take (in 2013) in which a short-finned pilot whale was hooked and entangled by a charterboat fisherman. The animal was released alive but considered seriously injured (Maze-Foley and Garrison 2016).
Other Mortality Pilot whales have a propensity to mass strand throughout their range, but the role of human activity in these events is unknown. Between two and 168 pilot whales have stranded annually, either individually or in groups, along the eastern U.S. seaboard since 1980 (NMFS 1993; stranding databases maintained by NMFS NER, NEFSC and SEFSC). During 2012–2016, 39 short-finned pilot whales (Globicephala macrorhynchus) and one pilot whale not specified to the species level (Globicephala sp.) were reported stranded between Massachusetts and Florida (Table 3; Northeast Regional Marine Mammal Stranding Network; Southeast Regional Marine Mammal Stranding Network; NOAA National Marine Mammal Health and Stranding Response Database unpublished data, accessed 28 April June 2017 (SER) and 5 May 2017 (NER)).
Table 3. Short-finned pilot whale (Globicephala macrorhynchus [SF] and Globicephala sp. [Sp]) strandings along the Atlantic coast, 2012–2016. Strandings which were not reported to species have been reported as Globicephala sp. The level of technical expertise among stranding network personnel varies, and given the potential difficulty in correctly identifying stranded pilot whales to species, reports to specific species should be viewed with caution. Data are from the NOAA National Marine Mammal Health and Stranding Response Database unpublished data, accessed 28 April June 2017 (SER) and 5 May 2017 (NER).
STATE 2012-SF
2012-Sp
2013-SF
2013-Sp
2014-SF
2014-Sp
2015-SF
2015-Sp
2016-SF
2016-Sp
TOTAL-SF
TOTAL-Sp
Massachusetts 0 0 0 0 0 0 0 0 1 0 1 0
North Carolina 1a 0 0 0 3 0 2 0 0 0 6 0
South Carolina 3b 1 1 0 2 0 0 0 0 0 6 1
Georgia 0 0 0 0 0 0 1 0 0 0 1 0
Florida 23c 0 0 0 0 0 2 0 0 0 25 0
TOTALS 27 1 1 0 5 0 5 0 1 0 39 1 a Signs of fishery interaction were observed for this short-finned pilot whale stranding.
Fishery Years
Vesselsa
Data Type
b
Percent Observer Coveragec
Observed Serious Injury
Observed Mortality
Est. Serious Injury
Est. Mortality
Est. Combined Mortality
Est.
CVs
Mean Annual
Mortality
Pelagic Longline
2012 2013 2104 2015 2016
82 79 78 74 60
Obs. Data,
Logbook
7 9
10 12 15
14 13 19 32 14
0 0 0 0 1
170 124 233 200 106
0 0 0 0
5.1
170 124 233 200 111
0.33 0.32 0.24 0.24 0.31
168 (0.13)
89
b Signs of fishery interaction were observed for 2 of these short-finned pilot whale strandings. c These animals mass stranded alive in September 2012. One short-finned pilot whale stranding was reported as far north as Cape Cod, Massachusetts (2016); the remaining strandings occurred from North Carolina southward (Table 3). During 2012–2016, several fishery interactions were documented in stranded pilot whales along the U.S. Atlantic coast. In 2012, three short-finned pilot whales had evidence of fishery interactions, two of them in South Carolina and one in North Carolina. During 2012–2016, no evidence of other human interactions was documented for stranded pilot whales. These strandings are not included in the estimate of total human-caused mortality and serious injury. Stranding data probably underestimate the extent of human and fishery-related mortality and serious injury, particularly for offshore species such as pilot whales, because not all of the whales that die or are seriously injured in human interactions wash ashore, or, if they do, they are not all recovered (Peltier et al. 2012; Wells et al. 2015). Additionally, not all carcasses will show evidence of human interaction, entanglement or other fishery-related interaction due to decomposition, scavenger damage, etc. (Byrd et al. 2014). Finally, the level of technical expertise among stranding network personnel varies widely as does the ability to recognize signs of human interaction.
HABITAT ISSUES The chronic impacts of contaminants (polychlorinated biphenyls [PCBs] and chlorinated pesticides [DDT, DDE, dieldrin, etc.]) on marine mammal reproduction and health are of concern (e.g., Schwacke et al. 2002; Jepson et al. 2016; Hall et al. 2018). Moderate levels of these contaminants have been found in pilot whale blubber (Taruski et al. 1975; Muir et al. 1988; Weisbrod et al. 2000). Weisbrod et al. (2000) examined polychlorinated biphenyl and chlorinated pesticide concentrations in bycaught and stranded pilot whales in the western North Atlantic. Contaminant levels were similar to or lower than levels found in other toothed whales in the western North Atlantic, perhaps because they are feeding further offshore than other species (Weisbrod et al. 2000). Dam and Bloch (2000) found very high PCB levels in long-finned pilot whales in the Faroes. Also, high levels of toxic metals (mercury, lead, cadmium) and selenium were measured in pilot whales harvested in the Faroe Island drive fishery (Nielsen et al. 2000). However, the population effect of the observed levels of such contaminants on this stock is unknown.
STATUS OF STOCK The short-finned pilot whale is not listed as threatened or endangered under the Endangered Species Act, and the western North Atlantic stock is not a strategic stock under the MMPA because the mean annual human-caused mortality and serious injury does not exceed PBR. The status of this stock relative to OSP in the U.S. Atlantic EEZ is unknown. Total U.S. fishery-related mortality and serious injury attributed to short-finned pilot whales exceeds 10% of the calculated PBR and therefore cannot be considered to be insignificant and approaching zero mortality and serious injury rate. There is no evidence for a trend in population size for this stock. Should there be multiple demographically-independent stocks within this stock’s range, the geographically-concentrated nature of the fishery-related mortality and serious injury could mean that the mortality is impacting one stock more than the other.
REFERENCES CITED Barlow, J., S.L. Swartz, T.C. Eagle and P.R. Wade. 1995. U.S. marine mammal stock assessments: Guidelines for
preparation, background, and a summary of the 1995 assessments. NOAA Tech. Memo. NMFS-OPR-6. 73 pp. Available from: http://www.nmfs.noaa.gov/pr/pdfs/sars/guidelines1995.pdf
Bernard, H. J. and S.B. Reilly. 1999. Pilot whales Globicephala Lesson, 1828. Pages 245–279 in: S. H. Ridgway and R. Harrison (eds), Handbook of marine mammals, Vol. 6: The second book of dolphins and the porpoises. Academic Press, San Diego, CA, USA.
Byrd, B.L., A.A. Hohn, G.N. Lovewell, K.M. Altman, S.G. Barco, A. Friedlaender, C.A. Harms, W.A. McLellan, K.T. Moore, P.E. Rosel and V.G. Thayer. 2014. Strandings illustrate marine mammal biodiversity and human impacts off the coast of North Carolina, USA. Fish. Bull. 112:1–23.
Claridge, D., G. M. Ylitalo, D. Herman, J. Durban and K. Parsons. 2015. Behavioral ecology of deep diving odontocetes in the Bahamas. Final Report SERDP Project Number: RC-2114. 114 pp. Available from: https://swfsc.noaa.gov/uploadedFiles/Events/Meetings/MMT_2015/Documents/4.4%20Ppr%202015_SERDP%20Draft%20Final%20Report_RC2114.pdf
Dam, M. and D. Bloch. 2000. Screening of mercury and persistent organochlorine pollutants in long-finned pilot whale (Globicephala melas) in the Faroe Islands. Mar. Poll. Bull. 40(12):1090–1099.Garrison, L.P. 2007.
90
Interactions between marine mammals and longline fishing gear in the U.S. Atlantic Ocean between 1992 and 2004. Fish. Bull. 105(3):408–417.
Garrison, L.P. 2016. Abundance of marine mammals in waters of the U.S. East Coast during summer 2011. Southeast Fisheries Science Center, Protected Resources and Biodiversity Division, 75 Virginia Beach Dr., Miami, FL 33140. PRBD Contribution # PRBD-2016-08, 21 pp.
Garrison, L.P. and D. Palka. 2018. Abundance of short-finned pilot whales along the U.S. east coast from summer 2016 vessel surveys. Southeast Fisheries Science Center, Protected Resources and Biodiversity Division, 75 Virginia Beach Dr., Miami, FL 33140. PRBD Contribution # PRBD-2018-07, 17 pp.
Garrison, L.P. and P.E. Rosel. 2017. Partitioning short-finned and long-finned pilot whale bycatch estimates using habitat and genetic information. Southeast Fisheries Science Center, Protected Resources and Biodiversity Division, 75 Virginia Beach Dr., Miami, FL 33140. PRBD Contribution # PRBD-2016-17, 24 pp.
Garrison, L.P. and L. Stokes. 2013. Estimated bycatch of marine mammals and sea turtles in the U.S. Atlantic pelagic longline fleet during 2012. NOAA Tech. Memo. NMFS-SEFSC-655. 62 pp.
Garrison, L.P. and L. Stokes. 2014. Estimated bycatch of marine mammals and sea turtles in the U.S. Atlantic pelagic longline fleet during 2013. NOAA Tech. Memo. NMFS-SEFSC-667. 61 pp.Garrison, L.P. and L. Stokes. 2016. Estimated bycatch of marine mammals and sea turtles in the U.S. Atlantic pelagic longline fleet during 2014. NOAA Tech. Memo. NMFS-SEFSC-696, 62 pp.
Garrison, L.P. and L. Stokes. 2017. Estimated bycatch of marine mammals and sea turtles in the U.S. Atlantic pelagic longline fleet during 2015. NOAA Tech. Memo. NMFS-SEFSC-709, 61 pp.
Garrison, L.P. and L. Stokes. 2019. Estimated bycatch of marine mammals and sea turtles in the U.S. Atlantic pelagic longline fleet during 2016. Southeast Fisheries Science Center, Protected Resources and Biodiversity Division, 75 Virginia Beach Dr., Miami, FL 33140. PRBD Contribution # PRBD-2019-01. 62 pp.
Hall, A.J., B.J. McConnell, L.J. Schwacke, G.M. Ylitalo, R. Williams and T.K. Rowles. 2018. Predicting the effects of polychlorinated biphenyls on cetacean populations through impacts on immunity and calf survival. Environ. Poll. 233:407–418.
Hansen, L.J., K.D. Mullin, T.A. Jefferson and G.P. Scott. 1996. Visual surveys aboard ships and aircraft. Pages 55-132 in: R.W. Davis and G.S. Fargion (eds.) Distribution and abundance of marine mammals in the north-central and western Gulf of Mexico: Final report. Volume II: Technical report. OCS Study MMS 96- 0027. Minerals Management Service, Gulf of Mexico OCS Region, New Orleans, LA.
Jepson, P.D., R. Deaville, J.L. Barber, A. Aguilar, A. Borrell, S. Murphy, J. Barry, A. Brownlow, J. Barnett, S. Berrow and A.A. Cunningham. 2016. PCB pollution continues to impact populations of orcas and other dolphins in European waters. Sci. Rep.-U.K. 6:18573.
Laake, J.L. and D.L. Borchers. 2004. Methods for incomplete detection at distance zero. Pages 108–189 in: S.T. Buckland, D.R. Andersen, K.P. Burnham, J.L. Laake, and L. Thomas, (eds.) Advanced distance sampling. Oxford University Press, New York.
Maze-Foley, K. and L.P. Garrison. 2016. Serious injury determinations for small cetaceans off the southeast U.S. coast, 2013. Southeast Fisheries Science Center, Protected Resources and Biodiversity Division, 75 Virginia Beach Dr., Miami, FL 33140. PRBD Contribution # PRBD-2016-06, 12 pp.
Muir, D.C.G., R. Wagemann, N.P. Grift, R.J. Norstrom, M. Simon and J. Lien. 1988. Organochlorine chemical and heavy metal contaminants in white-beaked dolphins (Lagenorhynchus albirostris) and pilot whales (Globicephala melaena) from the coast of Newfoundland, Canada. Arch. Environ. Contam. Toxicol. 17(5): 613–629.
Mullin, K.D. and G.L. Fulling. 2003. Abundance of cetaceans in the southern U.S. North Atlantic Ocean during summer 1998. Fish. Bull. 101(3):603–613.
Mullin, K.D. and W. Hoggard. 2000. Visual surveys of cetaceans and sea turtles from aircraft and ships. Pages 111-172 in: R.W. Davis, W.E. Evans and B. Würsig (eds.) Cetaceans, sea turtles and seabirds in the northern Gulf of Mexico: Distribution, abundance and habitat associations. Volume II: Technical report. Minerals Management Service, Gulf of Mexico OCS Region, New Orleans. OCS Study MMS 96-0027.
Nielsen, J.B., F. Nielsen, P.-J. Jorgensen and P. Grandjean. 2000. Toxic metals and selenium in blood from pilot whales (Globicephala melas) and sperm whales (Physeter catodon). Mar. Poll. Bull. 40(4):348–35.
NMFS. 1993. Status of fishery resources off the northeastern United States for 1993. NOAA Tech. Memo. NMFS-F/NEC-101, 140 pp. Available from: http://www.nefsc.noaa.gov/publications/tm/pdfs/tmfnec101.pdf
91
NMFS. 2017. Annual report of a comprehensive assessment of marine mammal, marine turtle, and seabird abundance and spatial distribution in US waters of the western North Atlantic Ocean – AMAPPS II. Available from: https://www.nefsc.noaa.gov/psb/AMAPPS/
Palka, D. 2012. Cetacean abundance estimates in US northwestern Atlantic Ocean waters from summer 2011 line transect survey. U.S. Dept. Commer., Northeast Fish. Sci. Cent. Ref. Doc. 12-29, 37 pp. Available from: http://www.nefsc.noaa.gov/nefsc/publications/
Payne, P.M. and D.W. Heinemann. 1993. The distribution of pilot whales (Globicephala sp.) in shelf/shelf edge and slope waters of the northeastern United States, 1978-1988. Rep. Int. Whal. Comm. (Special Issue) 14:51–68.
Peltier, H., W. Dabin, P. Daniel, O. Van Canneyt, G. Dorémus, M. Huon and V. Ridoux. 2012. The significance of stranding data as indicators of cetacean populations at sea: modelling the drift of cetacean carcasses. Ecol. Indic. 18:278–290.
Pugliares, K.R., T.W. French, G.S. Jones, M.E. Niemeyer, L.A. Wilcox and B.J. Freeman. 2016. First records of the short-finned pilot whale (Globicephala macrorhynchus) in Massachusetts, USA: 1980 and 2011. Aquat. Mamm. 42(3):357–362.
Rone, B.K. and R.M. Pace, III. 2012. A simple photograph-based approach for discriminating between free-ranging long-finned (Globicephala melas) and short-finned (G. macrorhynchus) pilot whales off the east coast of the United States. Mar. Mamm. Sci. 28(2):254–275.
Schwacke, L.H., E.O. Voit, L.J. Hansen, R.S. Wells, G.B. Mitchum, A.A. Hohn and P.A. Fair. 2002. Probabilistic risk assessment of reproductive effects of polychlorinated biphenyls on bottlenose dolphins (Tursiops truncatus) from the southeast United States coast. Env. Toxic. Chem. 21(12):2752–2764.Taruski, A.G., C.E. Olney and H.E. Winn. 1975. Chlorinated hydrocarbons in cetaceans. J. Fish. Res. Board Can 32(11):2205–2209.
Thomas, L., J.L. Laake, E. Rexstad, S. Strindberg, F.F.C. Marques, S.T. Buckland, D.L. Borchers, D.R. Anderson, K.P. Burnham, M.L. Burt, S.L. Hedley, J.H. Pollard, J.R.B. Bishop and T.A. Marques. 2009. Distance 6.0. Release 2. [Internet]. University of St. Andrews (UK): Research Unit for Wildlife Population Assessment. Available from: http://distancesampling.org/Distance/.
Wade, P.R. and R.P. Angliss. 1997. Guidelines for assessing marine mammal stocks: Report of the GAMMS Workshop April 3-5, 1996, Seattle, Washington. NOAA Tech. Memo. NMFS-OPR-12, 93 pp. Available from: http://www.nmfs.noaa.gov/pr/pdfs/sars/gamms_report.pdf
Weisbrod, A.V., D. Shea, M.J. Moore and J.J. Stegeman. 2000. Bioaccumulation patterns of polychlorinated biphenyls and chlorinated pesticides in northwest Atlantic pilot whales. Environ. Toxicol. Chem. 19(3):667–677.
Wells, R.S., J.B. Allen, G. Lovewell, J. Gorzelany, R.E. Delynn, D.A. Fauquier and N.B. Barros. 2015. Carcass-recovery rates for resident bottlenose dolphins in Sarasota Bay, Florida. Mar. Mamm. Sci. 31(1):355–368.
Wells, R.S., E.M. Fougeres, A.G. Cooper, R.O. Stevens, M.Brodsky, R. Lingenfelser, C. Dold, and D.C. Douglas 2013. Movements and dive patterns of short-finned pilot whales (Globicephala macrorhynchus) released from a mass stranding in the Florida Keys. Aquat. Mamm. 39(1): 61–72.

92
February 2019
ATLANTIC WHITE-SIDED DOLPHIN (Lagenorhynchus acutus): Western North Atlantic Stock
STOCK DEFINITION AND GEOGRAPHIC RANGE White-sided dolphins are found in temperate and sub-polar waters of the North Atlantic, primarily in continental shelf waters to the 100-m depth contour. In the western North Atlantic the species inhabits waters from multiple marine ecoregions (Spalding 2007) within the region from central West Greenland to North Carolina (about 35˚N) and perhaps as far east as 29˚W in the vicinity of the mid-Atlantic Ridge (Evans 1987; Hamazaki 2002; Doksaeter et al. 2008; Waring et al. 2008). Distribution of sightings, strandings and incidental takes suggest the possible existence of three population units: Gulf of Maine, Gulf of St. Lawrence and Labrador Sea populations (Palka et al. 1997). Evidence for a separation between the population in the southern Gulf of Maine and the Gulf of St. Lawrence population comes from the reduced density of summer sightings along the Atlantic side of Nova Scotia. This was reported in Gaskin (1992), is evident in Smithsonian stranding records and in Canadian/west Greenland bycatch data (Stenson et al. 2011), and was obvious during summer abundance surveys that covered waters from Virginia to the Gulf of St. Lawrence and during the Canadian component of the Trans-North Atlantic Sighting Survey in the summer of 2007 (Lawson and Gosselin 2009, 2011). White-sided dolphins were seen frequently in Gulf of Maine waters and in waters at the mouth of the Gulf of St. Lawrence, but only a relatively few sightings were recorded between these two regions. This gap has been less obvious since 2007 and could be related to an increasing number of animals being distributed more northwards due to climatic/ecosystem changes that are occurring in the Gulf of Maine. No comparative genetic analysis of samples from U.S. waters and the Gulf of St. Lawrence and/or Newfoundland have been made. The Gulf of Maine population of white-sided dolphins is most common in continental shelf waters from Hudson Canyon (approximately 39˚N) to Georges Bank, and in the Gulf of Maine and lower Bay of Fundy. Sighting data indicate seasonal shifts in distribution (Northridge et al. 1997). During January to May, low numbers of white-sided dolphins are found from Georges Bank to Jeffreys Ledge (off New Hampshire), with even lower numbers south of Georges Bank, as documented by a few strandings collected on beaches of Virginia to South Carolina. From June through September, large numbers of white-sided dolphins are found from Georges Bank to the lower Bay of Fundy. From October to December, white-sided dolphins occur at intermediate densities from southern Georges Bank to southern Gulf of Maine (Payne and Heinemann 1990). Sightings south of Georges Bank, particularly around Hudson Canyon, occur year round but at low densities. The Virginia and North Carolina observations appear to represent the
Figure 1. Distribution of white-sided dolphin sightings from NEFSC and SEFSC shipboard and aerial surveys during the summers of 1995, 1998, 1999, 2002, 2004, 2006, 2007, 2008, 2010, and 2011, and DFO’s 2007 TNASS survey. Isobaths are the 100-m, 1000-m and 4000-m depth contours.

93
southern extent of the species’ range during the winter months. On 4 May 2008 a stranded 17-year old male white-sided dolphin with severe pulmonary distress and reactive lymphadenopathy stranded in South Carolina (Powell et al. 2012). In the absence of additional strandings or sightings, this stranding seems to be an out-of-range anomaly. The seasonal spatial distribution of this species appears to be changing during the last few years. There is evidence for an earlier distributional shift during the 1970s, from primarily offshore waters into the Gulf of Maine, hypothesized to be related to shifts in abundance of pelagic fish stocks resulting from depletion of herring by foreign distant-water fleets (Kenney et al. 1996). Stomach-content analysis of both stranded and incidentally caught white-sided dolphins in U.S. waters determined that the predominant prey were silver hake (Merluccius bilinearis), spoonarm octopus (Bathypolypus bairdii) and haddock (Melanogrammus aeglefinus). Sand lances (Ammodytes spp.) were only found in the stomach of one stranded white-sided dolphin. Seasonal variation in diet was indicated; pelagic Atlantic herring (Clupea harengus) was the most important prey in summer, but was rare in winter (Craddock et al. 2009). Within the Gulf of Maine population a genetic analysis comparing samples from Maine to samples from Massachusetts found no significant differentiation (Banguera-Hinestroza et al. 2014). Abrahams (2014) compared samples collected between Connecticut and Maine to those collected between New York and North Carolina and found no evidence for genetic differentiation between these two regions. Sample sizes in these studies in some cases were low, and the potential for seasonal movement, as suggested by Northridge et al. (1997), has the potential to confound these studies if season was not considered in the sampling scheme. As a consequence of these distribution patterns and genetic analyses, this report assumes white-sided dolphins in U.S. waters are distributed from the Gulf of Maine population, which is separate from the neighboring Gulf of St. Lawrence population. In summary, the Western North Atlantic stock of white-sided dolphins may contain multiple demographically-independent populations, where the animals in U.S. waters are part of the Gulf of Maine population. However, further research is necessary to support this hypothesis and eliminate the uncertainties.
POPULATION SIZE The best available current abundance estimate for white-sided dolphins in the western North Atlantic stock is 48,819 (CV= 0.61), resulting from a June–August 2011 survey. However, this estimate actually only covers the Gulf of Maine population, not the entire western North Atlantic stock. A current abundance survey that accounts for availability bias and covers at least the Atlantic U.S. and Canadian waters is needed to estimate the abundance of the entire, or at least most of, the western North Atlantic stock.
Earlier abundance estimates Please see Appendix IV for earlier abundance estimates. As recommended in the GAMMS Workshop Report (Wade and Angliss 1997), estimates older than eight years are deemed unreliable to determine the current PBR.
Recent surveys and abundance estimates An abundance estimate of 48,819 (CV=0.61) white-sided dolphins was generated from a shipboard and aerial survey conducted during June–August 2011 (Palka 2012). The aerial portion that contributed to the abundance estimate covered 5,313 km of tracklines that were over waters north of New Jersey from the coastline to the 100-m depth contour through the U.S. and Canadian Gulf of Maine and up to and including the lower Bay of Fundy. The shipboard portion covered 3,107 km of tracklines that were in waters offshore of central Virginia to Massachusetts (waters that were deeper than the 100-m depth contour out to beyond the U.S. EEZ). Both sighting platforms used a double-platform data-collection procedure, which allows estimation of abundance corrected for perception bias of the detected species (Laake and Borchers, 2004). Estimation of the abundance was based on the independent-observer approach assuming point independence (Laake and Borchers 2004) and calculated using the MRDS option in the computer program Distance (version 6.0, release 2, Thomas et al. 2009). No white-sided dolphins were detected in the aerial and ship abundance surveys that were conducted concurrently (June-August 2011) in waters between central Virginia and central Florida. This shipboard survey included shelf-break and inner continental slope waters deeper than the 50-m depth contour within the U.S. EEZ. The survey employed the double-platform methodology searching with 25x150 “bigeye” binoculars. A total of 4,445 km of tracklines was surveyed, yielding 290 cetacean sightings.
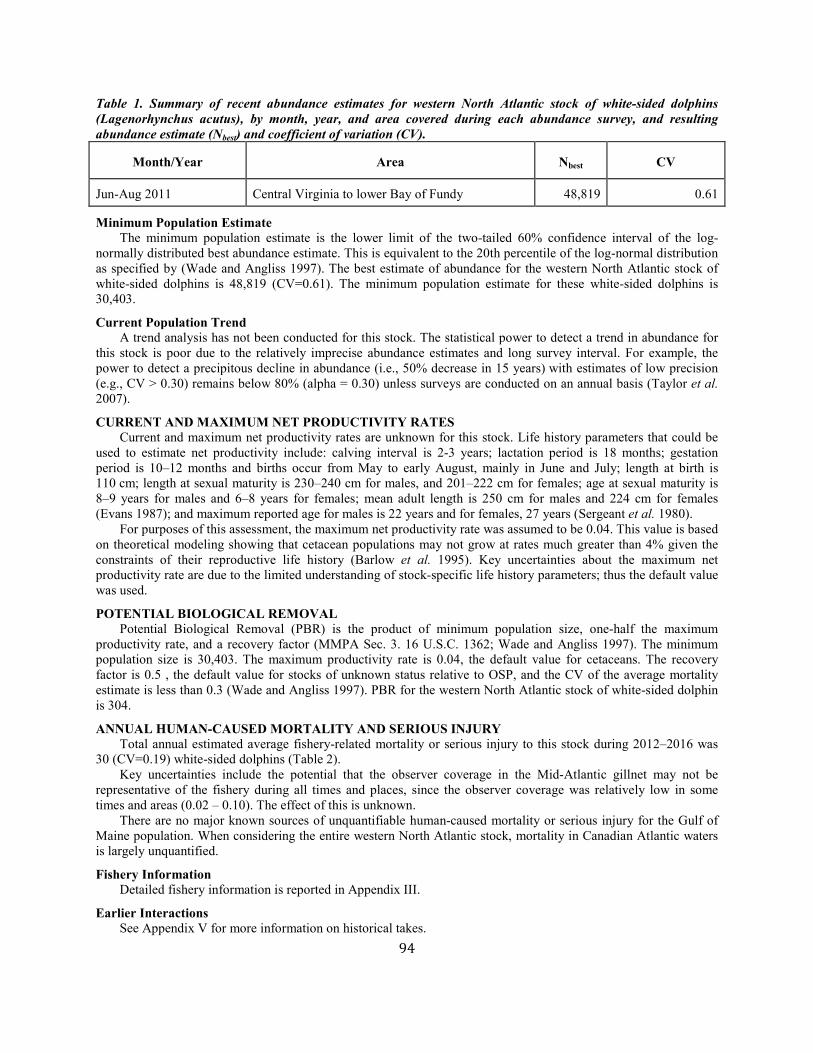
94
Table 1. Summary of recent abundance estimates for western North Atlantic stock of white-sided dolphins (Lagenorhynchus acutus), by month, year, and area covered during each abundance survey, and resulting abundance estimate (Nbest) and coefficient of variation (CV).
Month/Year Area Nbest CV
Jun-Aug 2011 Central Virginia to lower Bay of Fundy 48,819 0.61
Minimum Population Estimate The minimum population estimate is the lower limit of the two-tailed 60% confidence interval of the log-normally distributed best abundance estimate. This is equivalent to the 20th percentile of the log-normal distribution as specified by (Wade and Angliss 1997). The best estimate of abundance for the western North Atlantic stock of white-sided dolphins is 48,819 (CV=0.61). The minimum population estimate for these white-sided dolphins is 30,403.
Current Population Trend A trend analysis has not been conducted for this stock. The statistical power to detect a trend in abundance for this stock is poor due to the relatively imprecise abundance estimates and long survey interval. For example, the power to detect a precipitous decline in abundance (i.e., 50% decrease in 15 years) with estimates of low precision (e.g., CV > 0.30) remains below 80% (alpha = 0.30) unless surveys are conducted on an annual basis (Taylor et al. 2007).
CURRENT AND MAXIMUM NET PRODUCTIVITY RATES Current and maximum net productivity rates are unknown for this stock. Life history parameters that could be used to estimate net productivity include: calving interval is 2-3 years; lactation period is 18 months; gestation period is 10–12 months and births occur from May to early August, mainly in June and July; length at birth is 110 cm; length at sexual maturity is 230–240 cm for males, and 201–222 cm for females; age at sexual maturity is 8–9 years for males and 6–8 years for females; mean adult length is 250 cm for males and 224 cm for females (Evans 1987); and maximum reported age for males is 22 years and for females, 27 years (Sergeant et al. 1980). For purposes of this assessment, the maximum net productivity rate was assumed to be 0.04. This value is based on theoretical modeling showing that cetacean populations may not grow at rates much greater than 4% given the constraints of their reproductive life history (Barlow et al. 1995). Key uncertainties about the maximum net productivity rate are due to the limited understanding of stock-specific life history parameters; thus the default value was used.
POTENTIAL BIOLOGICAL REMOVAL Potential Biological Removal (PBR) is the product of minimum population size, one-half the maximum productivity rate, and a recovery factor (MMPA Sec. 3. 16 U.S.C. 1362; Wade and Angliss 1997). The minimum population size is 30,403. The maximum productivity rate is 0.04, the default value for cetaceans. The recovery factor is 0.5 , the default value for stocks of unknown status relative to OSP, and the CV of the average mortality estimate is less than 0.3 (Wade and Angliss 1997). PBR for the western North Atlantic stock of white-sided dolphin is 304.
ANNUAL HUMAN-CAUSED MORTALITY AND SERIOUS INJURY Total annual estimated average fishery-related mortality or serious injury to this stock during 2012–2016 was 30 (CV=0.19) white-sided dolphins (Table 2). Key uncertainties include the potential that the observer coverage in the Mid-Atlantic gillnet may not be representative of the fishery during all times and places, since the observer coverage was relatively low in some times and areas (0.02 – 0.10). The effect of this is unknown. There are no major known sources of unquantifiable human-caused mortality or serious injury for the Gulf of Maine population. When considering the entire western North Atlantic stock, mortality in Canadian Atlantic waters is largely unquantified.
Fishery Information Detailed fishery information is reported in Appendix III.
Earlier Interactions See Appendix V for more information on historical takes.

95
U.S.
Northeast Sink Gillnet White-sided dolphin bycatch has been rare in this fishery, but when it occurred it was in both the Gulf of Maine and southern New England regions and mostly in non-summer (May–August) months. Fishery-related bycatch rates were estimated using an annual stratified ratio-estimator (Table 2; Hatch and Orphanides 2014, 2015, 2016, Orphanides and Hatch 2017, Orphanides 2019). See Table 2 for bycatch estimates and observed mortality and serious injury for the current 5-year period, and Appendix V for long-term bycatch information.
Northeast Bottom Trawl White-sided dolphins have been bycaught all year-round in the Gulf of Maine, where most occurred outside of summer (May–August) and offshore near the EEZ. Fishery-related bycatch rates were estimated using an annual stratified ratio-estimator (Lyssikatos 2015; Chavez-Rosales et al. 2018). See Table 2 for bycatch estimates and observed mortality and serious injury for the current 5-year period, and Appendix V for long-term bycatch information.
Mid-Atlantic Bottom Trawl White-sided dolphin bycatch has been rare in this fishery, but when it occurred it was usually in the winter (January–April) and around Hudson Canyon. Fishery-related bycatch rates were estimated using an annual stratified ratio-estimator (Lyssikatos 2015; Chavez-Rosales et al. 2018). See Table 2 for bycatch estimates and observed mortality and serious injury for the current 5-year period, and Appendix V for long-term bycatch information.
Table 2. Summary of the incidental mortality of North Atlantic stock of white-sided dolphins (Lagenorhynchus acutus) by commercial fishery including the years sampled, the type of data used, the annual observer coverage, the serious injuries and mortalities recorded by on-board observers, the estimated annual serious injury and mortality, the estimated CV of the combined annual mortality and the mean annual mortality (CV in parentheses).
Fishery Years Data Type a
Observer Coverage b
Observed Serious Injuryc
Observed Mortality
Estimated Serious Injury
Estimated Mortality
Estimated Combined Mortality
Estimated CVs
Mean Combined
Annual Mortality
Northeast Sink Gillnet
2012 2013 2104 2015 2016
Obs. Data, Weighout,
Trip Logbook
0.15 0.11 0.18 0.14 0.10
0 0 0 0 0
1 1 2 0 0
0 0 0 0 0
9 4
10 0 0
9 4
10 0 0
.92 1.03 .66 0 0
4.6 (0.49)
Northeast Bottom Trawl
2012 2013 2104 2015 2016
Obs. Data, Trip
Logbook
0.17, .15, 17, .19, .12
0 0 0 0 0
9 8 3 3 3
0 0 0 0 0
27 33 16 15 28
27 33 16 15 28
.47
.31 .5
.52
.46
24 (0.20)
Mid-Atlantic Bottom Trawl
2012 2013 2104 2015 2016
Obs. Data,Trip Logbook
.05, .06,
.08, .09, .097
0 0 0 0 0
0 0 1 0 0
0 0 0 0 0
0 0
9.67 0 0
0 0
9.67 0 0
0 0
.94 0 0
1.9 (0.94)
Total 30 (0.19)
a Observer data (Obs. Data), used to measure bycatch rates, are collected within the Northeast Observer Program and At-sea Monitoring Program. NEFSC collects landings data (unallocated Dealer Data or Allocated Dealer Data) which are used as a measure of total landings and mandatory Vessel Trip Reports (VTR) (Trip Logbook) are used to determine the spatial distribution of landings and fishing effort in the sink gillnet, bottom trawl and mid-water trawl fisheries. In addition, the Trip Logbooks are the primary source of the measure of total effort (tow duration) in the mid-water and bottom trawl fisheries. b Observer coverage is defined as the ratio of observed to total metric tons of fish landed for the gillnet fisheries, and the ratio of observed to total trips for bottom trawl and Mid-Atlantic mid-water trawl (including pair trawl) fisheries. Total observer coverage reported for bottom trawl and gillnet gear includes samples collected from the at-sea monitoring program in addition to traditional observer coverage through the Northeast Fisheries Observer Program (NEFOP).
96
c Serious injuries were evaluated for the 2012–2016 period and include both at-sea monitor and traditional observer data (Josephson et al. 2019). CANADA There is little information available that quantifies fishery interactions involving white-sided dolphins in Canadian waters. Two white-sided dolphins were reported caught in groundfish gillnet sets in the Bay of Fundy during 1985 to 1989, and 9 were reported taken in West Greenland between 1964 and 1966 in the now non-operational salmon drift nets (Gaskin 1992). Several (number not specified) were also taken during the 1960s in the now non-operational Newfoundland and Labrador groundfish gillnets. A few (number not specified) were taken in an experimental drift gillnet fishery for salmon off West Greenland which took place from 1965 to 1982 (Read 1994). Hooker et al. (1997) summarized bycatch data from a Canadian fisheries observer program that placed observers on all foreign fishing vessels operating in Canadian waters, on 25-40% of large Canadian fishing vessels (greater than 100 feet long), and on approximately 5% of smaller Canadian fishing vessels. Bycaught marine mammals were noted as weight in kilos rather than by the numbers of animals caught. Thus the number of individuals was estimated by dividing the total weight per species per trip by the maximum recorded weight of each species. During 1991 through 1996, an estimated 6 white-sided dolphins were observed taken. One animal was from a longline trip south of the Grand Banks (43º 10'N 53º 08'W) in November 1996 and the other 5 were taken in the bottom trawl fishery off Nova Scotia in the Atlantic Ocean; 1 in July 1991, 1 in April 1992, 1 in May 1992, 1 in April 1993, 1 in June 1993 and 0 in 1994 to 1996. Estimation of small cetacean bycatch for Newfoundland fisheries using data collected during 2001 to 2003 (Benjamins et al. 2007) indicated that, while most of the estimated 862 to 2,228 animals caught were harbor porpoises, a few were white-sided dolphins caught in the Newfoundland nearshore gillnet fishery and offshore monkfish/skate gillnet fisheries.
Other Mortality U.S. Recent Atlantic white-sided dolphin strandings on the U.S. Atlantic coast are documented in Table 3 (NOAA National Marine Mammal Health and Stranding Response Database unpublished data, accessed 03 November 2017). Sixteen of these animals were released alive. Human interaction was indicated in 4 records during this period. None of these were classified as fishery interactions. Mass strandings involving up to a hundred or more animals at one time are common for this species. The causes of these strandings are not known. Because such strandings have been known since antiquity, it could be presumed that recent strandings are a normal condition (Gaskin 1992). It is unknown whether human causes, such as fishery interactions and pollution, have increased the number of strandings. In an analysis of mortality causes of stranded marine mammals on Cape Cod and southeastern Massachusetts between 2000 and 2006, Bogomolni et al. (2010) found 69% (46 of 67) of stranded white-sided dolphins were involved in mass-stranding events with no significant cause determined, and 21% (14 of 67) were classified as disease-related. Stranding data probably underestimate the extent of fishery-related mortality and serious injury because all of the marine mammals that die or are seriously injured may not wash ashore, nor will all of those that do wash ashore necessarily show signs of entanglement or other fishery-interaction. Finally, the level of technical expertise among stranding network personnel varies widely as does the ability to recognize signs of fishery interaction. CANADA The Nova Scotia Stranding Network documented whales and dolphins stranded on the coast of Nova Scotia during 1991 to 1996 (Hooker et al. 1997). Researchers with Dept. of Fisheries and Oceans, Canada documented strandings on the beaches of Sable Island during 1970 to 1998 (Lucas and Hooker 2000). More recently whales and dolphins stranded on the coast of Nova Scotia have been recorded by the Marine Animal Response Society and the Nova Scotia Stranding Network (Table 3; Marine Animal Response Society, pers. comm.). In addition, stranded white-sided dolphins in Newfoundland and Labrador are being recorded by the Whale Release and Strandings Program (Table 3; Ledwell and Huntington 2012a, 2012b, 2013, 2014, 2015, 2017).
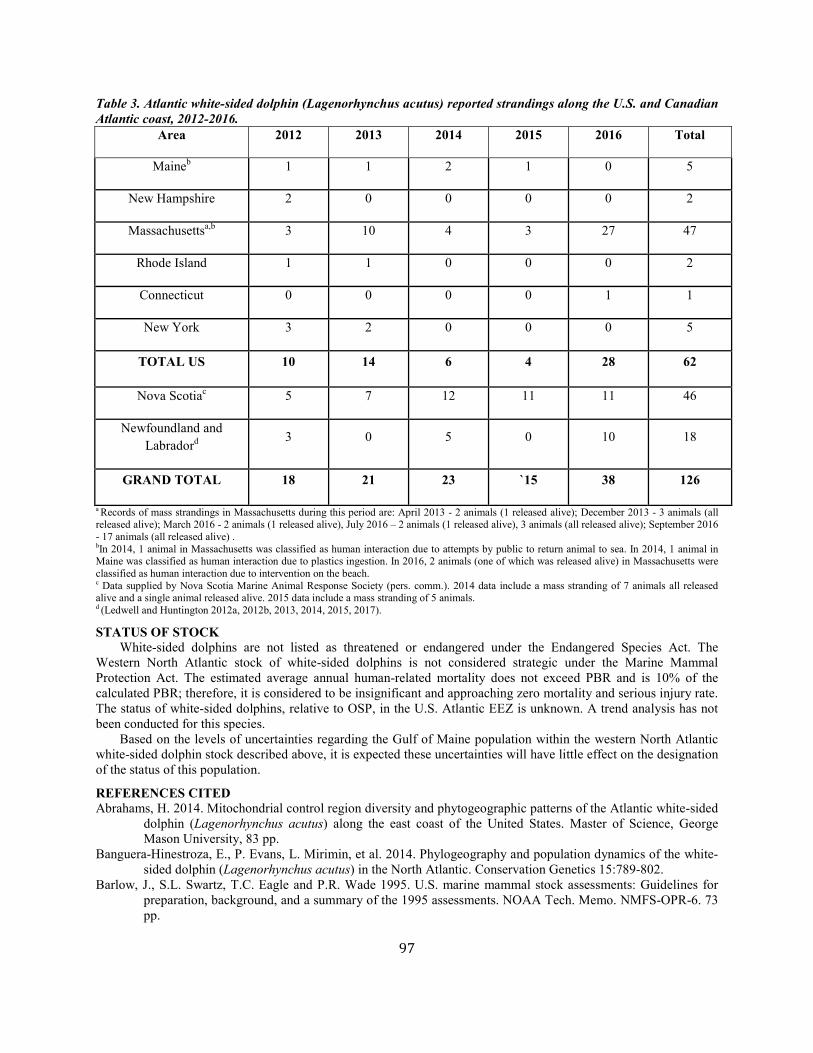
97
Table 3. Atlantic white-sided dolphin (Lagenorhynchus acutus) reported strandings along the U.S. and Canadian Atlantic coast, 2012-2016.
Area 2012 2013 2014 2015 2016 Total
Maineb 1 1 2 1 0 5
New Hampshire 2 0 0 0 0 2
Massachusettsa,b 3 10 4 3 27 47
Rhode Island 1 1 0 0 0 2
Connecticut 0 0 0 0 1 1
New York 3 2 0 0 0 5
TOTAL US 10 14 6 4 28 62
Nova Scotiac 5 7 12 11 11 46
Newfoundland and Labradord
3 0 5 0 10 18
GRAND TOTAL 18 21 23 `15 38 126
a Records of mass strandings in Massachusetts during this period are: April 2013 - 2 animals (1 released alive); December 2013 - 3 animals (all released alive); March 2016 - 2 animals (1 released alive), July 2016 – 2 animals (1 released alive), 3 animals (all released alive); September 2016 - 17 animals (all released alive) . bIn 2014, 1 animal in Massachusetts was classified as human interaction due to attempts by public to return animal to sea. In 2014, 1 animal in Maine was classified as human interaction due to plastics ingestion. In 2016, 2 animals (one of which was released alive) in Massachusetts were classified as human interaction due to intervention on the beach. c Data supplied by Nova Scotia Marine Animal Response Society (pers. comm.). 2014 data include a mass stranding of 7 animals all released alive and a single animal released alive. 2015 data include a mass stranding of 5 animals. d (Ledwell and Huntington 2012a, 2012b, 2013, 2014, 2015, 2017).
STATUS OF STOCK White-sided dolphins are not listed as threatened or endangered under the Endangered Species Act. The Western North Atlantic stock of white-sided dolphins is not considered strategic under the Marine Mammal Protection Act. The estimated average annual human-related mortality does not exceed PBR and is 10% of the calculated PBR; therefore, it is considered to be insignificant and approaching zero mortality and serious injury rate. The status of white-sided dolphins, relative to OSP, in the U.S. Atlantic EEZ is unknown. A trend analysis has not been conducted for this species. Based on the levels of uncertainties regarding the Gulf of Maine population within the western North Atlantic white-sided dolphin stock described above, it is expected these uncertainties will have little effect on the designation of the status of this population.
REFERENCES CITED Abrahams, H. 2014. Mitochondrial control region diversity and phytogeographic patterns of the Atlantic white-sided
dolphin (Lagenorhynchus acutus) along the east coast of the United States. Master of Science, George Mason University, 83 pp.
Banguera-Hinestroza, E., P. Evans, L. Mirimin, et al. 2014. Phylogeography and population dynamics of the white-sided dolphin (Lagenorhynchus acutus) in the North Atlantic. Conservation Genetics 15:789-802.
Barlow, J., S.L. Swartz, T.C. Eagle and P.R. Wade 1995. U.S. marine mammal stock assessments: Guidelines for preparation, background, and a summary of the 1995 assessments. NOAA Tech. Memo. NMFS-OPR-6. 73 pp.
98
Benjamins, S., J.W. Lawson and G.B. Stenson 2007. Recent harbor porpoise bycatch in Newfoundland, Canada’s gillnet fisheries. J. Cetacean Res. Manage. 9(3):189–200.
Bogomolni, A.L., K.R. Pugliares, S.M. Sharp, K. Patchett, C.T. Harry, J.M. LaRocque, K.M. Touhey, and M. Moore 2010. Mortality trends of stranded marine mammals on Cape Cod and southeastern Massachusetts, USA, 2000 to 2006. Dis. Aquat. Organ. 88:143–155
Chavez-Rosales, S., M.C. Lyssikatos, and J. Hatch. 2018. Estimates of cetacean and pinniped bycatch in northeast and mid-Atlantic bottom trawl fisheries, 2012-2016. NOAA Tech. Memo NMFS-NE-250. 29pp.
Craddock, J.E., P.T. Polloni, B. Hayward and F. Wenzel 2009. Food habits of Atlantic white-sided dolphins
(Lagenorhynchus acutus) off the coast of New England. Fish. Bull. 107:384–394. Doksaeter, L., E. Olsen, L. Nottestad and A. Ferno 2008. Distribution and feeding ecology of dolphins along the
mid-Atlantic Ridge between Iceland and the Azores. Deep-Sea Res. II 55:243–253. Evans, P.G.H. 1987. The natural history of whales and dolphins. Facts on File Publications, New York. 343 pp. Gaskin, D.E. 1992. Status of Atlantic white-sided dolphin, Lagenorhynchus acutus, in Canada. Can. Field-Nat.
106:64–72. Hamazaki, T. 2002. Spatiotemporal prediction models of cetacean habitats in the mid-western North Atlantic Ocean
(from Cape Hatteras, No. Carolina, USA to Nova Scotia, Canada). Mar. Mamm. Sci. 18(4):920–939. Hatch, J.M. and C.D. Orphanides 2014. Estimates of cetacean and pinniped bycatch in the 2012 New England sink
and mid-Atlantic gillnet fisheries. Northeast Fish Sci Cent Ref Doc.14-02. 20 pp. Hatch, J.M. and C.D. Orphanides 2015. Estimates of cetacean and pinniped bycatch in the 2013 New England sink
and mid-Atlantic gillnet fisheries. Northeast Fish Sci Cent Ref Doc 15-15. 33 pp. Hatch, J.M. and C.D. Orphanides 2016. Estimates of cetacean and pinniped bycatch in the 2014 New England sink
and mid-Atlantic gillnet fisheries. Northeast Fish Sci Cent Ref Doc 16-05. 22 pp. Hooker, S.K., R.W. Baird and M.A. Showell 1997. Cetacean strandings and bycatches in Nova Scotia, Eastern
Canada, 1991–1996. International Whaling Commission SC/49/O5. 11 pp. http://www.st-andrews.ac.uk/~sh43/pubs/Hooker_etal_1997_IWC.pdf .
Kenney, R.D., P.M. Payne, D.J. Heinemann, and H.E. Winn. 1996. Shifts in Northeast shelf cetacean distributions relative to trends in Gulf of Maine/Georges Bank finfish abundance. Pages 169–196 in: K. Sherman, N. A. Jaworski, and T. J. Smayda, (eds). The Northeast Shelf ecosystem: assessment, sustainability, and management. Blackwell Science, Boston.
Laake, J.L., and D.L. Borchers 2004. Methods for incomplete detection at distance zero, Pages 108–189 in: S.T. Buckland, D.R. Andersen, K.P. Burnham, J.L. Laake, and L. Thomas, (eds.). Advanced distance sampling. Oxford University Press, New York.
Lawson, J.W. and J.-F. Gosselin 2009. Distribution and preliminary abundance estimates for cetaceans seen during Canada’s Marine Megafauna Survey - A component of the 2007 TNASS. Can. Sci. Advisory Sec. Res. Doc. 2009/031. 33 pp. http://www.dfo-mpo.gc.ca/csas-sccs/publications/resdocs-docrech/2009/2009_031-eng.htm.
Lawson, J.W. and J.-F. Gosselin 2011. Fully-corrected cetacean abundance estimates from the Canadian TNASS survey. Working Paper 10. National Marine Mammal Peer Review Meeting. Ottawa, Can. 28 p.
Ledwell, W. and J. Huntington 2012a. Incidental entanglements of cetacean and leatherback sea turtles in fishing gear reported during 2011-2012 and a summary of the Whale Release and Strandings Group activities. A preliminary report to Fisheries and Oceans Canada, St. John's, Newfoundland, Canada. 17 pp.
Ledwell, W. and J. Huntington 2012b. Incidental entrapments in fishing gear and stranding reported to and responded to by the Whale Release and Strandings Group in Newfoundland and Labrador and a summary of the Whale Release and Strandings program during 2012. Report to Fisheries and Oceans Canada, St. John's, Newfoundland, Canada. 18 pp.
Ledwell, W. and J. Huntington 2013. Incidental entrapments in fishing gear and stranding reported to and responded to by the Whale Release and Strandings Group in Newfoundland and Labrador and a summary of the Whale Release and Strandings program during 2013. Report to Fisheries and Oceans Canada, St. John's, Newfoundland, Canada. 19 pp.
Ledwell, W. and J. Huntington 2014. Incidental entrapments and entanglements of cetaceans and leatherback sea turtles, strandings, ice entrapments reported to the Whale Release and Strandings Group in Newfoundland and Labrador and a summary of the Whale Release and Strandings program during 2014. Report to the Department of Fisheries and Oceans Canada, St. John's, Newfoundland, Canada. 23 pp.

99
Ledwell, W. and J. Huntington 2015. Incidental entrapments and entanglements of cetaceans and leatherback sea turtles, strandings, ice entrapments reported to the Whale Release and Strandings Group in Newfoundland and Labrador and a summary of the Whale Release and Strandings program during 2015. Report to the Department of Fisheries and Oceans Canada, St. John's, Newfoundland, Canada. 22 pp.
Ledwell, W. and J. Huntington 2017. Incidental entrapments and entanglements of cetaceans and leatherback sea turtles, strandings, ice entrapments reported to the Whale Release and Strandings Group in Newfoundland and Labrador and a summary of the Whale Release and Strandings program during 2016. Report to the Department of Fisheries and Oceans Canada, St. John's, Newfoundland, Canada. 23 pp.
Lyssikatos, M. 2015. Estimates of cetacean and pinniped bycatch in Northeast and mid-Atlantic bottom trawl fisheries, 2008-2013. Northeast Fish Sci Cent Ref Doc. 15-19. 20 p. Available at http://www.nefsc.noaa.gov/publications/.
Lucas, Z.N. and S.K. Hooker 2000. Cetacean strandings on Sable Island, Nova Scotia, 1970–1998. Can. Field-Nat. 114(1):46–61.
Northridge, S., M. Tasker, A. Webb, K. Camphuysen and M. Leopold 1997. White-beaked Lagenorhynchus albirostris and Atlantic white-sided dolphin L. acutus distributions in northwest European and U.S. North Atlantic waters. Rep. Int. Whal. Comm. 47:797-805.
Orphanides, C.D. and J. Hatch. 2017. Estimates of cetacean and pinniped bycatch in the 2015 New England sink and Mid-Atlantic gillnet fisheries. Northeast Fish Sci Cent Ref Doc. 17-18. 21 pp. Available at: http://nefsc.noaa.gov/publications/crd/crd1718/.
Orphanides, In review. Estimates of cetacean and pinniped bycatch in the 2016 New England sink and Mid-Atlantic gillnet fisheries. Northeast Fish Sci Cent Ref Doc. 16-xx. xx pp. Available at: http://nefsc.noaa.gov/publications/crd/crd16xx/.
Palka, D., A. Read and C. Potter 1997. Summary of knowledge of white-sided dolphins (Lagenorhynchus acutus) from U.S. and Canadian Atlantic waters. Rep. Int. Whal. Comm. 47:729–734.
Palka, D.L. 2012. Cetacean abundance estimates in US northwestern Atlantic Ocean waters from summer 2011 line transect survey. Northeast Fish. Sci. Cent. Ref. Doc. 12-29. 37 pp.
http://www.nefsc.noaa.gov/nefsc/publications/crd/crd1229/ Payne, M. and D. W. Heinemann 1990. A distributional assessment of cetaceans in the shelf and shelf edge waters
of the northeastern United States based on aerial and shipboard surveys, 1978–1988. Report to NMFS. [Available from National Marine Fisheries Science Center, 166 Water St., Woods Hole, MA 02543], 108 pp.
Powell, J.W.B., D.S. Rotstein and W.E. McFee. 2012. First records of the melon-headed whale (Peponocephala electra) and Atlantic white-sided dolphin (Lagenorhynchus acutus) in South Carolina. Southeastern Nat. 11(1):23–34.
Read, A.J. 1994. Interactions between cetaceans and gillnet and trap fisheries in the northwest Atlantic. Rep. Int. Whal. Comm. (Special Issue) 15: 133-147.
Sergeant, D.E., D.J. St. Aubin and J.R. Geraci. 1980. Life history and northwest Atlantic status of the Atlantic white-sided dolphin, Lagenorhynchus acutus. Cetology 37:1–12.
Spalding, M.D., H.E. Fox, G.R. Allen, N. Davidson, Z.A. Ferdaña, M. Finlayson, B.S. Halpern, M.A. Jorge, A. Lombana, S.A. Lourie, K.D. Martin, E. McManus, J. Molnar, C.A. Recchia and J. Robertson. 2007. Marine ecoregions of the world: a bioregionalization of coastal and shelf areas. BioScience 57(7):573–583.
Stenson, G.B., S. Benjamins and D.G. Reddin. 2011. Using bycatch data to understand habitat use of small cetaceans: lessons from an experimental driftnet fishery. ICES J. Mar. Sci. 68:937-946.
Taylor, B.L., M. Martinez, T. Gerrodette, J. Barlow and Y.N. Hrovat. 2007. Lessons from monitoring trends in abundance in marine mammals. Mar. Mamm. Sci. 23(1):157–175.
Thomas L, J.L. Laake, E. Rexstad, S. Strindberg, F.F.C. Marques, S.T. Buckland, D.L. Borchers, D.R. Anderson, K.P. Burnham, M.L. Burt, S.L. Hedley, J.H. Pollard, J.R.B. Bishop and T.A. Marques 2009. Distance 6.0. Release 2. [Internet]. University of St. Andrews (UK): Research Unit for Wildlife Population Assessment. Available from: http://distancesampling.org/Distance/
Wade, P.R. and R.P. Angliss. 1997. Guidelines for assessing marine mammal stocks: Report of the GAMMS Workshop April 3-5, 1996, Seattle, Washington. NOAA Tech. Memo. NMFS-OPR-12. 93 pp.
Waring, G.T., L. Nøttestad, E. Olsen, H. Skov and G. Vikingsson. 2008. Distribution and density estimates of cetaceans along the mid-Atlantic Ridge during summer 2004. J. Cetacean Res. Manage. 10(2):137–146.
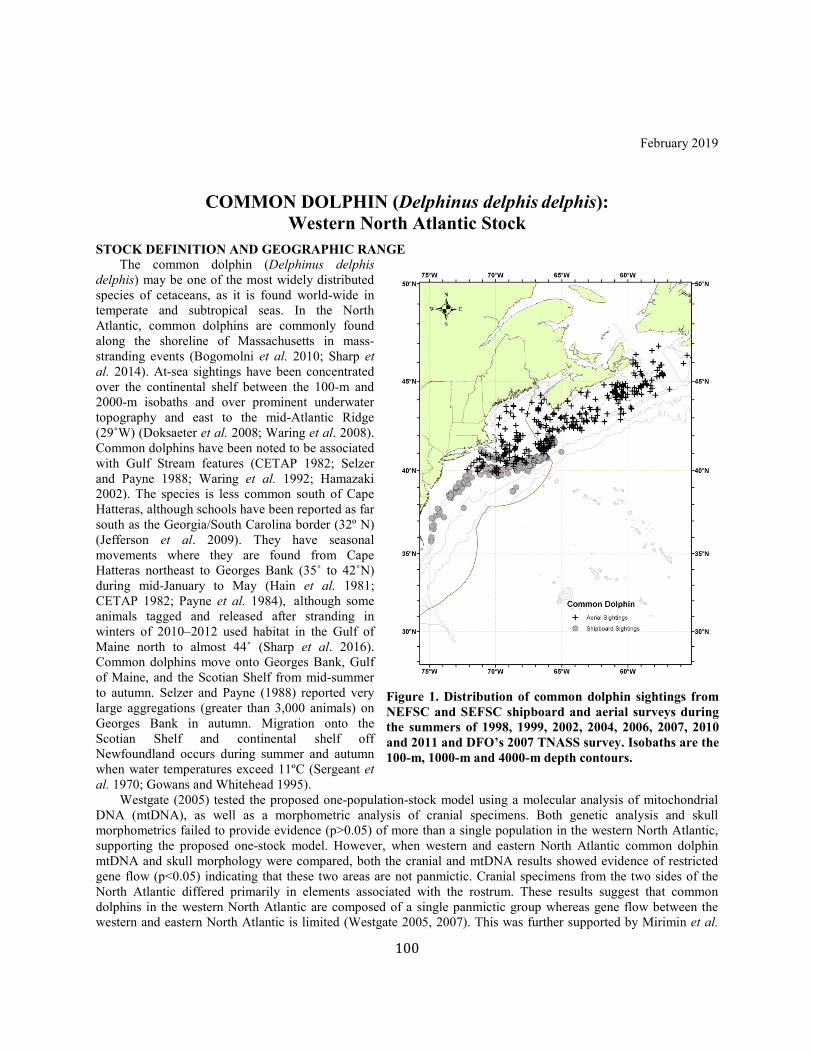
100
February 2019
COMMON DOLPHIN (Delphinus delphis delphis): Western North Atlantic Stock
STOCK DEFINITION AND GEOGRAPHIC RANGE The common dolphin (Delphinus delphis delphis) may be one of the most widely distributed species of cetaceans, as it is found world-wide in temperate and subtropical seas. In the North Atlantic, common dolphins are commonly found along the shoreline of Massachusetts in mass-stranding events (Bogomolni et al. 2010; Sharp et al. 2014). At-sea sightings have been concentrated over the continental shelf between the 100-m and 2000-m isobaths and over prominent underwater topography and east to the mid-Atlantic Ridge (29˚W) (Doksaeter et al. 2008; Waring et al. 2008). Common dolphins have been noted to be associated with Gulf Stream features (CETAP 1982; Selzer and Payne 1988; Waring et al. 1992; Hamazaki 2002). The species is less common south of Cape Hatteras, although schools have been reported as far south as the Georgia/South Carolina border (32º N) (Jefferson et al. 2009). They have seasonal movements where they are found from Cape Hatteras northeast to Georges Bank (35˚ to 42˚N) during mid-January to May (Hain et al. 1981; CETAP 1982; Payne et al. 1984), although some animals tagged and released after stranding in winters of 2010–2012 used habitat in the Gulf of Maine north to almost 44˚ (Sharp et al. 2016). Common dolphins move onto Georges Bank, Gulf of Maine, and the Scotian Shelf from mid-summer to autumn. Selzer and Payne (1988) reported very large aggregations (greater than 3,000 animals) on Georges Bank in autumn. Migration onto the Scotian Shelf and continental shelf off Newfoundland occurs during summer and autumn when water temperatures exceed 11ºC (Sergeant et al. 1970; Gowans and Whitehead 1995). Westgate (2005) tested the proposed one-population-stock model using a molecular analysis of mitochondrial DNA (mtDNA), as well as a morphometric analysis of cranial specimens. Both genetic analysis and skull morphometrics failed to provide evidence (p>0.05) of more than a single population in the western North Atlantic, supporting the proposed one-stock model. However, when western and eastern North Atlantic common dolphin mtDNA and skull morphology were compared, both the cranial and mtDNA results showed evidence of restricted gene flow (p<0.05) indicating that these two areas are not panmictic. Cranial specimens from the two sides of the North Atlantic differed primarily in elements associated with the rostrum. These results suggest that common dolphins in the western North Atlantic are composed of a single panmictic group whereas gene flow between the western and eastern North Atlantic is limited (Westgate 2005, 2007). This was further supported by Mirimin et al.
Figure 1. Distribution of common dolphin sightings from NEFSC and SEFSC shipboard and aerial surveys during the summers of 1998, 1999, 2002, 2004, 2006, 2007, 2010 and 2011 and DFO’s 2007 TNASS survey. Isobaths are the 100-m, 1000-m and 4000-m depth contours.
101
(2009) who investigated genetic variability using both nuclear and mitochondrial genetic markers and observed no significant genetic differentiation between samples from within the western North Atlantic region, which may be explained by seasonal shifts in distribution between northern latitudes (summer months) and southern latitudes (winter months). However, the authors point out that some uncertainty remains if the same population was sampled in the two different seasons.
POPULATION SIZE The current best abundance estimate for common dolphins off the U.S. Atlantic coast is 70,184 (CV=0.28). This estimate, derived from 2011 shipboard and aerial surveys, is the only current estimate available. This estimate is substantially lower than the estimate from the 2015 SAR (173,486, CV=0.55). This is because the previous estimate included data from the 2007 TNASS surveys of Canadian waters. For the purposes of this SAR, as recommended in the guidelines for preparing Stock Assessment Reports (NMFS 2016), estimates older than eight years are deemed unreliable, so this new estimate must not include data from the 2007 TNASS survey. This new estimate should not be interpreted as a decline in abundance of this stock, as previous estimates are not directly comparable (Table 1). A key uncertainty in the current abundance estimate is the number of animals in Canadian waters. The northern part of the stock’s range was not surveyed in the 2011 shipboard survey (Palka 2012). This new abundance estimate largely represents only the U.S. portion of this stock, and a small portion in Canadian waters. Additionally, the current abundance estimate does not account for availability bias due to submerged animals. Without a correction for this bias, the abundance estimate is likely biased low. Finally, since the most current estimate dates from a survey done in 2011, the ability for that estimate to accurately represent the present population size has become increasingly uncertain.
Earlier estimates Please see Appendix IV for a summary of abundance estimates, including earlier estimates and survey descriptions. As recommended in the guidelines for preparing Stock Assessment Reports (NMFS 2016), estimates older than eight years are deemed unreliable to determine a current PBR.
Recent surveys and abundance estimates An abundance estimate of 67,191 (CV=0.29) common dolphins was generated from a shipboard and aerial survey conducted during June–August 2011 (Palka 2012). The aerial portion that contributed to the estimate covered 5,313 km of tracklines that were over waters north of New Jersey from the coastline to the 100-m depth contour through the U.S. and Canadian Gulf of Maine and up to and including the lower Bay of Fundy. The shipboard portion covered 3,107 km of tracklines between central Virginia and Massachusetts in waters deeper than the 100-m depth contour out to beyond the U.S. EEZ. Both sighting platforms used a double-platform data-collection procedure, which allows estimation of abundance corrected for perception bias of the detected species (Laake and Borchers 2004). Estimation of the abundance was based on the independent-observer approach assuming point independence (Laake and Borchers 2004) and calculated using the mark-recapture distance sampling (MRDS) option in the computer program Distance (version 6.0, release 2, Thomas et al. 2009). An abundance estimate of 2,993 (CV=0.87) common dolphins was generated from a shipboard survey conducted concurrently (June–August 2011) in waters between central Virginia and central Florida. This shipboard survey included shelf-break and inner continental slope waters deeper than the 50-m depth contour within the U.S. EEZ. The survey employed a double-platform visual team procedure searching with 25×150 “bigeye” binoculars. A total of 4,445 km of tracklines was surveyed. Estimation of the abundance was based on the independent-observer approach assuming point independence (Laake and Borchers 2004) and calculated using the MRDS option in the computer program Distance (version 6.0, release 2, Thomas et al. 2009) (Table 1).
Table 1. Summary of recent abundance estimates for western North Atlantic common dolphin (Delphinus delphis delphis) by month, year, and area covered during each abundance survey, and resulting abundance estimate (Nbest) and coefficient of variation (CV).
Month/Year Area Nbest
CV
Jul-Aug 2011 Central Virginia to lower Bay of Fundy 67,191 0.29
Jun-Aug 2011 Central Florida to Central Virginia 2,993 0.87
Jun-Aug 2011 Central Florida to lower Bay of Fundy (COMBINED) 70,184 0.28
102
Minimum Population Estimate The minimum population estimate is the lower limit of the two-tailed 60% confidence interval of the log-normally distributed best abundance estimate. This is equivalent to the 20th percentile of the log-normal distribution as specified by Wade and Angliss (1997). The best estimate of abundance for common dolphins is 70,184 animals (CV=0.28), derived from the 2011 aerial and shipboard surveys. The minimum population estimate for the western North Atlantic common dolphin is 55,690.
Current Population Trend A trend analysis has not been conducted for this stock. The statistical power to detect a trend in abundance for this stock is poor due to the relatively imprecise abundance estimates and long survey interval (see Appendix IV for a survey history of this stock). For example, the power to detect a precipitous decline in abundance (i.e., 50% decrease in 15 years) with estimates of low precision (e.g., CV>0.30) remains below 80% (alpha=0.30) unless surveys are conducted on an annual basis (Taylor et al. 2007).
CURRENT AND MAXIMUM NET PRODUCTIVITY RATES There is limited published life-history information that could be used to estimate net productivity. Westgate (2005) and Westgate and Read (2007) have provided reviews with a number of known parameters. There is a peak in parturition during July and August with an average birth date of 28 July. Gestation lasts about 11.7 months and lactation lasts at least a year. Given these results, western North Atlantic female common dolphins likely average 2–3 year calving intervals. Females become sexually mature earlier (8.3 years and 200 cm) than males (9.5 years and 215 cm) as males continue to increase in size and mass. There is significant sexual dimorphism present with males being on average about 9% larger in body length. Due to uncertainties about the stock-specific life-history parameters, the maximum net productivity rate was assumed to be the default value for cetaceans of 0.04. This value is based on theoretical modeling showing that cetacean populations may not grow at rates much greater than 4% given the constraints of their reproductive life history (Barlow et al. 1995).
POTENTIAL BIOLOGICAL REMOVAL Potential Biological Removal (PBR) is the product of minimum population size, one-half the maximum productivity rate, and a recovery factor (MMPA Sec. 3. 16 U.S.C. 1362; Wade and Angliss 1997). The minimum population size is 55,690 animals. The maximum productivity rate is 0.04, the default value for cetaceans. The recovery factor is 0.5, the default value for stocks of unknown status and with the CV of the average mortality estimate less than 0.3 (Wade and Angliss 1997). PBR for the western North Atlantic stock of common dolphin is 557.
ANNUAL HUMAN-CAUSED MORTALITY AND SERIOUS INJURY Average annual estimated fishery-related mortality or serious injury to this stock during 2012–2016 was 406 (CV=0.10) common dolphins from estimated annual bycatch in observed fisheries plus 0.2 from research takes, for a total of 406.2. Uncertainties not accounted for include the potential that the observer coverage was not representative of the fishery during all times and places. There are no major known sources of unquantifiable human-caused mortality or serious injury for this stock.
Fishery information Detailed fishery information is reported in Appendix III.
Earlier Interactions Historically, U.S. fishery interactions have been documented with common dolphins in the northeast and mid-Atlantic gillnet fisheries, northeast and mid-Atlantic bottom trawl fisheries, northeast and mid-Atlantic mid-water trawl fishery, and the pelagic longline fishery. See Appendix V for more information on historical takes.
Northeast Sink Gillnet Annual common dolphin mortalities were estimated using annual ratio-estimator methods (Hatch and Orphanides 2014, 2015, 2016; Orphanides and Hatch 2017, Orphanides 2019). See Table 2 for bycatch estimates and observed mortality and serious injury for the current 5-year period, and Appendix V for historical bycatch information.
103
Mid-Atlantic Gillnet Common dolphins were taken in observed trips during most years. Annual common dolphin mortalities were estimated using annual ratio-estimator methods (Hatch and Orphanides 2014, 2015, 2016; Orphanides and Hatch 2017, Orphanides 2019). See Table 2 for bycatch estimates and observed mortality and serious injury for the current 5-year period, and Appendix V for historical bycatch information.
Northeast Bottom Trawl This fishery is active in New England waters in all seasons. Annual common dolphin mortalities were estimated using annual stratified ratio-estimator methods (Chavez-Rosales et al. 2018). See Table 2 for bycatch estimates and observed mortality and serious injury for the current 5-year period, and Appendix V for historical bycatch information.
Mid-Atlantic Bottom Trawl Annual common dolphin mortalities were estimated using annual stratified ratio-estimator methods (Chavez-Rosales et al. 2018). See Table 2 for bycatch estimates and observed mortality and serious injury for the current 5-year period, and Appendix V for historical bycatch information.
Northeast Mid-water Trawl Fishery (Including Pair Trawl) A common dolphin mortality was observed in this fishery in 2012 (Table 2). An expanded bycatch estimate has not been calculated so the minimum raw count is reported.
Pelagic Longline Pelagic longline bycatch estimates of common dolphins for 2012–2016 were documented in Garrison and Stokes (2013, 2014, 2016, 2017, in review). There is a high likelihood that dolphins released alive with ingested gear or gear wrapped around appendages will not survive (Wells et al. 2008). See Table 2 for bycatch estimates and observed mortality and serious injury for the current 5-year period, and Appendix V for historical bycatch information.
Research Takes In October 2016; The University of Rhode Island, Graduate School of Oceanography reported the incidental capture/drowning of a 206-cm female, common dolphin during a routine, weekly research trawl fishing trip in Narragansett Bay, Rhode Island. The incident was reported to Mystic Aquarium, Mystic, Connecticut; NOAA GARFO Office, Gloucester, Massachusetts; NOAA Law enforcement; and NOAA Protected Species Branch, Woods Hole, Massachusetts. A complete necropsy was conducted at the Wood Hole Oceanographic Institution, Woods Hole, Massachusetts.
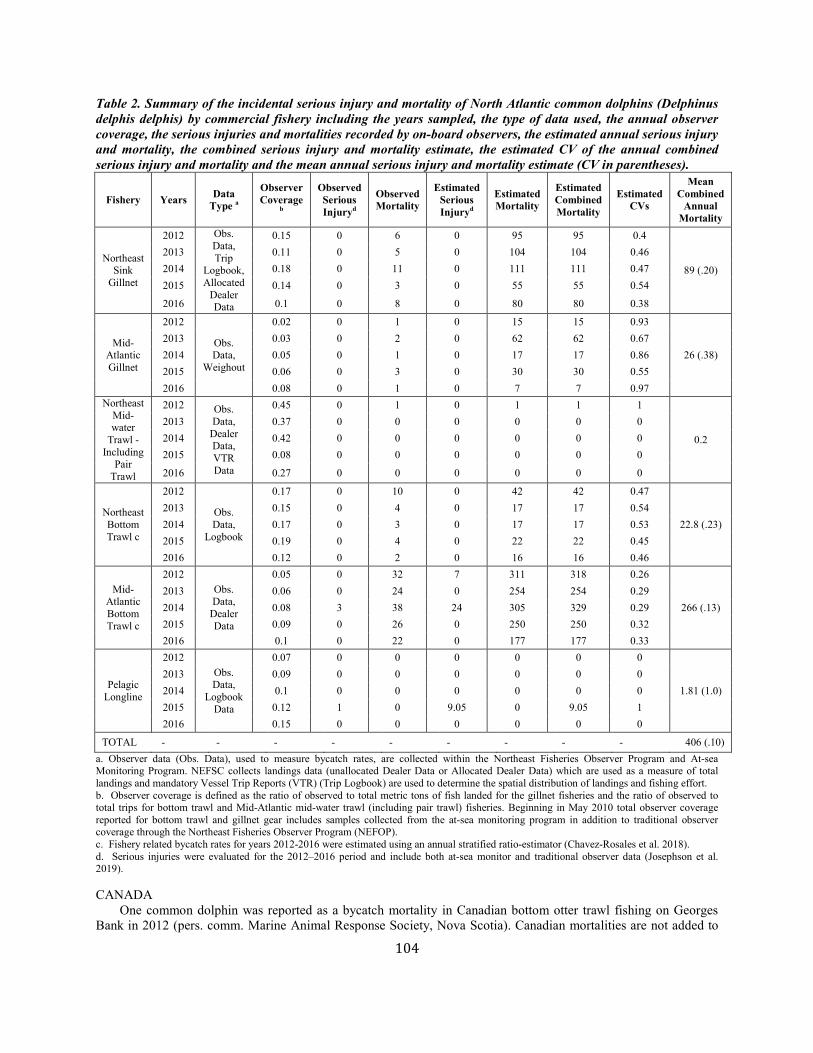
104
Table 2. Summary of the incidental serious injury and mortality of North Atlantic common dolphins (Delphinus delphis delphis) by commercial fishery including the years sampled, the type of data used, the annual observer coverage, the serious injuries and mortalities recorded by on-board observers, the estimated annual serious injury and mortality, the combined serious injury and mortality estimate, the estimated CV of the annual combined serious injury and mortality and the mean annual serious injury and mortality estimate (CV in parentheses).
Fishery Years Data Type a
Observer Coverage
b
Observed Serious Injuryd
Observed Mortality
Estimated Serious Injuryd
Estimated Mortality
Estimated Combined Mortality
Estimated CVs
Mean Combined
Annual Mortality
Northeast Sink
Gillnet
2012 Obs. Data, Trip
Logbook, Allocated
Dealer Data
0.15 0 6 0 95 95 0.4
89 (.20)
2013 0.11 0 5 0 104 104 0.46 2014 0.18 0 11 0 111 111 0.47 2015 0.14 0 3 0 55 55 0.54
2016 0.1 0 8 0 80 80 0.38
Mid-Atlantic Gillnet
2012
Obs. Data,
Weighout
0.02 0 1 0 15 15 0.93
26 (.38) 2013 0.03 0 2 0 62 62 0.67 2014 0.05 0 1 0 17 17 0.86 2015 0.06 0 3 0 30 30 0.55 2016 0.08 0 1 0 7 7 0.97
Northeast Mid-water
Trawl - Including
Pair Trawl
2012 Obs. Data,
Dealer Data, VTR Data
0.45 0 1 0 1 1 1
0.2
2013 0.37 0 0 0 0 0 0 2014 0.42 0 0 0 0 0 0 2015 0.08 0 0 0 0 0 0
2016 0.27 0 0 0 0 0 0
Northeast Bottom Trawl c
2012
Obs. Data,
Logbook
0.17 0 10 0 42 42 0.47
22.8 (.23) 2013 0.15 0 4 0 17 17 0.54 2014 0.17 0 3 0 17 17 0.53 2015 0.19 0 4 0 22 22 0.45 2016 0.12 0 2 0 16 16 0.46
Mid-Atlantic Bottom Trawl c
2012 Obs. Data,
Dealer Data
0.05 0 32 7 311 318 0.26
266 (.13) 2013 0.06 0 24 0 254 254 0.29 2014 0.08 3 38 24 305 329 0.29 2015 0.09 0 26 0 250 250 0.32 2016 0.1 0 22 0 177 177 0.33
Pelagic Longline
2012 Obs. Data,
Logbook Data
0.07 0 0 0 0 0 0
1.81 (1.0) 2013 0.09 0 0 0 0 0 0 2014 0.1 0 0 0 0 0 0 2015 0.12 1 0 9.05 0 9.05 1 2016 0.15 0 0 0 0 0 0
TOTAL - - - - - - - - - 406 (.10) a. Observer data (Obs. Data), used to measure bycatch rates, are collected within the Northeast Fisheries Observer Program and At-sea Monitoring Program. NEFSC collects landings data (unallocated Dealer Data or Allocated Dealer Data) which are used as a measure of total landings and mandatory Vessel Trip Reports (VTR) (Trip Logbook) are used to determine the spatial distribution of landings and fishing effort. b. Observer coverage is defined as the ratio of observed to total metric tons of fish landed for the gillnet fisheries and the ratio of observed to total trips for bottom trawl and Mid-Atlantic mid-water trawl (including pair trawl) fisheries. Beginning in May 2010 total observer coverage reported for bottom trawl and gillnet gear includes samples collected from the at-sea monitoring program in addition to traditional observer coverage through the Northeast Fisheries Observer Program (NEFOP). c. Fishery related bycatch rates for years 2012-2016 were estimated using an annual stratified ratio-estimator (Chavez-Rosales et al. 2018). d. Serious injuries were evaluated for the 2012–2016 period and include both at-sea monitor and traditional observer data (Josephson et al. 2019). CANADA One common dolphin was reported as a bycatch mortality in Canadian bottom otter trawl fishing on Georges Bank in 2012 (pers. comm. Marine Animal Response Society, Nova Scotia). Canadian mortalities are not added to
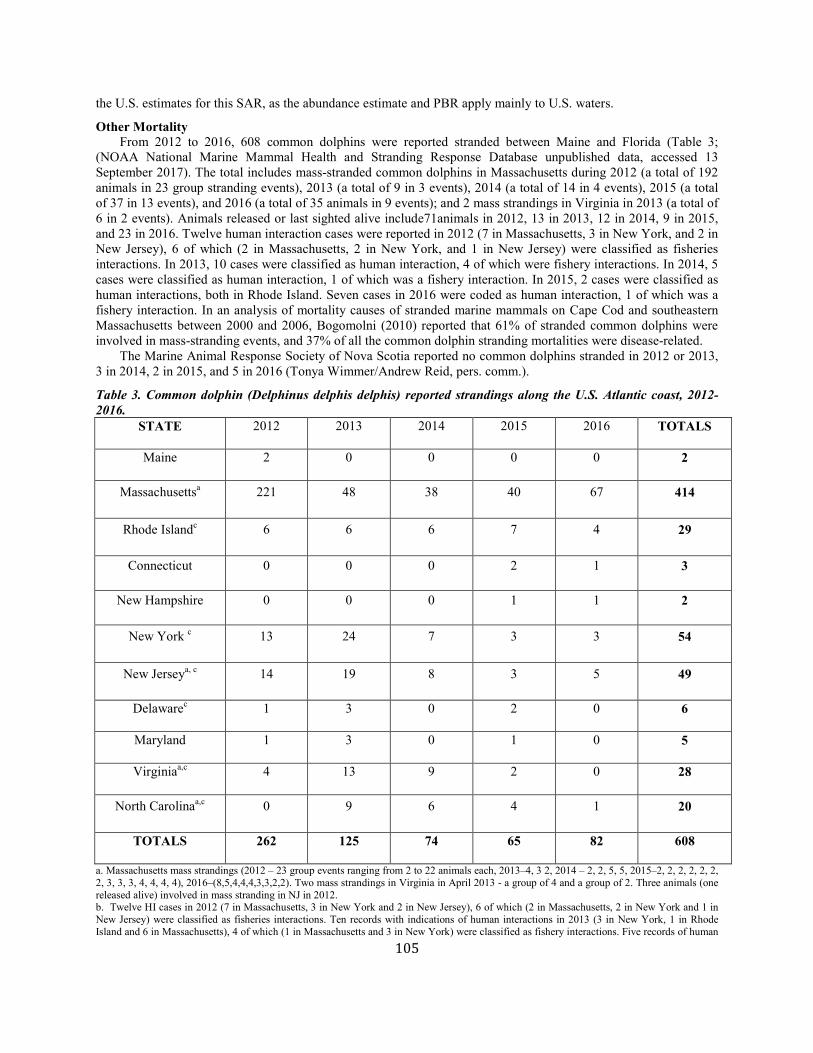
105
the U.S. estimates for this SAR, as the abundance estimate and PBR apply mainly to U.S. waters.
Other Mortality From 2012 to 2016, 608 common dolphins were reported stranded between Maine and Florida (Table 3; (NOAA National Marine Mammal Health and Stranding Response Database unpublished data, accessed 13 September 2017). The total includes mass-stranded common dolphins in Massachusetts during 2012 (a total of 192 animals in 23 group stranding events), 2013 (a total of 9 in 3 events), 2014 (a total of 14 in 4 events), 2015 (a total of 37 in 13 events), and 2016 (a total of 35 animals in 9 events); and 2 mass strandings in Virginia in 2013 (a total of 6 in 2 events). Animals released or last sighted alive include71animals in 2012, 13 in 2013, 12 in 2014, 9 in 2015, and 23 in 2016. Twelve human interaction cases were reported in 2012 (7 in Massachusetts, 3 in New York, and 2 in New Jersey), 6 of which (2 in Massachusetts, 2 in New York, and 1 in New Jersey) were classified as fisheries interactions. In 2013, 10 cases were classified as human interaction, 4 of which were fishery interactions. In 2014, 5 cases were classified as human interaction, 1 of which was a fishery interaction. In 2015, 2 cases were classified as human interactions, both in Rhode Island. Seven cases in 2016 were coded as human interaction, 1 of which was a fishery interaction. In an analysis of mortality causes of stranded marine mammals on Cape Cod and southeastern Massachusetts between 2000 and 2006, Bogomolni (2010) reported that 61% of stranded common dolphins were involved in mass-stranding events, and 37% of all the common dolphin stranding mortalities were disease-related. The Marine Animal Response Society of Nova Scotia reported no common dolphins stranded in 2012 or 2013, 3 in 2014, 2 in 2015, and 5 in 2016 (Tonya Wimmer/Andrew Reid, pers. comm.).
Table 3. Common dolphin (Delphinus delphis delphis) reported strandings along the U.S. Atlantic coast, 2012-2016.
STATE 2012 2013 2014 2015 2016 TOTALS
Maine 2 0 0 0 0 2
Massachusettsa 221 48 38 40 67 414
Rhode Islandc 6 6 6 7 4 29
Connecticut 0 0 0 2 1 3
New Hampshire 0 0 0 1 1 2
New York c 13 24 7 3 3 54
New Jerseya, c 14 19 8 3 5 49
Delawarec 1 3 0 2 0 6
Maryland 1 3 0 1 0 5
Virginiaa,c 4 13 9 2 0 28
North Carolinaa,c 0 9 6 4 1 20
TOTALS 262 125 74 65 82 608
a. Massachusetts mass strandings (2012 – 23 group events ranging from 2 to 22 animals each, 2013–4, 3 2, 2014 – 2, 2, 5, 5, 2015–2, 2, 2, 2, 2, 2, 2, 3, 3, 3, 4, 4, 4, 4), 2016–(8,5,4,4,4,3,3,2,2). Two mass strandings in Virginia in April 2013 - a group of 4 and a group of 2. Three animals (one released alive) involved in mass stranding in NJ in 2012. b. Twelve HI cases in 2012 (7 in Massachusetts, 3 in New York and 2 in New Jersey), 6 of which (2 in Massachusetts, 2 in New York and 1 in New Jersey) were classified as fisheries interactions. Ten records with indications of human interactions in 2013 (3 in New York, 1 in Rhode Island and 6 in Massachusetts), 4 of which (1 in Massachusetts and 3 in New York) were classified as fishery interactions. Five records of human
106
interaction in 2014 (1 fisheries interaction in Rhode Island, 2 other human interactions in Massachusetts and 2 in Rhode Island). Two of the human interactions in 2014 (1 Massachusetts and 1 Rhode Island) involved live animals. Two records of HI in 2015, both in Rhode Island. Seven HI cases in 2016 (6 in Massachusetts and 1 in Rhode Island), 5 of which were relocation responses to live animals. Of the 2 dead HI, 1 in Massachusetts was coded as a fishery interaction and 1 in Rhode Island had unauthorized public intervention prior to euthanasia by stranding responders. Stranding data probably underestimate the extent of fishery-related mortality and serious injury because all of the marine mammals that die or are seriously injured may not wash ashore, nor will all of those that do wash ashore necessarily show signs of entanglement or other fishery interaction. Finally, the level of technical expertise among stranding network personnel varies widely as does the ability to recognize signs of fishery interaction. However a recently published human interaction manual (Barco and Moore 2013) and case criteria for human interaction determinations (Moore et al. 2013) should help with this.
STATUS OF STOCK Common dolphins are not listed as threatened or endangered under the Endangered Species Act, and the Western North Atlantic stock is not considered strategic under the Marine Mammal Protection Act. The 2012–2016 average annual human-related mortality does not exceed PBR. The total U.S. fishery-related mortality and serious injury for this stock is not less than 10% of the calculated PBR and, therefore, cannot be considered to be insignificant and approaching zero mortality and serious injury rate. The status of common dolphins, relative to OSP, in the U.S. Atlantic EEZ is unknown. Population trends for this species have not been investigated.
REFERENCES CITED Barco, S., and K.T. Moore. 2013. Handbook for recognizing, evaluating and documenting human interactions in
stranded cetaceans and pinnipeds. NOAA Tech. Memo. NMFS-SWFSC-510. 102 pp. http://swfsc.noaa.gov/publications/TM/SWFSC/NOAA-TM-NMFS-SWFSC-510.pdf.
Barlow, J., S.L. Swartz, T.C. Eagle and P.R. Wade. 1995. U.S. marine mammal stock assessments: Guidelines for preparation, background, and a summary of the 1995 assessments. NOAA Tech. Memo. NMFS-OPR-6. 73 pp.
Bogomolni, A.L., K.R. Pugliares, S.M. Sharp, K. Patchett, C.T. Harry, J.M. LaRocque, K.M. Touhey and M. Moore. 2010. Mortality trends of stranded marine mammals on Cape Cod and southeastern Massachusetts, USA, 2000 to 2006. Dis. Aquat. Org. 88:143–155.
Buckland, S.T., D.R. Anderson, K.P. Burnham, J.L. Laake, D.L. Borchers and L. Thomas. 2001. Introduction to distance sampling: estimating abundance of biological populations. Oxford University Press, London, UK. 432 pp.
CETAP. 1982. A characterization of marine mammals and turtles in the mid- and North Atlantic areas of the U.S. outer continental shelf, final report, Cetacean and Turtle Assessment Program, University of Rhode Island. Bureau of Land Management, Washington, DC. #AA551-CT8-48. 576 pp.
Chavez-Rosales, S., M.C. Lyssikatos, and J. Hatch. 2018. Estimates of cetacean and pinniped bycatch in northeast and mid-Atlantic bottom trawl fisheries, 2012-2016. NOAA Tech. Memo NMFS-NE-250. 29pp.
Doksaeter, L., E. Olsen, L. Nottestad and A. Ferno. 2008 Distribution and feeding ecology of dolphins along the mid-Atlantic Ridge between Iceland and the Azores. Deep Sea Res. II 55:243–253.
Garrison, L.P. and L. Stokes 2013. Estimated bycatch of marine mammals and sea turtles in the U.S. Atlantic pelagic longline fleet during 2012. NOAA Tech. Memo. NMFS-SEFSC-655. 62 pp.
Garrison, L.P. and L. Stokes. 2014. Estimated bycatch of marine mammals and sea turtles in the U.S. Atlantic pelagic longline fleet during 2013. NOAA Tech. Memo. NMFS-SEFSC-667. 61pp.
Garrison, L.P. and L. Stokes. 2016. Estimated bycatch of marine mammals and sea turtles in the U.S. Atlantic pelagic longline fleet during 2014. NOAA Tech. Memo. NMFS-SEFSC-696. 62 pp.
Garrison, L.P. and L. Stokes. 2017. Estimated bycatch of marine mammals and sea turtles in the U.S. Atlantic pelagic longline fleet during 2015. NOAA Tech. Memo. NMFS-SEFSC-709. 67 pp.
Garrison, L.P. and L. Stokes. in review. Estimated bycatch of marine mammals and sea turtles in the U.S. Atlantic pelagic longline fleet during 2016.
Gowans, S., and H. Whitehead. 1995. Distribution and habitat partitioning by small odontocetes in the Gully, a submarine canyon on the Scotian Shelf. Can. J. Zool. 73:1599–1608.
Hain, J.H.W., R.K. Edel, H.E. Hays, S.K. Katona and J.D. Roanowicz. 1981. General distribution of cetaceans in the continental shelf waters of the northeastern United States. Pages II.1–II.345 In: Cetacean and Turtle Assessment Program, University of Rhode Island. A characterization of marine mammals and turtles in the mid- and north Atlantic areas of the US outer continental shelf, annual report for 1979. Bureau of Land Management, Washington, DC. AA551-CT8-48.
107
Hamazaki, T. 2002. Spatiotemporal prediction models of cetacean habitats in the mid-western North Atlantic Ocean (from Cape Hatteras, North Carolina, U.S.A to Nova Scotia, Canada). Mar. Mamm. Sci. 18(4):920-939.
Hatch, J.M. and C.D. Orphanides. 2014. Estimates of cetacean and pinniped bycatch in the 2012 New England sink and Mid-Atlantic gillnet fisheries. Northeast Fish. Sci. Cent. Ref. Doc. 14-02. 20 pp.
Hatch, J.M. and C.D. Orphanides. 2015. Estimates of cetacean and pinniped bycatch in the 2013 New England sink and Mid-Atlantic gillnet fisheries. Northeast Fish. Sci. Cent. Ref. Doc. 15-15. 33 pp.
Hatch, J.M. and C.D. Orphanides. 2016. Estimates of cetacean and pinniped bycatch in the 2014 New England sink and Mid-Atlantic gillnet fisheries. Northeast Fish. Sci. Cent. Ref. Doc.16-05. 22 pp.
Jefferson, T.A., D. Fertl, J. Bolanos-Jimenez and A.N. Zerbini. 2009. Distribution of common dolphins (Delphinus spp.) in the western North Atlantic: a critical re-examination. Mar. Biol. 156:1109–1124.
Josephson, E., F. Wenzel and M.C. Lyssikatos. 2019. Serious injury determinations for small cetaceans and pinnipeds caught in commercial fisheries off the northeast U.S. coast, 2012-2016. Northeast Fish. Sci. Cent. Ref. Doc. 19-05, 27pp.
Laake, J.L., J. Calambokidis, S.D. Osmek, and D.J. Rugh. 1997. Probability of detecting harbor porpoise from aerial surveys: estimating g(0). J. Wildl. Manage. 61:63–75.
Laake, J.L. and D.L. Borchers. 2004. Methods for incomplete detection at distance zero. Pages 108-189 in: Advanced distance sampling, S.T. Buckland, D.R. Andersen, K.P. Burnham, J.L. Laake and L. Thomas, (eds.), Oxford University Press, New York, NY.
Lens, S. 1997. Interactions between marine mammals and deep water trawlers in the NAFO regulatory area. Unpublished meeting document C.M. 1997/Q:08. International Council for the Exploration of the Sea, Copenhagen, Denmark. 10 pp.
Mirimin L., A. Westgate, E. Rogan,P. Rosel, A. Read, J. Coughlan and T. Cross. 2009. Population structure of short-beaked common dolphins (Delphinus delphis) in the North Atlantic Ocean as revealed by mitochondrial and nuclear genetic markers. Mar. Biol. 156:821–834. DOI 10.1007/s00227-008-1120-y123
Moore, M., J. van der Hoop, S. Barco, A. Costidis, F. Gulland, P. Jepson, K. Moore, S. Raverty and W. McLellan. 2013. Criteria and case definitions for serious injury and death of pinnipeds and cetaceans caused by anthropogenic trauma. Dis. Aquat. Org. 103(3):229–264.
National Marine Fisheries Service (NMFS). 2016. Guidelines for preparing stock assessment reports pursuant to the 1994 amendments to the Marine Mammal Protection Act. 23 p. Available online: https://www.fisheries.noaa.gov/national/marine-mammal-protection/guidelines-assessing-marine-mammal-stocks. Accessed July 2017.
Orphanides, C.D. and J. Hatch. 2017. Estimates of cetacean and pinniped bycatch in the 2015 New England Sink Gillnet fishery and mid-Atlantic gillnet fisheries. Northeast Fish. Sci. Cent. Ref. Doc 17-18. 21 pp.
Orphanides, C.D. 2019. Estimates of cetacean and pinniped bycatch in the 2016 New England Sink Gillnet fishery and mid-Atlantic gillnet fisheries. 19-04. 12 pp.
Palka, D.L. 2012. Cetacean abundance estimates in US northwestern Atlantic Ocean waters from summer 2011 line transect survey. Northeast Fish. Sci. Cent. Ref. Doc. 12-29. 37 pp.
http://www.nefsc.noaa.gov/nefsc/publications/crd/crd1229/ Payne, P.M., L.A. Selzer and A.R. Knowlton. 1984. Distribution and density of cetaceans, marine turtles and
seabirds in the shelf waters of the northeast U.S., June 1980 – Dec. 1983, based on shipboard observations. Final report, contract NA81FAC00023. National Marine Fisheries Service, Woods Hole, MA. 245 pp.
Selzer, L.A. and P.M. Payne. 1988. The distribution of white-sided (Lagenorhynchus acutus) and common dolphins (Delphinus delphis) vs. environmental features of the continental shelf of the northeastern United States. Mar. Mamm. Sci. 4(2):141–153.
Sergeant, D.E., A.W. Mansfield and B. Beck. 1970. Inshore records of cetacea for eastern Canada, 1949-68. J. Fish. Res. Board Can. 27:1903–1915.
Sharp, S.M., C.T. Harry, J.M. Hoppe, K.M. Moore, M.E. Niemeyer, I. Robinson, K.S. Rose, W.B. Sharp, S. Landry, J. Richardson and M.J. Moore 2016. A comparison of post release survival parameters between single and mass stranded delphinids from Cape Cod, Massachusetts, U.S.A. Mar. Mamm. Sci. 32(1):161–180.
Sharp, S.M., J.S. Knoll, M.J. Moore, K.M. Moore, C.T. Harry, J. M Hoppe, M.E. Niemeyer, I. Robinson, K.S. Rose, W.B. Sharp and D. Rotstein. 2014, Hematological, biochemical, and morphological parameters as prognostic indicators for stranded common dolphins (Delphinus delphis) from Cape Cod, Massachusetts, U.S.A. Mar. Mamm. Sci. 30(3):864–887.

108
Taylor, B.L., M. Martinez, T. Gerrodette, J. Barlow and Y.N. Hrovat. 2007. Lessons from monitoring trends in abundance in marine mammals. Mar. Mamm. Sci. 23(1):157–175.
Thomas L, J.L. Laake, E. Rexstad, S. Strindberg, F.F.C. Marques, S.T. Buckland, D.L. Borchers, D.R. Anderson, K.P. Burnham, M.L. Burt, S.L. Hedley, J.H. Pollard, J.R.B. Bishop and T.A. Marques. 2009. Distance 6.0. Release 2. [Internet]. University of St. Andrews, Research Unit for Wildlife Population Assessment. St. Andrews, UK. Available from: http://distancesampling.org/Distance/
Wade, P.R. and R.P. Angliss. 1997. Guidelines for assessing marine mammal stocks: Report of the GAMMS Workshop April 3-5, 1996, Seattle, Washington. NOAA Tech. Memo. NMFS-OPR-12. 93 pp.
Waring, G.T., C.P. Fairfield, C. M. Ruhsam and M. Sano. 1992. Cetaceans associated with Gulf Stream features off the northeastern USA shelf. Unpublished meeting document C.M. 1992/N:12. International Council for the Exploration of the Sea, Copenhagen, Denmark.
Waring, G.T., L. Nottestad, E. Olsen, H. Skov and G. Vikingsson. 2008. Distribution and density estimates of cetaceans along the mid-Atlantic Ridge during summer 2004. J. Cetacean Res. Manage. 10(2):137–146.
Wells, R.S., J.B. Allen, S. Hofmann, K. Bassos-Hull, D.A. Fauquier, N.B. Barros, R.E. DeLynn, G. Sutton, V. Socha and M.D. Scott. 2008. Consequences of injuries on survival and reproduction of common bottlenose dolphins (Tursiops truncatus) along the west coast of Florida. Mar. Mamm. Sci. 24:774–794.
Westgate, A.J. 2005. Population structure and life history of short-beaked common dolphins (Delphinus delphis) in the North Atlantic. Ph.D thesis. Nicholas School of the Environment and Earth Sciences, Duke University, Beaufort, NC.
Westgate, A.J. 2007. Geographic variation in cranial morphology of short-beaked common dolphins (Delphinus delphis) from the North Atlantic. J. Mamm. 88(3):678–688.
Westgate, A.J., and A.J. Read. 2007. Reproduction in short-beaked common dolphins (Delphinus delphis) from the western North Atlantic. Mar. Biol. 150:1011–1024.
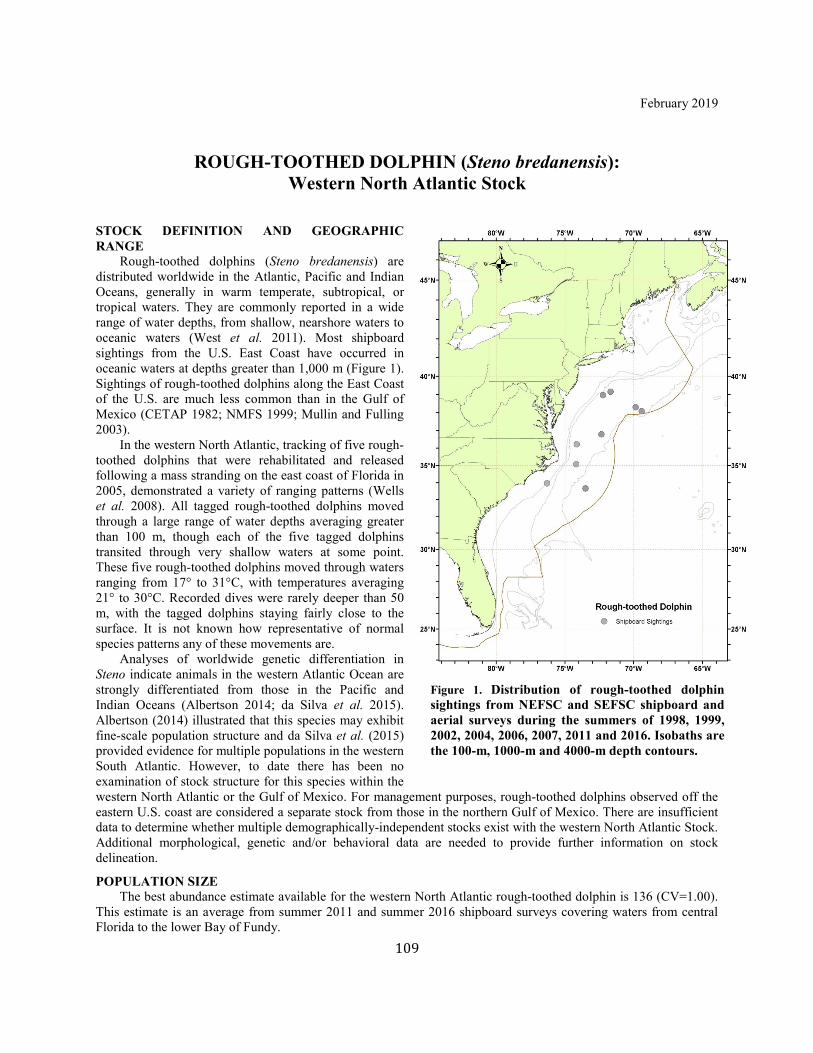
109
February 2019
ROUGH-TOOTHED DOLPHIN (Steno bredanensis): Western North Atlantic Stock
STOCK DEFINITION AND GEOGRAPHIC RANGE Rough-toothed dolphins (Steno bredanensis) are distributed worldwide in the Atlantic, Pacific and Indian Oceans, generally in warm temperate, subtropical, or tropical waters. They are commonly reported in a wide range of water depths, from shallow, nearshore waters to oceanic waters (West et al. 2011). Most shipboard sightings from the U.S. East Coast have occurred in oceanic waters at depths greater than 1,000 m (Figure 1). Sightings of rough-toothed dolphins along the East Coast of the U.S. are much less common than in the Gulf of Mexico (CETAP 1982; NMFS 1999; Mullin and Fulling 2003). In the western North Atlantic, tracking of five rough-toothed dolphins that were rehabilitated and released following a mass stranding on the east coast of Florida in 2005, demonstrated a variety of ranging patterns (Wells et al. 2008). All tagged rough-toothed dolphins moved through a large range of water depths averaging greater than 100 m, though each of the five tagged dolphins transited through very shallow waters at some point. These five rough-toothed dolphins moved through waters ranging from 17° to 31°C, with temperatures averaging 21° to 30°C. Recorded dives were rarely deeper than 50 m, with the tagged dolphins staying fairly close to the surface. It is not known how representative of normal species patterns any of these movements are. Analyses of worldwide genetic differentiation in Steno indicate animals in the western Atlantic Ocean are strongly differentiated from those in the Pacific and Indian Oceans (Albertson 2014; da Silva et al. 2015). Albertson (2014) illustrated that this species may exhibit fine-scale population structure and da Silva et al. (2015) provided evidence for multiple populations in the western South Atlantic. However, to date there has been no examination of stock structure for this species within the western North Atlantic or the Gulf of Mexico. For management purposes, rough-toothed dolphins observed off the eastern U.S. coast are considered a separate stock from those in the northern Gulf of Mexico. There are insufficient data to determine whether multiple demographically-independent stocks exist with the western North Atlantic Stock. Additional morphological, genetic and/or behavioral data are needed to provide further information on stock delineation.
POPULATION SIZE The best abundance estimate available for the western North Atlantic rough-toothed dolphin is 136 (CV=1.00). This estimate is an average from summer 2011 and summer 2016 shipboard surveys covering waters from central Florida to the lower Bay of Fundy.
Figure 1. Distribution of rough-toothed dolphin sightings from NEFSC and SEFSC shipboard and aerial surveys during the summers of 1998, 1999, 2002, 2004, 2006, 2007, 2011 and 2016. Isobaths are the 100-m, 1000-m and 4000-m depth contours.
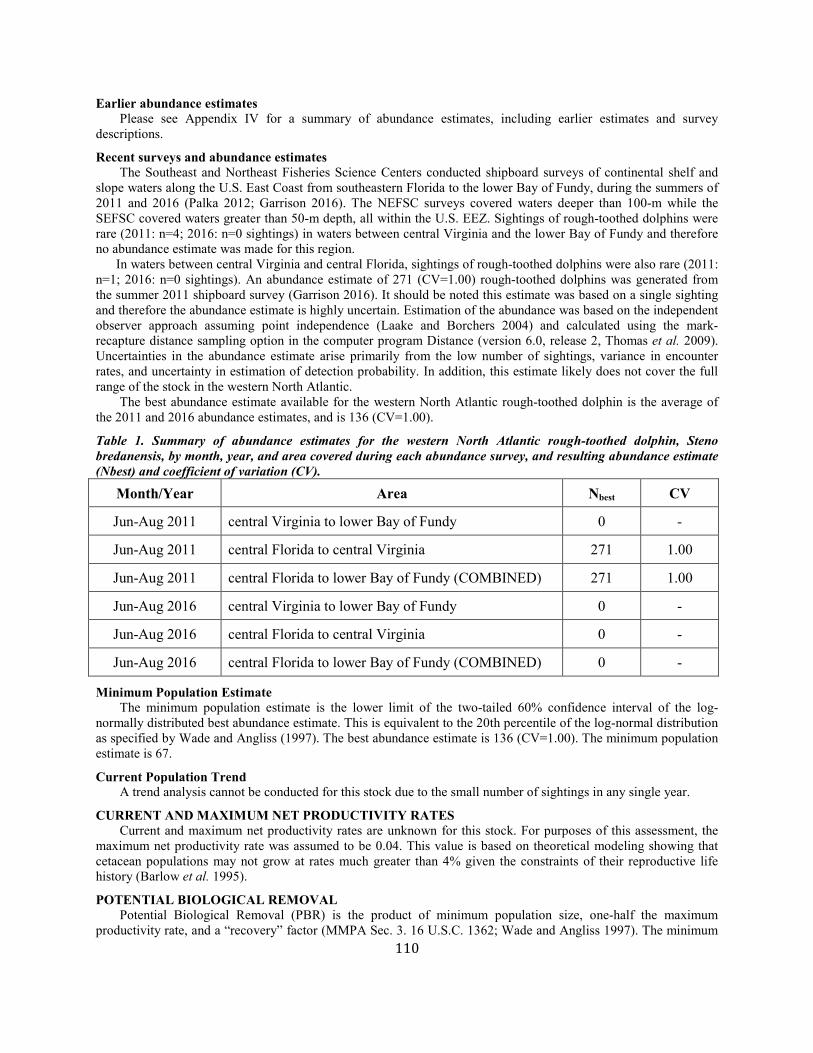
110
Earlier abundance estimates Please see Appendix IV for a summary of abundance estimates, including earlier estimates and survey descriptions.
Recent surveys and abundance estimates The Southeast and Northeast Fisheries Science Centers conducted shipboard surveys of continental shelf and slope waters along the U.S. East Coast from southeastern Florida to the lower Bay of Fundy, during the summers of 2011 and 2016 (Palka 2012; Garrison 2016). The NEFSC surveys covered waters deeper than 100-m while the SEFSC covered waters greater than 50-m depth, all within the U.S. EEZ. Sightings of rough-toothed dolphins were rare (2011: n=4; 2016: n=0 sightings) in waters between central Virginia and the lower Bay of Fundy and therefore no abundance estimate was made for this region. In waters between central Virginia and central Florida, sightings of rough-toothed dolphins were also rare (2011: n=1; 2016: n=0 sightings). An abundance estimate of 271 (CV=1.00) rough-toothed dolphins was generated from the summer 2011 shipboard survey (Garrison 2016). It should be noted this estimate was based on a single sighting and therefore the abundance estimate is highly uncertain. Estimation of the abundance was based on the independent observer approach assuming point independence (Laake and Borchers 2004) and calculated using the mark-recapture distance sampling option in the computer program Distance (version 6.0, release 2, Thomas et al. 2009). Uncertainties in the abundance estimate arise primarily from the low number of sightings, variance in encounter rates, and uncertainty in estimation of detection probability. In addition, this estimate likely does not cover the full range of the stock in the western North Atlantic. The best abundance estimate available for the western North Atlantic rough-toothed dolphin is the average of the 2011 and 2016 abundance estimates, and is 136 (CV=1.00).
Table 1. Summary of abundance estimates for the western North Atlantic rough-toothed dolphin, Steno bredanensis, by month, year, and area covered during each abundance survey, and resulting abundance estimate (Nbest) and coefficient of variation (CV).
Month/Year Area Nbest CV
Jun-Aug 2011 central Virginia to lower Bay of Fundy 0 -
Jun-Aug 2011 central Florida to central Virginia 271 1.00
Jun-Aug 2011 central Florida to lower Bay of Fundy (COMBINED) 271 1.00
Jun-Aug 2016 central Virginia to lower Bay of Fundy 0 -
Jun-Aug 2016 central Florida to central Virginia 0 -
Jun-Aug 2016 central Florida to lower Bay of Fundy (COMBINED) 0 -
Minimum Population Estimate The minimum population estimate is the lower limit of the two-tailed 60% confidence interval of the log- normally distributed best abundance estimate. This is equivalent to the 20th percentile of the log-normal distribution as specified by Wade and Angliss (1997). The best abundance estimate is 136 (CV=1.00). The minimum population estimate is 67.
Current Population Trend A trend analysis cannot be conducted for this stock due to the small number of sightings in any single year.
CURRENT AND MAXIMUM NET PRODUCTIVITY RATES Current and maximum net productivity rates are unknown for this stock. For purposes of this assessment, the maximum net productivity rate was assumed to be 0.04. This value is based on theoretical modeling showing that cetacean populations may not grow at rates much greater than 4% given the constraints of their reproductive life history (Barlow et al. 1995).
POTENTIAL BIOLOGICAL REMOVAL Potential Biological Removal (PBR) is the product of minimum population size, one-half the maximum productivity rate, and a “recovery” factor (MMPA Sec. 3. 16 U.S.C. 1362; Wade and Angliss 1997). The minimum
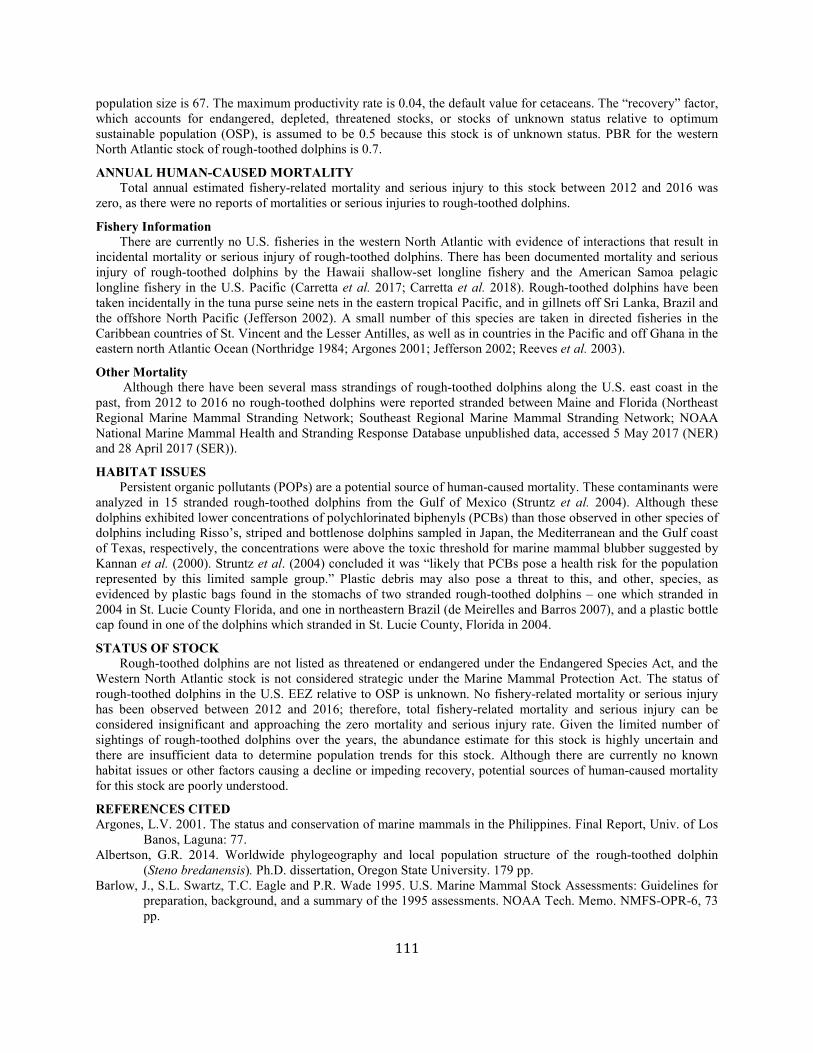
111
population size is 67. The maximum productivity rate is 0.04, the default value for cetaceans. The “recovery” factor, which accounts for endangered, depleted, threatened stocks, or stocks of unknown status relative to optimum sustainable population (OSP), is assumed to be 0.5 because this stock is of unknown status. PBR for the western North Atlantic stock of rough-toothed dolphins is 0.7.
ANNUAL HUMAN-CAUSED MORTALITY Total annual estimated fishery-related mortality and serious injury to this stock between 2012 and 2016 was zero, as there were no reports of mortalities or serious injuries to rough-toothed dolphins.
Fishery Information There are currently no U.S. fisheries in the western North Atlantic with evidence of interactions that result in incidental mortality or serious injury of rough-toothed dolphins. There has been documented mortality and serious injury of rough-toothed dolphins by the Hawaii shallow-set longline fishery and the American Samoa pelagic longline fishery in the U.S. Pacific (Carretta et al. 2017; Carretta et al. 2018). Rough-toothed dolphins have been taken incidentally in the tuna purse seine nets in the eastern tropical Pacific, and in gillnets off Sri Lanka, Brazil and the offshore North Pacific (Jefferson 2002). A small number of this species are taken in directed fisheries in the Caribbean countries of St. Vincent and the Lesser Antilles, as well as in countries in the Pacific and off Ghana in the eastern north Atlantic Ocean (Northridge 1984; Argones 2001; Jefferson 2002; Reeves et al. 2003).
Other Mortality Although there have been several mass strandings of rough-toothed dolphins along the U.S. east coast in the past, from 2012 to 2016 no rough-toothed dolphins were reported stranded between Maine and Florida (Northeast Regional Marine Mammal Stranding Network; Southeast Regional Marine Mammal Stranding Network; NOAA National Marine Mammal Health and Stranding Response Database unpublished data, accessed 5 May 2017 (NER) and 28 April 2017 (SER)).
HABITAT ISSUES Persistent organic pollutants (POPs) are a potential source of human-caused mortality. These contaminants were analyzed in 15 stranded rough-toothed dolphins from the Gulf of Mexico (Struntz et al. 2004). Although these dolphins exhibited lower concentrations of polychlorinated biphenyls (PCBs) than those observed in other species of dolphins including Risso’s, striped and bottlenose dolphins sampled in Japan, the Mediterranean and the Gulf coast of Texas, respectively, the concentrations were above the toxic threshold for marine mammal blubber suggested by Kannan et al. (2000). Struntz et al. (2004) concluded it was “likely that PCBs pose a health risk for the population represented by this limited sample group.” Plastic debris may also pose a threat to this, and other, species, as evidenced by plastic bags found in the stomachs of two stranded rough-toothed dolphins – one which stranded in 2004 in St. Lucie County Florida, and one in northeastern Brazil (de Meirelles and Barros 2007), and a plastic bottle cap found in one of the dolphins which stranded in St. Lucie County, Florida in 2004.
STATUS OF STOCK Rough-toothed dolphins are not listed as threatened or endangered under the Endangered Species Act, and the Western North Atlantic stock is not considered strategic under the Marine Mammal Protection Act. The status of rough-toothed dolphins in the U.S. EEZ relative to OSP is unknown. No fishery-related mortality or serious injury has been observed between 2012 and 2016; therefore, total fishery-related mortality and serious injury can be considered insignificant and approaching the zero mortality and serious injury rate. Given the limited number of sightings of rough-toothed dolphins over the years, the abundance estimate for this stock is highly uncertain and there are insufficient data to determine population trends for this stock. Although there are currently no known habitat issues or other factors causing a decline or impeding recovery, potential sources of human-caused mortality for this stock are poorly understood.
REFERENCES CITED Argones, L.V. 2001. The status and conservation of marine mammals in the Philippines. Final Report, Univ. of Los
Banos, Laguna: 77. Albertson, G.R. 2014. Worldwide phylogeography and local population structure of the rough-toothed dolphin
(Steno bredanensis). Ph.D. dissertation, Oregon State University. 179 pp. Barlow, J., S.L. Swartz, T.C. Eagle and P.R. Wade 1995. U.S. Marine Mammal Stock Assessments: Guidelines for
preparation, background, and a summary of the 1995 assessments. NOAA Tech. Memo. NMFS-OPR-6, 73 pp.
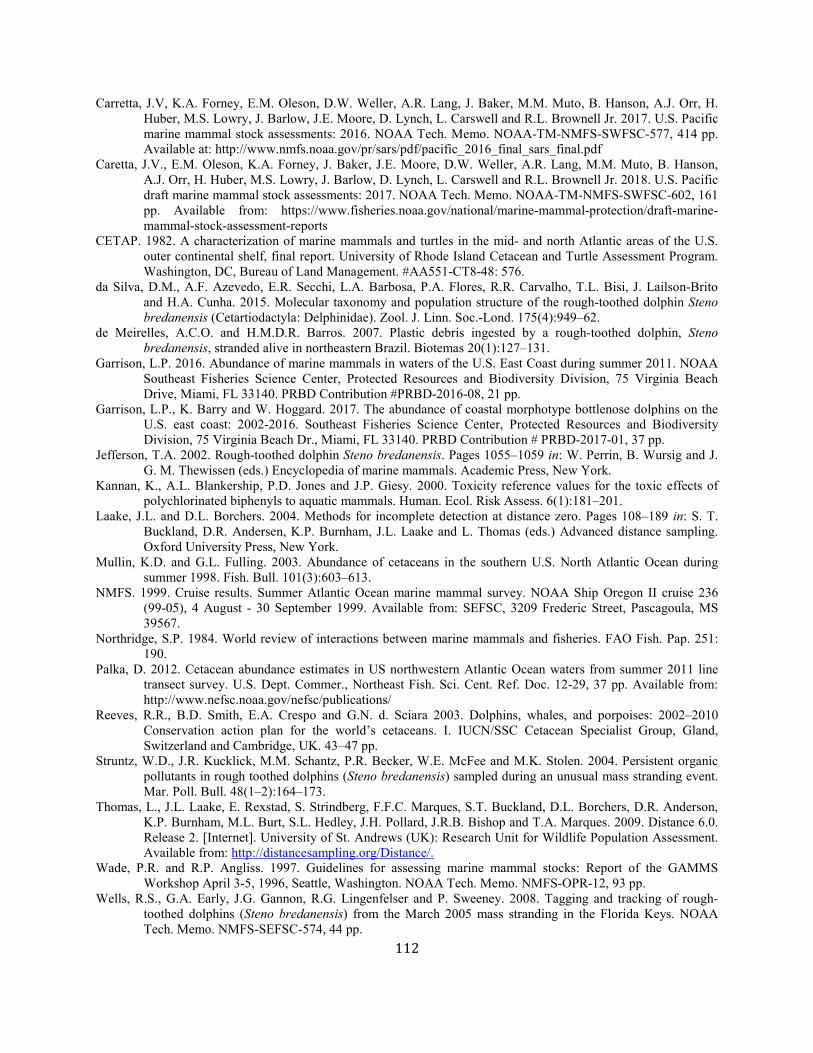
112
Carretta, J.V, K.A. Forney, E.M. Oleson, D.W. Weller, A.R. Lang, J. Baker, M.M. Muto, B. Hanson, A.J. Orr, H. Huber, M.S. Lowry, J. Barlow, J.E. Moore, D. Lynch, L. Carswell and R.L. Brownell Jr. 2017. U.S. Pacific marine mammal stock assessments: 2016. NOAA Tech. Memo. NOAA-TM-NMFS-SWFSC-577, 414 pp. Available at: http://www.nmfs.noaa.gov/pr/sars/pdf/pacific_2016_final_sars_final.pdf
Caretta, J.V., E.M. Oleson, K.A. Forney, J. Baker, J.E. Moore, D.W. Weller, A.R. Lang, M.M. Muto, B. Hanson, A.J. Orr, H. Huber, M.S. Lowry, J. Barlow, D. Lynch, L. Carswell and R.L. Brownell Jr. 2018. U.S. Pacific draft marine mammal stock assessments: 2017. NOAA Tech. Memo. NOAA-TM-NMFS-SWFSC-602, 161 pp. Available from: https://www.fisheries.noaa.gov/national/marine-mammal-protection/draft-marine-mammal-stock-assessment-reports
CETAP. 1982. A characterization of marine mammals and turtles in the mid- and north Atlantic areas of the U.S. outer continental shelf, final report. University of Rhode Island Cetacean and Turtle Assessment Program. Washington, DC, Bureau of Land Management. #AA551-CT8-48: 576.
da Silva, D.M., A.F. Azevedo, E.R. Secchi, L.A. Barbosa, P.A. Flores, R.R. Carvalho, T.L. Bisi, J. Lailson-Brito and H.A. Cunha. 2015. Molecular taxonomy and population structure of the rough-toothed dolphin Steno bredanensis (Cetartiodactyla: Delphinidae). Zool. J. Linn. Soc.-Lond. 175(4):949–62.
de Meirelles, A.C.O. and H.M.D.R. Barros. 2007. Plastic debris ingested by a rough-toothed dolphin, Steno bredanensis, stranded alive in northeastern Brazil. Biotemas 20(1):127–131.
Garrison, L.P. 2016. Abundance of marine mammals in waters of the U.S. East Coast during summer 2011. NOAA Southeast Fisheries Science Center, Protected Resources and Biodiversity Division, 75 Virginia Beach Drive, Miami, FL 33140. PRBD Contribution #PRBD-2016-08, 21 pp.
Garrison, L.P., K. Barry and W. Hoggard. 2017. The abundance of coastal morphotype bottlenose dolphins on the U.S. east coast: 2002-2016. Southeast Fisheries Science Center, Protected Resources and Biodiversity Division, 75 Virginia Beach Dr., Miami, FL 33140. PRBD Contribution # PRBD-2017-01, 37 pp.
Jefferson, T.A. 2002. Rough-toothed dolphin Steno bredanensis. Pages 1055–1059 in: W. Perrin, B. Wursig and J. G. M. Thewissen (eds.) Encyclopedia of marine mammals. Academic Press, New York.
Kannan, K., A.L. Blankership, P.D. Jones and J.P. Giesy. 2000. Toxicity reference values for the toxic effects of polychlorinated biphenyls to aquatic mammals. Human. Ecol. Risk Assess. 6(1):181–201.
Laake, J.L. and D.L. Borchers. 2004. Methods for incomplete detection at distance zero. Pages 108–189 in: S. T. Buckland, D.R. Andersen, K.P. Burnham, J.L. Laake and L. Thomas (eds.) Advanced distance sampling. Oxford University Press, New York.
Mullin, K.D. and G.L. Fulling. 2003. Abundance of cetaceans in the southern U.S. North Atlantic Ocean during summer 1998. Fish. Bull. 101(3):603–613.
NMFS. 1999. Cruise results. Summer Atlantic Ocean marine mammal survey. NOAA Ship Oregon II cruise 236 (99-05), 4 August - 30 September 1999. Available from: SEFSC, 3209 Frederic Street, Pascagoula, MS 39567.
Northridge, S.P. 1984. World review of interactions between marine mammals and fisheries. FAO Fish. Pap. 251: 190.
Palka, D. 2012. Cetacean abundance estimates in US northwestern Atlantic Ocean waters from summer 2011 line transect survey. U.S. Dept. Commer., Northeast Fish. Sci. Cent. Ref. Doc. 12-29, 37 pp. Available from: http://www.nefsc.noaa.gov/nefsc/publications/
Reeves, R.R., B.D. Smith, E.A. Crespo and G.N. d. Sciara 2003. Dolphins, whales, and porpoises: 2002–2010 Conservation action plan for the world’s cetaceans. I. IUCN/SSC Cetacean Specialist Group, Gland, Switzerland and Cambridge, UK. 43–47 pp.
Struntz, W.D., J.R. Kucklick, M.M. Schantz, P.R. Becker, W.E. McFee and M.K. Stolen. 2004. Persistent organic pollutants in rough toothed dolphins (Steno bredanensis) sampled during an unusual mass stranding event. Mar. Poll. Bull. 48(1–2):164–173.
Thomas, L., J.L. Laake, E. Rexstad, S. Strindberg, F.F.C. Marques, S.T. Buckland, D.L. Borchers, D.R. Anderson, K.P. Burnham, M.L. Burt, S.L. Hedley, J.H. Pollard, J.R.B. Bishop and T.A. Marques. 2009. Distance 6.0. Release 2. [Internet]. University of St. Andrews (UK): Research Unit for Wildlife Population Assessment. Available from: http://distancesampling.org/Distance/.
Wade, P.R. and R.P. Angliss. 1997. Guidelines for assessing marine mammal stocks: Report of the GAMMS Workshop April 3-5, 1996, Seattle, Washington. NOAA Tech. Memo. NMFS-OPR-12, 93 pp.
Wells, R.S., G.A. Early, J.G. Gannon, R.G. Lingenfelser and P. Sweeney. 2008. Tagging and tracking of rough-toothed dolphins (Steno bredanensis) from the March 2005 mass stranding in the Florida Keys. NOAA Tech. Memo. NMFS-SEFSC-574, 44 pp.

113
West, K.L., J.G. Mead and W. White. 2011. Steno bredanensis (Cetacea: Delphinidae). Mammalian Species 43(886):177–189.
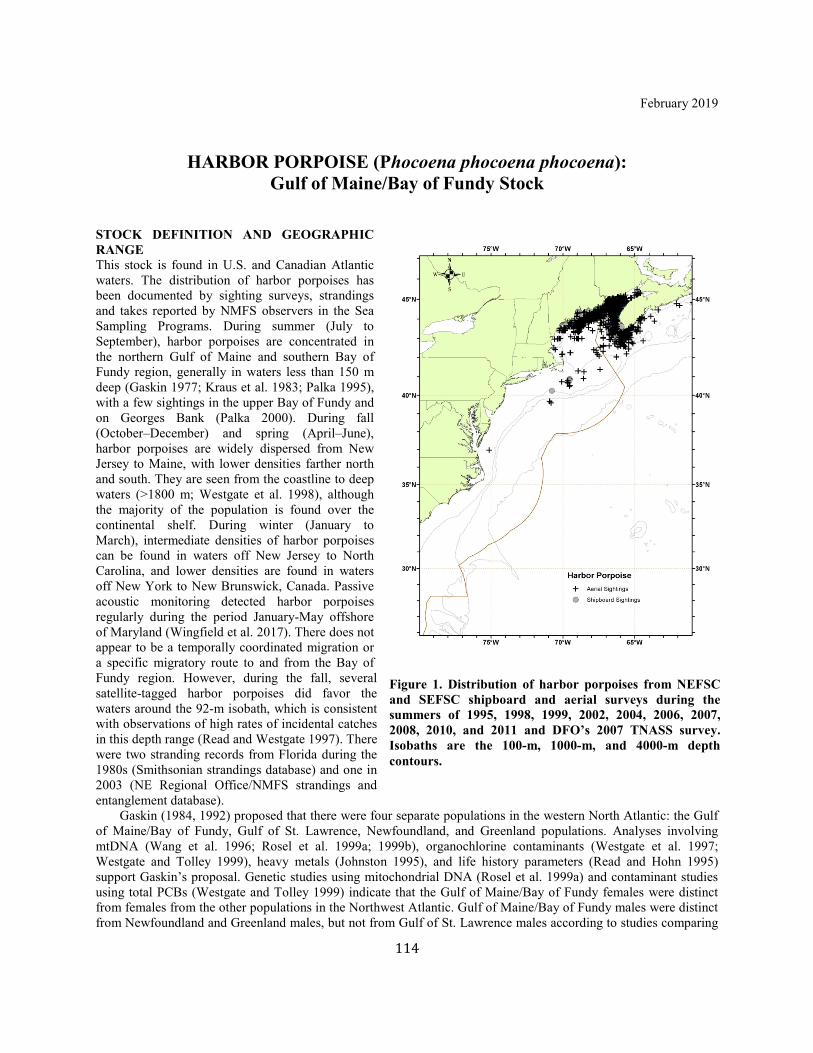
114
February 2019
HARBOR PORPOISE (Phocoena phocoena phocoena): Gulf of Maine/Bay of Fundy Stock
STOCK DEFINITION AND GEOGRAPHIC RANGE This stock is found in U.S. and Canadian Atlantic waters. The distribution of harbor porpoises has been documented by sighting surveys, strandings and takes reported by NMFS observers in the Sea Sampling Programs. During summer (July to September), harbor porpoises are concentrated in the northern Gulf of Maine and southern Bay of Fundy region, generally in waters less than 150 m deep (Gaskin 1977; Kraus et al. 1983; Palka 1995), with a few sightings in the upper Bay of Fundy and on Georges Bank (Palka 2000). During fall (October–December) and spring (April–June), harbor porpoises are widely dispersed from New Jersey to Maine, with lower densities farther north and south. They are seen from the coastline to deep waters (>1800 m; Westgate et al. 1998), although the majority of the population is found over the continental shelf. During winter (January to March), intermediate densities of harbor porpoises can be found in waters off New Jersey to North Carolina, and lower densities are found in waters off New York to New Brunswick, Canada. Passive acoustic monitoring detected harbor porpoises regularly during the period January-May offshore of Maryland (Wingfield et al. 2017). There does not appear to be a temporally coordinated migration or a specific migratory route to and from the Bay of Fundy region. However, during the fall, several satellite-tagged harbor porpoises did favor the waters around the 92-m isobath, which is consistent with observations of high rates of incidental catches in this depth range (Read and Westgate 1997). There were two stranding records from Florida during the 1980s (Smithsonian strandings database) and one in 2003 (NE Regional Office/NMFS strandings and entanglement database). Gaskin (1984, 1992) proposed that there were four separate populations in the western North Atlantic: the Gulf of Maine/Bay of Fundy, Gulf of St. Lawrence, Newfoundland, and Greenland populations. Analyses involving mtDNA (Wang et al. 1996; Rosel et al. 1999a; 1999b), organochlorine contaminants (Westgate et al. 1997; Westgate and Tolley 1999), heavy metals (Johnston 1995), and life history parameters (Read and Hohn 1995) support Gaskin’s proposal. Genetic studies using mitochondrial DNA (Rosel et al. 1999a) and contaminant studies using total PCBs (Westgate and Tolley 1999) indicate that the Gulf of Maine/Bay of Fundy females were distinct from females from the other populations in the Northwest Atlantic. Gulf of Maine/Bay of Fundy males were distinct from Newfoundland and Greenland males, but not from Gulf of St. Lawrence males according to studies comparing
Figure 1. Distribution of harbor porpoises from NEFSC and SEFSC shipboard and aerial surveys during the summers of 1995, 1998, 1999, 2002, 2004, 2006, 2007, 2008, 2010, and 2011 and DFO’s 2007 TNASS survey. Isobaths are the 100-m, 1000-m, and 4000-m depth contours.
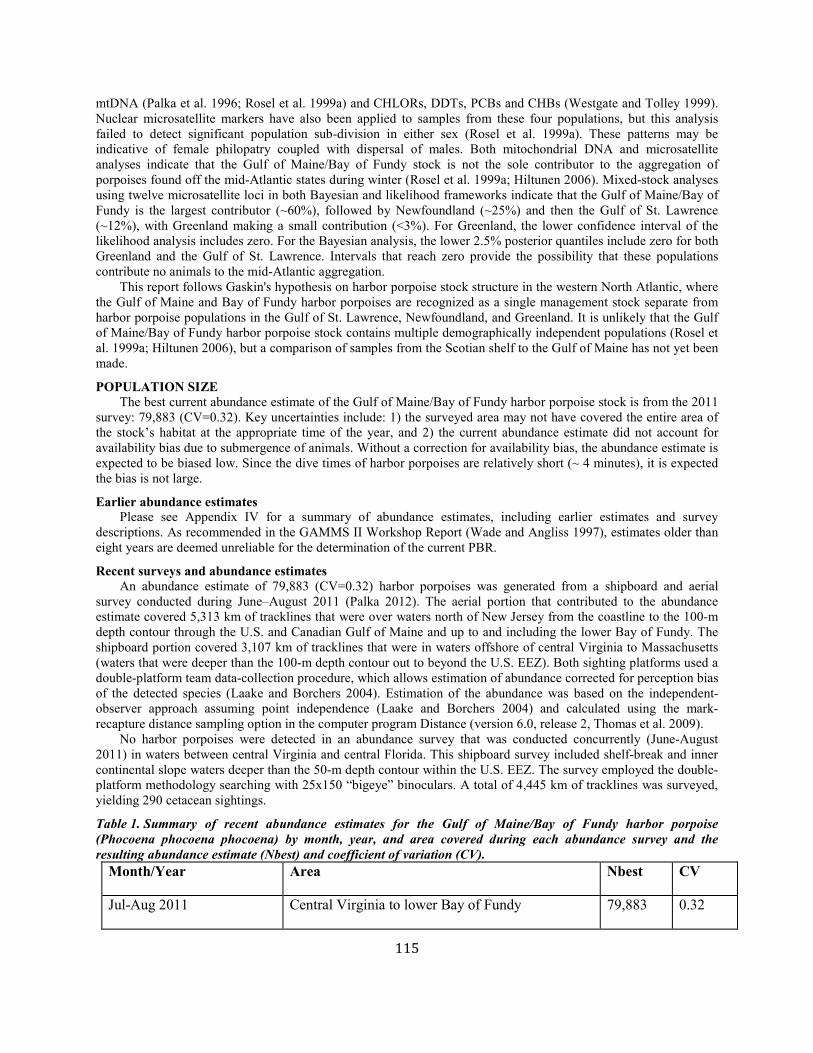
115
mtDNA (Palka et al. 1996; Rosel et al. 1999a) and CHLORs, DDTs, PCBs and CHBs (Westgate and Tolley 1999). Nuclear microsatellite markers have also been applied to samples from these four populations, but this analysis failed to detect significant population sub-division in either sex (Rosel et al. 1999a). These patterns may be indicative of female philopatry coupled with dispersal of males. Both mitochondrial DNA and microsatellite analyses indicate that the Gulf of Maine/Bay of Fundy stock is not the sole contributor to the aggregation of porpoises found off the mid-Atlantic states during winter (Rosel et al. 1999a; Hiltunen 2006). Mixed-stock analyses using twelve microsatellite loci in both Bayesian and likelihood frameworks indicate that the Gulf of Maine/Bay of Fundy is the largest contributor (~60%), followed by Newfoundland (~25%) and then the Gulf of St. Lawrence (~12%), with Greenland making a small contribution (<3%). For Greenland, the lower confidence interval of the likelihood analysis includes zero. For the Bayesian analysis, the lower 2.5% posterior quantiles include zero for both Greenland and the Gulf of St. Lawrence. Intervals that reach zero provide the possibility that these populations contribute no animals to the mid-Atlantic aggregation. This report follows Gaskin's hypothesis on harbor porpoise stock structure in the western North Atlantic, where the Gulf of Maine and Bay of Fundy harbor porpoises are recognized as a single management stock separate from harbor porpoise populations in the Gulf of St. Lawrence, Newfoundland, and Greenland. It is unlikely that the Gulf of Maine/Bay of Fundy harbor porpoise stock contains multiple demographically independent populations (Rosel et al. 1999a; Hiltunen 2006), but a comparison of samples from the Scotian shelf to the Gulf of Maine has not yet been made.
POPULATION SIZE The best current abundance estimate of the Gulf of Maine/Bay of Fundy harbor porpoise stock is from the 2011 survey: 79,883 (CV=0.32). Key uncertainties include: 1) the surveyed area may not have covered the entire area of the stock’s habitat at the appropriate time of the year, and 2) the current abundance estimate did not account for availability bias due to submergence of animals. Without a correction for availability bias, the abundance estimate is expected to be biased low. Since the dive times of harbor porpoises are relatively short (~ 4 minutes), it is expected the bias is not large.
Earlier abundance estimates Please see Appendix IV for a summary of abundance estimates, including earlier estimates and survey descriptions. As recommended in the GAMMS II Workshop Report (Wade and Angliss 1997), estimates older than eight years are deemed unreliable for the determination of the current PBR.
Recent surveys and abundance estimates An abundance estimate of 79,883 (CV=0.32) harbor porpoises was generated from a shipboard and aerial survey conducted during June–August 2011 (Palka 2012). The aerial portion that contributed to the abundance estimate covered 5,313 km of tracklines that were over waters north of New Jersey from the coastline to the 100-m depth contour through the U.S. and Canadian Gulf of Maine and up to and including the lower Bay of Fundy. The shipboard portion covered 3,107 km of tracklines that were in waters offshore of central Virginia to Massachusetts (waters that were deeper than the 100-m depth contour out to beyond the U.S. EEZ). Both sighting platforms used a double-platform team data-collection procedure, which allows estimation of abundance corrected for perception bias of the detected species (Laake and Borchers 2004). Estimation of the abundance was based on the independent-observer approach assuming point independence (Laake and Borchers 2004) and calculated using the mark-recapture distance sampling option in the computer program Distance (version 6.0, release 2, Thomas et al. 2009). No harbor porpoises were detected in an abundance survey that was conducted concurrently (June-August 2011) in waters between central Virginia and central Florida. This shipboard survey included shelf-break and inner continental slope waters deeper than the 50-m depth contour within the U.S. EEZ. The survey employed the double-platform methodology searching with 25x150 “bigeye” binoculars. A total of 4,445 km of tracklines was surveyed, yielding 290 cetacean sightings.
Table 1. Summary of recent abundance estimates for the Gulf of Maine/Bay of Fundy harbor porpoise (Phocoena phocoena phocoena) by month, year, and area covered during each abundance survey and the resulting abundance estimate (Nbest) and coefficient of variation (CV).
Month/Year Area Nbest CV
Jul-Aug 2011 Central Virginia to lower Bay of Fundy 79,883 0.32
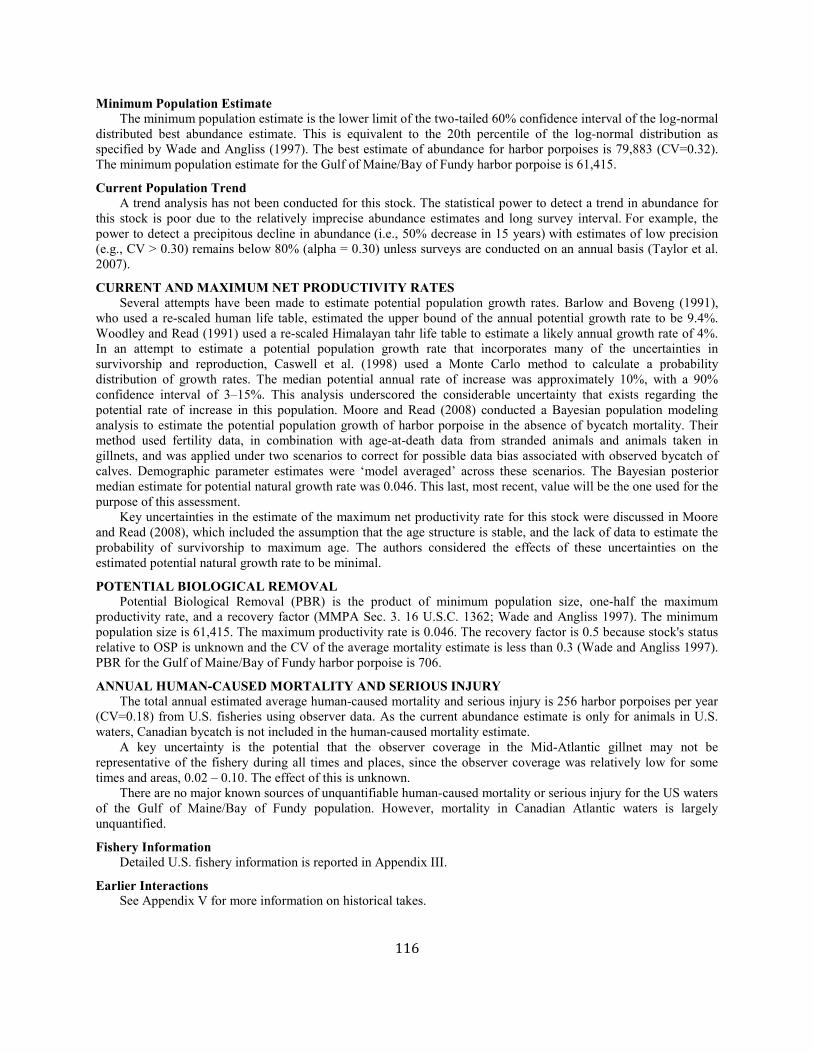
116
Minimum Population Estimate The minimum population estimate is the lower limit of the two-tailed 60% confidence interval of the log-normal distributed best abundance estimate. This is equivalent to the 20th percentile of the log-normal distribution as specified by Wade and Angliss (1997). The best estimate of abundance for harbor porpoises is 79,883 (CV=0.32). The minimum population estimate for the Gulf of Maine/Bay of Fundy harbor porpoise is 61,415.
Current Population Trend A trend analysis has not been conducted for this stock. The statistical power to detect a trend in abundance for this stock is poor due to the relatively imprecise abundance estimates and long survey interval. For example, the power to detect a precipitous decline in abundance (i.e., 50% decrease in 15 years) with estimates of low precision (e.g., CV > 0.30) remains below 80% (alpha = 0.30) unless surveys are conducted on an annual basis (Taylor et al. 2007).
CURRENT AND MAXIMUM NET PRODUCTIVITY RATES Several attempts have been made to estimate potential population growth rates. Barlow and Boveng (1991), who used a re-scaled human life table, estimated the upper bound of the annual potential growth rate to be 9.4%. Woodley and Read (1991) used a re-scaled Himalayan tahr life table to estimate a likely annual growth rate of 4%. In an attempt to estimate a potential population growth rate that incorporates many of the uncertainties in survivorship and reproduction, Caswell et al. (1998) used a Monte Carlo method to calculate a probability distribution of growth rates. The median potential annual rate of increase was approximately 10%, with a 90% confidence interval of 3–15%. This analysis underscored the considerable uncertainty that exists regarding the potential rate of increase in this population. Moore and Read (2008) conducted a Bayesian population modeling analysis to estimate the potential population growth of harbor porpoise in the absence of bycatch mortality. Their method used fertility data, in combination with age-at-death data from stranded animals and animals taken in gillnets, and was applied under two scenarios to correct for possible data bias associated with observed bycatch of calves. Demographic parameter estimates were ‘model averaged’ across these scenarios. The Bayesian posterior median estimate for potential natural growth rate was 0.046. This last, most recent, value will be the one used for the purpose of this assessment. Key uncertainties in the estimate of the maximum net productivity rate for this stock were discussed in Moore and Read (2008), which included the assumption that the age structure is stable, and the lack of data to estimate the probability of survivorship to maximum age. The authors considered the effects of these uncertainties on the estimated potential natural growth rate to be minimal.
POTENTIAL BIOLOGICAL REMOVAL Potential Biological Removal (PBR) is the product of minimum population size, one-half the maximum productivity rate, and a recovery factor (MMPA Sec. 3. 16 U.S.C. 1362; Wade and Angliss 1997). The minimum population size is 61,415. The maximum productivity rate is 0.046. The recovery factor is 0.5 because stock's status relative to OSP is unknown and the CV of the average mortality estimate is less than 0.3 (Wade and Angliss 1997). PBR for the Gulf of Maine/Bay of Fundy harbor porpoise is 706.
ANNUAL HUMAN-CAUSED MORTALITY AND SERIOUS INJURY The total annual estimated average human-caused mortality and serious injury is 256 harbor porpoises per year (CV=0.18) from U.S. fisheries using observer data. As the current abundance estimate is only for animals in U.S. waters, Canadian bycatch is not included in the human-caused mortality estimate. A key uncertainty is the potential that the observer coverage in the Mid-Atlantic gillnet may not be representative of the fishery during all times and places, since the observer coverage was relatively low for some times and areas, 0.02 – 0.10. The effect of this is unknown. There are no major known sources of unquantifiable human-caused mortality or serious injury for the US waters of the Gulf of Maine/Bay of Fundy population. However, mortality in Canadian Atlantic waters is largely unquantified.
Fishery Information Detailed U.S. fishery information is reported in Appendix III.
Earlier Interactions See Appendix V for more information on historical takes.

117
U.S.
Northeast Sink Gillnet Harbor porpoise bycatch in the northern Gulf of Maine occurs primarily from June to September, while in the southern Gulf of Maine and south of New England, bycatch occurs from January to May and September to December. Annual bycatch is estimated using ratio estimator techniques that account for the use of pingers (Hatch and Orphanides 2014, 2015, 2016, Orphanides and Hatch 2017, Orphanides 2019). See Table 2 for bycatch estimates and observed mortality and serious injury for the current 5-year period, and Appendix V for historical bycatch information.
Mid-Atlantic Gillnet Harbor porpoise bycatch in Mid-Atlantic waters occurs primarily from December to May in waters off New Jersey and less frequently in other waters ranging farther south, from New Jersey to North Carolina. Annual bycatch is estimated using ratio estimator techniques (Hatch and Orphanides 2014, 2015, 2016; Orphanides and Hatch 2017, Orphanides 2019). See Table 2 for bycatch estimates and observed mortality and serious injury for the current 5-year period, and Appendix V for historical bycatch information.
Northeast Bottom Trawl Since 1989, harbor porpoise mortalities have been observed in the northeast bottom trawl fishery, but many of these were not attributable to this fishery because decomposed animals are presumed to have been dead prior to being taken by the trawl. Those infrequently caught freshly dead harbor porpoises have been caught during January to April on Georges Bank or in the southern Gulf of Maine. Fishery-related bycatch rates were estimated using an annual stratified ratio-estimator (Chavez-Rosales 2018). See Table 2 for bycatch estimates and observed mortality and serious injury for the current 5-year period, and Appendix V for historical bycatch information. CANADA No current estimates exist, but harbor porpoise interactions have been documented in the Bay of Fundy sink gillnet fishery and in herring weirs between the years 1998-2001 in the lower Bay of Fundy demersal gillnet fishery (Trippel and Shepherd 2004). That fishery has declined since 2001 and it is assumed bycatch is very small, if any (H. Stone, Department of Fisheries and Oceans Canada, pers. comm.).
Table 2. From observer program data, summary of the incidental mortality of Gulf of Maine/Bay of Fundy harbor porpoise (Phocoena phocoena phocoena) by commercial fishery including the years sampled, the type of data used, the annual observer coverage, the mortalities and serious injuries recorded by on-board observers, the estimated annual serious injury and mortality, the estimated CV of the annual mortality, and the mean annual combined mortality (CV in parentheses).
Fishery Yrs Data Type a
Obs. Cov.b
Observed Serious Injuryc
Observed Mortality
Estimated Serious Injurye
EstimatedMortality
Estimated Combined Mortality
Est. CVs
Mean Combined Annual Mortality
Northeast Sink Gillnet
2012 2013 2014 2015 2016
Obs. Data, Trip Logbook, Allocated Dealer Data
0.15 0.11 0.18 0.14 0.10
0 0 0 0 0
34 20 28 23 11
0 0 0 0 0
277 399 128 177 125
277 399 128 177 125
0.59 0.33 0.27 0.28 0.34
221 (.020)
Mid-Atlantic Gillnet
2012 2013 2014 2015 2016
Obs. Data, Weighout
0.02 0.03 0.05 0.06 0.08
0 0 0 0 0
2 1 1 2 2
0 0 0 0 0
63 19 22 33 23
63 19 22 33 23
0.83 1.06 1.03 1.16 0.64
32 (.46)
Northeast Bottom Trawl
2012 2013 2014 2015
Obs. Data, Weighout
0.17 0.15 0.17 0.19 0.12
0 0 0 0 0
0 1 1 4 0
0 0 0 0 0
0 7
5.5 3.71
0
0 7
5.5 3.71
0
0 0.98 0.86 0.49
0
3.2 (0.53)

118
Fishery Yrs Data Type a
Obs. Cov.b
Observed Serious Injuryc
Observed Mortality
Estimated Serious Injurye
EstimatedMortality
Estimated Combined Mortality
Est. CVs
Mean Combined Annual Mortality
2016
TOTAL - - - - - - - - - 256 (0.18)
a Observer data (Obs. Data) are used to measure bycatch rates and the data are collected within the Northeast Fisheries Observer Program. NEFSC collects Weighout (Weighout) landings data that are used as a measure of total effort for the U.S. gillnet fisheries. Mandatory vessel trip report (VTR) (Trip Logbook) data are used to determine the spatial distribution of fishing effort in the northeast sink gillnet fishery. b Observer coverage for the U.S. Northeast and mid-Atlantic coastal gillnet fisheries is based on tons of fish landed. Northeast bottom trawl fishery coverages are ratios based on trips. c Serious injuries were evaluated for the 2012–2016 period and include both at-sea monitor and traditional observer data (Josephson et al. 2019).
Other Mortality U.S. There is evidence that harbor porpoises were harvested by natives in Maine and Canada before the 1960s, and the meat was used for human consumption, oil, and fish bait (NMFS 1992). The extent of these past harvests is unknown, though it is believed to have been small. Up until the early 1980s, small kills by native hunters (Passamaquoddy Indians) were reported. It was believed to have nearly stopped (Polacheck 1989) until media reports in September 1997 depicted a Passamaquoddy tribe member dressing out a harbor porpoise. Further articles describing use of porpoise products for food and other purposes were timed to coincide with ongoing legal action in state court. Recent harbor porpoise strandings on the U.S. Atlantic coast are documented in Table 3 (NOAA National Marine Mammal Health and Stranding Response Database unpublished data, accessed 03 November 2017). During 2012, 45 harbor porpoises were reported stranded on Atlantic U.S. beaches. Of these, 4 stranding mortalities were reported as having signs of human interaction, one of which was reported to be a fishery interaction. During 2013, 102 harbor porpoises were reported stranded on Atlantic U.S. beaches. Of these, 9 stranding mortalities were reported as having signs of human interaction, three of which were reported to be fishery interactions. During 2014, 39 harbor porpoises were reported stranded on Atlantic U.S. beaches. Of these, 5 stranding mortalities were reported as having signs of human interactions, one of which was reported to have been a fishery interaction. During 2015, 44 harbor porpoises were reported stranded on Atlantic U.S. beaches. Of these, 2 stranding mortalities were reported as having signs of human interactions, neither of which were fishery interactions. During 2016, 25 harbor porpoises were reported stranded on Atlantic U.S. beaches. Of these, 2 stranding mortalities were reported as having signs of human interactions, one of which was reported to have been a fishery interaction. Stranding data probably underestimate the extent of fishery-related mortality and serious injury because all of the marine mammals that die or are seriously injured may not wash ashore, nor will all of those that do wash ashore necessarily show signs of entanglement or other fishery-interaction. Finally, the level of technical expertise among stranding network personnel varies widely as does the ability to recognize signs of fishery interaction.
Table 3. Harbor porpoise (Phocoena phocoena phocoena) reported strandings along the U.S. and Canadian Atlantic coast, 2012-2016. Area 2012 2013 2014 2015 2016 Total
Mainea, d, e 7 7 5 2 5 26
New Hampshire 3 1 1 0 1 6
Massachusettsa, c, d, e 25 40 22 18 8 113
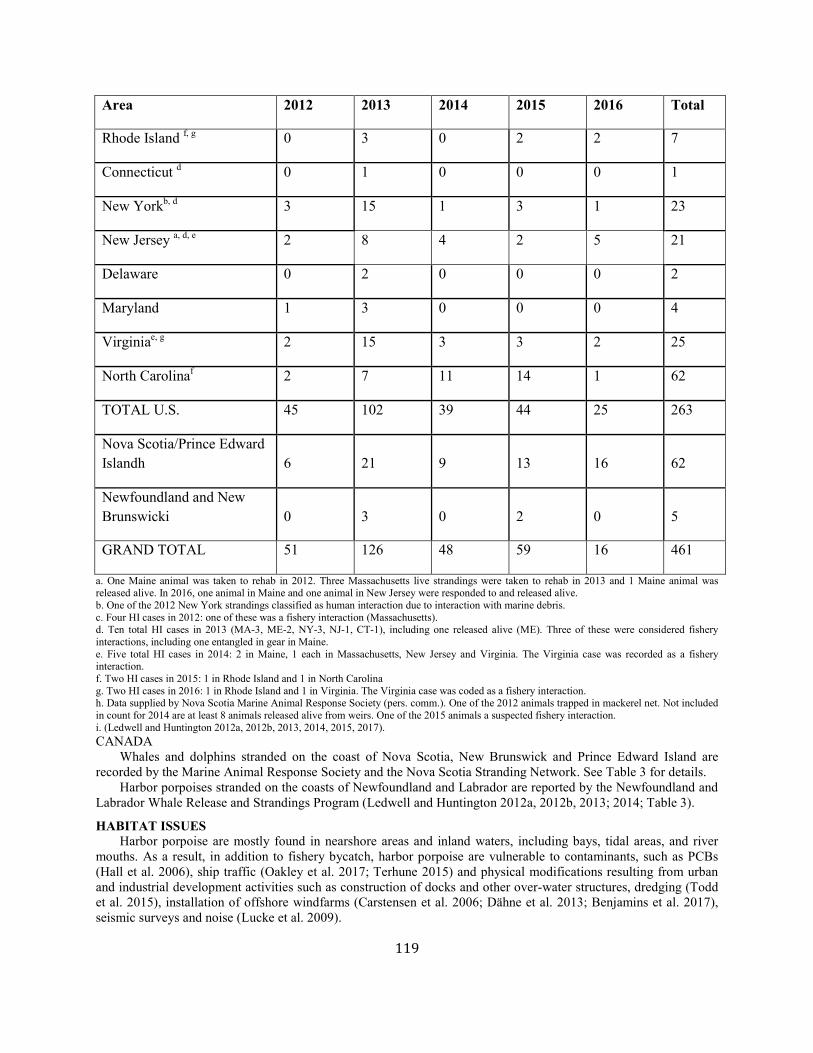
119
Area 2012 2013 2014 2015 2016 Total
Rhode Island f, g 0 3 0 2 2 7
Connecticut d 0 1 0 0 0 1
New Yorkb, d 3 15 1 3 1 23
New Jersey a, d, e 2 8 4 2 5 21
Delaware 0 2 0 0 0 2
Maryland 1 3 0 0 0 4
Virginiae, g 2 15 3 3 2 25
North Carolinaf 2 7 11 14 1 62
TOTAL U.S. 45 102 39 44 25 263
Nova Scotia/Prince Edward Islandh 6 21 9 13 16 62
Newfoundland and New Brunswicki 0 3 0 2 0 5
GRAND TOTAL 51 126 48 59 16 461
a. One Maine animal was taken to rehab in 2012. Three Massachusetts live strandings were taken to rehab in 2013 and 1 Maine animal was released alive. In 2016, one animal in Maine and one animal in New Jersey were responded to and released alive. b. One of the 2012 New York strandings classified as human interaction due to interaction with marine debris. c. Four HI cases in 2012: one of these was a fishery interaction (Massachusetts). d. Ten total HI cases in 2013 (MA-3, ME-2, NY-3, NJ-1, CT-1), including one released alive (ME). Three of these were considered fishery interactions, including one entangled in gear in Maine. e. Five total HI cases in 2014: 2 in Maine, 1 each in Massachusetts, New Jersey and Virginia. The Virginia case was recorded as a fishery interaction. f. Two HI cases in 2015: 1 in Rhode Island and 1 in North Carolina g. Two HI cases in 2016: 1 in Rhode Island and 1 in Virginia. The Virginia case was coded as a fishery interaction. h. Data supplied by Nova Scotia Marine Animal Response Society (pers. comm.). One of the 2012 animals trapped in mackerel net. Not included in count for 2014 are at least 8 animals released alive from weirs. One of the 2015 animals a suspected fishery interaction. i. (Ledwell and Huntington 2012a, 2012b, 2013, 2014, 2015, 2017). CANADA Whales and dolphins stranded on the coast of Nova Scotia, New Brunswick and Prince Edward Island are recorded by the Marine Animal Response Society and the Nova Scotia Stranding Network. See Table 3 for details. Harbor porpoises stranded on the coasts of Newfoundland and Labrador are reported by the Newfoundland and Labrador Whale Release and Strandings Program (Ledwell and Huntington 2012a, 2012b, 2013; 2014; Table 3).
HABITAT ISSUES Harbor porpoise are mostly found in nearshore areas and inland waters, including bays, tidal areas, and river mouths. As a result, in addition to fishery bycatch, harbor porpoise are vulnerable to contaminants, such as PCBs (Hall et al. 2006), ship traffic (Oakley et al. 2017; Terhune 2015) and physical modifications resulting from urban and industrial development activities such as construction of docks and other over-water structures, dredging (Todd et al. 2015), installation of offshore windfarms (Carstensen et al. 2006; Dähne et al. 2013; Benjamins et al. 2017), seismic surveys and noise (Lucke et al. 2009).
120
STATUS OF STOCK Harbor porpoise in the Gulf of Maine/Bay of Fundy are not listed as threatened or endangered under the Endangered Species Act, and this stock is not considered strategic under the MMPA. The total U.S. fishery-related mortality and serious injury for this stock is not less than 10% of the calculated PBR and, therefore, cannot be considered to be insignificant and approaching zero mortality and serious injury rate. The status of harbor porpoises, relative to OSP, in the U.S. Atlantic EEZ is unknown. Population trends for this species have not been investigated. Based on the low levels of uncertainties described in the above sections, it expected these uncertainties will have little effect on the designation of the status of this stock.
REFERENCES CITED Barlow, J. and P. Boveng 1991. Modeling age-specific mortality for marine mammal populations. Mar. Mamm. Sci.
7: 50–65. Benjamins, S., N. van Geel, G. Hastie, J. Elliott and B. Wilson. 2017. Harbour porpoise distribution can vary at
small spatiotemporal scales in energetic habitats. Deep-Sea Res. II. http://dx.doi.org/10.1016/j.dsr2.2016.07.002i
Carstensen J, O.D. Henriksen and J. Teilmann. Impacts of offshore wind farm construction on harbour porpoises: acoustic monitoring of echolocation activity using porpoise detectors (T-PODs). Mar Ecol Prog Ser. 2006;321:295–308.Caswell, H., S. Brault, A.J. Read and T.D. Smith 1998. Harbor porpoise and fisheries: An uncertainty analysis of incidental mortality. Ecol. Appl. 8(4): 1226–1238.
Chavez-Rosales, S., M.C. Lyssikatos, and J. Hatch. 2018. Estimates of cetacean and pinniped bycatch in northeast and mid-Atlantic bottom trawl fisheries, 2012-2016. NOAA Tech. Memo NMFS-NE-250. 29pp.
Dähne, M. A. Gilles, K. Lucke, V. Peschko, S. Adler, K. Krugel, J. Sundermeyer and U. Siebert. 2013. Effects of pile-driving on harbour porpoises (Phocoena phocoena) at the first offshore wind farm in Germany. Environ. Res. Lett. 8: 1–15.
Gaskin, D.E. 1977. Harbour porpoise, Phocoena phocoena (L.), in the western approaches to the Bay of Fundy 1969-75. Rep. Int. Whal. Comm. 27: 487–492.
Gaskin, D.E. 1984. The harbor porpoise Phocoena phocoena (L.): Regional populations, status, and information on direct and indirect catches. Rep. Int. Whal. Comm. 34: 569–586.
Gaskin, D.E. 1992. The status of the harbour porpoise. Can. Field-Nat. 106: 36–54. Hall, A.J., K. Hugunin, R. Deaville, R.J. Law, C.R. Allchin and P.D. Jepson 2006. The risk of infection from
polychlorinates biphenyl exposure in the harbor porpoise (Phocoena phocoena): A case-control approach. Environmental Health Perpectives 114(5): 704–711.
Hatch, J.M. and C.D. Orphanides 2016. Estimates of cetacean and pinniped bycatch in the 2014 New England sink and mid-Atlantic gillnet fisheries. Northeast Fish Sci Cent Ref Doc 16-05. 22 pp.
Hatch, J.M. and C.D. Orphanides 2015. Estimates of cetacean and pinniped bycatch in the 2013 New England sink and mid-Atlantic gillnet fisheries. Northeast Fish Sci Cent Ref Doc. 15–15; 26 p. Available at http://www.nefsc.noaa.gov/publications/ doi:10.7289/V5HD7SNK.
Hatch, J.M. and C.D. Orphanides 2014. Estimates of cetacean and pinniped bycatch in the 2012 New England sink and mid-Atlantic gillnet fisheries. Northeast Fish Sci Cent Ref Doc. 14-02. 20 pp.
Hiltunen, K.H. 2006. Mixed-stock analysis of harbor porpoises (Phocoena phocoena) along the U.S. mid-Atlantic coast using microsatellite DNA markers. MS thesis. The College of Charleston, Charleston, SC. 92 pp.
Johnston, D.W. 1995. Spatial and temporal differences in heavy metal concentrations in the tissues of harbour porpoises (Phocoena phocoena L.) from the western North Atlantic. M.S. thesis. University of Guelph, Guelph, Ontario, Canada. 152 pp.
Josephson, E., F. Wenzel and M.C. Lyssikatos. 2019. Serious injury determinations for small cetaceans and pinnipeds caught in commercial fisheries off the northeast U.S. coast, 2012-2016. Northeast Fish. Sci. Cent. Ref. Doc. 19-05, 27pp.
Kraus, S.D., J.H. Prescott and G.S. Stone 1983. Harbor porpoise, Phocoena phocoena, in the U.S. coastal waters off the Gulf of Maine: a survey to determine seasonal distribution and abundance. NMFS. NA82FAC00027 22 pp.
Kraus, S.D., A.J. Read, A. Solow, K. Baldwin, T. Spradlin, E. Anderson and J. Williamson 1997. Acoustic alarms reduce porpoise mortality. Nature 388(6642): 525.
Laake, J.L., and D.L. Borchers 2004. Methods for incomplete detection at distance zero, In: Advanced distance sampling, edited by S. T. Buckland, D. R. Andersen, K. P. Burnham, J. L. Laake, and L. Thomas, pp. 108–189, Oxford University Press, New York.
121
Ledwell, W. and J. Huntington 2012a. Incidental entrapments of cetaceans and leatherback sea turtles in fishing gear reported during 2011-2012 and a summary of the Whale Release and Stranding Group activities. A preliminary report to Fisheries and Oceans Canada, St. John's, Newfoundland, Canada. 17 pp.
Ledwell, W. and J. Huntington 2012b. Incidental entrapments in fishing gear and stranding reported to and responded to by the Whale Release and Strandings Group in Newfoundland and Labrador and a summary of the Whale Release and Strandings program during 2012. Report to Fisheries and Oceans Canada, St. John's, Newfoundland, Canada. 18 pp.
Ledwell, W., J. Huntington and E. Sacrey 2013. Incidental entrapments in fishing gear and stranding reported to and responded to by the Whale Release and Strandings Group in Newfoundland and Labrador and a summary of the Whale Release and Strandings program during 2013. Report to the Department of Fisheries and Oceans Canada, St. John's, Newfoundland, Canada. 19 pp.
Ledwell, W. and J. Huntington 2014. Incidental entrapments and entanglements of cetaceans and leatherback sea turtles, strandings, ice entrapments reported to the Whale Release and Strandings Group in Newfoundland and Labrador and a summary of the Whale Release and Strandings program during 2014. Report to the Department of Fisheries and Oceans Canada, St. John's, Newfoundland, Canada. 23 pp.
Ledwell, W. and J. Huntington 2015. Incidental entrapments and entanglements of cetaceans and leatherback sea turtles, strandings, ice entrapments reported to the Whale Release and Strandings Group in Newfoundland and Labrador and a summary of the Whale Release and Strandings program during 2015. Report to the Department of Fisheries and Oceans Canada, St. John's, Newfoundland, Canada. 22 pp.
Ledwell, W. and J. Huntington 2017. Incidental entrapments and entanglements of cetaceans and leatherback sea turtles and strandings and harassments reported to the Whale Release and Strandings Group in Newfoundland and Labrador and a summary of the Whale Release and Strandings program during 2016. Report to the Department of Fisheries and Oceans Canada, St. John's, Newfoundland, Canada. 23 pp.
Lucke K., U. Siebert, P.A. Lepper and M-A. Blanchet. 2009. Temporary shift in masking hearing thresholds in a harbor porpoise (Phocoena phocoena) after exposure to seismic airgun stimuli. J. Acoust. Soc. Am. 125(6):4060–4070.
Lyssikatos, M. 2015. Estimates of cetacean and pinniped bycatch in Northeast and mid-Atlantic bottom trawl fisheries, 2008-2013. Northeast Fish Sci Cent Ref Doc. 15-19. 20 p. Available at http://www.nefsc.noaa.gov/publications/.
Moore, J.E. and A.J. Read 2008. A Bayesian uncertainty analysis of cetacean demography and bycatch mortality using age-at-death data. Ecol. Appl. 18(8): 1914–1931.
NMFS 1992. Harbor porpoise in Eastern North America: Status and research needs. Results of a scientific workshop held May 5-8, 1992 at NEFSC, Woods Hole, MA, USA. Northeast Fish. Sci. Cent. Ref. Doc., 92-06. National Marine Fisheries Service. 28 pp.
Oakley, J.A., A.T. Williams and T. Thomas. 2017. Reactions of harbor porpoise (Phocoena phocoena) to vessel traffic in the coastal waters of South West Wales, UK. Ocean & Coastal Management 138:158–169.
Orphanides, C.D. 2019. Estimates of cetacean and pinniped bycatch during 2016 in the New England and Mid-Atlantic Sink Gillnet fisheries. Northeast Fish Sci Cent Ref Doc. 19-04. 12 pp.
Orphanides, C.D. and Hatch, J. 2017. Estimates of cetacean and pinniped bycatch during 2015 in the New England and mid-Atlantic sink gillnet fisheries. Northeast Fish Sci Cent Ref Doc. 17-18. 21pp.
Orphanides, C.D. 2013. Estimates of cetacean and pinniped bycatch during 2010 and 2011 in the New England Sink Gillnet fishery, Mid-Atlantic Gillnet fishery, and two NMFS gillnet experiments. Northeast Fish Sci Cent Ref Doc. 13-13 38 pp. Available at: http://nefsc.noaa.gov/publications/crd/crd1313/.
Palka, D. 1995. Influences on spatial patterns of Gulf of Maine harbor porpoises. Pages 69–75 in: A. S. Blix, L. Walloe and O. Ulltang, (eds.) Whales, Seals, Fish and Man. Elsevier Science. Amsterdam.
Palka, D.L., A.J. Read, A.J. Westgate and D.W. Johnston 1996. Summary of current knowledge of harbour porpoises in US and Canadian Atlantic waters. Rep. Int. Whal. Comm. 46: 559–565.
Palka, D. 2000. Abundance of the Gulf of Maine/Bay of Fundy harbor porpoise based on shipboard and aerial surveys during 1999. Northeast Fish. Sci. Cent. Ref. Doc. 00-07. 29 pp. http://www.nefsc.noaa.gov/psb/pubs/palkalabref00-07.pdf
Palka, D.L. 2012. Cetacean abundance estimates in US northwestern Atlantic Ocean waters from summer 2011 line transect survey. Northeast Fish. Sci. Cent. Ref. Doc. 12-29. 37 pp.
http://www.nefsc.noaa.gov/nefsc/publications/crd/crd1229/ Polacheck, T. 1989. Harbor porpoises and the gillnet fishery. Oceanus 32(1): 63-70.

122
Read, A.J. and A.A. Hohn 1995. Life in the fast lane: the life history of harbour porpoises from the Gulf of Maine. Mar. Mamm. Sci. 11(4): 423–440.
Read, A.J. and A.J. Westgate 1997. Monitoring the movements of harbour porpoises (Phocoena phocoena) with satellite telemetry. Ma. Biol. 130: 315–22.
Rosel, P.E., S.C. France, J.Y. Wang and T.D. Kocher 1999a. Genetic structure of harbour porpoise Phocoena phocoena populations in the northwest Atlantic based on mitochondrial and nuclear markers. Mol. Ecol. 8: S41-S54.
Rosel, P.E., R. Tiedemann and M. Walton 1999b. Genetic evidence for limited trans-Atlantic movements of the harbor porpoise Phocoena phocoena. Mar. Biol. 133: 583–591.
Taylor, B.L., M. Martinez, T. Gerrodette, J. Barlow and Y.N. Hrovat. 2007. Lessons from monitoring trends in abundance in marine mammals. Mar. Mamm. Sci. 23(1): 157–175.
Terhune, J.M. 2015. Harbour porpoise presence near oil tankers. J. Canadian Ac. 43(3) 2pp. Thomas L., J.L. Laake, E. Rexstad, S. Strindberg, F.F.C. Marques, S.T. Buckland, D.L. Borchers, D.R. Anderson,
K.P. Burnham, M.L. Burt, S.L. Hedley, J.H. Pollard, J.R.B. Bishop and T.A. Marques. 2009. Distance 6.0. Release 2. [Internet]. University of St. Andrews (UK): Research Unit for Wildlife Population Assessment. Available from: http://distancesampling.org/Distance/
Todd, V.L.G., I.B. Todd, J.C. Gardiner, E.C.N. Morrin, N.A. MacPherson, N.A. DiMarzio and F. Thomsen. 2015. A review of impacts of marine dredging activities on marine mammals. ICES J. of Mar. Sci. 72(2): 328-340.
Trippel, E.A. and T.D. Shepherd 2004. By-catch of harbour porpoise (Phocoena phocoena) in the Lower Bay of Fundy gillnet fishery from 1998-2001. Department of Fisheries and Oceans. Ottawa, Ontario. DFO Research Document 2004/2521 iv + 33 pp. http://www.fmap.ca/ramweb/papers-total/Trippel_Shepherd_2004.pdf
Wade, P.R. and R.P. Angliss 1997. Guidelines for assessing marine mammal stocks: Report of the GAMMS Workshop April 3-5, 1996, Seattle, Washington. NOAA Tech. Memo. NMFS-OPR-12. 93 pp.
Wang, J.Y., D.E. Gaskin and B.N. White 1996. Mitochondrial DNA analysis of harbour porpoise, Phocoena phocoena, subpopulations in North American waters. Can. J. Fish. Aquat. Sci 53: 1632–45.
Westgate, A.J., D.C.G. Muir, D.E. Gaskin and M.C.S. Kingsley 1997. Concentrations and accumulation patterns of organochlorine contaminants in the blubber of harbour porpoises, Phocoena phocoena, from the coast of Newfoundland, the Gulf of St. Lawrence and the Bay of Fundy/Gulf of Maine. Envir. Pollut. 95: 105-119.
Westgate, A.J., A.J. Read, T.M. Cox, T.D. Schofield, B.R. Whitaker and K.E. Anderson 1998. Monitoring a rehabilitated harbor porpoise using satellite telemetry. Mar. Mamm. Sci. 14(3): 599-604.
Westgate, A.J. and K.A. Tolley 1999. Geographical differences in organochlorine contaminants in harbour porpoises Phocoena phocoena from the western North Atlantic. Mar. Ecol. Prog. Ser. 177: 255-268.
Wingfield J.E., M. O’Brien, V. Lyubchich, J.J. Roberts, P.N. Halpin, A.N. Rice and H. Bailey. (2017) Year-round spatiotemporal distribution of harbor porpoises within and around the Maryland wind energy area. PLoS ONE 12(5): e0176653. https:// doi.org/10.1371/journal.pone.0176653
Woodley, T.H. and A.J. Read 1991. Potential rates of increase of a harbor porpoise (Phocoena phocoena) population subjected to incidental mortality in commercial fisheries. Can. J. Fish. Aquat. Sci 48: 2429-35.
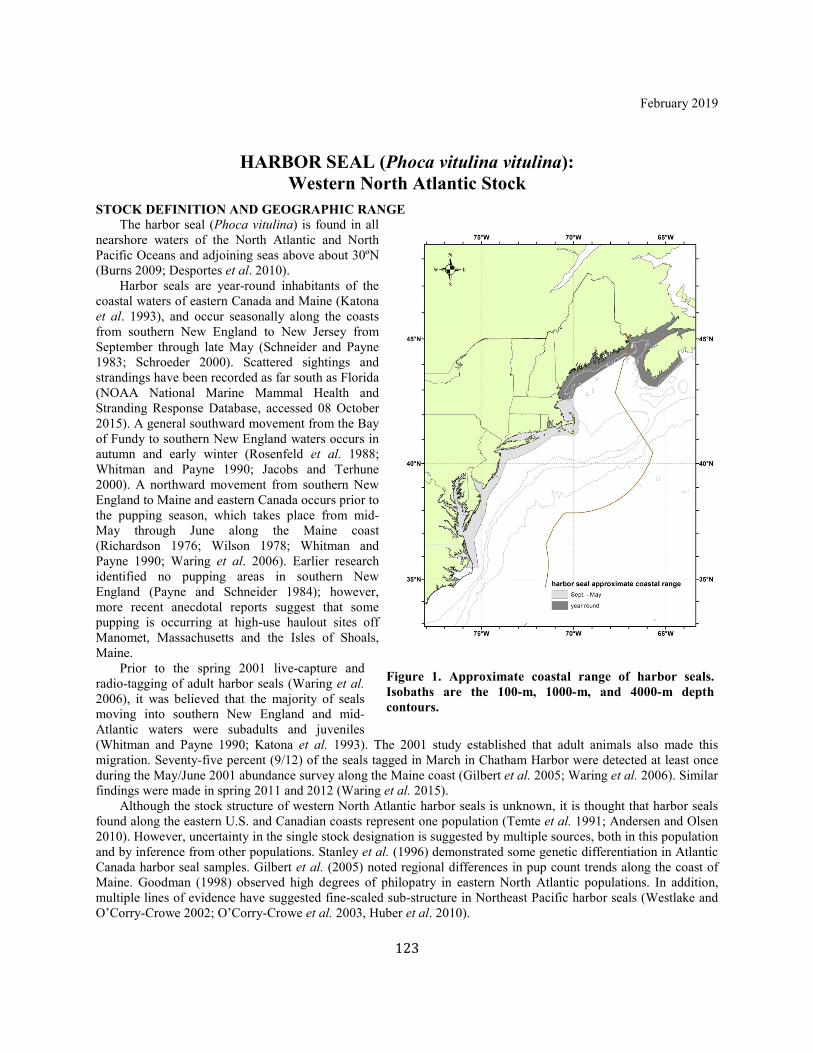
123
February 2019
HARBOR SEAL (Phoca vitulina vitulina): Western North Atlantic Stock
STOCK DEFINITION AND GEOGRAPHIC RANGE The harbor seal (Phoca vitulina) is found in all
nearshore waters of the North Atlantic and North Pacific Oceans and adjoining seas above about 30ºN (Burns 2009; Desportes et al. 2010).
Harbor seals are year-round inhabitants of the coastal waters of eastern Canada and Maine (Katona et al. 1993), and occur seasonally along the coasts from southern New England to New Jersey from September through late May (Schneider and Payne 1983; Schroeder 2000). Scattered sightings and strandings have been recorded as far south as Florida (NOAA National Marine Mammal Health and Stranding Response Database, accessed 08 October 2015). A general southward movement from the Bay of Fundy to southern New England waters occurs in autumn and early winter (Rosenfeld et al. 1988; Whitman and Payne 1990; Jacobs and Terhune 2000). A northward movement from southern New England to Maine and eastern Canada occurs prior to the pupping season, which takes place from mid-May through June along the Maine coast (Richardson 1976; Wilson 1978; Whitman and Payne 1990; Waring et al. 2006). Earlier research identified no pupping areas in southern New England (Payne and Schneider 1984); however, more recent anecdotal reports suggest that some pupping is occurring at high-use haulout sites off Manomet, Massachusetts and the Isles of Shoals, Maine. Prior to the spring 2001 live-capture and radio-tagging of adult harbor seals (Waring et al. 2006), it was believed that the majority of seals moving into southern New England and mid-Atlantic waters were subadults and juveniles (Whitman and Payne 1990; Katona et al. 1993). The 2001 study established that adult animals also made this migration. Seventy-five percent (9/12) of the seals tagged in March in Chatham Harbor were detected at least once during the May/June 2001 abundance survey along the Maine coast (Gilbert et al. 2005; Waring et al. 2006). Similar findings were made in spring 2011 and 2012 (Waring et al. 2015). Although the stock structure of western North Atlantic harbor seals is unknown, it is thought that harbor seals found along the eastern U.S. and Canadian coasts represent one population (Temte et al. 1991; Andersen and Olsen 2010). However, uncertainty in the single stock designation is suggested by multiple sources, both in this population and by inference from other populations. Stanley et al. (1996) demonstrated some genetic differentiation in Atlantic Canada harbor seal samples. Gilbert et al. (2005) noted regional differences in pup count trends along the coast of Maine. Goodman (1998) observed high degrees of philopatry in eastern North Atlantic populations. In addition, multiple lines of evidence have suggested fine-scaled sub-structure in Northeast Pacific harbor seals (Westlake and O’Corry-Crowe 2002; O’Corry-Crowe et al. 2003, Huber et al. 2010).
Figure 1. Approximate coastal range of harbor seals. Isobaths are the 100-m, 1000-m, and 4000-m depth contours.

124
POPULATION SIZE The best current abundance estimate of harbor seals is 75,834 (CV=0.15) which is from a 2012 survey (Waring et al. 2015). Aerial photographic surveys and radio tracking of harbor seals on ledges along the Maine coast were conducted during the pupping period in late May 2012. Twenty-nine harbor seals (20 adults and 9 juveniles) were captured and radio-tagged prior to the aerial survey. Of these, 18 animals were available during the survey to develop a correction factor for the fraction of seals not observed. A key uncertainty is that the area from which the samples were drawn in 2012 may not have included the area the entire population occupied in late May and early June. Additionally, since the most current estimate dates from a survey done in 2012, the ability for that estimate to accurately represent the present population size has become increasingly uncertain.
Table 1. Summary of recent abundance estimates for the western North Atlantic harbor seal (Phoca vitulina vitulina) by month, year, and area covered during each abundance survey, and resulting abundance estimate (Nbest) and coefficient of variation (CV).
Month/Year Area Nbest CV
May/June 2012 Maine coast 75,834 0.15
Minimum Population Estimate The minimum population estimate is the lower limit of the two-tailed 60% confidence interval of the log-normally distributed best abundance estimate. This is equivalent to the 20th percentile of the log-normal distribution as specified by Wade and Angliss (1997). The best estimate of abundance for harbor seals is 75,834 (CV=0.15). The minimum population estimate is 66,884 based on corrected available counts along the Maine coast in 2012.
Current Population Trend A trend analysis has not been possible for this stock. The statistical power to detect a trend in abundance for this stock is poor due to the relatively imprecise abundance estimates and long survey interval. For example, the power to detect a precipitous decline in abundance (i.e., 50% decrease in 15 years) with estimates of low precision (e.g., CV>0.30) remains below 80% (alpha=0.30) unless surveys are conducted on an annual basis (Taylor et al. 2007). Although the 2012 population estimate was lower than the previous estimate of 99,340 obtained from a survey in 2001 (Gilbert et al. 2005), Waring et al. (2015) did not consider the population to be declining because the two estimates were not significantly different and there was uncertainty over whether some fraction of the population was not in the survey area. This was due to the fact that 31.4% of the count was pups, a percentage that is biologically unlikely. The estimated number of harbor seal pups did not differ significantly between 2001 and 2012. In 2001, there were an estimated 23,722 (CV=0.096) pups in the study area (Gilbert et al. 2005); in 2012 there were an estimated 23,830 (CV=0.159) pups in the study area. Therefore some non-pups in the population may not have been available to be counted because they were outside the study area of Coastal Maine. Some seals could have remained farther south in New England, more northerly in Canada, or offshore. Johnston et al. (2015) document a decline in stranding and bycatch rates of harbor seals, providing support for an apparent decline in abundance. However, there has been very little systematic research conducted on fine-scale changes in habitat use, particularly in relation to the sympatric population of gray seals. Therefore, a decline in the apparent abundance of harbor seals could be explained by changing distributions and survey designs.
CURRENT AND MAXIMUM NET PRODUCTIVITY RATES Current and maximum net productivity rates are unknown for this stock. For purposes of this assessment, the maximum net productivity rate was assumed to be 0.12. This value is based on theoretical modeling showing that pinniped populations may not grow at rates much greater than 12% given the constraints of their reproductive life history (Barlow et al. 1995). Key uncertainties about the maximum net productivity rate are due to the limited understanding of the stock-specific life history parameters; thus the default value was used.
POTENTIAL BIOLOGICAL REMOVAL Potential Biological Removal (PBR) is the product of minimum population size, one-half the maximum productivity rate, and a recovery factor (MMPA Sec. 3. 16 U.S.C. 1362; Wade and Angliss 1997). The minimum population size is 66,884 animals. The maximum productivity rate is 0.12, the default value for pinnipeds. The recovery factor (F
R) is 0.5, the default value for stocks of unknown status relative to optimum sustainable population
(OSP) and with the CV of the average mortality estimate less than 0.3 (Wade and Angliss 1997). PBR for the
125
western North Atlantic stock of harbor seals is 2,006.
ANNUAL HUMAN-CAUSED SERIOUS INJURY AND MORTALITY For the period 2012-2016 the total human caused mortality and serious injury to harbor seals is estimated to be 345 per year. The average was derived from two components: 1) 333 (CV=0.12; Table 2) from 2012–2016 observed fisheries; 2) 11.6 from 2012–2016 non-fishery-related, human interaction stranding and direct interaction mortalities (NOAA National Marine Mammal Health and Stranding Response Database, accessed 03 November 2017, and 3) 0.2 from U.S. research mortalities. Analysis of bycatch rates from fisheries observer program records likely underestimates lethal (Lyle and Willcox 2008), and greatly under-represents sub-lethal, fishery interactions. Reports of seal shootings and other non-fishery-related human interactions are minimums.
Fishery Information Detailed fishery information is given in Appendix III. U.S. Northeast Sink Gillnet: Harbor seal bycatch is observed year-round, most frequently in the summer in groundfish trips occurring between Boston, Massachusetts, and Maine in coastal Gulf of Maine waters. Williams (1999) aged 261 harbor seals caught in this fishery from 1991 to 1997, and 93% were juveniles (i.e., less than four years old). Revised serious injury guidelines were applied for this period (Josephson et al. 2019). See Table 2 for bycatch estimates and observed mortality and serious injury for the current 5-year period, and Appendix V for historical bycatch information. Analysis methodology and results can be found in Orphanides (2013, 2019), Hatch and Orphanides (2014, 2015, 2016), and Orphanides and Hatch (2017).
Mid-Atlantic Gillnet Harbor seal bycatch has been observed in this fishery in waters off Massachusetts and New Jersey and rarely further south. See Table 2 for bycatch estimates and observed mortality and serious injury for the current 5-year period, and Appendix V for historical bycatch information. Analysis methodology and results can be found in Orphanides (2013, 2019), Hatch and Orphanides (2014, 2015, 2016), and Orphanides and Hatch (2017).
Northeast Bottom Trawl Harbor seals are occasionally observed taken in this fishery. See Table 2 for bycatch estimates and observed mortality and serious injury for the current 5-year period, and Appendix V for historical bycatch information.
Mid-Atlantic Bottom Trawl Harbor seals are rarely observed taken in this fishery. Annual harbor seal mortalities were estimated using annual stratified ratio-estimator methods (Chavez et al. 2018). See Table 2 for bycatch estimates and observed mortality and serious injury for the current 5-year period, and Appendix V for historical bycatch information.
Northeast Mid-water Trawl Fishery (Including Pair Trawl) Harbor seals are occasionally observed taken in this fishery. An extended bycatch rate has not been calculated for the current 5-year period. Until this bycatch estimate can be developed, the average annual fishery-related mortality and serious injury for 2012–2016 is calculated as 1.0 animal (5 animals/5 years). See Table 2 for bycatch estimates and observed mortality and serious injury for the current 5-year period, and Appendix V for historical bycatch information.
Gulf of Maine Atlantic Herring Purse Seine Fishery The Gulf of Maine Atlantic Herring Purse Seine Fishery is a Category III fishery. This fishery was not observed until 2003. No mortalities have been observed, but 1 harbor seal was captured and released alive in 2012, 1 in 2013, and 0 in 2014– 2016. In addition, 0 seals of unknown species were captured and released alive in 2012–2014, 2 in 2015, and 1 in 2016. None of the seals captured alive herring purse seine during 2012-2016 were designated as serious injuries (Josephson et al. 2019). CANADA Currently, scant data are available on bycatch in Atlantic Canada fisheries due to limited observer programs (Baird 2001). An unknown number of harbor seals have been taken in Newfoundland, Labrador, Gulf of St. Lawrence and Bay of Fundy groundfish gillnets; Atlantic Canada and Greenland salmon gillnets; Atlantic Canada cod traps; and in Bay of Fundy herring weirs (Read 1994; Cairns et al. 2000). Furthermore, some of these

126
mortalities (e.g., seals trapped in herring weirs) are the result of direct shooting under nuisance permits.
Table 2. Summary of the incidental mortality of harbor seals (Phoca vitulina vitulina) by commercial fishery including the years sampled (Years), the number of vessels active within the fishery (Vessels), the type of data used (Data Type), the annual observer coverage (Observer Coverage), the mortalities recorded by on-board observers (Observed Mortality), the estimated annual mortality (Estimated Mortality), the estimated CV of the annual mortality (Estimated CVs) and the mean annual mortality (CV in parentheses).
Fishery Years Data Type a
Observer Coverage
b
Observed Serious Injuryc
Observed Mortality
Estimated Serious Injury
Estimated Mortality
Estimated Combined Mortality
Estimated CVs
Mean Annual
Mortality
Northeast Sink
Gillnet
2012
Obs. Data, Weighout, Logbooks
0.15 0 37 0 252 252 0.26
302 (0.13)
2013 0.11 0 22 0 142 142 0.31 2014 0.18 0 59 0 390 390 0.39 2015 0.14 0 87 0 474 474 0.17 2016 0.1 0 36 0 245 245 0.29
Mid-Atlantic Gillnet
2012
Obs. Data, Weighout
0.02 0 0 0 0 0 0
17 (0.43) 2013 0.03 0 0 0 0 0 0 2014 0.05 0 1 0 19 19 1.06 2015 0.06 0 5 0 48 48 0.52 2016 0.08 0 2 0 18 18 0.95
Northeast Bottom Trawl
2012
Obs. Data, Weighout
0.17 0 1 0 3 3 .81,
3.6 (.46) 2013 0.15 0 1 0 4 4 0.89 2014 0.17 0 2 0 11 11 0.63 2015 0.19 0 0 0 0 0 0 2016 0.12 0 0 0 0 0 0
Mid-Atlantic Bottom Trawl
2012
Obs. Data, Dealer
0.05 0 3 0 23 23 .96,
10 (.53) 2013 0.06 0 1 0 11 11 0.96 2014 0.08 0 2 0 10 10 0.95 2015 0.09 0 1 0 7 7 1 2016 0.097 0 0 0 0 0 0
Northeast Mid-water
Trawl - Including
Pair Trawl
2012 Obs. Data, Weighout,
Trip Logbook
0.45 0 1 0 na na na
1.0 (na)
2013 0.37 0 0 0 0 0 0 2014 0.42 0 1 0 na na na 2015 0.08 0 2 0 na na na
2016 0.27 0 1 0 na na na
TOTAL - - - - - - - - - 333 (0.12)
a. Observer data (Obs. Data) are used to measure bycatch rates, and the data are collected within the Northeast Fisheries Observer Program. NEFSC collects landings data (Weighout), and total landings are used as a measure of total effort for the sink gillnet fishery. Mandatory logbook (Logbook) data are used to determine the spatial distribution of fishing effort in the northeast sink gillnet fishery. b. The observer coverages for the northeast sink gillnet fishery and the mid-Atlantic gillnet fisheries are ratios based on tons of fish landed and coverages for the bottom and mid-water trawl fisheries are ratios based on trips. Total observer coverage reported for bottom trawl gear and gillnet gear in the years 2012-2016 includes samples collected from traditional fisheries observers in addition to fishery monitors through the Northeast Fisheries Observer Program (NEFOP). c. Serious injuries were evaluated for the 2012–2016 period and include both at-sea monitor and traditional observer data (Josephson et al. 2019).
Other Mortality U.S. Historically, harbor seals were bounty-hunted in New England waters, which may have caused a severe decline of this stock in U.S. waters (Katona et al. 1993; Lelli et al. 2009). Bounty-hunting ended in the mid-1960s. Other sources of harbor seal mortality include human interactions, storms, abandonment by the mother, disease (Anthony et al. 2012), and predation (Katona et al. 1993; NMFS unpublished data; Jacobs and Terhune 2000). Mortalities caused by human interactions include research mortalities, boat strikes, fishing gear interactions, oil spill/exposure, harassment, and shooting. Harbor seals strand each year throughout their migratory range. Stranding data provide insight into some of these sources of mortality. From 2012 to 2016, 1,198 harbor seal stranding mortalities were reported between Maine

127
and Florida (Table 3; NOAA National Marine Mammal Health and Stranding Response Database unpublished data, accessed 03 November 2017). Sixty-nine (5.8%) of the dead harbor seals stranded during this five-year period showed signs of human interaction (9 in 2012, 15 in 2013, 11 in 2014, 18 in 2015, and 16 in 2016), with 11 (1.0%) having some sign of fishery interaction (2 in 2012, 3 in 2013, 2 in 2014, 2 in 2015, and 3 in 2016). Three harbor seals during this period were reported as having been shot. Sixteen harbor seal mortalities were reported with indications of vessel strike. In an analysis of mortality causes of stranded marine mammals on Cape Cod and southeastern Massachusetts between 2000 and 2006, Bogomolni et al. (2010) reported that 13% of harbor seal stranding mortalities were attributed to human interaction. An Unusual Mortality Event (UME) was declared for harbor seals in northern Gulf of Maine waters in 2003 and continued into 2004. No consistent cause of death could be determined. The UME was declared over in spring 2005 (MMC 2006). NMFS declared another UME in the Gulf of Maine in autumn 2006 based on infectious disease. A UME was declared in November of 2011 that involved 567 harbor seal stranding mortalities between June 2011 and October 2012 in Maine, New Hampshire, and Massachusetts. The UME was declared closed in February 2013. Stobo and Lucas (2000) have documented shark predation as an important source of natural mortality at Sable Island, Nova Scotia. They suggest that shark-inflicted mortality in pups, as a proportion of total production, was less than 10% in 1980-1993, approximately 25% in 1994–1995, and increased to 45% in 1996. Also, shark predation on adults was selective towards mature females. The decline in the Sable Island population appears to result from a combination of shark-inflicted mortality on both pups and adult females and inter-specific competition with the much more abundant gray seal for food resources (Stobo and Lucas 2000; Bowen et al. 2003). CANADA Aquaculture operations in eastern Canada can be licensed to shoot nuisance seals, but the number of seals killed is unknown (Jacobs and Terhune 2000; Baird 2001). Small numbers of harbor seals are taken in subsistence hunting in northern Canada (DFO 2011).
Table 3. Harbor seal (Phoca vitulina vitulina) stranding mortalities along the U.S. Atlantic coast (2012-2016) with subtotals of animals recorded as pups in parentheses. State 2012 2013 2014 2015 2016 Total
Maine 131 (101) 99 (74) 127 (94) 73 (47) 76 (58) 506
New Hamphire 24 (18) 16 (6) 38 (22) 56 (43) 45 (27) 179
Massachusetts 54 (35) 95 (39) 58 (15) 81 (24) 55 (19) 343
Rhode Island 14 (0) 9 (3) 7 (1) 8 (0) 5 (1) 43
Connecticut 1 (1) 2 (1) 0 2 (1) 1 6
New York 14 (1) 11 (2) 13 (4) 21 (0) 1 60
New Jersey 7 (0) 4 (0) 2 (1) 9 (4) 4 26
Delaware 0 0 3 (0) 1 (0) 1 (1) 5
Maryland 0 1 (0) 2 (0) 0 0 3
Virginia 0 5 (0) 2 (0) 1 (0) 1 9
North Carolina 2 (0) 3 (0) 3 (1) 5 (2) 4 (2) 17

128
State 2012 2013 2014 2015 2016 Total
South Carolina 0 0 1 (0) 0 0 1
Total 247 245 256 257 193 1198
Unspecified seals (all states) 28 25 38 31 13 135
STATUS OF STOCK Harbor seals are not listed as threatened or endangered under the Endangered Species Act, and the western North Atlantic stock is not considered strategic under the Marine Mammal Protection Act. The 2012–2016 average annual human-caused mortality and serious injury does not exceed PBR. The status of the western North Atlantic harbor seal stock, relative to OSP, in the U.S. Atlantic EEZ is unknown. Total fishery-related mortality and serious injury for this stock is not less than 10% of the calculated PBR and, therefore, cannot be considered to be insignificant and approaching zero mortality and serious injury rate.
REFERENCES CITED Anderson, L.W., and M.T. Olsen 2010. Distribution and population structure of North Atlantic harbour seals (Phoca
vitulina). Pages 173-188 in: Harbour Seals of the North Atlantic and the Baltic. NAMMCO Scientific Publications 8.
Anthony, S.J., J.A. St. Leger, K. Pugliares, H.S. Ip, J.M. Chan, Z.W. Carpenter, I. Navarrete-Macias, M. Sanchez-Leon, J.T. Saliki, J. Pedersen, W. Karesh, P. Daszak, R. Rabadan, T. Rowles and W.I. Lipkin. 2012. Emergence of fatal avian influenza in New England harbor seals. mBio 3:e00166–12.
Baird, R.W. 2001. Status of harbor seals, Phoca vitulina, in Canada. Can. Field-Nat. 115:663–675. Barlow, J., S.L. Swartz, T.C. Eagle and P.R. Wade. 1995. U.S. marine mammal stock assessments: Guidelines for
preparation, background, and a summary of the 1995 assessments. NOAA Tech. Memo. NMFS-OPR-6. 73 pp.
Bogomolni, A.L., K.R. Pugliares, S.M. Sharp, K. Patchett, C.T. Harry, J.M. LaRocque, K.M. Touhey and M. Moore. 2010. Mortality trends of stranded marine mammals on Cape Cod and southeastern Massachusetts, USA, 2000 to 2006. Dis. Aq. Org. 88:143–155.
Bowen, W.D., S.L. Ellis, S.J. Iverson and D.J. Boness. 2003. Maternal and newborn life-history traits during periods of contrasting population trends: implications for explaining the decline of harbour seals (Phoca vitulina), on Sable Island. J. Zool., London 261:155–163.
Burns, J.J. 2009. Harbor seal and spotted seal (Phoca vitulina and P. largha). Pages 533-542 in: W.F. Perrin, B. Wursig, and J.G.M. Thewissen (eds.) Encyclopedia of marine mammals, second edition. Academic Press, San Diego, CA.
Cairns, D.K., D.M. Keen, P-Y. Daoust, D.J. Gillis and M. Hammill 2000. Conflicts between seals and fishing gear on Prince Edward Island. Can. Tech. Rep. of Fish. and Aq. Sci. 2333. 39 pp.
Chavez-Rosales, S., M.C. Lyssikatos, and J. Hatch. 2018. Estimates of cetacean and pinniped bycatch in northeast and mid-Atlantic bottom trawl fisheries, 2012-2016. NOAA Tech. Memo NMFS-NE-250. 29pp.
Desportes G., A. Bjorge, A. Rosing-Asvid and G.T. Waring, eds., 2010 Harbour seals of the North Atlantic and the Baltic. NAMMCO Scientific Publications, vol. 8. North Atlantic Marine Mammal Commission, Tromsø, Norway. 377 pp.
DFO [Dept of Fisheries and Oceans]. 2011. 2011–2015 integrated fisheries management plan for Atlantic seals. Available at: http://www.dfo-mpo.gc.ca/fm-gp/seal-phoque/reports-rapports/mgtplan-planges20112015/mgtplan-planges20112015-eng.htm#c2.
Gilbert, J.R., G.T. Waring, K.M. Wynne and N. Guldager. 2005. Changes in abundance and distribution of harbor seals in Maine, 1981-2001. Mar. Mamm. Sci. 21:519–535.
Goodman, S.J. 1998 Patterns of extensive genetic differentiation and variation among European harbor seals (Phoca vitulina vitulina) revealed using microsatellite DNA polymorphisms. Mol. Biol. Evol. 15:104–118.
129
Hatch, J.M. and C.D. Orphanides. 2014. Estimates of cetacean and pinniped bycatch in the 2012 New England sink and mid-Atlantic gillnet fisheries. Northeast Fish. Sci. Cent. Ref. Doc. 14-02. 20 pp.
Hatch, J.M. and C.D. Orphanides. 2015. Estimates of cetacean and pinniped bycatch in the 2013 New England sink and mid-Atlantic gillnet fisheries. Northeast Fish. Sci. Cent. Ref. Doc. 15-15. 33 pp.
Hatch, J.M. and C.D. Orphanides. 2016. Estimates of cetacean and pinniped bycatch in the 2014 New England sink and mid-Atlantic gillnet fisheries. Northeast Fish. Sci. Cent. Ref. Doc.16-05. 22 pp.
Huber, H. R., S. J. Jeffries, D. M. Lambourn and B. R. Dickerson. 2010. Population substructure of harbor seals (Phoca vitulina richardsi) in Washington State using mtDNA. Can. J. Zool. 88:280–288.
Jacobs, S.R. and J.M. Terhune 2000. Harbor seal (Phoca vitulina) numbers along the New Brunswick coast of the Bay of Fundy in autumn in relation to aquaculture. Northeast. Nat. 7:289–296.
Johnston, D.W., J. Frungillo, A. Smith, K. Moore, B. Sharp, ,J. Schuh, and A.J. Read. 2015. Trends in stranding and by-catch rates of gray and harbor seals along the northeastern coast of the United States: Evidence of divergence in the abundance of two sympatric phocid species? PLoS ONE 10(7): e0131660. doi:10.1371/journal.pone.0131660
Josephson, E., F. Wenzel and M.C. Lyssikatos. 2019. Serious injury determinations for small cetaceans and pinnipeds caught in commercial fisheries off the northeast U.S. coast, 2012-2016. Northeast Fish. Sci. Cent. Ref. Doc. 19-05, 27pp.
Katona, S.K., V. Rough and D.T. Richardson 1993. A field guide to whales, porpoises, and seals from Cape Cod to Newfoundland. Smithsonian Institution Press, Washington, DC. 316 pp.
Lelli, B., D.E. Harri, and A-M. Aboueissa. 2009. Seal bounties in Maine and Massachusetts, 1888 to 1962. Northeast. Nat. 16:239–254.
Lyle, J.M. and S.T. Willcox. 2008. Dolphin and seal interactions with mid-water trawling in the commonwealth small pelagic fishery, including an assessment of bycatch mitigation. Australian Fisheries Management Authority, Final Report Project R05/0996, 49 p.
MMC 2006. US Marine Mammal Commission annual report to Congress, 2005. Marine Mammal Commission. Bethesda, MD. vi+163 pp. https://www.mmc.gov/letters-and-reports/reports/annual-reports/
Payne, P.M. and D.C. Schneider. 1984. Yearly changes in abundance of harbor seals, Phoca vitulina, at a winter haul-out site in Massachusetts. Fish. Bull. 82:440–442.
O’Corry-Crowe, G.M., K.K. Martien and B.L. Taylor. 2003. The analysis of population genetic structure in Alaskan harbor seals, Phoca vitulina, as a framework for the identification of management stocks. Southwest Fish. Sci. Cent. Admin. Rep. LJ-03-08. 66 pp. Available at:
https://alaskafisheries.noaa.gov/sites/default/files/geneticstructure_occrowe03.pdf Orphanides, C.D. and J. Hatch. 2017. Estimates of cetacean and pinniped bycatch in the 2015 New England sink and
mid-Atlantic Gillnet fisheries. Northeast Fish. Sci. Cent. Ref. Doc. 17-18. 21 pp. Orphanides, C.D. 2019. Estimates of cetacean and pinniped bycatch in the 2016 New England sink and mid-Atlantic
Gillnet fisheries. Northeast Fish. Sci. Cent. Ref. Doc.19-04. 12 pp. Read, A.J. 1994. Interactions between cetaceans and gillnet and trap fisheries in the northwest Atlantic. Rep. Int.
Whal. Comm. (Special Issue) 15:133–147. Richardson, D.T. 1976. Assessment of harbor and gray seal populations in Maine 1974-1975. Final report to Marine
Mammal Commission, Contract No. MM4AC009. Marine Mammal Commission, Washington, DC. Rosenfeld, M., M. George and J.M. Terhune. 1988. Evidence of autumnal harbour seal, Phoca vitulina, movement
from Canada to the United States. Can. Field-Nat. 102:527–529. Schneider, D.C. and P.M. Payne. 1983. Factors affecting haul-out of harbor seals at a site in southeastern
Massachusetts. J. Mamm. 64:518–520. Schroeder, C.L. 2000. Population status and distribution of the harbor seal in Rhode Island waters. M.S. thesis.
University of Rhode Island, Kingston, RI. 197 pp. Stanley, H.F., S. Casey, J.M. Carnahan, S. Goodman, J. Harwood and R.K. Wayne. 1996. Worldwide patterns of
mitochondrial DNA differentiation in the harbor seal (Phoca vitulina). Mol. Biol. Evol. 13:368–382. Stobo, W.T. and G.M. Fowler. 1994. Aerial surveys of seals in the Bay of Fundy and off southwest Nova Scotia.
Can. Tech. Rep. Fish. Aquat. Sci. 1943. 57 pp. Stobo, W.T. and Z. Lucas. 2000. Shark-inflicted mortality on a population of harbour seals (Phoca vitulina) at Sable
Island, Nova Scotia. J. Zool., London 252:405–414. Taylor, B.L., M. Martinez, T. Gerrodette, J. Barlow and Y.N. Hrovat. 2007. Lessons from monitoring trends in
abundance in marine mammals. Mar. Mamm. Sci. 23:157–175.
130
Temte, J.L., M.A. Bigg and O. Wiig 1991. Clines revisited: the timing of pupping in the harbour seal (Phoca vitulina). J. Zool., London 224:617–632.
Wade, P.R. and R.P. Angliss. 1997. Guidelines for assessing marine mammal stocks: Report of the GAMMS Workshop April 3-5, 1996, Seattle, Washington. NOAA Tech. Memo. NMFS-OPR-12. 93 pp.
Waring, G.T., J.R. Gilbert, J. Loftin and N. Cabana. 2006. Short-term movements of radio-tagged harbor seals in New England. Northeast. Nat. 13:1–14.
Waring, G.T., R.A. DiGiovanni Jr, E. Josephson, S. Wood and J.R. Gilbert. 2015. 2012 population estimate for the harbor seal (Phoca vitulina concolor) in New England waters. NOAA Tech. Memo. NMFS NE-235. 15 pp.
Westlake R.L. and G.M. O’Corry-Crowe. 2002. Macrogeographic structure and patterns of genetic diversity in harbor seals (Phoca vitulina) from Alaska to Japan. J. Mamm. 83:111–1126.
Whitman, A.A. and P.M. Payne. 1990. Age of harbour seals, Phoca vitulina concolor, wintering in southern New England. Can. Field-Nat. 104:579–582.
Williams, A.S. 1999. Prey selection by harbor seals in relation to fish taken by the Gulf of Maine sink gillnet fishery. M.S. thesis. University of Maine, Orono, ME. 62 pp.
Wilson, S.C. 1978. Social organization and behavior of harbor seals, Phoca vitulina concolor, in Maine. Final report, contract MM6ACO13. Marine Mammal Commission, Washington, DC. 116 pp.
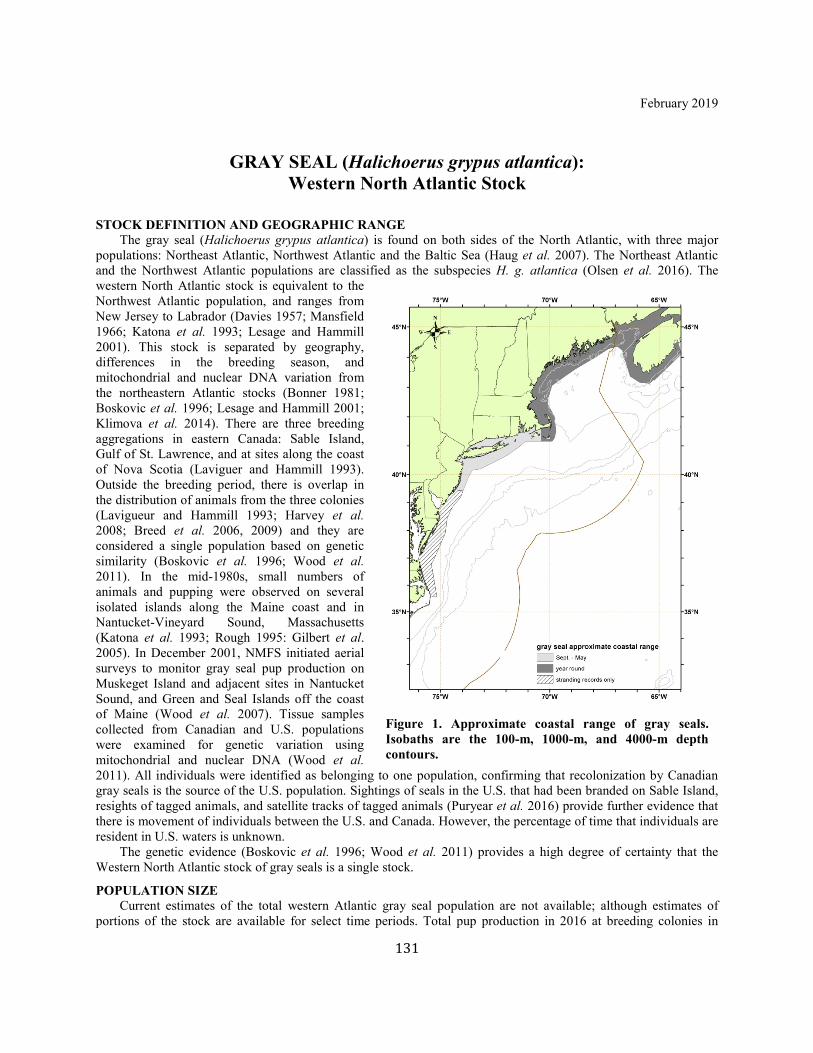
131
February 2019
GRAY SEAL (Halichoerus grypus atlantica): Western North Atlantic Stock
STOCK DEFINITION AND GEOGRAPHIC RANGE
The gray seal (Halichoerus grypus atlantica) is found on both sides of the North Atlantic, with three major populations: Northeast Atlantic, Northwest Atlantic and the Baltic Sea (Haug et al. 2007). The Northeast Atlantic and the Northwest Atlantic populations are classified as the subspecies H. g. atlantica (Olsen et al. 2016). The western North Atlantic stock is equivalent to the Northwest Atlantic population, and ranges from New Jersey to Labrador (Davies 1957; Mansfield 1966; Katona et al. 1993; Lesage and Hammill 2001). This stock is separated by geography, differences in the breeding season, and mitochondrial and nuclear DNA variation from the northeastern Atlantic stocks (Bonner 1981; Boskovic et al. 1996; Lesage and Hammill 2001; Klimova et al. 2014). There are three breeding aggregations in eastern Canada: Sable Island, Gulf of St. Lawrence, and at sites along the coast of Nova Scotia (Laviguer and Hammill 1993). Outside the breeding period, there is overlap in the distribution of animals from the three colonies (Lavigueur and Hammill 1993; Harvey et al. 2008; Breed et al. 2006, 2009) and they are considered a single population based on genetic similarity (Boskovic et al. 1996; Wood et al. 2011). In the mid-1980s, small numbers of animals and pupping were observed on several isolated islands along the Maine coast and in Nantucket-Vineyard Sound, Massachusetts (Katona et al. 1993; Rough 1995: Gilbert et al. 2005). In December 2001, NMFS initiated aerial surveys to monitor gray seal pup production on Muskeget Island and adjacent sites in Nantucket Sound, and Green and Seal Islands off the coast of Maine (Wood et al. 2007). Tissue samples collected from Canadian and U.S. populations were examined for genetic variation using mitochondrial and nuclear DNA (Wood et al. 2011). All individuals were identified as belonging to one population, confirming that recolonization by Canadian gray seals is the source of the U.S. population. Sightings of seals in the U.S. that had been branded on Sable Island, resights of tagged animals, and satellite tracks of tagged animals (Puryear et al. 2016) provide further evidence that there is movement of individuals between the U.S. and Canada. However, the percentage of time that individuals are resident in U.S. waters is unknown. The genetic evidence (Boskovic et al. 1996; Wood et al. 2011) provides a high degree of certainty that the Western North Atlantic stock of gray seals is a single stock.
POPULATION SIZE Current estimates of the total western Atlantic gray seal population are not available; although estimates of portions of the stock are available for select time periods. Total pup production in 2016 at breeding colonies in
Figure 1. Approximate coastal range of gray seals. Isobaths are the 100-m, 1000-m, and 4000-m depth contours.

132
Canada was estimated to be 98,650 pups (CV=0.10) (den Heyer 2017; DFO 2017). Production at Sable Island, Gulf of St. Lawrence, and Coastal Nova Scotia colonies accounted for 85%, 11% and 4%, respectively, of the estimated total number of pups born. Population models, incorporating estimates of age-specific reproductive rates and removals, are fit to these pup production estimates to estimate total population levels in Canada. The total Canadian gray seal population in 2016 was estimated to be 424,300 (95% CI=263,600 to 578,300) (DFO 2017). Uncertainties in the population estimate derive from uncertainties in life history parameters such as mortality rates and sex ratios (DFO 2017). In U.S. waters, gray seals primarily pup at four established colonies: Muskeget and Monomoy islands in Massachusetts, and Green and Seal islands in Maine. Since 2010 pupping has also been observed at Noman’s Island in Massachusetts and Wooden Ball and Matinicus Rock in Maine. Although white-coated pups have stranded on eastern Long Island beaches in New York, no pupping colonies have been detected in that region. Gray seals have been observed using the historic pupping site on Muskeget Island in Massachusetts since 1988. Pupping has taken place on Seal and Green Islands in Maine since at least the mid-1990s. Aerial survey data from these sites indicate that pup production is increasing (Table 2), although aerial survey quality and coverage has varied significantly among surveys. Table 2 summarizes single-day pup counts from U.S. pupping colonies from 2001/2002 to 2015/2016 pupping periods. A minimum of 6,308 of pups were born in 2016 at U.S. breeding colonies, approximately 6% of the total pup production over the entire range of the stock. The percentage of pup production in the U.S. is considered a minimum because pup counts are single day counts that have not been adjusted to account for pups born after the survey, or that left the colony prior to the survey. The number of pups born at U.S. breeding colonies can be used to approximate the total size (pups and adults) of the gray seal population in U.S. waters, based on the ratio of total best population size to pups in Canadian waters (4.3:1). This ratio falls within the range of other adult to pup ratios suggested for pinniped populations (Harwood and Prime 1978). Using this approach, the population estimate in U.S. waters is 27,131 (CV=0.19, 95% CI: 18,768–39,221) animals. The CV and CI around this estimate is based on CVs and CIs from Canadian population estimates, rather than using a default CV when the variance is unknown (Wade and Angliss 1997). There is further uncertainty in this abundance level in the U.S. because life history parameters that influence the ratio of pups to total individuals in this portion of the population are unknown. It also does not reflect seasonal changes in stock abundance in the Northeast region for a transboundary stock. For example, roughly 28,000–40,000 gray seals were estimated in southeastern Massachusetts in 2015, using correction factors applied to seal counts visible in Google Earth imagery (Moxley et al. 2017).
Table 1. Summary of recent abundance estimates for the western North Atlantic gray seal (Halichoerus grypus atlantica) by year, and area covered, resulting total abundance estimate and 95% confidence interval.
Month/Year Area Nbest a CI
2012b Gulf of St Lawrence + Nova Scotia Eastern Shore + Sable Island
331,000 263,000–458,000
2014c Gulf of St Lawrence + Nova Scotia Eastern Shore + Sable Island
505,000 329,000–682,000
2016d Gulf of St Lawrence + Nova Scotia Eastern Shore + Sable Island
424,300 263,600–578,300
2016 U.S 27,131e 18,768– 39,221
aThese are model-based estimates derived from pup surveys. b DFO 2013 c DFO 2014 d DFO 2017 eThis is derived from total population size to pup ratios in Canada, applied to U.S. pup counts.
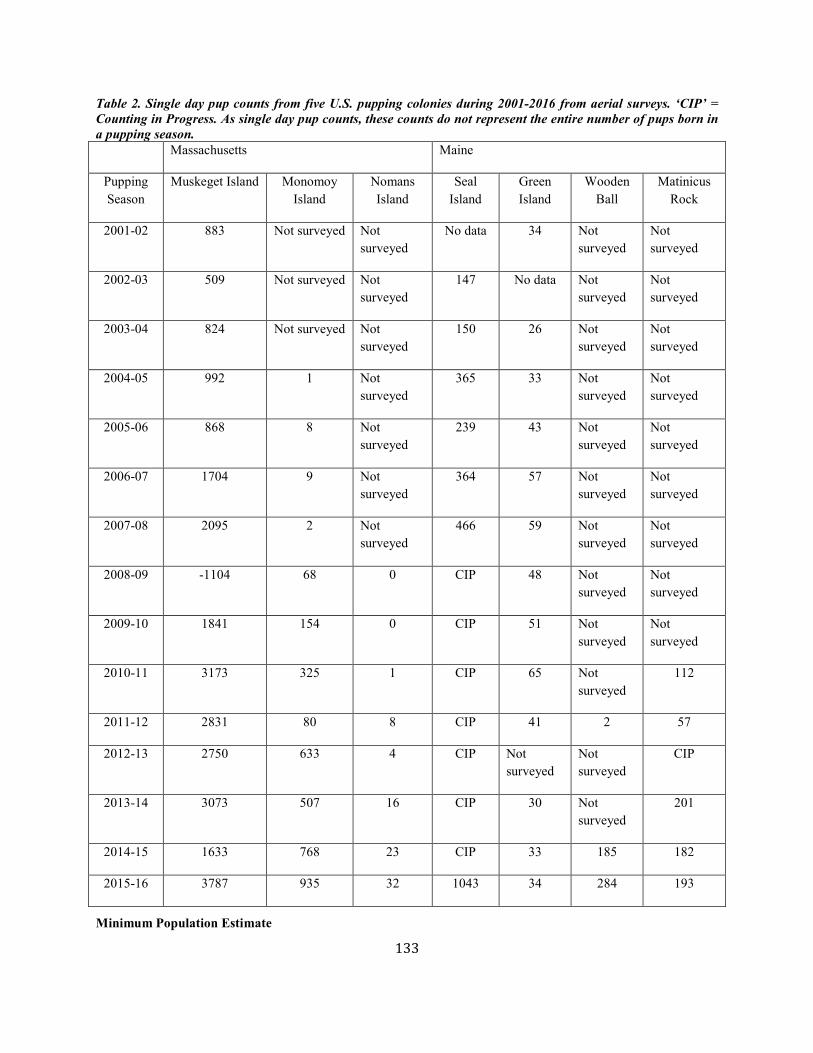
133
Table 2. Single day pup counts from five U.S. pupping colonies during 2001-2016 from aerial surveys. ‘CIP’ = Counting in Progress. As single day pup counts, these counts do not represent the entire number of pups born in a pupping season.
Massachusetts Maine
Pupping Season
Muskeget Island Monomoy Island
Nomans Island
Seal Island
Green Island
Wooden Ball
Matinicus Rock
2001-02 883 Not surveyed Not surveyed
No data 34 Not surveyed
Not surveyed
2002-03 509 Not surveyed Not surveyed
147 No data Not surveyed
Not surveyed
2003-04 824 Not surveyed Not surveyed
150 26 Not surveyed
Not surveyed
2004-05 992 1 Not surveyed
365 33 Not surveyed
Not surveyed
2005-06 868 8 Not surveyed
239 43 Not surveyed
Not surveyed
2006-07 1704 9 Not surveyed
364 57 Not surveyed
Not surveyed
2007-08 2095 2 Not surveyed
466 59 Not surveyed
Not surveyed
2008-09 -1104 68 0 CIP 48 Not surveyed
Not surveyed
2009-10 1841 154 0 CIP 51 Not surveyed
Not surveyed
2010-11 3173 325 1 CIP 65 Not surveyed
112
2011-12 2831 80 8 CIP 41 2 57
2012-13 2750 633 4 CIP Not surveyed
Not surveyed
CIP
2013-14 3073 507 16 CIP 30 Not surveyed
201
2014-15 1633 768 23 CIP 33 185 182
2015-16 3787 935 32 1043 34 284 193
Minimum Population Estimate
134
The minimum population estimate is the lower limit of the two-tailed 60% confidence interval of the log-normally distributed best abundance estimate. This is equivalent to the 20th percentile of the log-normal distribution as specified by Wade and Angliss (1997). Based on an estimated U.S. population of 27,131 (CV=0.19), the minimum population estimate in U.S. waters is 23,158. Similar to the best abundance estimate, there is uncertainty in this minimum abundance level in the U.S. because life history parameters that influence the ratio of pups to total individuals in this population are unknown.
Current Population Trend Gray seal abundance is likely increasing in the U.S. Atlantic Exclusive Economic Zone (EEZ), but the rate of increase is unknown. Methods to evaluate trends in pup production which account for variation across pupping sites and years are currently being investigated. The population in eastern Canada was greatly reduced by hunting and bounty programs, and in the 1950s the gray seal was considered rare (Lesage and Hammill 2001). The Sable Island, Nova Scotia, population was less affected and has been increasing for several decades. Pup production on Sable Island increased exponentially at a rate of 12.8% per year between the 1970s and 1997 (Stobo and Zwanenburg 1990; Mohn and Bowen 1996; Bowen et al. 2003; Trzcinski et al. 2005; Bowen et al. 2007; DFO 2011). Since 1997, the rate of increase has been slower (Bowen et al. 2011, den Heyer et al. 2017), supporting the hypothesis that density-dependent changes in vital rates may be limiting population growth. Pupping also occurs on Hay Island off Nova Scotia, in colonies off southwestern Nova Scotia, and in the Gulf of St. Lawrence. Pup production is increasing on Sable Island and in southwest Nova Scotia, and stabilizing on Hay Island in the Gulf of St. Lawrence (DFO 2017, den Heyer et al. 2017). In the Gulf of St. Lawrence, the proportion of pups born on the ice has declined from 100% in 2004 to 1% in 2016 due to a decline in winter ice cover in the area, and seals have responded by pupping on nearby islands (DFO 2017). The projected population trends for all Canadian aggregations are still increasing. The model projections in 2016 differed from previous analyses due to changes in adult sex ratio and adult mortality rates (DFO 2017). Uncertainties in the population abundance estimates and mortality could have impacts on the abundance trends.
CURRENT AND MAXIMUM NET PRODUCTIVITY RATES Current and maximum net productivity rates are unknown for this stock. Recent studies estimated the current annual rate of increase at 4.5% for the combined breeding aggregations in Canada (DFO 2014), continuing a decline in the rate of increase (Trzcinski et al. 2005; Bowen et al. 2007; Thomas et al. 2011; DFO 2014). For purposes of this assessment, the maximum net productivity rate was assumed to be 0.12. This value is based on theoretical modeling showing that pinniped populations may not grow at rates much greater than 12% given the constraints of their reproductive life history (Barlow et al. 1995).
POTENTIAL BIOLOGICAL REMOVAL Potential Biological Removal (PBR) is the product of minimum population size, one-half the maximum productivity rate, and a recovery factor (MMPA Sec. 3. 16 U.S.C. 1362; Wade and Angliss 1997). The minimum population size for the stock in U.S. waters is 23,158. The maximum productivity rate is 0.12, the default value for pinnipeds. The recovery factor (F
R) for this stock is 1.0, the value for stocks of unknown status, but which are
known to be increasing. PBR for the western North Atlantic stock of gray seals in U.S. waters is 1,389 animals. Uncertainty in the PBR level arises from the same sources of uncertainty in calculating a minimum abundance estimate in U.S. waters.
ANNUAL HUMAN-CAUSED MORTALITY AND SERIOUS INJURY For the period 2012–2016, the average annual estimated human-caused mortality and serious injury to gray seals in the U.S. and Canada was 5,688 (878 U.S./4,809 Canada) per year. The average was derived from six components: 1) 873 (CV=0.10) (Table 3) from the 2012–2016 U.S. observed fisheries; 2) 4.8 from average 2012–2016 non-fishery related, human interaction stranding and shooting mortalities in the U.S.; 3) 0.8 from U.S. research mortalities; 4) 659 from the average 2012–2016 Canadian commercial harvest; 5) 74 from the average 2012–2016 DFO scientific collections; and 6) 4,076 removals of nuisance animals in Canada (DFO 2017). A source of unquantified human-caused mortality or serious injury for this stock is the fact that observed serious injury rates are lower than would be expected from the anecdotally-observed numbers of gray seals living with ongoing entanglements. Reports of seal shootings and other non-fishery-related human interactions are minimum counts. Canadian reporting of nuisance seal removal is known to be incomplete and there is also limited information on Canadian fishery bycatch (DFO 2017).
135
Fishery Information Detailed fishery information is given in Appendix III. U.S.
Northeast Sink Gillnet Gray seal bycatch in the northeast sink gillnet fishery was usually observed in the first half of the year in waters to the east and south of Cape Cod, Massachusetts in 12-inch gillnets fishing for skates and monkfish (Hatch and Orphanides 2014, 2015, 2016, Orphanides and Hatch 2017; Orphanides 2019). There were 1, 8, 8, 10, and 6 unidentified seals observed during 2012–2016, respectively. Since 1997 unidentified seals have not been prorated to a species. This is consistent with the treatment of other unidentified mammals that do not get prorated to a specific species. See Table 3 for bycatch estimates and observed mortality and serious injury for the current 5-year period, and Appendix V for historical bycatch information.
Mid-Atlantic Gillnet Gray seal interactions were first observed in this fishery in 2010, since then, when they are observed, it is usually in waters off New Jersey in gillnets that have mesh sizes ≥ 7 in (Hatch and Orphanides 2015, 2016; Orphanides and Hatch 2017; Orphanides 2019). See Table 3 for bycatch estimates and observed mortality and serious injury for the current 5-year period, and Appendix V for historical bycatch information.
Northeast Mid-Water Trawl One gray seal mortality was observed in 2012 and one in 2013 in this fishery. An expanded bycatch estimate has not been generated. Until this bycatch estimate can be developed, the average annual fishery-related mortality and serious injury for 2012–2016 is calculated as 0.4 animals (2 animals /5 years). See Table 3 for bycatch estimates and observed mortality and serious injury for the current 5-year period, and Appendix V for historical bycatch information.
Gulf of Maine Atlantic Herring Purse Seine Fishery The Gulf of Maine Atlantic Herring Purse Seine Fishery is a Category III fishery. This fishery was not observed until 2003, and was not observed in 2006. No mortalities have been observed, but during this time period 33 gray seals were captured and released alive in 2012, 1 in 2013, and 2 in 2014, 0 in 2015, and 5 in 2016. In addition, during this time period 2 seals of unknown species were captured and released alive in 2015 and 1 in 2016 (Josephson et al. 2019).
Northeast Bottom Trawl Vessels in the North Atlantic bottom trawl fishery, a Category III fishery under MMPA, were observed in order to meet fishery management, rather than marine mammal management needs. Eight gray seal mortalities were observed in this fishery in 2012, 5 in 2013, 4 in 2014, 4 in 2015, and 0 in 2016. See Table 3 for bycatch estimates and observed mortality and serious injury for the current 5-year period, and Appendix V for historical bycatch information.
Mid-Atlantic Bottom Trawl One gray seal mortality was observed in this fishery in 2012, 2 in 2013, 1 in 2014, none in 2015, and 3 in 2016. See Table 3 for bycatch estimates and observed mortality and serious injury for the current 5-year period, and Appendix V for historical bycatch information. CANADA Historically, an unknown number of gray seals have been taken in Newfoundland and Labrador, Gulf of St. Lawrence, and Bay of Fundy groundfish gillnets; Atlantic Canada and Greenland salmon gillnets; Atlantic Canada cod traps, and Bay of Fundy herring weirs (Read 1994).
Table 3. Summary of the incidental serious injury and mortality of gray seal (Halichoerus grypus atlantica) by commercial fishery including the years sampled, the type of data used (Data Type), the annual observer coverage (Observer Coverage), the mortalities recorded by on-board observers (Observed Mortality), the estimated annual mortality (Estimated Mortality), the estimated CV of the annual mortality (Estimated CVs) and the mean annual mortality (CV in parentheses).
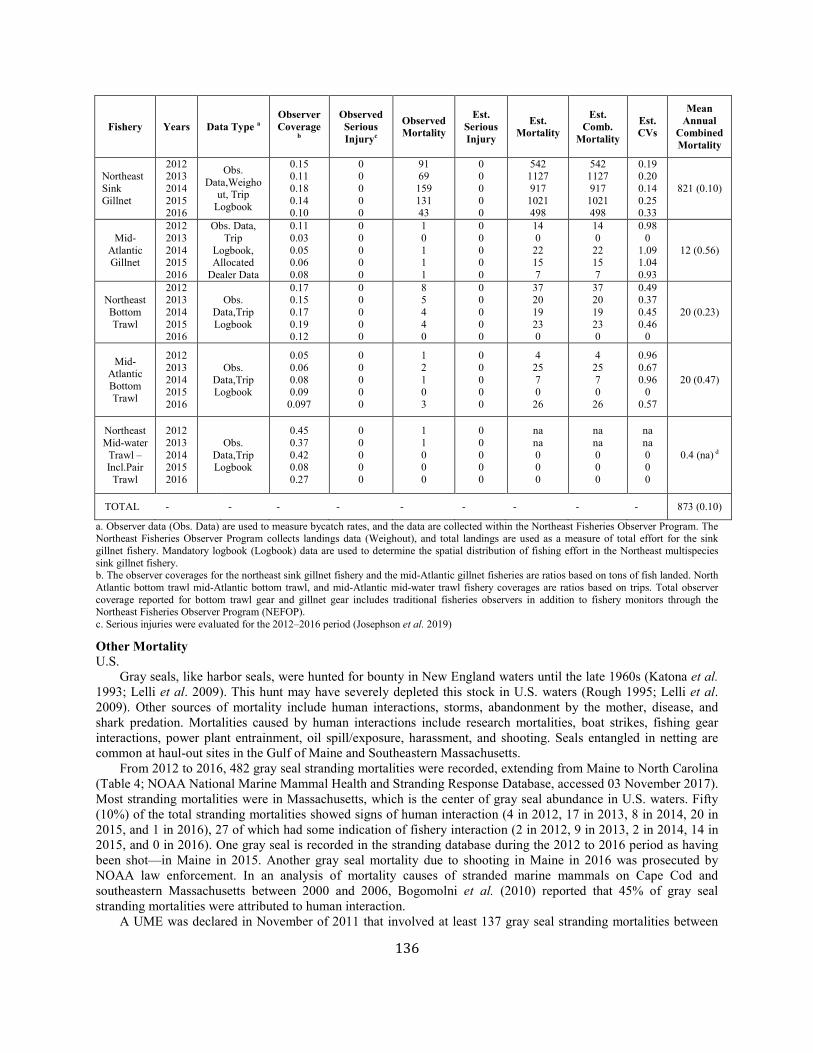
136
Fishery Years Data Type a Observer Coverage
b
Observed Serious Injuryc
Observed Mortality
Est. Serious Injury
Est. Mortality
Est. Comb.
Mortality
Est. CVs
Mean Annual
Combined Mortality
Northeast Sink Gillnet
2012 2013 2014 2015 2016
Obs. Data,Weigho
ut, Trip Logbook
0.15 0.11 0.18 0.14 0.10
0 0 0 0 0
91 69 159 131 43
0 0 0 0 0
542 1127 917
1021 498
542 1127 917
1021 498
0.19 0.20 0.14 0.25 0.33
821 (0.10)
Mid-Atlantic Gillnet
2012 2013 2014 2015 2016
Obs. Data, Trip
Logbook, Allocated
Dealer Data
0.11 0.03 0.05 0.06 0.08
0 0 0 0 0
1 0 1 1 1
0 0 0 0 0
14 0
22 15 7
14 0
22 15 7
0.98 0
1.09 1.04 0.93
12 (0.56)
Northeast Bottom Trawl
2012 2013 2014 2015 2016
Obs. Data,Trip Logbook
0.17 0.15 0.17 0.19 0.12
0 0 0 0 0
8 5 4 4 0
0 0 0 0 0
37 20 19 23 0
37 20 19 23 0
0.49 0.37 0.45 0.46
0
20 (0.23)
Mid-Atlantic Bottom Trawl
2012 2013 2014 2015 2016
Obs. Data,Trip Logbook
0.05 0.06 0.08 0.09
0.097
0 0 0 0 0
1 2 1 0 3
0 0 0 0 0
4 25 7 0
26
4 25 7 0
26
0.96 0.67 0.96
0 0.57
20 (0.47)
Northeast Mid-water
Trawl – Incl.Pair
Trawl
2012 2013 2014 2015 2016
Obs. Data,Trip Logbook
0.45 0.37 0.42 0.08 0.27
0 0 0 0 0
1 1 0 0 0
0 0 0 0 0
na na 0 0 0
na na 0 0 0
na na 0 0 0
0.4 (na) d
TOTAL - - - - - - - - - 873 (0.10)
a. Observer data (Obs. Data) are used to measure bycatch rates, and the data are collected within the Northeast Fisheries Observer Program. The Northeast Fisheries Observer Program collects landings data (Weighout), and total landings are used as a measure of total effort for the sink gillnet fishery. Mandatory logbook (Logbook) data are used to determine the spatial distribution of fishing effort in the Northeast multispecies sink gillnet fishery. b. The observer coverages for the northeast sink gillnet fishery and the mid-Atlantic gillnet fisheries are ratios based on tons of fish landed. North Atlantic bottom trawl mid-Atlantic bottom trawl, and mid-Atlantic mid-water trawl fishery coverages are ratios based on trips. Total observer coverage reported for bottom trawl gear and gillnet gear includes traditional fisheries observers in addition to fishery monitors through the Northeast Fisheries Observer Program (NEFOP). c. Serious injuries were evaluated for the 2012–2016 period (Josephson et al. 2019)
Other Mortality U.S. Gray seals, like harbor seals, were hunted for bounty in New England waters until the late 1960s (Katona et al. 1993; Lelli et al. 2009). This hunt may have severely depleted this stock in U.S. waters (Rough 1995; Lelli et al. 2009). Other sources of mortality include human interactions, storms, abandonment by the mother, disease, and shark predation. Mortalities caused by human interactions include research mortalities, boat strikes, fishing gear interactions, power plant entrainment, oil spill/exposure, harassment, and shooting. Seals entangled in netting are common at haul-out sites in the Gulf of Maine and Southeastern Massachusetts. From 2012 to 2016, 482 gray seal stranding mortalities were recorded, extending from Maine to North Carolina (Table 4; NOAA National Marine Mammal Health and Stranding Response Database, accessed 03 November 2017). Most stranding mortalities were in Massachusetts, which is the center of gray seal abundance in U.S. waters. Fifty (10%) of the total stranding mortalities showed signs of human interaction (4 in 2012, 17 in 2013, 8 in 2014, 20 in 2015, and 1 in 2016), 27 of which had some indication of fishery interaction (2 in 2012, 9 in 2013, 2 in 2014, 14 in 2015, and 0 in 2016). One gray seal is recorded in the stranding database during the 2012 to 2016 period as having been shot—in Maine in 2015. Another gray seal mortality due to shooting in Maine in 2016 was prosecuted by NOAA law enforcement. In an analysis of mortality causes of stranded marine mammals on Cape Cod and southeastern Massachusetts between 2000 and 2006, Bogomolni et al. (2010) reported that 45% of gray seal stranding mortalities were attributed to human interaction. A UME was declared in November of 2011 that involved at least 137 gray seal stranding mortalities between

137
June 2011 and October 2012 in Maine, New Hampshire, and Massachusetts. The UME was declared closed in February 2013 (https://www.fisheries.noaa.gov/national/marine-life-distress/active-and-closed-unusual-mortality-events). CANADA Between 2012 and 2016, the average annual human-caused mortality and serious injury to gray seals in Canadian waters from commercial harvest was 659 per year though more are permitted (up to 60,000 seals/year, see http://www.dfo-mpo.gc.ca/decisions/fm-2015-gp/atl-001-eng.htm). This included: 0 in 2012, 243 in 2013, 82 in 2014 and 1,381 in 2015, and 1,588 in 2016 (DFO 2017). In addition, between 2012 and 2016, an average of 4,076 nuisance animals per year were killed. This included 5,428 in 2012, and 3,757 in 2013, 3,732 anually in 2014– 2016 (DFO 2017). Lastly, DFO took 159 animals in 2012, 58 animals in 2013, 83 animals in 2014, 42 animals in 2015 and 30 animals in 2016 for scientific collections, for an annual average of 74 animals (DFO 2017).
Table 4. Gray seal (Halichoerus grypus atlantica) stranding mortalities along the U.S. Atlantic coast (2012-2016) with subtotals of animals recorded as pups in parentheses.
State 2012 2013 2014 2015 2016 Total
ME 10 (2) 9 (4) 3 (1) 5 6 33
NH 1 (1) 1 (0) 3 (2) 2 0 7
MA 38 (21) 82 (8) 62 (6) 77 (3) 54 313
RI 13 (5) 11 (2) 8 (1) 7 (1) 4 43
NY 5 (3) 18 (5) 12 (4) 10 1 (1) 46
NJ 4 (0) 7 (2) 7 (6) 7 (6) 3 (1) 28
DE 0 0 3 (3) 3 (3) 0 6
MD 0 0 1 (0) 0 0 1
VA 0 0 0 3 0 3
NC 0 0 2 (2) 0 0 2
Total 71 (32) 128 (21) 101 (25) 114 68 (2) 482
Unspecified seals (all states) 28 25 38 31 13 135
STATUS OF STOCK Gray seals are not listed as threatened or endangered under the Endangered Species Act, and the western North Atlantic stock is not considered strategic under the Marine Mammal Protection Act. The U.S. portion of2012–2016 average annual human-caused mortality and serious injury in U.S. waters does not exceed the portion of PBR in U.S. waters. The status of the gray seal population relative to OSP in U.S. Atlantic EEZ waters is unknown, but the stock’s abundance appears to be increasing in Canadian and U.S. waters. Total fishery-related mortality and serious injury for this stock is not less than 10% of the calculated PBR and, therefore, cannot be considered to be insignificant and approaching zero mortality and serious injury rate. Uncertainties described in the above sections could have an effect on the designation of the status of this stock in U.S waters.

138
REFERENCES CITED Barlas, M.E. 1999. The distribution and abundance of harbor seals (Phoca vitulina concolor) and gray seals
(Halichoerus grypus) in southern New England, winter 1998-summer 1999. M.A. thesis. Graduate School of Arts and Sciences Boston University, Boston, MA. 52 pp.
Barlow, J., S.L. Swartz, T.C. Eagle and P.R. Wade. 1995. U.S. marine mammal stock assessments: Guidelines for preparation, background, and a summary of the 1995 assessments. NOAA Tech. Memo. NMFS-OPR-6. 73 pp.
Bogomolni, A.L., K.R. Pugliares, S.M. Sharp, K. Patchett, C.T. Harry, J.M. LaRocque, K.M. Touhey and M. Moore. 2010. Mortality trends of stranded marine mammals on Cape Cod and southeastern Massachusetts, USA, 2000 to 2006. Dis. Aq. Org. 88:143–155.
Bonner, W.N. 1981. Grey seal Halichoerus grypus Fabricus, 1791. Pages 111–144 in: S.H. Ridgway and R.J. Harrison, (eds.) Handbook of marine mammals, Vol. 2: Seals. Academic Press, London, UK.
Boskovic, R., K.M. Kovacs, M.O. Hammill and B.N. White. 1996. Geographic distribution of mitochondrial DNA haplotypes in grey seals (Halichoerus grypus). Can. J. Zool. 74:1787–1796.
Bowen, W.D., J. McMillan and R. Mohn. 2003. Sustained exponential population growth of grey seals at Sable Island, Nova Scotia. ICES J. Mar. Sci. 60:1265–1274.
Bowen, W.D., J.I. McMillan and W. Blanchard. 2007. Reduced population growth of gray seals at Sable Island: Evidence from pup production and age of primiparity. Mar. Mamm. Sci. 23:48-64.
Bowen, W.D., C. den Heyer, J.I. McMillan, and M.O. Hammill. 2011. Pup production at Scotian Shelf grey seal (Halichoerus grypus) colonies in 2010. DFO Can. Sci. Advis. Sec. Res. Doc. 2011/066: vi + 25pp.
Bravington, M.V. and K.D. Bisack. 1996. Estimates of harbour porpoise bycatch in the Gulf of Maine sink gillnet fishery, 1990-1993. Rep. Int. Whal. Comm. 46:567–574.
Breed, G.A., W.D. Bowen, J.I. McMillan and M.L. Leonard. 2006. Sexual segregation of seasonal foraging habitats in a non-migratory marine mammal. Proc. Royal Soc. B 273:2319–2326.
Breed, G.A., I.D. Jonsen, R.A. Myers, W.D. Bowen, and M.L. Leonard. 2009. Sex-specific, seasonal foraging tactics of adult grey seals (Halichoerus grypus) revealed by state-space analysis. Ecology 90:3209–3221.
Chavez-Rosales, S., M.C. Lyssikatos, and J. Hatch. 2018. Estimates of cetacean and pinniped bycatch in northeast and mid-Atlantic bottom trawl fisheries, 2012-2016. NOAA Tech. Memo NMFS-NE-250. 29pp.
Davies, J.L. 1957. The geography of the gray seal. J. Mamm. 38:297-310. deHart, P.A.P. 2002. The distribution and abundance of harbor seals (Phoca vitulina concolor) in the Woods Hole
region. M.A. thesis. Graduate School of Arts and Sciences, Boston University, Boston, MA. 88 pp. den Heyer, C.E., Lang, S.L.C., Bowen, W.D., and Hammill, M.O. 2017. Pup production at Scotian Shelf grey seal
(Halichoerus grypus) colonies in 2016. DFO Can. Sci. Advis. Sec. Res. Doc. 2017/056. v + 34 p.DFO [Dept. of Fisheries and Oceans]. 2011. Stock assessment of Northwest Atlantic grey seals (Halichoerus grypus), Can. Sci. Advis. Sec. Advis. Rep. 2010/091 12 pp.
DFO [Dept. of Fisheries and Oceans]. 2013. Stock assessment of Northwest Atlantic grey seals (Halichoerus grypus). DFO Can. Sci. Advis. Sec. Sci. Advis. Rep. 2013/008 11 pp
DFO [Dept. of Fisheries and Oceans]. 2014. Stock assessment of Canadian grey seals (Halichoerus grypus). DFO Can. Sci. Advis. Sec. Sci. Advis. Rep. 2014/010 13 pp.
DFO [Dept. of Fisheries and Oceans]. 2017. Stock assessment of Canadian Northwest Atlantic grey seals (Halichoerus grypus). DFO Can. Sci. Advis. Sec. Sci. Advis. Rep. 2017/045 13 pp.
Gilbert, J.R., G.T. Waring, K.M. Wynne and N. Guldager. 2005. Changes in abundance and distribution of harbor seals in Maine, 1981-2001. Mar. Mamm. Sci. 21: 519–535.
Hammill, M.O. 2005. Abundance of Northwest Atlantic grey seals in the Gulf of St. Lawrence and along the Nova Scotia eastern shore. DFO Research Document 2005/036. Canadian Department of Fisheries and Oceans. Ottawa, Ontario, Canada.11pp.http://www.dfo-mpo.gc.ca/csas/Csas/Publications/ResDocs-DocRech/2005/2005_036_e.
Hammill, M.O. and J.F. Gosselin. 2005. Pup production of non-Sable Island grey seals in 2004. DFO Research Document 2005/036. Canadian Department of Fisheries and Oceans. Ottawa, Ontario. 20 pp. http://www.dfo-mpo.gc.ca/csas/Csas/Publications/ResDocs-DocRech/2005/2005_033_e.htm.
Harvey, V., S.D. Côté, and M.O. Hammill 2008. The ecology of 3-D space use in a sexually dimorphic mammal. Ecography 31:371–380.
Harwood, J. and J.H. Prime. 1978. Some factors affecting the size of British grey seal populations. J. Appl. Ecol. 15: 401-411.

139
Hatch, J.M. and C.D. Orphanides 2014. Estimates of cetacean and pinniped bycatch in the 2012 New England sink and mid-Atlantic gillnet fisheries. Northeast Fish Sci Cent Ref Doc.14-02. 20 pp.
Hatch, J.M. and C.D. Orphanides 2015. Estimates of cetacean and pinniped bycatch in the 2013 New England sink and mid-Atlantic gillnet fisheries. Northeast Fish Sci Cent Ref Doc.15-15. 33 pp.
Hatch, J.M. and C.D. Orphanides. 2016. Estimates of cetacean and pinniped bycatch in the 2014 New England sink and mid-Atlantic gillnet fisheries. Northeast Fish Sci Cent Ref Doc. 16-05. 22 pp.
Haug T, M.O. Hammill, and D. Ólafsdóttir, eds. 2007. Grey seals in the North Atlantic and the Baltic. NAMMCO Scientific Publications 6: 7–12.
Josephson, E., F. Wenzel and M.C. Lyssikatos. 2019. Serious injury determinations for small cetaceans and pinnipeds caught in commercial fisheries off the northeast U.S. coast, 2012-2016. Northeast Fish. Sci. Cent. Ref. Doc. 19-05, 27pp.
Katona, S.K., V. Rough and D.T. Richardson. 1993. A field guide to whales, porpoises, and seals from Cape Cod to Newfoundland. Smithsonian Institution Press, Washington, DC. 316 pp.
Klimova, A., C.D. Phillips, K. Fietz, M.T. Olsen, J. Harwood, W. Amos, and J.I. Hoffman 2014. Global population structure and demographic history of the grey seal. Mol. Ecol. 23(16):3999–4017.
Laviguer, L. and M.O. Hammill. 1993. Distribution and seasonal movements of grey seals, Halichoerus grypus, born in the Gulf of St. Lawrence and eastern Nova Scotia shore. Can. Field-Nat. 107:329–340.
Lesage, V. and M.O. Hammill. 2001. The status of the grey seal, Halichoerus grypus, in the Northwest Atlantic. Can. Field-Nat. 115:653–662.
Lelli, B., D.E. Harris, and A-M Aboueissa. 2009. Seal bounties in Maine and Massachusetts, 1888 to 1962. Northeast. Nat. 16:239–254.
Mansfield, A.W. 1966. The grey seal in eastern Canadian waters. Can. Audubon Mag. 28:161–166. Mohn, R. and W.D. Bowen. 1996. Grey seal predation on the eastern Scotian Shelf: Modeling the impact on
Atlantic cod. Can. J. Fish. Aquat. Sci 53:2722–2738. Moxley, J.H., A. Bogomolni, M.O. Hammill, K.M.T. Moore, M.J. Polito, L. Sette, B. Sharp, G.T. Waring, J.R.
Gilbert, P.N. Halpin, and D.W. Johnston. 2017. Google Haul Out: Earth observation imagery and digital aerial surveys in coastal wildlife management and abundance estimation. BioScience, 67: 760-768.
Olsen, M.T., A. Galatius, V. Biard, K. Gregersen, and C.C. Kinze. 2016. The forgotten type specimen of the grey seal [Halichoerus grypus (Fabricius, 1791)] from the island of Amager, Denmark. Zoo. J. Linnean Soc. 178:713–720.
Orphanides, C.D. and Hatch J. 2017. Estimates of cetacean and pinniped bycatch in the 2015 New England sink and mid-Atlantic Gillnet fisheries. Northeast Fish Sci Cent Ref Doc. 17-18. 21 pp.
Orphanides, C.D. 2019. Estimates of cetacean and pinniped bycatch in the 2016 New England sink and mid-Atlantic Gillnet fisheries. Northeast Fish Sci Cent Ref Doc. 19-04. 12 pp.
Puryear, W.B., M. Keogh, N. Hill, J. Moxley, E. Josephson, K.R. Davis, C. Bandoro, D. Lidgard, A. Bogomolni, M.Levin, S. Lang, M. Hammill, D. Bowen, D.W Johnston, T. Romano, G.Waring, and J. Runstadler. 2016. Prevalence of influenza A virus in live-captured North Atlantic gray seals: a possible wild reservoir. Emerg. Microbes Infect. 5:e81. doi:10.1038/emi.2016.77
Read, A.J. 1994. Interactions between cetaceans and gillnet and trap fisheries in the northwest Atlantic. Rep. Int. Whal. Comm. (Special Issue) 15:133–147
Rough, V. 1995. Gray seals in Nantucket Sound, Massachusetts, winter and spring, 1994. Final report to Marine Mammal Commission. Contract T10155615 28 pp.
Stobo, W.T. and K.C.T. Zwanenburg. 1990. Grey seal (Halichoerus grypus) pup production on Sable Island and estimates of recent production in the Northwest Atlantic. Pages 171–184 in: W. D. Bowen, (ed.) Population biology of sealworm (Pseudoterranova decipiens) in relation to its intermediate and seal hosts. Can. Bull. Fish. Aquat. Sci. 222.
Thomas, L., M.O. Hammill, and W.D. Bowen. 2011. Estimated size of the Northwest Atlantic grey seal population, Can. Sci. Advis. Sec. Res. Doc. 2011/017 23 pp.
Trzcinski, M.K., R. Mohn and W.D. Bowen. 2005. Estimation of grey seal population size and trends at Sable Island. DFO Research Document 2005/067. Canadian Department of Fisheries and Oceans. Ottawa, Ontario, Canada. 10pp. http://www.dfo-mpo.gc.ca/csas/Csas/Publications/ResDocs-DocRech/2005/2005_067_e.htm
Wade, P.R. and R.P. Angliss. 1997. Guidelines for assessing marine mammal stocks: Report of the GAMMS Workshop April 3-5, 1996, Seattle, Washington. NOAA Tech. Memo. NMFS-OPR-12. 93 pp.

140
Wood LaFond, S. 2009. Dynamics of recolonization: a study of the gray seal (Halichoerus grypus) in the northeast U.S. Ph.D. dissertation. University of Massachusetts, Boston, MA. 83 p.
Wood, S.A., S. Brault and J.R. Gilbert. 2007. 2002 aerial survey of grey seals in the northeastern United States. Pages 117–121 in: T. Haug, M. Hammill and D. Ólafsdóttir, (eds.) Grey seals in the North Atlantic and Baltic. NAMMCO Sci. Pub. 6, Tromsø, Norway.
Wood, S.A., T.R. Frasier, B.A. McLeod, J.R. Gilbert, B.N. White, W.D. Bowen, M.O. Hammill, G.T. Waring, and S. Brault. 2011. The genetics of recolonization: an analysis of the stock structure of grey seals (Halichoerus grypus) in the Northwest Atlantic. Can. J. Zool. 89:490–497.
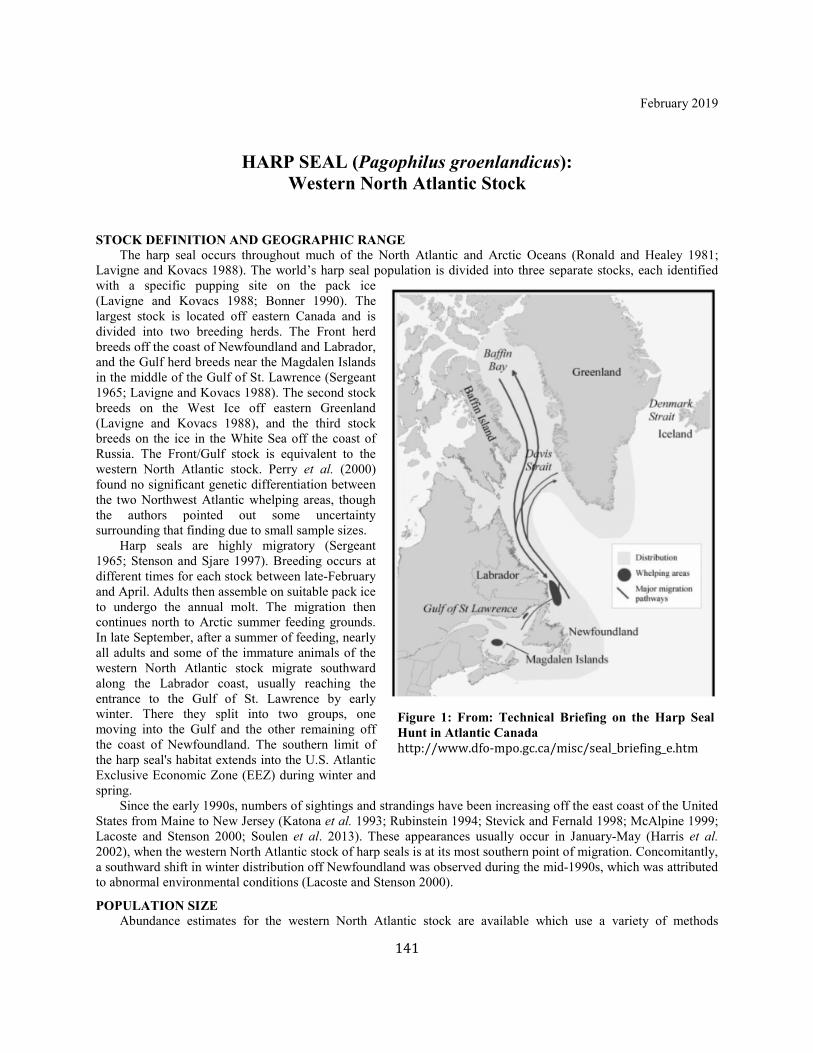
141
February 2019
HARP SEAL (Pagophilus groenlandicus): Western North Atlantic Stock
STOCK DEFINITION AND GEOGRAPHIC RANGE The harp seal occurs throughout much of the North Atlantic and Arctic Oceans (Ronald and Healey 1981;
Lavigne and Kovacs 1988). The world’s harp seal population is divided into three separate stocks, each identified with a specific pupping site on the pack ice (Lavigne and Kovacs 1988; Bonner 1990). The largest stock is located off eastern Canada and is divided into two breeding herds. The Front herd breeds off the coast of Newfoundland and Labrador, and the Gulf herd breeds near the Magdalen Islands in the middle of the Gulf of St. Lawrence (Sergeant 1965; Lavigne and Kovacs 1988). The second stock breeds on the West Ice off eastern Greenland (Lavigne and Kovacs 1988), and the third stock breeds on the ice in the White Sea off the coast of Russia. The Front/Gulf stock is equivalent to the western North Atlantic stock. Perry et al. (2000) found no significant genetic differentiation between the two Northwest Atlantic whelping areas, though the authors pointed out some uncertainty surrounding that finding due to small sample sizes. Harp seals are highly migratory (Sergeant 1965; Stenson and Sjare 1997). Breeding occurs at different times for each stock between late-February and April. Adults then assemble on suitable pack ice to undergo the annual molt. The migration then continues north to Arctic summer feeding grounds. In late September, after a summer of feeding, nearly all adults and some of the immature animals of the western North Atlantic stock migrate southward along the Labrador coast, usually reaching the entrance to the Gulf of St. Lawrence by early winter. There they split into two groups, one moving into the Gulf and the other remaining off the coast of Newfoundland. The southern limit of the harp seal's habitat extends into the U.S. Atlantic Exclusive Economic Zone (EEZ) during winter and spring. Since the early 1990s, numbers of sightings and strandings have been increasing off the east coast of the United States from Maine to New Jersey (Katona et al. 1993; Rubinstein 1994; Stevick and Fernald 1998; McAlpine 1999; Lacoste and Stenson 2000; Soulen et al. 2013). These appearances usually occur in January-May (Harris et al. 2002), when the western North Atlantic stock of harp seals is at its most southern point of migration. Concomitantly, a southward shift in winter distribution off Newfoundland was observed during the mid-1990s, which was attributed to abnormal environmental conditions (Lacoste and Stenson 2000).
POPULATION SIZE Abundance estimates for the western North Atlantic stock are available which use a variety of methods
Figure 1: From: Technical Briefing on the Harp Seal Hunt in Atlantic Canada http://www.dfo-mpo.gc.ca/misc/seal_briefing_e.htm
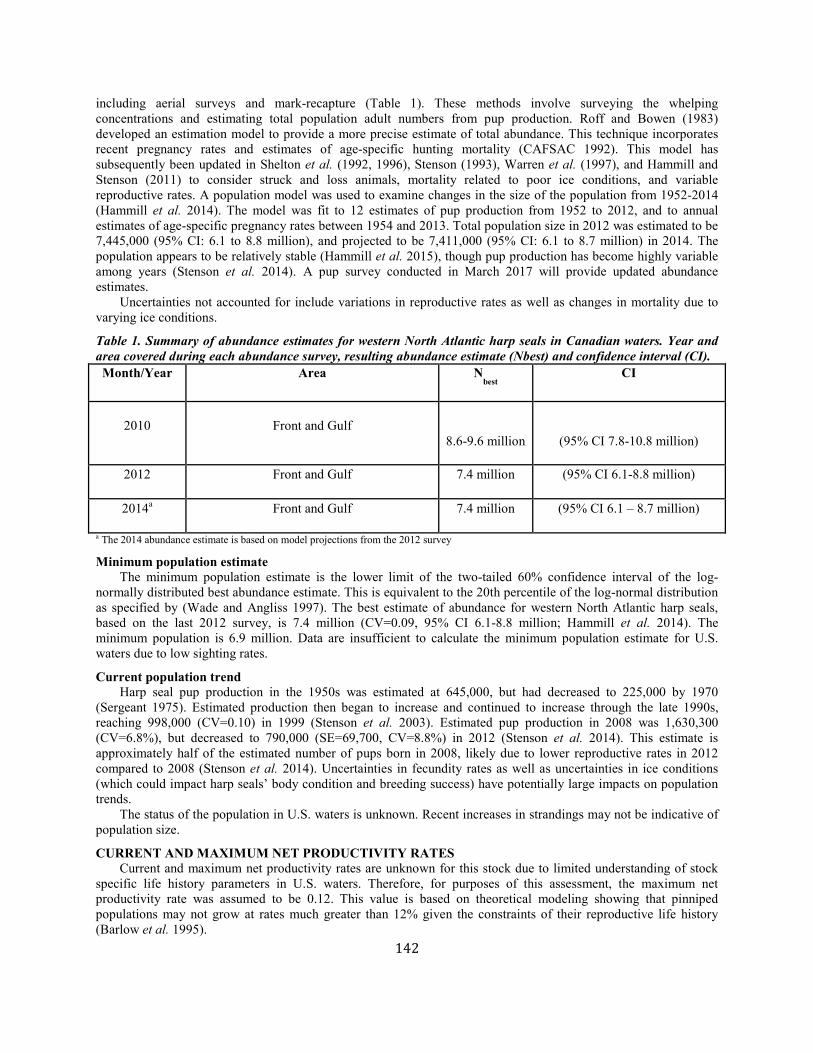
142
including aerial surveys and mark-recapture (Table 1). These methods involve surveying the whelping concentrations and estimating total population adult numbers from pup production. Roff and Bowen (1983) developed an estimation model to provide a more precise estimate of total abundance. This technique incorporates recent pregnancy rates and estimates of age-specific hunting mortality (CAFSAC 1992). This model has subsequently been updated in Shelton et al. (1992, 1996), Stenson (1993), Warren et al. (1997), and Hammill and Stenson (2011) to consider struck and loss animals, mortality related to poor ice conditions, and variable reproductive rates. A population model was used to examine changes in the size of the population from 1952-2014 (Hammill et al. 2014). The model was fit to 12 estimates of pup production from 1952 to 2012, and to annual estimates of age-specific pregnancy rates between 1954 and 2013. Total population size in 2012 was estimated to be 7,445,000 (95% CI: 6.1 to 8.8 million), and projected to be 7,411,000 (95% CI: 6.1 to 8.7 million) in 2014. The population appears to be relatively stable (Hammill et al. 2015), though pup production has become highly variable among years (Stenson et al. 2014). A pup survey conducted in March 2017 will provide updated abundance estimates. Uncertainties not accounted for include variations in reproductive rates as well as changes in mortality due to varying ice conditions.
Table 1. Summary of abundance estimates for western North Atlantic harp seals in Canadian waters. Year and area covered during each abundance survey, resulting abundance estimate (Nbest) and confidence interval (CI). Month/Year Area N
best CI
2010 Front and Gulf
8.6-9.6 million
(95% CI 7.8-10.8 million)
2012 Front and Gulf 7.4 million (95% CI 6.1-8.8 million)
2014a Front and Gulf 7.4 million (95% CI 6.1 – 8.7 million)
a The 2014 abundance estimate is based on model projections from the 2012 survey
Minimum population estimate The minimum population estimate is the lower limit of the two-tailed 60% confidence interval of the log-normally distributed best abundance estimate. This is equivalent to the 20th percentile of the log-normal distribution as specified by (Wade and Angliss 1997). The best estimate of abundance for western North Atlantic harp seals, based on the last 2012 survey, is 7.4 million (CV=0.09, 95% CI 6.1-8.8 million; Hammill et al. 2014). The minimum population is 6.9 million. Data are insufficient to calculate the minimum population estimate for U.S. waters due to low sighting rates.
Current population trend Harp seal pup production in the 1950s was estimated at 645,000, but had decreased to 225,000 by 1970 (Sergeant 1975). Estimated production then began to increase and continued to increase through the late 1990s, reaching 998,000 (CV=0.10) in 1999 (Stenson et al. 2003). Estimated pup production in 2008 was 1,630,300 (CV=6.8%), but decreased to 790,000 (SE=69,700, CV=8.8%) in 2012 (Stenson et al. 2014). This estimate is approximately half of the estimated number of pups born in 2008, likely due to lower reproductive rates in 2012 compared to 2008 (Stenson et al. 2014). Uncertainties in fecundity rates as well as uncertainties in ice conditions (which could impact harp seals’ body condition and breeding success) have potentially large impacts on population trends. The status of the population in U.S. waters is unknown. Recent increases in strandings may not be indicative of population size.
CURRENT AND MAXIMUM NET PRODUCTIVITY RATES Current and maximum net productivity rates are unknown for this stock due to limited understanding of stock specific life history parameters in U.S. waters. Therefore, for purposes of this assessment, the maximum net productivity rate was assumed to be 0.12. This value is based on theoretical modeling showing that pinniped populations may not grow at rates much greater than 12% given the constraints of their reproductive life history (Barlow et al. 1995).
143
POTENTIAL BIOLOGICAL REMOVAL Potential Biological Removal (PBR) is the product of minimum population size, one-half the maximum productivity rate, and a recovery factor (MMPA Sec. 3. 16 U.S.C. 1362; Wade and Angliss 1997). The minimum population size in U.S. waters is unknown. The maximum productivity rate is 0.12, the default value for pinnipeds. The recovery factor, which accounts for endangered, depleted, threatened stocks, or stocks of unknown status relative to optimum sustainable population (OSP) was set at 1.0 the population is increasing. PBR for the western North Atlantic harp seal in U.S. waters is unknown. The PBR for the stock in U.S. waters is unknown.
ANNUAL HUMAN-CAUSED MORTALITY AND SERIOUS INJURY For the period 2012–2016 the total estimated annual human caused mortality and serious injury to harp seals was 225,687. This is derived from three components: 1) 57 harp seals (CV=0.23) from the observed U.S. fisheries (Table 2a); 2) an average of 2 stranded seals from 2012-2016 that showed signs of non-fishing human interaction; and 3) an average catch of 225,628 seals from 2012-2016 by Canada and Greenland, including bycatch in the lumpfish fishery (Table 2b). Uncertainties in bycatch estimates are small compared to the magnitude of commercial and subsistence harvest in Canada. A potential source of unquantified human-caused mortality is the mortality associated with poor ice conditions due to climate change.
Fishery Information U.S. Detailed fishery information is reported in the Appendix III.
Northeast Sink Gillnet: During 2012–2016, 28 mortalities were observed in the northeast sink gillnet fishery (Orphanides 2019, Hatch and Orphanides 2014, 2015, 2016; Orphanides and Hatch 2017). There were no observed injuries of harp seals in the Northeast region during 2012–2016 to assess using new serious injury criteria. See Table 2a for bycatch estimates and observed mortality and serious injury for the current 5-year period, and Appendix V for historical bycatch information.
Table 2a. Summary of the incidental mortality of harp seal (Pagophilus groenlandicus) by commercial fishery including the years sampled (Years), the type of data used (Data Type), the annual observer coverage (Observer Coverage), the mortalities recorded by on-board observers (Observed Mortality), the estimated annual mortality (Estimated Mortality), the estimated CV of the annual mortality (Estimated CVs) and the mean annual mortality (CV in parentheses).
Fishery Years Data Type a
Observer Coverage
b
Observed Serious Injuryc
Observed Mortality
Estimated Serious Injury
Estimated Mortality
Estimated Combined Mortality
Estimated CVs
Mean Annual
Mortality
Northeast Sink
Gillnet
2012
Obs. Data, Weighout, Logbooks
0.15 0 0 0 0 0 0 57
(0.23)
2013 0.11 0 2 0 22 22 0.75 2014 0.18 0 9 0 57 57 0.42 2015 0.14 0 12 0 119 119 0.34 2016 0.1 0 5 0 85 85 0.50
TOTAL - - - - - - - - - 57 (0.23)
a. Observer data (Obs. Data) are used to measure bycatch rates, and the data are collected within the Northeast Fisheries Observer Program. The Northeast Fisheries Observer Program collects landings data (Weighout) and total landings are used as a measure of total effort for the sink gillnet fishery. Mandatory logbook (Logbook) data are used to determine the spatial distribution of fishing effort in the Northeast sink gillnet fishery. b. The observer coverages for the Northeast sink gillnet fishery and the mid-Atlantic coastal sink gillnet fisheries are ratios based on tons of fish landed. North Atlantic bottom trawl fishery coverages are ratios based on trips. c. Serious injuries were evaluated for the 2012–2016 period and include both at-sea monitor and traditional observer data (Josephson et al. 2019).
Other Mortality U.S. From 2012 to 2016, 174 harp seal stranding mortalities were reported (Table 3; NOAA National Marine Mammal Health and Stranding Response Database unpublished data, accessed 03 November 2017). Ten (5.7%) of the mortalities during this five-year period showed signs of human interaction (1in 2012, 2 in 2013, 4 in 2014, 2 in 2015, and 1 in 2016), 1 of which with some sign of fishery interaction (2013). Harris and Gupta (2006) analyzed NMFS 1996-2002 stranding data and suggested that the distribution of harp seal strandings in the Gulf of Maine was

144
consistent with the species’ seasonal migratory patterns in this region. CANADA Harp seals have been commercially hunted since the mid-1800s in the Canadian Atlantic (Stenson 1993). Between 2003 and 2010 the harp seal total allowable catch (TAC) in Canada ranged from 270,000 to 330,000 (ICES 2016). In 2011 the TAC was raised to 400,000 and since then, has remained at this level each year. The TAC includes allocations for aboriginal harvesters (6,840), development of new products (20,000), and personal use (2,000). There is no specific allocation or quotas for catches in Arctic Canada. Commercial catches in Canada have remained below 80,000 since 2009 (Table 2b).
Table 2b. Summary of the Canadian directed catch and bycatch mortality of Northwest Atlantic harp seal (Pagophilus groenlandicus) by year.
Fishery 2012 2013 2014 2015 2016 Average
Commercial catchesa 71,460 90,703 54,830 35,304 66,865 63,832
Struck and lostb 64,664 86,970 66,946 81,609 83,268 76,691
Greenland subsistence catchc 59,124 80,102 62,147 78,749 78,749 71,774
Canadian Arcticd 1,000 1,000 1,000 1,000 1,000 1,000
Newfoundland lumpfishe 12,330 12,330 12,330 12,330 12,330 12,330
Total 208,578 271,105 197,253 208,992 242,212 225,628
a. ICES 2016 b. Animals that are killed but not recovered and reported. Values include seals from both Canada and Greenland (ICES 2016). c. ICES 2016. Catches in 2015 and 2016 are an average from 2005-2014 d. ICES 2016. e. Estimates of bycatch levels in the last decade are not available and so the average annual level during the previous decade (12,330) has been assumed (DFO 2014)
Table 3. Harp seal (Pagophilus groenlandicus) stranding mortalities a along the U.S. Atlantic coast (2012–2016) with subtotals of animals recorded as pups in parentheses.
State 2012 2013 2014 2015 2016 Total
Maine 0 2 2 (1) 1 4 9
New Hampshire 0 1 0 0 2 3
Massachusetts 4 6 (1) 28 17 19 (1) 74
Rhode Island 0 1 9 4 3 17
Connecticut 0 0 0 0 1 1
New York 1 9 18 12 1 41
New Jersey 0 2 1 3 1 7
Delaware 0 1 0 0 0 1
Maryland 0 0 0 1 0 1
145
State 2012 2013 2014 2015 2016 Total
Virginia 0 1 9 4 1 15
North Carolina 0 2 1 2 2 (1) 5
Total 5 23 68 44 34 174
Unspecified seals (all states)
28 25 38 31 13 97
a. Mortalities include animals found dead and animals that were euthanized, died during handling, or died in the transfer to, or upon arrival at, rehab facilities.
STATUS OF STOCK Harp seals are not listed as threatened or endangered under the Endangered Species Act and the western North Atlantic stock is not considered strategic under the Marine Mammal Protection Act. The level of human-caused mortality and serious injury in the U.S. Atlantic EEZ is low relative to the total stock size. The status of the harp seal stock, relative to OSP, in the U.S. Atlantic EEZ is unknown, but the stock’s abundance appears to have stabilized. The total U.S. fishery-related mortality and serious injury for this stock is very low relative to the stock size and can be considered insignificant and approaching zero mortality and serious injury rate. Based on the low levels of uncertainties described in the above sections, it expected these uncertainties will have little effect on the status of this stock.
REFERENCES CITED Angliss, R.P. and D.P. DeMaster. 1998. Differentiating serious and non-serious injury of marine mammals taken
incidental to commercial fishing operations: Report of the serious injury workshop, 1-2 April 1997, Silver Spring, MD. NOAA Tech. Memo. NMFS-OPR-13. 48 pp.
Barlow, J., S.L. Swartz, T.C. Eagle and P.R. Wade. 1995. U.S. Marine Mammal Stock Assessments: Guidelines for preparation, background, and a summary of the 1995 assessments. NOAA Tech. Memo. NMFS-OPR-6. 73 pp.
Bonner, W.N. 1990. The natural history of seals. Facts on File, New York. 196 pp. CAFSAC 1992. Update on population estimates of harp seal in the Northwest Atlantic. Canadian Atlantic Fisheries
Scientific Advisory Committee. DFO 2014. Updated status of Northwest Atlantic harp seals, (Pagophilus groenlandicus). Department of Fisheries
and Oceans. DFO Can. Sci. Advis. Sec. Sci. Rep. 2014/011. 15 pp. Hammill, M.O. and Stenson, G.B. 2011. Estimating abundance of Northwest Atlantic harp seals, examining the
impact of density dependence. DFO Can. Sci. Advis. Sec. Res. Doc. 2011/011. Hammill, M.O., Stenson, G.B., Mosnier A., and Doniol-Valcroze, T. 2014. Abundance estimates of Northwest
Atlantic harp seals and management advice for 2014. DFO Can. Sci. Advis. Sec. Res. Doc. 2014/022. v + 33 p.
Hammill, M.O, Stenson, G.B., Doniol-Valcroze, T., Mosnier, A. 2015. Conservation of northwest Atlantic harp seals: Past success, future uncertainty? Biol. Cons. 192:181-191.
Harris, D.E. and S. Gupta. 2006. GIS-based analysis of ice-breeding seal strandings in the Gulf of Maine. Northeast. Nat. 13: 403-420.
Harris, D.E., B. Lelli and G. Jakush. 2002. Harp seal records from the southern Gulf of Maine: 1997-2001. Northeast. Nat. 9(3): 331-340.
Hatch, J.M. and C.D. Orphanides 2014. Estimates of cetacean and pinniped bycatch in the 2012 New England sink and mid-Atlantic gillnet fisheries. Northeast Fish. Sci. Cent. Ref. Doc.14-02. 20 pp.
Hatch, J.M. and C.D. Orphanides. 2015. Estimates of cetacean and pinniped bycatch in the 2013 New England sink and mid-Atlantic gillnet fisheries. Northeast Fish. Sci. Cent. Ref. Doc.15-15. 33 pp.
Hatch, J.M. and C.D. Orphanides. 2016. Estimates of cetacean and pinniped bycatch in the 2014 New England sink and mid-Atlantic gillnet fisheries. Northeast Fish Sci Cent Ref Doc.16-05. 22 pp.
ICES 2016. Report of the ICES/NAFO/NAMMCO Working Group on Harp and Hooded Seals (WGHARP), 26-30 September 2016, ICES HQ, Copenhagen, Denmark. ICES CM 2016/ACOM:21.85 pp.

146
Josephson, E., F. Wenzel and M.C. Lyssikatos. 2019. Serious injury determinations for small cetaceans and pinnipeds caught in commercial fisheries off the northeast U.S. coast, 2012-2016. Northeast Fish. Sci. Cent. Ref. Doc. 19-05, 27pp.
Katona, S.K., V. Rough and D.T. Richardson. 1993. A field guide to whales, porpoises, and seals from Cape Cod to Newfoundland. Smithsonian Institution Press, Washington, DC. 316 pp.
Lacoste, K.N. and G.B. Stenson. 2000. Winter distribution of harp seals (Phoca groenlandica) off eastern Newfoundland and southern Labrador. Polar Biol. 23: 805-811.
Lavigne, D.M. and K.M. Kovacs. 1988. Harps and hoods: Ice breeding seals of the Northwest Atlantic. University of Waterloo Press, Waterloo, Ontario, Canada. 174 pp.
McAlpine, D.F. 1999. Increase in extralimital occurrences of ice-breeding seals in the northern Gulf of Maine region: more seals or fewer fish. Mar. Mamm. Sci. 15: 906-911.
Orphanides, C.D. and Hatch J. 2017. Estimates of cetacean and pinniped bycatch in the 2015 New England sink and mid-Atlantic Gillnet fisheries. Northeast Fish Sci Cent Ref Doc. 17-18. 21 pp.
Orphanides, C.D. 2019. Estimates of cetacean and pinniped bycatch in the 2016 New England sink and mid-Atlantic Gillnet fisheries. Northeast Fish Sci Cent Ref Doc. 19-04. 12 pp.
Perry E.A., G. B. Stenson, S.E. Bartlett, W.S. Davidson and S.M. Carr. 2000. DNA sequence identifies genetically distinguishable populations of harp seals (Pagophilus groenlandicus) in the Northwest and Northeast Atlantic. Mar. Biol. 137:53-58.
Roff, D.A. and W.D. Bowen. 1983. Population dynamics and management of the Northwest Atlantic harp seal. Can. J. Fish. Aquat. Sci 40: 919-932.
Ronald, K. and P.J. Healey. 1981. Harp Seal. Pages 55-87 in: S. H. Ridgway and R. J. Harrison, (eds.) Handbook of marine mammals, Vol. 2: Seals. Academic Press, New York.
Rubinstein, B. 1994. An apparent shift in distrubution of ice seals, Phoca groenlandica, Cystophora cristata, and Phoca hispida, toward the east coast of the United States. MA thesis. Department of Biology. Boston, MA, Boston University.
Sergeant, D.E. 1965. Migrations of harp seal Pagophilus groenlandicus (Erxleben) in the Northwest Atlantic. J. Fish. Res. Board Can 22: 433-464.
Sergeant, D.E. 1975. Estimating numbers of harp seals. Rapp. P.-v. Reun. Cons. int Explor. Mer. 169(274-280). Shelton, P.A., N.G. Caddigan and G.B. Stenson. 1992. Model estimates of harp seal population trajectories in the
Northwest Atlantic. CAFSAC Res. Doc. 92/89. 23 pp. Shelton, P.A., G.B. Stenson, B. Sjare and W.G. Warren. 1996. Model estimates of harp seal numbers-at-age for the
Northwest Atlantic. NAFO Sci. Coun. Studies 26: 1-14 Soulen B.K., K. Cammen, T.F. Schultz, and D.W. Johnston. 2013. Factors affecting harp seal (Pagophilus
groenlandicus) strandings in the northwest Atlantic PlosOne http://dx.doi.org/10.1371/journal.pone.0068779
Stenson, G.B. 1993. The status of pinnipeds in the Newfoundland region. NAFO SCR Doc. 93/34. Stenson, G.B. and B. Sjare. 1997. Seasonal distribution of harp seals, Phoca groenlandica, in the Northwest
Atlantic. ICES C.M. 1997/CC:10 (Biology and Behavior II). 23 pp. Stenson, G.B., L.P. Rivest, M.O. Hammill, J. F. Gosselin and B. Sjare 2003. Estimating pup production of harp
seals, Pagophilus groenlandicus, in the Northwest Atlantic. Mar. Mamm. Sci. 19(1): 141-160. Stenson, G. B. 2008. Recent catches of harp seals (Pagophilus groenlandicus) in the Northwest Atlantic DFO. Can.
Sci. Advisory Sec. Res. Doc. 2008/080. Stenson, G.B., M.O. Hammill, J.W. Lawson, and J.F. Gosselin 2014. Estimating pup production of northwest
Atlantic harp seals, Pagophilus groenlandicus, in 2012. DFO Can. Sci. Advis. Sec. Res. Doc. 2014/057.v + 43 pp.
Stevick, P.T. and T.W. Fernald. 1998. Increase in extralimital records of harp seals in Maine. Northeast. Nat. 5(1): 75-82.
Wade, P.R. and R.P. Angliss. 1997. Guidelines for assessing marine mammal stocks: Report of the GAMMS Workshop April 3-5, 1996, Seattle, Washington. NOAA Tech. Memo. NMFS-OPR-12. 93 pp.
Warren, W.G., P.A. Shelton and G.B. Stenson. 1997. Quantifying some of the major sources of uncertainty associated with estimates of harp seal prey consumption. Part 1: Uncertainty in the estimates of harp seal population size. J. Northwest Atl. Fish. Sci. 22: 289-302.
147
February 2019
HOODED SEAL (Cystophora cristata): Western North Atlantic Stock
STOCK DEFINITION AND GEOGRAPHIC RANGE The hooded seal occurs throughout much of the North Atlantic and Arctic Oceans (King 1983) preferring deeper water and occurring farther offshore than harp seals (Sergeant 1976; Campbell 1987; Lavigne and Kovacs 1988; Stenson et al. 1996). The world’s hooded seal population has been divided by ICES into three separate stocks, each identified with a specific breeding site (Lavigne and Kovacs 1988; Stenson et al. 1996): Northwest Atlantic, Greenland Sea (“West Ice”), and White Sea (“East Ice”). The Western North Atlantic stock (synonymous with the ICES Northwest Atlantic stock), whelps off the coast of eastern Canada and is divided into three whelping areas. The Front herd (largest) breeds off the coast of Newfoundland and Labrador, Gulf herd breeds in the Gulf of St. Lawrence, and the third area is in the Davis Strait. Animals breeding on the “West Ice” are thought to belong to the Northeast Atlantic stock (Hammill and Stenson 2006), though genetics analyses suggest that there is some mixing between the Northeast and Northwest stocks (Coltman et al. 2007). Hooded seals are highly migratory and may wander as far south as Puerto Rico (Mignucci-Giannoni and Odell 2001), with increased occurrences from Maine to Florida. These appearances usually occur between January and May in New England waters, and in summer and autumn off the southeast U.S. coast and in the Caribbean (McAlpine et al. 1999; Harris et al. 2001; Mignucci-Giannoni and Odell 2001). Although it is not known which stock these seals come from, it is known that during spring, the northwest Atlantic stock of hooded seals are at their southernmost point of migration in the Gulf of St. Lawrence. Hooded seals remain on the Newfoundland continental shelf during winter/spring (Stenson et al. 1996). Breeding occurs at about the same time in March for each stock. Three of 4 hooded seals stranded, satellite tagged, and released in the United States in 2004 migrated to the eastern edge of the Scotian Shelf and the two that were monitored until June ended up on the southeast tip of Greenland. The fourth traveled into the Gulf of St. Lawrence. (WHALENET at http://whale.wheelock.edu). Adults from all stocks assemble in the Denmark Strait to molt between late June and August (King 1983; ICES 1995), and following this, the seals disperse widely (Andersen et al. 2010). Some move south and west around the southern tip of Greenland, and then north along the west coast of Greenland. Others move to the east and north between Greenland and Svalbard during late summer and early fall (Lavigne and Kovacs 1988). Baffin Bay and Davis Strait appear to be important foraging areas for hooded seals after the molt (Anderson et al. 2010).
POPULATION SIZE The number of hooded seals in the western North Atlantic is derived from pup production estimates produced from whelping pack surveys. In the most recent assessment (Hammill and Stenson 2006), a model was fit to estimates of pup production derived from aerial surveys between 1984 – 2005. The model incorporates estimates of age-specific reproductive rates and removals, fit to these pup production estimates, to estimate total population levels in Canada. The most Pup production at the Front was estimated to be 107,900 (SE=18,800, 95% CI: 70,600-143,300) and the total population 535,800 (SE=93,600 95%CI; 350,600-711,300). For all herds, which includes assumptions about the number of hooded seals in the Davis Straight, pup production was estimated to be 120,100 (SE=13,800 95%CI: 94,100-147,900), and the total population to be 593,500 (SE=67,200 95%CI: 465,600-728,300). There is uncertainty in these estimates due to limited surveys, limited reproductive data, and uncertainty in stock relationships and harvest statistics. In Canada the Northwest Atlantic Stock of hooded seals is considered to be “data poor”, which means that there is no current information (≤5 years old) on fecundity and/or mortality to determine sustainable levels of exploitation and there is not more than three abundance estimates over a 15-year period, the last estimate being obtained within the past 5 years (Hammill and Stenson 2007).
Minimum population estimate The minimum population estimate is the lower limit of the two-tailed 60% confidence interval of the log-normally distributed best abundance estimate. This is equivalent to the 20th percentile of the log-normal distribution as specified by Wade and Angliss (1997). The best estimate of abundance for western North Atlantic hooded seals is 593,500 (CV=0.10). The minimum population estimate is 543,549. Present data are insufficient to calculate the minimum population estimate for U.S. waters.
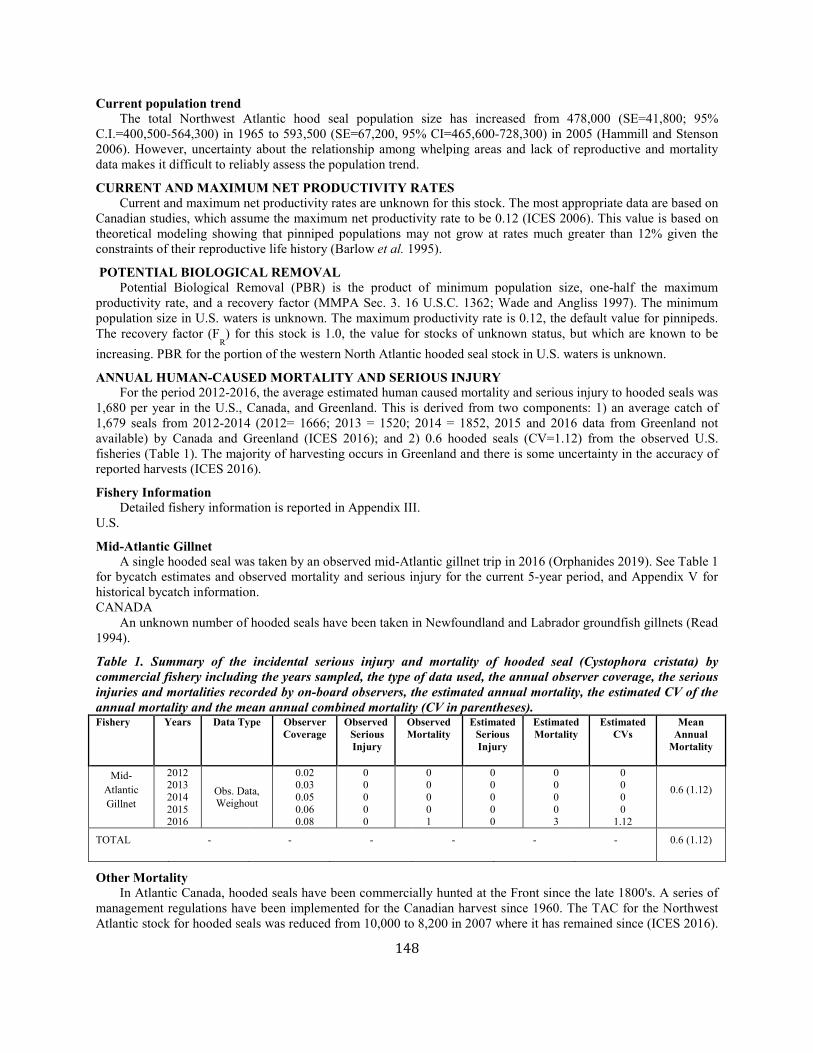
148
Current population trend The total Northwest Atlantic hood seal population size has increased from 478,000 (SE=41,800; 95% C.I.=400,500-564,300) in 1965 to 593,500 (SE=67,200, 95% CI=465,600-728,300) in 2005 (Hammill and Stenson 2006). However, uncertainty about the relationship among whelping areas and lack of reproductive and mortality data makes it difficult to reliably assess the population trend.
CURRENT AND MAXIMUM NET PRODUCTIVITY RATES Current and maximum net productivity rates are unknown for this stock. The most appropriate data are based on Canadian studies, which assume the maximum net productivity rate to be 0.12 (ICES 2006). This value is based on theoretical modeling showing that pinniped populations may not grow at rates much greater than 12% given the constraints of their reproductive life history (Barlow et al. 1995).
POTENTIAL BIOLOGICAL REMOVAL Potential Biological Removal (PBR) is the product of minimum population size, one-half the maximum productivity rate, and a recovery factor (MMPA Sec. 3. 16 U.S.C. 1362; Wade and Angliss 1997). The minimum population size in U.S. waters is unknown. The maximum productivity rate is 0.12, the default value for pinnipeds. The recovery factor (F
R) for this stock is 1.0, the value for stocks of unknown status, but which are known to be
increasing. PBR for the portion of the western North Atlantic hooded seal stock in U.S. waters is unknown.
ANNUAL HUMAN-CAUSED MORTALITY AND SERIOUS INJURY For the period 2012-2016, the average estimated human caused mortality and serious injury to hooded seals was 1,680 per year in the U.S., Canada, and Greenland. This is derived from two components: 1) an average catch of 1,679 seals from 2012-2014 (2012= 1666; 2013 = 1520; 2014 = 1852, 2015 and 2016 data from Greenland not available) by Canada and Greenland (ICES 2016); and 2) 0.6 hooded seals (CV=1.12) from the observed U.S. fisheries (Table 1). The majority of harvesting occurs in Greenland and there is some uncertainty in the accuracy of reported harvests (ICES 2016).
Fishery Information Detailed fishery information is reported in Appendix III. U.S.
Mid-Atlantic Gillnet A single hooded seal was taken by an observed mid-Atlantic gillnet trip in 2016 (Orphanides 2019). See Table 1 for bycatch estimates and observed mortality and serious injury for the current 5-year period, and Appendix V for historical bycatch information. CANADA An unknown number of hooded seals have been taken in Newfoundland and Labrador groundfish gillnets (Read 1994).
Table 1. Summary of the incidental serious injury and mortality of hooded seal (Cystophora cristata) by commercial fishery including the years sampled, the type of data used, the annual observer coverage, the serious injuries and mortalities recorded by on-board observers, the estimated annual mortality, the estimated CV of the annual mortality and the mean annual combined mortality (CV in parentheses). Fishery Years Data Type
Observer Coverage
Observed Serious Injury
Observed Mortality
Estimated Serious Injury
Estimated Mortality
Estimated CVs
Mean Annual
Mortality
Mid-Atlantic Gillnet
2012 2013 2014 2015 2016
Obs. Data, Weighout
0.02 0.03 0.05 0.06 0.08
0 0 0 0 0
0 0 0 0 1
0 0 0 0 0
0 0 0 0 3
0 0 0 0
1.12
0.6 (1.12)
TOTAL - - - - - - 0.6 (1.12)
Other Mortality In Atlantic Canada, hooded seals have been commercially hunted at the Front since the late 1800's. A series of management regulations have been implemented for the Canadian harvest since 1960. The TAC for the Northwest Atlantic stock for hooded seals was reduced from 10,000 to 8,200 in 2007 where it has remained since (ICES 2016).

149
The taking of “blueback” pups (animals <14 months) has been prohibited since 1987 (Hammill and Stenson 2016). From 2012 to 2016, 4 hooded seal stranding mortalities were reported, with the majority in Massachusetts (Table 2; NOAA National Marine Mammal Health and Stranding Response Database, accessed 03 November 2017)). Several other hooded seal strandings were responded to and the seal left at site or brought to rehabilitation. None of the mortalities during this five year period showed signs of human interaction. Extralimital strandings have also been reported off the southeast U.S., North Carolina to Florida, and in the Caribbean (McAlpine et al. 1999; Mignucci-Giannoni and Odell 2001; NMFS, unpublished data). Harris and Gupta (2006) analyzed NMFS 1996-2002 stranding data and suggest that the distribution of hooded seal stranding in the Gulf of Maine is consistent with the species seasonal migratory patterns in this region.
Table 2. Hooded seal (Cystophora cristata) stranding mortalities along the U.S. Atlantic coast (2012-2016) with subtotals of animals recorded as pups in parentheses.
State 2012 2013 2014 2015 2016 Total
MA 0 2 1 0 0 3
NY 1 (1) 0 0 0 0 1
Total 1 2 1 0 0 4
Unspecified seals (all states) 28 25 38 31 13 135
STATUS OF STOCK The status of hooded seals relative to OSP in U.S. Atlantic EEZ is unknown, and the trend in the stock’s abundance is uncertain. The species not listed as threatened or endangered under the Endangered Species Act. The total U.S. fishery-related mortality and serious injury for this stock is very low relative to the stock’s size and can be considered insignificant and approaching zero mortality and serious injury rate. Because the level of human-caused mortality and serious injury is also low relative to overall stock size, this is not a strategic stock.
REFERENCES CITED Andersen, J M; Y.F. Wiersma, G. Stenson, and G; M.O. Hammill. 2010. Movement patterns of hooded Seals
(Cystophora cristata) in the northwest Atlantic Ocean during the post-moult and pre-breed season. J. Northw. Atl. Fish. Sci. 42:1–11.
Coltman, D. W., G. Stenson, M.O. Hamill, T. Haug, S. Davis, and T.L. Fulton. 2007. Panmitic population structure in the hooded seal (Cystophora cristata). Mol. Ecol. 16:1639–1648.
Hammill, M.O. and G.B. Stenson. 2007. Application of the Precautionary Approach and Conservation Reference Points to the management of Atlantic seals. ICES Journal of Marine Science, 64: 702–706.
Hammill, M.O. and G.B. Stenson. 2006. Abundance of Northwest Atlantic hooded seals (1960–2005). DFO Can. Sci. Advis. Sec. Res. Doc. 2006/068. 19p.
Harris, D.E. and S. Gupta. 2006. GIS-based analysis of ice-breeding seal strandings in the Gulf of Maine. Northeast. Nat.13:403-420.
Harris, D.E., B. Lelli, G. Jakush, and G. Early. 2001. Hooded seal (Cystophora cristata) records from the southern Gulf of Maine. Northeast. Nat. 8:427-434.
ICES 2016. Report of the ICES/NAFO/NAMMCO Working Group on Harp and Hooded Seals (WGHARP), 26-30 September 2016, ICES HQ, Copenhagen, Denmark. ICES CM 2016/ACOM:21.85 pp.
ICES. 1995. Report of the Joint ICES/NAFO Working Group on Harp and Hooded Seals. 5-9 June 1995, Dartmouth, Nova Scotia Canada. NAFO SCS Doc. 95/16. Serial No. N2569. 40 pp.
King, J.E. 1983. Seals of the World. Cornell University Press, Ithaca, NY, 240 pp. Lavigne, D.M. and K.M. Kovacs. 1988. Harps and Hoods Ice Breeding Seals of the Northwest Atlantic. University
of Waterloo Press, Waterloo, Ontario, Canada, 174 pp.

150
Mignucci-Giannoni, A.A. and D.K. Odell. 2001. Tropical and subtropical records of hooded seals (Cystophora cristata) dispel the myth of extant Caribbean monk seals (Monachus tropicalis). Carib. Bull. Mar. Sci., 68:47-58.
McAlpine, D.F., P.T. Stevick, L.D. Murison, and S.D. Turnbull. 1999. Extralimital records of hooded seals (Cystophora cristata) from the Bay of Fundy and northern Gulf of Maine. Northeast. Nat. 6: 225-230.
Orphanides, C.D. 2019. Estimates of cetacean and pinniped bycatch in the 2016 New England Sink Gillnet fishery and mid-Atlantic gillnet fisheries. Northeast Fish. Sci. Cent. Ref. Doc. 19-04; 12pp.
Read, A.J. 1994. Interactions between cetaceans and gillnet and trap fisheries in the northwest Atlantic. Rep. int. Whal. Commn (Special Issue) 15:133-147.
Sergeant, D.E. 1976 History and present status of populations of harp and hooded seals. Biol. Conserv. 10:95-117. Stenson, G.B., R.A. Myers, I-H. Ni and W.G. Warren. 1996. Pup production of hooded seals (Cystophora cristata)
in the Northwest Atlantic. NAFO Sci. Coun. Studies 26:105-114. Wade, P.R., and R.P. Angliss. 1997. Guidelines for assessing marine mammal stocks: Report of the GAMMS
Workshop April 3-5, 1996, Seattle, Washington. NOAA Tech. Memo. NMFS-OPR-12, 93 pp. Available at: http://nmml.afsc.noaa.gov/library/gammsrep/gammsrep.htm.

151
February 2019
COMMON BOTTLENOSE DOLPHIN (Tursiops truncatus truncatus) Terrebonne-Timbalier Bay Estuarine System Stock
NOTE – NMFS is in the process of writing individual stock assessment reports for each of the 31 bay, sound and estuary stocks of common bottlenose dolphins in the Gulf of Mexico.
STOCK DEFINITION AND GEOGRAPHIC RANGE Common bottlenose dolphins are distributed throughout the bays, sounds, and estuaries (BSE) of the Gulf of Mexico (Mullin 1988). Long-term (year-round, multi-year) residency by at least some individuals has been reported from nearly every estuarine site where photographic identification (photo-ID) or tagging studies have been conducted in the Gulf of Mexico (e.g., Irvine and Wells 1972; Shane 1977; 1990; 2004; Gruber 1981; Irvine et al. 1981; Wells 1986; 1991; 2003; Wells et al. 1987; 1996a,b; 1997; Scott et al. 1990; Bräger 1993; Bräger et al. 1994; Fertl 1994; Weller 1998; Maze and Würsig 1999; Lynn and Würsig 2002; Hubard et al. 2004; Irwin and Würsig 2004; Balmer et al. 2008; Urian et al. 2009; Bassos-Hull et al. 2013). In many cases, residents occur predominantly within estuarine waters, with limited movements through passes to the Gulf of Mexico (Shane 1977; 1990; Gruber 1981; Irvine et al. 1981; Maze and Würsig 1999; Lynn and Würsig 2002; Fazioli et al. 2006; Bassos-Hull et al. 2013; Wells et al. 2017). Genetic data also support the presence of relatively discrete BSE stocks (Duffield and Wells 2002; Sellas et al. 2005). Sellas et al. (2005) examined population subdivision among dolphins sampled in Sarasota Bay, Tampa Bay, and Charlotte Harbor, Florida; Matagorda Bay, Texas; and the coastal Gulf of Mexico (1–12 km offshore) from just outside Tampa Bay to the south end of Lemon Bay, and found evidence of significant population differentiation among all areas on the basis of both mitochondrial DNA control region sequence data and nine nuclear microsatellite loci. The Sellas et al. (2005) findings support the identification of BSE populations distinct from those occurring in adjacent Gulf coastal waters. Differences in reproductive seasonality from site to site also suggest genetic-based distinctions among areas (Urian et al. 1996). Photo-ID and genetic data from several inshore areas of the southeastern United States also support the existence of resident estuarine animals and differentiation between animals biopsied along the Atlantic coast and those biopsied within estuarine systems at the same latitude (Caldwell 2001; Gubbins 2002; Zolman 2002; Mazzoil et al. 2005; Litz 2007; Rosel et al. 2009). The Terrebonne-Timbalier Bay Estuarine System (TTBES) is a shallow (mean depth = 2 m) estuarine system encompassing an area of approximately 1,761 km2 in central Louisiana (U.S. EPA 1999; Figure 1). This estuarine system is connected to the Gulf of Mexico by a series of passes (Wine Island Pass, Cat Island Pass, and Whiskey Pass). Freshwater input comes from the Atchafalaya River and Bay via the Houma Ship Channel and Grand Bayou Canal (CWPPRA 2017). Timbalier-Terrebonne Bay, together with the Barataria Bay system, has been selected as an
Figure 1. Geographic extent of the Terrebonne-Timbalier Bay Estuarine System Stock, located on the coast of Louisiana. The borders are denoted by solid lines.
152
estuary of national significance by the Environmental Protection Agency National Estuary Program (see http://www.btnep.org/BTNEP/home.aspx). Thus, a comprehensive conservation and management plan has been developed and is being implemented through a partnership of local, state, and federal representatives as well as community stakeholders, to restore and protect the estuary (Lester and Gonzalez 2011). The marshes supply breeding and nursery grounds for an assortment of commercial and recreational species of fish and invertebrates, and the region has been designated an Important Bird Area (BirdLife International 2018). The TTBES Stock was delimited in the first stock assessment reports published in 1995 (Blaylock et al. 1995). The stock area includes estuarine waters from Bay Junop in the west to Bayou LaFourche in the east and includes Bay Junop, Caillou Lake, Lake Pelto, Terrebonne Bay, Lake Barre, Lake Felicity, Timbalier Bay, and Lake Raccourci, and extends out 1 km from the barrier islands (Isles Dernieres, Timbalier Island, East Timbalier Island) into Gulf of Mexico coastal waters (Figure 1). The western boundary of the stock is not well defined and is subject to revision upon further study. The habitat encompassed by the stock area is varied, with complex marsh habitat, large areas of open water, and barrier islands. These different habitat types are also present in the adjacent Barataria Bay, where photo-ID, telemetry and genetic data indicate dolphins partition the habitat of the bay, and that multiple demographically-independent populations of common bottlenose dolphins are plausible (McDonald et al. 2017; Rosel et al. 2017; Wells et al. 2017). Therefore, it is plausible the TTBES Stock contains multiple demographically-independent populations.
POPULATION SIZE The best available abundance estimate for the TTBES Stock of common bottlenose dolphins is 3,870 (CV=0.15; 95% CI: 2934–5210), which is the result of vessel-based capture-recapture photo-ID surveys conducted during June 2016 (Litz et al. 2018).
Recent surveys and abundance estimates Three photo-ID capture-recapture surveys were conducted in June 2016 (Sinclair et al. 2017). The study area included Terrebonne and Timbalier Bays, several small lakes and human-made canals, and tracklines in the coastal waters outside of TTBES (1 km from shore and 2 km from shore; Sinclair et al. 2017). A Poisson-log normal Mark-Resight model was used to estimate abundance (McClintock et al. 2009; Litz et al. 2018). Only 16% of the marked animals were sighted more than once and little is known about the use of the coastal waters by TTBES residents and transients. Studies of other BSE stocks in the northern Gulf of Mexico indicate that resident BSE stock dolphins utilize coastal waters within 1 km of shore (e.g., Mullin et al. 2017; Wells et al. 2017). Therefore, the TTBES Stock boundary also includes waters out to 1 km from shore. Sightings farther than 1 km from shore were excluded from the abundance analyses. The abundance estimate for June 2016 was 3870 dolphins (CV=0.15; 95% CI: 2934–5210) (Litz et al. 2018). Key uncertainties in this abundance estimate include low capture probabilities and the possibility that some coastal stock animals may have been included in the estimate, especially because only data from summer surveys were available. In addition, for some BSE stocks, winter estimates are thought to more accurately represent the resident dolphin abundance (e.g., Mullin et al. 2017). A winter survey was conducted in January 2017 (Sinclair et al. 2017), but photo analysis was not yet complete at the time this report was written. Until data from this winter survey are analyzed, it is not known whether this seasonality applies to the TTBES Stock. If it does, this summer estimate may be biased upwards by an unknown amount.
Minimum Population Estimate The minimum population estimate is the lower limit of the two-tailed 60% confidence interval of the log-normal distributed abundance estimate. This is equivalent to the 20th percentile of the log-normal distributed abundance estimate as specified by Wade and Angliss (1997). The best estimate of abundance for this stock of common bottlenose dolphins is 3,870 (CV=0.15). The minimum population estimate for the TTBES Stock is 3,426 bottlenose dolphins.
Current Population Trend There are insufficient data to assess population trends for this stock because only one estimate of population size is available.
CURRENT AND MAXIMUM NET PRODUCTIVITY RATES Current and maximum net productivity rates are unknown for this stock. The maximum net productivity rate
was assumed to be 0.04. This value is based on theoretical modeling showing that cetacean populations likely do not grow at rates much greater than 4% given the constraints of their reproductive life history (Barlow et al. 1995). The current productivity rate may be compromised by the Deepwater Horizon (DWH) oil spill, as Lane et al. (2015) and
153
Kellar et al. (2017) reported negative reproductive impacts for the adjacent Barataria Bay Estuarine System Stock.
POTENTIAL BIOLOGICAL REMOVAL Potential Biological Removal (PBR) is the product of the minimum population size, one-half the maximum
productivity rate, and a recovery factor (MMPA Sec. 3. 16 U.S.C. 1362; Wade and Angliss 1997; Wade 1998). The minimum population size of the TTBES Stock of common bottlenose dolphins is 3426. The maximum productivity rate is 0.04, the default value for cetaceans. The recovery factor is 0.4 because the CV of the shrimp trawl mortality estimate for Louisiana BSE stocks is greater than 0.8 (Wade and Angliss 1997). PBR for this stock of common bottlenose dolphins is 27.
ANNUAL HUMAN-CAUSED MORTALITY AND SERIOUS INJURY The total annual human-caused mortality and serious injury for the TTBES Stock of common bottlenose dolphins during 2012–2016 is unknown. The mean annual fishery-related mortality and serious injury during 2012–2016 based on strandings and at-sea observations identified as fishery-related was 0 (however, see Shrimp Trawl section for additional fishery-related mortality). Additional mean annual mortality and serious injury during 2012–2016 due to other human-caused sources (gunshot wound) was 0.2. The minimum total mean annual human-caused mortality and serious injury for this stock during 2012–2016 was therefore 0.2 (Table 1). This is a biased estimate because 1) not all fisheries that could interact with this stock are observed and/or observer coverage is very low, 2) stranding data are used as an indicator of fishery-related interactions and not all dead animals are recovered by the stranding network (Peltier et al. 2012; Wells et al. 2015), 3) cause of death is not (or cannot be) routinely determined for stranded carcasses, 4) the estimate of fishery-related interactions includes an actual count of verified fishery-caused deaths and serious injuries and should be considered a minimum (NMFS 2016), 5) the estimate does not include shrimp trawl bycatch (see Shrimp Trawl section), and 6) the stock experienced increased numbers of mortalities during the DWH oil spill, but a damage assessment was not performed for this stock (see Other Mortality section).
Fishery Information There are four commercial fisheries that interact, or that potentially could interact, with this stock. These include two Category II fisheries (Southeastern U.S. Atlantic, Gulf of Mexico shrimp trawl and Gulf of Mexico menhaden purse seine fisheries) and two Category III fisheries (Gulf of Mexico blue crab trap/pot and Atlantic Ocean, Gulf of Mexico, Caribbean commercial passenger fishing vessel [hook and line] fisheries). Detailed fishery information is presented in Appendix III.
Shrimp Trawl Between 1997 and 2014, seven common bottlenose dolphins and seven unidentified dolphins, which could have been either common bottlenose dolphins or Atlantic spotted dolphins, became entangled in the net, lazy line, turtle excluder device, or tickler chain gear in the commercial shrimp trawl fishery in the Gulf of Mexico (Soldevilla et al. 2016). All dolphin bycatch interactions resulted in mortalities except for one unidentified dolphin that was released alive without serious injury in 2009 (Maze-Foley and Garrison 2016). Soldevilla et al. (2015; 2016) provided mortality estimates calculated from analysis of shrimp fishery effort data and NMFS’s Observer Program bycatch data. Although this fishery operates inside the estuaries of the northern Gulf of Mexico, observer program coverage did not extend into BSE waters, therefore time-area stratified bycatch rates were extrapolated into inshore waters to estimate a five-year unweighted mean mortality estimate for 2010–2014 based on inshore fishing effort (Soldevilla et al. 2016). Because the spatial resolution at which fishery effort is modeled is aggregated at the state level (e.g., Nance et al. 2008), the mortality estimate covers inshore waters of Louisiana from Sabine Lake east to Barataria Bay, not just the TTBES Stock. The mean annual mortality estimate for Louisiana BSE stocks for the years 2010–2014 was 61 (CV=1.4; Soldevilla et al. 2016). If all of the mortality occurred in TTBES, the mortality estimate would exceed PBR for this stock; however, because bycatch for the TTBES Stock alone cannot be quantified at this time, the shrimp trawl mortality estimate is not included in the annual human-caused mortality and serious injury total for this stock. It should also be noted that this mortality estimate does not include skimmer trawl effort, which accounts for >48% of shrimp fishery effort in Louisiana, Alabama, and Mississippi inshore waters, because Observer Program coverage of skimmer trawls is limited. Limitations and biases of annual bycatch mortality estimates are described in detail in Soldevilla et al. (2015; 2016).
Menhaden Purse Seine During 2012–2016 there were no documented interactions between the menhaden purse seine fishery and the TTBES Stock. The menhaden purse seine fishery operates in Gulf of Mexico coastal waters just outside the barrier
154
islands of Terrebonne and Timbalier bays (Smith et al. 2002). It has the potential to interact with dolphins of this stock that use nearshore coastal waters. Interactions have been reported for nearby coastal and estuarine stocks (Waring et al. 2015). Without a systematic observer program, it is not possible to obtain statistically reliable information for this fishery on the number of sets annually, the incidental take and mortality rates, and the stocks from which bottlenose dolphins are being taken.
Blue Crab Trap/Pot During 2012–2016 there were no documented interactions between commercial blue crab trap/pot gear and the TTBES Stock. There is no systematic observer coverage of crab trap/pot fisheries, so it is not possible to quantify total mortality.
Hook and Line (Rod and Reel) During 2012–2016, there were no documented interactions with hook and line gear and the TTBES Stock. It is not possible to estimate the total number of interactions with hook and line gear because there is no systematic observer program.
Other Mortality NOAA's Office of Law Enforcement has been investigating increased reports from along the northern Gulf of Mexico coast of violence against common bottlenose dolphins, including shootings via guns and bows and arrows, stabbings, and harassment using pipe bombs and cherry bombs (Vail 2016). During 2012–2016, one animal was shot with buckshot-like ammunition in a canal off Terrebonne Bay (in 2013). This animal was included in the stranding database (NOAA National Marine Mammal Health and Stranding Response Database unpublished data, accessed 28 April 2017) and in the totals presented in Table 2, as well as in the annual human-caused mortality and serious injury total for this stock (Table 1). From recent cases that have been prosecuted, it has been shown that fishermen become frustrated and retaliate against dolphins for removing bait or catch, or depredating, their fishing gear. However, it is unknown whether the 2013 shooting involved depredation. Depredation is a growing problem in Gulf of Mexico coastal and estuary waters and globally, and can lead to serious injury or mortality via ingestion of or entanglement in gear (e.g., Zollett and Read 2006; Read 2008; Powell and Wells 2011; Vail 2016), as well as changes to the dolphin's activity patterns, such as decreases in natural foraging (Powell and Wells 2011). It has been suggested that provisioning, or the illegal feeding, of wild common bottlenose dolphins, may encourage depredation because provisioning conditions dolphins to approach humans and vessels, where they then may prey on bait and catches (Vail 2016). Provisioning has been documented in the literature in Florida and Texas (Bryant 1994; Samuels and Bejder 2004; Cunningham-Smith et al. 2006; Powell and Wells 2011). To date there are no records within the literature of provisioning for this stock area. The Terrebonne-Timbalier Bay Stock had higher stranding rates compared to baseline in the spring and summer of 2010 after the DWH oil spill (Litz et al. 2014). Heavy persistent oiling was recorded on the barrier islands and heavy oiling was recorded in the marshes inside the bay (Michel et al. 2013; Nixon et al. 2016). It is highly likely, therefore, that the dolphins in this stock area were exposed to DWH oil. However, due to a combination of low numbers of carcasses recovered in the remote marshy habitat of Terrebonne and Timbalier bays after the spill, a lack of pre-spill data for this stock, and low power of the statistical model to distinguish mortalities due to oil exposure from mortalities due to cold weather for this stock, DWH injury quantification was not performed for this stock (DWH NRDAT 2016). Thus, mortality due to this spill is unquantified, but it is likely the spill impacted this stock (see Habitat Issues section). All mortalities and serious injuries from known sources for the TTBES Stock are summarized in Table 1.
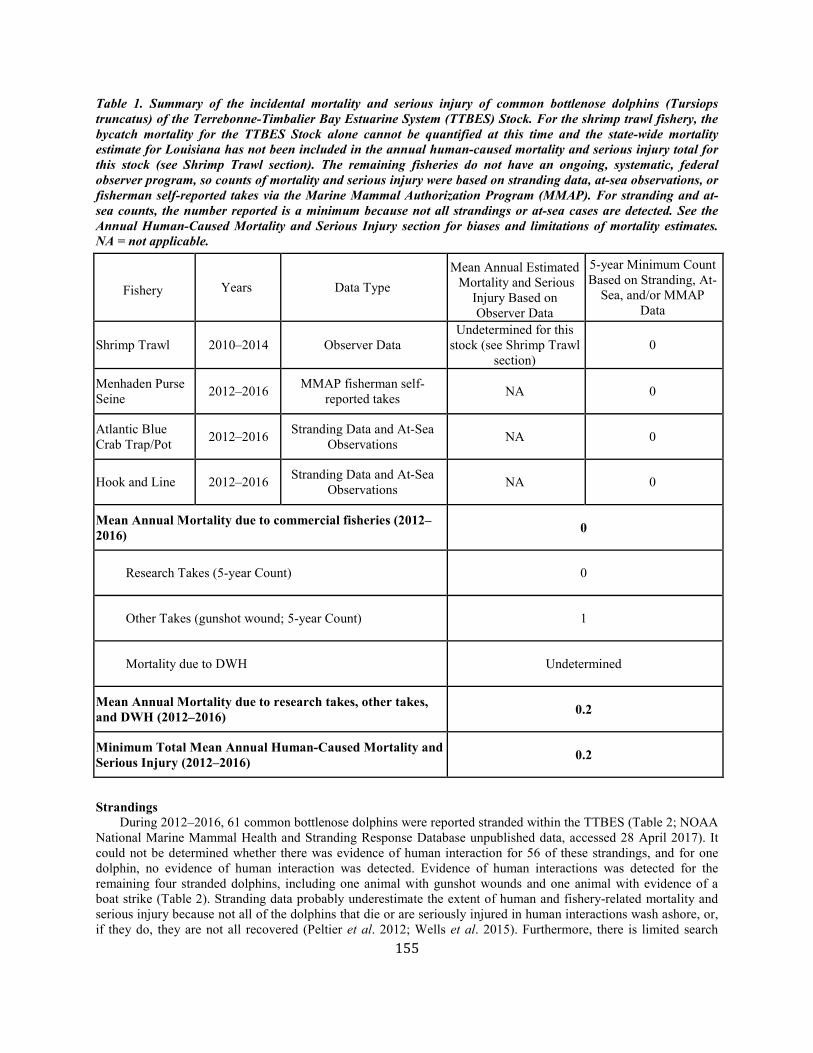
155
Table 1. Summary of the incidental mortality and serious injury of common bottlenose dolphins (Tursiops truncatus) of the Terrebonne-Timbalier Bay Estuarine System (TTBES) Stock. For the shrimp trawl fishery, the bycatch mortality for the TTBES Stock alone cannot be quantified at this time and the state-wide mortality estimate for Louisiana has not been included in the annual human-caused mortality and serious injury total for this stock (see Shrimp Trawl section). The remaining fisheries do not have an ongoing, systematic, federal observer program, so counts of mortality and serious injury were based on stranding data, at-sea observations, or fisherman self-reported takes via the Marine Mammal Authorization Program (MMAP). For stranding and at-sea counts, the number reported is a minimum because not all strandings or at-sea cases are detected. See the Annual Human-Caused Mortality and Serious Injury section for biases and limitations of mortality estimates. NA = not applicable.
Strandings During 2012–2016, 61 common bottlenose dolphins were reported stranded within the TTBES (Table 2; NOAA National Marine Mammal Health and Stranding Response Database unpublished data, accessed 28 April 2017). It could not be determined whether there was evidence of human interaction for 56 of these strandings, and for one dolphin, no evidence of human interaction was detected. Evidence of human interactions was detected for the remaining four stranded dolphins, including one animal with gunshot wounds and one animal with evidence of a boat strike (Table 2). Stranding data probably underestimate the extent of human and fishery-related mortality and serious injury because not all of the dolphins that die or are seriously injured in human interactions wash ashore, or, if they do, they are not all recovered (Peltier et al. 2012; Wells et al. 2015). Furthermore, there is limited search
Fishery Years Data Type Mean Annual Estimated Mortality and Serious
Injury Based on Observer Data
5-year Minimum Count Based on Stranding, At-
Sea, and/or MMAP Data
Shrimp Trawl 2010–2014 Observer Data Undetermined for this
stock (see Shrimp Trawl section)
0
Menhaden Purse Seine 2012–2016 MMAP fisherman self-
reported takes NA 0
Atlantic Blue Crab Trap/Pot 2012–2016 Stranding Data and At-Sea
Observations NA 0
Hook and Line 2012–2016 Stranding Data and At-Sea Observations NA 0
Mean Annual Mortality due to commercial fisheries (2012–2016) 0
Research Takes (5-year Count) 0
Other Takes (gunshot wound; 5-year Count) 1
Mortality due to DWH Undetermined
Mean Annual Mortality due to research takes, other takes, and DWH (2012–2016) 0.2
Minimum Total Mean Annual Human-Caused Mortality and Serious Injury (2012–2016) 0.2
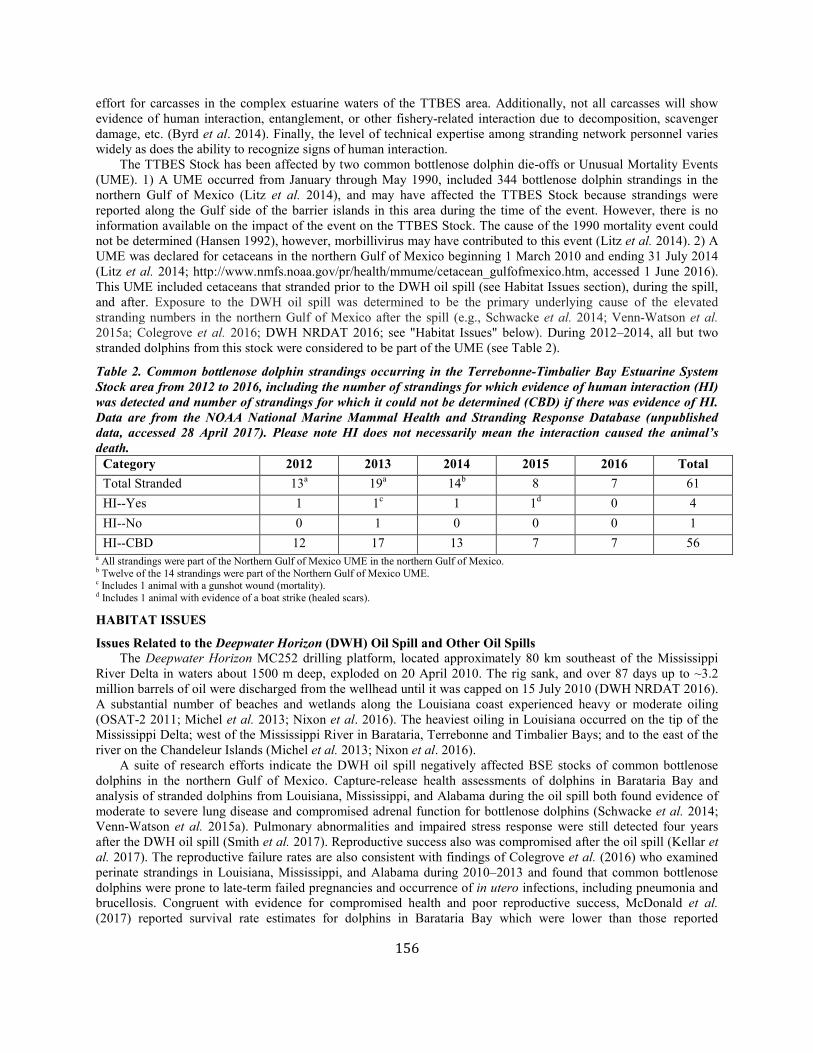
156
effort for carcasses in the complex estuarine waters of the TTBES area. Additionally, not all carcasses will show evidence of human interaction, entanglement, or other fishery-related interaction due to decomposition, scavenger damage, etc. (Byrd et al. 2014). Finally, the level of technical expertise among stranding network personnel varies widely as does the ability to recognize signs of human interaction. The TTBES Stock has been affected by two common bottlenose dolphin die-offs or Unusual Mortality Events (UME). 1) A UME occurred from January through May 1990, included 344 bottlenose dolphin strandings in the northern Gulf of Mexico (Litz et al. 2014), and may have affected the TTBES Stock because strandings were reported along the Gulf side of the barrier islands in this area during the time of the event. However, there is no information available on the impact of the event on the TTBES Stock. The cause of the 1990 mortality event could not be determined (Hansen 1992), however, morbillivirus may have contributed to this event (Litz et al. 2014). 2) A UME was declared for cetaceans in the northern Gulf of Mexico beginning 1 March 2010 and ending 31 July 2014 (Litz et al. 2014; http://www.nmfs.noaa.gov/pr/health/mmume/cetacean_gulfofmexico.htm, accessed 1 June 2016). This UME included cetaceans that stranded prior to the DWH oil spill (see Habitat Issues section), during the spill, and after. Exposure to the DWH oil spill was determined to be the primary underlying cause of the elevated stranding numbers in the northern Gulf of Mexico after the spill (e.g., Schwacke et al. 2014; Venn-Watson et al. 2015a; Colegrove et al. 2016; DWH NRDAT 2016; see "Habitat Issues" below). During 2012–2014, all but two stranded dolphins from this stock were considered to be part of the UME (see Table 2).
Table 2. Common bottlenose dolphin strandings occurring in the Terrebonne-Timbalier Bay Estuarine System Stock area from 2012 to 2016, including the number of strandings for which evidence of human interaction (HI) was detected and number of strandings for which it could not be determined (CBD) if there was evidence of HI. Data are from the NOAA National Marine Mammal Health and Stranding Response Database (unpublished data, accessed 28 April 2017). Please note HI does not necessarily mean the interaction caused the animal’s death.
Category 2012 2013 2014 2015 2016 Total Total Stranded 13a 19a 14b 8 7 61 HI--Yes 1 1c 1 1d 0 4 HI--No 0 1 0 0 0 1 HI--CBD 12 17 13 7 7 56
a All strandings were part of the Northern Gulf of Mexico UME in the northern Gulf of Mexico. b Twelve of the 14 strandings were part of the Northern Gulf of Mexico UME. c Includes 1 animal with a gunshot wound (mortality). d Includes 1 animal with evidence of a boat strike (healed scars).
HABITAT ISSUES
Issues Related to the Deepwater Horizon (DWH) Oil Spill and Other Oil Spills The Deepwater Horizon MC252 drilling platform, located approximately 80 km southeast of the Mississippi River Delta in waters about 1500 m deep, exploded on 20 April 2010. The rig sank, and over 87 days up to ~3.2 million barrels of oil were discharged from the wellhead until it was capped on 15 July 2010 (DWH NRDAT 2016). A substantial number of beaches and wetlands along the Louisiana coast experienced heavy or moderate oiling (OSAT-2 2011; Michel et al. 2013; Nixon et al. 2016). The heaviest oiling in Louisiana occurred on the tip of the Mississippi Delta; west of the Mississippi River in Barataria, Terrebonne and Timbalier Bays; and to the east of the river on the Chandeleur Islands (Michel et al. 2013; Nixon et al. 2016). A suite of research efforts indicate the DWH oil spill negatively affected BSE stocks of common bottlenose dolphins in the northern Gulf of Mexico. Capture-release health assessments of dolphins in Barataria Bay and analysis of stranded dolphins from Louisiana, Mississippi, and Alabama during the oil spill both found evidence of moderate to severe lung disease and compromised adrenal function for bottlenose dolphins (Schwacke et al. 2014; Venn-Watson et al. 2015a). Pulmonary abnormalities and impaired stress response were still detected four years after the DWH oil spill (Smith et al. 2017). Reproductive success also was compromised after the oil spill (Kellar et al. 2017). The reproductive failure rates are also consistent with findings of Colegrove et al. (2016) who examined perinate strandings in Louisiana, Mississippi, and Alabama during 2010–2013 and found that common bottlenose dolphins were prone to late-term failed pregnancies and occurrence of in utero infections, including pneumonia and brucellosis. Congruent with evidence for compromised health and poor reproductive success, McDonald et al. (2017) reported survival rate estimates for dolphins in Barataria Bay which were lower than those reported

157
previously for other southeastern U.S. estuarine areas that did not experience oiling, including Charleston, South Carolina (Speakman et al. 2010) and Sarasota Bay, Florida (Wells and Scott 1990). Although health assessment studies were not performed in the TTBES, both the barrier islands and marshes of Terrebonne and Timbalier Bays experienced oiling levels similar to Barataria Bay (Nixon et al. 2016) and so it is reasonable to conclude that these dolphins also experienced negative health impacts from this spill. Stranding rates in the northern Gulf of Mexico, including in the TTBES, were higher than previously recorded in the years following the oil spill (Litz et al. 2014; Venn-Watson et al. 2015b) and a UME was declared for cetaceans in the northern Gulf of Mexico beginning 1 March 2010 and ending 31 July 2014 (Litz et al. 2014; http://www.nmfs.noaa.gov/pr/health/mmume/cetacean_gulfofmexico.htm, accessed 1 June 2016). Investigations to date have determined that the DWH oil spill was the primary underlying cause of the elevated stranding numbers in the northern Gulf of Mexico after the spill (e.g., Schwacke et al. 2014; Venn-Watson et al. 2015a; Colegrove et al. 2016). Balmer et al. (2015) suggested it is unlikely that persistent organic pollutants (POP) significantly contributed to the unusually high stranding rates following the DWH oil spill because POP concentrations from six northern Gulf sites were comparable to or lower than those previously measured by Kucklick et al. (2011) from southeastern U.S. sites; however, the authors cautioned that potential synergistic effects of oil exposure and POPs should be considered as the extra stress from oil exposure added to the background POP levels could have intensified toxicological effects. Morbillivirus infection, brucellosis, and biotoxins were also ruled out as a primary cause of the UME (Venn-Watson et al. 2015a). In addition to offshore oil spills moving onshore and affecting the TTBES, the TTBES area is home to a significant portion of Louisiana's oil and gas exploration, production, and transportation industry, and hence oil spills have occurred in the area (BTNEP 2010). For example, 72,000–122,000 gallons of crude oil were released into Timbalier Bay in September 1992 when a well belonging to the Greenhill Petroleum Corporation blew out. Impacted resources included birds, fishes, intertidal marshes, and sediments (Burlington 1999). In 1997, 6,561 barrels of crude oil were discharged into Lake Barre from a ruptured Texaco pipeline (Penn and Tomasi 2002; Dickey 2012). Oiled birds as well as fish and shrimp kills occurred despite response efforts (oil skimming and oil booms). Another smaller incident occurred in 1997 involving a tank battery crude oil spill of 15–20 barrels into Timbalier Bay just north of East Timbalier Island. Beach surveys and flights failed to detect any oil in the water or on the beaches. The oil possibly moved offshore into the Gulf (NOAA 1997). A collision of a tank barge and tow vessel in 1999 resulted in ~51,406 gallons of diesel fuel being spilled into Bayou Lafourche just east of Timbalier Bay (Dickey 2012).
Other Habitat Issues Like much of coastal southeastern Louisiana, the TTBES has experienced significant wetland and barrier island loss resulting in more open water and less marsh habitat (CPRA 2017). Subsidence, sea-level rise, storms, winds and tides, and human activities including levee construction and loss of sediment input, and channelization (navigational channels and oil and gas canals), all play a role in this habitat degradation (CPRA 2017). The impacts to common bottlenose dolphins from these changes to the habitat are unknown. The State of Louisiana has a wetland restoration master plan for the area to build and maintain land (CPRA 2017), which could result in additional changes to the habitat, including changes to the salinity within the TTBES. Common bottlenose dolphins are typically found in salinities ranging from 20 to 35 ppt and can experience significant health impacts and/or death due to low salinity exposure (e.g., Andersen 1973; Holyoake et al. 2010). The marshes and waterways of the TTBES are heavily used by industry, and commercial and recreational fisheries. TTBES includes a major port just inland, the Port of Terrebonne, and the associated shipping traffic through the Houma Navigation Canal that runs from the port through Terrebonne Bay into the Gulf of Mexico. This port is important for the construction of oil and gas structures used offshore, the transport of oil and gas, and the construction and repair of marine vessels. Two and a half million tons of cargo pass through the Port of Terrebonne annually (Terrebonne Port Commission 2013). Commercial shrimp trawl and skimmer trawl fishing occurs within TTBES. In addition, over 85,000 recreational vessels are registered in the Barataria Bay-Terrebonne Bay System combined, and over 150,000 recreational fishing licenses have been sold annually (BTNEP 2010). While specific data on noise in the TTBES are lacking, considering the amount of recreational and commercial vessel traffic, it is likely there is a consistent level of anthropogenic ambient noise. In addition, there was a seismic survey for oil and gas during 2014 in lower Terrebonne Parish conducted by Castex Energy (Houma Today 2014). Impacts of non-petroleum product contaminants and heavy metals to the dolphins in the TTBES are unknown. The herbicide atrazine is used extensively on corn and sugarcane fields in southeastern Louisiana, and runoff from treated cropland may reach the TTBES (BTNEP 2010), but impacts to dolphins are unknown. Polychlorinated
158
contaminant levels have not been measured in the dolphins of this stock; however, the concentrations of these contaminants in common bottlenose dolphins in the adjacent Barataria Bay were relatively low compared to other estuarine sites in the southeastern United States (Balmer et al. 2015). Mercury levels in king mackerel in Louisiana waters are relatively high and the Louisiana Department of Environmental Quality has issued a coast-wide advisory for consumption of large king mackerel (>39 inches) due to mercury contamination (Louisiana DEQ 2017).
STATUS OF STOCK Common bottlenose dolphins are not listed as threatened or endangered under the Endangered Species Act, and the TTBES Stock is not a strategic stock under the MMPA. PBR for the TTBES Stock is 27, therefore the zero mortality rate goal, 10% of PBR, is 2.7. The documented mean annual human-caused mortality for this stock for 2012–2016 was 0.2. However, it is likely that the estimate of annual fishery-caused mortality and serious injury is biased low as indicated above (see Annual Human-Caused Mortality and Serious Injury). In particular, if even half of the shrimp trawl mortality estimated for Louisiana BSE stocks occurred in TTBES, the annual fishery-caused mortality for this stock would exceed PBR and the stock would be strategic. Because a UME of unprecedented size and duration (March 2010–July 2014) has impacted the northern Gulf of Mexico, including Terrebonne-Timbalier Bay, and because health and reproductive success of dolphins within Terrebonne-Timbalier Bay has likely been compromised as a result of the DWH oil spill, NMFS finds cause for concern about this stock. The status of this stock relative to OSP is unknown. There is insufficient information to determine whether or not the total fishery-related mortality and serious injury is approaching a zero mortality and serious injury rate. There are insufficient data to determine population trends for this stock.
REFERENCES CITED Andersen, S.H. 1973. Treatment of water in dolphinaria. Aquat. Mamm. (1)3:1–8. Balmer, B.C., R.S. Wells, S.M. Nowacek, D.P. Nowacek, L.H. Schwacke, W.A. McLellan, F.S. Scharf, T.K.
Rowles, L.J. Hansen, T.R. Spradlin and D.A. Pabst. 2008. Seasonal abundance and distribution patterns of common bottlenose dolphins (Tursiops truncatus) near St. Joseph Bay, Florida, USA. J. Cetacean Res. Manage. 10(2):157–167.
Balmer, B.C., G.M. Ylitalo, L.E. McGeorge, K.L. Baugh, D. Boyd, K.D. Mullin, P.E. Rosel, C. Sinclair, R.S. Wells, E.S. Zolman and L.H. Schwacke. 2015. Persistent organic pollutants (POPs) in blubber of common bottlenose dolphins (Tursiops truncatus) along the northern Gulf of Mexico coast, USA. Sci. Total Environ. 527–528:306–312.
Barlow, J., S.L. Swartz, T.C. Eagle and P.R. Wade 1995. U.S. marine mammal stock assessments: Guidelines for preparation, background, and a summary of the 1995 assessments. NOAA Tech. Memo. NMFS-OPR-6, 73 pp.
Bassos-Hull, K., R.M. Perrtree, C.C. Shepard, S. Schilling, A.A. Barleycorn, J.B. Allen, B.C. Balmer, W.E. Pine and R.S. Wells. 2013. Long-term site fidelity and seasonal abundance estimates of common bottlenose dolphins (Tursiops truncatus) along the southwest coast of Florida and responses to natural perturbations. J. Cetacean Res. Manage. 13(1):19–30.
BirdLife International. 2018. Important Bird Areas factsheet: Barataria Terrebonne. Available from: http://datazone.birdlife.org/site/factsheet/barataria-terrebonne-iba-usa
Blaylock, R.A., J.W. Hain, L.J. Hansen, D.L. Palka and G.T. Waring. 1995. U.S. Atlantic and Gulf of Mexico marine mammal stock assessements. NOAA Tech. Memo. NMFS-SEFSC-363, 219 pp.
Bräger, S. 1993. Diurnal and seasonal behavior patterns of bottlenose dolphins (Tursiops truncatus). Mar. Mamm. Sci. 9(4):434–440.
Bräger, S., B. Würsig, A. Acevedo and T. Henningsen. 1994. Association patterns of bottlenose dolphins (Tursiops truncatus) in Galveston Bay, Texas. J. Mamm. 75(2):431–437.
BTNEP (Barataria-Terrebonne National Estuary Program). 2010. Shedding light on our estuary & our economy: environmental indicators in the Barataria-Terrebonne Estuary System 2010. BTNEP, Thibodaux, Louisiana, 36 pp. Available from: https://btnep.org/wp-content/uploads/2017/07/Shedding_Light_on_Our_Estuary_and_Our_economy.pdf
Burlington, L.B. 1999. Ten year historical perspective of the NOAA damage assessment and restoration program. Spill Sci. Technol. B. 5(2):109–116.
Bryant, L. 1994. Report to Congress on results of feeding wild dolphins: 1989-1994. National Marine Fisheries Service, Office of Protected Resources, 23 pp.
159
Byrd, B.L., A.A. Hohn, G.N. Lovewell, K.M. Altman, S.G. Barco, A. Friedlaender, C.A. Harms, W.A. McLellan, K.T. Moore, P.E. Rosel and V.G. Thayer. 2014. Strandings illustrate marine mammal biodiversity and human impacts off the coast of North Carolina, USA. Fish. Bull. 112(1):1–23.
Caldwell, M. 2001. Social and genetic structure of bottlenose dolphin (Tursiops truncatus) in Jacksonville, Florida. Ph.D. dissertation from University of Miami, 143 pp.
Colegrove, K.M., S. Venn-Watson, J. Litz, M.J. Kinsel, K.A. Terio, E. Fougeres, R. Ewing, D.A. Pabst, W.A. McLellan, S. Raverty, J. Saliki, S. Fire, G. Rappucci, S. Bowen-Stevens, L. Noble, A. Costidis, M. Barbieri, C. Field, S. Smith, R.H. Carmichael, C. Chevis, W. Hatchett, D. Shannon, M. Tumlin, G. Lovewell, W. McFee and T.K. Rowles. 2016. Fetal distress and in utero pneumonia in perinatal dolphins during the Northern Gulf of Mexico unusual mortality event. Dis. Aquat. Org. 119(1):1–16.
CPRA (Coastal Protection and Restoration Authority of Louisiana). 2017. Louisiana’s 2017 comprehensive master plan for a sustainable coast. 92 pp. Available from: http://coastal.la.gov/resources/library/reports/
CWPPRA (Coastal Wetlands Planning, Protection and Restoration Act). 2017. The Terrebonne Basin. Available from: http://lacoast.gov/new/about/Basin_data/te/Default.aspx. Accessed 21 November 2017.
Cunningham-Smith, P., D.E. Colbert, R.S. Wells and T. Speakman. 2006. Evaluation of human interactions with a wild bottlenose dolphin (Tursiops truncatus) near Sarasota Bay, Florida, and efforts to curtail the interactions. Aquat. Mamm. 32(3):346–356.
De Guise, S., M. Levin, E. Gebhard, L. Jasperse, L. Burdett Hart, C. Smith, S. Venn-Watson, F. Townsend, R. Wells, B. Balmer, E. Zolman, T. Rowles and L. Schwacke. 2017. Changes in immune function in bottlenose dolphins in the northern Gulf of Mexico associated with the Deepwater Horizon oil spill. Endanger. Spec. Res. 33:291–303.
Dickey, D.H. 2012. Notable oil spills in U.S. waters calendar years 1989–2011. Department of Homeland Security United States Coast Guard, Washington, D.C., 13 pp.
Duffield, D.A. and R.S. Wells. 2002. The molecular profile of a resident community of bottlenose dolphins, Tursiops truncatus. Pages 3–11 in: C. J. Pfeiffer, (ed.) Cell and Molecular Biology of Marine Mammals. Krieger Publishing, Melbourne, FL.
DWH NRDAT (Deepwater Horizon Natural Resource Damage Assessment Trustees). 2016. Deepwater Horizon oil spill: Final programmatic damage assessment and restoration plan and final programmatic environmental impact statement. Available from: http://www.gulfspillrestoration.noaa.gov/restoration-planning/gulf-plan.
Fazioli, K.L., S. Hofmann and R.S. Wells. 2006. Use of Gulf of Mexico coastal waters by distinct assemblages of bottlenose dolphins (Tursiops truncatus). Aquat. Mamm. 32(2):212–222.
Fertl, D.C. 1994. Occurrence patterns and behavior of bottlenose dolphins (Tursiops truncatus) in the Galveston ship channel. Texas J. Sci. 46:299–317.
Gruber, J.A. 1981. Ecology of the Atlantic bottlenosed dolphin (Tursiops truncatus) in the Pass Cavallo area of Matagorda Bay, Texas. M. Sc. thesis from Texas A&M University, College Station. 182 pp.
Gubbins, C. 2002. Association patterns of resident bottlenose dolphins (Tursiops truncatus) in a South Carolina estuary. Aquat. Mamm. 28(1):24–31.
Hansen, L.J. (ed.) 1992. Report on investigation of 1990 Gulf of Mexico bottlenose dolphin strandings. NOAA-NMFS-SEFSC Contribution MIA-92/93-21. Available from: NMFS, Southeast Fisheries Science Center, 75 Virginia Beach Dr., Miami, FL 33149.
Holyoake, C., H. Finn, N. Stephens, P. Duignan, C. Salgado, H. Smith, L. Bejder, T. Linke, C. Daniel, H.N. Lo, G.S. Ham, K. Moiler, S. Allen, K. Bryant and D. McElligott. 2010. Technical report on the bottlenose dolphin (Tursiops aduncus) unusual mortality event within the Swan Canning Riverpark, June-October 2009. Western Australia.
Houma Today. 2014. Shrimpers upset over survey for oil and gas. Accessed 7 December 2017. Available from: http://www.houmatoday.com/article/20140822/ARTICLES/140829844
Hubard, C.W., K. Maze-Foley, K.D. Mullin and W.W. Schroeder. 2004. Seasonal abundance and site fidelity of bottlenose dolphins (Tursiops truncatus) in Mississippi Sound. Aquat. Mamm. 30(2):299-310.
Irvine, B. and R.S. Wells. 1972. Results of attempts to tag Atlantic bottlenose dolphins (Tursiops truncatus). Cetology 13:1–5.
Irvine, A.B., M.D. Scott, R.S. Wells and J.H. Kaufmann. 1981. Movements and activities of the Atlantic bottlenose dolphin, Tursiops truncatus, near Sarasota, Florida. Fish. Bull. 79(4): 671–688.
Irwin, L.J. and B. Würsig. 2004. A small resident community of bottlenose dolphins, Tursiops truncatus, in Texas: Monitoring recommendations. G. Mex. Sci. 22(1):13–21.
160
Kellar, N.M., S.M. Lane, C.R. Smith, T.R. Speakman, B.C. Balmer, M.L. Trego, K.N. Catelani, M.N. Robbins, C.D. Allen, R.S. Wells, E. Zolman and L.H. Schwacke. 2017. Reproductive failure rates of two northern Gulf of Mexico bottlenose dolphin (Tursiops truncatus) stocks following the Deepwater Horizon disaster (2010-2015). Endanger. Spec. Res. 33:143–158.
Kucklick, J., L. Schwacke, R. Wells, A. Hohn, A. Guichard, J. Yordy, L. Hansen, E. Zolman, R. Wilson, J. Litz, D. Nowacek, T. Rowles, R. Pugh, B. Balmer, C. Sinclair and P. Rosel. 2011. Bottlenose dolphins as indicators of persistent organic pollutants in the western North Atlantic Ocean and northern Gulf of Mexico. Environ. Sci. Technol. 45(10):4270–4277.
Lane, S.M., C.R. Smith, J. Mitchell, B.C. Balmer, K.P. Barry, T. McDonald, C.S. Mori, P.E. Rosel, T.K. Rowles, T.R. Speakman, F.I. Townsend, M.C. Tumlin, R.S. Wells, E.S. Zolman and L.H. Schwacke. 2015. Reproductive outcome and survival of common bottlenose dolphins sampled in Barataria Bay, Louisiana, USA, following the Deepwater Horizon oil spill. Proc. R. Soc. B 282:20151944.
Lester, L.J. and L.A. Gonzalez, eds. 2011. The state of the bay: a characterization of the Galveston Bay Ecosystem, Third Edition. Texas Commission on Environmental Quality, Galveston Bay Estuary Program, Houston, Texas, 356 pp. Available from: http://galvbaydata.org/www.galvbaydata.org/StateoftheBay/tabid/1846/Default.html
Litz, J.A. 2007. Social structure, genetic structure, and persistent organohalogen pollutants in bottlenose dolphins (Tursiops truncatus) in Biscayne Bay, Florida. Ph.D. dissertation from University of Miami, 140 pp.
Litz, J., C. Sinclair and L. Garrison. 2018. Terrebonne-Timbalier Bay, Louisiana, common bottlenose dolphin abundance estimate: 2016. Southeast Fisheries Science Center, Protected Resources and Biodiversity Division, 75 Virginia Beach Dr., Miami, FL 33140. PRBD Contribution # PRBD-2018-03, 10 pp. Available from: https://grunt.sefsc.noaa.gov/P_QryLDS/download/PRB94_PRBD_2018-03-C.pdf?id=LDS
Litz, J.A., M.A. Baran, S.R. Bowen-Stevens, R.H. Carmichael, K.M. Colegrove, L.P. Garrison, S.E. Fire, E.M. Fougeres, R. Hardy, S. Holmes, W. Jones, B.E. Mase-Guthrie, D.K. Odell, P.E. Rosel, J.T. Saliki, D.K. Shannon, S.F. Shippee, S.M. Smith, E.M. Stratton, M.C. Tumlin, H.R. Whitehead, G.A.J. Worthy and T.K. Rowles. 2014. Review of historical unusual mortality events (UMEs) in the Gulf of Mexico (1990–2009): Providing context for the complex and long-lasting northern Gulf of Mexico cetacean UME. Dis. Aquat. Organ. 112(2):161–175.
Louisiana DEQ (Department of Environmental Quality). 2017. Fishing consumption and swimming advisories. Available from: http://deq.louisiana.gov/page/fishing-consumption-and-swimming-advisories. Accessed 7 December 2017.
Lynn, S.K. and B. Würsig. 2002. Summer movement patterns of bottlenose dolphins in a Texas bay. G. Mex. Sci. 20(1):25–37.
Maze, K.S. and B. Würsig. 1999. Bottlenose dolphins of San Luis Pass, Texas: Occurrence patterns, site fidelity, and habitat use. Aquat. Mamm. 25(2):91–103.
Maze-Foley, K. and L.P. Garrison. 2016. Serious injury determinations for small cetaceans off the southeast U.S. coast, 2007-2011. Southeast Fisheries Science Center, Protected Resources and Biodiversity Division, 75 Virginia Beach Dr., Miami, FL 33140. PRBD Contribution # PRBD-2016-04, 16 pp.
Mazzoil, M., S.D. McCulloch and R.H. Defran. 2005. Observations on the site fidelity of bottlenose dolphins (Tursiops truncatus) in the Indian River Lagoon, Florida. Fla. Sci. 68(4):217–226.
McClintock, B.T., G.C. White, M.F. Antolin and D.W. Tripp. 2009. Estimating abundance using mark-resight when sampling is with replacement or the number of marked individuals is unknown. Biometerics. 65(1): 237–246.
McDonald, T.L., F.E. Hornsby, T.R. Speakman, E.S. Zolman, K.D. Mullin, C. Sinclair, P.E. Rosel, L. Thomas and L.H. Schwacke. 2017. Survival, density, and abundance of common bottlenose dolphins in Barataria Bay following the Deepwater Horizon oil spill. Endanger. Spec. Res. 33:193–209.
Michel, J., E.H. Owens, S. Zengel, A. Graham, Z. Nixon, T. Allard, W. Holton, P.D. Reimer, A. Lamarche, M. White, N. Rutherford, C. Childs, G. Mauseth, G. Challenger and E. Taylor. 2013. Extent and degree of shoreline oiling: Deepwater Horizon oil spill, Gulf of Mexico, USA. PLoS ONE 8(6):e65087.
Mullin, K.D. 1988. Comparative seasonal abundance and ecology of bottlenose dolphins (Tursiops truncatus) in three habitats of the north-central Gulf of Mexico. Ph.D. thesis. Mississippi State University, Starkville. 135 pp.
Mullin, K.D., T. McDonald, R.S. Wells, B.C. Balmer, T. Speakman, C. Sinclair, E.S. Zolman, F. Hornsby, S.M. McBride, K.A. Wilkinson and L.H. Schwacke. 2017. Density, abundance, survival, and ranging patters of
161
common bottlenose dolphins (Tursiops truncatus) in Mississippi Sound following the Deepwater Horizon oil spill. PLoS ONE 12(10):e0186265.
Nance, J., W. Keithly, Jr., C. Caillouet, Jr., J. Cole, W. Gaidry, B. Gallaway, W. Griffin, R. Hart and M. Travis. 2008. Estimation of effort, maximum sustainable yield, and maximum economic yield in the shrimp fishery of the Gulf of Mexico. NOAA Tech. Memo. NMFS-SEFSC-570. 71 pp.
Nixon, Z., S. Zengel, M. Baker, M. Steinhoff, G. Fricano, S. Rouhani and J. Michel. 2016. Shoreline oiling from the Deepwater Horizon oil spill. Mar. Pollut. Bull. 107(1):170–178.
NMFS. 2016. Guidelines for preparing stock assessment reports pursuant to the 1994 amendments to the MMPA. NMFS Instruction 02-204-01, February 22, 2016. Available from: https://www.fisheries.noaa.gov/national/marine-mammal-protection/guidelines-assessing-marine-mammal-stocks
NOAA. 1997. Incident news: Timbalier Bay. Available from: https://incidentnews.noaa.gov/incident/7247 OSAT-2 (Operational Science Advisory Team). 2011. Summary report for fate and effects of remnant oil in the
beach environment. Annex B: Spatial oil distribution. Available from: https://www.restorethegulf.gov/sites/default/files/u316/OSAT-2%20Report%20no%20ltr.pdf
Peltier, H., W. Dabin, P. Daniel, O. Van Canneyt, G. Dorémus, M. Huon and V. Ridoux. 2012. The significance of stranding data as indicators of cetacean populations at sea: modelling the drift of cetacean carcasses. Ecol. Indicators 18:278–290.
Penn, T. and T. Tomasi. 2002. Calculating resource restoration for an oil discharge in Lake Barre, Louisiana, USA. Environ. Manage. 29(5):691–702.
Powell, J.R. and R.S. Wells. 2011. Recreational fishing depredation and associated behaviors involving common bottlenose dolphins (Tursiops truncatus) in Sarasota Bay, Florida. Mar. Mamm. Sci. 27(1):111–129.
Read, A.J. 2008. The looming crisis: Interactions between marine mammals and fisheries. J. Mammal. 89(3):541–548.
Rosel, P.E., L. Hansen and A.A. Hohn. 2009. Restricted dispersal in a continuously distributed marine species: Common bottlenose dolphins Tursiops truncatus in coastal waters of the western North Atlantic. Mol. Ecol. 18(24):5030–5045.
Rosel, P.E., L.A. Wilcox, C. Sinclair, T.R. Speakman, M.C. Tumlin, J.A. Litz and E.S. Zolman. 2017. Genetic assignment to stock of stranded bottlenose dolphins in southeastern Louisiana after the Deepwater Horizon oil spill. Endang. Species Res. 33:221–234.
Samuels, A. and L. Bejder. 2004. Chronic interactions between humans and free-ranging bottlenose dolphins near Panama City Beach, Florida, USA. J. Cetacean Res. Manage. 6(1):69–77.
Schwacke, L.H., C.R. Smith, F.I. Townsend, R.S. Wells, L.B. Hart, B.C. Balmer, T.K. Collier, S. De Guise, M.M. Fry, L.J. Guillette, S.V. Lamb, S.M. Lane, W.E. McFee, N.J. Place, M.C. Tumlin, G.M. Ylitalo, E.S. Zolman and T.K. Rowles. 2014. Health of bottlenose dolphins (Tursiops truncatus) in Barataria Bay, Louisiana following the Deepwater Horizon oil spill. Environ. Sci. Technol. 48(1):93–103.
Scott, M.D., R.S. Wells and A.B. Irvine 1990. A long-term study of bottlenose dolphins on the west coast of Florida. Pages 235–244 in: S. Leatherwood and R.R. Reeves, (eds.) The bottlenose dolphin. Academic Press, San Diego, CA.
Sellas, A.B., R.S. Wells and P.E. Rosel. 2005. Mitochondrial and nuclear DNA analyses reveal fine scale geographic structure in bottlenose dolphins (Tursiops truncatus) in the Gulf of Mexico. Conserv. Genet. 6(5):715–728.
Shane, S.H. 1977. The population biology of the Atlantic bottlenose dolphin, Tursiops truncatus, in the Aransas Pass area of Texas. M. Sc. thesis from Texas A&M University, College Station. 238 pp.
Shane, S.H. 1990. Behavior and ecology of the bottlenose dolphin at Sanibel Island, Florida. Pages 245–265 in: S. Leatherwood and R.R. Reeves, (eds.) The bottlenose dolphin. Academic Press, San Diego, CA.
Shane, S.H. 2004. Residence patterns, group characteristics, and association patterns of bottlenose dolphins near Sanibel Island, Florida. G. Mex. Sci. 22(1):1–12.
Sinclair, C., K. Barry, E. Ronje, A. Gorgone, A. Martinez, T. Speakman and K. Mullin. 2017. Terrebonne bay – Timbalier Bay, Louisiana common bottlenose dolphin (Tursiops truncatus) stock photo-id capture-recapture and biopsy field summary. NOAA Tech. Memo. NMFS-SEFSC-717, 21 pp.
Smith, J.W., E.A. Hall, N.A. McNeill and W.B. O'Bier. 2002. The distribution of purse-seine sets and catches in the Gulf menhaden fishery in the northern Gulf of Mexico, 1994–98. G. Mex. Sci. 20(1):12–24.
Smith, C.R., T.K. Rowles, L.B. Hart, F.I. Townsend, R.S. Wells, E.S. Zolman, B.C. Balmer, B. Quigley, M. Ivančić, W. McKercher, M.C. Tumlin, K.D. Mullin, J.D. Adams, Q. Wu, W. McFee, T.K. Collier and L.H.

162
Schwacke. 2017. Slow recovery of Barataria Bay dolphin health following the Deepwater Horizon oil spill (2013-2014), with evidence of persistent lung disease and impaired stress response. Endanger. Spec. Res. 33:127–142.
Soldevilla, M.S., L.P. Garrison, E. Scott-Denton and J.M. Nance. 2015. Estimation of marine mammal bycatch mortality in the Gulf of Mexico shrimp otter trawl fishery. NOAA Tech. Memo. NMFS-SEFSC-672, 70 pp.
Soldevilla, M.S., L.P. Garrison, E. Scott-Denton and R.A. Hart. 2016. Estimated bycatch mortality of marine mammals in the Gulf of Mexico shrimp otter trawl fishery during 2012 to 2014. NOAA Tech. Memo. NMFS-SEFSC-697, 47 pp.
Speakman, T., S.M. Lane, L.H. Schwacke, P.A. Fair and E.S. Zolman. 2010. Mark-recapture estimates of seasonal abundance and survivorship for bottlenose dolphins (Tursiops truncatus) near Charleston, South Carolina, USA. J. Cetacean Res. Manage. 11(2):153–162.
Terrebonne Port Commission. 2013. Port of Terrebonne, Houma, LA. Accessed 8 December 2017. Available from: http://www.terrebonneport.com/about.aspx
Urian, K.W., D.A. Duffield, A.J. Read, R.S. Wells and D.D. Shell. 1996. Seasonality of reproduction in bottlenose dolphins, Tursiops truncatus. J. Mamm. 77(2):394–403.
Urian, K.W., S. Hofmann, R.S. Wells and A.J. Read. 2009. Fine-scale population structure of bottlenose dolphins (Tursiops truncatus) in Tampa Bay, Florida. Mar. Mamm. Sci. 25(3):619–638.
U.S. EPA (Environmental Protection Agency). 1999. Ecological condition of estuaries in the Gulf of Mexico. EPA 620-R-98-004. U.S. Environmental Protection Agency, Office of Research and Development, National Health and Environmental Effects Research Laboratory, Gulf Ecology Division, Gulf Breeze, Florida. 80pp.
Vail, C.S. 2016. An overview of increasing incidents of bottlenose dolphin harassment in the Gulf of Mexico and possible solutions. Front. Mar. Sci. 3:110.
Venn-Watson, S., K.M. Colegrove, J. Litz, M. Kinsel, K. Terio, J. Saliki, S. Fire, R. Carmichael, C. Chevis, W. Hatchett, J. Pitchford, M. Tumlin, C. Field, S. Smith, R. Ewing, D. Fauquier, G. Lovewell, H. Whitehead, D. Rotstein, W. McFee, E. Fougeres and T. Rowles. 2015a. Adrenal gland and lung lesions in Gulf of Mexico common bottlenose dolphins (Tursiops truncatus) found dead following the Deepwater Horizon Oil Spill. PLoS ONE 10(5):e0126538.
Venn-Watson, S., L. Garrison, J. Litz, E. Fougeres, B. Mase, G. Rappucci, E. Stratton, R. Carmichael, D. Odell, D. Shannon, S. Shippee, S. Smith, L. Staggs, M. Tumlin, H. Whitehead and T. Rowles. 2015b. Demographic clusters identified within the northern Gulf of Mexico common bottlenose dolphin (Tursiops truncatus) Unusual Mortality Event: January 2010 - June 2013. PLoS ONE 10(2):e0117248.
Wade, P.R. 1998. Calculating limits to the allowable human-caused mortality of cetaceans and pinnipeds. Mar. Mamm. Sci. 14(1):1–37.
Wade, P.R. and R.P. Angliss. 1997. Guidelines for assessing marine mammal stocks: Report of the GAMMS Workshop April 3-5, 1996, Seattle, Washington. NOAA Tech. Memo. NMFS-OPR-12, 93 pp.
Waring, G.T., E. Josephson, K. Maze-Foley and P.E. Rosel. 2015. U.S. Atlantic and Gulf of Mexico Marine Mammal Stock Assessments -- 2014. NOAA Tech. Memo. NMFS-NE-231, 370 pp.
Weller, D.W. 1998. Global and regional variation in the biology and behavior of bottlenose dolphins. Ph. D. thesis from Texas A&M University, College Station. 142 pp.
Wells, R.S. 1986. Population structure of bottlenose dolphins: Behavioral studies along the central west coast of Florida. Contract report to NMFS, SEFSC. Contract No. 45-WCNF-5-00366. Available from: NMFS, Southeast Fisheries Science Center, 75 Virginia Beach Dr., Miami, FL 33149. 58 pp.
Wells, R.S. 1991. The role of long-term study in understanding the social structure of a bottlenose dolphin community. Pages 199-225 in: K. Pryor and K. S. Norris, (eds.) Dolphin societies: Discoveries and puzzles. University of California Press, Berkeley.
Wells, R.S. 2003. Dolphin social complexity: Lessons from long-term study and life history. Pages 32-56 in: F. B. M. de Waal and P. L. Tyack, (eds.) Animal social complexity: Intelligence, culture, and individualized societies. Harvard University Press, Cambridge, MA.
Wells, R.S. and M.D. Scott. 1990. Estimating bottlenose dolphin population parameters from individual identification and capture-release techniques. Pages 407-415 in: P.S. Hammond, S.A. Mizroch and G.P. Donovan (eds.), Individual recognition of cetaceans: Use of photo-identification and other techniques to estimate population parameters. Rep. Int. Whal. Comm., Cambridge, U.K. Special Issue 12.
Wells, R.S., M.D. Scott and A.B. Irvine. 1987. The social structure of free ranging bottlenose dolphins. Pages 247–305 in: H. Genoways, (ed.) Current Mammalogy, Vol. 1. Plenum Press, New York.

163
Wells, R.S., M.K. Bassos, K.W. Urian, W.J. Carr and M.D. Scott 1996a. Low-level monitoring of bottlenose dolphins, Tursiops truncatus, in Charlotte Harbor, Florida: 1990-1994. NOAA Tech. Memo. NMFS-SEFSC-384, 36 pp.
Wells, R.S., K.W. Urian, A.J. Read, M.K. Bassos, W.J. Carr and M.D. Scott. 1996b. Low-level monitoring of bottlenose dolphins, Tursiops truncatus, in Tampa Bay, Florida: 1988-1993. NOAA Tech. Memo. NMFS-SEFSC-385, 25 pp.
Wells, R.S., M.K. Bassos, K.W. Urian, S.H. Shane, E.C.G. Owen, C.F. Weiss, W.J. Carr and M.D. Scott. 1997. Low-level monitoring of bottlenose dolphins, Tursiops truncatus, in Pine Island Sound, Florida: 1996. Contract report to National Marine Fisheries Service, Southeast Fisheries Center Contribution No. 40-WCNF601958. Available from: NMFS, Southeast Fisheries Science Center, 75 Virginia Beach Dr., Miami, FL 33149.
Wells, R.S., J.B. Allen, G. Lovewell, J. Gorzelany, R.E. Delynn, D.A. Fauquier and N.B. Barros. 2015. Carcass-recovery rates for resident bottlenose dolphins in Sarasota Bay, Florida. Mar. Mamm. Sci. 31(1):355–368.
Wells, R.S., L.H. Schwacke, T.K. Rowles, B.C. Balmer, E. Zolman, T. Speakman, F.I. Townsend, M.C. Tumlin, A. Barleycorn and K.A. Wilkinson. 2017. Ranging patterns of common bottlenose dolphins (Tursiops truncatus) in Barataria Bay, Louisiana, following the Deepwater Horizon oil spill. Endanger. Spec. Res. 33:159–180.
Zollett, E.A. and A.J. Read. 2006. Depredation of catch by bottlenose dolphins (Tursiops truncatus) in the Florida king mackerel (Scomberomorus cavalla) troll fishery. Fish. Bull. 104(3):343–349.
Zolman, E.S. 2002. Residence patterns of bottlenose dolphins (Tursiops truncatus) in the Stono River estuary, Charleston County, South Carolina, U.S.A. Mar. Mamm. Sci. 18(4):879–892.
164
February 2019
COMMON BOTTLENOSE DOLPHIN (Tursiops truncatus truncatus): Northern Gulf of Mexico Bay, Sound, and Estuary Stocks
NOTE – NMFS is in the process of writing individual stock assessment reports for each of the 31 bay, sound, and estuary stocks of common bottlenose dolphins in the northern Gulf of Mexico. To date, five stocks have individual reports completed (Terrebonne-Timbalier Bay Estuarine System, Barataria Bay Estuarine System, Mississippi Sound/Lake Borgne/Bay Boudreau, Choctawhatchee Bay, and St. Joseph Bay), and the remaining 26 stocks are assessed in this report.
STOCK DEFINITION AND GEOGRAPHIC RANGE Common bottlenose dolphins are distributed throughout the bays, sounds and estuaries of the Gulf of Mexico (Mullin 1988). The identification of biologically-meaningful “stocks” of common bottlenose dolphins in these waters is complicated by the high degree of behavioral variability exhibited by this species (Shane et al. 1986; Wells and Scott 1999; Wells 2003), and by the lack of requisite information for much of the region. Distinct stocks are delineated in each of 31 areas of contiguous, enclosed or semi-enclosed bodies of water adjacent to the northern Gulf of Mexico (i.e., U.S. Gulf of Mexico; Table 1; Figure 1). The genesis of the delineation of these stocks was work initiated in the 1970s in Sarasota Bay, Florida (Irvine and Wells 1972; Irvine et al. 1981), and in bays in Texas (Shane 1977; Gruber 1981). These studies documented year-round residency of individual common bottlenose dolphins in estuarine waters. As a result, the expectation of year-round resident populations was extended to bay, sound and estuary (BSE) waters across the northern Gulf of Mexico when the first stock assessment reports were published in 1995 (Blaylock et al. 1995). Since these early studies, long-term (year-round, multi-year) residency has been reported from nearly every site where photographic identification (photo-ID) or tagging studies have been conducted in the Gulf of Mexico. In Texas, long-term resident dolphins have been reported in the Matagorda-Espiritu Santo Bay area (Gruber 1981; Lynn and Würsig 2002), Aransas Pass (Shane 1977; Weller 1998), San Luis Pass (Maze and Würsig 1999; Irwin and Würsig 2004), and Galveston Bay (Bräger 1993; Bräger et al. 1994; Fertl 1994). In Louisiana, Miller (2003) concluded the common bottlenose dolphin population in the Barataria Basin was relatively closed, and Wells et al. (2017) documented long-term, year-round residency in Barataria Bay based on telemetry data. Hubard et al. (2004) reported sightings of dolphins in Mississippi Sound that were known from tagging efforts there 12–15 years prior. In Florida, long-term residency has been reported from Tampa Bay (Wells 1986; Wells et al. 1996b; Urian et al. 2009), Sarasota Bay (Irvine and Wells 1972; Irvine et al. 1981; Wells 1986; 1991; 2003; 2014; Wells et al. 1987; Scott et al. 1990), Lemon Bay (Wells et al. 1996a; Bassos-Hull et al. 2013), Charlotte Harbor/Pine Island Sound (Shane 1990; Wells et al. 1996a; 1997; Shane 2004; Bassos-Hull et al. 2013) and Gasparilla Sound (Bassos-Hull et al. 2013). In Sarasota Bay, which has the longest research history, up to five concurrent generations of identifiable residents have been identified, including individuals identified through more than four decades (Wells 2014). Maximum immigration and emigration rates of about 2–3% have been estimated (Wells and Scott 1990). Genetic data also support the concept of relatively discrete BSE stocks. Analyses of mitochondrial DNA haplotype distributions indicate the existence of clinal variations along the Gulf of Mexico coastline (Duffield and Wells 2002). Differences in reproductive seasonality from site to site also suggest genetic-based distinctions between communities (Urian et al. 1996). Mitochondrial DNA analyses suggest finer-scale structural levels as well. For example, dolphins in Matagorda Bay, Texas, appear to be a localized population, and differences in haplotype frequencies distinguish among adjacent communities in Tampa Bay, Sarasota Bay, and Charlotte Harbor/Pine Island Sound, along the central west coast of Florida (Duffield and Wells 1991; 2002). Additionally, Sellas et al. (2005) examined population subdivision among dolphins sampled in Sarasota Bay, Tampa Bay, Charlotte Harbor, Matagorda Bay, and the coastal Gulf of Mexico (1–12 km offshore) from just outside Tampa Bay to the southern end of Lemon Bay, and found evidence of significant population structure among all areas on the basis of both mitochondrial DNA control region sequence data and 9 nuclear microsatellite loci. Rosel et al. (2017) also identified significant population differentiation between estuarine residents of Barataria Bay and the adjacent coastal stock.
165
The Sellas et al. (2005) and Rosel et al. (2017) findings support the separate identification of BSE populations from those occurring in adjacent Gulf coastal waters. In many cases, residents occur primarily in BSE waters, with limited movements through passes to the Gulf of Mexico (Shane 1977; 1990; Gruber 1981; Irvine et al. 1981; Maze and Würsig 1999; Lynn and Würsig 2002; Fazioli et al. 2006). These habitat use patterns are reflected in the ecology of the dolphins in some areas; for example, residents of Sarasota Bay, Florida, lacked squid in their diet, unlike non-resident dolphins stranded on nearby Gulf beaches (Barros and Wells 1998). However, in some areas year-round residents may co-occur with non-resident dolphins. For example, about 14–17% of group sightings involving resident Sarasota Bay dolphins include at least one non-resident as well (Wells et al. 1987; Fazioli et al. 2006). Mixing of inshore residents and non-residents has been seen at San Luis Pass, Texas (Maze and Würsig 1999), Cedar Keys, Florida (Quintana-Rizzo and Wells 2001), and Pine Island Sound, Florida (Shane 2004). Non-residents exhibit a variety of movement patterns, ranging from apparent nomadism recorded as transience to a given area, to apparent seasonal or non-seasonal migrations. Passes, especially the mouths of the larger estuaries, serve as mixing areas. For example, dolphins from several different areas were documented at the mouth of Tampa Bay, Florida (Wells 1986), and most of the dolphins identified in the mouths of Galveston Bay and Aransas Pass, Texas, were considered transients (Henningsen 1991; Bräger 1993; Weller 1998). Seasonal movements of dolphins into and out of some of the bays, sounds and estuaries have also been documented. In Sarasota Bay, Florida, and San Luis Pass, Texas, residents have been documented moving into Gulf coastal waters in fall/winter, and returning inshore in spring/summer (Irvine et al. 1981; Maze and Würsig 1999). Fall/winter increases in abundance have been noted for Tampa Bay (Scott et al. 1989) and are thought to occur in Matagorda Bay (Gruber 1981; Lynn and Würsig 2002) and Aransas Pass (Shane 1977; Weller 1998). Spring/summer increases in abundance occur in Mississippi Sound (Hubard et al. 2004) and are thought to occur in Galveston Bay (Henningsen 1991; Bräger 1993; Fertl 1994). Spring and fall increases in abundance have been reported for St. Joseph Bay, Florida. Mark-recapture abundance estimates were highest in spring and fall and lowest in summer and winter (Table 1; Balmer et al. 2008). Individuals with low site-fidelity indices were sighted more often in spring and fall, whereas individuals sighted during summer and winter displayed higher site-fidelity indices. In conjunction with health assessments, 23 dolphins were radio tagged during April 2005 and July 2006. Dolphins tagged in spring 2005 displayed variable utilization areas and variable site fidelity patterns. In contrast, during summer 2006 the majority of radio-tagged individuals displayed similar utilization areas and moderate to high site-fidelity patterns. The results of the studies suggest that during summer and winter St. Joseph Bay hosts dolphins that spend most of their time within this region, and these may represent a resident community. In spring and fall, St. Joseph Bay is visited by dolphins that range outside of this area (Balmer et al. 2008). The current BSE stocks are delineated as described in Table 1. There are some estuarine areas that are not currently part of any stock’s range. Many of these are areas that dolphins cannot readily access. For example, the marshlands between Galveston Bay and Sabine Lake and between Sabine Lake and Calcasieu Lake are fronted by long, sandy beaches that prohibit dolphins from entering the marshes. The region between the Calcasieu Lake and Vermilion Bay/Atchafalaya Bay stocks has some access, but these marshes are predominantly freshwater rather than saltwater marshes, making them unsuitable for long-term survival of a viable population of common bottlenose dolphins. In other regions, there is insufficient estuarine habitat to harbor a demographically independent population, for instance between the Matagorda Bay and West Bay Stocks in Texas, and/or sufficient isolation of the estuarine habitat from coastal waters. The regions between the south end of the Estero Bay Stock area to just south of Naples and between Little Sarasota Bay and Lemon Bay are highly developed and contain little appropriate habitat. South of Naples to Marco Island and Gullivan Bay is also not currently covered within a stock boundary. This region contains common bottlenose dolphins, but the relationship of any dolphins in this region to other BSE stocks is unknown. They may be members of the Gullivan to Chokoloskee Bay stock as there is passage behind Marco Island that would allow dolphins to move north. The regions between Apalachee Bay and Cedar Key/Waccasassa Bay, between Crystal Bay and St. Joseph Sound, and between Chokoloskee Bay and Whitewater Bay are comprised of thin strips of marshland with no barriers to adjacent coastal waters. Further work is necessary to determine whether year-round resident dolphins use these thin marshes or whether dolphins in these areas are members of the coastal stock that use the fringing marshland as well. Finally, the region between the eastern border of the Barataria Bay Estuarine System Stock and the Mississippi River Delta Stock to the east may harbor dolphins, but the area is small and work is necessary to determine whether any dolphins utilizing this habitat come from an adjacent BSE stock. As more information becomes available, combination or division of these stocks, or alterations to stock boundaries, may be warranted. Recent research based on photo-ID data collected by Bassos-Hull et al. (2013)
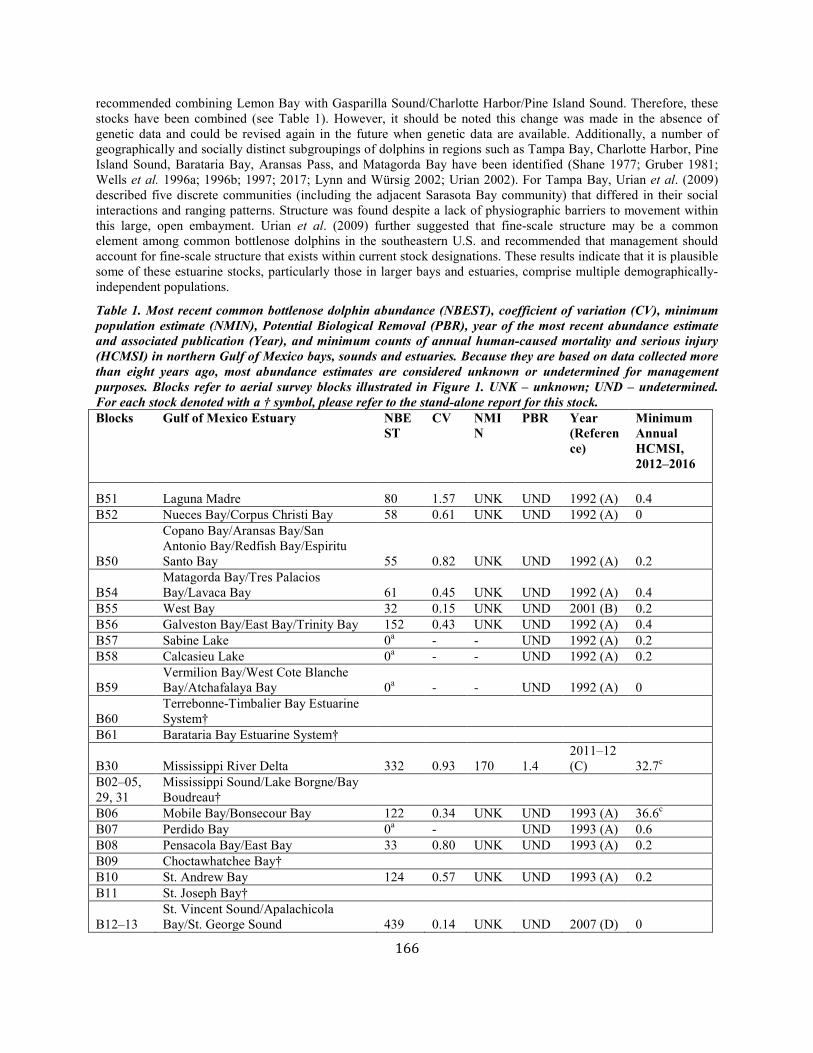
166
recommended combining Lemon Bay with Gasparilla Sound/Charlotte Harbor/Pine Island Sound. Therefore, these stocks have been combined (see Table 1). However, it should be noted this change was made in the absence of genetic data and could be revised again in the future when genetic data are available. Additionally, a number of geographically and socially distinct subgroupings of dolphins in regions such as Tampa Bay, Charlotte Harbor, Pine Island Sound, Barataria Bay, Aransas Pass, and Matagorda Bay have been identified (Shane 1977; Gruber 1981; Wells et al. 1996a; 1996b; 1997; 2017; Lynn and Würsig 2002; Urian 2002). For Tampa Bay, Urian et al. (2009) described five discrete communities (including the adjacent Sarasota Bay community) that differed in their social interactions and ranging patterns. Structure was found despite a lack of physiographic barriers to movement within this large, open embayment. Urian et al. (2009) further suggested that fine-scale structure may be a common element among common bottlenose dolphins in the southeastern U.S. and recommended that management should account for fine-scale structure that exists within current stock designations. These results indicate that it is plausible some of these estuarine stocks, particularly those in larger bays and estuaries, comprise multiple demographically-independent populations.
Table 1. Most recent common bottlenose dolphin abundance (NBEST), coefficient of variation (CV), minimum population estimate (NMIN), Potential Biological Removal (PBR), year of the most recent abundance estimate and associated publication (Year), and minimum counts of annual human-caused mortality and serious injury (HCMSI) in northern Gulf of Mexico bays, sounds and estuaries. Because they are based on data collected more than eight years ago, most abundance estimates are considered unknown or undetermined for management purposes. Blocks refer to aerial survey blocks illustrated in Figure 1. UNK – unknown; UND – undetermined. For each stock denoted with a † symbol, please refer to the stand-alone report for this stock. Blocks Gulf of Mexico Estuary NBE
ST CV NMI
N PBR Year
(Reference)
Minimum Annual HCMSI, 2012–2016
B51 Laguna Madre 80 1.57 UNK UND 1992 (A) 0.4 B52 Nueces Bay/Corpus Christi Bay 58 0.61 UNK UND 1992 (A) 0
B50
Copano Bay/Aransas Bay/San Antonio Bay/Redfish Bay/Espiritu Santo Bay 55 0.82 UNK UND 1992 (A) 0.2
B54 Matagorda Bay/Tres Palacios Bay/Lavaca Bay 61 0.45 UNK UND 1992 (A) 0.4
B55 West Bay 32 0.15 UNK UND 2001 (B) 0.2 B56 Galveston Bay/East Bay/Trinity Bay 152 0.43 UNK UND 1992 (A) 0.4 B57 Sabine Lake 0a - - UND 1992 (A) 0.2 B58 Calcasieu Lake 0a - - UND 1992 (A) 0.2
B59 Vermilion Bay/West Cote Blanche Bay/Atchafalaya Bay 0a - - UND 1992 (A) 0
B60 Terrebonne-Timbalier Bay Estuarine System†
B61 Barataria Bay Estuarine System†
B30 Mississippi River Delta 332 0.93 170 1.4 2011–12 (C) 32.7c
B02–05, 29, 31
Mississippi Sound/Lake Borgne/Bay Boudreau†
B06 Mobile Bay/Bonsecour Bay 122 0.34 UNK UND 1993 (A) 36.6c B07 Perdido Bay 0a - UND 1993 (A) 0.6 B08 Pensacola Bay/East Bay 33 0.80 UNK UND 1993 (A) 0.2 B09 Choctawhatchee Bay† B10 St. Andrew Bay 124 0.57 UNK UND 1993 (A) 0.2 B11 St. Joseph Bay†
B12–13 St. Vincent Sound/Apalachicola Bay/St. George Sound 439 0.14 UNK UND 2007 (D) 0
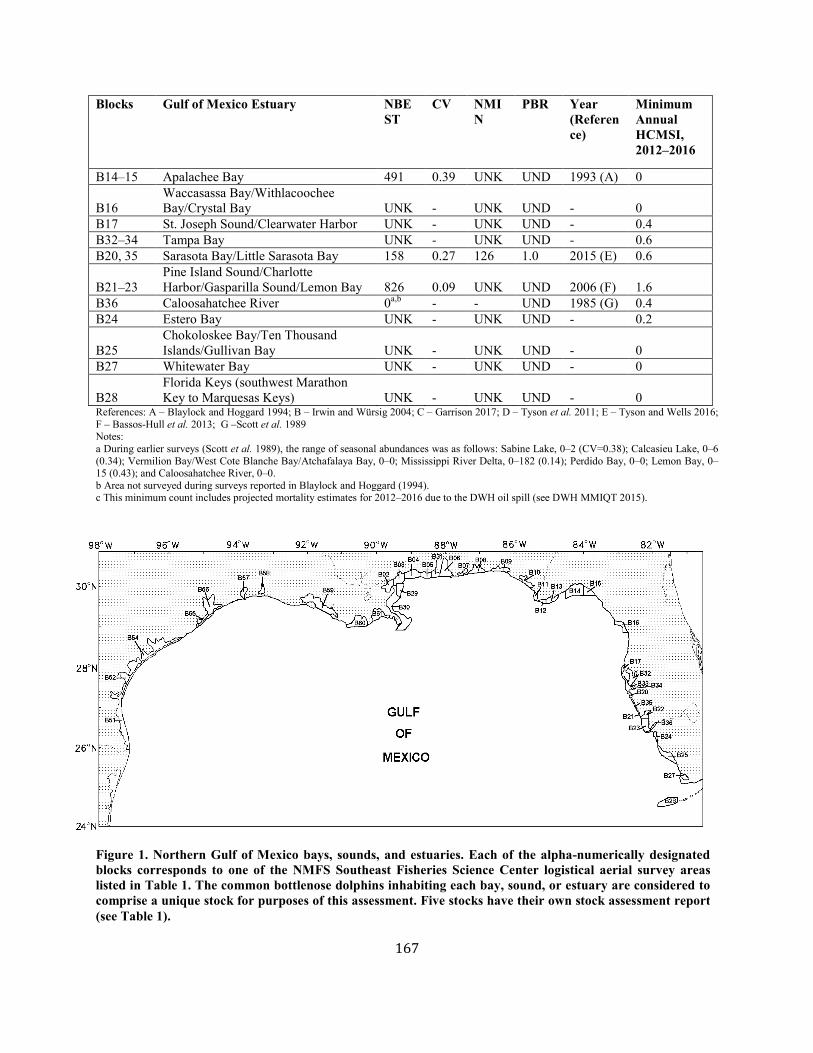
167
Blocks Gulf of Mexico Estuary NBEST
CV NMIN
PBR Year (Reference)
Minimum Annual HCMSI, 2012–2016
B14–15 Apalachee Bay 491 0.39 UNK UND 1993 (A) 0
B16 Waccasassa Bay/Withlacoochee Bay/Crystal Bay UNK - UNK UND - 0
B17 St. Joseph Sound/Clearwater Harbor UNK - UNK UND - 0.4 B32–34 Tampa Bay UNK - UNK UND - 0.6 B20, 35 Sarasota Bay/Little Sarasota Bay 158 0.27 126 1.0 2015 (E) 0.6
B21–23 Pine Island Sound/Charlotte Harbor/Gasparilla Sound/Lemon Bay 826 0.09 UNK UND 2006 (F) 1.6
B36 Caloosahatchee River 0a,b - - UND 1985 (G) 0.4 B24 Estero Bay UNK - UNK UND - 0.2
B25 Chokoloskee Bay/Ten Thousand Islands/Gullivan Bay UNK - UNK UND - 0
B27 Whitewater Bay UNK - UNK UND - 0
B28 Florida Keys (southwest Marathon Key to Marquesas Keys) UNK - UNK UND - 0
References: A – Blaylock and Hoggard 1994; B – Irwin and Würsig 2004; C – Garrison 2017; D – Tyson et al. 2011; E – Tyson and Wells 2016; F – Bassos-Hull et al. 2013; G –Scott et al. 1989 Notes: a During earlier surveys (Scott et al. 1989), the range of seasonal abundances was as follows: Sabine Lake, 0–2 (CV=0.38); Calcasieu Lake, 0–6 (0.34); Vermilion Bay/West Cote Blanche Bay/Atchafalaya Bay, 0–0; Mississippi River Delta, 0–182 (0.14); Perdido Bay, 0–0; Lemon Bay, 0–15 (0.43); and Caloosahatchee River, 0–0. b Area not surveyed during surveys reported in Blaylock and Hoggard (1994). c This minimum count includes projected mortality estimates for 2012–2016 due to the DWH oil spill (see DWH MMIQT 2015).
Figure 1. Northern Gulf of Mexico bays, sounds, and estuaries. Each of the alpha-numerically designated blocks corresponds to one of the NMFS Southeast Fisheries Science Center logistical aerial survey areas listed in Table 1. The common bottlenose dolphins inhabiting each bay, sound, or estuary are considered to comprise a unique stock for purposes of this assessment. Five stocks have their own stock assessment report (see Table 1).
168
POPULATION SIZE Population size estimates for most of these stocks are more than eight years old and therefore the current population sizes for all but two are considered unknown (Wade and Angliss 1997). However, a capture-mark-recapture population size estimate is available for Sarasota Bay/Little Sarasota Bay for 2015 (Tyson and Wells 2016). Recent aerial survey line-transect population size estimates are available for Mississippi River Delta for 2011–2012 (Garrison 2017; Table 1). Population size estimates for many stocks were generated from preliminary analyses of line-transect data collected during aerial surveys conducted in September–October 1992 in Texas and Louisiana and in September–October 1993 in Louisiana, Mississippi, Alabama, and the Florida Panhandle (Blaylock and Hoggard 1994; Table 1). Standard line-transect perpendicular sighting distance analytical methods (Buckland et al. 1993) and the computer program DISTANCE (Laake et al. 1993) were used.
Minimum Population Estimate The population sizes for all but two stocks are currently unknown and the minimum population estimates are given for those two stocks in Table 1. The minimum population estimate is the lower limit of the two-tailed 60% confidence interval of the log-normally distributed best abundance estimate. This is equivalent to the 20th percentile of the log-normal distribution as specified by Wade and Angliss (1997). The minimum population estimate was calculated for each block from the estimated population size and its associated coefficient of variation.
Current Population Trend The data are insufficient to determine population trends for most of the Gulf of Mexico BSE common bottlenose dolphin stocks.
CURRENT AND MAXIMUM NET PRODUCTIVITY RATES Current and maximum net productivity rates are not known for these stocks. The maximum net productivity rate was assumed to be 0.04. This value is based on theoretical modeling showing that cetacean populations may not grow at rates much greater than 4% given the constraints of their reproductive life history (Barlow et al. 1995).
POTENTIAL BIOLOGICAL REMOVAL Potential Biological Removal (PBR) is the product of minimum population size, one-half the maximum productivity rate and a recovery factor (Wade and Angliss 1997). The recovery factor is 0.5 for Texas BSE stocks because these stocks are of unknown status. The recovery factor is 0.4 for Louisiana, Mississippi, Alabama, and Florida BSE stocks because the CV of the shrimp trawl mortality estimate for those stocks is greater than 0.8 (Wade and Angliss 1997). PBR is undetermined for all but two stocks because the population size estimates are more than eight years old. PBR for those stocks with population size estimates less than eight years old is given in Table 1.
ANNUAL HUMAN-CAUSED MORTALITY AND SERIOUS INJURY The total annual human-caused mortality and serious injury for these stocks of common bottlenose dolphins during 2012–2016 is unknown. Minimum estimates of human-caused mortality and serious injury for each stock are given in Table 1; however these estimates are biased because: 1) not all fisheries that could interact with these stocks are observed and/or observer coverage is very low, 2) stranding data are used as an indicator of fishery-related interactions and not all dead animals are recovered by the stranding network (Peltier et al. 2012; Wells et al. 2015), 3) cause of death is not (or cannot be) routinely determined for stranded carcasses, 4) the estimate of fishery-related interactions includes an actual count of verified fishery-caused deaths and serious injuries and should be considered a minimum (NMFS 2016), 5) the estimate does not include shrimp trawl bycatch because estimates are not available for individual BSE stocks (see Shrimp Trawl section), and 6) various assumptions were made in the population model used to estimate population decline for northern Gulf of Mexico BSE stocks impacted by the Deepwater Horizon (DWH) oil spill.
Fishery Information There are seven commercial fisheries that interact, or that potentially could interact, with these stocks in the Gulf of Mexico. These include four Category II fisheries (Southeastern U.S. Atlantic, Gulf of Mexico shrimp trawl; Gulf of Mexico menhaden purse seine; Southeastern U.S. Atlantic, Gulf of Mexico stone crab trap/pot; and Gulf of Mexico gillnet fisheries); and three Category III fisheries (Gulf of Mexico blue crab trap/pot; Florida spiny lobster trap/pot; and Atlantic Ocean, Gulf of Mexico, Caribbean commercial passenger fishing vessel [hook and line] fisheries). Detailed fishery information is presented in Appendix III. In the following sections the number of documented interactions of common bottlenose dolphins with each of these fisheries during 2012–2016 is reported. The likely stock(s) of origin for each interaction has been inferred based on the location of the interaction and distribution of the fishery.

169
Shrimp Trawl During 2012–2016, there were no observed mortalities or serious injuries of common bottlenose dolphins from Gulf of Mexico BSE stocks by commercial shrimp trawls because observer coverage of this fishery did not include BSE waters. Between 1997 and 2014, seven common bottlenose dolphins and seven unidentified dolphins, which could have been either common bottlenose dolphins or Atlantic spotted dolphins, became entangled in the net, lazy line, turtle excluder device or tickler chain gear in the commercial shrimp trawl fishery in the Gulf of Mexico (Soldevilla et al. 2016). All dolphin bycatch interactions resulted in mortalities except for one unidentified dolphin that was released alive without serious injury in 2009 (Maze-Foley and Garrison 2016). Soldevilla et al. (2015; 2016) provided mortality estimates calculated from analysis of shrimp fishery effort data and NMFS’s Observer Program bycatch data. Observer program coverage did not extend into BSE waters, therefore time-area stratified bycatch rates were extrapolated into inshore waters to estimate the most recent five-year unweighted mean mortality estimate for 2010–2014 based on inshore fishing effort (Soldevilla et al. 2016). The 4-area (Texas, Louisiana, Mississippi/Alabama, Florida) stratification method was chosen because it best approximates how fisheries operate (Soldevilla et al. 2015; 2016). The BSE stock mortality estimates were aggregated at the state level as this was the spatial resolution at which fishery effort is modeled (e.g., Nance et al. 2008). The mean annual mortality estimates for the BSE stocks were as follows: Texas BSE (from Galveston Bay/East Bay/Trinity Bay south to Laguna Madre): 0; Louisiana BSE (from Sabine Lake east to Barataria Bay): 61 (CV=1.4); Mississippi/Alabama BSE (from Mississippi River Delta east to Mobile Bay/Bonsecour Bay): 27 (CV=1.1); and Florida BSE (from Perdido Bay east and south to the Florida Keys): 2.4 (CV=1.6). These estimates do not include skimmer trawl effort, which accounts for >48% of shrimp fishery effort in Louisiana, Alabama, and Mississippi inshore waters, because observer program coverage of skimmer trawls is limited. Limitations and biases of annual bycatch mortality estimates are described in detail in Soldevilla et al. (2015; 2016). It should be noted that because bycatch for individual BSE stocks cannot be quantified at this time, shrimp trawl bycatch is not being included in the annual human-caused mortality and serious injury total for any BSE stock. During 2012–2016, stranding data documented two mortalities of common bottlenose dolphins associated with entanglement in shrimp trawl gear. Both mortalities occurred in 2016—one in Pensacola Bay and one in Perdido Bay. And in 2012, one dolphin was released alive without serious injury in Perdido Bay during non-commercial shrimp trawling (see Other Mortality section for details). During 2016 the Marine Mammal Authorization Program (MMAP) documented a self-reported incidental take (mortality) of a common bottlenose dolphin by a commercial fisherman trawling in Mobile Bay. The dolphin was entangled in the lazy line of the gear.
Menhaden Purse Seine During 2012–2016, there were no documented mortalities or serious injuries associated with the menhaden purse seine fishery except for those involving the Mississippi Sound/Lake Borgne/Bay Boudreau Stock (please see that SAR). However, it should be noted that there is currently no observer program for the Gulf of Mexico menhaden purse seine fishery. Despite the lack of an observer program, incidental takes have been reported via two sources for common bottlenose dolphin BSE and coastal stocks. First, in 2011, a pilot observer program operated from May through September, and observers documented three dolphins trapped within purse seine nets. All three were released alive without serious injury (Maze-Foley and Garrison 2016). Two of the three dolphins were trapped within a single purse seine within waters of the Western Coastal Stock. The third animal was trapped in waters of the Mississippi Sound/Lake Borgne/Bay Boudreau Stock. Second, the Marine Mammal Authorization Program (MMAP) has documented 13 self-reported incidental takes (all mortalities) of common bottlenose dolphins in northern Gulf of Mexico coastal and estuarine waters by the menhaden purse seine fishery during 2000–2016. Specific self-reported takes under the MMAP likely involving BSE stocks are as follows: two dolphins were reported taken in a single purse seine during 2012 in Mississippi Sound (Mississippi Sound/Lake Borgne/Bay Boudreau Stock); one take of a single dolphin was reported in Louisiana waters during 2004 that likely belonged to the Mississippi River Delta Stock; one take of a single unidentified dolphin reported during 2002 likely belonged to the Mississippi Sound/Lake Borgne/Bay Boudreau Stock; one take of a single dolphin was reported in Louisiana waters during 2001 which likely belonged to Mississippi River Delta Stock or Northern Coastal Stock; during 2000, one take of a single dolphin was reported in Louisiana waters which likely belonged to Mississippi River Delta Stock or Northern Coastal Stock; and also in 2000, three dolphins were reported taken in a single purse seine in Mississippi waters which likely belonged to Mississippi Sound/Lake Borgne/Bay Boudreau Stock. Without an ongoing observer program, it is not possible to obtain statistically reliable information for this fishery on the incidental take and mortality rates, and the stocks from which common bottlenose dolphins are being
170
taken.
Blue Crab, Stone Crab and Florida Spiny Lobster Trap/Pot During 2012–2016 there were five documented interactions between trap/pot fisheries and BSE stocks. During 2016 one animal was partially disentangled from trap/pot gear and released alive seriously injured. This animal likely belonged to the Pine Island Sound/Charlotte Harbor/Gasparilla Sound/Lemon Bay Stock. Also in 2016, an animal was disentangled from commercial stone crab trap/pot gear and released alive not seriously injured following mitigation (disentanglement) efforts (the initial determination [pre-mitigation] was seriously injured). This animal likely belonged to the Sarasota Bay/Little Sarasota Bay Stock. During 2015 one mortality occurred due to entanglement in blue crab trap/pot gear. This animal likely belonged to the Mobile Bay/Bonsecour Bay Stock. Also in 2015, one animal was disentangled and released alive from crab trap/pot gear (it could not be determined if the animal was seriously injured following mitigation efforts; the initial determination was seriously injured [Maze-Foley and Garrison 2018]). This animal likely belonged to the Sarasota Bay/Little Sarasota Bay Stock. During 2013, one animal was disentangled and released alive from Florida spiny lobster trap/pot gear (it could not be determined if the animal was seriously injured following mitigation efforts; the initial determination was seriously injured [Maze-Foley and Garrison 2018]). This animal likely belonged to the Florida Keys Stock. The specific fishery could not be identified for the trap/pot gear involved in the 2015 and one of the 2016 live releases. The mortality and the animals released alive were all included in the stranding database (NOAA National Marine Mammal Health and Stranding Response Database unpublished data, accessed 28 April 2017) and are included in the stranding totals in Table 2. Because there is no systematic observer program, it is not possible to estimate the total number of interactions or mortalities associated with crab traps/pots.
Gillnet No marine mammal mortalities associated with gillnet fisheries have been reported or observed in recent years, but stranding data suggest that gillnet and marine mammal interactions do occur, causing mortality and serious injury. During 2012–2016, 11 entanglements in research-related gillnets were reported in BSE stocks: seven dolphins in Texas, two in Louisiana and two in Florida. Two of the 11 entanglements resulted in mortalities, and three in serious injuries (see Other Mortality section and Table 4 for details on recent research-related entanglements). There has been no observer coverage of this fishery in federal waters. Beginning in November 2012, NMFS began placing observers on commercial vessels in the coastal waters of Alabama, Mississippi, and Louisiana (state waters only). No takes have been observed to date, however dolphins have been observed during haul back and observed feeding from gillnets and sometimes swimming into the circle of a strike net to feed (Mathers et al. 2016). When this occurred, fishermen opened the strike net to allow the dolphins to escape capture, but it was suggested inexperienced fishermen may not be able to safely execute such measures (Mathers et al. 2016). In 1995, a Florida state constitutional amendment banned gillnets and large nets from bays, sounds, estuaries, and other inshore waters. Commercial and recreational gillnet fishing is also prohibited in Texas state waters.
Hook and Line (Rod and Reel) During 2012–2016 there were 29 documented interactions (entanglements or ingestions) between hook and line gear and BSE stocks—20 mortalities and 9 live animals (disentanglement efforts were made for 8 of the 9). The stranding data indicate that, for 10 of these mortalities, the hook and line gear interaction contributed to the cause of death. For six mortalities, evidence suggested the hook and line gear interaction was incidental and was not a contributing factor to cause of death. For four mortalities, it could not be determined if the hook and line gear interaction contributed to cause of death. One live animal was considered seriously injured and no disentanglement efforts were made. Attempts were made to disentangle the remaining eight live animals from hook and line gear, one of which was considered seriously injured by the gear based on observations during mitigation (disentanglement) efforts. Three live animals were considered seriously injured by the gear prior to mitigation efforts, but based on observations during mitigations, they were considered not seriously injured post-mitigation. One live animal was considered seriously injured by the gear prior to mitigation efforts, but following mitigation it could not be determined if the animal was seriously injured. For the remaining three live animals, it could not be determined if the animals were seriously injured (Maze Foley and Garrison 2018). In summary, the evidence available from stranding data suggested that at least 10 mortalities and three serious injuries to animals from BSE stocks resulted from interactions with rod and reel hook and line gear. Interactions by year with hook and line gear were as follows: During 2012 there were nine mortalities, and two live animals were disentangled from hook and line gear (one considered not seriously injured, one could not be
171
determined if it was seriously injured) (Maze-Foley and Garrison 2018). During 2013 there were three mortalities and three live animals disentangled from hook and line gear. One of the live animals was considered not seriously injured and for the other two, it could not be determined whether they were seriously injured (Maze-Foley and Garrison 2018). During 2014 there were four mortalities and one live animal disentangled from hook and line gear considered not seriously injured (Maze-Foley and Garrison 2018). During 2015 there was one mortality. Finally, during 2016 there were three mortalities, two live animals considered seriously injured, and one live animal for which it could not be determined if it was seriously injured (for two of the three live animals, disentanglement efforts were made) (Maze-Foley and Garrison 2018). The mortalities and serious injuries likely involved animals from the following BSE stocks: Neuces Bay/Corpus Christi Bay, West Bay, Galveston Bay/East Bay/Trinity Bay, Mobile Bay/Bonsecour Bay, Perdido Bay, Pensacola Bay/East Bay, St. Andrew Bay, Waccasassa Bay/Withlacoochee Bay/Crystal Bay, Tampa Bay, Sarasota Bay/Little Sarasota Bay, Pine Island Sound/Charlotte Harbor/Gasparilla Sound/Lemon Bay, Caloosahatchee River, Estero Bay, and Chokoloskee Bay/Ten Thousand Islands/Gullivan Bay. All mortalities and live entanglements were included in the stranding database (NOAA National Marine Mammal Health and Stranding Response Database unpublished data, accessed 28 April 2017) and are included in the stranding totals presented in Table 2. It should be noted that, in general, it cannot be determined if rod and reel hook and line gear originated from a commercial (i.e., charter boat or headboat) or recreational angler because the gear type used by both sources is typically the same. Also, it is not possible to estimate the total number of interactions with hook and line gear because there is no systematic observer program.
Strandings A total of 530 common bottlenose dolphins was found stranded within bays, sounds and estuaries of the northern Gulf of Mexico from 2012 through 2016 (Table 2; NOAA National Marine Mammal Health and Stranding Response Database unpublished data, accessed 28 April 2017). It could not be determined if there was evidence of human interaction for 416 of these strandings. For 21 dolphins, no evidence of human interaction was detected. Evidence of human interaction was detected for 93 of these dolphins. Human interactions were from numerous sources, including 29 entanglements with hook and line gear, 5 entanglements with trap/pot gear, 10 entanglements in research gillnet gear, 1 stabbing with a screwdriver, 2 animals shot by arrow, 2 entanglements in commercial shrimp trawls, 1 entanglement in a non-commercial shrimp trawl, 1 entanglement in research longline gear, 1 entrapment between oil booms, and 23 animals with evidence of a boat strike (see Table 2). Strandings with evidence of fishery-related interactions are reported above in the respective gear sections. Bottlenose dolphins are known to become entangled in, or ingest recreational and commercial fishing gear (Gorzelany 1998; Wells et al. 1998; 2008), and some are struck by vessels (Wells and Scott 1997; Wells et al. 2008). There are a number of difficulties associated with the interpretation of stranding data. Except in rare cases, such as Sarasota Bay, Florida, where residency can be determined, it is possible that some or all of the stranded dolphins may have been from a nearby coastal stock. However, the proportion of stranded dolphins belonging to another stock cannot be determined because of the difficulty of determining from where the stranded carcasses originated. Stranding data probably underestimate the extent of human and fishery-related mortality and serious injury because not all of the dolphins that die or are seriously injured in human interactions wash ashore, or, if they do, they are not all recovered (Peltier et al. 2012; Wells et al. 2015). Additionally, not all carcasses will show evidence of human interaction, entanglement, or other fishery-related interaction due to decomposition, scavenger damage, etc. (Byrd et al. 2014). Finally, the level of technical expertise among stranding network personnel varies widely as does the ability to recognize signs of human interaction. Since 1990, there have been 13 common bottlenose dolphin die-offs or Unusual Mortality Events (UMEs) in the northern Gulf of Mexico (Litz et al. 2014; http://www.nmfs.noaa.gov/pr/health/mmume/events.html, accessed 11 January 2016). 1) From January through May 1990, 344 common bottlenose dolphins stranded in the northern Gulf of Mexico. Overall this represented a two-fold increase in the prior maximum recorded number of strandings for the same period, but in some locations (i.e., Alabama) strandings were 10 times the average number. The cause of the 1990 mortality event could not be determined (Hansen 1992), however, morbillivirus may have contributed to this event (Litz et al. 2014). 2) A UME was declared for Sarasota Bay, Florida, in 1991 involving 31 common bottlenose dolphins. The cause was not determined, but it is believed biotoxins may have contributed to this event (Litz et al. 2014). 3) In March and April 1992, 119 common bottlenose dolphins stranded in Texas - about nine times the average number. The cause of this event was not determined, but low salinity due to record rainfall combined with pesticide
172
runoff and exposure to morbillivirus were suggested as potential contributing factors (Duignan et al. 1996; Colbert et al. 1999; Litz et al. 2014). 4) In 1993–1994 a UME of common bottlenose dolphins caused by morbillivirus started in the Florida Panhandle and spread west with most of the mortalities occurring in Texas (Lipscomb et al. 1994; Litz et al. 2014). From February through April 1994, 236 common bottlenose dolphins were found dead on Texas beaches, of which 67 occurred in a single 10-day period. 5) In 1996 a UME was declared for common bottlenose dolphins in Mississippi when 31 common bottlenose dolphins stranded during November and December. The cause was not determined, but a Karenia brevis (red tide) bloom was suspected to be responsible (Litz et al. 2014). 6) Between August 1999 and May 2000, 150 common bottlenose dolphins died coincident with K. brevis blooms and fish kills in the Florida Panhandle (additional strandings included three Atlantic spotted dolphins, Stenella frontalis, one Risso’s dolphin, Grampus griseus, two Blainville’s beaked whales, Mesoplodon densirostris, and four unidentified dolphins. Brevetoxin was determined to be the cause of this event (Twiner et al. 2012; Litz et al. 2014). 7) In March and April 2004, in another Florida Panhandle UME attributed to K. brevis blooms, 105 common bottlenose dolphins and two unidentified dolphins stranded dead (Litz et al. 2014). Although there was no indication of a K. brevis bloom at the time, high levels of brevetoxin were found in the stomach contents of the stranded dolphins (Flewelling et al. 2005; Twiner et al. 2012). 8) In 2005, a particularly destructive red tide (K. brevis) bloom occurred off central west Florida. Manatee, sea turtle, bird and fish mortalities were reported in the area in early 2005 and a manatee UME had been declared. Dolphin mortalities began to rise above the historical averages by late July 2005, continued to increase through October 2005, and were then declared to be part of a multi-species UME. The multi-species UME extended into 2006, and ended in November 2006. In total, 190 dolphins were involved, primarily common bottlenose dolphins (plus strandings of one Atlantic spotted dolphin and 23 unidentified dolphins). The evidence suggests a red tide bloom contributed to the cause of this event (Litz et al. 2014). 9) A separate UME was declared in the Florida Panhandle after elevated numbers of dolphin strandings occurred in association with a K. brevis bloom in September 2005. Dolphin strandings remained elevated through the spring of 2006 and brevetoxin was again detected in the tissues of most of the stranded dolphins and determined to be the cause of the event (Twiner et al. 2012; Litz et al. 2014). Between September 2005 and April 2006 when the event was officially declared over, a total of 88 common bottlenose dolphin strandings occurred (plus strandings of five unidentified dolphins). 10) During February and March of 2007 an event was declared for northeast Texas and western Louisiana involving 64 common bottlenose dolphins and two unidentified dolphins. Decomposition prevented conclusive analyses on most carcasses (Litz et al. 2014). 11) During February and March of 2008 an additional event was declared in Texas involving 111 common bottlenose dolphin strandings (plus strandings of one unidentified dolphin and one melon-headed whale, Peponocephala electra). Most of the animals recovered were in a decomposed state. The investigation is closed and a direct cause could not be identified. However, there were numerous, co-occurring harmful algal bloom toxins detected during the time period of this UME which may have contributed to the mortalities (Fire et al. 2011). 12) A UME was declared for cetaceans in the northern Gulf of Mexico beginning 1 February 2010 and ending 31 July 2014 (Litz et al. 2014; http://www.nmfs.noaa.gov/pr/health/mmume/cetacean_gulfofmexico.htm, accessed 1 June 2016). The UME began a few months prior to the DWH oil spill, however most of the strandings prior to May 2010 were in Lake Pontchartrain, Louisiana, and western Mississippi and were likely a result of low salinity and cold temperatures (Venn-Watson et al. 2015a). The largest increase in strandings (compared to historical data) occurred after May 2010 following the DWH spill, and strandings were focused in areas exposed to DWH oil. Investigations to date have determined that the DWH oil spill is the primary underlying cause of the elevated stranding numbers in the northern Gulf of Mexico after the spill (e.g., Schwacke et al. 2014; Venn-Watson et al. 2015b; Colegrove et al. 2016; DWH NRDAT 2016; see Habitat Issues section). 13) A UME occurred from November 2011 to March 2012 across five Texas counties and included 126 common bottlenose dolphin strandings. The strandings were coincident with a harmful algal bloom of K. brevis, but researchers have not determined that was the cause of the event. During 2011, six animals from BSE stocks were considered to be part of the UME; during 2012, 24 animals.
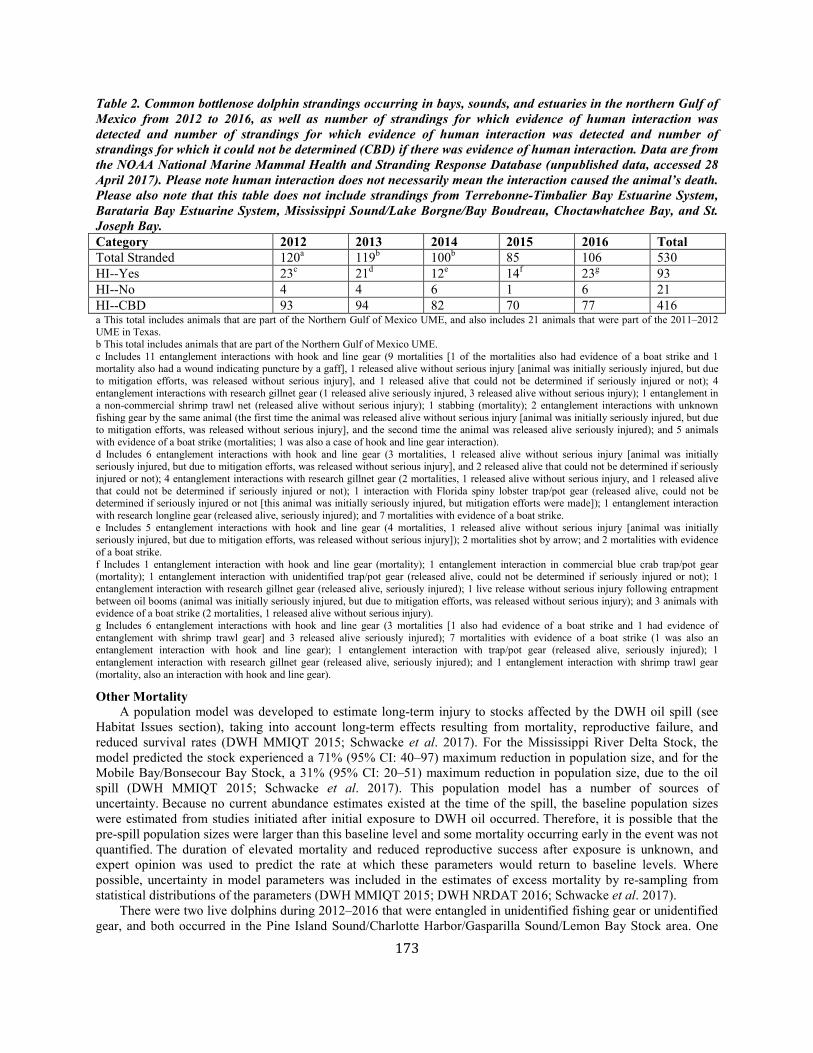
173
Table 2. Common bottlenose dolphin strandings occurring in bays, sounds, and estuaries in the northern Gulf of Mexico from 2012 to 2016, as well as number of strandings for which evidence of human interaction was detected and number of strandings for which evidence of human interaction was detected and number of strandings for which it could not be determined (CBD) if there was evidence of human interaction. Data are from the NOAA National Marine Mammal Health and Stranding Response Database (unpublished data, accessed 28 April 2017). Please note human interaction does not necessarily mean the interaction caused the animal’s death. Please also note that this table does not include strandings from Terrebonne-Timbalier Bay Estuarine System, Barataria Bay Estuarine System, Mississippi Sound/Lake Borgne/Bay Boudreau, Choctawhatchee Bay, and St. Joseph Bay. Category 2012 2013 2014 2015 2016 Total Total Stranded 120a 119b 100b 85 106 530 HI--Yes 23c 21d 12e 14f 23g 93 HI--No 4 4 6 1 6 21 HI--CBD 93 94 82 70 77 416 a This total includes animals that are part of the Northern Gulf of Mexico UME, and also includes 21 animals that were part of the 2011–2012 UME in Texas. b This total includes animals that are part of the Northern Gulf of Mexico UME. c Includes 11 entanglement interactions with hook and line gear (9 mortalities [1 of the mortalities also had evidence of a boat strike and 1 mortality also had a wound indicating puncture by a gaff], 1 released alive without serious injury [animal was initially seriously injured, but due to mitigation efforts, was released without serious injury], and 1 released alive that could not be determined if seriously injured or not); 4 entanglement interactions with research gillnet gear (1 released alive seriously injured, 3 released alive without serious injury); 1 entanglement in a non-commercial shrimp trawl net (released alive without serious injury); 1 stabbing (mortality); 2 entanglement interactions with unknown fishing gear by the same animal (the first time the animal was released alive without serious injury [animal was initially seriously injured, but due to mitigation efforts, was released without serious injury], and the second time the animal was released alive seriously injured); and 5 animals with evidence of a boat strike (mortalities; 1 was also a case of hook and line gear interaction). d Includes 6 entanglement interactions with hook and line gear (3 mortalities, 1 released alive without serious injury [animal was initially seriously injured, but due to mitigation efforts, was released without serious injury], and 2 released alive that could not be determined if seriously injured or not); 4 entanglement interactions with research gillnet gear (2 mortalities, 1 released alive without serious injury, and 1 released alive that could not be determined if seriously injured or not); 1 interaction with Florida spiny lobster trap/pot gear (released alive, could not be determined if seriously injured or not [this animal was initially seriously injured, but mitigation efforts were made]); 1 entanglement interaction with research longline gear (released alive, seriously injured); and 7 mortalities with evidence of a boat strike. e Includes 5 entanglement interactions with hook and line gear (4 mortalities, 1 released alive without serious injury [animal was initially seriously injured, but due to mitigation efforts, was released without serious injury]); 2 mortalities shot by arrow; and 2 mortalities with evidence of a boat strike. f Includes 1 entanglement interaction with hook and line gear (mortality); 1 entanglement interaction in commercial blue crab trap/pot gear (mortality); 1 entanglement interaction with unidentified trap/pot gear (released alive, could not be determined if seriously injured or not); 1 entanglement interaction with research gillnet gear (released alive, seriously injured); 1 live release without serious injury following entrapment between oil booms (animal was initially seriously injured, but due to mitigation efforts, was released without serious injury); and 3 animals with evidence of a boat strike (2 mortalities, 1 released alive without serious injury). g Includes 6 entanglement interactions with hook and line gear (3 mortalities [1 also had evidence of a boat strike and 1 had evidence of entanglement with shrimp trawl gear] and 3 released alive seriously injured); 7 mortalities with evidence of a boat strike (1 was also an entanglement interaction with hook and line gear); 1 entanglement interaction with trap/pot gear (released alive, seriously injured); 1 entanglement interaction with research gillnet gear (released alive, seriously injured); and 1 entanglement interaction with shrimp trawl gear (mortality, also an interaction with hook and line gear).
Other Mortality A population model was developed to estimate long-term injury to stocks affected by the DWH oil spill (see Habitat Issues section), taking into account long-term effects resulting from mortality, reproductive failure, and reduced survival rates (DWH MMIQT 2015; Schwacke et al. 2017). For the Mississippi River Delta Stock, the model predicted the stock experienced a 71% (95% CI: 40–97) maximum reduction in population size, and for the Mobile Bay/Bonsecour Bay Stock, a 31% (95% CI: 20–51) maximum reduction in population size, due to the oil spill (DWH MMIQT 2015; Schwacke et al. 2017). This population model has a number of sources of uncertainty. Because no current abundance estimates existed at the time of the spill, the baseline population sizes were estimated from studies initiated after initial exposure to DWH oil occurred. Therefore, it is possible that the pre-spill population sizes were larger than this baseline level and some mortality occurring early in the event was not quantified. The duration of elevated mortality and reduced reproductive success after exposure is unknown, and expert opinion was used to predict the rate at which these parameters would return to baseline levels. Where possible, uncertainty in model parameters was included in the estimates of excess mortality by re-sampling from statistical distributions of the parameters (DWH MMIQT 2015; DWH NRDAT 2016; Schwacke et al. 2017). There were two live dolphins during 2012–2016 that were entangled in unidentified fishing gear or unidentified gear, and both occurred in the Pine Island Sound/Charlotte Harbor/Gasparilla Sound/Lemon Bay Stock area. One
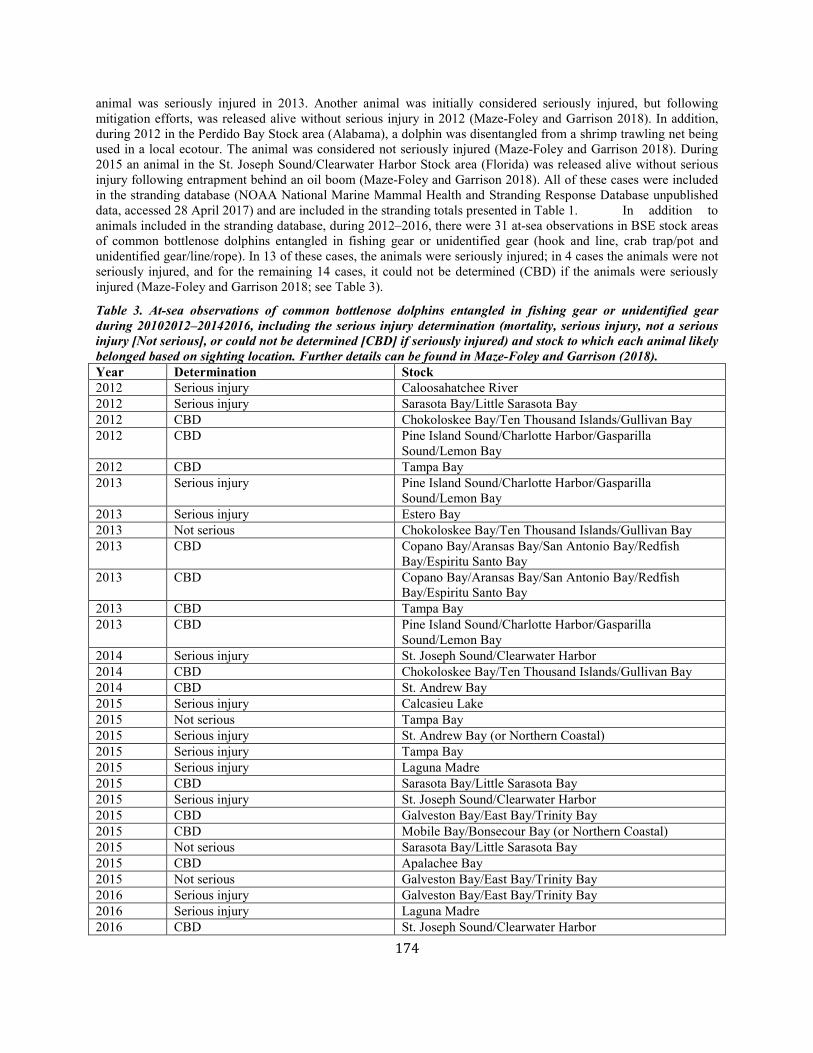
174
animal was seriously injured in 2013. Another animal was initially considered seriously injured, but following mitigation efforts, was released alive without serious injury in 2012 (Maze-Foley and Garrison 2018). In addition, during 2012 in the Perdido Bay Stock area (Alabama), a dolphin was disentangled from a shrimp trawling net being used in a local ecotour. The animal was considered not seriously injured (Maze-Foley and Garrison 2018). During 2015 an animal in the St. Joseph Sound/Clearwater Harbor Stock area (Florida) was released alive without serious injury following entrapment behind an oil boom (Maze-Foley and Garrison 2018). All of these cases were included in the stranding database (NOAA National Marine Mammal Health and Stranding Response Database unpublished data, accessed 28 April 2017) and are included in the stranding totals presented in Table 1. In addition to animals included in the stranding database, during 2012–2016, there were 31 at-sea observations in BSE stock areas of common bottlenose dolphins entangled in fishing gear or unidentified gear (hook and line, crab trap/pot and unidentified gear/line/rope). In 13 of these cases, the animals were seriously injured; in 4 cases the animals were not seriously injured, and for the remaining 14 cases, it could not be determined (CBD) if the animals were seriously injured (Maze-Foley and Garrison 2018; see Table 3).
Table 3. At-sea observations of common bottlenose dolphins entangled in fishing gear or unidentified gear during 20102012–20142016, including the serious injury determination (mortality, serious injury, not a serious injury [Not serious], or could not be determined [CBD] if seriously injured) and stock to which each animal likely belonged based on sighting location. Further details can be found in Maze-Foley and Garrison (2018). Year Determination Stock 2012 Serious injury Caloosahatchee River 2012 Serious injury Sarasota Bay/Little Sarasota Bay 2012 CBD Chokoloskee Bay/Ten Thousand Islands/Gullivan Bay 2012 CBD Pine Island Sound/Charlotte Harbor/Gasparilla
Sound/Lemon Bay 2012 CBD Tampa Bay 2013 Serious injury Pine Island Sound/Charlotte Harbor/Gasparilla
Sound/Lemon Bay 2013 Serious injury Estero Bay 2013 Not serious Chokoloskee Bay/Ten Thousand Islands/Gullivan Bay 2013 CBD Copano Bay/Aransas Bay/San Antonio Bay/Redfish
Bay/Espiritu Santo Bay 2013 CBD Copano Bay/Aransas Bay/San Antonio Bay/Redfish
Bay/Espiritu Santo Bay 2013 CBD Tampa Bay 2013 CBD Pine Island Sound/Charlotte Harbor/Gasparilla
Sound/Lemon Bay 2014 Serious injury St. Joseph Sound/Clearwater Harbor 2014 CBD Chokoloskee Bay/Ten Thousand Islands/Gullivan Bay 2014 CBD St. Andrew Bay 2015 Serious injury Calcasieu Lake 2015 Not serious Tampa Bay 2015 Serious injury St. Andrew Bay (or Northern Coastal) 2015 Serious injury Tampa Bay 2015 Serious injury Laguna Madre 2015 CBD Sarasota Bay/Little Sarasota Bay 2015 Serious injury St. Joseph Sound/Clearwater Harbor 2015 CBD Galveston Bay/East Bay/Trinity Bay 2015 CBD Mobile Bay/Bonsecour Bay (or Northern Coastal) 2015 Not serious Sarasota Bay/Little Sarasota Bay 2015 CBD Apalachee Bay 2015 Not serious Galveston Bay/East Bay/Trinity Bay 2016 Serious injury Galveston Bay/East Bay/Trinity Bay 2016 Serious injury Laguna Madre 2016 CBD St. Joseph Sound/Clearwater Harbor

175
Year Determination Stock 2016 Serious injury Mobile Bay/Bonsecour Bay Interactions between common bottlenose dolphins and research-fishery gear are also known to occur. During 2012–2016, a dolphin was seriously injured during a research longline survey (Maze-Foley and Garrison 2018; see Table 4) and 11 dolphins were entangled in research-related gillnets—in Texas (7), Louisiana (2) and Florida (2). Two of the 10 entanglements resulted in mortalities; three entanglements resulted in serious injuries; five entanglements were released alive without serious injury; and for one entanglement, it could not be determined if the animal was seriously injured (Maze-Foley and Garrison 2018; see Table 4). All of the interactions with research gear were included in the stranding database (NOAA National Marine Mammal Health and Stranding Response Database unpublished data, accessed 28 April 2017).
Table 4. Research-related takes of common bottlenose dolphins during 2012–2016, including the serious injury determination for each animal (mortality, serious injury, not a serious injury [Not serious], or could not be determined ([CBD)] if seriously injured) and stock to which each animal likely belonged based on location of the interaction. All of these interactions were included in the stranding database (NOAA National Marine Mammal Health and Stranding Response Database unpublished data, accessed 28 April 2017). Further details on injury determinations can be found in Maze-Foley and Garrison (2018). Year Gear Type Determination Stock
2013 Longline Serious injury Mobile Bay/Bonsecour Bay
2012 Gillnet Serious injury Copano Bay/Aransas Bay/San Antonio Bay/Redfish Bay/Espiritu Santo Bay
2012 Gillnet Not serious Neuces Bay/Corpus Christi Bay
2012 Gillnet Not serious Copano Bay/Aransas Bay/San Antonio Bay/Redfish Bay/Espiritu Santo Bay
2012 Gillnet Not serious Laguna Madre
2013 Gillnet Not serious Mississippi River Delta
2013 Gillnet Mortality Mississippi River Delta
2013 Gillnet Mortality Pine Island Sound/Charlotte Harbor/Gasparilla Sound/Lemon Bay
2013 Gillnet CBD Pine Island Sound/Charlotte Harbor/Gasparilla Sound/Lemon Bay
2015 Gillnet Serious injury Matagorda Bay/Tres Palacios Bay/Lavaca Bay
2016 Gillnet Serious injury Matagorda Bay/Tres Palacios Bay/Lavaca Bay
2016 Gillnet Not serious Laguna Madre
NOAA's Office of Law Enforcement has been investigating increasing numbers of reports from the northern Gulf of Mexico coast of violence against common bottlenose dolphins, including shootings using guns and bows and arrows, throwing pipe bombs and cherry bombs, and stabbings (Vail 2016). There have been several documented shootings of BSE common bottlenose dolphins in recent years, both by arrows and guns. During 2014 in Cow Bayou, Texas (Sabine Lake Stock), a dolphin was shot with a compound bow resulting in mortality. In 2014 near Orange Beach, Alabama (Perdido Bay Stock), a dolphin was shot with a hunting arrow. During 2012 a dolphin was observed swimming in Perdido Bay with a screwdriver protruding from its melon and was found dead the next day. All three of these cases were included in the stranding database (NOAA National Marine Mammal Health and Stranding Response Database unpublished data, accessed 28 April 2017) and in Table 2. Illegal feeding or provisioning of wild common bottlenose dolphins has been documented in Florida, particularly near Panama City Beach in the Panhandle (Samuels and Bejder 2004; Powell et al. 2018) and in and near Sarasota Bay (Cunningham-Smith et al. 2006; Powell and Wells 2011), and also in Texas near Corpus Christi
176
(Bryant 1994). Feeding wild dolphins is defined under the MMPA as a form of ‘take’ because it can alter their natural behavior and increase their risk of injury or death. Nevertheless, a high rate of provisioning was observed near Panama City Beach in 1998 (Samuels and Bejder 2004), and provisioning has been observed south of Sarasota Bay since 1990 (Cunningham-Smith et al. 2006; Powell and Wells 2011). There are emerging questions regarding potential linkages between provisioning and depredation of recreational fishing gear and associated entanglement and ingestion of gear, which is increasing through much of Florida. During 2006, at least 2% of the long-term resident dolphins of Sarasota Bay died from ingestion of recreational fishing gear (Powell and Wells 2011). Depredation is a growing problem in the Gulf of Mexico and globally, and can lead to serious injury or mortality via ingestion of or entanglement in gear (e.g., Zollett and Read 2006; Read 2008; Powell and Wells 2011; Vail 2016), as well as changes to the dolphin's activity patterns, such as decreases in natural foraging (Powell and Wells 2011). It has been suggested that provisioning of wild common bottlenose dolphins may encourage depredation because provisioning conditions dolphins to approach humans and vessels, where they then may prey on bait and catches (Vail 2016). Christiansen et al. (2017) found that via direct and indirect food provisioning, an increasing percentage of the long-term Sarasota Bay residents were becoming conditioned to human interactions. In addition, when comparing conditioned to unconditioned dolphins, Christiansen et al. (2017) reported it was more likely for a conditioned dolphin to be injured by human interactions. Swimming with wild common bottlenose dolphins has also been documented in Florida in Key West (Samuels and Engleby 2007) and near Panama City Beach (Samuels and Bejder 2004). Near Panama City Beach, Samuels and Bejder (2004) concluded that dolphins were amenable to swimmers due to illegal provisioning. Swimming with wild dolphins may cause harassment, and harassment is illegal under the MMPA. As noted previously, common bottlenose dolphins are known to be struck by vessels (Wells and Scott 1997; Wells et al. 2008). During 2012–2016, 23 stranded bottlenose dolphins (of 530 total strandings) showed signs of a boat collision (NOAA National Marine Mammal Health and Stranding Response Database unpublished data, accessed 28 April 2017). It is possible some of the instances were post-mortem collisions. In addition to vessel collisions, the presence of vessels may also impact common bottlenose dolphin behavior in bays, sounds and estuaries. Nowacek et al. (2001) reported that boats pass within 100 m of each bottlenose dolphin in Sarasota Bay once every six minutes on average, leading to changes in dive patterns and group cohesion. Buckstaff (2004) noted changes in communication patterns of Sarasota Bay dolphins when boats approached. Miller et al. (2008) investigated the immediate responses of common bottlenose dolphins to “high-speed personal watercraft” (i.e., recreational boats) in Mississippi Sound. They found an immediate impact on dolphin behavior demonstrated by an increase in traveling behavior and dive duration, and a decrease in feeding behavior for non-traveling groups. The findings suggested that dolphins attempted to avoid high-speed personal watercraft. It is likely that repeated short-term effects will result in long-term consequences like reduced health and viability or habitat displacement of dolphins (Bejder et al. 2006). Further studies are needed to determine the impacts throughout the Gulf of Mexico. As part of its annual coastal dredging program, the Army Corps of Engineers conducts sea turtle relocation trawling during hopper dredging as a protective measure for marine turtles. No interactions have been documented during the most recent five years, 2012–2016, that fall within BSE stocks in this report; however, one interaction occurred within the boundaries of the Mississippi Sound/Lake Borgne/Bay Boudreau Stock (please see that SAR for details). In earlier years, five interactions, including four mortalities (2003, 2005, 2006, 2007), were documented in the Gulf of Mexico involving common bottlenose dolphins and relocation trawling activities. It is likely that two of these animals belonged to BSE stocks (2003, 2006). There have been two documented mortalities of common bottlenose dolphins during health-assessment research projects in the Gulf of Mexico, but none have occurred during the most recent five years, 2012–2016. Some of the BSE communities were the focus of a live-capture fishery for common bottlenose dolphins which supplied dolphins to the U.S. Navy and to oceanaria for research and public display for more than two decades (Reeves and Leatherwood 1984; Scott 1990). Between 1973 and 1988, 533 common bottlenose dolphins were removed from Southeastern U.S. waters (Scott 1990). The impact of these removals on the stocks is unknown. In 1989, the Alliance of Marine Mammal Parks and Aquariums declared a self-imposed moratorium on the capture of common bottlenose dolphins in the Gulf of Mexico (Corkeron 2009).
HABITAT ISSUES
Issues Related to the Deepwater Horizon (DWH) Oil Spill and the Texas City Y Oil Spill The DWH MC252 drilling platform, located approximately 80 km southeast of the Mississippi River Delta in waters about 1500 m deep, exploded on 20 April 2010. The rig sank, and over 87 days up to ~3.2 million barrels of oil were discharged from the wellhead until it was capped on 15 July 2010 (DWH NRDAT 2016). A substantial
177
number of beaches and wetlands along the Louisiana coast experienced heavy or moderate oiling (OSAT-2 2011; Michel et al. 2013). The heaviest oiling in Louisiana occurred west of the Mississippi River on the Mississippi Delta and in Barataria and Terrebonne Bays, and to the east of the river on the Chandeleur Islands. Some heavy to moderate oiling occurred on Alabama and Florida beaches, with the heaviest stretch occurring from Dauphin Island, Alabama, to Gulf Breeze, Florida. Light to trace oil was reported along the majority of Mississippi's mainland coast, from Gulf Breeze to Panama City, Florida, and outside of Atchafalaya and Vermilion Bays in western Louisiana. Heavy to light oiling occurred on Mississippi's barrier islands (Michel et al. 2013). Shortly after the oil spill, the Natural Resource Damage Assessment (NRDA) process was initiated under the Oil Pollution Act of 1990. A variety of NRDA research studies were conducted to determine potential impacts of the spill on marine mammals. Stranding rates in the northern Gulf of Mexico rose significantly in the years of and following the DWH oil spill to levels higher than previously recorded (Litz et al. 2014; Venn-Watson et al. 2015b) and a UME was declared for cetaceans in the northern Gulf of Mexico beginning 1 March 2010 and ending 31 July 2014 (Litz et al. 2014; http://www.nmfs.noaa.gov/pr/health/mmume/cetacean_gulfofmexico.htm, accessed 1 June 2016). The primary cause for the UME was attributed to exposure to the DWH oil spill (Venn-Watson et al. 2015a; Colegrove et al. 2016; DWH NRDAT 2016) as other possible causes (e.g., morbillivirus infection, brucellosis, and biotoxins) were ruled out (Venn-Watson et al. 2015a). Balmer et al. (2015) indicated it is unlikely that persistent organic pollutants (POPs) significantly contributed to the unusually high stranding rates following the DWH oil spill. POP concentrations in dolphins sampled between 2010 and 2012 at six northern Gulf sites that experienced DWH oiling were comparable to or lower than those previously measured by Kucklick et al. (2011) from southeastern U.S. sites; however, the authors cautioned that potential synergistic effects of oil exposure and POPs should be considered as the extra stress from oil exposure added to the background POP levels could have intensified toxicological effects. The DWH NRDA Trustees quantified injuries to four BSE stocks of common bottlenose dolphins, including two stocks included in this report, the Mississippi River Delta Stock and the Mobile Bay/Bounsecour Bay Stock, as well two stocks that have their own SARs (Barataria Bay Estuarine System Stock and Mississippi Sound/Lake Borgne/Bay Bourdreau Stock). A suite of research efforts indicated the DWH oil spill negatively affected these stocks of common bottlenose dolphins (Schwacke et al. 2014; Venn-Watson et al. 2015a; Colegrove et al. 2016). Capture-release health assessments and analysis of stranded dolphins during the oil spill both found evidence of moderate to severe lung disease and compromised adrenal function (Schwacke et al. 2014; Venn-Watson et al. 2015a). Colegrove et al. (2016) examined perinate strandings in Louisiana, Mississippi, and Alabama during 2010–2013 and found that common bottlenose dolphins were prone to late-term failed pregnancies and in utero infections, including pneumonia and brucellosis. In the absence of any additional non-natural mortality or restoration efforts, the DWH damage assessment estimated the Mississippi River Delta Stock will take 52 years to recover to pre-spill population size, and the Mobile Bay/Bonsecour Bay Stock, 31 years (DWH MMIQT 2015). A recent oil spill in 2014, referred to as the Texas City Y incident, involved a vessel collision in Galveston Bay near Texas City and the subsequent release of ~168,000 gallons of intermediate fuel oil. Through the NRDA process, impacts of this spill are currently being evaluated and will include impacts to common bottlenose dolphins (NOAA DAARP 2018). No information is currently available on potential impacts to the Galveston Bay/East Bay/Trinity Bay Stock or other stocks in Texas.
Other Habitat Issues The nearshore habitat occupied by many of these stocks is adjacent to areas of high human population, and in some bays, such as Mobile Bay in Alabama and Galveston Bay in Texas, is highly industrialized. The area surrounding Galveston Bay, for example, has a coastal population of over three million people. More than 50% of all chemical products manufactured in the U.S. are produced there, and 17% of the oil produced in the Gulf of Mexico is refined there (Henningsen and Würsig 1991). Many of the enclosed bays in Texas are surrounded by agricultural lands that receive periodic pesticide applications. Concentrations of chlorinated hydrocarbons and metals were examined in conjunction with an anomalous mortality event of common bottlenose dolphins in Texas bays in 1990 and found to be relatively low in most; however, some had concentrations at levels of possible toxicological concern (Varanasi et al. 1992). No studies to date have determined the amount, if any, of indirect human-induced mortality resulting from pollution or habitat degradation. Analyses of organochlorine concentrations in the tissues of common bottlenose dolphins in Sarasota Bay, Florida, have found that the concentrations in male dolphins exceeded toxic threshold values that may result in adverse effects on health or reproductive rates (Schwacke et al. 2002). Studies of contaminant concentrations
178
relative to life history parameters showed higher levels of mortality in first-born offspring, and higher contaminant concentrations in these calves and in primiparous females (Wells et al. 2005). While there are no direct measurements of adverse effects of pollutants on estuary dolphins, the exposure to environmental pollutants and subsequent effects on population health are areas of concern and active research.
STATUS OF STOCKS The status of these stocks relative to OSP is unknown and this species is not listed as threatened or endangered under the Endangered Species Act. The occurrence of 13 Unusual Mortality Events (UMEs) among common bottlenose dolphins along the northern Gulf of Mexico coast since 1990 (Litz et al. 2014; http://www.nmfs.noaa.gov/pr/health/mmume/events.html, accessed 11 January 2016) is cause for concern. Notably, stock areas in Louisiana, Mississippi, Alabama, and the western Florida panhandle have been impacted by a UME of unprecedented size and duration (began 1 February 2010 and ended 31 July 2014). However, the effects of the mortality events on stock abundance have not yet been determined, in large part because it has not been possible to assign mortalities to specific stocks due to a lack of empirical information on stock identification. Human-caused mortality and serious injury for each of these stocks is not known. Considering the evidence from stranding data (Table 2) and the low PBRs for stocks with recent abundance estimates, the total fishery-related mortality and serious injury likely exceeds 10% of the total known PBR or previous PBR, and therefore, it is probably not insignificant and not approaching the zero mortality and serious injury rate. NMFS considers each of these stocks, except for the Sarasota Bay/Little Sarasota Bay Stock, to be strategic because most of the stock sizes are currently unknown, but are likely small such that relatively few mortalities and serious injuries would exceed PBR.
REFERENCES CITED Balmer, B.C., R.S. Wells, S.M. Nowacek, D.P. Nowacek, L.H. Schwacke, W.A. McLellan, F.S. Scharf, T.K.
Rowles, L.J. Hansen, T.R. Spradlin and D.A. Pabst. 2008. Seasonal abundance and distribution patterns of common bottlenose dolphins (Tursiops truncatus) near St. Joseph Bay, Florida, USA. J. Cetacean Res. Manage. 10(2):157–167.
Balmer, B.C., G.M. Ylitalo, L.E. McGeorge, K.L. Baugh, D. Boyd, K.D. Mullin, P.E. Rosel, C. Sinclair, R.S. Wells, E.S. Zolman and L.H. Schwacke. 2015. Persistent organic pollutants (POPs) in blubber of common bottlenose dolphins (Tursiops truncatus) along the northern Gulf of Mexico coast, USA. Sci. Total Environ. 527–528:306–312.
Barlow, J., S.L. Swartz, T.C. Eagle and P.R. Wade. 1995. U.S. marine mammal stock assessments: Guidelines for preparation, background, and a summary of the 1995 assessments. NOAA Tech. Memo. NMFS-OPR-6, 73 pp.
Barros, N.B. and R.S. Wells. 1998. Prey and feeding patterns of resident bottlenose dolphins (Tursiops truncatus) in Sarasota Bay, Florida. J. Mamm. 79(3):1045–1059.
Bassos-Hull, K., R.M. Perrtree, C.C. Shepard, S. Schilling, A.A. Barleycorn, J.B. Allen, B.C. Balmer, W.E. Pine and R.S. Wells. 2013. Long-term site fidelity and seasonal abundance estimates of common bottlenose dolphins (Tursiops truncatus) along the southwest coast of Florida and responses to natural perturbations. J. Cetacean Res. Manage. 13(1):19–30.
Bejder, L., A. Samuels, H. Whitehead, N. Gales, J. Mann, R. Connor, M. Heithaus, J. Watson-Capps, C. Flaherty and M. Krützen. 2006. Decline in relative abundance of bottlenose dolphins exposed to long-term disturbance. Conserv. Biol. 20(6):1791–1798.
Blaylock, R.A. and W. Hoggard. 1994. Preliminary estimates of bottlenose dolphin abundance in southern U.S. Atlantic and Gulf of Mexico continental shelf waters. NOAA Tech. Memo. NMFS-SEFSC-356, 10 pp.
Blaylock, R.A., J.W. Hain, L.J. Hansen, D.L. Palka and G.T. Waring. 1995. U.S. Atlantic and Gulf of Mexico marine mammal stock assessments. NOAA Tech. Memo. NMFS-SEFSC-363, 219 pp.
Bräger, S. 1993. Diurnal and seasonal behavior patterns of bottlenose dolphins (Tursiops truncatus). Mar. Mamm. Sci. 9(4):434–440.
Bräger, S., B. Würsig, A. Acevedo and T. Henningsen. 1994. Association patterns of bottlenose dolphins (Tursiops truncatus) in Galveston Bay, Texas. J. Mamm. 75(2):431–437.
Bryant, L. 1994. Report to Congress on results of feeding wild dolphins: 1989-1994. National Marine Fisheries Service, Office of Protected Resources, 23 pp.
Buckland, S.T., D.R. Andersen, K.P. Burnham and J.L. Laake. 1993. Distance sampling: Estimating abundance of biological populations. Chapman and Hall, New York. 446 pp.
179
Buckstaff, K.C. 2004. Effects of watercraft noise on the acoustic behavior of bottlenose dolphins, Tursiops truncatus, in Sarasota Bay, Florida. Mar. Mamm. Sci. 20(4):709–725.
Byrd, B.L., A.A. Hohn, G.N. Lovewell, K.M. Altman, S.G. Barco, A. Friedlaender, C.A. Harms, W.A. McLellan, K.T. Moore, P.E. Rosel and V.G. Thayer. 2014. Strandings illustrate marine mammal biodiversity and human impacts off the coast of North Carolina, USA. Fish. Bull. 112(1):1–23.
Christiansen, F., K.A. McHugh, L. Bejder, E.M. Siegal, D. Lusseau, E.B. McCabe, G. Lovewell and R.S. Wells. 2017. Food provisioning increases the risk of injury in a long-lived marine top predator. R. Soc. open sci. 3:160560.
Colbert, A.A., G.I. Scott, M.H. Fulton, E.F. Wirth, J.W. Daugomah, P.B. Key, E.D. Strozier and S.B. Galloway. 1999. Investigation of unusual mortalities of bottlenose dolphins along the mid-Texas coastal bay ecosystem during 1992. NOAA Tech. Rpt. 147, 23 pp. Available from: http://spo.nmfs.noaa.gov/tr147.pdf
Colegrove, K.M., S. Venn-Watson, J. Litz, M.J. Kinsel, K.A. Terio, E. Fougeres, R. Ewing, D.A. Pabst, W.A. McLellan, S. Raverty, J. Saliki, S. Fire, G. Rappucci, S. Bowen-Stevens, L. Noble, A. Costidis, M. Barbieri, C. Field, S. Smith, R.H. Carmichael, C. Chevis, W. Hatchett, D. Shannon, M. Tumlin, G. Lovewell, W. McFee and T.K. Rowles. 2016. Fetal distress and in utero pneumonia in perinatal dolphins during the Northern Gulf of Mexico unusual mortality event. Dis. Aquat. Org. 119(1):1–16.
Conn, P.B., A.M. Gorgone, A.R. Jugovich, B.L. Byrd and L.J. Hansen. 2011. Accounting for transients when estimating abundance of bottlenose dolphins in Choctawhatchee Bay, Florida. J. Wildl. Manage. 75(3): 569–579.
Corkeron, P. 2009. Captivity. Pages 183–188 in: W.F. Perrin, B. Würsig, J.G. M. Thewissen (eds) The encyclopedia of marine mammals, second edition. Academic Press, San Diego, CA.
Cunningham-Smith, P., D.E. Colbert, R.S. Wells and T. Speakman. 2006. Evaluation of human interactions with a wild bottlenose dolphin (Tursiops truncatus) near Sarasota Bay, Florida, and efforts to curtail the interactions. Aquat. Mamm. 32(3):346–356.
Duffield, D.A. and R.S. Wells. 1991. The combined application of chromosome, protein and molecular data for the investigation of social unit structure and dynamics in Tursiops truncatus. Rep. Int. Whal. Comm. (Special Issue) 13:155–169.
Duffield, D.A. and R.S. Wells. 2002. The molecular profile of a resident community of bottlenose dolphins, Tursiops truncatus. Pages 3–11 in: C.J. Pfeiffer (ed.), Cell and molecular biology of marine mammals. Krieger Publishing, Melbourne, FL.
Duignan, P.J., C. House, D.K. Odell, R.S. Wells, L.J. Hansen, M.T. Walsh, D.J. St. Aubin, B.K. Rima, J.R. Geraci. 1996. Morbillivirus infection in bottlenose dolphins: Evidence for recurrent epizootics in the western Atlantic and Gulf of Mexico. Mar. Mamm. Sci. 12(4):499–515.
DWH MMIQT (Deepwater Horizon Marine Mammal Injury Quantification Team). 2015. Models and analyses for the quantification of injury to Gulf of Mexico cetaceans from the Deepwater Horizon Oil Spill. Available from: https://www.fws.gov/doiddata/dwh-ar-documents/876/DWH-AR0105866.pdf
DWH NRDAT (Deepwater Horizon Natural Resource Damage Assessment Trustees). 2016. Deepwater Horizon oil spill: Final programmatic damage assessment and restoration plan and final programmatic environmental impact statement. Available from: http://www.gulfspillrestoration.noaa.gov/restoration-planning/gulf-plan.
Fazioli, K.L., S. Hoffman and R.S. Wells. 2006. Use of Gulf of Mexico coastal waters by distinct assemblages of bottlenose dolphins (Tursiops truncatus). Aquat. Mamm. 32(2):212–222.
Fertl, D.C. 1994. Occurrence patterns and behavior of bottlenose dolphins (Tursiops truncatus) in the Galveston Ship Channel. Texas J. Sci. 46:299–317.
Fire, S.E., Z. Wang, M. Byrd, H.R. Whitehead, J. Paternoster and S.L. Morton. 2011. Co-occurrence of multiple classes of harmful algal toxins in bottlenose dolphins (Tursiops truncatus) stranding during an unusual mortality event in Texas, USA. Harmful Algae 10(3):330–336.
Flewelling, L.J., J.P. Naar, J.P. Abbott, D.G. Baden, N.B. Barros, G.D. Bossart, M.D. Bottein, D.G. Hammond, E.M. Haubold, C.A. Heil, M.S. Henry, H.M. Jacocks, T.A. Leighfield, R.H. Pierce, T.D. Pitchford, S.A. Rommel, P.S. Scott, K.A. Steidinger, E.W. Truby, F.M. Van Dolah and J.H. Landsberg. 2005. Red tides and marine mammal mortalities: Unexpected brevetoxin vectors may account for deaths long after or remote from an algal bloom. Nature 435(7043):755–756.
Garrison, L.P. 2017. Abundance of coastal and continental shelf stocks of bottlenose dolphins in the northern Gulf of Mexico: 2011-2012. Southeast Fisheries Science Center, Protected Resources and Biodiversity Division, 75 Virginia Beach Dr., Miami, FL 33140. PRBD Contribution # PRBD-2017-04, 34 pp.
180
Gorzelany, J.F. 1998. Unusual deaths of two free-ranging Atlantic bottlenose dolphins (Tursiops truncatus) related to ingestion of recreational fishing gear. Mar. Mamm. Sci. 14(3):614–617.
Gruber, J.A. 1981. Ecology of the Atlantic bottlenosed dolphin (Tursiops truncatus) in the Pass Cavallo area of Matagorda Bay, Texas. M. Sc. thesis. Texas A&M University, College Station. 182 pp.
Hansen, L.J. (ed.) 1992. Report on investigation of 1990 Gulf of Mexico bottlenose dolphin strandings. NOAA-NMFS-SEFSC Contribution MIA-92/93-21. Available from: NMFS, Southeast Fisheries Science Center, 75 Virginia Beach Dr., Miami, FL 33149.
Henningsen, T. 1991. Zur Verbreitung und Ökologie des Großen Tümmlers (Tursiops truncatus) in Galveston, Texas. Diplom thesis. Christian-Albrechts-Universität, Kiel, Germany. 80 pp.
Henningsen, T. and B. Würsig. 1991. Bottle-nosed dolphins in Galveston Bay, Texas: Numbers and activities. Pages 36–38 in: European research on cetaceans – 5. Proceedings of the Fifth Annual Conference of the European Cetacean Society, Sandefjord, Norway, Cambridge, UK, 21-23 February, 1991.
Hubard, C.W., K. Maze-Foley, K.D. Mullin and W.W. Schroeder. 2004. Seasonal abundance and site fidelity of bottlenose dolphins (Tursiops truncatus) in Mississippi Sound. Aquat. Mamm. 30(2):299–310.
Irvine, B. and R.S. Wells. 1972. Results of attempts to tag Atlantic bottlenose dolphins (Tursiops truncatus). Cetology 13:1–5.
Irvine, A.B., M.D. Scott, R.S. Wells and J.H. Kaufmann. 1981. Movements and activities of the Atlantic bottlenose dolphin, Tursiops truncatus, near Sarasota, Florida. Fish. Bull. 79(4):671–688.
Irwin, L.J. and B. Würsig. 2004. A small resident community of bottlenose dolphins, Tursiops truncatus, in Texas: Monitoring recommendations. G. Mex. Sci. 22(1):13–21.
Kucklick, J., L. Schwacke, R. Wells, A. Hohn, A. Guichard, J. Yordy, L. Hansen, E. Zolman, R. Wilson, J. Litz, D. Nowacek, T. Rowles, R. Pugh, B. Balmer, C. Sinclair and P. Rosel. 2011. Bottlenose dolphins as indicators of persistent organic pollutants in the western North Atlantic Ocean and northern Gulf of Mexico. Environ. Sci. Technol. 45(10):4270–4277.
Laake, J.L., S.T. Buckland, D.R. Anderson and K.P. Burnham. 1993. DISTANCE user’s guide, V2.0. Colorado Cooperative Fish & Wildlife Research Unit, Colorado State University, Ft. Collins. 72 pp.
Lipscomb, T.P., S. Kennedy, D. Moffet and B.K. Ford. 1994. Morbilliviral disease in an Atlantic bottlenose dolphin (Tursiops truncatus) from the Gulf of Mexico. J. Wildl. Dis. 30(4):572–576.
Litz, J.A., M.A. Baran, S.R. Bowen-Stevens, R.H. Carmichael, K.M. Colegrove, L.P. Garrison, S.E. Fire, E.M. Fougeres, R. Hardy, S. Holmes, W. Jones, B.E. Mase-Guthrie, D.K. Odell, P.E. Rosel, J.T. Saliki, D.K. Shannon, S.F. Shippee, S.M. Smith, E.M. Stratton, M.C. Tumlin, H.R. Whitehead, G.A.J. Worthy and T.K. Rowles. 2014. Review of historical unusual mortality events (UMEs) in the Gulf of Mexico (1990–2009): Providing context for the complex and long-lasting northern Gulf of Mexico cetacean UME. Dis. Aquat. Organ. 112(2):161–175.
Lynn, S.K. and B. Würsig. 2002. Summer movement patterns of bottlenose dolphins in a Texas bay. G. Mex. Sci. 20(1):25–37.
Mathers, A.N., B.M. Deacy and J.K. Carlson. 2016. Characterization of catch and bycatch in the state gillnet fisheries of Alabama, Mississippi, and Louisiana, 2012-2015. NOAA Tech. Memo. NMFS-SEFSC-691, 35 pp.
Maze, K.S. and B. Würsig. 1999. Bottlenose dolphins of San Luis Pass, Texas: Occurrence patterns, site fidelity, and habitat use. Aquat. Mamm. 25(2):91–103.
Maze-Foley, K. and L.P. Garrison. 2016. Serious injury determinations for small cetaceans off the southeast U.S. coast, 2007-2011. Southeast Fisheries Science Center, Protected Resources and Biodiversity Division, 75 Virginia Beach Dr., Miami, FL 33140. PRBD Contribution # PRBD-2016-04, 16 pp. Available from: https://www.sefsc.noaa.gov/P_QryLDS/download/PRB85_PRBD-2016-04.pdf?id=LDS
Maze-Foley, K. and L.P. Garrison. 2018. Serious injury determinations for small cetaceans off the southeast U.S. coast, 2012–2016. Southeast Fisheries Science Center, Protected Resources and Biodiversity Division, 75 Virginia Beach Dr., Miami, FL 33140. PRBD Contribution # PRBD 2018-04, 31 pp. Available from: https://grunt.sefsc.noaa.gov/P_QryLDS/download/PRB95_PRBD-2018-04_C.pdf?id=LDS
McDonald, T.L., F.E. Hornsby, T.R. Speakman, E.S. Zolman, K.D. Mullin, C. Sinclair, P.E. Rosel, L. Thomas and L.H. Schwacke. 2017. Survival, density, and abundance of common bottlenose dolphins in Barataria Bay following the Deepwater Horizon oil spill. Endanger. Spec. Res. 33:193–209.
Michel, J., E.H. Owens, S. Zengel, A. Graham, Z. Nixon, T. Allard, W. Holton, P.D. Reimer, A. Lamarche, M. White, N. Rutherford, C. Childs, G. Mauseth, G. Challenger and E. Taylor. 2013. Extent and degree of shoreline oiling: Deepwater Horizon oil spill, Gulf of Mexico, USA. PLoS ONE 8(6):e65087.
181
Miller, C. 2003. Abundance trends and environmental habitat usage patterns of bottlenose dolphins (Tursiops truncatus) in lower Barataria and Caminada Bays, Louisiana. Ph.D. thesis. Louisiana State University, Baton Rouge. 125 pp.
Miller, L.J., M. Solangi and S.A. Kuczaj, II. 2008. Immediate response of Atlantic bottlenose dolphins to high-speed personal watercraft in the Mississippi Sound. J. Mar. Biol. Assoc. U.K. 88(6):1139–1143.
Mullin, K.D. 1988. Comparative seasonal abundance and ecology of bottlenose dolphins (Tursiops truncatus) in three habitats of the north-central Gulf of Mexico. Ph.D. thesis. Mississippi State University, Starkville. 135 pp.
Mullin, K.D., T. McDonald, R.S. Wells, B.C. Balmer, T. Speakman, C. Sinclair, E.S. Zolman, F. Hornsby, S.M. McBride, K.A. Wilkinson and L.H. Schwacke. 2017. Density, abundance, survival, and ranging patters of common bottlenose dolphins (Tursiops truncatus) in Mississippi Sound following the Deepwater Horizon oil spill. PLoS ONE 12(10):e0186265.
Nance, J., W. Keithly, Jr., C. Caillouet, Jr., J. Cole, W. Gaidry, B. Gallaway, W. Griffin, R. Hart and M. Travis. 2008. Estimation of effort, maximum sustainable yield, and maximum economic yield in the shrimp fishery of the Gulf of Mexico. NOAA Tech. Memo. NMFS-SEFSC-570. 71 pp.
NMFS. 2016. Guidelines for preparing stock assessment reports pursuant to the 1994 amendments to the MMPA. NMFS Instruction 02-204-01, February 22, 2016. Available from: https://www.fisheries.noaa.gov/national/marine-mammal-protection/guidelines-assessing-marine-mammal-stocks.
Nowacek, S.M., R.S. Wells and A.R. Solow. 2001. Short-term effects of boat traffic on bottlenose dolphins, Tursiops truncatus, in Sarasota Bay, Florida. Mar. Mamm. Sci. 17(4):673–688.
OSAT-2 (Operational Science Advisory Team ). 2011. Summary report for fate and effects of remnant oil remaining in the beach environment. Annex B: Spatial oil distribution. Available from: http://www.restorethegulf.gov/release/2011/03/01/osat-2-fate-and-effects-oil-beaches
Peltier, H., W. Dabin, P. Daniel, O. Van Canneyt, G. Dorémus, M. Huon and V. Ridoux. 2012. The significance of stranding data as indicators of cetacean populations at sea: modelling the drift of cetacean carcasses. Ecol. Indic. 18:278–290.
Powell, J.R. and R.S. Wells. 2011. Recreational fishing depredation and associated behaviors involving common bottlenose dolphins (Tursiops truncatus) in Sarasota Bay, Florida. Mar. Mamm. Sci. 27(1):111–129.
Powell, J.R., A.F. Machernis, L.K. Engleby, N.A. Farmer and T.R. Spradlin. 2018. Sixteen years later: an updated evaluation of the impacts of chronic human interactions with bottlenose dolphins (Tursiops truncatus) in Panama City, Florida, USA. J. Cetacean Res. Manage. 19:79–93.
Quintana-Rizzo, E. and R.S. Wells. 2001. Resighting and association patterns of bottlenose dolphins (Tursiops truncatus) in the Cedar Keys, Florida: Insights into social organization. Can. J. Zool. 79(3):447–456.
Read, A.J. 2008. The looming crisis: Interactions between marine mammals and fisheries. J. Mammal. 89(3):541–548.
Reeves, R.R. and S. Leatherwood. 1984. Live-capture fisheries for cetaceans in USA and Canadian waters, 1973- 1982. Rep. Int. Whal. Comm. 34:497–507. Rosel, P.E., L.A. Wilcox, C. Sinclair, T.R. Speakman, M.C. Tumlin, J.A. Litz, and E.S. Zolman. 2017. Genetic
assignment to stock of stranded common bottlenose dolphins in southeastern Louisiana after the Deepwater Horizon oil spill. Endang. Species Res. 33:221–234.
Samuels, A. and L. Bejder. 2004. Chronic interactions between humans and free-ranging bottlenose dolphins near Panama City Beach, Florida, USA. J. Cetacean Res. Manage. 6(1):69–77.
Samuels, A. and L. Engleby. 2007. Evaluating impacts of tourism on free-ranging bottlenose dolphins near Key West, Florida. Final Technical Report, PWD Proposal # 2003-18. Available from: Dolphin Ecology Project, 727 11th Avenue South, St. Petersburg, FL 33701.
Schwacke, L.H., E.O. Voit, L.J. Hansen, R.S. Wells, G.B. Mitchum, A.A. Hohn and P.A. Fair. 2002. Probabilistic risk assessment of reproductive effects of polychlorinated biphenyls on bottlenose dolphins (Tursiops truncatus) from the southeast United States coast. Environ. Toxicol. Chem. 21(12):2752–2764.
Schwacke , L.H., C.R. Smith, F.I. Townsend, R.S. Wells, L.B. Hart, B.C. Balmer, T.K. Collier, S. De Guise, M.M. Fry, L.J. Guillette, S.V. Lamb, S.M. Lane, W.E. McFee, N.J. Place, M.C. Tumlin, G.M. Ylitalo, E.S. Zolman and T.K. Rowles. 2014. Health of bottlenose dolphins (Tursiops truncatus) in Barataria Bay, Louisiana following the Deepwater Horizon oil spill. Environ. Sci. Technol. 48(1):93–103.
Schwacke, L.H., L. Thomas, R.S. Wells, W.E. McFee, A.A. Hohn, K.D. Mullin, E.S. Zolman, B.M. Quigley, T.K. Rowles and J.H. Schwacke. 2017. Quantifying injury to common bottlenose dolphins from the Deepwater

182
Horizon oil spill using an age-, sex- and class-structured population model. Endanger. Spec. Res. 33:265–279.
Scott, G.P. 1990. Management-oriented research on bottlenose dolphins in the Southeast Fisheries Center. Pages 623-639 in: S. Leatherwood and R.R. Reeves, (eds.) The bottlenose dolphin. Academic Press, San Diego, CA.
Scott, G.P., D.M. Burn, L.J. Hansen and R.E. Owen. 1989. Estimates of bottlenose dolphin abundance in the Gulf of Mexico from regional aerial surveys. CRD 88/89-07. Available from: NMFS, Southeast Fisheries Science Center, 75 Virginia Beach Dr., Miami, FL 33149.
Scott, M.D., R.S. Wells and A.B. Irvine. 1990. A long-term study of bottlenose dolphins on the west coast of Florida. Pages 235–244 in: S. Leatherwood and R.R. Reeves (eds.), The bottlenose dolphin. Academic Press, San Diego, CA.
Sellas, A.B., R.S. Wells and P.E. Rosel. 2005. Mitochondrial and nuclear DNA analyses reveal fine scale geographic structure in bottlenose dolphins (Tursiops truncatus) in the Gulf of Mexico. Conserv. Genet. 6(5):715–728.
Shane, S.H. 1977. The population biology of the Atlantic bottlenose dolphin, Tursiops truncatus, in the Aransas Pass area of Texas. M. Sc. thesis. Texas A&M University, College Station. 238 pp.
Shane, S.H. 1990. Behavior and ecology of the bottlenose dolphin at Sanibel Island, Florida. Pages 245–265 in: S. Leatherwood and R.R. Reeves (eds.), The bottlenose dolphin. Academic Press, San Diego, CA.
Shane, S.H. 2004. Residence patterns, group characteristics, and association patterns of bottlenose dolphins near Sanibel Island, Florida. G. Mex. Sci. 22(1):1–12.
Shane, S.H., R.S. Wells and B. Würsig. 1986. Ecology, behavior, and social organization of the bottlenose dolphin: A review. Mar. Mamm. Sci. 2(1):34–63.
Soldevilla, M.S., L.P. Garrison, E. Scott-Denton and J.M. Nance. 2015. Estimation of marine mammal bycatch mortality in the Gulf of Mexico shrimp otter trawl fishery. NOAA Tech. Memo. NMFS-SEFSC-672, 70 pp.
Soldevilla, M.S., L.P. Garrison, E. Scott-Denton and R.A. Hart. 2016. Estimated bycatch mortality of marine mammals in the Gulf of Mexico shrimp otter trawl fishery during 2012 to 2014. NOAA Tech. Memo. NMFS-SEFSC-697. 47 pp.
Twiner, M.J., L.J. Flewelling, S.E. Fire, S.R. Bowen-Stevens, J.K. Gaydos, C.K. Johnson, J.H. Landsberg, T.A. Leighfield, B. Mase-Guthrie, L. Schwacke, F.M. Van Dolah, Z. Wang and T.K. Rowles. 2012. Comparative analysis of three brevetoxin-associated bottlenose dolphin (Tursiops truncatus) mortality events in the Florida panhandle region (USA). PLoS ONE 7(8): e42974.
Tyson, R.B. and R.S. Wells. 2016. Sarasota Bay/Little Sarasota Bay bottlenose dolphin abundance estimates: 2015. Prepared for National Marine Fisheries Service, northern Gulf of Mexico bay, sound, and estuary
bottlenose dolphin stock blocks B20 and B35, combined. Southeast Fisheries Science Center, Protected Resources and Biodiversity Division, 75 Virginia Beach Dr., Miami, FL 33140. PRBD Contribution # PRBD-2016-02, 21 pp. Available from: https://www.sefsc.noaa.gov/P_QryLDS/download/PRB84_PRBD-2016-02.pdf?id=LDS
Tyson, R.B., S.M. Nowacek and D.P. Nowacek. 2011. Community structure and abundance of bottlenose dolphins Tursiops truncatus in coastal waters of the northeast Gulf of Mexico. Mar. Ecol. Prog. Ser. 438:253–265.
Urian, K.W. 2002. Community structure of bottlenose dolphins (Tursiops truncatus) in Tampa Bay, Florida, USA. M. Sc. thesis. University of North Carolina, Wilmington. 26 pp.
Urian, K.W., D.A. Duffield, A.J. Read, R.S. Wells and D.D. Shell. 1996. Seasonality of reproduction in bottlenose dolphins, Tursiops truncatus. J. Mamm. 77(2):394–403.
Urian, K.W., S. Hofmann, R.S. Wells and A.J. Read. 2009. Fine-scale population structure of bottlenose dolphins (Tursiops truncatus) in Tampa Bay, Florida. Mar. Mamm. Sci. 25(3):619–638.
Vail, C.S. 2016. An overview of increasing incidents of bottlenose dolphin harassment in the Gulf of Mexico and possible solutions. Front. Mar. Sci. 3:110.
Varanasi, U., K.L. Tilbury, D.W. Brown, M.M. Krahn, C.A. Wigren, R.C. Clark and S.L. Chan. 1992. Chemical contaminants in bottlenose dolphins stranded along the Gulf of Mexico during 1990. Pages 56-86 in: L.J. Hansen (ed.), Report on investigation of 1990 Gulf of Mexico bottlenose dolphin strandings. Southeast Fisheries Science Center Contribution MIA-92/93-21.
Venn-Watson, S., L. Garrison, J. Litz, E. Fougeres, B. Mase, G. Rappucci, E. Stratton, R. Carmichael, D. Odell, D. Shannon, S. Shippee, S. Smith, L. Staggs, M. Tumlin, H. Whitehead and T. Rowles. 2015a. Demographic clusters identified within the northern Gulf of Mexico common bottlenose dolphin (Tursiops truncatus) Unusual Mortality Event: January 2010 - June 2013. PLoS ONE 10(2):e0117248.
183
Venn-Watson, S., K.M. Colegrove, J. Litz, M. Kinsel, K. Terio, J. Saliki, S. Fire, R. Carmichael, C. Chevis, W. Hatchett, J. Pitchford, M. Tumlin, C. Field, S. Smith, R. Ewing, D. Fauquier, G. Lovewell, H. Whitehead, D. Rotstein, W. McFee, E. Fougeres and T. Rowles. 2015b. Adrenal gland and lung lesions in Gulf of Mexico common bottlenose dolphins (Tursiops truncatus) found dead following the Deepwater Horizon Oil Spill. PLoS ONE 10(5):e0126538.
Wade, P.R. and R.P. Angliss. 1997. Guidelines for assessing marine mammal stocks: Report of the GAMMS Workshop April 3-5, 1996, Seattle, Washington. NOAA Tech. Memo. NMFS-OPR-12. 93 pp.
Weller, D.W. 1998. Global and regional variation in the biology and behavior of bottlenose dolphins. Ph.D. thesis. Texas A&M University, College Station. 142 pp.
Wells, R.S. 1986. Population structure of bottlenose dolphins: Behavioral studies along the central west coast of Florida. Contract report to NMFS, SEFSC. Contract No. 45-WCNF-5-00366. Available from: NMFS, Southeast Fisheries Science Center, 75 Virginia Beach Dr., Miami, FL 33149. 58 pp.
Wells, R.S. 1991. The role of long-term study in understanding the social structure of a bottlenose dolphin community. Pages 199–225 in: K. Pryor and K.S. Norris (eds.), Dolphin societies: Discoveries and puzzles. University of California Press, Berkeley.
Wells, R.S. 2003. Dolphin social complexity: Lessons from long-term study and life history. Pages 32–56 in: F.B.M. de Waal and P.L. Tyack (eds.), Animal social complexity: Intelligence, culture, and individualized societies. Harvard University Press, Cambridge, MA.
Wells, R. S. 2014. Social structure and life history of bottlenose dolphins near Sarasota Bay, Florida: Insights from four decades and five generations. Pages 149–172 in: J. Yamagiwa and L. Karczmarski (eds.), Primates and cetaceans: Field research and conservation of complex mammalian societies. Primatology Monographs. Springer Japan, Tokyo.
Wells, R.S. and M.D. Scott. 1990. Estimating bottlenose dolphin population parameters from individual identification and capture-release techniques. Pages 407–415 in: P.S. Hammond, S.A. Mizroch and G.P. Donovan (eds.), Individual recognition of cetaceans: Use of photo-identification and other techniques to estimate population parameters. Rep. Int. Whal. Comm., Cambridge, U.K. Special Issue 12.
Wells, R.S. and M.D. Scott. 1997. Seasonal incidence of boat strikes on bottlenose dolphins near Sarasota, Florida. Mar. Mamm. Sci. 13(3):475–480.
Wells, R.S. and M.D. Scott. 1999. Bottlenose dolphins. Pages 137-182 in: S.H. Ridgway and R. Harrison (eds.), Handbook of marine mammals. Vol. 6: The second book of dolphins and the porpoises. Academic Press, San Diego, CA.
Wells, R.S., M.D. Scott and A.B. Irvine. 1987. The social structure of free ranging bottlenose dolphins. Pages 247-305 in: H. Genoways (ed.), Current Mammalogy, Vol. 1. Plenum Press, New York.
Wells, R.S., M.K. Bassos, K.W. Urian, W.J. Carr and M.D. Scott. 1996a. Low-level monitoring of bottlenose dolphins, Tursiops truncatus, in Charlotte Harbor, Florida: 1990-1994. NOAA Tech. Memo. NMFS-SEFSC-384, 36 pp.
Wells, R.S., K.W. Urian, A.J. Read, M.K. Bassos, W.J. Carr and M.D. Scott. 1996b. Low-level monitoring of bottlenose dolphins, Tursiops truncatus, in Tampa Bay, Florida: 1988-1993. NOAA Tech. Memo. NMFS-SEFSC-385, 25 pp.
Wells, R.S., M.K. Bassos, K.W. Urian, S.H. Shane, E.C.G. Owen, C.F. Weiss, W.J. Carr and M.D. Scott. 1997. Low-level monitoring of bottlenose dolphins, Tursiops truncatus, in Pine Island Sound, Florida: 1996. Contract report to National Marine Fisheries Service, Southeast Fisheries Science Center Contribution No. 40-WCNF601958. Available from: NMFS, Southeast Fisheries Science Center, 75 Virginia Beach Dr., Miami, FL 33149.
Wells, R.S., S. Hofmann and T.L. Moors. 1998. Entanglement and mortality of bottlenose dolphins, Tursiops truncatus, in recreational fishing gear in Florida. Fish. Bull. 96(3):647–650.
Wells, R.S., V. Tornero, A. Borrell, A. Aguilar, T.K. Rowles, H.L. Rhinehart, S. Hofmann, W.M. Jarman, A.A. Hohn and J.C. Sweeney. 2005. Integrating life history and reproductive success data to examine potential relationships with organochlorine compounds for bottlenose dolphins (Tursiops truncatus) in Sarasota Bay, Florida. Sci. Total Environ. 349(1–3):106–119.
Wells, R.S., J.B. Allen, S. Hoffman, K. Bassos-Hull, D.A. Fauquier, N.B. Barros, R.E. DeLynn, G. Sutton, V. Socha and M.D. Scott. 2008. Consequences of injuries on survival and reproduction of common bottlenose dolphins (Tursiops truncatus) along the west coast of Florida. Mar. Mamm. Sci. 24(4):774–794.
Wells, R.S., J.B. Allen, G. Lovewell, J. Gorzelany, R.E. DeLynn, D.A. Fauquier and N.B. Barros. 2015. Carcass-recovery rates for resident bottlenose dolphins in Sarasota Bay, Florida. Mar. Mamm. Sci. 31(1):355–368.

184
Wells, R.S., L.H. Schwacke, T.K. Rowles, B.C. Balmer, E. Zolman, T. Speakman, F.I. Townsend, M.C. Tumlin, A. Barleycorn and K.A. Wilkinson. 2017. Ranging patterns of common bottlenose dolphins (Tursiops truncatus) in Barataria Bay, Louisiana, following the Deepwater Horizon oil spill. Endanger. Spec. Res. 33:159–180.
Zollett, E.A. and A.J. Read. 2006. Depredation of catch by bottlenose dolphins (Tursiops truncatus) in the Florida king mackerel (Scomberomorus cavalla) troll fishery. Fish. Bull. 104(3):343–349.
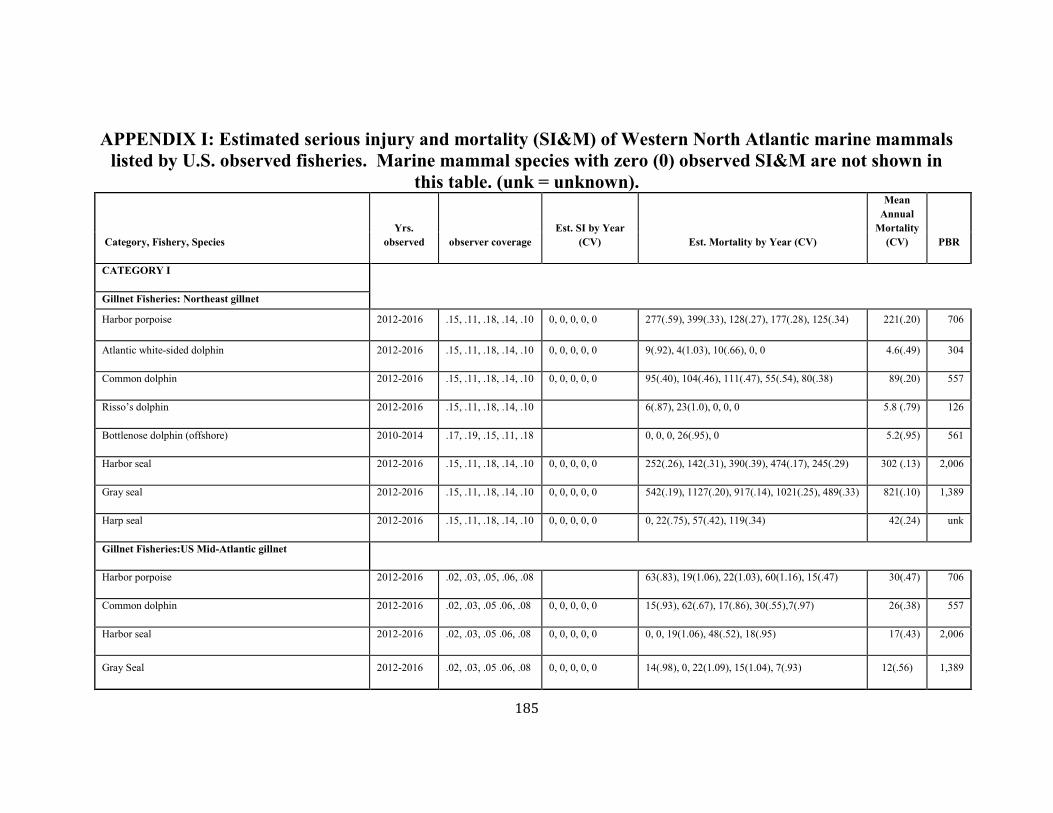
185
APPENDIX I: Estimated serious injury and mortality (SI&M) of Western North Atlantic marine mammals listed by U.S. observed fisheries. Marine mammal species with zero (0) observed SI&M are not shown in
this table. (unk = unknown).
Category, Fishery, Species Yrs.
observed observer coverage Est. SI by Year
(CV) Est. Mortality by Year (CV)
Mean Annual
Mortality (CV) PBR
CATEGORY I
Gillnet Fisheries: Northeast gillnet
Harbor porpoise 2012-2016 .15, .11, .18, .14, .10 0, 0, 0, 0, 0 277(.59), 399(.33), 128(.27), 177(.28), 125(.34) 221(.20) 706
Atlantic white-sided dolphin 2012-2016 .15, .11, .18, .14, .10 0, 0, 0, 0, 0 9(.92), 4(1.03), 10(.66), 0, 0 4.6(.49) 304
Common dolphin 2012-2016 .15, .11, .18, .14, .10 0, 0, 0, 0, 0 95(.40), 104(.46), 111(.47), 55(.54), 80(.38) 89(.20) 557
Risso’s dolphin 2012-2016 .15, .11, .18, .14, .10 6(.87), 23(1.0), 0, 0, 0 5.8 (.79) 126
Bottlenose dolphin (offshore) 2010-2014 .17, .19, .15, .11, .18 0, 0, 0, 26(.95), 0 5.2(.95) 561
Harbor seal 2012-2016 .15, .11, .18, .14, .10 0, 0, 0, 0, 0 252(.26), 142(.31), 390(.39), 474(.17), 245(.29) 302 (.13) 2,006
Gray seal 2012-2016 .15, .11, .18, .14, .10 0, 0, 0, 0, 0 542(.19), 1127(.20), 917(.14), 1021(.25), 489(.33) 821(.10) 1,389
Harp seal 2012-2016 .15, .11, .18, .14, .10 0, 0, 0, 0, 0 0, 22(.75), 57(.42), 119(.34) 42(.24) unk
Gillnet Fisheries:US Mid-Atlantic gillnet
Harbor porpoise 2012-2016 .02, .03, .05, .06, .08 63(.83), 19(1.06), 22(1.03), 60(1.16), 15(.47) 30(.47) 706
Common dolphin 2012-2016 .02, .03, .05 .06, .08 0, 0, 0, 0, 0 15(.93), 62(.67), 17(.86), 30(.55),7(.97) 26(.38) 557
Harbor seal 2012-2016 .02, .03, .05 .06, .08 0, 0, 0, 0, 0 0, 0, 19(1.06), 48(.52), 18(.95) 17(.43) 2,006
Gray Seal 2012-2016 .02, .03, .05 .06, .08 0, 0, 0, 0, 0 14(.98), 0, 22(1.09), 15(1.04), 7(.93) 12(.56) 1,389
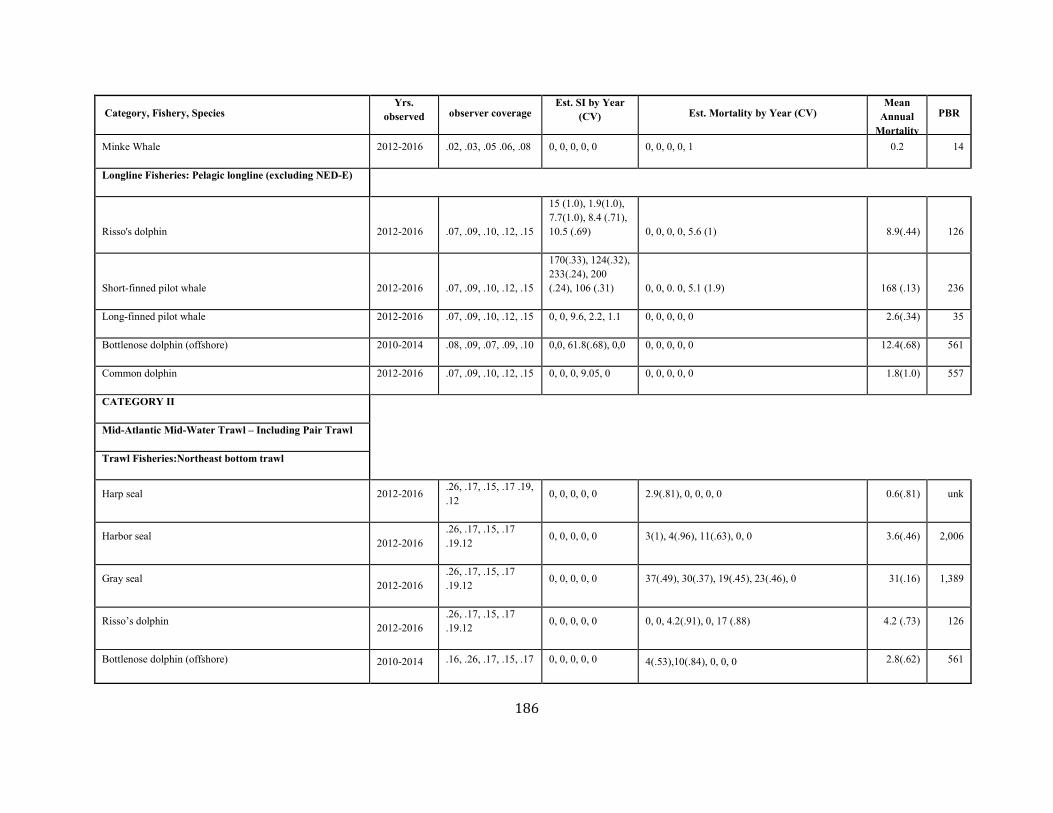
186
Category, Fishery, Species Yrs.
observed observer coverage Est. SI by Year
(CV) Est. Mortality by Year (CV) Mean
Annual Mortality
PBR
Minke Whale 2012-2016 .02, .03, .05 .06, .08 0, 0, 0, 0, 0 0, 0, 0, 0, 1 0.2 14
Longline Fisheries: Pelagic longline (excluding NED-E)
Risso's dolphin 2012-2016 .07, .09, .10, .12, .15
15 (1.0), 1.9(1.0), 7.7(1.0), 8.4 (.71), 10.5 (.69) 0, 0, 0, 0, 5.6 (1) 8.9(.44) 126
Short-finned pilot whale 2012-2016 .07, .09, .10, .12, .15
170(.33), 124(.32), 233(.24), 200 (.24), 106 (.31) 0, 0, 0. 0, 5.1 (1.9) 168 (.13) 236
Long-finned pilot whale 2012-2016 .07, .09, .10, .12, .15 0, 0, 9.6, 2.2, 1.1 0, 0, 0, 0, 0 2.6(.34) 35
Bottlenose dolphin (offshore) 2010-2014 .08, .09, .07, .09, .10 0,0, 61.8(.68), 0,0 0, 0, 0, 0, 0 12.4(.68) 561
Common dolphin 2012-2016 .07, .09, .10, .12, .15 0, 0, 0, 9.05, 0 0, 0, 0, 0, 0 1.8(1.0) 557
CATEGORY II
Mid-Atlantic Mid-Water Trawl – Including Pair Trawl
Trawl Fisheries:Northeast bottom trawl
Harp seal 2012-2016 .26, .17, .15, .17 .19, .12 0, 0, 0, 0, 0 2.9(.81), 0, 0, 0, 0 0.6(.81) unk
Harbor seal 2012-2016
.26, .17, .15, .17
.19.12 0, 0, 0, 0, 0 3(1), 4(.96), 11(.63), 0, 0 3.6(.46) 2,006
Gray seal 2012-2016 .26, .17, .15, .17 .19.12 0, 0, 0, 0, 0 37(.49), 30(.37), 19(.45), 23(.46), 0 31(.16) 1,389
Risso’s dolphin 2012-2016 .26, .17, .15, .17 .19.12 0, 0, 0, 0, 0 0, 0, 4.2(.91), 0, 17 (.88) 4.2 (.73) 126
Bottlenose dolphin (offshore) 2010-2014 .16, .26, .17, .15, .17 0, 0, 0, 0, 0 4(.53),10(.84), 0, 0, 0 2.8(.62) 561
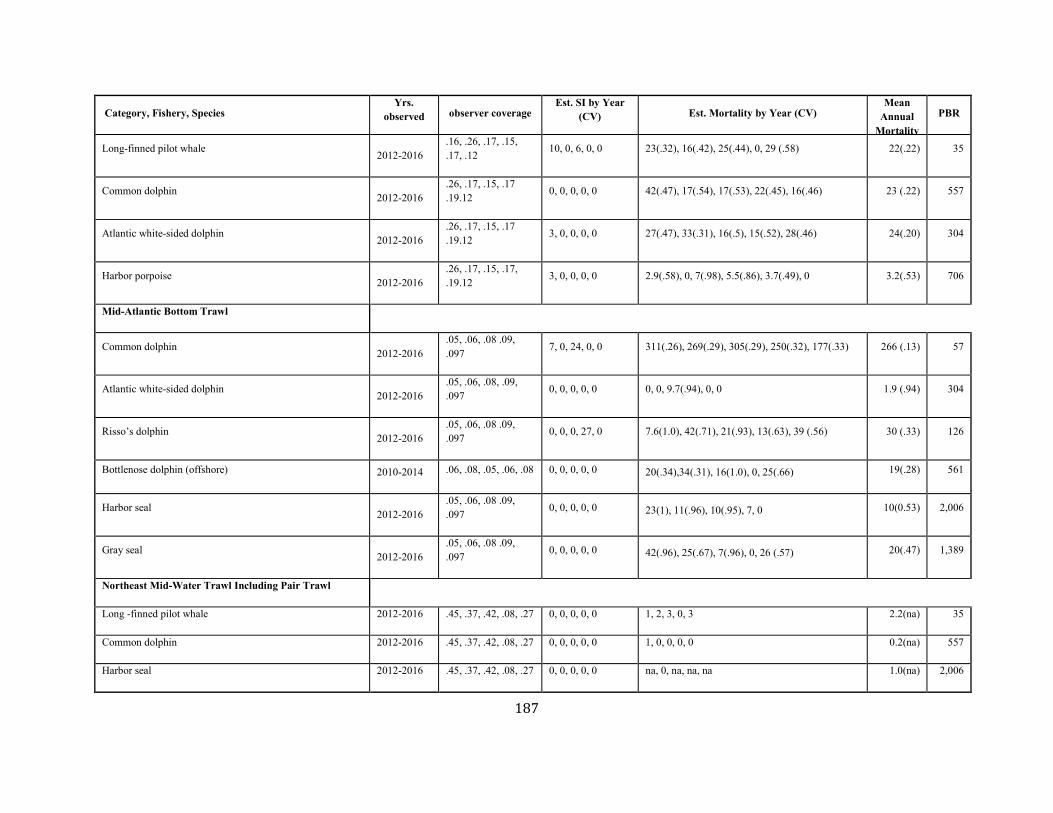
187
Category, Fishery, Species Yrs.
observed observer coverage Est. SI by Year
(CV) Est. Mortality by Year (CV) Mean
Annual Mortality
PBR
Long-finned pilot whale 2012-2016
.16, .26, .17, .15,
.17, .12 10, 0, 6, 0, 0 23(.32), 16(.42), 25(.44), 0, 29 (.58) 22(.22) 35
Common dolphin 2012-2016 .26, .17, .15, .17 .19.12 0, 0, 0, 0, 0 42(.47), 17(.54), 17(.53), 22(.45), 16(.46) 23 (.22) 557
Atlantic white-sided dolphin 2012-2016 .26, .17, .15, .17 .19.12 3, 0, 0, 0, 0 27(.47), 33(.31), 16(.5), 15(.52), 28(.46) 24(.20) 304
Harbor porpoise 2012-2016 .26, .17, .15, .17, .19.12 3, 0, 0, 0, 0 2.9(.58), 0, 7(.98), 5.5(.86), 3.7(.49), 0 3.2(.53) 706
Mid-Atlantic Bottom Trawl
Common dolphin 2012-2016 .05, .06, .08 .09, .097 7, 0, 24, 0, 0 311(.26), 269(.29), 305(.29), 250(.32), 177(.33) 266 (.13) 57
Atlantic white-sided dolphin 2012-2016 .05, .06, .08, .09, .097 0, 0, 0, 0, 0 0, 0, 9.7(.94), 0, 0 1.9 (.94) 304
Risso’s dolphin 2012-2016 .05, .06, .08 .09, .097 0, 0, 0, 27, 0 7.6(1.0), 42(.71), 21(.93), 13(.63), 39 (.56) 30 (.33) 126
Bottlenose dolphin (offshore) 2010-2014 .06, .08, .05, .06, .08 0, 0, 0, 0, 0 20(.34),34(.31), 16(1.0), 0, 25(.66) 19(.28) 561
Harbor seal 2012-2016 .05, .06, .08 .09, .097 0, 0, 0, 0, 0 23(1), 11(.96), 10(.95), 7, 0 10(0.53) 2,006
Gray seal 2012-2016 .05, .06, .08 .09, .097 0, 0, 0, 0, 0 42(.96), 25(.67), 7(.96), 0, 26 (.57) 20(.47) 1,389
Northeast Mid-Water Trawl Including Pair Trawl
Long -finned pilot whale 2012-2016 .45, .37, .42, .08, .27 0, 0, 0, 0, 0 1, 2, 3, 0, 3 2.2(na) 35
Common dolphin 2012-2016 .45, .37, .42, .08, .27 0, 0, 0, 0, 0 1, 0, 0, 0, 0 0.2(na) 557
Harbor seal 2012-2016 .45, .37, .42, .08, .27 0, 0, 0, 0, 0 na, 0, na, na, na 1.0(na) 2,006
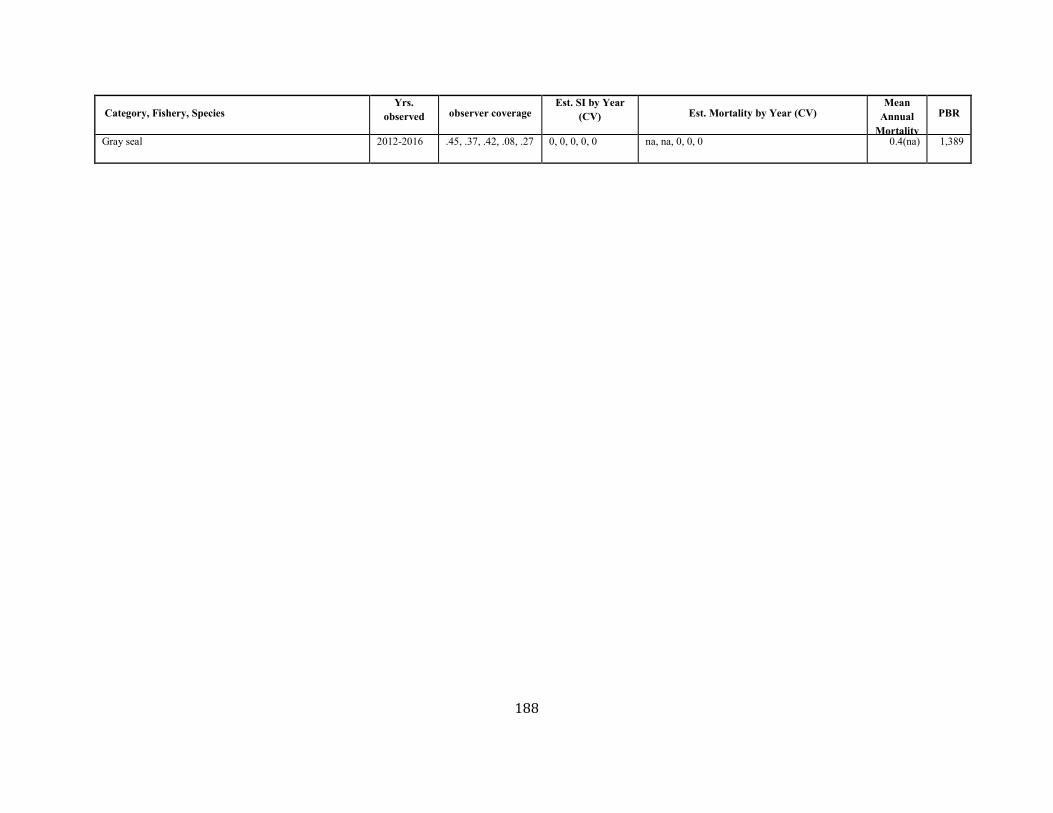
188
Category, Fishery, Species Yrs.
observed observer coverage Est. SI by Year
(CV) Est. Mortality by Year (CV) Mean
Annual Mortality
PBR
Gray seal 2012-2016 .45, .37, .42, .08, .27 0, 0, 0, 0, 0 na, na, 0, 0, 0 0.4(na) 1,389
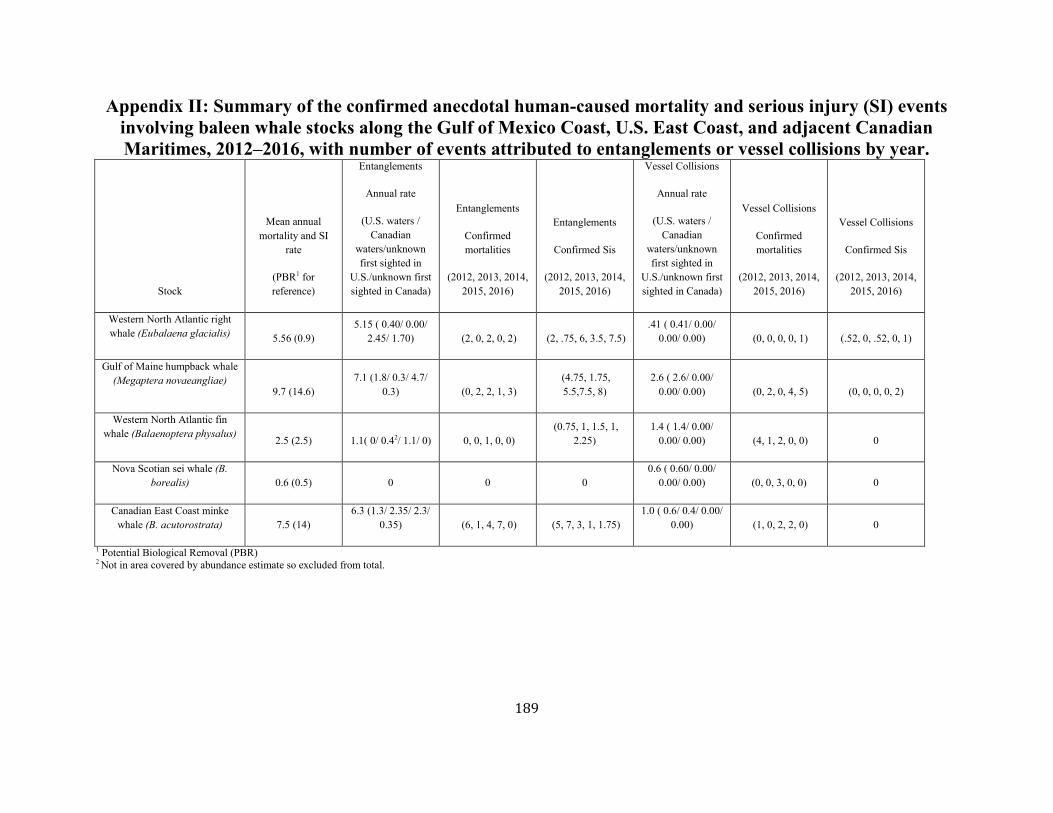
189
Appendix II: Summary of the confirmed anecdotal human-caused mortality and serious injury (SI) events involving baleen whale stocks along the Gulf of Mexico Coast, U.S. East Coast, and adjacent Canadian Maritimes, 2012–2016, with number of events attributed to entanglements or vessel collisions by year.
Stock
Mean annual mortality and SI
rate
(PBR1 for reference)
Entanglements
Annual rate
(U.S. waters / Canadian
waters/unknown first sighted in
U.S./unknown first sighted in Canada)
Entanglements
Confirmed mortalities
(2012, 2013, 2014, 2015, 2016)
Entanglements
Confirmed Sis
(2012, 2013, 2014, 2015, 2016)
Vessel Collisions
Annual rate
(U.S. waters / Canadian
waters/unknown first sighted in
U.S./unknown first sighted in Canada)
Vessel Collisions
Confirmed mortalities
(2012, 2013, 2014, 2015, 2016)
Vessel Collisions
Confirmed Sis
(2012, 2013, 2014, 2015, 2016)
Western North Atlantic right whale (Eubalaena glacialis) 5.56 (0.9)
5.15 ( 0.40/ 0.00/ 2.45/ 1.70) (2, 0, 2, 0, 2) (2, .75, 6, 3.5, 7.5)
.41 ( 0.41/ 0.00/ 0.00/ 0.00) (0, 0, 0, 0, 1) (.52, 0, .52, 0, 1)
Gulf of Maine humpback whale
(Megaptera novaeangliae) 9.7 (14.6)
7.1 (1.8/ 0.3/ 4.7/ 0.3) (0, 2, 2, 1, 3)
(4.75, 1.75, 5.5,7.5, 8)
2.6 ( 2.6/ 0.00/ 0.00/ 0.00) (0, 2, 0, 4, 5) (0, 0, 0, 0, 2)
Western North Atlantic fin whale (Balaenoptera physalus) 2.5 (2.5) 1.1( 0/ 0.42/ 1.1/ 0) 0, 0, 1, 0, 0)
(0.75, 1, 1.5, 1, 2.25)
1.4 ( 1.4/ 0.00/ 0.00/ 0.00) (4, 1, 2, 0, 0) 0
Nova Scotian sei whale (B. borealis) 0.6 (0.5) 0 0 0
0.6 ( 0.60/ 0.00/ 0.00/ 0.00) (0, 0, 3, 0, 0) 0
Canadian East Coast minke whale (B. acutorostrata) 7.5 (14)
6.3 (1.3/ 2.35/ 2.3/ 0.35) (6, 1, 4, 7, 0) (5, 7, 3, 1, 1.75)
1.0 ( 0.6/ 0.4/ 0.00/ 0.00) (1, 0, 2, 2, 0) 0
1 Potential Biological Removal (PBR) 2 Not in area covered by abundance estimate so excluded from total.

190
Appendix III Fishery Descriptions
This appendix is broken into two parts: Part A describes commercial fisheries that have documented interactions with marine mammals in the Atlantic Ocean; and Part B describes commercial fisheries that have documented interactions with marine mammals in the Gulf of Mexico. A complete list of all known fisheries for both oceanic regions, the List of Fisheries, is published in the Federal Register annually. Each part of this appendix contains three sections: I. data sources used to document marine mammal mortality/entanglements and commercial fishing effort trip locations, II. links to fishery descriptions for Category I, II and some category III fisheries that have documented interactions with marine mammals and their historical level of observer coverage, and III. historical fishery descriptions.
Part A. Description of U.S. Atlantic Commercial Fisheries
I. Data Sources Items 1-5 describe sources of marine mammal mortality, serious injury or entanglement data; items 6-9 describe the sources of commercial fishing effort data used to summarize different components of each fishery (i.e. active number of permit holders, total effort, temporal and spatial distribution) and generate maps depicting the location and amount of fishing effort.
1. Northeast Region Fisheries Observer Program (NEFOP) In 1989 a Fisheries Observer Program was implemented in the Northeast Region (Maine-Rhode Island) to document incidental bycatch of marine mammals in the Northeast Region Multi-species Gillnet Fishery. In 1993 sampling was expanded to observe bycatch of marine mammals in Gillnet Fisheries in the Mid-Atlantic Region (New York-North Carolina). The Northeast Fisheries Observer Program (NEFOP) has since been expanded to sample multiple gear types in both the Northeast and Mid-Atlantic Regions for documenting and monitoring interactions of marine mammals, sea turtles and finfish bycatch attributed to commercial fishing operations. At sea observers onboard commercial fishing vessels collect data on fishing operations, gear and vessel characteristics, kept and discarded catch composition, bycatch of protected species, animal biology, and habitat (NMFS-NEFSC 2019).
2. Southeast Region Fishery Observer Programs Three Fishery Observer Programs are managed by the Southeast Fisheries Science Center (SEFSC) that observe commercial fishery activity in U.S. Atlantic waters. The Pelagic Longline Observer Program (POP) administers a mandatory observer program for the U.S. Atlantic Large Pelagics Longline Fishery. The program has been in place since 1992 and randomly allocates observer effort by eleven geographic fishing areas proportional to total reported effort in each area and quarter. Observer coverage levels are mandated under the Highly Migratory Species Fisheries Management Plan (HMS FMP, 50 CFR Part 635). The second program is the Shark Gillnet Observer Program that observes the Southeastern U.S. Atlantic Shark Gillnet Fishery. The Observer Program is mandated under the HMS FMP, the Atlantic Large Whale Take Reduction Plan (ALWTRP) (50 CFR Part 229.32), and the Biological Opinion under Section 7 of the Endangered Species Act. Observers are deployed on any active fishing vessel reporting shark drift gillnet effort. In 2005, this program also began to observe sink gillnet fishing for sharks along the southeastern U.S. coast. The observed fleet includes vessels with an active directed shark permit and fish with sink gillnet gear (Carlson and Bethea 2007). The third program is the Southeastern Shrimp Otter Trawl Fishery Observer Program. Prior to 2007, this was a voluntary program administered by SEFSC in cooperation with the Gulf and South Atlantic Fisheries Foundation. The program was funding and project dependent, therefore observer coverage is not necessarily randomly allocated across the fishery. In 2007, the observer program was expanded, and it became mandatory for fishing vessels to take an observer if selected. The program now includes more systematic sampling of the fleet based upon reported landings and effort patterns. The total level of observer coverage for this program is approximately 1% of the total fishery effort. In each Observer Program, the observers record information on the total target species catch, the number and type of interactions with protected species (including both marine mammals and sea turtles), and biological information on species caught.
3. Regional Marine Mammal Stranding Networks The Northeast and Southeast Region Stranding Networks are components of the Marine Mammal Health and Stranding Response Program (MMHSRP). The goals of the MMHSRP are to facilitate collection and dissemination of data, assess health trends in marine mammals, correlate health with other biological and environmental parameters, and coordinate effective responses to unusual mortality events (Becker et al. 1994). Since 1997, the Northeast Region Marine Mammal Stranding Network has been collecting and storing data on marine mammal strandings and entanglements that occur from Maine through Virginia. The Southeast Region Strandings Program is responsible for data collection and stranding response coordination along the Atlantic coast from North Carolina to Florida, along the U.S. Gulf of Mexico coast from Florida through Texas, and in the U.S. Virgin Islands and Puerto Rico. Prior to 1997, stranding and entanglement data were maintained by the New England Aquarium and the National Museum of Natural History, Washington, D.C. Volunteer participants, acting under a letter of agreement, collect data on stranded animals that include: species; event date and location; details of the event (i.e., signs of human interaction) and determination on cause of death; animal
191
disposition; morphology; and biological samples. Collected data are reported to the appropriate Regional Stranding Network Coordinator and are maintained in regional and national databases.
4. Marine Mammal Authorization Program Commercial fishing vessels engaging in Category I or II fisheries are automatically registered under the Marine Mammal Authorization Program (MMAP) in order to lawfully take a non-endangered/threatened marine mammal incidental to fishing operations. These fishermen are required to carry an Authorization Certificate onboard while participating in the listed fishery, must be prepared to carry a fisheries observer if selected, and must comply with all applicable take reduction plan regulations. All vessel owners, regardless of the category of fishery they are operating in, are required to report, within 48 hours of the incident and even if an observer has recorded the take, all incidental injuries and mortalities of marine mammals that have occurred as a result of fishing operations (NMFS-OPR 2019). Events are reported by fishermen on the Marine Mammal Mortality/Injury forms then submitted to and maintained by the NMFS Office of Protected Resources. The data reported include: captain and vessel demographics; gear type and target species; date, time and location of event; type of interaction; animal species; mortality or injury code; and number of interactions. Reporting can be done online at https://docs.google.com/a/noaa.gov/forms/d/e/1FAIpQLSfKe0moEVK24x1Jbly33A0MRAa2ljZgmAcCVO1hEXghtB3SYA/viewform.
5. Other Data Sources for Protected Species Interactions/Entanglements/Ship Strikes In addition to the above, data on fishery interactions/entanglements and vessel collisions with large cetaceans are reported from a variety of other sources including the New England Aquarium (Boston, Massachusetts); Provincetown Center for Coastal Studies (Provincetown, Massachusetts); U.S. Coast Guard; whale watch vessels; Canadian Department of Fisheries and Oceans (DFO)); and members of the Atlantic Large Whale Disentanglement Network. These data, photographs, etc. are maintained by the Protected Species Division at the Greater Atlantic Regional Fisheries Office (GARFO), the Protected Species Branch at the Northeast Fisheries Science Center (NEFSC) and the Southeast Fisheries Science Center (SEFSC).
6. Northeast Region Vessel Trip Reports The Northeast Region Vessel Trip Report Data Collection System is a mandatory, but self-reported, commercial fishing effort database (Wigley et al. 1998). The data collected include: species kept and discarded; gear types used; trip location; trip departure and landing dates; port; and vessel and gear characteristics. The reporting of these data is mandatory only for vessels fishing under a federal permit. Vessels fishing under a federal permit are required to report in the Vessel Trip Report even when they are fishing within state waters.
7. Southeast Region Fisheries Logbook System The Fisheries Logbook System (FLS) is maintained at the SEFSC and manages data submitted from mandatory Fishing Vessel Logbook Programs under several FMPs. In 1986 a comprehensive logbook program was initiated for the Large Pelagics Longline Fishery and this reporting became mandatory in 1992. Logbook reporting has also been initiated since the 1990s for a number of other fisheries including: Reef Fish Fisheries; Snapper-Grouper Complex Fisheries; federally managed Shark Fisheries; and King and Spanish Mackerel Fisheries. In each case, vessel captains are required to submit information on the fishing location, the amount and type of fishing gear used, the total amount of fishing effort (e.g., gear sets) during a given trip, the total weight and composition of the catch, and the disposition of the catch during each unit of effort (e.g., kept, released alive, released dead). FLS data are used to estimate the total amount of fishing effort in the fishery and thus expand bycatch rate estimates from observer data to estimates of the total incidental take of marine mammal species in a given fishery. More information is available at https://www.sefsc.noaa.gov/fisheries/logbook.htm.
8. Northeast Region Dealer Reported Data The Northeast Region Dealer Database houses trip level fishery statistics on fish species landed by market category, vessel ID, permit number, port location and date of landing, and gear type utilized. The data are collected by both federally permitted seafood dealers and NMFS port agents. Data are considered to represent a census of both vessels actively fishing with a federal permit and total fish landings. It also includes vessels that fish with a state permit (excluding the state of North Carolina) that land a federally managed species. Some states submit the same trip level data to the Northeast Region, but contrary to the data submitted by federally permitted seafood dealers, the trip level data reported by individual states does not include unique vessel and permit information. Therefore, the estimated number of active permit holders reported within this appendix should be considered a minimum estimate. It is important to note that dealers were previously required to report weekly in a dealer call in system. However, in recent years the NER regional dealer reporting system has instituted a daily electronic reporting system. Although the initial reports generated from this new system did experience some initial reporting problems, these problems have been addressed and the new daily electronic reporting system is providing better real time information to managers.
9. Northeast At Sea Monitoring Program At-sea monitors collect scientific, management, compliance, and other fisheries data onboard commercial fishing vessels through interviews of vessel captains and crew, observations of fishing operations, photographing catch, and measurements of selected portions of the catch and fishing gear. At-sea monitoring requirements are detailed under Amendment 16 to the NE Multispecies
192
Fishery Management Plan with a planned implementation date of May 1st, 2010. At-sea monitoring coverage is an integral part of catch monitoring to ensure that Annual Catch Limits are not exceeded. At-sea monitors collect accurate information on catch composition and the data are used to estimate total discards by sectors (and common pool), gear type, and stock area. Coverage levels are expected around 30%.
II. Marine Mammal Protection Act’s List of Fisheries The List of Fisheries (LOF) classifies U.S. commercial fisheries into one of three Categories according to the level of incidental mortality or serious injury of marine mammals:
I. frequent incidental mortality or serious injury of marine mammals II. occasional incidental mortality or serious injury of marine mammals
III. remote likelihood of/no known incidental mortality or serious injury of marine mammals
The Marine Mammal Protection Act (MMPA) mandates that each fishery be classified by the level of mortality or serious injury and mortality of marine mammals that occurs incidental to each fishery as reported in the annual Marine Mammal Stock Assessment Reports for each stock. A fishery may qualify as one Category for one marine mammal stock and another Category for a different marine mammal stock. A fishery is typically categorized on the LOF according to its highest level of classification (e.g., a fishery that qualifies for Category III for one marine mammal stock and Category II for another marine mammal stock will be listed under Category II). The fisheries listed below are linked to classification based on the most current LOF published in the Federal Register.
IV.U.S Atlantic Commercial Fisheries
Please see the List of Fisheries for more information on the following fisheries: Northeast Sink Gillnet; Northeast Anchored Float Gillnet Fishery; Northeast Drift Gillnet Fishery;Mid-Atlantic Gillnet;Mid-Atlantic Bottom Trawl; Northeast Bottom Trawl; Northeast Mid-Water Trawl Fishery (includes pair trawls); Mid-Atlantic Mid-Water Trawl Fishery (includes pair trawls); Bay of Fundy Herring Weir; Gulf of Maine Atlantic Herring Purse Seine Fishery; Northeast/Mid-Atlantic American Lobster Trap/Pot; Atlantic Mixed Species Trap/Pot Fishery; Atlantic Ocean, Caribbean, Gulf of Mexico Large Pelagics Longline; Southeast Atlantic Gillnet; Southeastern U.S. Atlantic Shark Gillnet Fishery; Atlantic Blue Crab Trap/Pot; Mid-Atlantic Haul/Beach Seine; North Carolina Inshore Gillnet Fishery; North Carolina Long Haul Seine; North Carolina Roe Mullet Stop Net; Virginia Pound Net; Mid-Atlantic Menhaden Purse Seine; Southeastern U.S. Atlantic/Gulf of Mexico Shrimp Trawl; and Southeastern U.S. Atlantic, Gulf of Mexico Stone Crab Trap/Pot Fishery.
IV. Historical Fishery Descriptions
Atlantic Foreign Mackerel Prior to 1977, there was no documentation of marine mammal bycatch in DWF activities off the Northeast coast of the U.S. With implementation of the Magnuson Fisheries Conservation and Management Act (MFCMA) in that year, an Observer Program was established which recorded fishery data and information on incidental bycatch of marine mammals. DWF effort in the U.S. Atlantic Exclusive Economic Zone (EEZ) under MFCMA had been directed primarily towards Atlantic Mackerel and Squid. From 1977 through 1982, an average mean of 120 different foreign vessels per year (range 102-161) operated within the U.S. Atlantic EEZ. In 1982, there were 112 different foreign vessels; 16%, or 18, were Japanese Tuna longline vessels operating along the U.S. east coast. This was the first year that the Northeast Regional Observer Program assumed responsibility for observer coverage of the longline vessels. Between 1983 and 1991, the numbers of foreign vessels operating within the U.S. Atlantic EEZ each year were 67, 52, 62, 33, 27, 26, 14, 13, and 9 respectively. Between 1983 and 1988, the numbers of DWF vessels included 3, 5, 7, 6, 8, and 8 respectively, Japanese longline vessels. Observer coverage on DWF vessels was 25-35% during 1977-1982, and increased to 58%, 86%, 95% and 98%, respectively, in 1983-1986. One hundred percent observer coverage was maintained during 1987-1991. Foreign fishing operations for Squid ceased at the end of the 1986 fishing season and for Mackerel at the end of the 1991 season. Documented interactions with white sided dolphins were reported in this fishery.
Pelagic Drift Gillnet In 1996 and 1997, NMFS issued management regulations which prohibited the operation of this fishery in 1997. The fishery operated during 1998. Then, in January 1999 NMFS issued a Final Rule to prohibit the use of drift net gear in the North Atlantic Swordfish Fishery (50 CFR Part 630). In 1986, NMFS established a mandatory self-reported fisheries information system for Large Pelagic Fisheries. Data files are maintained at the SEFSC. The estimated total number of hauls in the Atlantic Pelagic Drift Gillnet Fishery increased from 714 in 1989 to 1,144 in 1990; thereafter, with the introduction of quotas, effort was severely reduced. The estimated number of hauls from 1991 to 1996 was 233, 243, 232, 197, 164, and 149 respectively. Fifty-nine different vessels participated in this fishery at one time or another between 1989 and 1993. In 1994 to 1998 there were 11, 12, 10, 0, and 11 vessels,
193
respectively, in the fishery. Observer coverage, expressed as percent of sets observed, was 8% in 1989, 6% in 1990, 20% in 1991, 40% in 1992, 42% in 1993, 87% in 1994, 99% in 1995, 64% in 1996, no fishery in 1997, and 99% coverage during 1998. Observer coverage dropped during 1996 because some vessels were deemed too small or unsafe by the contractor that provided observer coverage to NMFS. Fishing effort was concentrated along the southern edge of Georges Bank and off Cape Hatteras, North Carolina. Examination of the species composition of the catch and locations of the fishery throughout the year suggest that the Drift Gillnet Fishery was stratified into two strata: a southern, or winter, stratum and a northern, or summer, stratum. Documented interactions with North Atlantic right whales, humpback whales, sperm whales, pilot whale spp., Mesoplodon spp., Risso’s dolphins, common dolphins, striped dolphins and white sided dolphins were reported in this fishery.
Atlantic Tuna Purse Seine The Tuna Purse Seine Fishery occurring between the Gulf of Maine and Cape Hatteras, North Carolina is directed at large medium and giant Bluefin Tuna (BFT). Spotter aircraft are typically used to locate fish schools. The official start date, set by regulation, is 15 July of each year. Individual Vessel Quotas (IVQs) and a limited access system prevent a derby fishery situation. Catch rates for large medium and giant Tuna can be high and consequently, the season can last only a few weeks, however, over the last number of years, effort expended by this sector of the BFT fishery has diminished dramatically due to the unavailability of BFT on the fishing grounds. The regulations allocate approximately 18.6% of the U.S. BFT quota to this sector of the fishery (5 IVQs) with a tolerance limit established for large medium BFT (15% by weight of the total amount of giant BFT landed. Limited observer data is available for the Atlantic Tuna Purse Seine Fishery. Out of 45 total trips made in 1996, 43 trips (95.6%) were observed. Forty-four sets were made on the 43 observed trips and all sets were observed. A total of 136 days were covered. No trips were observed during 1997 through 1999. Two trips (seven hauls) were observed in October 2000 in the Great South Channel Region. Four trips were observed in September 2001. No marine mammals were observed taken during these trips. Documented interactions with pilot whale spp. were reported in this fishery.
Atlantic Tuna Pelagic Pair Trawl The Pelagic Pair Trawl Fishery operated as an experimental fishery from 1991 to 1995, with an estimated 171 hauls in 1991, 536 in 1992, 586 in 1993, 407 in 1994, and 440 in 1995. This fishery ceased operations in 1996 when NMFS rejected a petition to consider pair trawl gear as an authorized gear type in the Atlantic Tuna Fishery. The fishery operated from August to November in 1991, from June to November in 1992, from June to October in 1993 (Northridge 1996), and from mid-summer to December in 1994 and 1995. Sea sampling began in October of 1992 (Gerrior et al. 1994) where 48 sets (9% of the total) were sampled. In 1993, 102 hauls (17% of the total) were sampled. In 1994 and 1995, 52% (212) and 55% (238), respectively, of the sets were observed. Nineteen vessels have operated in this fishery. The fishery operated in the area between 35N to 41N and 69W to 72W. Approximately 50% of the total effort was within a one degree square at 39N, 72W, around Hudson Canyon, from 1991 to 1993. Examination of the 1991-1993 locations and species composition of the bycatch, showed little seasonal change for the six months of operation and did not warrant any seasonal or areal stratification of this fishery (Northridge 1996). During the 1994 and 1995 Experimental Pelagic Pair Trawl Fishing Seasons, fishing gear experiments were conducted to collect data on environmental parameters, gear behavior, and gear handling practices to evaluate factors affecting catch and bycatch (Goudy 1995, 1996), but the results were inconclusive. Documented interactions with pilot whale spp., Risso’s dolphin and common dolphins were reported in this fishery.
Part B. Description of U.S. Gulf of Mexico Fisheries
I. Data Sources Items 1 and 2 describe sources of marine mammal mortality, serious injury or entanglement data, and item 3 describes the source of commercial fishing effort data used to generate maps depicting the location and amount of fishing effort and the numbers of active permit holders. In general, commercial fisheries in the Gulf of Mexico have had little directed observer coverage and the level of fishing effort for most fisheries that may interact with marine mammals is either not reported or highly uncertain.
1. Southeast Region Fishery Observer Programs Two fishery observer programs are managed by the SEFSC that observe commercial fishery activity in the U.S. Gulf of Mexico. The Pelagic Longline Observer Program (POP) administers a mandatory observer program for the U.S. Atlantic Large Pelagics Longline Fishery. The program has been in place since 1992, and randomly allocates observer effort by eleven geographic fishing areas proportional to total reported effort in each area and quarter. Observer coverage levels are mandated under the Highly Migratory Species FMP (HMS FMP, 50 CFR Part 635). The second is the Southeastern Shrimp Otter Trawl Fishery Observer Program. Prior to 2007, this was a voluntary program administered by SEFSC in cooperation with the Gulf and South Atlantic Fisheries Foundation. The program was funding and project dependent, therefore observer coverage is not necessarily randomly allocated across the fishery. In 2007, the observer program was expanded, and it became mandatory for fishing vessels to take an observer if selected. The program now includes more systematic sampling of the fleet based upon reported landings and effort patterns. The total level of observer coverage for this program is ~ 1% of the total fishery effort. In each Observer Program, the observers record information on the total target species catch, the number and type of interactions with protected species (including both marine mammals and sea turtles), and biological information on species caught. In each Observer Program, the observers record information on the total target species catch,
194
the number and type of interactions with protected species including both marine mammals and sea turtles, and biological information on species caught.
2. Regional Marine Mammal Stranding Networks The Southeast Regional Stranding Network is a component of the Marine Mammal Health and Stranding Response Program (MMHSRP). The goals of the MMHSRP are to facilitate collection and dissemination of data, assess health trends in marine mammals, correlate health with other biological and environmental parameters, and coordinate effective responses to unusual mortality events (Becker et al. 1994). The Southeast Region Strandings Program is responsible for data collection and stranding response coordination along the U.S. Gulf of Mexico coast from Florida through Texas. Prior to 1997, stranding and entanglement data were maintained by the New England Aquarium and the National Museum of Natural History, Washington, D.C. Volunteer participants, acting under a letter of agreement with NOAA Fisheries, collect data on stranded animals that include: species; event date and location; details of the event including evidence of human interactions; determinations of the cause of death; animal disposition; morphology; and biological samples. Collected data are reported to the appropriate Regional Stranding Network Coordinator and are maintained in regional and national databases.
3. Southeast Region Fisheries Logbook System The FLS is maintained at the SEFSC and manages data submitted from mandatory fishing vessel logbook programs under several FMPs. In 1986, a comprehensive logbook program was initiated for the Large Pelagics Longline Fisheries, and this reporting became mandatory in 1992. Logbook reporting has also been initiated since the early 1990s for a number of other fisheries including: reef fish fisheries; snapper-grouper complex fisheries; federally managed shark fisheries; and king and Spanish mackerel fisheries. In each case, vessel captains are required to submit information on the fishing location, the amount and type of fishing gear used, the total amount of fishing effort (e.g., gear sets) during a given trip, the total weight and composition of the catch, and the disposition of the catch during each unit of effort (e.g., kept, released alive, released dead). FLS data are used to estimate the total amount of fishing effort in the fishery and thus expand bycatch rate estimates from observer data to estimates of the total incidental take of marine mammal species in a given fishery.
4. Marine Mammal Authorization Program Commercial fishing vessels engaging in Category I or II fisheries are automatically registered under the Marine Mammal Authorization Program (MMAP) in order to lawfully take a non-endangered/threatened marine mammal incidental to fishing operations. These fishermen are required to carry an Authorization Certificate onboard while participating in the listed fishery, must be prepared to carry a fisheries observer if selected, and must comply with all applicable take reduction plan regulations. All vessel owners, regardless of the category of fishery they are operating in, are required to report, within 48 hours of the incident even if an observer has recorded the take, all incidental injuries and mortalities of marine mammals that have occurred as a result of fishing operations (NMFS-OPR 2019). Events are reported by fishermen on the Marine Mammal Mortality/Injury forms then submitted to and maintained by the NMFS Office of Protected Resources. The data reported include: captain and vessel demographics; gear type and target species; date, time and location of event; type of interaction; animal species; mortality or injury code; and number of interactions. Reporting can be done online at https://docs.google.com/a/noaa.gov/forms/d/e/1FAIpQLSfKe0moEVK24x1Jbly33A0MRAa2ljZgmAcCVO1hEXghtB3SYA/viewform.
II. Gulf of Mexico Commercial Fisheries
Please see the List of Fisheries for more information on the following fisheries:
Spiny Lobster Trap/Pot Fishery; Southeastern U.S. Atlantic, Gulf of Mexico Stone Crab Trap/Pot Fishery; Gulf of Mexico Menhaden Purse Seine Fishery; Gulf of Mexico Gillnet Fishery.
Literature Cited Becker, P.R., D. Wilkinson and T. Lillestolen. 1994. Marine Mammal Health and Stranding Response Program: Program
Development Plan. NOAA Tech. Memo. NMFS-OPR-94-2. 35 pp. Carlson, J.K. and D.M. Bethea. 2007. Catch and bycatch in the shark gillnet fishery: 2005-2006. NOAA Tech. Memo. NMFS-SEFSC-
552. 26 pp. Gerrior, P., A.S. Williams and D.J. Christensen 1994. Observations of the 1992 U.S. pelagic pair trawl fishery in the Northwest
Atlantic. Mar. Fish. Rev. 56(3): 24-27. Goudy, C.A. 1995. The 1994 experimental pair trawl fishery for tuna in the Northwest Atlantic. Massachusetts Institute of
Technology, Sea Grant, Cambridge, MA. MITSWG 95-6 10 pp. Goudy, C.A. 1996. The 1995 experimental pair trawl fishery for tuna in the Northwest Atlantic. Massachusetts Institute of
Technology, Sea Grant, Cambridge, MA MITSG 96-17: 13. NMFS-NEFSC. 2019. Fishery Sampling Branch. National Marine Fisheries Service-Northeast Fisheries Science Center, accessed on
11/05/2003, from https://www.nefsc.noaa.gov/fsb/. NMFS-OPR. 2019. Marine Mammal Authorization Program. National Marine Fisheries Service-Office of Protected Resources.
195
https://www.fisheries.noaa.gov/national/marine-mammal-protection/marine-mammal-authorization-program. accessed on 02/14/2019
Northridge, S. 1996. Estimation of cetacean mortality in the U.S. Atlantic swordfish and tuna driftnet and pair trawl fisheries. NMFS. 40ENNF500160 21 pp.
Wigley, S., M. Terceiro, A. Delong and K. Sosebee. 1998. Proration of 1994-96 USA Commercial Landings of Atlantic Cod, Haddock and Yellowtail Flounder to Unit Stock Areas. Northeast Fish. Sci. Cent. Ref. Doc. 98-02.
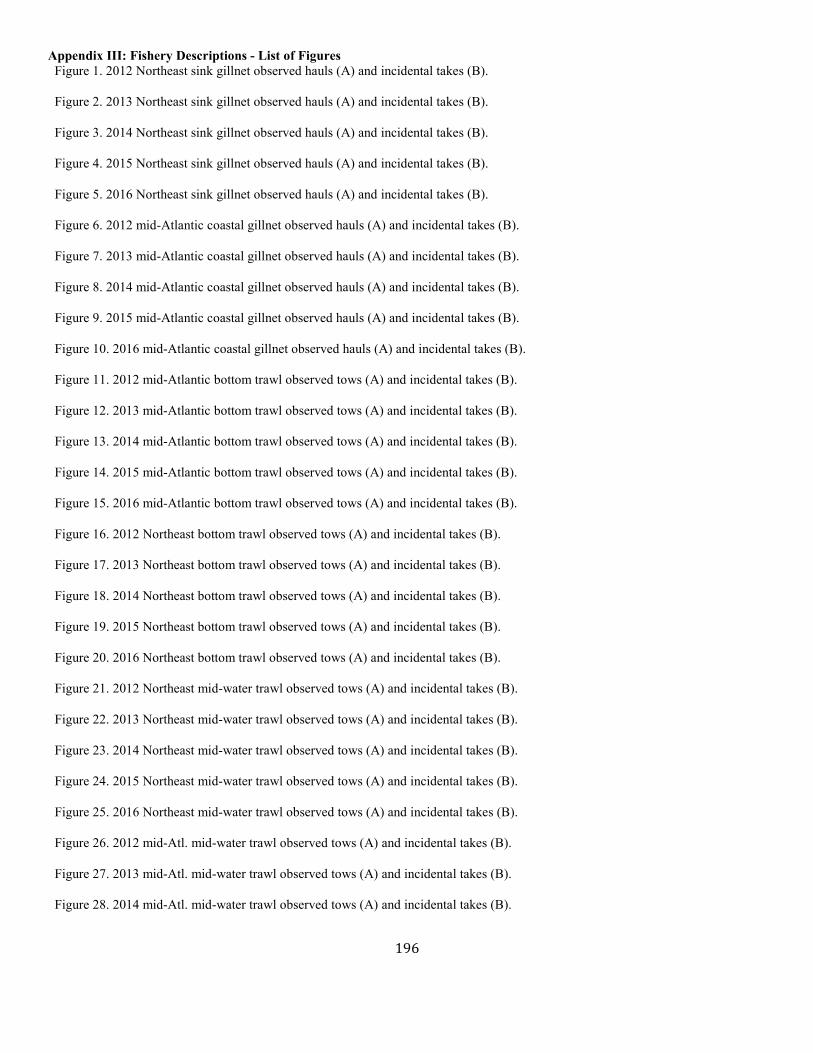
196
Appendix III: Fishery Descriptions - List of Figures Figure 1. 2012 Northeast sink gillnet observed hauls (A) and incidental takes (B).
Figure 2. 2013 Northeast sink gillnet observed hauls (A) and incidental takes (B).
Figure 3. 2014 Northeast sink gillnet observed hauls (A) and incidental takes (B).
Figure 4. 2015 Northeast sink gillnet observed hauls (A) and incidental takes (B).
Figure 5. 2016 Northeast sink gillnet observed hauls (A) and incidental takes (B).
Figure 6. 2012 mid-Atlantic coastal gillnet observed hauls (A) and incidental takes (B).
Figure 7. 2013 mid-Atlantic coastal gillnet observed hauls (A) and incidental takes (B).
Figure 8. 2014 mid-Atlantic coastal gillnet observed hauls (A) and incidental takes (B).
Figure 9. 2015 mid-Atlantic coastal gillnet observed hauls (A) and incidental takes (B).
Figure 10. 2016 mid-Atlantic coastal gillnet observed hauls (A) and incidental takes (B).
Figure 11. 2012 mid-Atlantic bottom trawl observed tows (A) and incidental takes (B).
Figure 12. 2013 mid-Atlantic bottom trawl observed tows (A) and incidental takes (B).
Figure 13. 2014 mid-Atlantic bottom trawl observed tows (A) and incidental takes (B).
Figure 14. 2015 mid-Atlantic bottom trawl observed tows (A) and incidental takes (B).
Figure 15. 2016 mid-Atlantic bottom trawl observed tows (A) and incidental takes (B).
Figure 16. 2012 Northeast bottom trawl observed tows (A) and incidental takes (B).
Figure 17. 2013 Northeast bottom trawl observed tows (A) and incidental takes (B).
Figure 18. 2014 Northeast bottom trawl observed tows (A) and incidental takes (B).
Figure 19. 2015 Northeast bottom trawl observed tows (A) and incidental takes (B).
Figure 20. 2016 Northeast bottom trawl observed tows (A) and incidental takes (B).
Figure 21. 2012 Northeast mid-water trawl observed tows (A) and incidental takes (B).
Figure 22. 2013 Northeast mid-water trawl observed tows (A) and incidental takes (B).
Figure 23. 2014 Northeast mid-water trawl observed tows (A) and incidental takes (B).
Figure 24. 2015 Northeast mid-water trawl observed tows (A) and incidental takes (B).
Figure 25. 2016 Northeast mid-water trawl observed tows (A) and incidental takes (B).
Figure 26. 2012 mid-Atl. mid-water trawl observed tows (A) and incidental takes (B).
Figure 27. 2013 mid-Atl. mid-water trawl observed tows (A) and incidental takes (B).
Figure 28. 2014 mid-Atl. mid-water trawl observed tows (A) and incidental takes (B).

197
Figure 29. 2015 mid-Atl. mid-water trawl observed tows (A) and incidental takes (B).
Figure 30. 2016 mid-Atl. mid-water trawl observed tows (A) and incidental takes (B).
Figure 31. 2012 Atlantic herring purse seine observed hauls (A) and incidental takes (B).
Figure 32. 2013 Atlantic herring purse seine observed hauls (A) and incidental takes (B).
Figure 33. 2014 Atlantic herring purse seine observed hauls (A) and incidental takes (B).
Figure 34. 2015 Atlantic herring purse seine observed hauls (A) and incidental takes (B).
Figure 35. 2016 Atlantic herring purse seine observed hauls (A) and incidental takes (B).
Figure 36. 2012 Observed sets and marine mammal interactions in the pelagic longline fishery - U.S. Atlantic coast.
Figure 37. 2013 Observed sets and marine mammal interactions in the pelagic longline fishery - U.S. Atlantic coast.
Figure 38. 2014 Observed sets and marine mammal interactions in the pelagic longline fishery - U.S. Atlantic coast.
Figure 39. 2015 Observed sets and marine mammal interactions in the pelagic longline fishery - U.S. Atlantic coast.
Figure 40. 2016 Observed sets and marine mammal interactions in the pelagic longline fishery - U.S. Atlantic coast.
Figure 41. 2012 Observed sets and marine mammal interactions in the pelagic longline fishery - Gulf of Mexico.
Figure 42. 2013 Observed sets and marine mammal interactions in the pelagic longline fishery - Gulf of Mexico.
Figure 43. 2014 Observed sets and marine mammal interactions in the pelagic longline fishery - Gulf of Mexico.
Figure 44. 2015 Observed sets and marine mammal interactions in the pelagic longline fishery - Gulf of Mexico.
Figure 45. 2016 Observed sets and marine mammal interactions in the pelagic longline fishery - Gulf of Mexico.
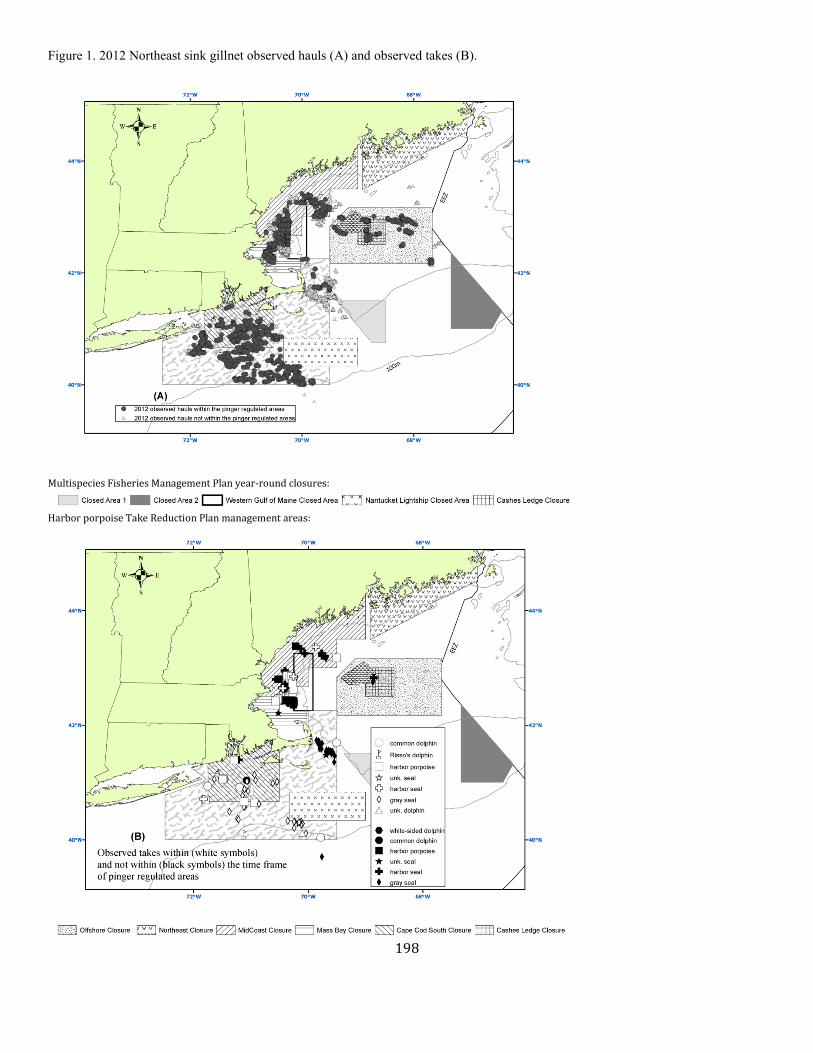
198
Figure 1. 2012 Northeast sink gillnet observed hauls (A) and observed takes (B).
Multispecies Fisheries Management Plan year-round closures:
Harbor porpoise Take Reduction Plan management areas:
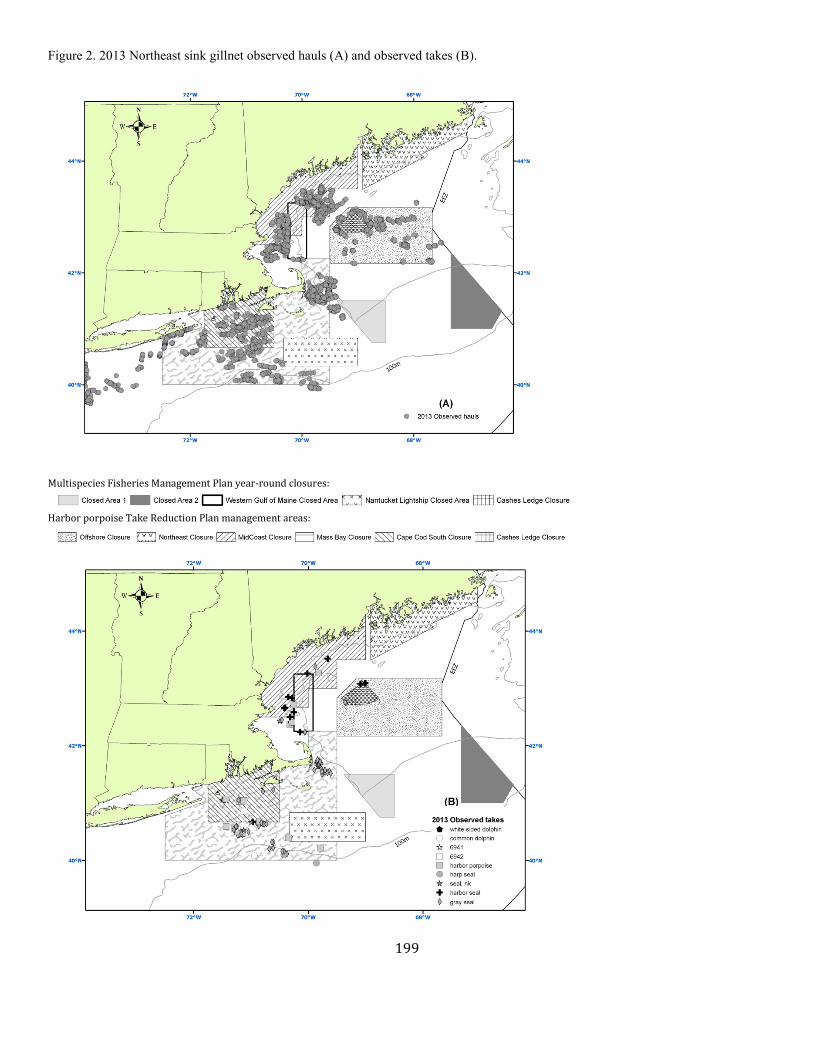
199
Figure 2. 2013 Northeast sink gillnet observed hauls (A) and observed takes (B).
Multispecies Fisheries Management Plan year-round closures:
Harbor porpoise Take Reduction Plan management areas:
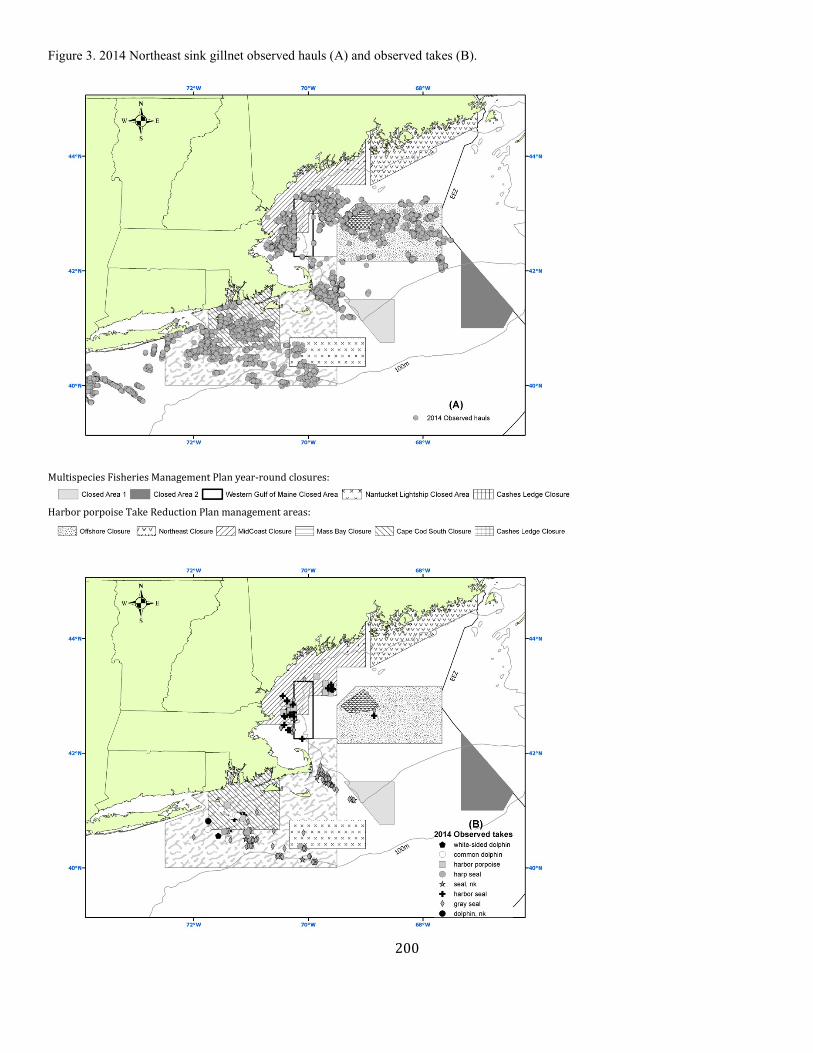
200
Figure 3. 2014 Northeast sink gillnet observed hauls (A) and observed takes (B).
Multispecies Fisheries Management Plan year-round closures:
Harbor porpoise Take Reduction Plan management areas:

201
Figure 4. 2015 Northeast sink gillnet observed hauls (A) and observed takes (B).
Multispecies Fisheries Management Plan year-round closures: Closed Area 1 Closed Area 2 Western Gulf of Maine Closed Area Nantucket Lightship Closed Area Cashes Ledge Closed Area
Harbor porpoise Take Reduction Plan management areas: Offshore Closure Northeast Closure MidCoast Closure Mass Bay Closure Cape Cod South Closure Cashes Ledge Closed Area

202
Figure 5. 2016 Northeast sink gillnet observed hauls (A) and observed takes (B).
Multispecies Fisheries Management Plan year-round closures: Closed Area 1 Closed Area 2 Western Gulf of Maine Closed Area Nantucket Lightship Closed Area Cashes Ledge Closed Area
Harbor porpoise Take Reduction Plan management areas: Offshore Closure Northeast Closure MidCoast Closure Mass Bay Closure Cape Cod South Closure Cashes Ledge Closed Area
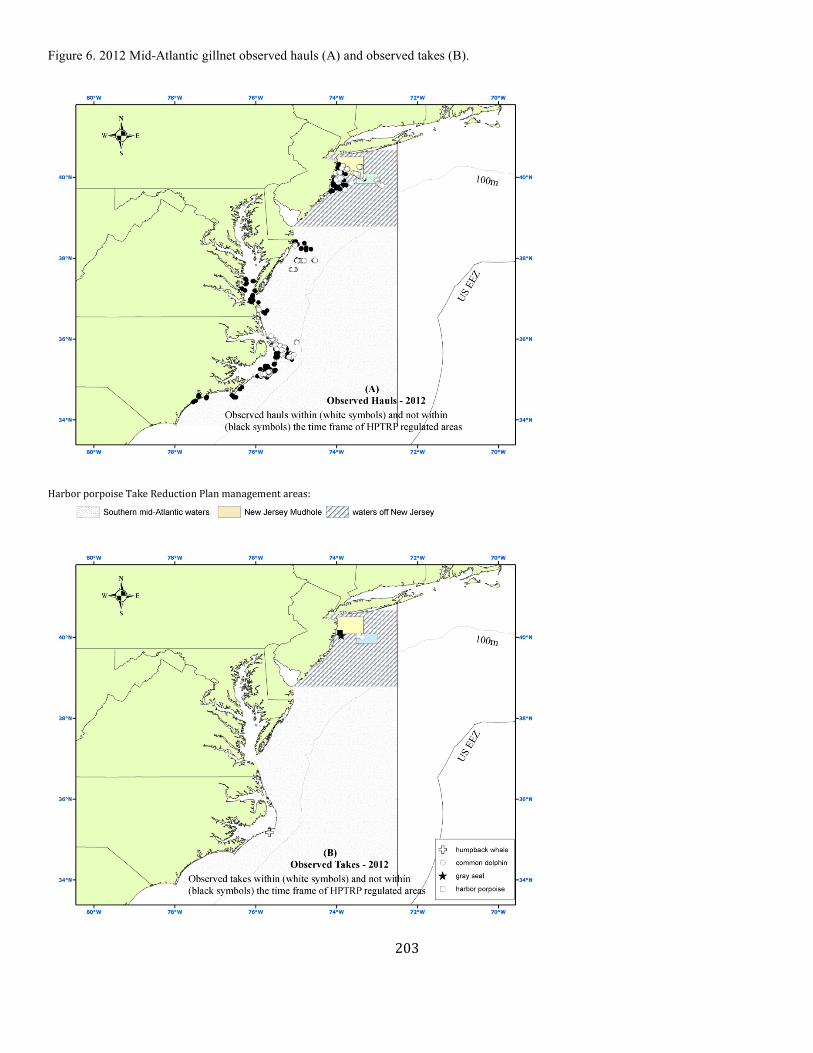
203
Figure 6. 2012 Mid-Atlantic gillnet observed hauls (A) and observed takes (B).
Harbor porpoise Take Reduction Plan management areas:
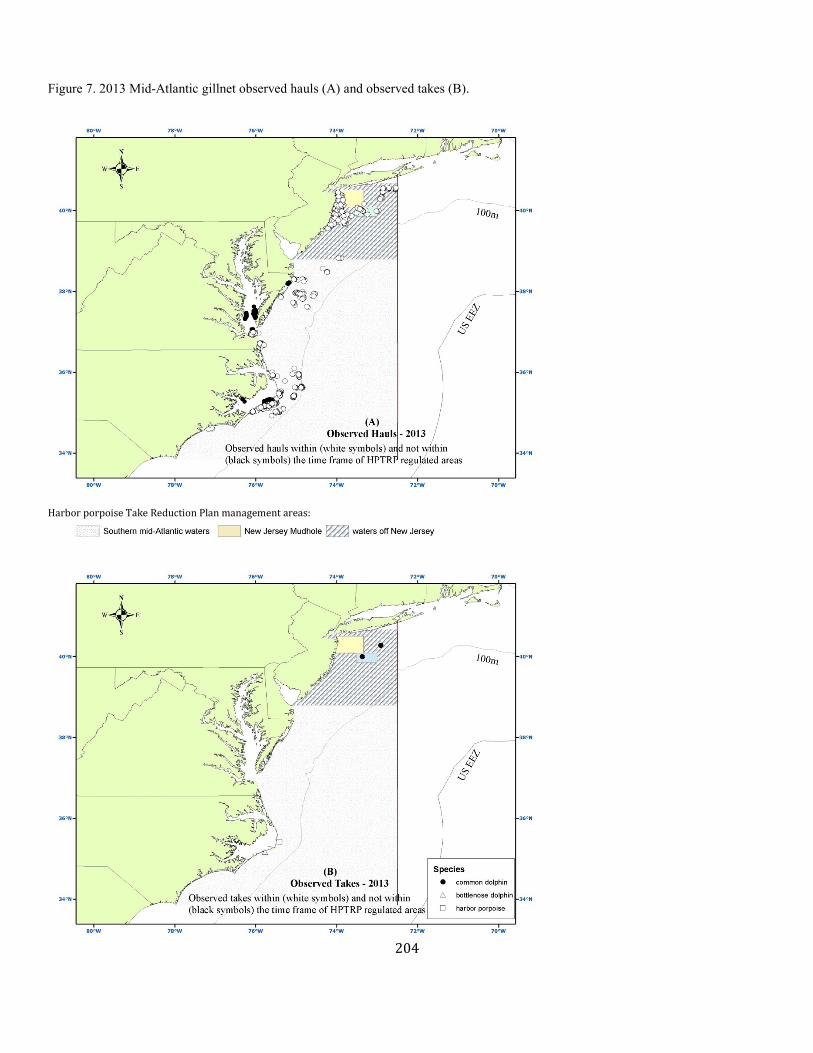
204
Figure 7. 2013 Mid-Atlantic gillnet observed hauls (A) and observed takes (B).
Harbor porpoise Take Reduction Plan management areas:

205
Figure 8. 2014 Mid-Atlantic gillnet observed hauls (A) and observed takes (B).
Harbor porpoise Take Reduction Plan management areas:
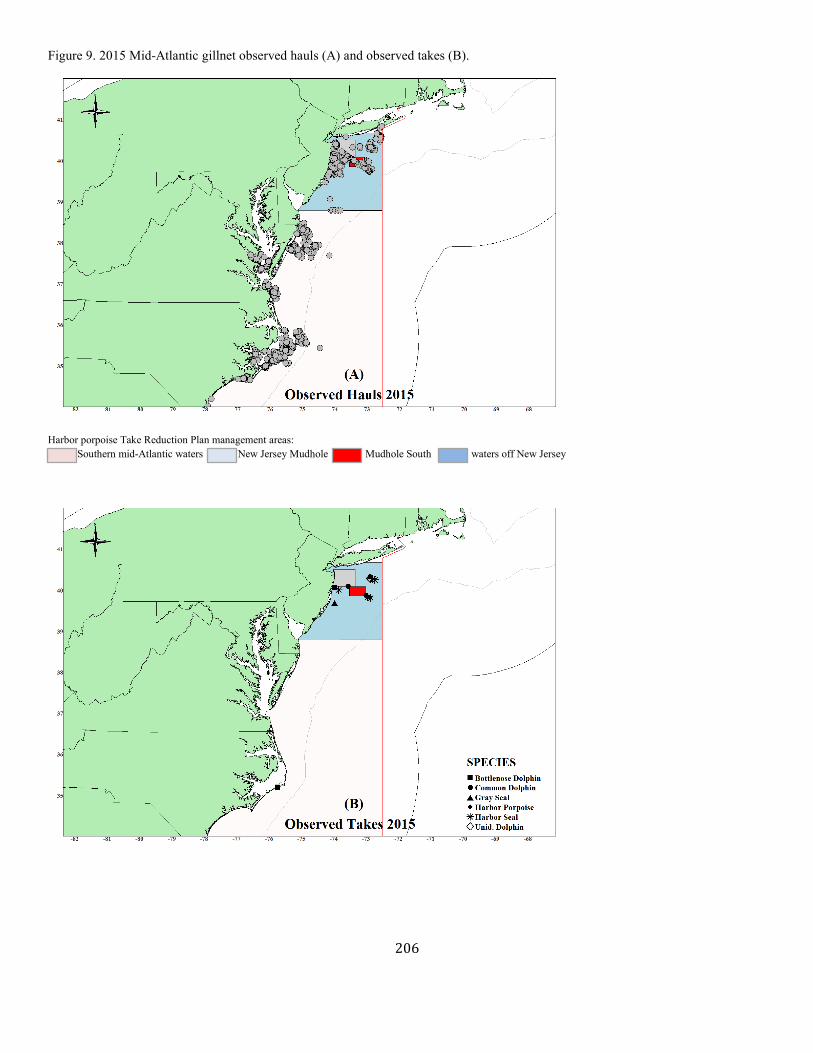
206
Figure 9. 2015 Mid-Atlantic gillnet observed hauls (A) and observed takes (B).
Harbor porpoise Take Reduction Plan management areas: Southern mid-Atlantic waters New Jersey Mudhole Mudhole South waters off New Jersey
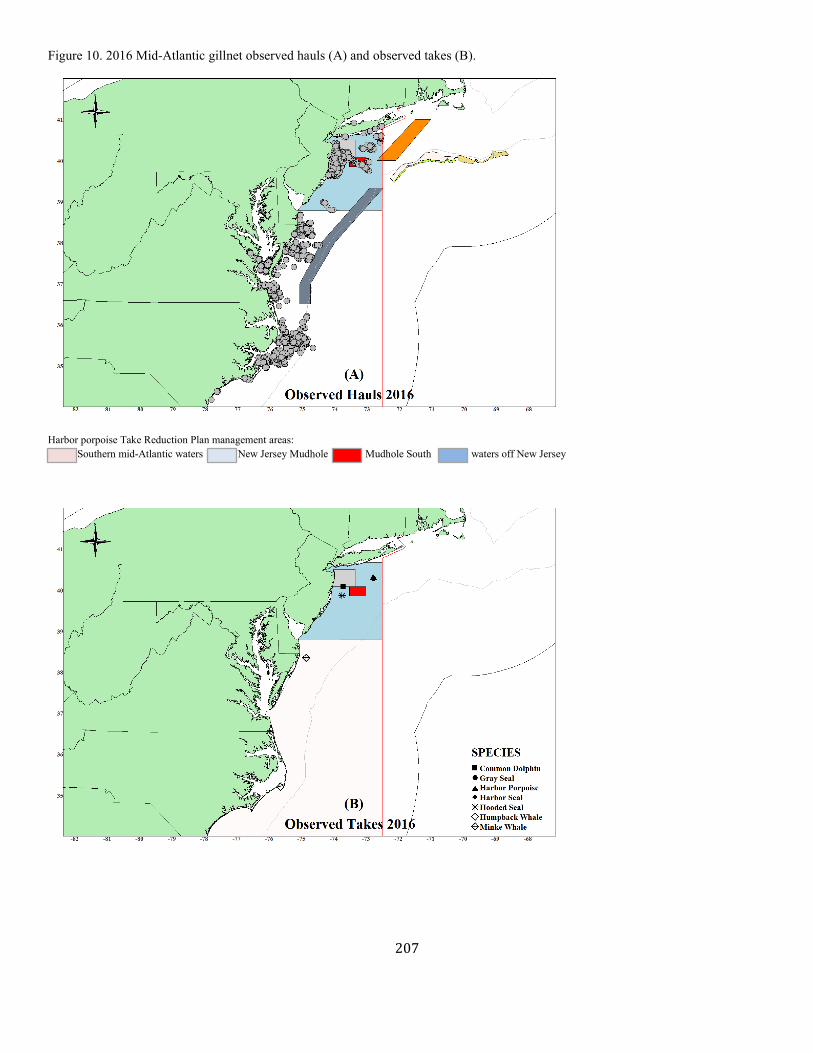
207
Figure 10. 2016 Mid-Atlantic gillnet observed hauls (A) and observed takes (B).
Harbor porpoise Take Reduction Plan management areas: Southern mid-Atlantic waters New Jersey Mudhole Mudhole South waters off New Jersey
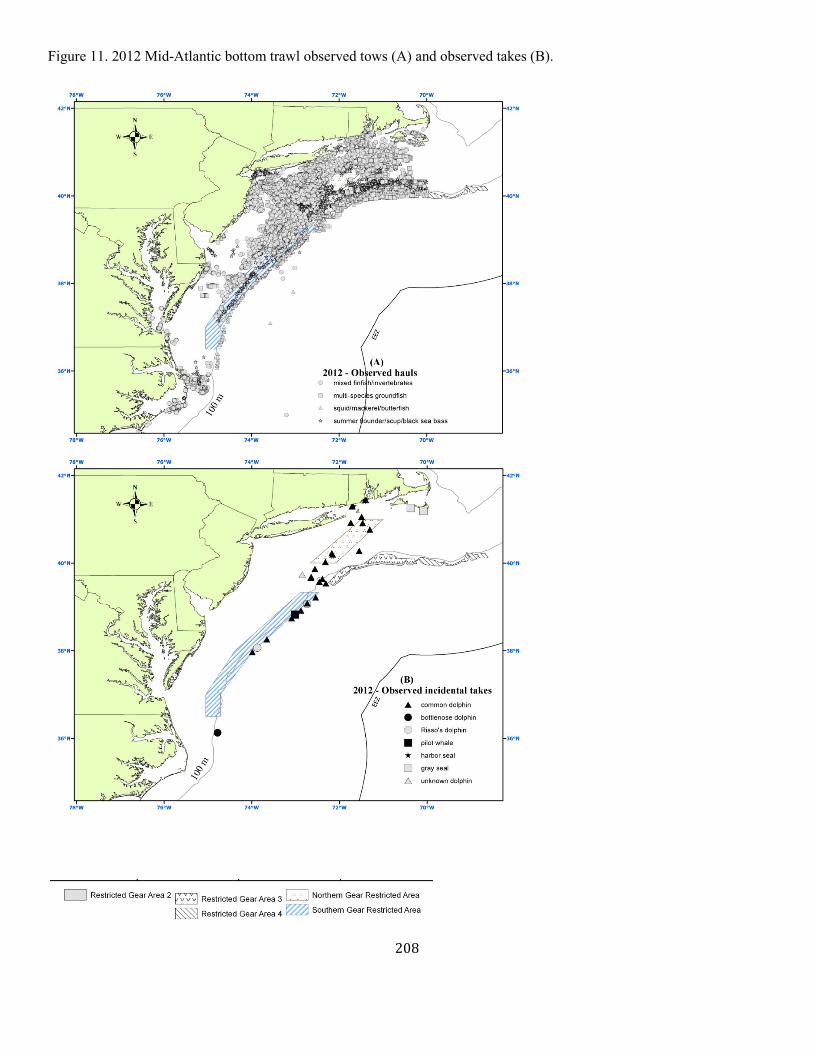
208
Figure 11. 2012 Mid-Atlantic bottom trawl observed tows (A) and observed takes (B).
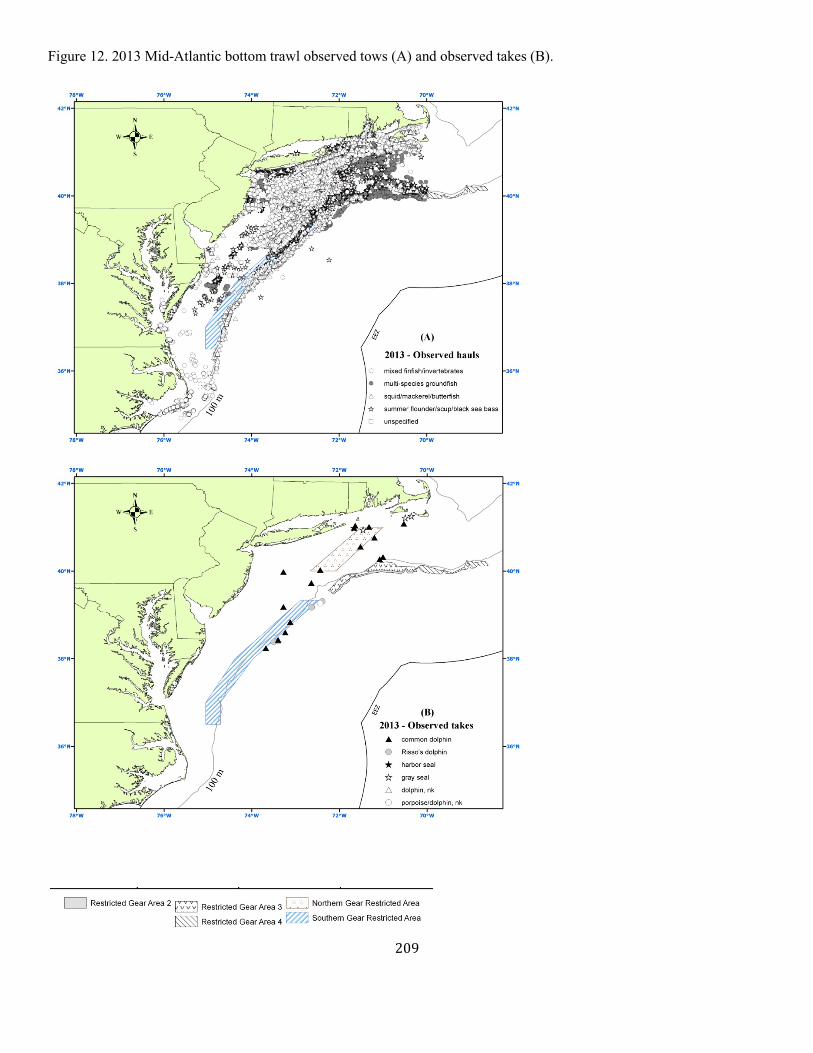
209
Figure 12. 2013 Mid-Atlantic bottom trawl observed tows (A) and observed takes (B).

210
Figure 13. 2014 Mid-Atlantic bottom trawl observed tows (A) and observed takes (B).

211
Figure 14. 2015 Mid-Atlantic bottom trawl observed tows (A) and observed takes (B).
Southern Gear Restricted Area Northern Gear Restricted Area
Restricted Area 2 Restricted Area 3 Restricted Area 4
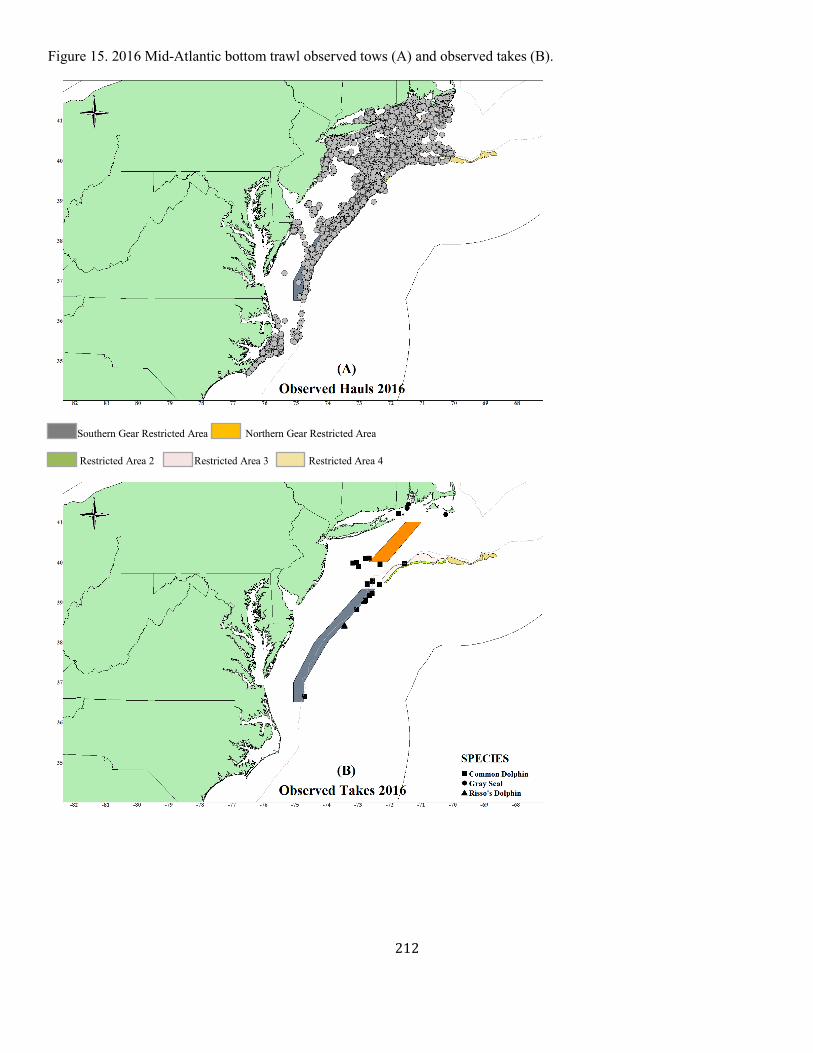
212
Figure 15. 2016 Mid-Atlantic bottom trawl observed tows (A) and observed takes (B).
Southern Gear Restricted Area Northern Gear Restricted Area
Restricted Area 2 Restricted Area 3 Restricted Area 4

213
Figure 16. 2012 Northeast bottom trawl observed tows (A) and observed takes (B).
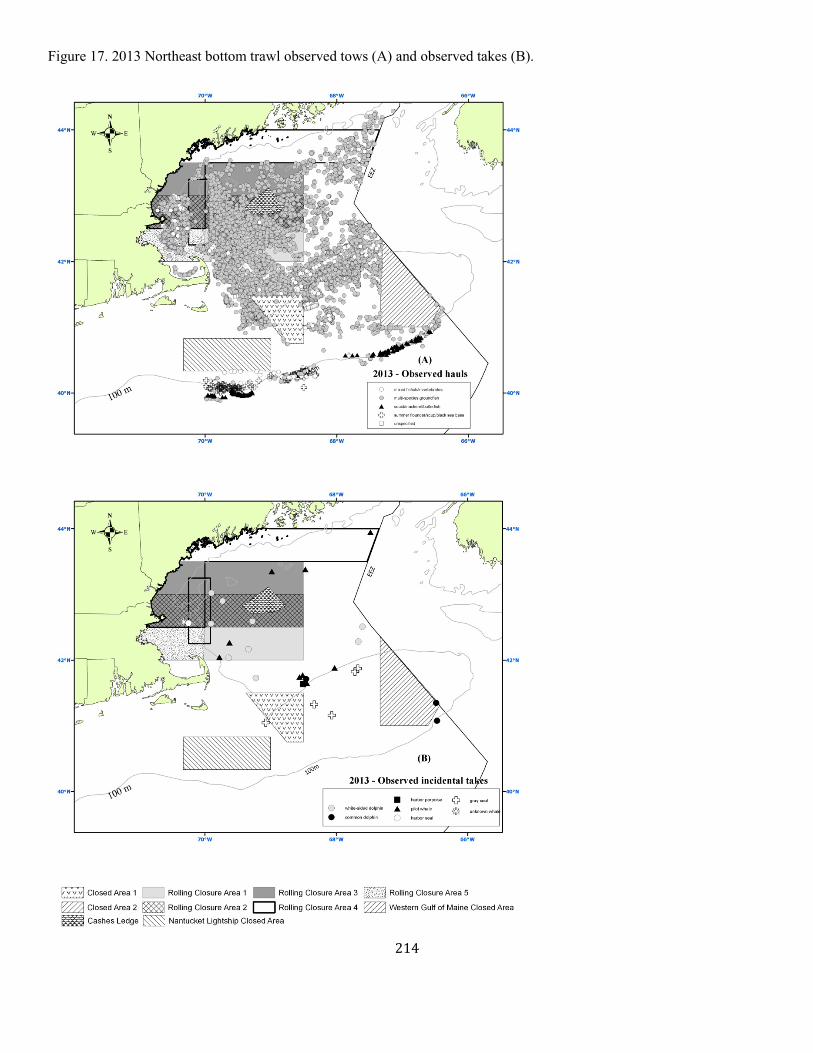
214
Figure 17. 2013 Northeast bottom trawl observed tows (A) and observed takes (B).
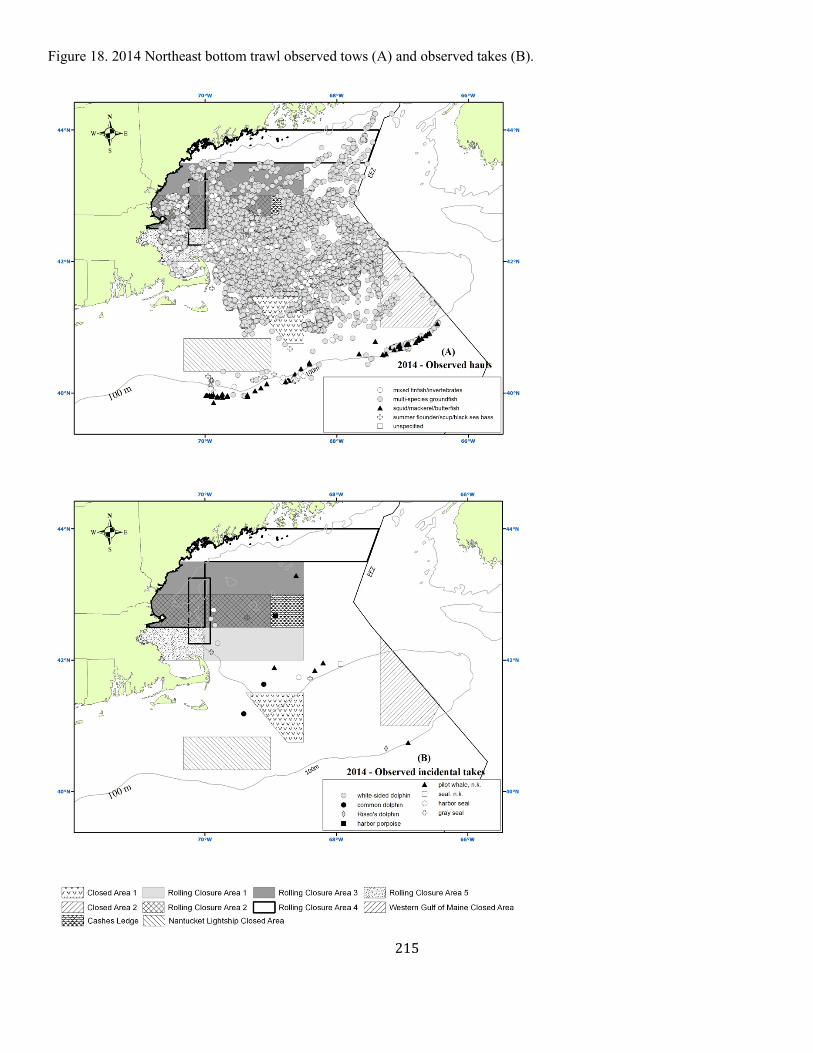
215
Figure 18. 2014 Northeast bottom trawl observed tows (A) and observed takes (B).

216
Figure 19. 2015 Northeast bottom trawl observed tows (A) and observed takes (B).
Closed Area 1 Closed Area 2 Western Gulf of Maine Closed Area Nantucket Lightship Closed Area Cashes Ledge Closed Area
Rolling Closure Area 1 Rolling Closure Area 2 Rolling Closure Area 3 Rolling Closure Area 4 Rolling Closure Area 5

217
Figure 20. 2016 Northeast bottom trawl observed tows (A) and observed takes (B).
Closed Area 1 Closed Area 2 Western Gulf of Maine Closed Area Nantucket Lightship Closed Area Cashes Ledge Closed Area
Rolling Closure Area 1 Rolling Closure Area 2 Rolling Closure Area 3 Rolling Closure Area 4 Rolling Closure Area 5
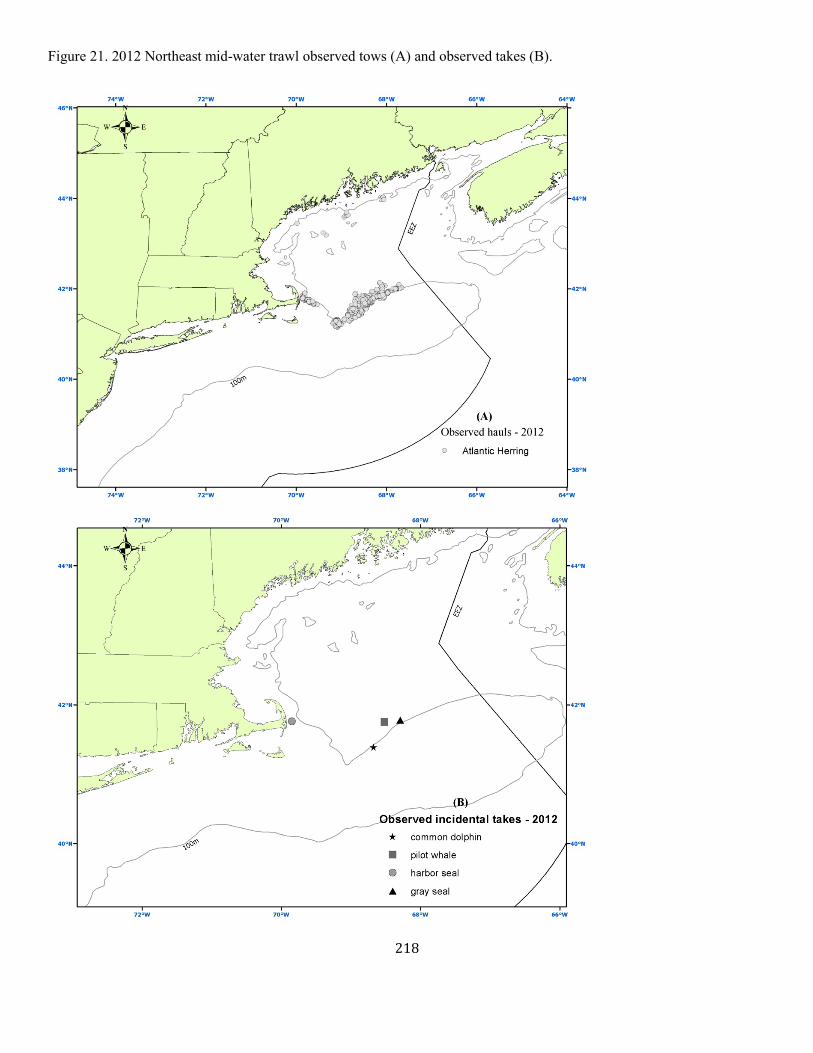
218
Figure 21. 2012 Northeast mid-water trawl observed tows (A) and observed takes (B).

219
Figure 22. 2013 Northeast mid-water trawl observed tows (A) and observed takes (B).
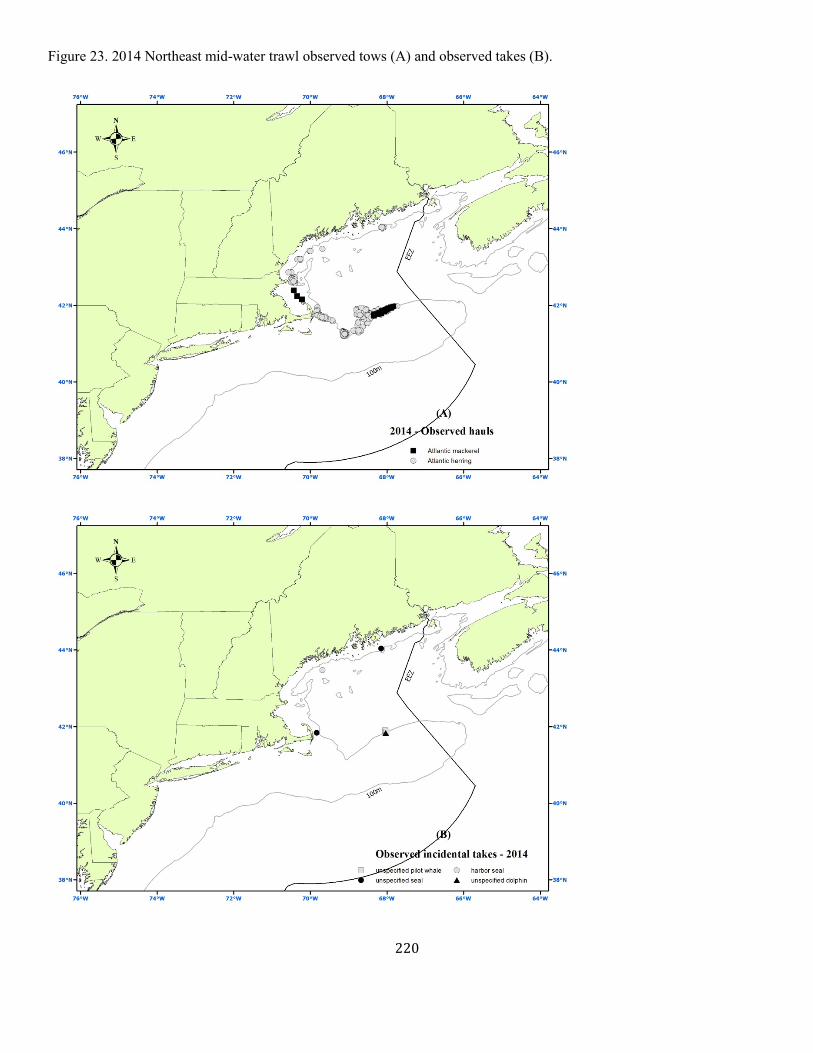
220
Figure 23. 2014 Northeast mid-water trawl observed tows (A) and observed takes (B).
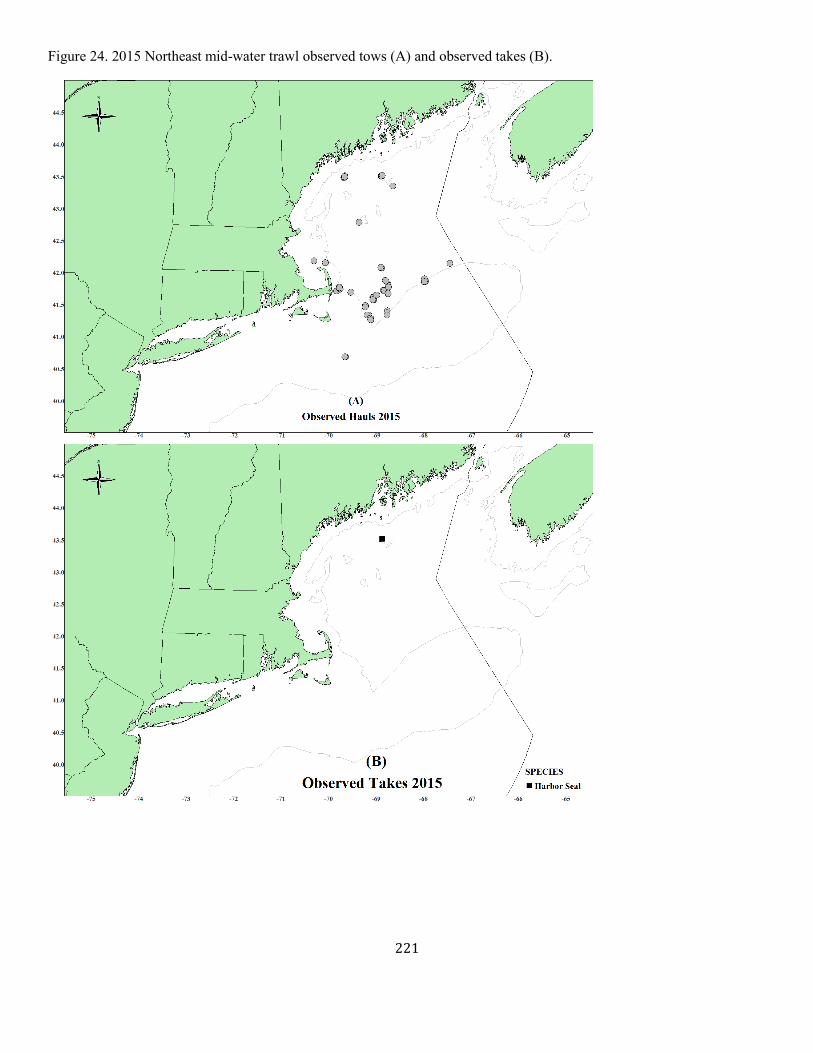
221
Figure 24. 2015 Northeast mid-water trawl observed tows (A) and observed takes (B).
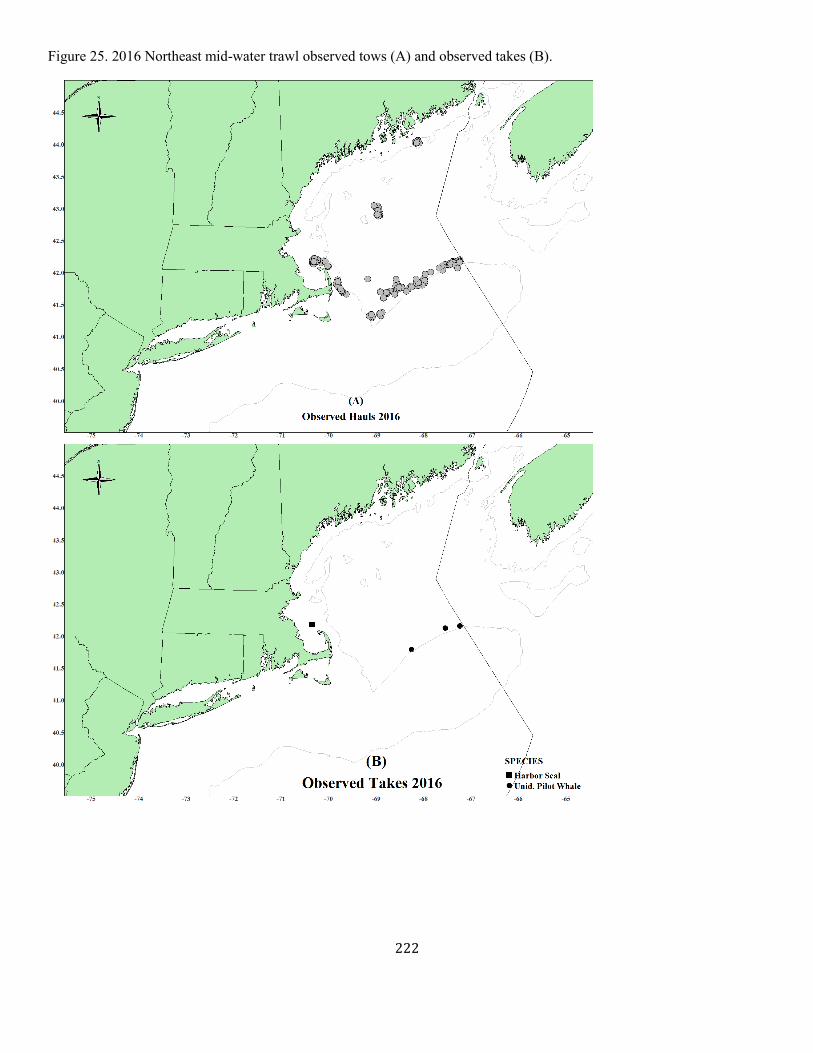
222
Figure 25. 2016 Northeast mid-water trawl observed tows (A) and observed takes (B).

223
Figure 26. 2012 Mid-Atlantic mid-water trawl observed tows (A) and observed takes (B).
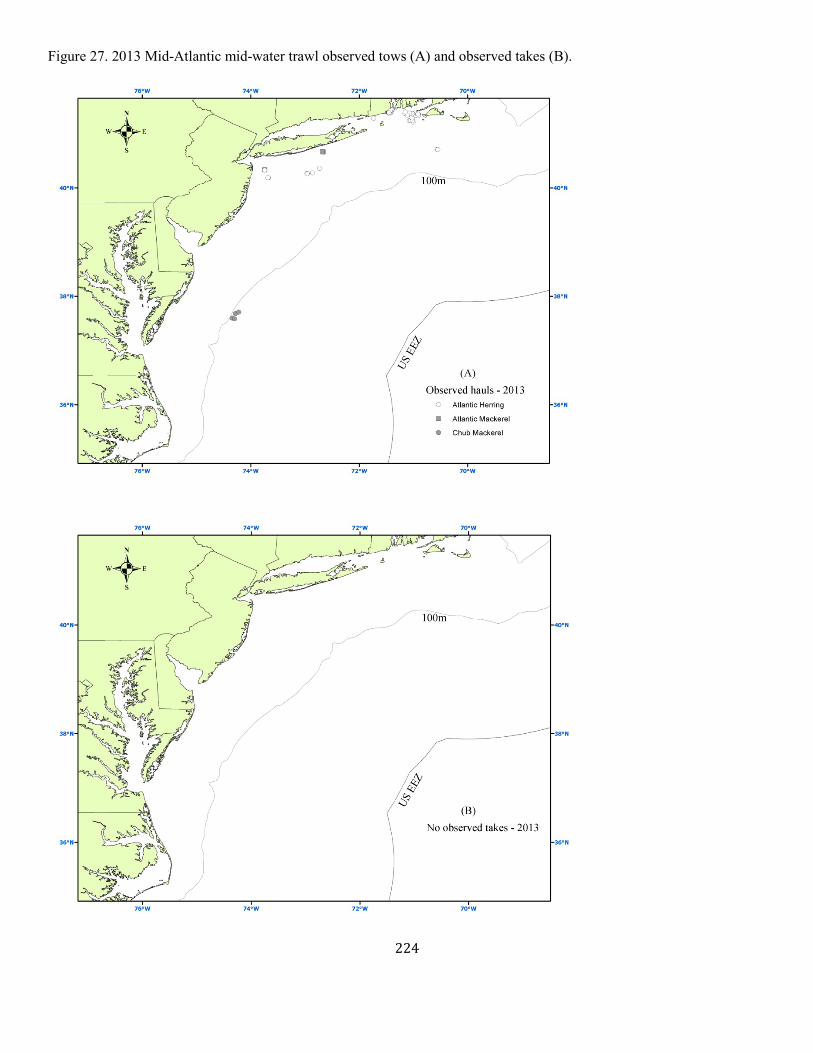
224
Figure 27. 2013 Mid-Atlantic mid-water trawl observed tows (A) and observed takes (B).
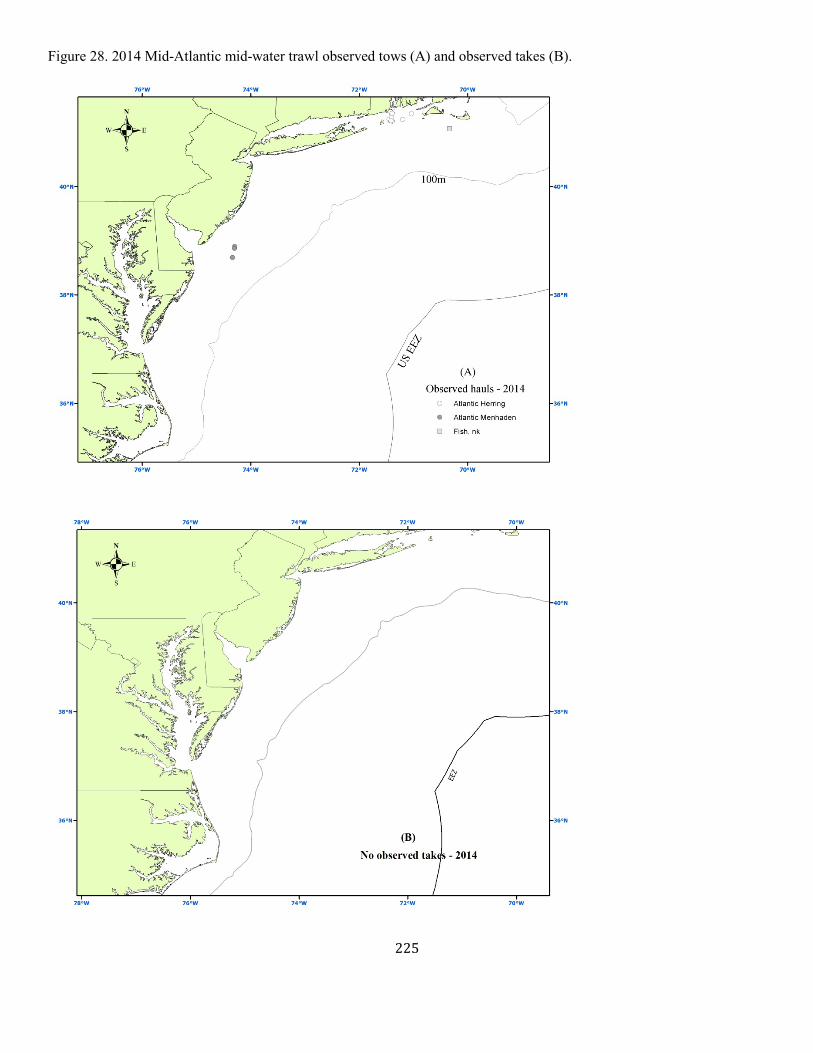
225
Figure 28. 2014 Mid-Atlantic mid-water trawl observed tows (A) and observed takes (B).

226
Figure 29. 2015 Mid-Atlantic mid-water trawl observed tows (A) and observed takes (B).
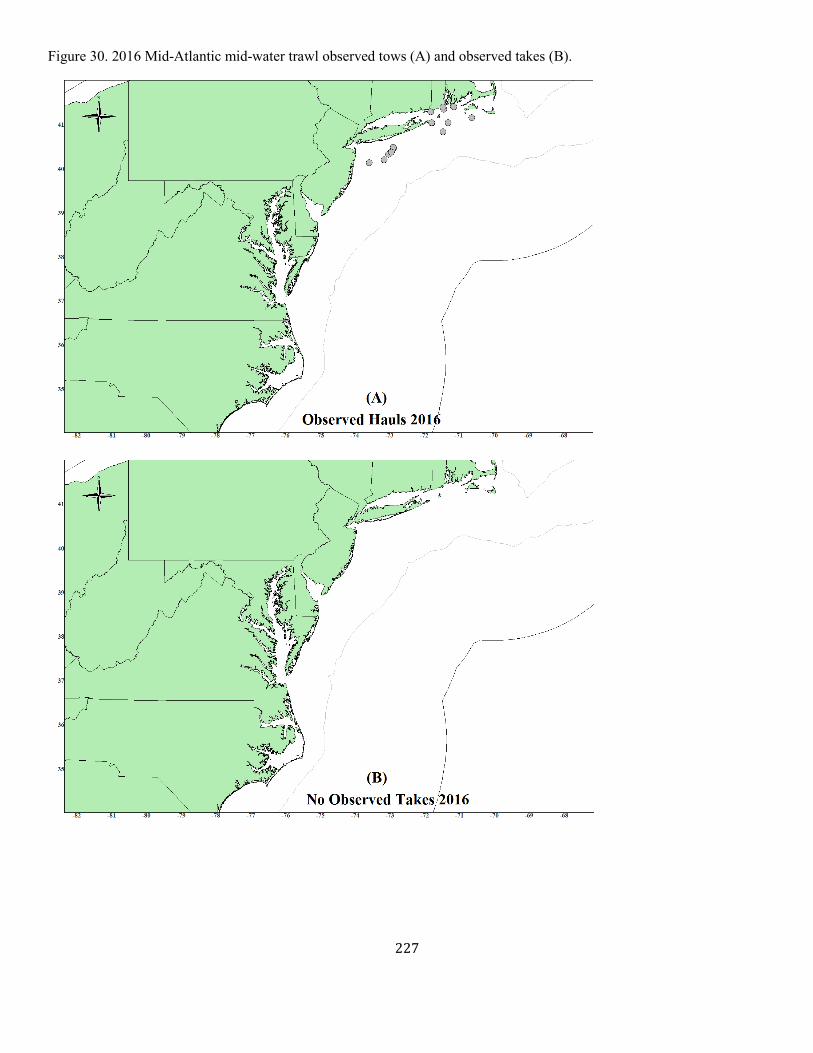
227
Figure 30. 2016 Mid-Atlantic mid-water trawl observed tows (A) and observed takes (B).
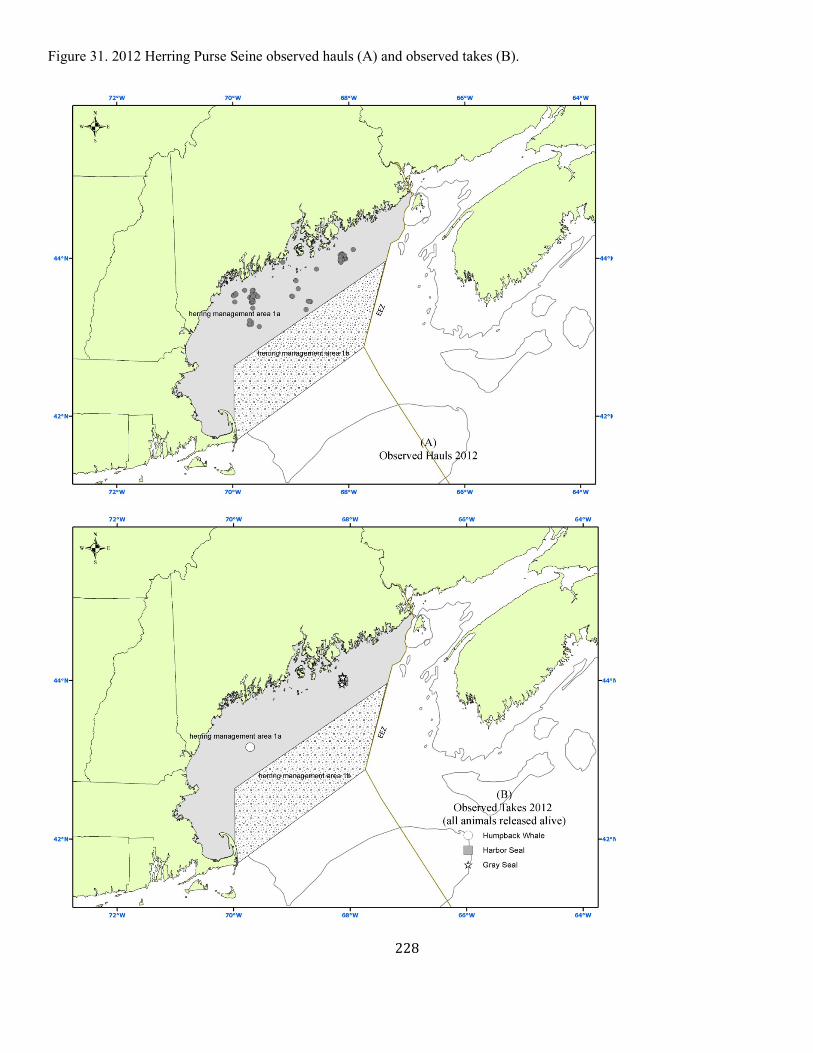
228
Figure 31. 2012 Herring Purse Seine observed hauls (A) and observed takes (B).
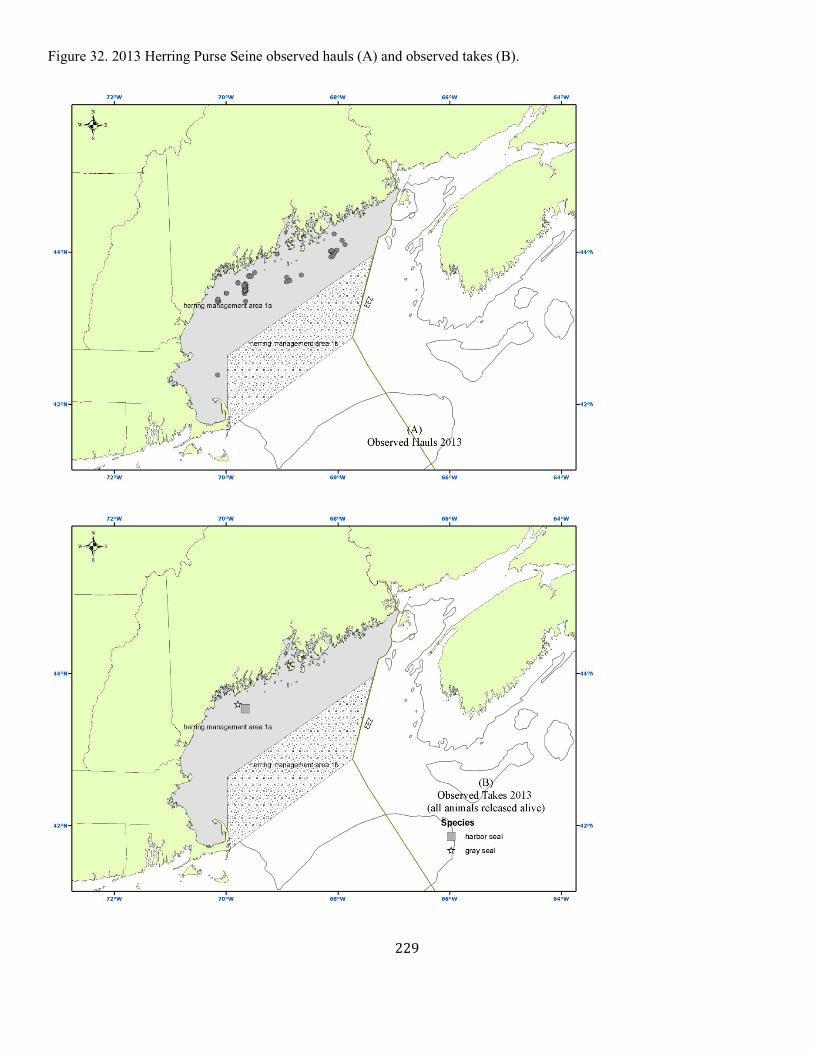
229
Figure 32. 2013 Herring Purse Seine observed hauls (A) and observed takes (B).

230
Figure 33. 2014 Herring Purse Seine observed hauls (A) and observed takes (B).
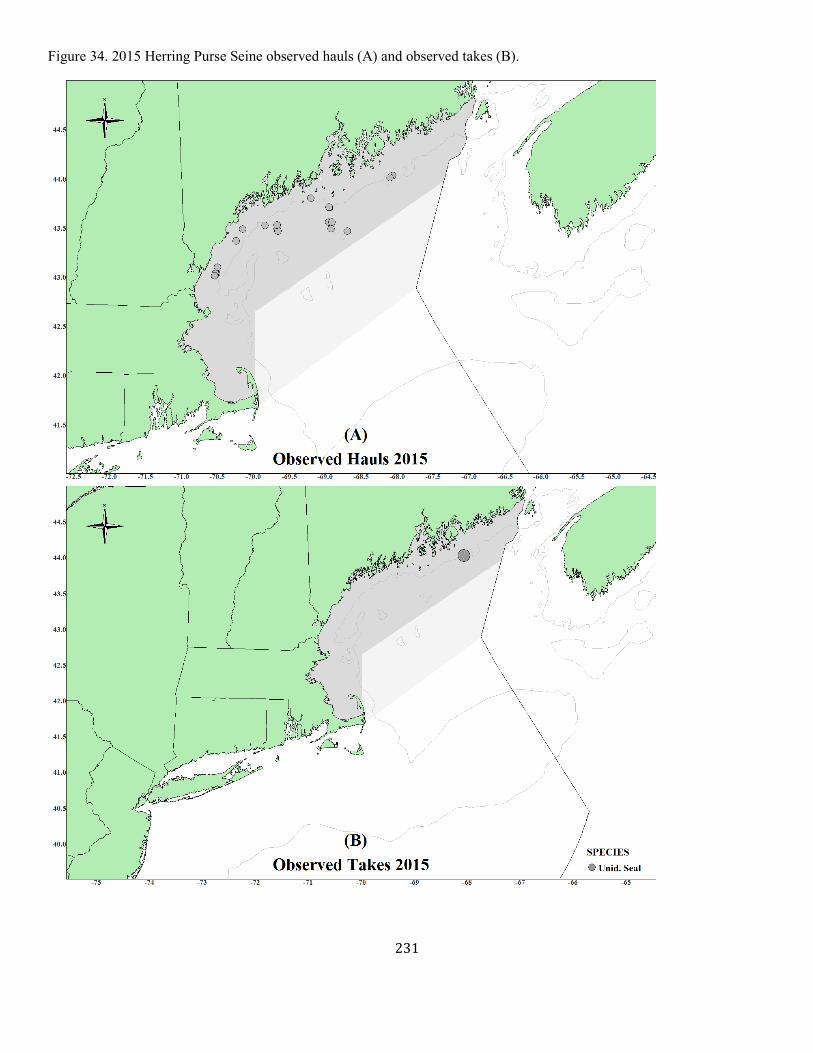
231
Figure 34. 2015 Herring Purse Seine observed hauls (A) and observed takes (B).

232
Figure 35. 2016 Herring Purse Seine observed hauls (A) and observed takes (B).

233
Figure 36. Observed sets and marine mammal interactions in the Pelagic longline fishery along the U.S. Atlantic coast during 2012. The boundaries of the Florida East Coast (FEC), South Atlantic Bight (SAB), Mid-Atlantic Bight (MAB), Northeast Coastal (NEC), and Sargasso Sea (SAR) fishing areas are shown. Seasonal closed areas instituted in 2001 under the HMS FMP are shown as hatched areas.
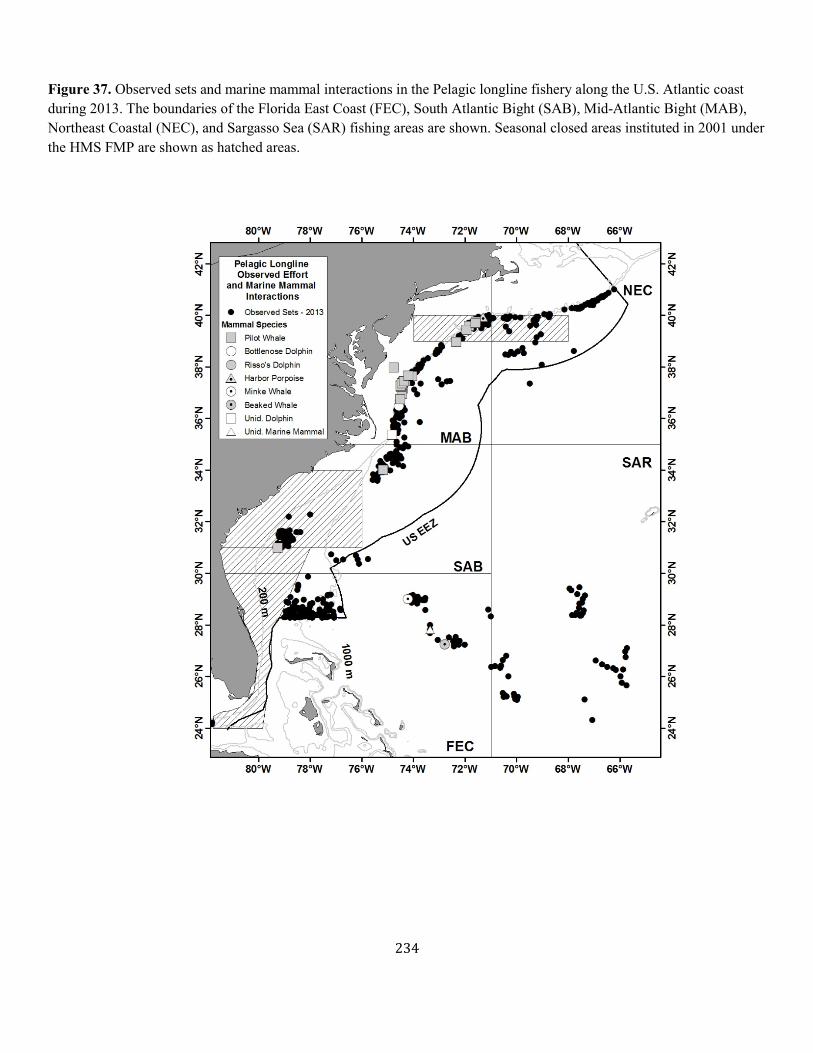
234
Figure 37. Observed sets and marine mammal interactions in the Pelagic longline fishery along the U.S. Atlantic coast during 2013. The boundaries of the Florida East Coast (FEC), South Atlantic Bight (SAB), Mid-Atlantic Bight (MAB), Northeast Coastal (NEC), and Sargasso Sea (SAR) fishing areas are shown. Seasonal closed areas instituted in 2001 under the HMS FMP are shown as hatched areas.
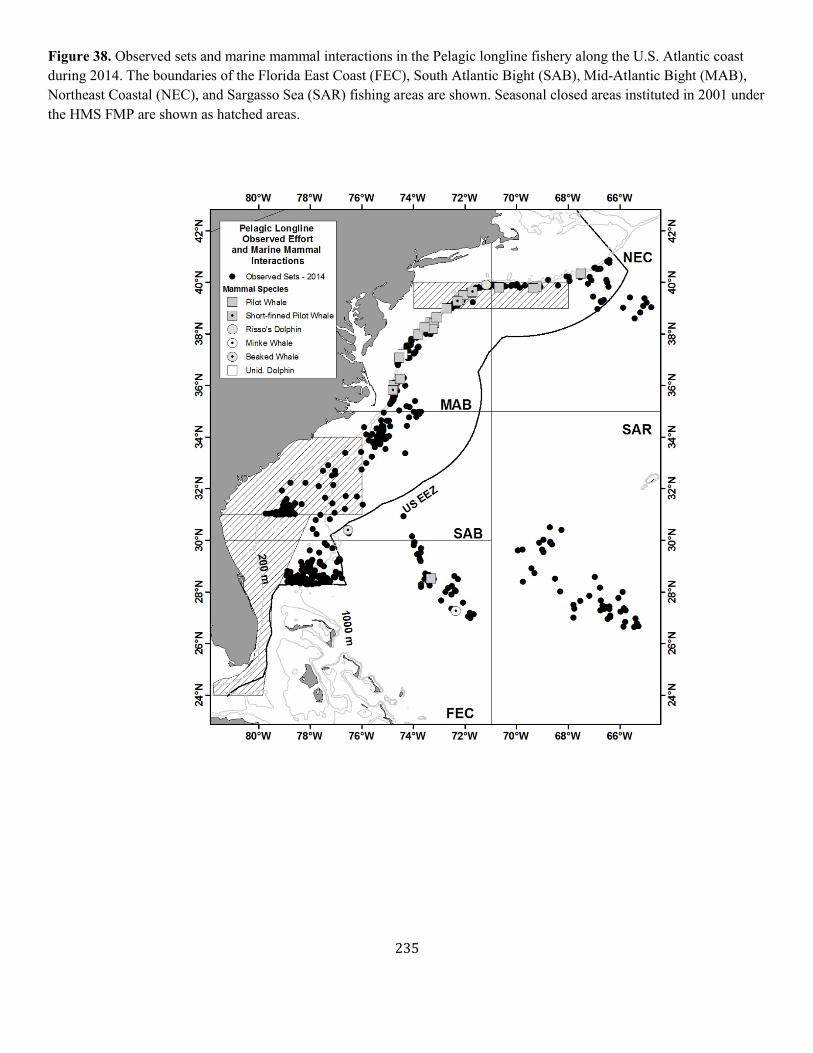
235
Figure 38. Observed sets and marine mammal interactions in the Pelagic longline fishery along the U.S. Atlantic coast during 2014. The boundaries of the Florida East Coast (FEC), South Atlantic Bight (SAB), Mid-Atlantic Bight (MAB), Northeast Coastal (NEC), and Sargasso Sea (SAR) fishing areas are shown. Seasonal closed areas instituted in 2001 under the HMS FMP are shown as hatched areas.
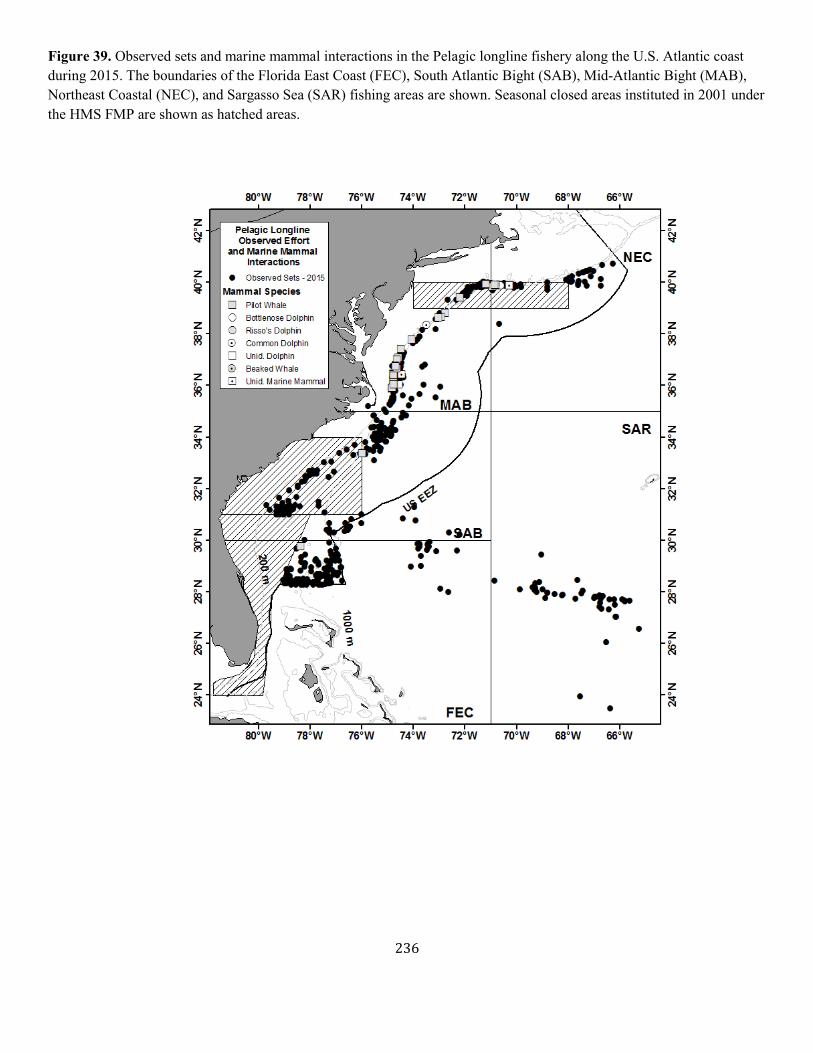
236
Figure 39. Observed sets and marine mammal interactions in the Pelagic longline fishery along the U.S. Atlantic coast during 2015. The boundaries of the Florida East Coast (FEC), South Atlantic Bight (SAB), Mid-Atlantic Bight (MAB), Northeast Coastal (NEC), and Sargasso Sea (SAR) fishing areas are shown. Seasonal closed areas instituted in 2001 under the HMS FMP are shown as hatched areas.
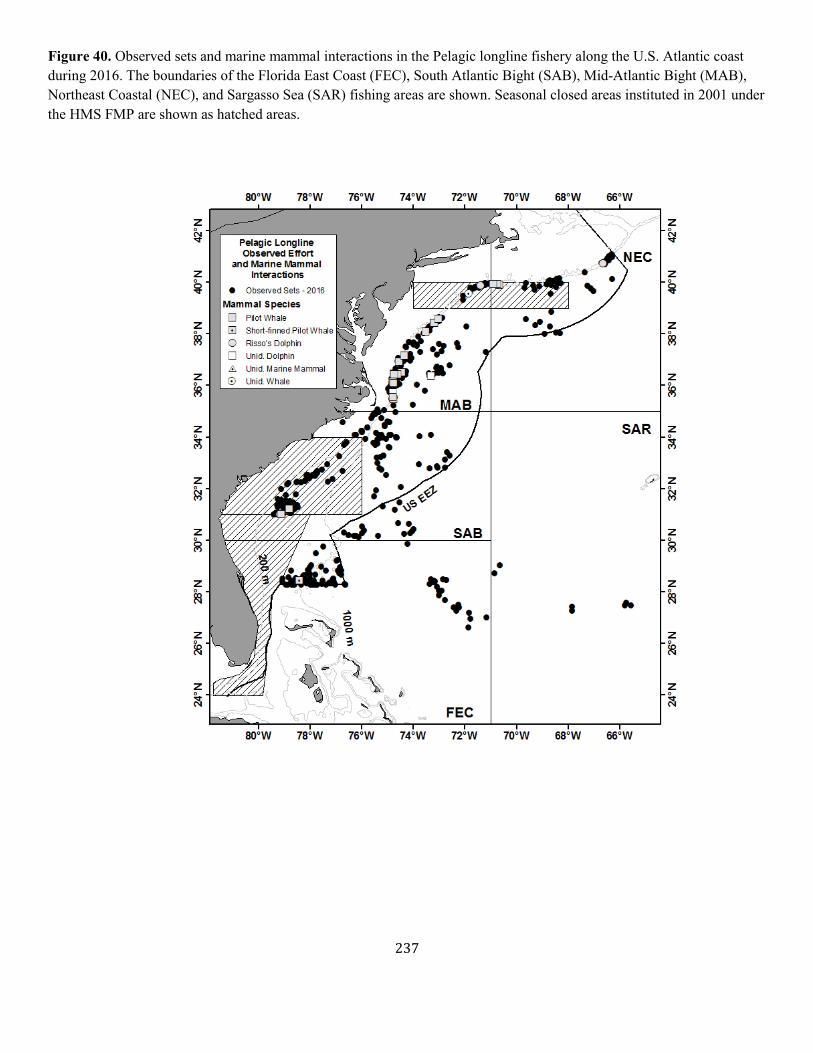
237
Figure 40. Observed sets and marine mammal interactions in the Pelagic longline fishery along the U.S. Atlantic coast during 2016. The boundaries of the Florida East Coast (FEC), South Atlantic Bight (SAB), Mid-Atlantic Bight (MAB), Northeast Coastal (NEC), and Sargasso Sea (SAR) fishing areas are shown. Seasonal closed areas instituted in 2001 under the HMS FMP are shown as hatched areas.
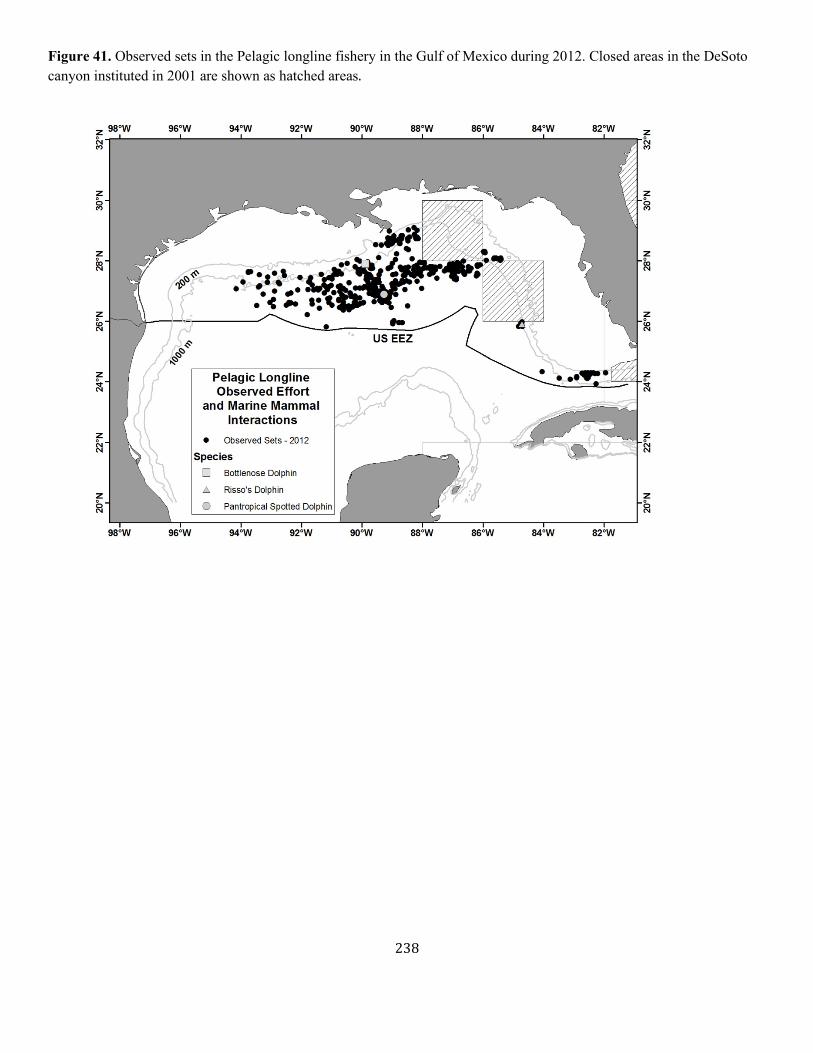
238
Figure 41. Observed sets in the Pelagic longline fishery in the Gulf of Mexico during 2012. Closed areas in the DeSoto canyon instituted in 2001 are shown as hatched areas.
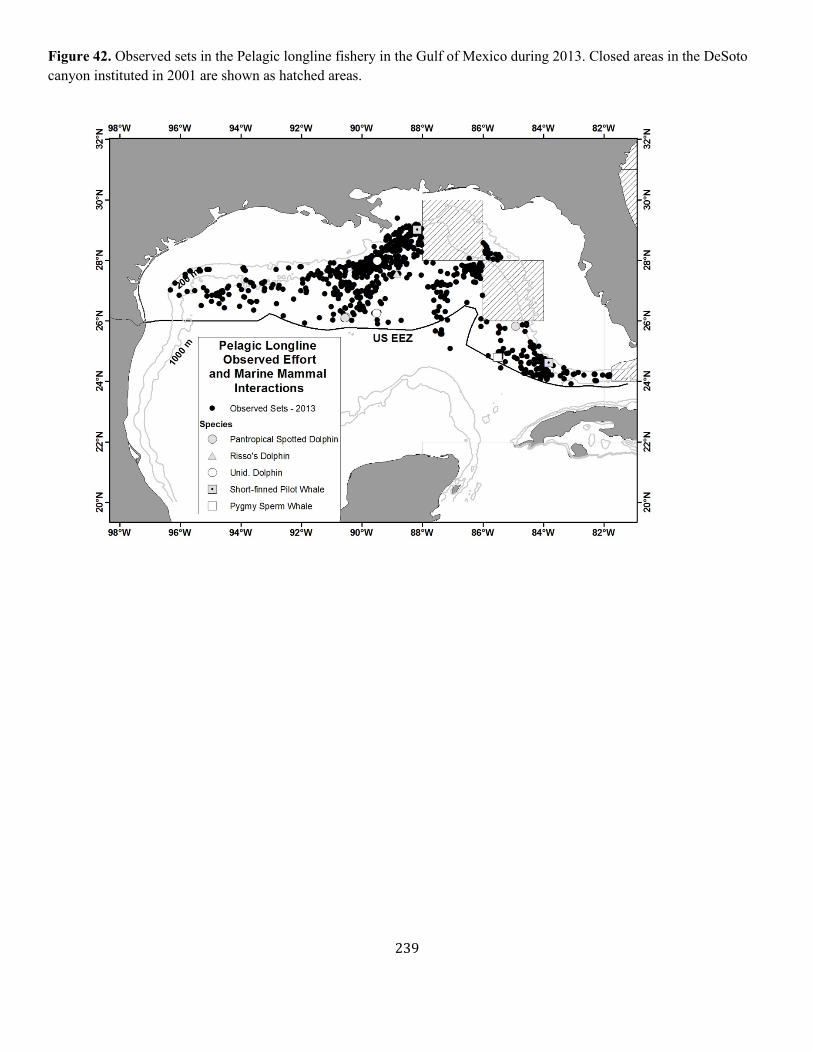
239
Figure 42. Observed sets in the Pelagic longline fishery in the Gulf of Mexico during 2013. Closed areas in the DeSoto canyon instituted in 2001 are shown as hatched areas.
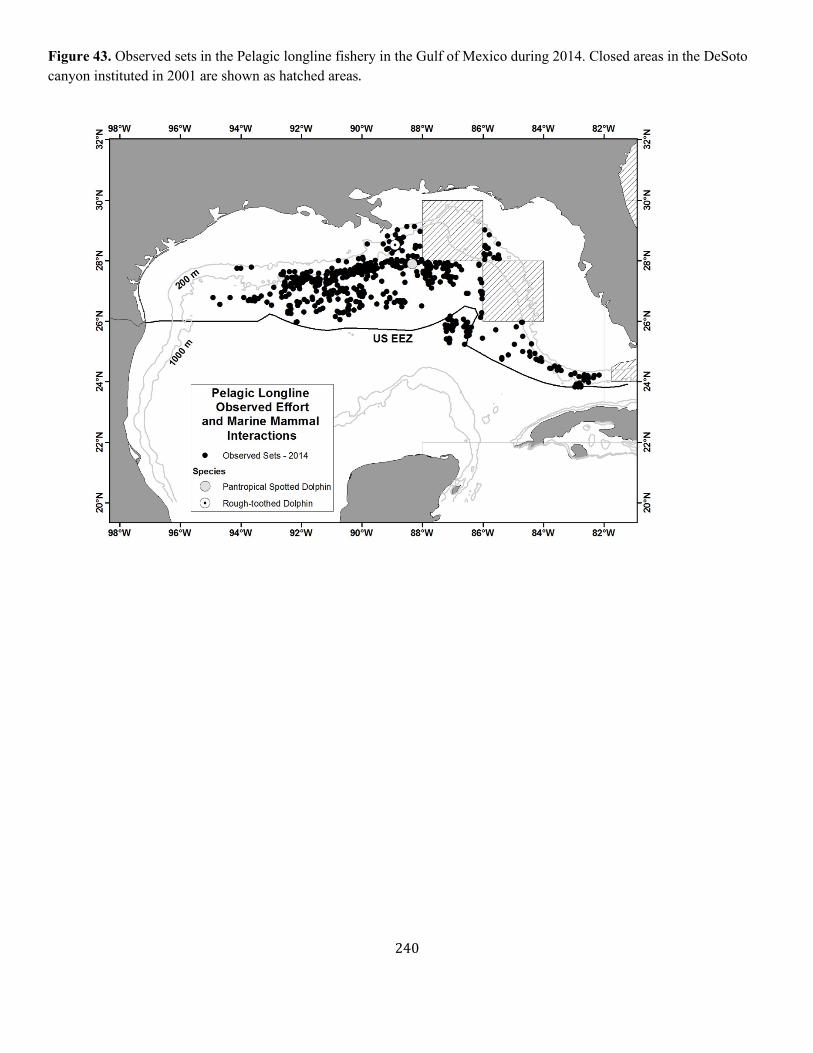
240
Figure 43. Observed sets in the Pelagic longline fishery in the Gulf of Mexico during 2014. Closed areas in the DeSoto canyon instituted in 2001 are shown as hatched areas.
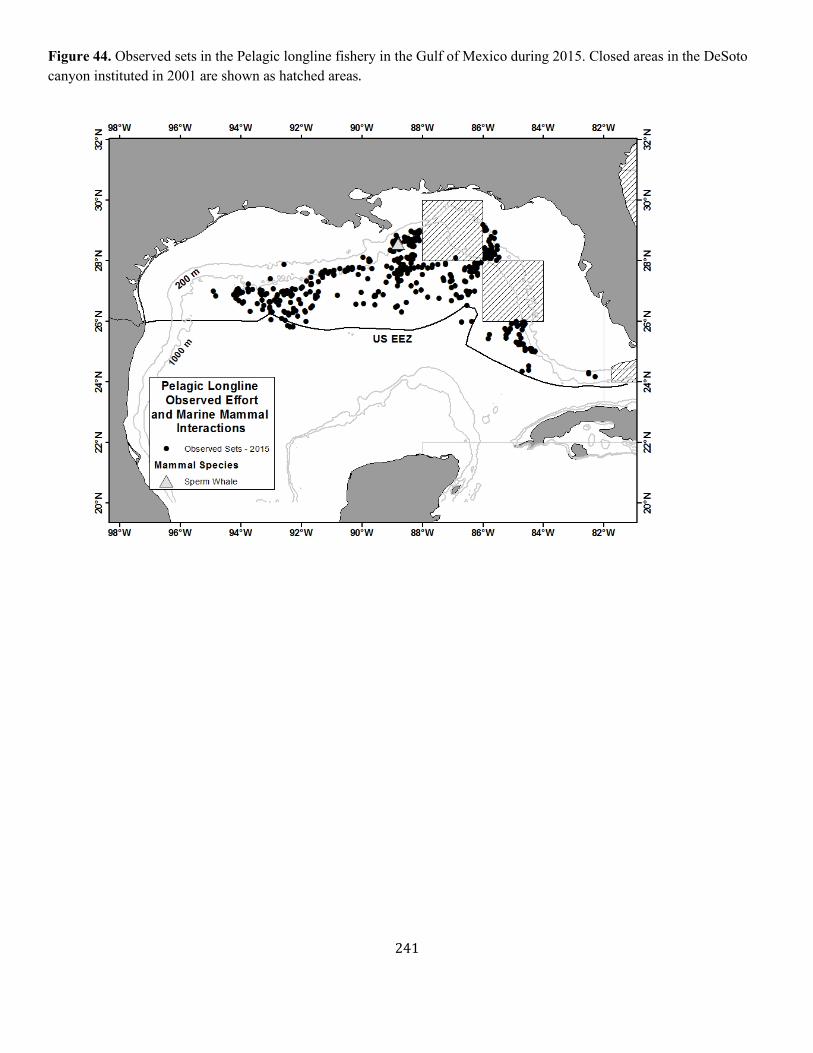
241
Figure 44. Observed sets in the Pelagic longline fishery in the Gulf of Mexico during 2015. Closed areas in the DeSoto canyon instituted in 2001 are shown as hatched areas.
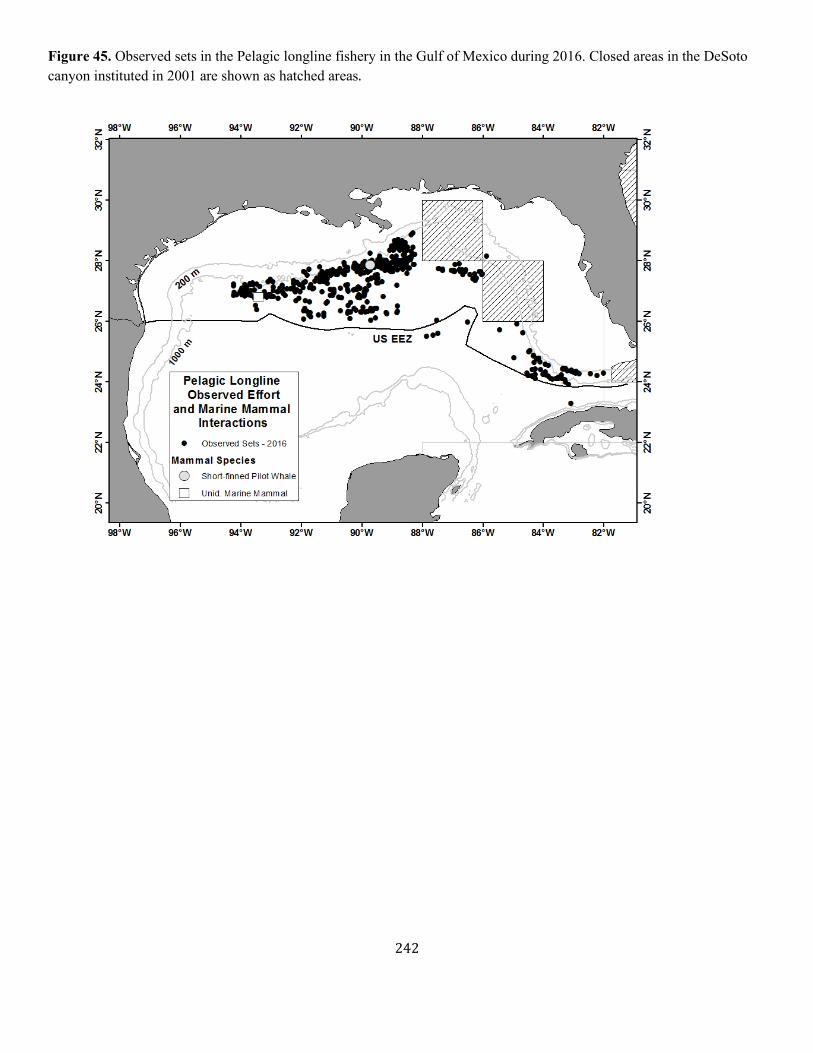
242
Figure 45. Observed sets in the Pelagic longline fishery in the Gulf of Mexico during 2016. Closed areas in the DeSoto canyon instituted in 2001 are shown as hatched areas.

243
Appendix IV: Surveys and Abundance Estimates
APPENDIX IV: Table A. Surveys
Survey Number Year Season Platform
Track line
length (km)
Area
Agency/
Program
Analysis
Corrected for g(0)
Reference
1 1982 year-round plane 211,585
Cape Hatteras, NC to Nova Scotia, continental shelf and shelf edge waters CETAP
Line transect analyses of distance data N CETAP 1982
2 1990 Aug
ship (Chapman) 2,067
Cape Hatteras, NC to Southern New England, north wall of the Gulf Stream NEC
One team data analyzed by DISTANCE N NMFS 1990
3 1991 Jul-Aug ship (Abel-J) 1,962
Gulf of Maine, lower Bay of Fundy, southern Scotian Shelf NEC
Two independent team data analyzed with modified direct duplicate method. Y Palka 1995
4 1991 Aug
boat (Sneak Attack) 640
inshore bays of Maine NEC
One team data analyzed by DISTANCE. Y Palka 1995
5 1991 Aug-Sep
plane 1(AT-11) 9,663
Cape Hatteras, NC to Nova Scotia, continental shelf and shelf edge waters
NEC/SEC
One team data analyzed by DISTANCE. N NMFS 1991
6 1991 Aug-Sep
plane 2 (Twin Otter)
Cape Hatteras, NC to Nova Scotia, continental shelf and shelf edge
NEC/SEC
One team data analyzed by DISTANCE. N NMFS 1991
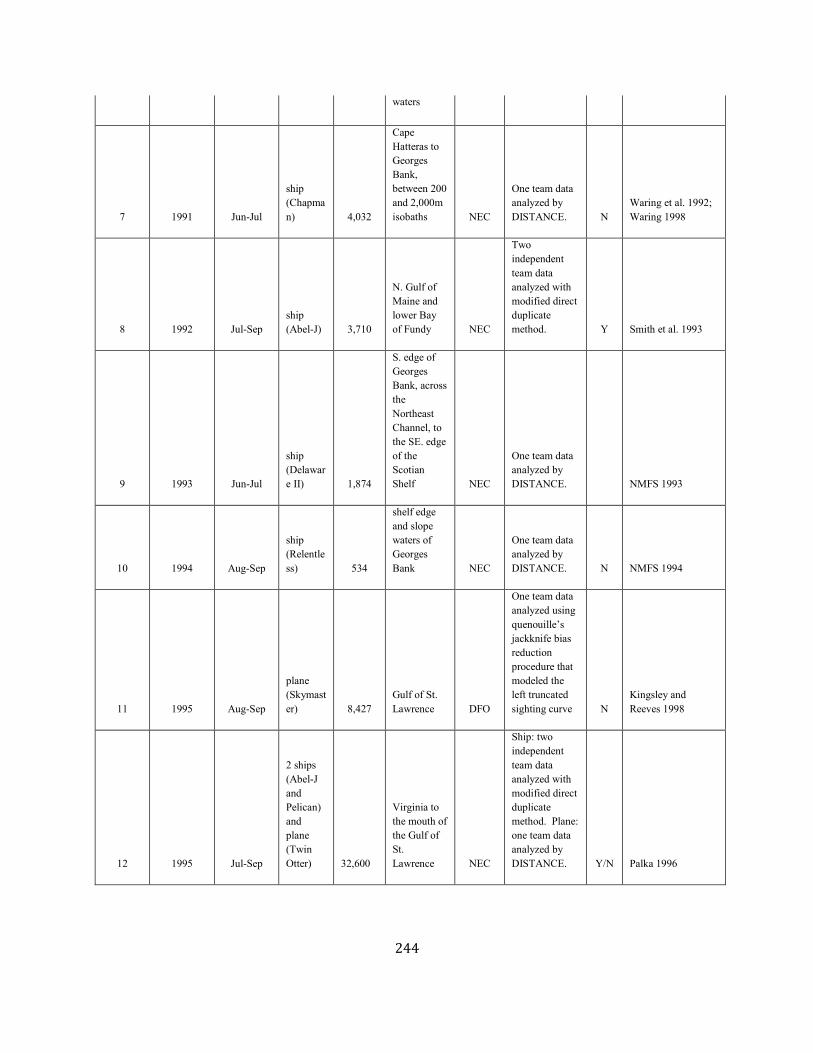
244
waters
7 1991 Jun-Jul
ship (Chapman) 4,032
Cape Hatteras to Georges Bank, between 200 and 2,000m isobaths NEC
One team data analyzed by DISTANCE. N
Waring et al. 1992; Waring 1998
8 1992 Jul-Sep ship (Abel-J) 3,710
N. Gulf of Maine and lower Bay of Fundy NEC
Two independent team data analyzed with modified direct duplicate method. Y Smith et al. 1993
9 1993 Jun-Jul
ship (Delaware II) 1,874
S. edge of Georges Bank, across the Northeast Channel, to the SE. edge of the Scotian Shelf NEC
One team data analyzed by DISTANCE. NMFS 1993
10 1994 Aug-Sep
ship (Relentless) 534
shelf edge and slope waters of Georges Bank NEC
One team data analyzed by DISTANCE. N NMFS 1994
11 1995 Aug-Sep
plane (Skymaster) 8,427
Gulf of St. Lawrence DFO
One team data analyzed using quenouille’s jackknife bias reduction procedure that modeled the left truncated sighting curve N
Kingsley and Reeves 1998
12 1995 Jul-Sep
2 ships (Abel-J and Pelican) and plane (Twin Otter) 32,600
Virginia to the mouth of the Gulf of St. Lawrence NEC
Ship: two independent team data analyzed with modified direct duplicate method. Plane: one team data analyzed by DISTANCE. Y/N Palka 1996
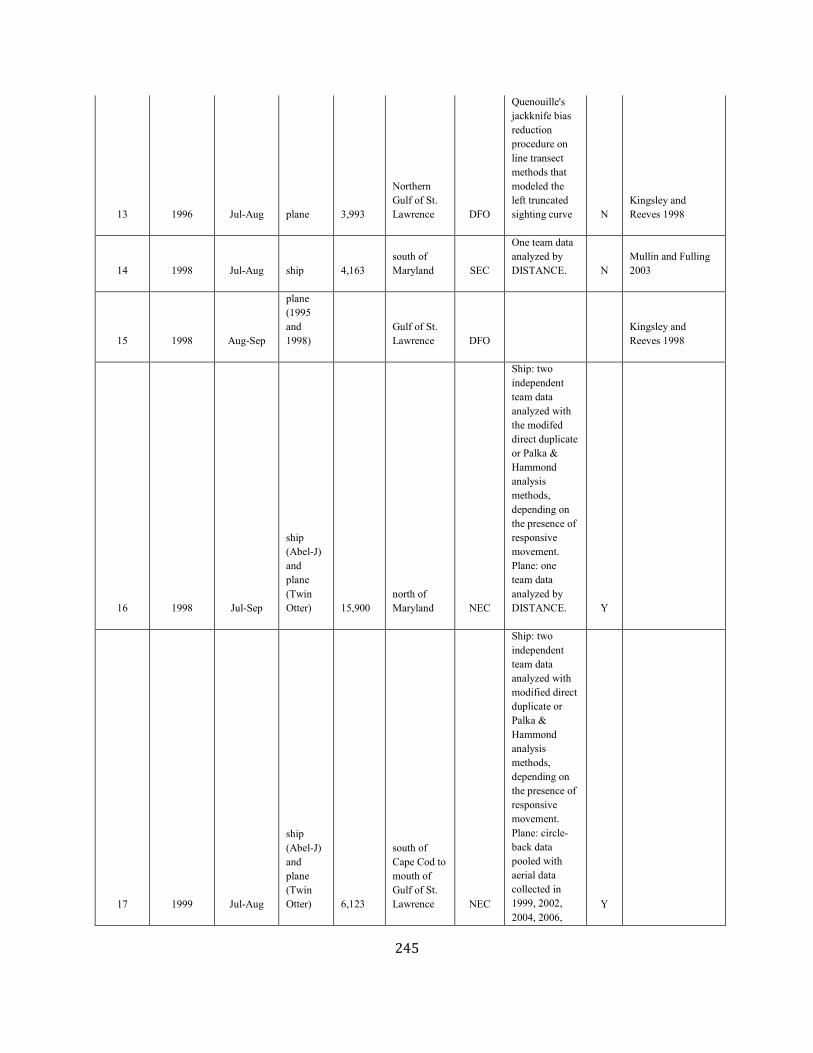
245
13 1996 Jul-Aug plane 3,993
Northern Gulf of St. Lawrence DFO
Quenouille's jackknife bias reduction procedure on line transect methods that modeled the left truncated sighting curve N
Kingsley and Reeves 1998
14 1998 Jul-Aug ship 4,163 south of Maryland SEC
One team data analyzed by DISTANCE. N
Mullin and Fulling 2003
15 1998 Aug-Sep
plane (1995 and 1998)
Gulf of St. Lawrence DFO
Kingsley and Reeves 1998
16 1998 Jul-Sep
ship (Abel-J) and plane (Twin Otter) 15,900
north of Maryland NEC
Ship: two independent team data analyzed with the modifed direct duplicate or Palka & Hammond analysis methods, depending on the presence of responsive movement. Plane: one team data analyzed by DISTANCE. Y
17 1999 Jul-Aug
ship (Abel-J) and plane (Twin Otter) 6,123
south of Cape Cod to mouth of Gulf of St. Lawrence NEC
Ship: two independent team data analyzed with modified direct duplicate or Palka & Hammond analysis methods, depending on the presence of responsive movement. Plane: circle-back data pooled with aerial data collected in 1999, 2002, 2004, 2006,
Y
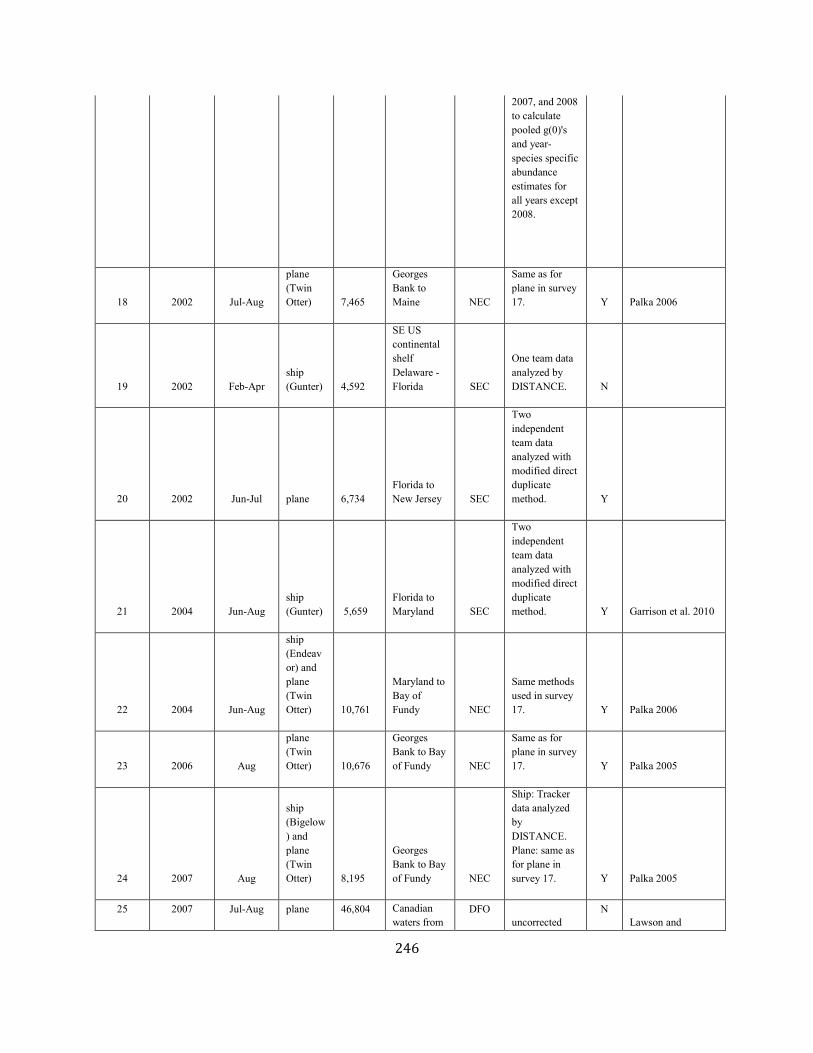
246
2007, and 2008 to calculate pooled g(0)'s and year-species specific abundance estimates for all years except 2008.
18 2002 Jul-Aug
plane (Twin Otter) 7,465
Georges Bank to Maine NEC
Same as for plane in survey 17. Y Palka 2006
19 2002 Feb-Apr ship (Gunter) 4,592
SE US continental shelf Delaware - Florida SEC
One team data analyzed by DISTANCE. N
20 2002 Jun-Jul plane 6,734 Florida to New Jersey SEC
Two independent team data analyzed with modified direct duplicate method. Y
21 2004 Jun-Aug ship (Gunter) 5,659
Florida to Maryland SEC
Two independent team data analyzed with modified direct duplicate method. Y Garrison et al. 2010
22 2004 Jun-Aug
ship (Endeavor) and plane (Twin Otter) 10,761
Maryland to Bay of Fundy NEC
Same methods used in survey 17. Y Palka 2006
23 2006 Aug
plane (Twin Otter) 10,676
Georges Bank to Bay of Fundy NEC
Same as for plane in survey 17. Y Palka 2005
24 2007 Aug
ship (Bigelow) and plane (Twin Otter) 8,195
Georges Bank to Bay of Fundy NEC
Ship: Tracker data analyzed by DISTANCE. Plane: same as for plane in survey 17. Y Palka 2005
25 2007 Jul-Aug plane 46,804 Canadian waters from
DFO uncorrected
N Lawson and
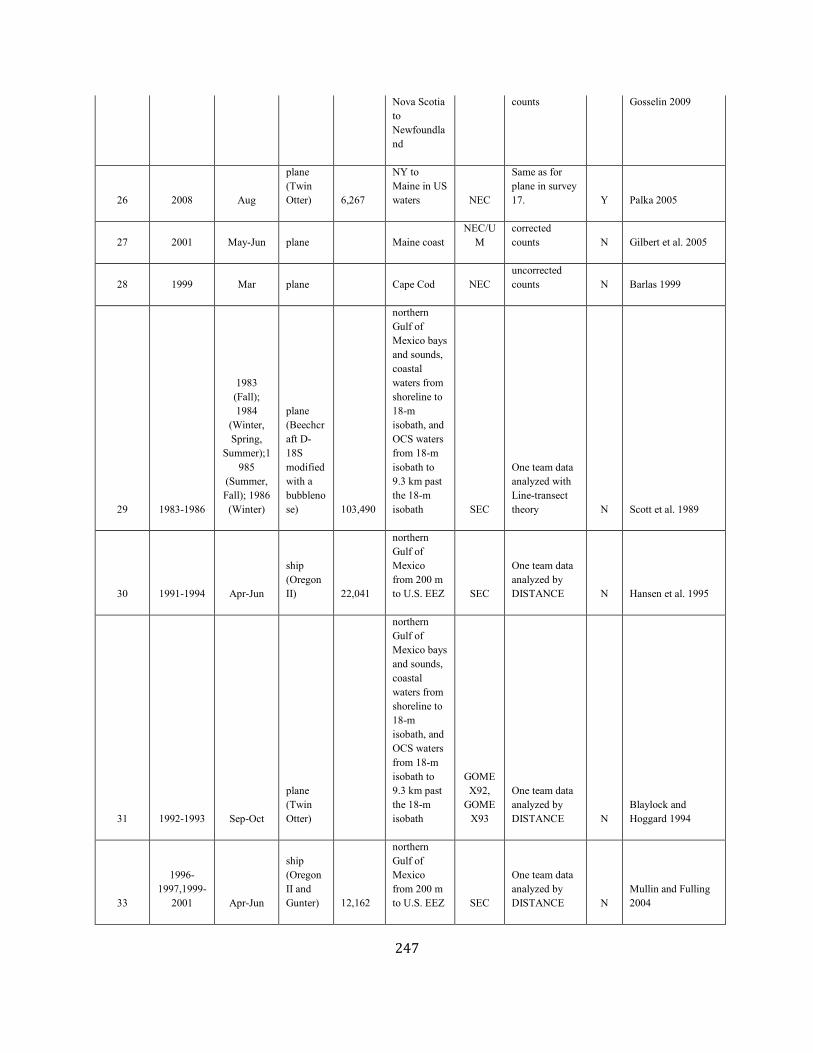
247
Nova Scotia to Newfoundland
counts Gosselin 2009
26 2008 Aug
plane (Twin Otter) 6,267
NY to Maine in US waters NEC
Same as for plane in survey 17. Y Palka 2005
27 2001 May-Jun plane
Maine coast NEC/U
M corrected counts N Gilbert et al. 2005
28 1999 Mar plane
Cape Cod NEC uncorrected counts N Barlas 1999
29 1983-1986
1983 (Fall); 1984
(Winter, Spring,
Summer);1985
(Summer, Fall); 1986 (Winter)
plane (Beechcraft D-18S modified with a bubblenose) 103,490
northern Gulf of Mexico bays and sounds, coastal waters from shoreline to 18-m isobath, and OCS waters from 18-m isobath to 9.3 km past the 18-m isobath SEC
One team data analyzed with Line-transect theory N Scott et al. 1989
30 1991-1994 Apr-Jun
ship (Oregon II) 22,041
northern Gulf of Mexico from 200 m to U.S. EEZ SEC
One team data analyzed by DISTANCE N Hansen et al. 1995
31 1992-1993 Sep-Oct
plane (Twin Otter)
northern Gulf of Mexico bays and sounds, coastal waters from shoreline to 18-m isobath, and OCS waters from 18-m isobath to 9.3 km past the 18-m isobath
GOMEX92,
GOMEX93
One team data analyzed by DISTANCE N
Blaylock and Hoggard 1994
33
1996-1997,1999-
2001 Apr-Jun
ship (Oregon II and Gunter) 12,162
northern Gulf of Mexico from 200 m to U.S. EEZ SEC
One team data analyzed by DISTANCE N
Mullin and Fulling 2004

248
34 1998-2001 end Aug-early Oct
ship (Gunter and Oregon II) 2,196
northern Gulf of Mexico outer continental shelf (OCS, 20-200 m) SEC
One team data analyzed by DISTANCE N Fulling et al. 2003
36 2004 12-13 Jan helicopter
Sable Island DFO Pup count na Bowen et al. 2007
37 2004 plane
Gulf of St Lawrence and Nova Scotia Eastern Shore DFO Pup count na Hammill 2005
38 2009 10 Jun-13
Aug ship 4,600
northern Gulf of Mexico from 200m to U.S. EEZ SEC
One team data analyzed by DISTANCE
39 2007 17 Jul-8
Aug plane
northern Gulf of Mexico from shore to 200m(majority of effort 0- 20m) SEC
One team data analyzed by DISTANCE
40 2011 4 Jun-1
Aug
ship (Bigelow) 3,107
Virginia to Massachusetts (waters that were deeper than the 100-m depth contour out to beyond the US EEZ) NEC
Two-independent teams, both using big-eyes. Analyzed using DISTANCE, the independent observer option assuming point independence Y Palka 2012
41 2011 7-26 Aug
Plane (Twin Otter) 5,313
Massachusetts to New Brunswick, Canada (waters north of New Jersey and shallower than the 100-m depth contour, through the US and
NEC
Two-independent teams, both using naked eye in the same plane. Analyzed using DISTANCE, the independent observer option assuming point independence Y Palka 2012
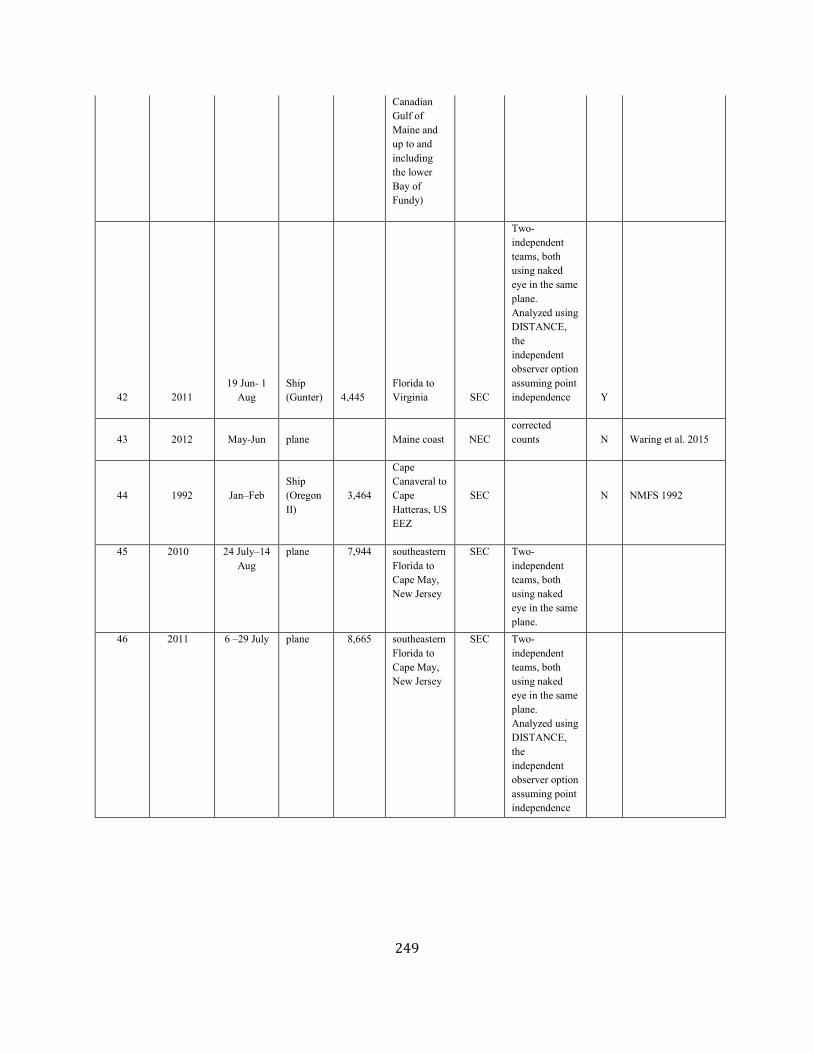
249
Canadian Gulf of Maine and up to and including the lower Bay of Fundy)
42 2011 19 Jun- 1
Aug Ship (Gunter) 4,445
Florida to Virginia SEC
Two-independent teams, both using naked eye in the same plane. Analyzed using DISTANCE, the independent observer option assuming point independence Y
43 2012 May-Jun plane
Maine coast NEC corrected counts N Waring et al. 2015
44 1992 Jan–Feb Ship (Oregon II)
3,464
Cape Canaveral to Cape Hatteras, US EEZ
SEC N NMFS 1992
45 2010 24 July–14 Aug
plane 7,944 southeastern Florida to Cape May, New Jersey
SEC Two-independent teams, both using naked eye in the same plane. A l d i
46 2011 6 –29 July plane 8,665 southeastern Florida to Cape May, New Jersey
SEC Two-independent teams, both using naked eye in the same plane. Analyzed using DISTANCE, the independent observer option assuming point independence
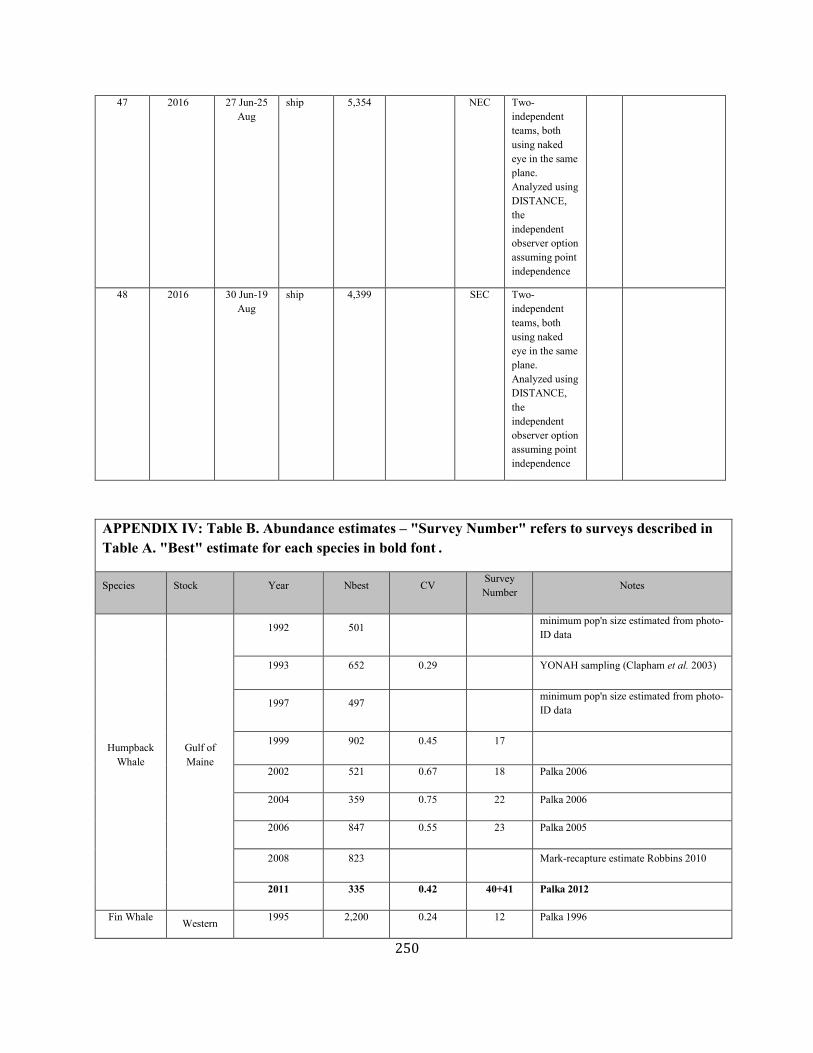
250
47 2016 27 Jun-25 Aug
ship 5,354 NEC Two-independent teams, both using naked eye in the same plane. Analyzed using DISTANCE, the independent observer option assuming point independence
48 2016 30 Jun-19 Aug
ship 4,399 SEC Two-independent teams, both using naked eye in the same plane. Analyzed using DISTANCE, the independent observer option assuming point independence
APPENDIX IV: Table B. Abundance estimates – "Survey Number" refers to surveys described in Table A. "Best" estimate for each species in bold font .
Species Stock Year Nbest CV Survey Number Notes
Humpback Whale
Gulf of Maine
1992 501 minimum pop'n size estimated from photo-ID data
1993 652 0.29 YONAH sampling (Clapham et al. 2003)
1997 497 minimum pop'n size estimated from photo-ID data
1999 902 0.45 17
2002 521 0.67 18 Palka 2006
2004 359 0.75 22 Palka 2006
2006 847 0.55 23 Palka 2005
2008 823 Mark-recapture estimate Robbins 2010
2011 335 0.42 40+41 Palka 2012
Fin Whale Western 1995 2,200 0.24 12 Palka 1996

251
North Atlantic
1999 2,814 0.21 18 Palka 2006
2002 2,933 0.49 18 Palka 2006
2004 1,925 0.55 22 Palka 2006
2006 2,269 0.37 23 Palka 2005
2007 3,522 0.27 25 Lawson and Gosselin 2009
2011 1,595 0.33 40+41 Palka 2012
2011 23 0.87 42
2011 1,618 0.33 40+41+42 Estimate summed from north and south surveys
Sei Whale Nova Scotia Stock
1977 1,393-2,248 based on tag-recapture data (Mitchell and Chapman 1977)
1977 870 based on census data (Mitchell and Chapman 1977)
1982 280 1 CETAP 1982
2002 71 1.01 18 Palka 2006
2004 386 0.85 22 Palka 2006
2006 207 0.62 23 Palka 2005
2011 357 0.52 40+41 Palka 2012
Minke Whale
Canadian East Coast
1982 320 0.23 1 CETAP 1982
1992 2,650 0.31 3+8
1993 330 0.66 9
1995 2,790 0.32 12 Palka 1996
1995 1,020 0.27 11
1996 620 0.52 13
1999 2,998 0.19 17
2002 756 0.9 18 Palka 2006
2004 600 0.61 22 Palka 2006
2006 3,312 0.74 23
2007 20,741 0.3 25 Lawson and Gosselin 2009
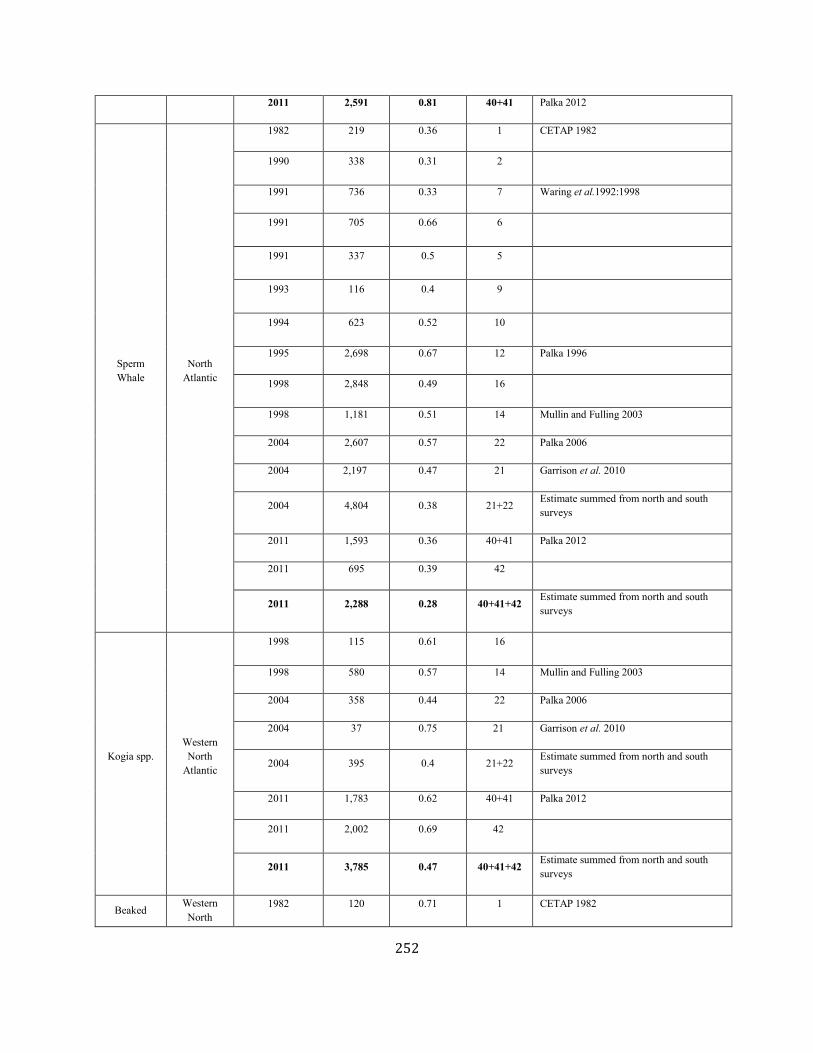
252
2011 2,591 0.81 40+41 Palka 2012
Sperm Whale
North Atlantic
1982 219 0.36 1 CETAP 1982
1990 338 0.31 2
1991 736 0.33 7 Waring et al.1992:1998
1991 705 0.66 6
1991 337 0.5 5
1993 116 0.4 9
1994 623 0.52 10
1995 2,698 0.67 12 Palka 1996
1998 2,848 0.49 16
1998 1,181 0.51 14 Mullin and Fulling 2003
2004 2,607 0.57 22 Palka 2006
2004 2,197 0.47 21 Garrison et al. 2010
2004 4,804 0.38 21+22 Estimate summed from north and south surveys
2011 1,593 0.36 40+41 Palka 2012
2011 695 0.39 42
2011 2,288 0.28 40+41+42 Estimate summed from north and south surveys
Kogia spp. Western North
Atlantic
1998 115 0.61 16
1998 580 0.57 14 Mullin and Fulling 2003
2004 358 0.44 22 Palka 2006
2004 37 0.75 21 Garrison et al. 2010
2004 395 0.4 21+22 Estimate summed from north and south surveys
2011 1,783 0.62 40+41 Palka 2012
2011 2,002 0.69 42
2011 3,785 0.47 40+41+42 Estimate summed from north and south surveys
Beaked Western North
1982 120 0.71 1 CETAP 1982
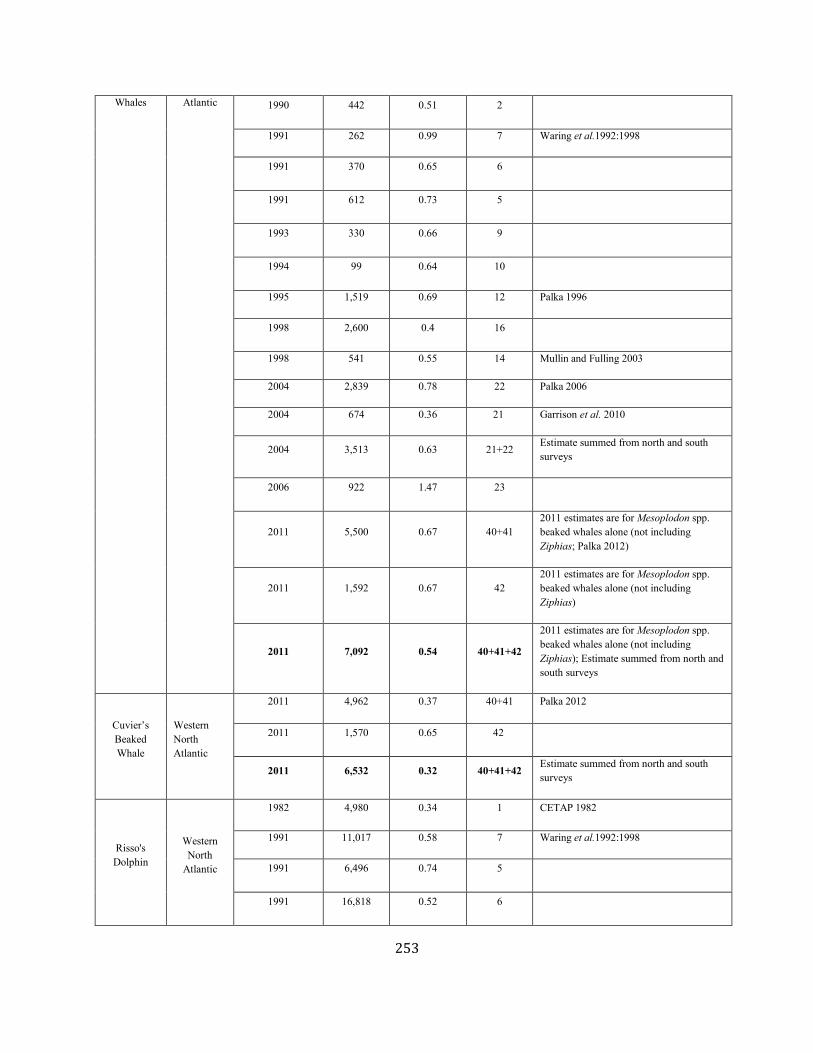
253
Whales Atlantic 1990 442 0.51 2
1991 262 0.99 7 Waring et al.1992:1998
1991 370 0.65 6
1991 612 0.73 5
1993 330 0.66 9
1994 99 0.64 10
1995 1,519 0.69 12 Palka 1996
1998 2,600 0.4 16
1998 541 0.55 14 Mullin and Fulling 2003
2004 2,839 0.78 22 Palka 2006
2004 674 0.36 21 Garrison et al. 2010
2004 3,513 0.63 21+22 Estimate summed from north and south surveys
2006 922 1.47 23
2011 5,500 0.67 40+41 2011 estimates are for Mesoplodon spp. beaked whales alone (not including Ziphias; Palka 2012)
2011 1,592 0.67 42 2011 estimates are for Mesoplodon spp. beaked whales alone (not including Ziphias)
2011 7,092 0.54 40+41+42
2011 estimates are for Mesoplodon spp. beaked whales alone (not including Ziphias); Estimate summed from north and south surveys
Cuvier’s Beaked Whale
Western North Atlantic
2011 4,962 0.37 40+41 Palka 2012
2011 1,570 0.65 42
2011 6,532 0.32 40+41+42 Estimate summed from north and south surveys
Risso's Dolphin
Western North
Atlantic
1982 4,980 0.34 1 CETAP 1982
1991 11,017 0.58 7 Waring et al.1992:1998
1991 6,496 0.74 5
1991 16,818 0.52 6
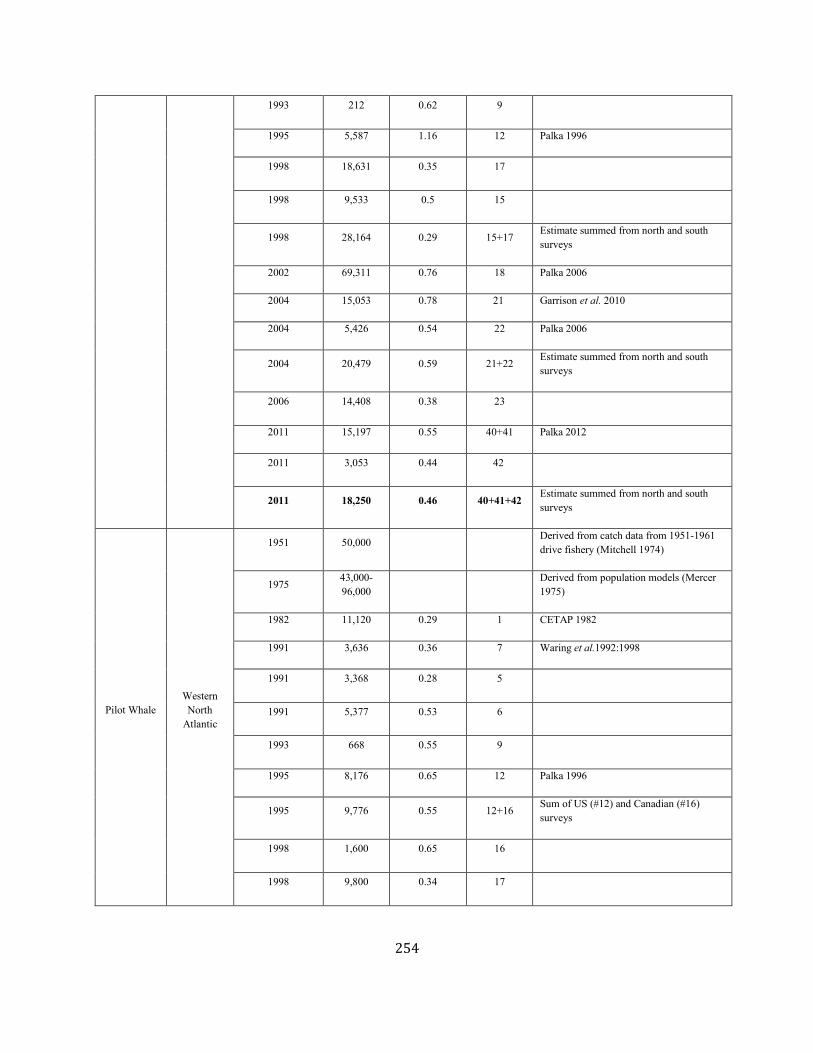
254
1993 212 0.62 9
1995 5,587 1.16 12 Palka 1996
1998 18,631 0.35 17
1998 9,533 0.5 15
1998 28,164 0.29 15+17 Estimate summed from north and south surveys
2002 69,311 0.76 18 Palka 2006
2004 15,053 0.78 21 Garrison et al. 2010
2004 5,426 0.54 22 Palka 2006
2004 20,479 0.59 21+22 Estimate summed from north and south surveys
2006 14,408 0.38 23
2011 15,197 0.55 40+41 Palka 2012
2011 3,053 0.44 42
2011 18,250 0.46 40+41+42 Estimate summed from north and south surveys
Pilot Whale Western North
Atlantic
1951 50,000 Derived from catch data from 1951-1961 drive fishery (Mitchell 1974)
1975 43,000-96,000 Derived from population models (Mercer
1975)
1982 11,120 0.29 1 CETAP 1982
1991 3,636 0.36 7 Waring et al.1992:1998
1991 3,368 0.28 5
1991 5,377 0.53 6
1993 668 0.55 9
1995 8,176 0.65 12 Palka 1996
1995 9,776 0.55 12+16 Sum of US (#12) and Canadian (#16) surveys
1998 1,600 0.65 16
1998 9,800 0.34 17

255
1998 5,109 0.41 15
2002 5,408 0.56 18 Palka 2006
2004 15,728 0.34 22 Palka 2006
2004 15,411 0.43 21 Garrison et al. 2010
2004 31,139 0.27 21+22 Estimate summed from north and south surveys
2006 26,535 0.35 23 Estimate summed from north and south surveys
2007 16,058 0.79 25 Lawson and Gosselin 2009; long-finned pilot whales
2011 5,636 0.63 40+41 long-finned pilot whales
2011 11,865 0.57 40+41 unidentified pilot whales
2011 4,569 0.57 40+41 short-finned pilot whales
2011 16,946 0.43 42 short-finned pilot whales
2011 21,515 0.37 40+41+42 Best estimate for short-finned pilot whales alone; Estimate summed from north and south surveys
2016 3,810 .42 47 short-finned pilot whales
2016 25,114 .27 48 short-finned pilot whales
2016 28,924 .24 47+48 Best estimate for short-finned pilot whales alone; Estimate summed from north and south surveys
Atlantic white-sided
Dolphin
Western North
Atlantic
1982 28,600 0.21 1
1992 20,400 0.63 2+7
1993 729 0.47 9
1995 27,200 0.43 12 Palka 1996
1995 11,750 0.47 11
1996 560 0.89 13
1999 51,640 0.38 17
2002 109,141 0.3 18 Palka 2006
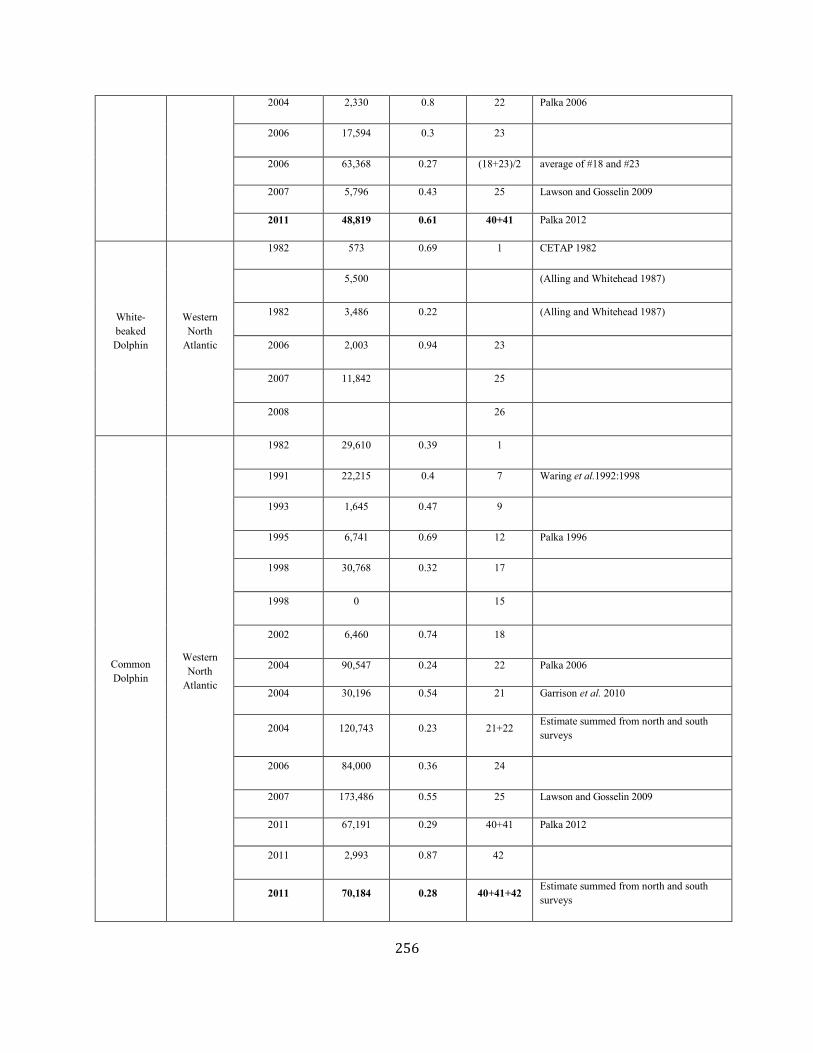
256
2004 2,330 0.8 22 Palka 2006
2006 17,594 0.3 23
2006 63,368 0.27 (18+23)/2 average of #18 and #23
2007 5,796 0.43 25 Lawson and Gosselin 2009
2011 48,819 0.61 40+41 Palka 2012
White-beaked Dolphin
Western North
Atlantic
1982 573 0.69 1 CETAP 1982
5,500 (Alling and Whitehead 1987)
1982 3,486 0.22 (Alling and Whitehead 1987)
2006 2,003 0.94 23
2007 11,842 25
2008 26
Common Dolphin
Western North
Atlantic
1982 29,610 0.39 1
1991 22,215 0.4 7 Waring et al.1992:1998
1993 1,645 0.47 9
1995 6,741 0.69 12 Palka 1996
1998 30,768 0.32 17
1998 0 15
2002 6,460 0.74 18
2004 90,547 0.24 22 Palka 2006
2004 30,196 0.54 21 Garrison et al. 2010
2004 120,743 0.23 21+22 Estimate summed from north and south surveys
2006 84,000 0.36 24
2007 173,486 0.55 25 Lawson and Gosselin 2009
2011 67,191 0.29 40+41 Palka 2012
2011 2,993 0.87 42
2011 70,184 0.28 40+41+42 Estimate summed from north and south surveys
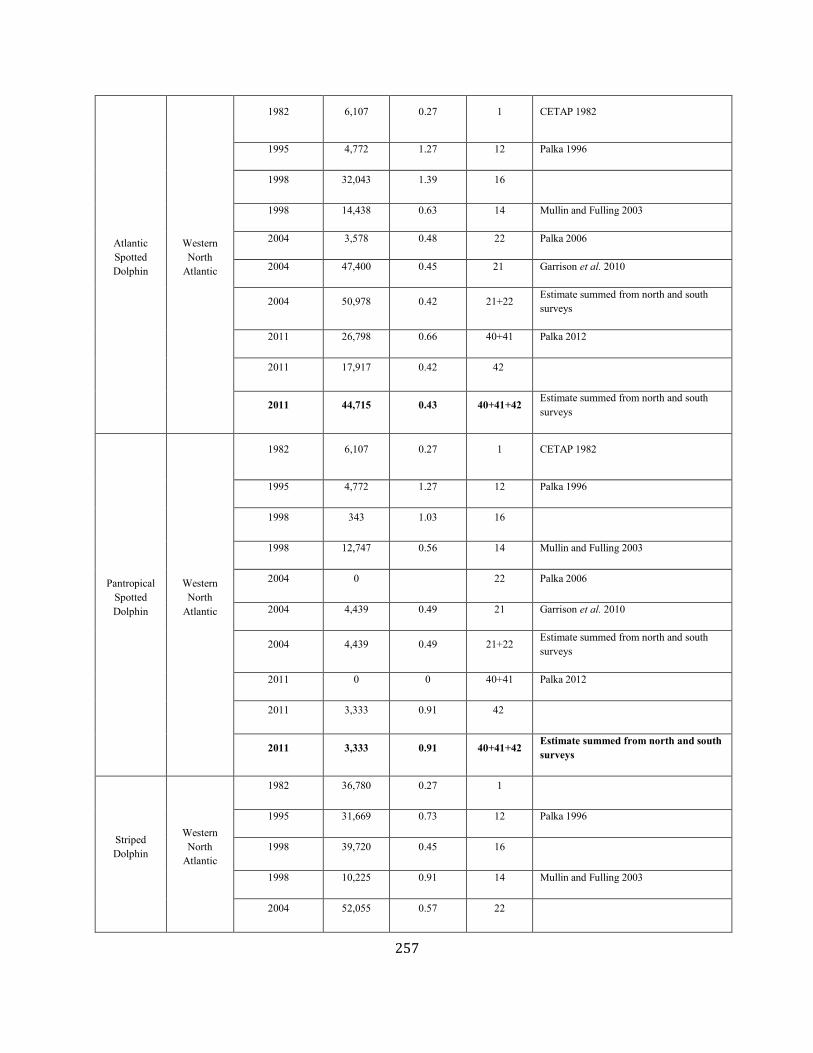
257
Atlantic Spotted Dolphin
Western North
Atlantic
1982 6,107 0.27 1 CETAP 1982
1995 4,772 1.27 12 Palka 1996
1998 32,043 1.39 16
1998 14,438 0.63 14 Mullin and Fulling 2003
2004 3,578 0.48 22 Palka 2006
2004 47,400 0.45 21 Garrison et al. 2010
2004 50,978 0.42 21+22 Estimate summed from north and south surveys
2011 26,798 0.66 40+41 Palka 2012
2011 17,917 0.42 42
2011 44,715 0.43 40+41+42 Estimate summed from north and south surveys
Pantropical Spotted Dolphin
Western North
Atlantic
1982 6,107 0.27 1 CETAP 1982
1995 4,772 1.27 12 Palka 1996
1998 343 1.03 16
1998 12,747 0.56 14 Mullin and Fulling 2003
2004 0 22 Palka 2006
2004 4,439 0.49 21 Garrison et al. 2010
2004 4,439 0.49 21+22 Estimate summed from north and south surveys
2011 0 0 40+41 Palka 2012
2011 3,333 0.91 42
2011 3,333 0.91 40+41+42 Estimate summed from north and south surveys
Striped Dolphin
Western North
Atlantic
1982 36,780 0.27 1
1995 31,669 0.73 12 Palka 1996
1998 39,720 0.45 16
1998 10,225 0.91 14 Mullin and Fulling 2003
2004 52,055 0.57 22
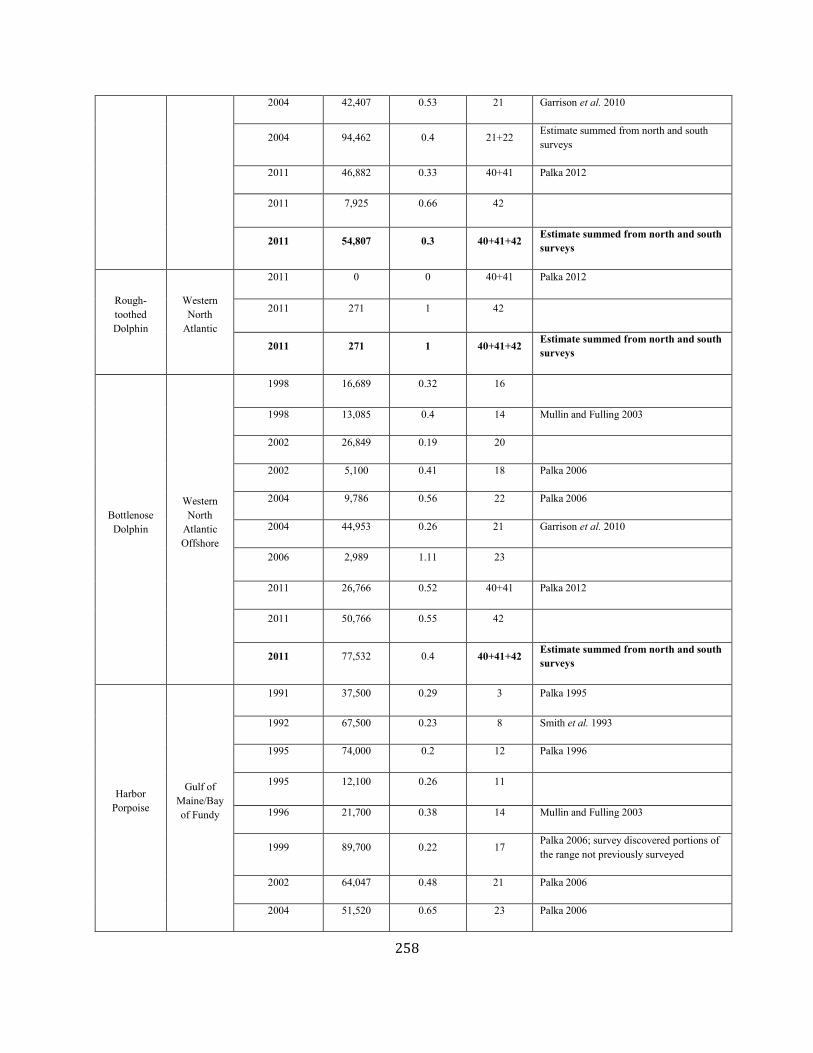
258
2004 42,407 0.53 21 Garrison et al. 2010
2004 94,462 0.4 21+22 Estimate summed from north and south surveys
2011 46,882 0.33 40+41 Palka 2012
2011 7,925 0.66 42
2011 54,807 0.3 40+41+42 Estimate summed from north and south surveys
Rough- toothed Dolphin
Western North
Atlantic
2011 0 0 40+41 Palka 2012
2011 271 1 42
2011 271 1 40+41+42 Estimate summed from north and south surveys
Bottlenose Dolphin
Western North
Atlantic Offshore
1998 16,689 0.32 16
1998 13,085 0.4 14 Mullin and Fulling 2003
2002 26,849 0.19 20
2002 5,100 0.41 18 Palka 2006
2004 9,786 0.56 22 Palka 2006
2004 44,953 0.26 21 Garrison et al. 2010
2006 2,989 1.11 23
2011 26,766 0.52 40+41 Palka 2012
2011 50,766 0.55 42
2011 77,532 0.4 40+41+42 Estimate summed from north and south surveys
Harbor Porpoise
Gulf of Maine/Bay of Fundy
1991 37,500 0.29 3 Palka 1995
1992 67,500 0.23 8 Smith et al. 1993
1995 74,000 0.2 12 Palka 1996
1995 12,100 0.26 11
1996 21,700 0.38 14 Mullin and Fulling 2003
1999 89,700 0.22 17 Palka 2006; survey discovered portions of the range not previously surveyed
2002 64,047 0.48 21 Palka 2006
2004 51,520 0.65 23 Palka 2006
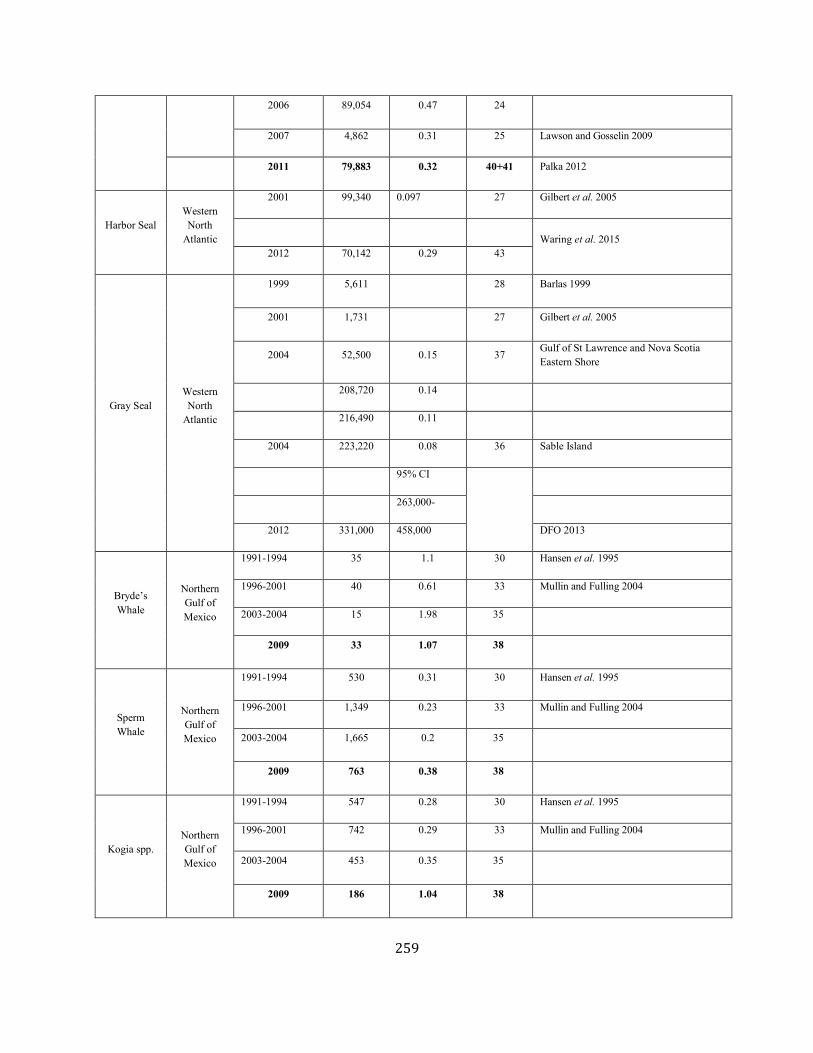
259
2006 89,054 0.47 24
2007 4,862 0.31 25 Lawson and Gosselin 2009
2011 79,883 0.32 40+41 Palka 2012
Harbor Seal Western North
Atlantic
2001 99,340 0.097 27 Gilbert et al. 2005
Waring et al. 2015
2012 70,142 0.29 43
Gray Seal Western North
Atlantic
1999 5,611 28 Barlas 1999
2001 1,731 27 Gilbert et al. 2005
2004 52,500 0.15 37 Gulf of St Lawrence and Nova Scotia Eastern Shore
208,720 0.14
216,490 0.11
2004 223,220 0.08 36 Sable Island
95% CI
263,000-
2012 331,000 458,000 DFO 2013
Bryde’s Whale
Northern Gulf of Mexico
1991-1994 35 1.1 30 Hansen et al. 1995
1996-2001 40 0.61 33 Mullin and Fulling 2004
2003-2004 15 1.98 35
2009 33 1.07 38
Sperm Whale
Northern Gulf of Mexico
1991-1994 530 0.31 30 Hansen et al. 1995
1996-2001 1,349 0.23 33 Mullin and Fulling 2004
2003-2004 1,665 0.2 35
2009 763 0.38 38
Kogia spp. Northern Gulf of Mexico
1991-1994 547 0.28 30 Hansen et al. 1995
1996-2001 742 0.29 33 Mullin and Fulling 2004
2003-2004 453 0.35 35
2009 186 1.04 38
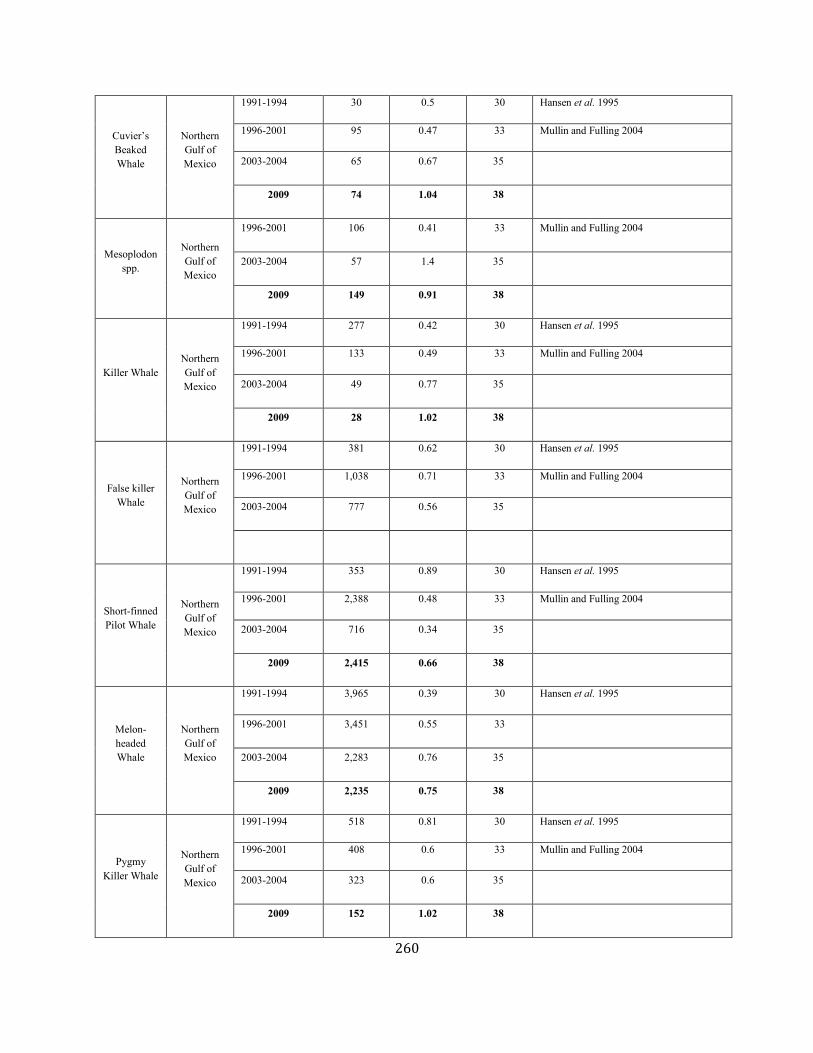
260
Cuvier’s Beaked Whale
Northern Gulf of Mexico
1991-1994 30 0.5 30 Hansen et al. 1995
1996-2001 95 0.47 33 Mullin and Fulling 2004
2003-2004 65 0.67 35
2009 74 1.04 38
Mesoplodon spp.
Northern Gulf of Mexico
1996-2001 106 0.41 33 Mullin and Fulling 2004
2003-2004 57 1.4 35
2009 149 0.91 38
Killer Whale Northern Gulf of Mexico
1991-1994 277 0.42 30 Hansen et al. 1995
1996-2001 133 0.49 33 Mullin and Fulling 2004
2003-2004 49 0.77 35
2009 28 1.02 38
False killer Whale
Northern Gulf of Mexico
1991-1994 381 0.62 30 Hansen et al. 1995
1996-2001 1,038 0.71 33 Mullin and Fulling 2004
2003-2004 777 0.56 35
Short-finned Pilot Whale
Northern Gulf of Mexico
1991-1994 353 0.89 30 Hansen et al. 1995
1996-2001 2,388 0.48 33 Mullin and Fulling 2004
2003-2004 716 0.34 35
2009 2,415 0.66 38
Melon-headed Whale
Northern Gulf of Mexico
1991-1994 3,965 0.39 30 Hansen et al. 1995
1996-2001 3,451 0.55 33
2003-2004 2,283 0.76 35
2009 2,235 0.75 38
Pygmy Killer Whale
Northern Gulf of Mexico
1991-1994 518 0.81 30 Hansen et al. 1995
1996-2001 408 0.6 33 Mullin and Fulling 2004
2003-2004 323 0.6 35
2009 152 1.02 38
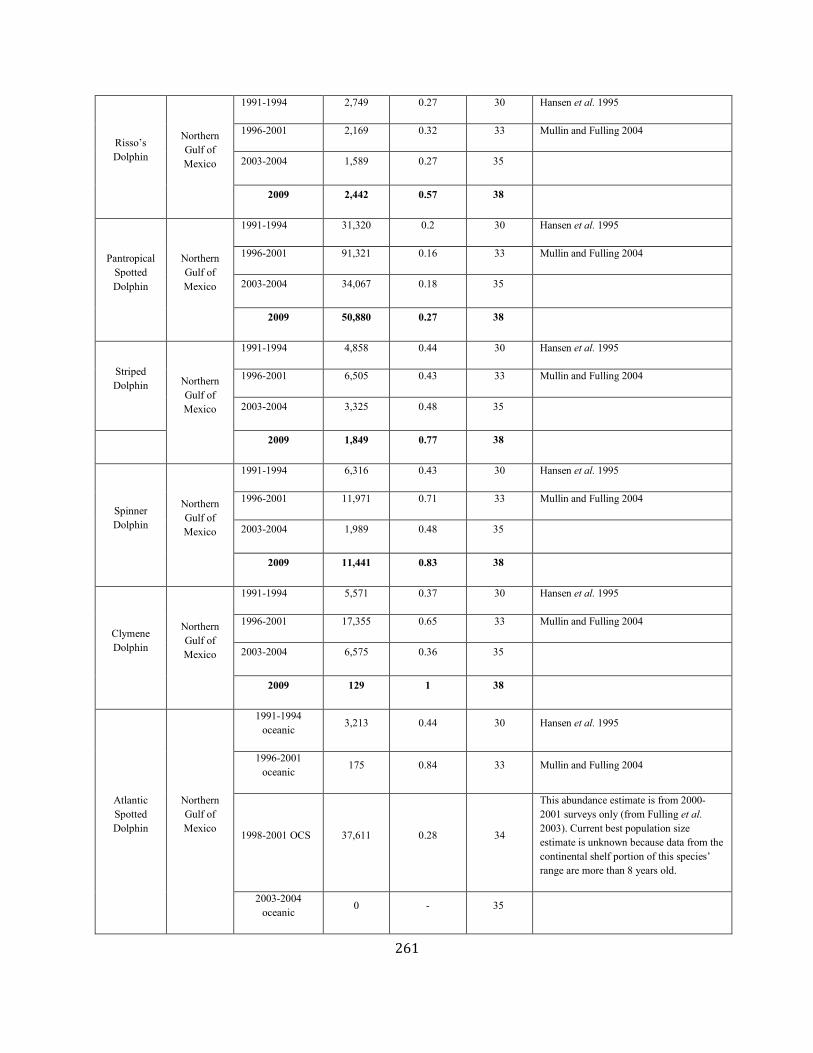
261
Risso’s Dolphin
Northern Gulf of Mexico
1991-1994 2,749 0.27 30 Hansen et al. 1995
1996-2001 2,169 0.32 33 Mullin and Fulling 2004
2003-2004 1,589 0.27 35
2009 2,442 0.57 38
Pantropical Spotted Dolphin
Northern Gulf of Mexico
1991-1994 31,320 0.2 30 Hansen et al. 1995
1996-2001 91,321 0.16 33 Mullin and Fulling 2004
2003-2004 34,067 0.18 35
2009 50,880 0.27 38
Striped Dolphin Northern
Gulf of Mexico
1991-1994 4,858 0.44 30 Hansen et al. 1995
1996-2001 6,505 0.43 33 Mullin and Fulling 2004
2003-2004 3,325 0.48 35
2009 1,849 0.77 38
Spinner Dolphin
Northern Gulf of Mexico
1991-1994 6,316 0.43 30 Hansen et al. 1995
1996-2001 11,971 0.71 33 Mullin and Fulling 2004
2003-2004 1,989 0.48 35
2009 11,441 0.83 38
Clymene Dolphin
Northern Gulf of Mexico
1991-1994 5,571 0.37 30 Hansen et al. 1995
1996-2001 17,355 0.65 33 Mullin and Fulling 2004
2003-2004 6,575 0.36 35
2009 129 1 38
Atlantic Spotted Dolphin
Northern Gulf of Mexico
1991-1994 oceanic 3,213 0.44 30 Hansen et al. 1995
1996-2001 oceanic 175 0.84 33 Mullin and Fulling 2004
1998-2001 OCS 37,611 0.28 34
This abundance estimate is from 2000-2001 surveys only (from Fulling et al. 2003). Current best population size estimate is unknown because data from the continental shelf portion of this species’ range are more than 8 years old.
2003-2004 oceanic 0 - 35

262
2009 2968 0.67 38
Fraser’s Dolphin
Northern Gulf of Mexico
1991-1994 127 0.9 30 Hansen et al. 1995
1996-2001 726 0.7 33
2003-2004 0 - 35
2009 0 - 38 Current best population size estimate is unknown.
Rough-toothed Dolphin
Northern Gulf of Mexico
1991-1994 oceanic 852 0.31 30
1996-2001 oceanic 985 0.44 33 Mullin and Fulling 2004
1998-2001 OCS 1,145 0.83 34
This abundance estimate is from 2000-2001 surveys only (from Fulling et al. 2003). Current best population size estimate is unknown because data from the continental shelf portion of this species’ range are more than 8 years old.
2003-2004 oceanic 1,508 0.39 35
2009 624 0.99 0.05
Bottlenose Dolphin
Northern Gulf of Mexico Oceanic
Mullin and Fulling 2004
1996-2001 2,239 0.41 33
2003-2004 3,708 0.42 35
2009 5,806 0.39 38
Bottlenose Dolphin
Northern Gulf of Mexico Continental Shelf
1998-2001 17,777 0.32 34
This abundance estimate is from 2000-2001 surveys only (from Fulling et al. 2003). Current best population size estimate is unknown because data from the continental shelf are more than 8 years old.
Bottlenose Dolphin
Northern Gulf of Mexico
Coastal (3 stocks)
Eastern 1994 9,912 0.12 32
Eastern 2007 7,702 0.19 39
Northern 1993 4,191 0.21 31
Blaylock and Hoggard 1994; Current best population size estimate for this stock is unknown because data are more than 8 years old.
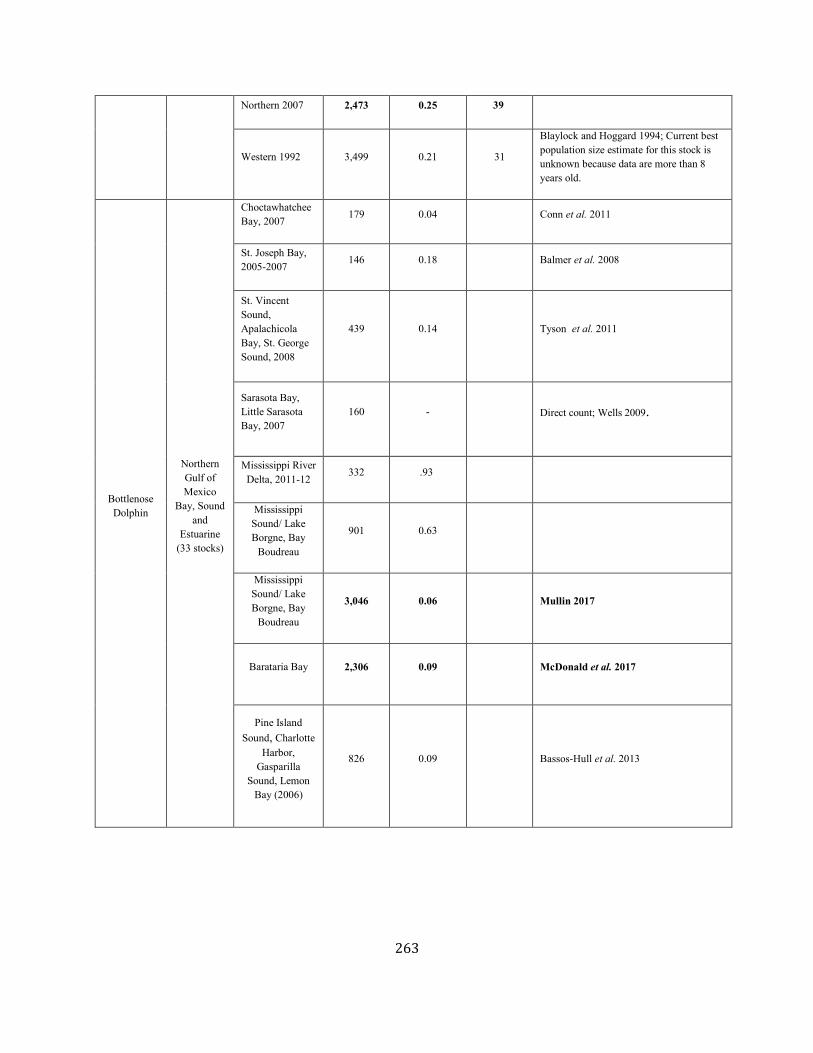
263
Northern 2007 2,473 0.25 39
Western 1992 3,499 0.21 31
Blaylock and Hoggard 1994; Current best population size estimate for this stock is unknown because data are more than 8 years old.
Bottlenose Dolphin
Northern Gulf of Mexico
Bay, Sound and
Estuarine (33 stocks)
Choctawhatchee Bay, 2007 179 0.04 Conn et al. 2011
St. Joseph Bay, 2005-2007 146 0.18 Balmer et al. 2008
St. Vincent Sound, Apalachicola Bay, St. George Sound, 2008
439 0.14 Tyson et al. 2011
Sarasota Bay, Little Sarasota Bay, 2007
160 - Direct count; Wells 2009.
Mississippi River Delta, 2011-12
332 .93
Mississippi Sound/ Lake Borgne, Bay
Boudreau
901 0.63
Mississippi Sound/ Lake Borgne, Bay
Boudreau
3,046 0.06 Mullin 2017
Barataria Bay 2,306 0.09 McDonald et al. 2017
Pine Island Sound, Charlotte
Harbor, Gasparilla
Sound, Lemon Bay (2006)
826 0.09 Bassos-Hull et al. 2013
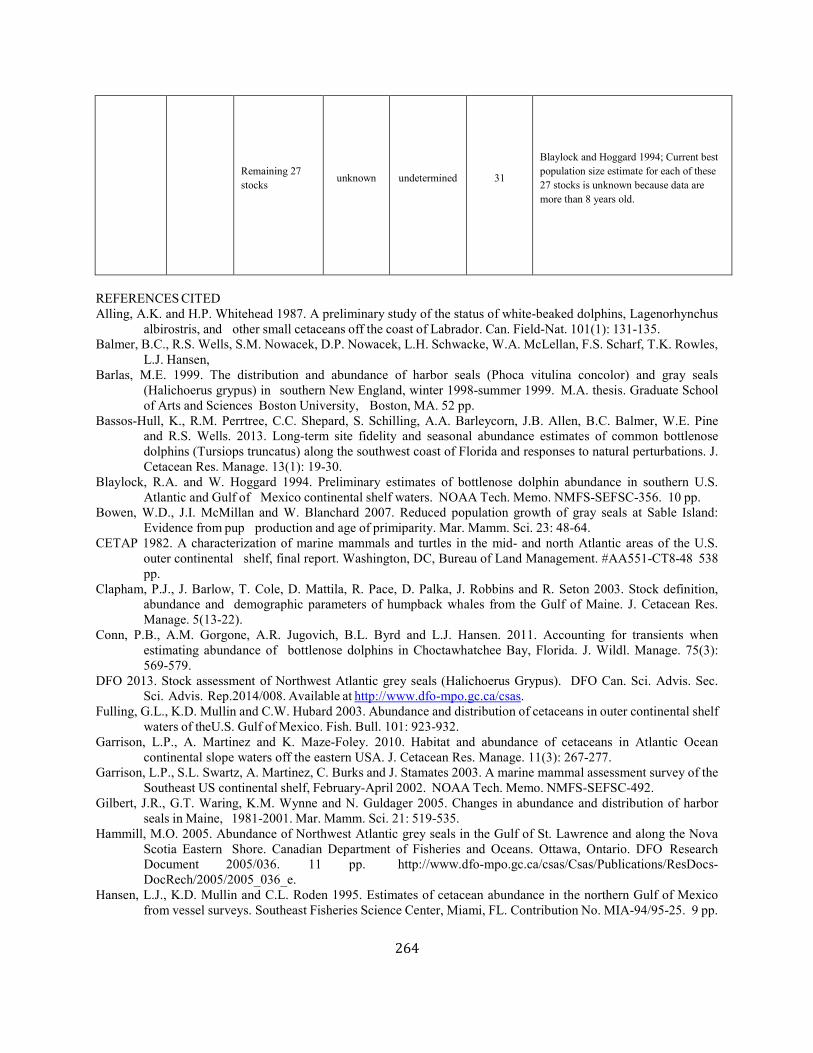
264
Remaining 27 stocks unknown undetermined 31
Blaylock and Hoggard 1994; Current best population size estimate for each of these 27 stocks is unknown because data are more than 8 years old.
REFERENCES CITED Alling, A.K. and H.P. Whitehead 1987. A preliminary study of the status of white-beaked dolphins, Lagenorhynchus
albirostris, and other small cetaceans off the coast of Labrador. Can. Field-Nat. 101(1): 131-135. Balmer, B.C., R.S. Wells, S.M. Nowacek, D.P. Nowacek, L.H. Schwacke, W.A. McLellan, F.S. Scharf, T.K. Rowles,
L.J. Hansen, Barlas, M.E. 1999. The distribution and abundance of harbor seals (Phoca vitulina concolor) and gray seals
(Halichoerus grypus) in southern New England, winter 1998-summer 1999. M.A. thesis. Graduate School of Arts and Sciences Boston University, Boston, MA. 52 pp.
Bassos-Hull, K., R.M. Perrtree, C.C. Shepard, S. Schilling, A.A. Barleycorn, J.B. Allen, B.C. Balmer, W.E. Pine and R.S. Wells. 2013. Long-term site fidelity and seasonal abundance estimates of common bottlenose dolphins (Tursiops truncatus) along the southwest coast of Florida and responses to natural perturbations. J. Cetacean Res. Manage. 13(1): 19-30.
Blaylock, R.A. and W. Hoggard 1994. Preliminary estimates of bottlenose dolphin abundance in southern U.S. Atlantic and Gulf of Mexico continental shelf waters. NOAA Tech. Memo. NMFS-SEFSC-356. 10 pp.
Bowen, W.D., J.I. McMillan and W. Blanchard 2007. Reduced population growth of gray seals at Sable Island: Evidence from pup production and age of primiparity. Mar. Mamm. Sci. 23: 48-64.
CETAP 1982. A characterization of marine mammals and turtles in the mid- and north Atlantic areas of the U.S. outer continental shelf, final report. Washington, DC, Bureau of Land Management. #AA551-CT8-48 538 pp.
Clapham, P.J., J. Barlow, T. Cole, D. Mattila, R. Pace, D. Palka, J. Robbins and R. Seton 2003. Stock definition, abundance and demographic parameters of humpback whales from the Gulf of Maine. J. Cetacean Res. Manage. 5(13-22).
Conn, P.B., A.M. Gorgone, A.R. Jugovich, B.L. Byrd and L.J. Hansen. 2011. Accounting for transients when estimating abundance of bottlenose dolphins in Choctawhatchee Bay, Florida. J. Wildl. Manage. 75(3): 569-579.
DFO 2013. Stock assessment of Northwest Atlantic grey seals (Halichoerus Grypus). DFO Can. Sci. Advis. Sec. Sci. Advis. Rep.2014/008. Available at http://www.dfo-mpo.gc.ca/csas.
Fulling, G.L., K.D. Mullin and C.W. Hubard 2003. Abundance and distribution of cetaceans in outer continental shelf waters of theU.S. Gulf of Mexico. Fish. Bull. 101: 923-932.
Garrison, L.P., A. Martinez and K. Maze-Foley. 2010. Habitat and abundance of cetaceans in Atlantic Ocean continental slope waters off the eastern USA. J. Cetacean Res. Manage. 11(3): 267-277.
Garrison, L.P., S.L. Swartz, A. Martinez, C. Burks and J. Stamates 2003. A marine mammal assessment survey of the Southeast US continental shelf, February-April 2002. NOAA Tech. Memo. NMFS-SEFSC-492.
Gilbert, J.R., G.T. Waring, K.M. Wynne and N. Guldager 2005. Changes in abundance and distribution of harbor seals in Maine, 1981-2001. Mar. Mamm. Sci. 21: 519-535.
Hammill, M.O. 2005. Abundance of Northwest Atlantic grey seals in the Gulf of St. Lawrence and along the Nova Scotia Eastern Shore. Canadian Department of Fisheries and Oceans. Ottawa, Ontario. DFO Research Document 2005/036. 11 pp. http://www.dfo-mpo.gc.ca/csas/Csas/Publications/ResDocs-DocRech/2005/2005_036_e.
Hansen, L.J., K.D. Mullin and C.L. Roden 1995. Estimates of cetacean abundance in the northern Gulf of Mexico from vessel surveys. Southeast Fisheries Science Center, Miami, FL. Contribution No. MIA-94/95-25. 9 pp.

265
Kingsley, M.C.S. and R.R. Reeves 1998. Aerial surveys of cetaceans in the Gulf of St. Lawrence in 1995 and 1996. Can. J. Zool. 76: 1529-1550.
Lawson, J.W. and J.-F. Gosselin 2009. Distribution and preliminary abundance estimates for cetaceans seen during Canada’s Marine Megafauna Survey - A component of the 2007 TNASS. Can. Sci. Advisory Sec. Res. Doc. 2009/031. 33 pp.
Lawson, J.W. and J.-F. Gosselin 2011. Fully-corrected cetacean abundance estimates from the Canadian TNASS survey.Working Paper 10. National Marine Mammal Peer Review Meeting. Ottawa, Can. 28 pp.
McDonald, T.L., F.E. Hornsby, T.R. Speakman, E.S. Zolman, K.D. Mullin, C. Sinclair, P.E. Rosel, L. Thomas and L.H. Schwacke. 2017. Survival, density, and abundance of common bottlenose dolphins in Barataria Bay following the Deepwater Horizon oil spill. Endanger. Spec. Res. 33:193–209.
Mercer, M.C. 1975. Modified Leslie-DeLury population models of the long-finned pilot whale (Globicephala melaena) and annual production of the short-finned squid (Illex illecebrosus) based upon their interactions at Newfoundland. J. Fish. Res. Board Can 32(7): 1145-1154.
Miller, C. 2003. Abundance trends and environmental habitat usage patterns of bottlenose dolphins (Tursiops truncatus) in lower Barataria and Caminada Bays, Louisiana. Ph.D. thesis. Louisiana State University, Baton Rouge. 125 pp.
Mitchell, E. 1974. Present status of northwest Atlantic fin and other whale stocks. Pages 108-169 in: W. E. Schevill, (ed.) The whale problem: A status report. Harvard University Press, Cambridge, MA.
Mitchell, E. and D.G. Chapman 1977. Preliminary assessment of stocks of northwest Atlantic sei whales (Balaenoptera borealis). Rep. Int. Whal. Comm. (Special Issue) 1: 117-120.
Mullin, K.D. 2007. Abundance of cetaceans in the oceanic Gulf of Mexico based on 2003-2004 ship surveys. Available from: NMFS, Southeast Fisheries Science Center, P.O. Drawer 1207, Pascagoula, MS 39568, 26 pp.
Mullin, K.D. 2017. Abundance of the Mississippi Sound, Lake Borgne, Bay Boudreau common bottlenose dolphin stock: July 2010 - May 2012. Southeast Fisheries Science Center, Protected Resources and Biodiversity Division, 75 Virginia Beach Dr., Miami, FL 33140. PRBD Contribution # PRBD-2017-05, 11 pp.
Mullin, K.D. and G.L. Fulling 2003. Abundance of cetaceans in the southern U.S. North Atlantic Ocean during summer 1998. Fish. Bull. 101: 603-613.
Mullin, K.D. and G.L. Fulling 2004. Abundance of cetaceans in the oceanic northern Gulf of Mexico. Mar. Mamm. Sci. 20(4): 787- 807.
NMFS 1990. Cruise results, NOAA Ship CHAPMAN, Cruise No. 90-05. Marine Mammal Sighting Survey. National Marine Fisheries Service. Available from: National Marine Fisheries Service, 166 Water Street, Woods Hole, MA 02543-1026. 5 pp.
NMFS 1991. Northeast cetacean aerial survey and inter-platform study. National Marine Fisheries Service. NOAA-NMFS-SEFSC and NEFSC. 4 pp.
NMFS 1993. Cruise results, NOAA ship DELAWARE II, Cruise No. DEL 93-06, Marine Mammal Survey. National Marine Fisheries Service. NOAA NMFS NEFSC, Woods Hole Laboratory, Woods Hole, MA, 5 pp.
NMFS 1994. Cruise results, NOAA ship RELENTLESS, Cruise No. RS 9402, Marine Mammal Survey/Warm Core Ring Study. National Marine Fisheries Service. Available from: National Marine Fisheries Service, 166 Water Street, Woods Hole, MA 02543-102. 8 pp.
Palka, D.L. 1995. Abundance estimate of Gulf of Maine harbor porpoise. Rep. Int. Whal. Comm. (Special Issue) 16: 27-50.
Palka, D.L. 1996. Update on abundance of Gulf of Maine/Bay of Fundy harbor porpoises. Northeast Fish. Sci. Cent. Ref. Doc. 96-04. 35 pp. http://www.nefsc.noaa.gov/nefsc/publications/crd/crd9604.pdf.
Palka, D.L. 2006. Summer abundance estimates of cetaceans in US North Atlantic Navy Operating Areas. Northeast Fish. Sci. Cent. Ref. Doc. 06-03. 41 pp. http://www.nefsc.noaa.gov/nefsc/publications/crd/crd0603/crd0603.pdf.
Palka, D.L. 2012. Cetacean abundance estimates in US northwestern Atlantic Ocean waters from summer 2011 line transect survey. Northeast Fish. Sci. Cent. Ref. Doc. 12-29. 37 pp. http://www.nefsc.noaa.gov/nefsc/publications/crd/crd1229/.
Scott, G.P., D.M. Burn, L.J. Hansen and R.E. Owen 1989. Estimates of bottlenose dolphin abundance in the Gulf of Mexico from regional aerial surveys. CRD 88/89-07. Available from: NMFS, Southeast Fisheries Science Center, 75 Virginia Beach Dr., Miami, FL 33149.
Smith, T., D. Palka and K. Bisack 1993. Biological significance of by-catch of harbor porpoise in the Gulf of Maine Demersal Gillnet Fishery. Northeast Fish. Sci. Cent. Ref. Doc. 93-23. 15 pp.

266
Spradlin T.R. and D.A. Pabst 2008. Seasonal abundance and distribution patterns of common bottlenose dolphins (Tursiops truncatus) near St. Joseph Bay, Florida, USA. J. Cetacean Res. Manage. 10(2): 157-167.
Tyson, R.B., S.M. Nowacek and D.P. Nowacek. 2011. Community structure and abundance of bottlenose dolphins Tursiops truncatus in coastal waters of the northeast Gulf of Mexico. Mar. Ecol. Prog. Ser. 438: 253-265.
Waring, G.T. 1998. Results of the summer 1991 R/V Chapman marine mammal sighting survey. Northeast Fish. Sci. Cent. Ref. Doc. 98-09. 21 pp.
Waring, G.T., C.P. Fairfield, C.M. Ruhsam and M. Sano 1992. Cetaceans associated with Gulf Stream Features off the Northeastern USA Shelf. ICES [Int. Counc. Explor. Sea] C.M. 1992/N:12.
Waring, G.T., R.A. DiGiovanni Jr, E. Josephson, S. Wood, and J.R. Gilbert. 2015. 2012 population estimate for the harbor seal (Phoca vitulina concolor) in New England waters. NOAA Tech. Memo. NMFS NE-235. 15 pp.
Wells, R.S. 2009. Learning from nature: Bottlenose dolphin care and husbandry. Zoo Biol. 28: 1-17.
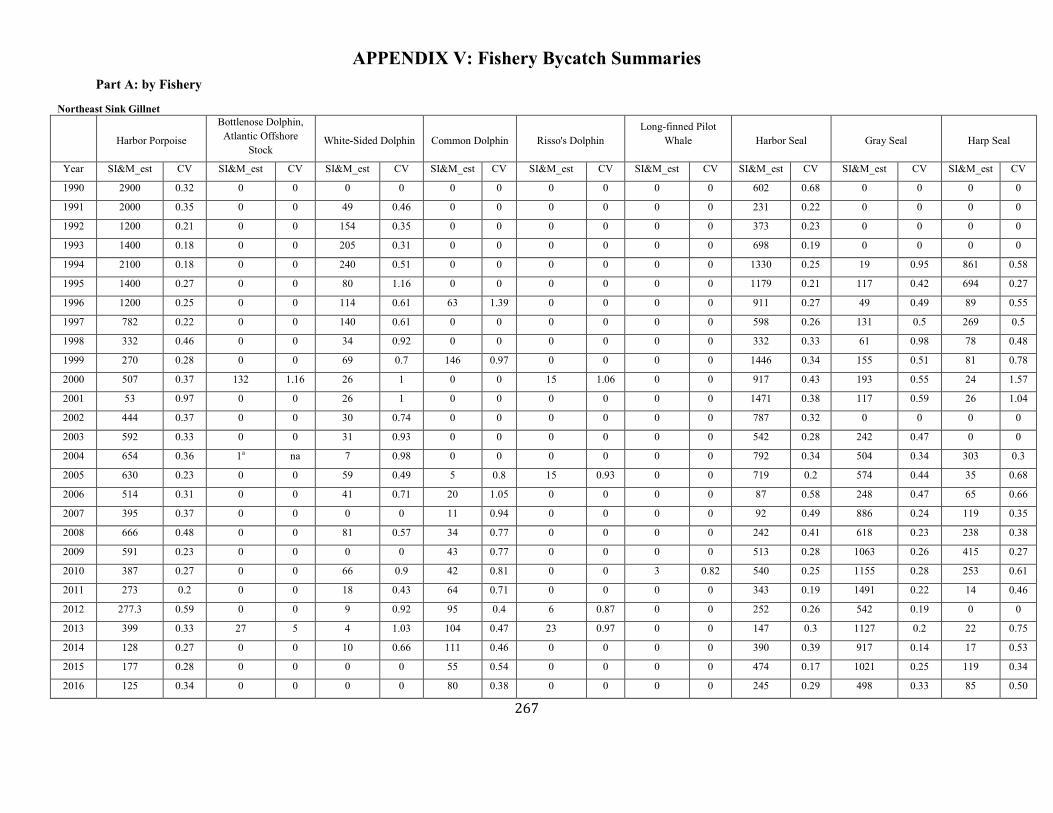
267
APPENDIX V: Fishery Bycatch Summaries Part A: by Fishery
Northeast Sink Gillnet
Harbor Porpoise
Bottlenose Dolphin, Atlantic Offshore
Stock White-Sided Dolphin Common Dolphin Risso's Dolphin
Long-finned Pilot Whale Harbor Seal Gray Seal Harp Seal
Year SI&M_est CV SI&M_est CV SI&M_est CV SI&M_est CV SI&M_est CV SI&M_est CV SI&M_est CV SI&M_est CV SI&M_est CV
1990 2900 0.32 0 0 0 0 0 0 0 0 0 0 602 0.68 0 0 0 0
1991 2000 0.35 0 0 49 0.46 0 0 0 0 0 0 231 0.22 0 0 0 0
1992 1200 0.21 0 0 154 0.35 0 0 0 0 0 0 373 0.23 0 0 0 0
1993 1400 0.18 0 0 205 0.31 0 0 0 0 0 0 698 0.19 0 0 0 0
1994 2100 0.18 0 0 240 0.51 0 0 0 0 0 0 1330 0.25 19 0.95 861 0.58
1995 1400 0.27 0 0 80 1.16 0 0 0 0 0 0 1179 0.21 117 0.42 694 0.27
1996 1200 0.25 0 0 114 0.61 63 1.39 0 0 0 0 911 0.27 49 0.49 89 0.55
1997 782 0.22 0 0 140 0.61 0 0 0 0 0 0 598 0.26 131 0.5 269 0.5
1998 332 0.46 0 0 34 0.92 0 0 0 0 0 0 332 0.33 61 0.98 78 0.48
1999 270 0.28 0 0 69 0.7 146 0.97 0 0 0 0 1446 0.34 155 0.51 81 0.78
2000 507 0.37 132 1.16 26 1 0 0 15 1.06 0 0 917 0.43 193 0.55 24 1.57
2001 53 0.97 0 0 26 1 0 0 0 0 0 0 1471 0.38 117 0.59 26 1.04
2002 444 0.37 0 0 30 0.74 0 0 0 0 0 0 787 0.32 0 0 0 0
2003 592 0.33 0 0 31 0.93 0 0 0 0 0 0 542 0.28 242 0.47 0 0
2004 654 0.36 1a na 7 0.98 0 0 0 0 0 0 792 0.34 504 0.34 303 0.3
2005 630 0.23 0 0 59 0.49 5 0.8 15 0.93 0 0 719 0.2 574 0.44 35 0.68
2006 514 0.31 0 0 41 0.71 20 1.05 0 0 0 0 87 0.58 248 0.47 65 0.66
2007 395 0.37 0 0 0 0 11 0.94 0 0 0 0 92 0.49 886 0.24 119 0.35
2008 666 0.48 0 0 81 0.57 34 0.77 0 0 0 0 242 0.41 618 0.23 238 0.38
2009 591 0.23 0 0 0 0 43 0.77 0 0 0 0 513 0.28 1063 0.26 415 0.27
2010 387 0.27 0 0 66 0.9 42 0.81 0 0 3 0.82 540 0.25 1155 0.28 253 0.61
2011 273 0.2 0 0 18 0.43 64 0.71 0 0 0 0 343 0.19 1491 0.22 14 0.46
2012 277.3 0.59 0 0 9 0.92 95 0.4 6 0.87 0 0 252 0.26 542 0.19 0 0
2013 399 0.33 27 5 4 1.03 104 0.47 23 0.97 0 0 147 0.3 1127 0.2 22 0.75
2014 128 0.27 0 0 10 0.66 111 0.46 0 0 0 0 390 0.39 917 0.14 17 0.53
2015 177 0.28 0 0 0 0 55 0.54 0 0 0 0 474 0.17 1021 0.25 119 0.34
2016 125 0.34 0 0 0 0 80 0.38 0 0 0 0 245 0.29 498 0.33 85 0.50

268
Note: this table only includes observed bycatch. For a complete list of marine mamal species interactions with this fishery please see https://www.fisheries.noaa.gov/national/marine-mammal-protection/northeast-sink-gillnet-fishery-mmpa-list-fisheries.
a Unextrapolated mortalities
b Due to uncertainty in stock identification both minimum and maximum estimates are provide with associated CV's. As a result of uncertainty in stock identification, minimum and maximum mortality estimates are not additive across the Atlantic coastal and estuarine bottlenose dolphin stocks.
na=not applicable; unk= observer coverage was absent or too low to detect bycatch, or no estimate generated; tbd= to be determined
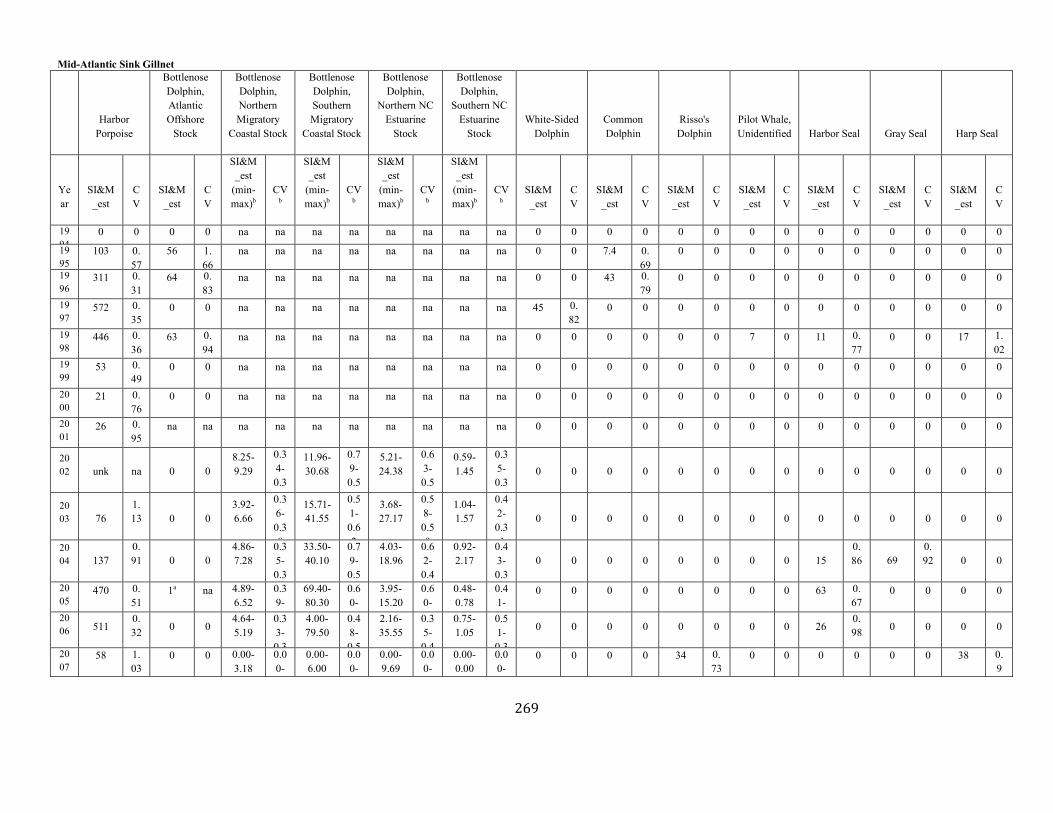
269
Mid-Atlantic Sink Gillnet
Harbor
Porpoise
Bottlenose Dolphin, Atlantic Offshore
Stock
Bottlenose Dolphin, Northern Migratory
Coastal Stock
Bottlenose Dolphin, Southern Migratory
Coastal Stock
Bottlenose Dolphin,
Northern NC Estuarine
Stock
Bottlenose Dolphin,
Southern NC Estuarine
Stock White-Sided
Dolphin Common Dolphin
Risso's Dolphin
Pilot Whale, Unidentified Harbor Seal Gray Seal Harp Seal
Year
SI&M_est
CV
SI&M_est
CV
SI&M_est
(min-max)b
CVb
SI&M_est
(min-max)b
CVb
SI&M_est
(min-max)b
CVb
SI&M_est
(min-max)b
CVb
SI&M_est
CV
SI&M_est
CV
SI&M_est
CV
SI&M_est
CV
SI&M_est
CV
SI&M_est
CV
SI&M_est
CV
1994
0 0 0 0 na na na na na na na na 0 0 0 0 0 0 0 0 0 0 0 0 0 0
1995
103 0.57
56 1.66
na na na na na na na na 0 0 7.4 0.69
0 0 0 0 0 0 0 0 0 0
1996
311 0.31
64 0.83
na na na na na na na na 0 0 43 0.79
0 0 0 0 0 0 0 0 0 0
1997
572 0.35
0 0 na na na na na na na na 45 0.82
0 0 0 0 0 0 0 0 0 0 0 0
1998
446 0.36
63 0.94
na na na na na na na na 0 0 0 0 0 0 7 0 11 0.77
0 0 17 1.02
1999
53 0.49
0 0 na na na na na na na na 0 0 0 0 0 0 0 0 0 0 0 0 0 0
2000
21 0.76
0 0 na na na na na na na na 0 0 0 0 0 0 0 0 0 0 0 0 0 0
2001
26 0.95
na na na na na na na na na na 0 0 0 0 0 0 0 0 0 0 0 0 0 0
2002 unk na 0 0
8.25-9.29
0.34-0.3
11.96-30.68
0.79-0.5
5.21-24.38
0.63-0.5
0.59-1.45
0.35-0.3
0 0 0 0 0 0 0 0 0 0 0 0 0 0
2003 76
1.13 0 0
3.92-6.66
0.36-0.30
15.71-41.55
0.51-0.62
3.68-27.17
0.58-0.59
1.04-1.57
0.42-0.34
0 0 0 0 0 0 0 0 0 0 0 0 0 0
2004 137
0.91 0 0
4.86-7.28
0.35-0.3
33.50-40.10
0.79-0.5
4.03-18.96
0.62-0.4
0.92-2.17
0.43-0.3
0 0 0 0 0 0 0 0 15 0.86 69
0.92 0 0
2005
470 0.51
1a na 4.89-6.52
0.39-
69.40-80.30
0.60-
3.95-15.20
0.60-
0.48-0.78
0.41-
0 0 0 0 0 0 0 0 63 0.67
0 0 0 0
2006 511
0.32 0 0
4.64-5.19
0.33-0 3
4.00-79.50
0.48-0 5
2.16-35.55
0.35-0 4
0.75-1.05
0.51-0 3
0 0 0 0 0 0 0 0 26 0.98 0 0 0 0
2007
58 1.03
0 0 0.00-3.18
0.00-
0.00-6.00
0.00-
0.00-9.69
0.00-
0.00-0.00
0.00-
0 0 0 0 34 0.73
0 0 0 0 0 0 38 0.9
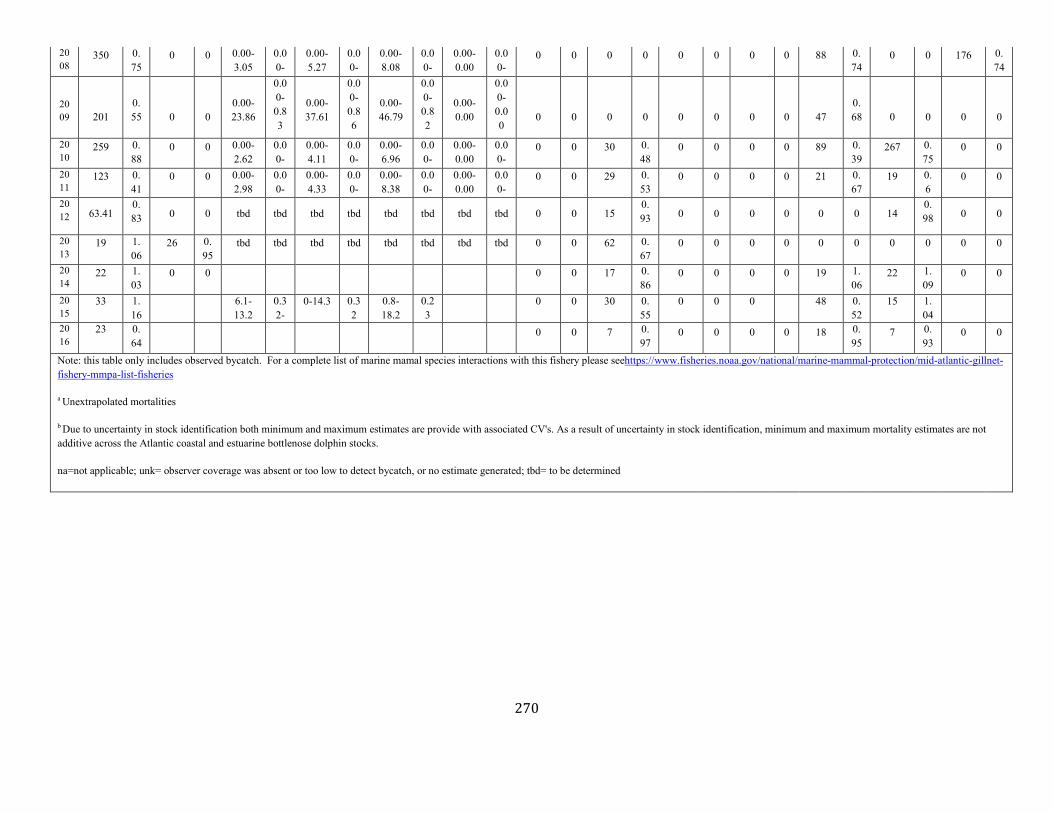
270
2008
350 0.75
0 0 0.00-3.05
0.00-
0.00-5.27
0.00-
0.00-8.08
0.00-
0.00-0.00
0.00-
0 0 0 0 0 0 0 0 88 0.74
0 0 176 0.74
2009 201
0.55 0 0
0.00-23.86
0.00-0.83
0.00-37.61
0.00-0.86
0.00-46.79
0.00-0.82
0.00-0.00
0.00-0.00
0 0 0 0 0 0 0 0 47 0.68 0 0 0 0
2010
259 0.88
0 0 0.00-2.62
0.00-
0.00-4.11
0.00-
0.00-6.96
0.00-
0.00-0.00
0.00-
0 0 30 0.48
0 0 0 0 89 0.39
267 0.75
0 0
2011
123 0.41
0 0 0.00-2.98
0.00-
0.00-4.33
0.00-
0.00-8.38
0.00-
0.00-0.00
0.00-
0 0 29 0.53
0 0 0 0 21 0.67
19 0.6
0 0
2012 63.41
0.83 0 0 tbd tbd tbd tbd tbd tbd tbd tbd 0 0 15
0.93 0 0 0 0 0 0 14
0.98 0 0
2013
19 1.06
26 0.95
tbd tbd tbd tbd tbd tbd tbd tbd 0 0 62 0.67
0 0 0 0 0 0 0 0 0 0
2014
22 1.03
0 0 0 0 17 0.86
0 0 0 0 19 1.06
22 1.09
0 0
2015
33 1.16
6.1-13.2
0.32-
0-14.3 0.32
0.8-18.2
0.23
0 0 30 0.55
0 0 0 48 0.52
15 1.04
2016
23 0.64
0 0 7 0.97
0 0 0 0 18 0.95
7 0.93
0 0
Note: this table only includes observed bycatch. For a complete list of marine mamal species interactions with this fishery please seehttps://www.fisheries.noaa.gov/national/marine-mammal-protection/mid-atlantic-gillnet-fishery-mmpa-list-fisheries
a Unextrapolated mortalities
b Due to uncertainty in stock identification both minimum and maximum estimates are provide with associated CV's. As a result of uncertainty in stock identification, minimum and maximum mortality estimates are not additive across the Atlantic coastal and estuarine bottlenose dolphin stocks.
na=not applicable; unk= observer coverage was absent or too low to detect bycatch, or no estimate generated; tbd= to be determined

271
New England/North Atlantic Bottom Trawl
Harbor
Porpoise
Bottlenose Dolphin, Atlantic Offshore Stock
White-Sided Dolphin
Common Dolphin
Risso's Dolphin-Atlantic
Pilot Whale, Unidentified
Long-finned Pilot Whale Harbor Seal Gray Seal Harp Seal Minke whale
Year SI&M_est CV
SI&M_est CV
SI&M_est CV
SI&M_est CV
SI&M_es
t CV SI&M_est CV
SI&M_est CV
SI&M_est CV
SI&M_est CV
SI&M_est CV
SI&M_est CV
1990 0 0 0 0 0 0 0 0 0 0 0 0 0 0 0 0 0 0 0 0 0 0
1991 0 0 91 0.97 0 0 0 0 0 0 0 0 0 0 0 0 0 0 0 0 0 0
1992 0 0 0 0 110 0.97 0 0 0 0 0 0 0 0 0 0 0 0 0 0 0 0
1993 0 0 0 0 0 0 0 0 0 0 0 0 0 0 0 0 0 0 0 0 0 0
1994 0 0 0 0 182 0.71 0 0 0 0 0 0 0 0 0 0 0 0 0 0 0 0
1995 0 0 0 0 0 0 142 0.77 0 0 0 0 0 0 0 0 0 0 0 0 0 0
1996 0 0 0 0 0 0 0 0 0 0 0 0 0 0 0 0 0 0 0 0 0 0
1997 0 0 0 0 0 0 93 1.06 0 0 0 0 0 0 0 0 0 0 0 0 0 0
1998 0 0 0 0 0 0 0 0 0 0 0 0 0 0 0 0 0 0 0 0 0 0
1999 0 0 0 0 0 0 0 0 0 0 0 0 0 0 0 0 0 0 0 0 0 0
2000 0 0 0 0 137 0.34 27 0.29 0 0 0 0 0 0 0 0 0 0 0 0 0 0
2001 0 0 0 0 161 0.34 30 0.3 0 0 21 0.27 0 0 0 0 0 0 49 1.1 0 0
2002 0 0 0 0 70 0.32 26 0.29 0 0 22 0.26 0 0 0 0 0 0 0 0 0 0
2003 * * 0 0 216 0.27 26 0.29 0 0 20 0.26 0 0 0 0 0 0 0 0 0 0
2004 0 0 0 0 200 0.3 26 0.29 0 0 15 0.29 0 0 0 0 0 0 0 0 0 0
2005 7.2 0.48 0 0 213 0.28 32 0.28 0 0 15 0.3 0 0 0 0 unk unk unk unk 0 0
2006 6.5 0.49 0 0 40 0.5 25 0.28 0 0 14 0.28 0 0 0 0 0 0 0 0 0 0
2007 5.6 0.46 48 0.95 29 0.66 24 0.28 3 0.52 0 0 0 0 0 0 unk unk 0 0 0 0
2008 5.6 0.97 19 0.88 13 0.57 6 0.99 2 0.56 0 0 21 0.51
0 0 16 0.52 0 0 7.8 0.69
2009 0 0 18 0.92 171 0.28 24 0.6 3 0.53 0 0 13 0.7 0 0 22 0.46 5 1.02 0 0
2010 0 0 4 0.53 37 0.32 114 0.32 2 0.55 0 0 30 0.43
0 0 30 0.34 0 0 0 0
2011 5.9 0.71 10 0.84 141 0.24 72 0.37 3 0.55 0 0 55 0.18
9 0.58 58 0.25 3 1.02 0 0
2012 0 0 0 0 27 0.47 40 0.54 0 0 0 0 33 0.32
3 1 37 0.49 0 0 0 0
2013 7 0.98 0 0 33 0.31 17 0.54 0 0 0 0 16 0.42
4 0.89 20 0.37 0 0 0 0
2014 5.5 0.86 0 0 16 0.5 17 0.53 4.2 0.91 0 0 25 0.44
11 0.63 19 0.45 0 0
2015 0 0 15 0.52 22 0.45 0 0 0 0 0 0 23 0.46 0 0 0 0

272
2016 0 0 33.5 0.89 27.7 0.46 15.9 0.46 16.7 0.88 0 0 29 0.58
0 0 0 0 0 0 0 0
Note: this table only includes observed bycatch. For a complete list of marine mamal species interactions with this fishery please see https://www.fisheries.noaa.gov/national/marine-mammal-protection/northeast-bottom-trawl-fishery-mmpa-list-fisheriesa Unextrapolated mortalities
b Due to uncertainty in stock identification both minimum and maximum estimates are provide with associated CV's. As a result of uncertainty in stock identification, minimum and maximum mortality estimates are not additive across the Atlantic coastal and estuarine bottlenose dolphin stocks.
na=not applicable; unk= observer coverage was absent or too low to detect bycatch, or no estimate generated; tbd= to be determined

273
Mid-Atlantic Bottom Trawl
Harbor Porpoise
Bottlenose Dolphin, Atlantic Offshore
Stock White-Sided
Dolphin Common Dolphin Risso's Dolphin-
Atlantic Pilot Whale, Unidentified
Long-finned Pilot Whale Harbor Seal Gray Seal
Year SI&M_est CV SI&M_est CV SI&M_est CV
SI&M_est CV
SI&M_est CV SI&M_est CV SI&M_est
CV SI&M_est CV
SI&M_est CV
1997 0 0 0 0 161 1.58 0 0 0 0 0 0 0 0 0 0 0 0
1998 0 0 0 0 0 0 0 0 0 0 0 0 0 0 0 0 0 0
1999 0 0 0 0 0 0 0 0 0 0 228 1.03
0 0 0 0 0 0
2000 0 0 0 0 27 0.17 0 0 0 0 0 0 0 0 0 0 0 0
2001 0 0 0 0 27 0.19 103 0.27 0 0 39 0.3 0 0 0 0 0 0
2002 0 0 0 0 25 0.17 87 0.27 0 0 38 0.36
0 0 0 0 0 0
2003 0 0 0 0 31 0.25 99 0.28 0 0 31 0.31
0 0 0 0 0 0
2004 0 0 0 0 26 0.2 159 0.3 0 0 35 0.33
0 0 0 0 0 0
2005 0 0 0 0 38 0.29 141 0.29 0 0 31 0.31
0 0 0 0 0 0
2006 0 0 0 0 3 0.53 131 0.28 0 0 37 0.34
0 0 0 0 0 0
2007 0 0 11 0.42 2 1.03 66 0.27 33 0.34 0 0 0 0 0 0 0 0
2008 0 0 16 0.36 0 0 23 1 39 0.69 0 0 0 0 0 0 0 0
2009 0 0 21 0.45 0 0 167 0.46 23 0.5 0 0 0 0 24 0.92 38 0.7
2010 0 0 20 0.34 0 0 21 0.96 54 0.74 0 0 0 0 11 1.1 0 0
2011 0 0 34 0.31 0 0 271 0.25 62 0.56 0 0 0 0 0 0 25 0.57
2012 0 0 16 1.00 0 0 323 0.26 8 1 0 0 0 0 23 1 30 1.1
2013 0 0 0 0 0 0 269 0.29 46 0.71 0 0 0 0 11 0.96 29 0.67
2014 0 0 25 0.66 9.7 0.94 329 0.29 21 0.93 0 0 0 0 10 0.95 7 0.96
2015 0 0 0 0 0 0 250 0.32 40 0.63 0 0 0 0 7.4 1.0 0 0
2016 0 0 7.3 0.93 0 0 177 0.33 39 0.56 0 0 0 0 0 26 0.57
Note: this table only includes observed bycatch. For a complete list of marine mamal species interactions with this fishery please see https://www.fisheries.noaa.gov/national/marine-mammal-protection/mid-atlantic-bottom-trawl-fishery-mmpa-list-fisheries
a Unextrapolated mortalities
b Due to uncertainty in stock identification both minimum and maximum estimates are provide with associated CV's. As a result of uncertainty in stock identification, minimum and maximum mortality estimates are not additive across the Atlantic coastal and estuarine bottlenose dolphin stocks.
na=not applicable; unk= observer coverage was absent or too low to detect bycatch, or no estimate generated; tbd= to be determined
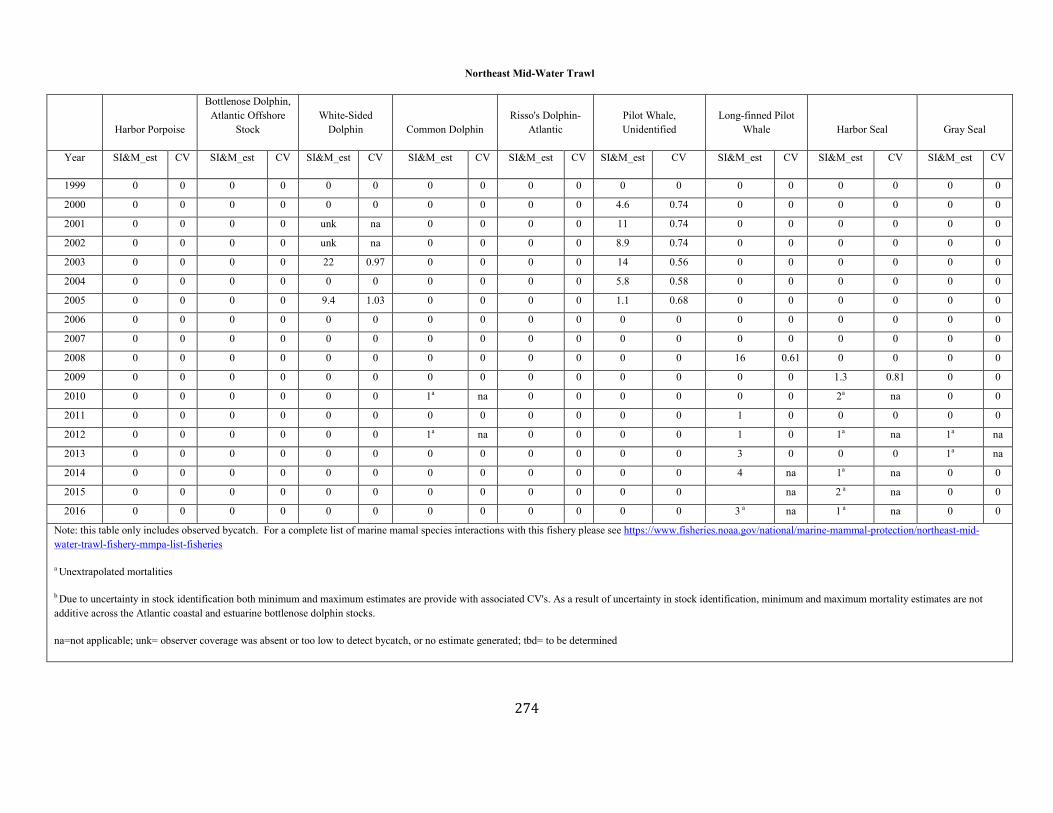
274
Northeast Mid-Water Trawl
Harbor Porpoise
Bottlenose Dolphin, Atlantic Offshore
Stock White-Sided
Dolphin Common Dolphin Risso's Dolphin-
Atlantic Pilot Whale, Unidentified
Long-finned Pilot Whale Harbor Seal Gray Seal
Year SI&M_est CV SI&M_est CV SI&M_est CV SI&M_est CV SI&M_est CV SI&M_est CV SI&M_est CV SI&M_est CV SI&M_est CV
1999 0 0 0 0 0 0 0 0 0 0 0 0 0 0 0 0 0 0
2000 0 0 0 0 0 0 0 0 0 0 4.6 0.74 0 0 0 0 0 0
2001 0 0 0 0 unk na 0 0 0 0 11 0.74 0 0 0 0 0 0
2002 0 0 0 0 unk na 0 0 0 0 8.9 0.74 0 0 0 0 0 0
2003 0 0 0 0 22 0.97 0 0 0 0 14 0.56 0 0 0 0 0 0
2004 0 0 0 0 0 0 0 0 0 0 5.8 0.58 0 0 0 0 0 0
2005 0 0 0 0 9.4 1.03 0 0 0 0 1.1 0.68 0 0 0 0 0 0
2006 0 0 0 0 0 0 0 0 0 0 0 0 0 0 0 0 0 0
2007 0 0 0 0 0 0 0 0 0 0 0 0 0 0 0 0 0 0
2008 0 0 0 0 0 0 0 0 0 0 0 0 16 0.61 0 0 0 0
2009 0 0 0 0 0 0 0 0 0 0 0 0 0 0 1.3 0.81 0 0
2010 0 0 0 0 0 0 1a na 0 0 0 0 0 0 2a na 0 0
2011 0 0 0 0 0 0 0 0 0 0 0 0 1 0 0 0 0 0
2012 0 0 0 0 0 0 1a na 0 0 0 0 1 0 1a na 1a na
2013 0 0 0 0 0 0 0 0 0 0 0 0 3 0 0 0 1a na
2014 0 0 0 0 0 0 0 0 0 0 0 0 4 na 1a na 0 0
2015 0 0 0 0 0 0 0 0 0 0 0 0 na 2 a na 0 0
2016 0 0 0 0 0 0 0 0 0 0 0 0 3 a na 1 a na 0 0
Note: this table only includes observed bycatch. For a complete list of marine mamal species interactions with this fishery please see https://www.fisheries.noaa.gov/national/marine-mammal-protection/northeast-mid-water-trawl-fishery-mmpa-list-fisheries
a Unextrapolated mortalities
b Due to uncertainty in stock identification both minimum and maximum estimates are provide with associated CV's. As a result of uncertainty in stock identification, minimum and maximum mortality estimates are not additive across the Atlantic coastal and estuarine bottlenose dolphin stocks.
na=not applicable; unk= observer coverage was absent or too low to detect bycatch, or no estimate generated; tbd= to be determined
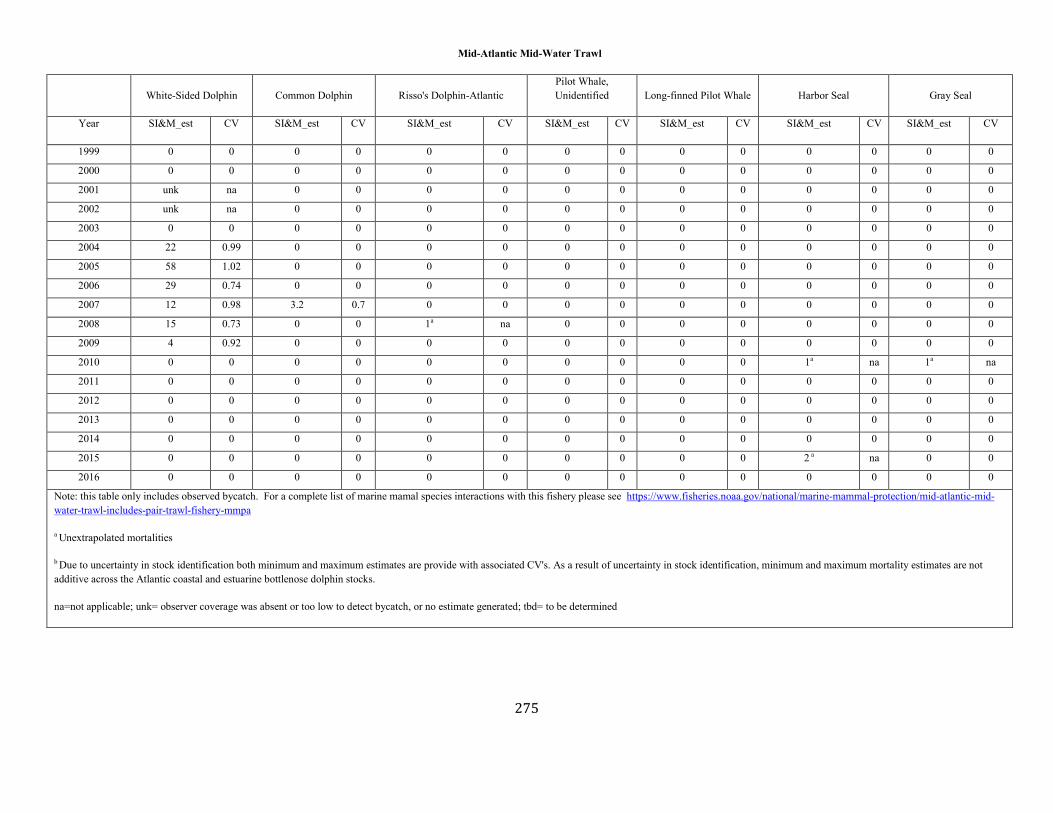
275
Mid-Atlantic Mid-Water Trawl
White-Sided Dolphin Common Dolphin Risso's Dolphin-Atlantic Pilot Whale, Unidentified Long-finned Pilot Whale Harbor Seal Gray Seal
Year SI&M_est CV SI&M_est CV SI&M_est CV SI&M_est CV SI&M_est CV SI&M_est CV SI&M_est CV
1999 0 0 0 0 0 0 0 0 0 0 0 0 0 0
2000 0 0 0 0 0 0 0 0 0 0 0 0 0 0
2001 unk na 0 0 0 0 0 0 0 0 0 0 0 0
2002 unk na 0 0 0 0 0 0 0 0 0 0 0 0
2003 0 0 0 0 0 0 0 0 0 0 0 0 0 0
2004 22 0.99 0 0 0 0 0 0 0 0 0 0 0 0
2005 58 1.02 0 0 0 0 0 0 0 0 0 0 0 0
2006 29 0.74 0 0 0 0 0 0 0 0 0 0 0 0
2007 12 0.98 3.2 0.7 0 0 0 0 0 0 0 0 0 0
2008 15 0.73 0 0 1a na 0 0 0 0 0 0 0 0
2009 4 0.92 0 0 0 0 0 0 0 0 0 0 0 0
2010 0 0 0 0 0 0 0 0 0 0 1a na 1a na
2011 0 0 0 0 0 0 0 0 0 0 0 0 0 0
2012 0 0 0 0 0 0 0 0 0 0 0 0 0 0
2013 0 0 0 0 0 0 0 0 0 0 0 0 0 0
2014 0 0 0 0 0 0 0 0 0 0 0 0 0 0
2015 0 0 0 0 0 0 0 0 0 0 2 a na 0 0
2016 0 0 0 0 0 0 0 0 0 0 0 0 0 0
Note: this table only includes observed bycatch. For a complete list of marine mamal species interactions with this fishery please see https://www.fisheries.noaa.gov/national/marine-mammal-protection/mid-atlantic-mid-water-trawl-includes-pair-trawl-fishery-mmpa
a Unextrapolated mortalities
b Due to uncertainty in stock identification both minimum and maximum estimates are provide with associated CV's. As a result of uncertainty in stock identification, minimum and maximum mortality estimates are not additive across the Atlantic coastal and estuarine bottlenose dolphin stocks.
na=not applicable; unk= observer coverage was absent or too low to detect bycatch, or no estimate generated; tbd= to be determined
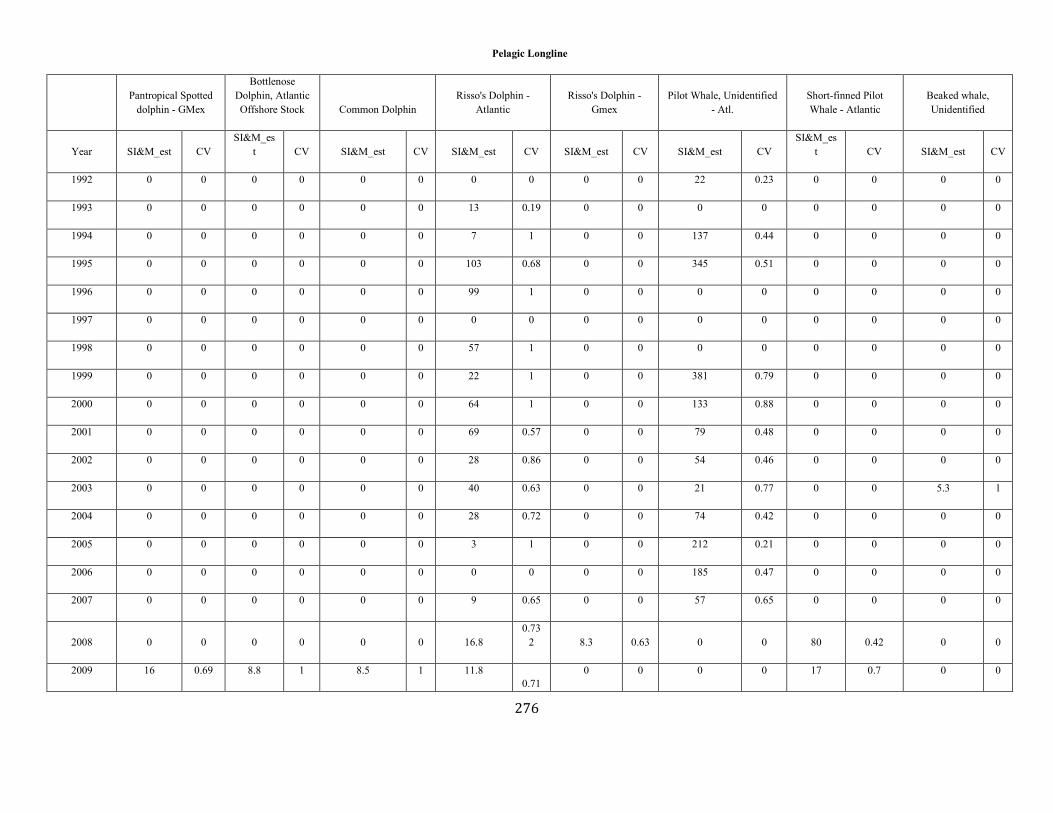
276
Pelagic Longline
Pantropical Spotted
dolphin - GMex
Bottlenose Dolphin, Atlantic Offshore Stock Common Dolphin
Risso's Dolphin - Atlantic
Risso's Dolphin - Gmex
Pilot Whale, Unidentified - Atl.
Short-finned Pilot Whale - Atlantic
Beaked whale, Unidentified
Year SI&M_est CV SI&M_es
t CV SI&M_est CV SI&M_est CV SI&M_est CV SI&M_est CV SI&M_es
t CV SI&M_est CV
1992 0 0 0 0 0 0 0 0 0 0 22 0.23 0 0 0 0
1993 0 0 0 0 0 0 13 0.19 0 0 0 0 0 0 0 0
1994 0 0 0 0 0 0 7 1 0 0 137 0.44 0 0 0 0
1995 0 0 0 0 0 0 103 0.68 0 0 345 0.51 0 0 0 0
1996 0 0 0 0 0 0 99 1 0 0 0 0 0 0 0 0
1997 0 0 0 0 0 0 0 0 0 0 0 0 0 0 0 0
1998 0 0 0 0 0 0 57 1 0 0 0 0 0 0 0 0
1999 0 0 0 0 0 0 22 1 0 0 381 0.79 0 0 0 0
2000 0 0 0 0 0 0 64 1 0 0 133 0.88 0 0 0 0
2001 0 0 0 0 0 0 69 0.57 0 0 79 0.48 0 0 0 0
2002 0 0 0 0 0 0 28 0.86 0 0 54 0.46 0 0 0 0
2003 0 0 0 0 0 0 40 0.63 0 0 21 0.77 0 0 5.3 1
2004 0 0 0 0 0 0 28 0.72 0 0 74 0.42 0 0 0 0
2005 0 0 0 0 0 0 3 1 0 0 212 0.21 0 0 0 0
2006 0 0 0 0 0 0 0 0 0 0 185 0.47 0 0 0 0
2007 0 0 0 0 0 0 9 0.65 0 0 57 0.65 0 0 0 0
2008 0 0 0 0 0 0 16.8 0.73
2 8.3 0.63 0 0 80 0.42 0 0
2009 16 0.69 8.8 1 8.5 1 11.8 0.71
0 0 0 0 17 0.7 0 0
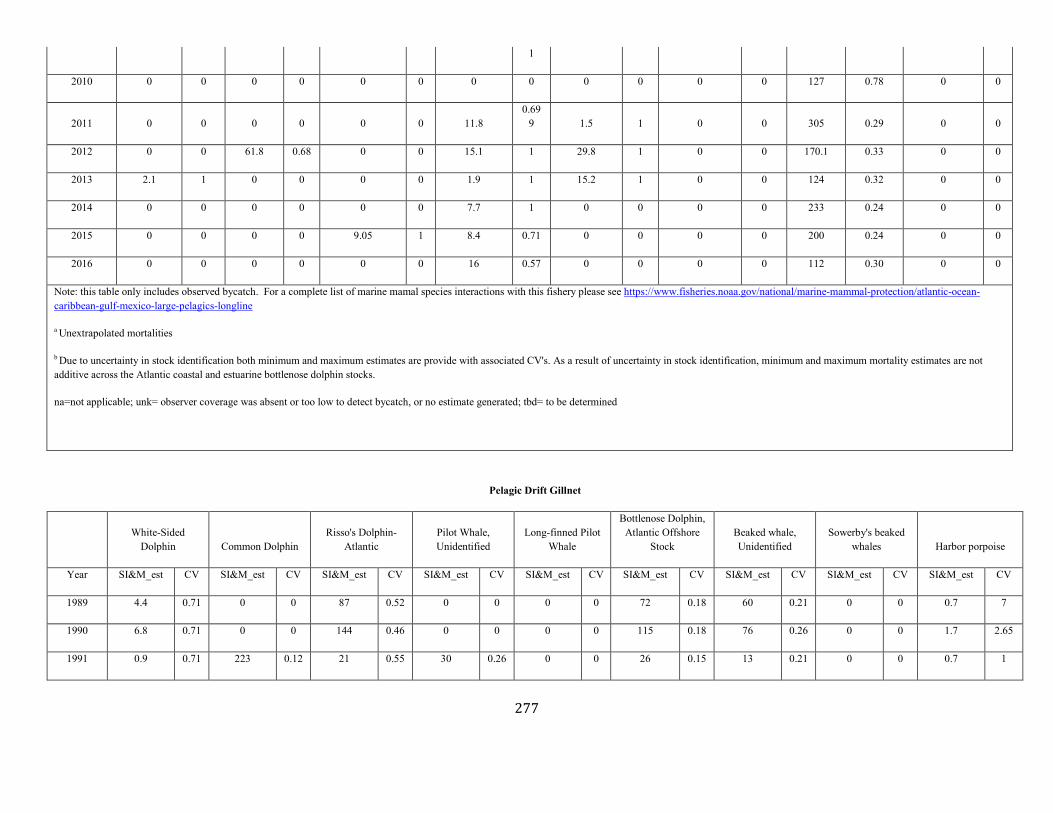
277
1
2010 0 0 0 0 0 0 0 0 0 0 0 0 127 0.78 0 0
2011 0 0 0 0 0 0 11.8 0.69
9 1.5 1 0 0 305 0.29 0 0
2012 0 0 61.8 0.68 0 0 15.1 1 29.8 1 0 0 170.1 0.33 0 0
2013 2.1 1 0 0 0 0 1.9 1 15.2 1 0 0 124 0.32 0 0
2014 0 0 0 0 0 0 7.7 1 0 0 0 0 233 0.24 0 0
2015 0 0 0 0 9.05 1 8.4 0.71 0 0 0 0 200 0.24 0 0
2016 0 0 0 0 0 0 16 0.57 0 0 0 0 112 0.30 0 0
Note: this table only includes observed bycatch. For a complete list of marine mamal species interactions with this fishery please see https://www.fisheries.noaa.gov/national/marine-mammal-protection/atlantic-ocean-caribbean-gulf-mexico-large-pelagics-longline
a Unextrapolated mortalities
b Due to uncertainty in stock identification both minimum and maximum estimates are provide with associated CV's. As a result of uncertainty in stock identification, minimum and maximum mortality estimates are not additive across the Atlantic coastal and estuarine bottlenose dolphin stocks.
na=not applicable; unk= observer coverage was absent or too low to detect bycatch, or no estimate generated; tbd= to be determined
Pelagic Drift Gillnet
White-Sided
Dolphin Common Dolphin Risso's Dolphin-
Atlantic Pilot Whale, Unidentified
Long-finned Pilot Whale
Bottlenose Dolphin, Atlantic Offshore
Stock Beaked whale, Unidentified
Sowerby's beaked whales Harbor porpoise
Year SI&M_est CV SI&M_est CV SI&M_est CV SI&M_est CV SI&M_est CV SI&M_est CV SI&M_est CV SI&M_est CV SI&M_est CV
1989 4.4 0.71 0 0 87 0.52 0 0 0 0 72 0.18 60 0.21 0 0 0.7 7
1990 6.8 0.71 0 0 144 0.46 0 0 0 0 115 0.18 76 0.26 0 0 1.7 2.65
1991 0.9 0.71 223 0.12 21 0.55 30 0.26 0 0 26 0.15 13 0.21 0 0 0.7 1

278
1992 0.8 0.71 227 0.09 31 0.27 33 0.16 0 0 28 0.1 9.7 0.24 0 0 0.4 1
1993 2.7 0.17 238 0.08 14 0.42 31 0.19 0 0 22 0.13 12 0.16 0 0 1.5 0.34
1994 0 0.71 163 0.02 1.5 0.16 20 0.06 0 0 14 0.04 0 0 3 0.09 0 0
1995 0 0 83 0 6 0 9.1 0 0 0 5 0 3 0 6 0 0 0
1996 0 0 0 0 0 0 0 0 0 0 0 0 2 0.25 9 0.12 0 0
1997 0 0 0 0 0 0 0 0 0 0 0 0 0 0 0 0 0 0
1998 0 0 0 0 9 0 0 0 0 0 3 0 7 0 2 0 0 0
1999 0 0 0 0 0 0 20 0 0 0 0 0 0 0 0 0 0 0
Note: this table only includes observed bycatch.
a Unextrapolated mortalities
b Due to uncertainty in stock identification both minimum and maximum estimates are provide with associated CV's. As a result of uncertainty in stock identification, minimum and maximum mortality estimates are not additive across the Atlantic coastal and estuarine bottlenose dolphin stocks.
na=not applicable; unk= observer coverage was absent or too low to detect bycatch, or no estimate generated; tbd= to be determined

279
Pelagic Pair Trawl
White-Sided Dolphin Common Dolphin Risso's Dolphin-Atlantic Pilot Whale, Unidentified Long-finned Pilot Whale Bottlenose dolphin- Atlantic
offshore
Year SI&M_est CV SI&M_est CV SI&M_est CV SI&M_est CV SI&M_est CV SI&M_est CV
1989 0 0 0 0 0 0 0 0 0 0 0 0
1990 0 0 0 0 0 0 0 0 0 0 0 0
1991 0 0 0 0 0.6 1 0 0 0 0 13 0.52
1992 0 0 0 0 4.3 0.76 0 0 0 0 73 0.49
1993 0 0 0 0 3.2 1 0 0 0 0 85 0.41
1994 0 0 0 0 0 0 2 0.49 0 0 4 0.4
1995 0 0 0 0 3.7 0.45 22 0.33 0 0 17 0.26
1996 0 0 0 0 0 0 0 0 0 0 0 0
1997 0 0 0 0 0 0 0 0 0 0 0 0
1998 0 0 0 0 0 0 0 0 0 0 0 0
1999 0 0 0 0 0 0 0 0 0 0 0 0
Note: this table only includes observed bycatch.
a Unextrapolated mortalities
b Due to uncertainty in stock identification both minimum and maximum estimates are provide with associated CV's. As a result of uncertainty in stock identification, minimum and maximum mortality estimates are not additive across the Atlantic coastal and estuarine bottlenose dolphin stocks.
na=not applicable; unk= observer coverage was absent or too low to detect bycatch, or no estimate generated; tbd= to be determined
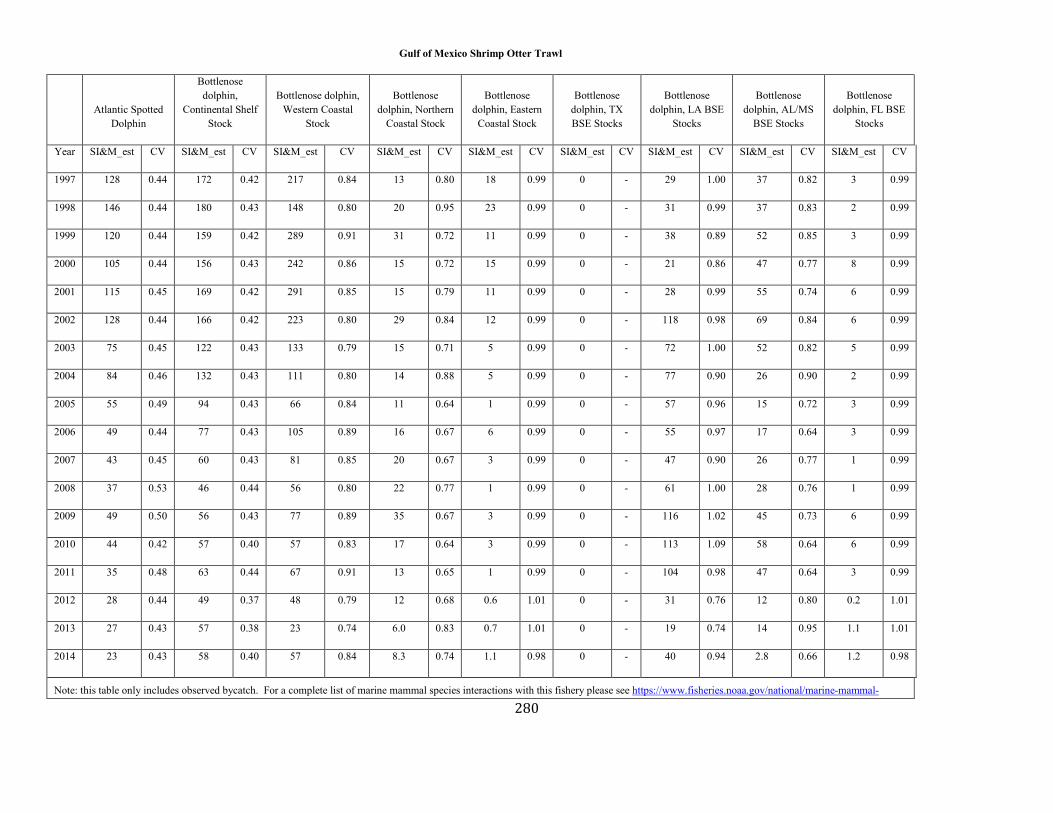
280
Gulf of Mexico Shrimp Otter Trawl
Atlantic Spotted
Dolphin
Bottlenose dolphin,
Continental Shelf Stock
Bottlenose dolphin, Western Coastal
Stock
Bottlenose dolphin, Northern
Coastal Stock
Bottlenose dolphin, Eastern
Coastal Stock
Bottlenose dolphin, TX BSE Stocks
Bottlenose dolphin, LA BSE
Stocks
Bottlenose dolphin, AL/MS
BSE Stocks
Bottlenose dolphin, FL BSE
Stocks
Year SI&M_est CV SI&M_est CV SI&M_est CV SI&M_est CV SI&M_est CV SI&M_est CV SI&M_est CV SI&M_est CV SI&M_est CV
1997 128 0.44 172 0.42 217 0.84 13 0.80 18 0.99 0 - 29 1.00 37 0.82 3 0.99
1998 146 0.44 180 0.43 148 0.80 20 0.95 23 0.99 0 - 31 0.99 37 0.83 2 0.99
1999 120 0.44 159 0.42 289 0.91 31 0.72 11 0.99 0 - 38 0.89 52 0.85 3 0.99
2000 105 0.44 156 0.43 242 0.86 15 0.72 15 0.99 0 - 21 0.86 47 0.77 8 0.99
2001 115 0.45 169 0.42 291 0.85 15 0.79 11 0.99 0 - 28 0.99 55 0.74 6 0.99
2002 128 0.44 166 0.42 223 0.80 29 0.84 12 0.99 0 - 118 0.98 69 0.84 6 0.99
2003 75 0.45 122 0.43 133 0.79 15 0.71 5 0.99 0 - 72 1.00 52 0.82 5 0.99
2004 84 0.46 132 0.43 111 0.80 14 0.88 5 0.99 0 - 77 0.90 26 0.90 2 0.99
2005 55 0.49 94 0.43 66 0.84 11 0.64 1 0.99 0 - 57 0.96 15 0.72 3 0.99
2006 49 0.44 77 0.43 105 0.89 16 0.67 6 0.99 0 - 55 0.97 17 0.64 3 0.99
2007 43 0.45 60 0.43 81 0.85 20 0.67 3 0.99 0 - 47 0.90 26 0.77 1 0.99
2008 37 0.53 46 0.44 56 0.80 22 0.77 1 0.99 0 - 61 1.00 28 0.76 1 0.99
2009 49 0.50 56 0.43 77 0.89 35 0.67 3 0.99 0 - 116 1.02 45 0.73 6 0.99
2010 44 0.42 57 0.40 57 0.83 17 0.64 3 0.99 0 - 113 1.09 58 0.64 6 0.99
2011 35 0.48 63 0.44 67 0.91 13 0.65 1 0.99 0 - 104 0.98 47 0.64 3 0.99
2012 28 0.44 49 0.37 48 0.79 12 0.68 0.6 1.01 0 - 31 0.76 12 0.80 0.2 1.01
2013 27 0.43 57 0.38 23 0.74 6.0 0.83 0.7 1.01 0 - 19 0.74 14 0.95 1.1 1.01
2014 23 0.43 58 0.40 57 0.84 8.3 0.74 1.1 0.98 0 - 40 0.94 2.8 0.66 1.2 0.98
Note: this table only includes observed bycatch. For a complete list of marine mammal species interactions with this fishery please see https://www.fisheries.noaa.gov/national/marine-mammal-
281
protection/southeastern-us-atlantic-gulf-mexico-shrimp-trawl-fishery-mmpa.
a Unextrapolated mortalities
b Due to uncertainty in stock identification both minimum and maximum estimates are provide with associated CV's. As a result of uncertainty in stock identification, minimum and maximum mortality estimates are not additive across the Atlantic coastal and estuarine bottlenose dolphin stocks.
na=not applicable; unk= observer coverage was absent or too low to detect bycatch, or no estimate generated; tbd= to be determined
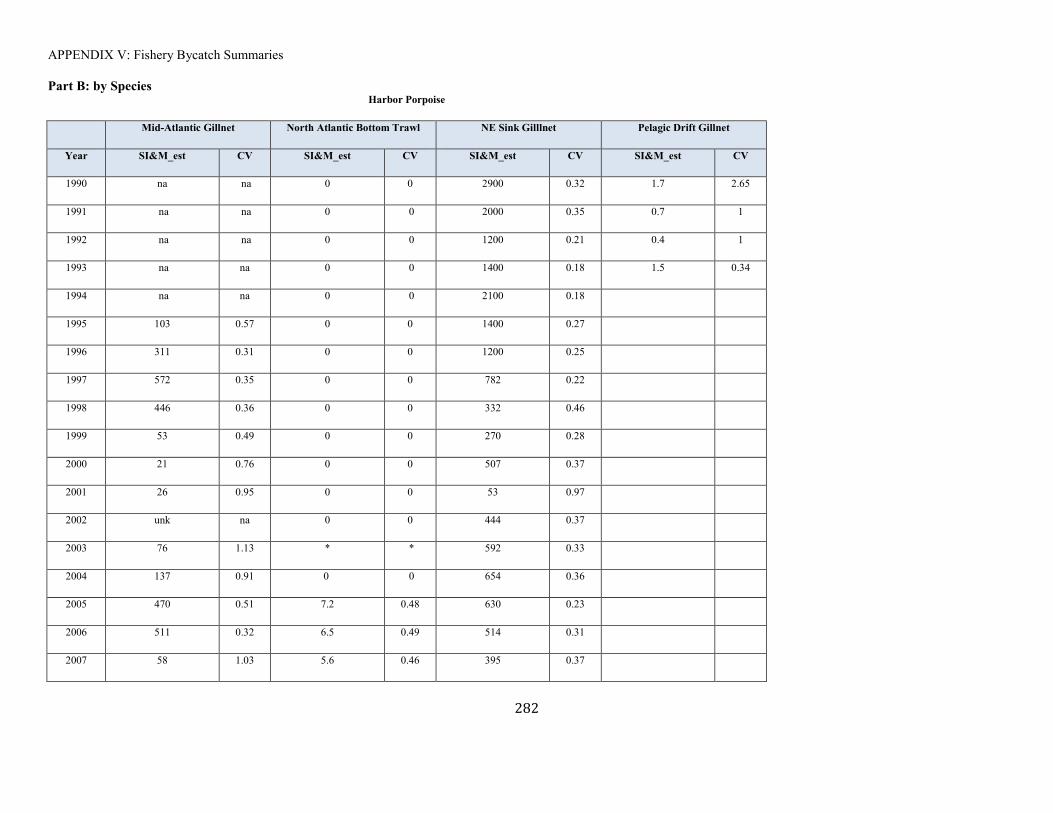
282
APPENDIX V: Fishery Bycatch Summaries
Part B: by Species Harbor Porpoise
Mid-Atlantic Gillnet North Atlantic Bottom Trawl NE Sink Gilllnet Pelagic Drift Gillnet
Year SI&M_est CV SI&M_est CV SI&M_est CV SI&M_est CV
1990 na na 0 0 2900 0.32 1.7 2.65
1991 na na 0 0 2000 0.35 0.7 1
1992 na na 0 0 1200 0.21 0.4 1
1993 na na 0 0 1400 0.18 1.5 0.34
1994 na na 0 0 2100 0.18
1995 103 0.57 0 0 1400 0.27
1996 311 0.31 0 0 1200 0.25
1997 572 0.35 0 0 782 0.22
1998 446 0.36 0 0 332 0.46
1999 53 0.49 0 0 270 0.28
2000 21 0.76 0 0 507 0.37
2001 26 0.95 0 0 53 0.97
2002 unk na 0 0 444 0.37
2003 76 1.13 * * 592 0.33
2004 137 0.91 0 0 654 0.36
2005 470 0.51 7.2 0.48 630 0.23
2006 511 0.32 6.5 0.49 514 0.31
2007 58 1.03 5.6 0.46 395 0.37

283
2008 350 0.75 5.6 0.97 666 0.48
2009 201 0.55 0 0 591 0.23
2010 259 0.88 0 0 387 0.27
2011 123 0.41 5.9 0.71 273 0.2
2012 63.41 0.83 0 0 277.3 0.59
2013 19 1.06 7 0.98 399 0.33
2014 22 1.03 5.5 0.86 128 0.27
2015 33 1.16 3.7 0.49 177 0.28
2016 23 0.64 0 0 125 0.34
Note: this table only includes observed bycatch. a Unextrapolated mortalities
na=not applicable; unk= observer coverage was absent or too low to detect bycatch, or no estimate generated; tbd= to be determined
Common Bottlenose Dolphin, Atlantic Offshore Stock
Mid-Atlantic Bottom Trawl Mid-Atlantic Gillnet North Atlantic Bottom Trawl NE Sink Gilllnet Pelagic Drift Gillnet Pelagic Longline
Year SI&M_est CV SI&M_est CV SI&M_est CV SI&M_est CV SI&M_est CV SI&M_est CV
1991 na na na na 91 0.97 0 0 26 0.15 0 0
1992 na na na na 0 0 0 0 28 0.1 0 0
1993 na na na na 0 0 0 0 22 0.13 0 0
1994 na na na na 0 0 0 0 14 0.04 0 0
1995 na na 56 1.66 0 0 0 0 5 0 0 0
1996 na na 64 0.83 0 0 0 0 0 0 0 0
1997 0 0 0 0 0 0 0 0 0 0
1998 0 0 63 0.94 0 0 0 0 0 0
1999 0 0 0 0 0 0 0 0 0 0

284
2000 0 0 0 0 0 0 132 1.16 0 0
2001 0 0 na na 0 0 0 0 0 0
2002 0 0 0 0 0 0 0 0 0 0
2003 0 0 0 0 0 0 0 0 0 0
2004 0 0 0 0 0 0 1a na 0 0
2005 0 0 1a na 0 0 0 0 0 0
2006 0 0 0 0 0 0 0 0 0 0
2007 11 0.42 0 0 48 .95 0 0
0 0
2008 16 0.36 0 0 19 0.88 0 0 0 0
2009 21 0.45 0 0 18 0.92 0 0 8.8 1
2010 20 0.34 0 0 4 0.53 0 0 0 0
2011 34 0.31 0 0 10 0.84 0 0 0 0
2012 16 1 0 0 0 0 0 0 61.8 0.68
2013 0 0 0 0 0 0 27 0.95 0 0
2014 25 0.66 0 0 0 0 0 0 0 0
2015
2016
Note: this table only includes observed bycatch. a Unextrapolated mortalities
na=not applicable; unk= observer coverage was absent or too low to detect bycatch, or no estimate generated; tbd= to be determined
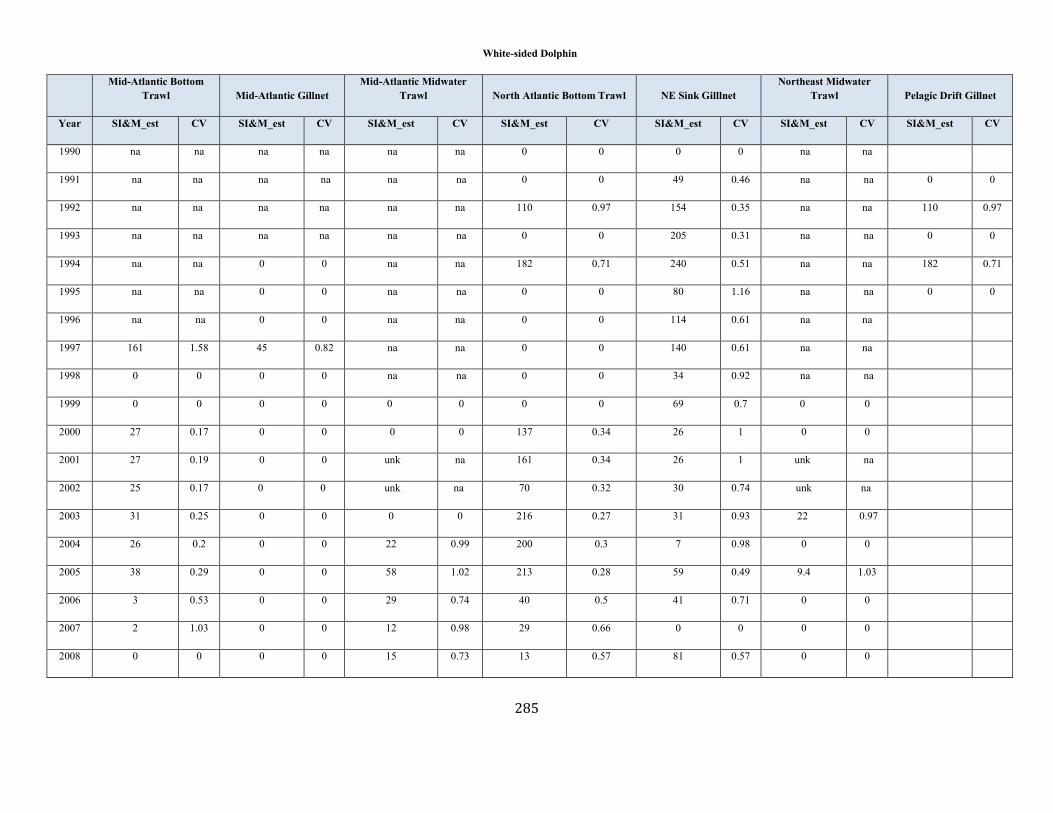
285
White-sided Dolphin
Mid-Atlantic Bottom
Trawl Mid-Atlantic Gillnet Mid-Atlantic Midwater
Trawl North Atlantic Bottom Trawl NE Sink Gilllnet Northeast Midwater
Trawl Pelagic Drift Gillnet
Year SI&M_est CV SI&M_est CV SI&M_est CV SI&M_est CV SI&M_est CV SI&M_est CV SI&M_est CV
1990 na na na na na na 0 0 0 0 na na
1991 na na na na na na 0 0 49 0.46 na na 0 0
1992 na na na na na na 110 0.97 154 0.35 na na 110 0.97
1993 na na na na na na 0 0 205 0.31 na na 0 0
1994 na na 0 0 na na 182 0.71 240 0.51 na na 182 0.71
1995 na na 0 0 na na 0 0 80 1.16 na na 0 0
1996 na na 0 0 na na 0 0 114 0.61 na na
1997 161 1.58 45 0.82 na na 0 0 140 0.61 na na
1998 0 0 0 0 na na 0 0 34 0.92 na na
1999 0 0 0 0 0 0 0 0 69 0.7 0 0
2000 27 0.17 0 0 0 0 137 0.34 26 1 0 0
2001 27 0.19 0 0 unk na 161 0.34 26 1 unk na
2002 25 0.17 0 0 unk na 70 0.32 30 0.74 unk na
2003 31 0.25 0 0 0 0 216 0.27 31 0.93 22 0.97
2004 26 0.2 0 0 22 0.99 200 0.3 7 0.98 0 0
2005 38 0.29 0 0 58 1.02 213 0.28 59 0.49 9.4 1.03
2006 3 0.53 0 0 29 0.74 40 0.5 41 0.71 0 0
2007 2 1.03 0 0 12 0.98 29 0.66 0 0 0 0
2008 0 0 0 0 15 0.73 13 0.57 81 0.57 0 0

286
2009 0 0 0 0 4 0.92 171 0.28 0 0 0 0
2010 0 0 0 0 0 0 37 0.32 66 0.9 0 0
2011 0 0 0 0 0 0 141 0.24 18 0.43 0 0
2012 0 0 0 0 0 0 27 0.47 9 0.92 0 0
2013 0 0 0 0 0 0 33 0.31 4 1.03 0 0
2014 9.7 0.94 0 0 0 0 16 0.50 10 0.66 0 0
2015 0 0 0 0 0 0 15 0.52 0 0 0 0
2016 0 0 0 0 0 0 28 0.46 0 0 0 0
Note: this table only includes observed bycatch. a Unextrapolated mortalities
na=not applicable; unk= observer coverage was absent or too low to detect bycatch, or no estimate generated; tbd= to be determined

287
Risso's Dolphin, Western North Atlantic Stock
Mid-Atlantic Bottom Trawl Mid-Atlantic Gillnet North Atlantic Bottom Trawl NE Sink Gilllnet Pelagic Longline
Year SI&M_est CV SI&M_est CV SI&M_est CV SI&M_est CV SI&M_est CV
1996 0 0 0 0 0 0 0 0 99 1
1997 0 0 0 0 0 0 0 0 0 0
1998 0 0 0 0 0 0 0 0 57 1
1999 0 0 0 0 0 0 0 0 22 1
2000 0 0 0 0 0 0 15 1.06 64 1
2001 0 0 0 0 0 0 0 0 69 0.57
2002 0 0 0 0 0 0 0 0 28 0.86
2003 0 0 0 0 0 0 0 0 40 0.63
2004 0 0 0 0 0 0 0 0 28 0.72
2005 0 0 0 0 0 0 15 0.93 3 1
2006 0 0 0 0 0 0 0 0 0 0
2007 33 0.34 34 0.73 3 0.52 0 0 9 0.65
2008 39 0.69 0 0 2 0.56 0 0 16.8 0.732
2009 23 0.5 0 0 3 0.53 0 0 11.8 0.711
2010 54 0.74 0 0 2 0.55 0 0 0 0
2011 62 0.56 0 0 3 0.55 0 0 11.8 0.699
2012 8 1 0 0 0 0 6 0.87 15.1 1
2013 46 0.71 0 0 0 0 23 0.97 1.9 1
2014 21 0.93 0 0 4.2 0.91 0 0 7.7 1.0
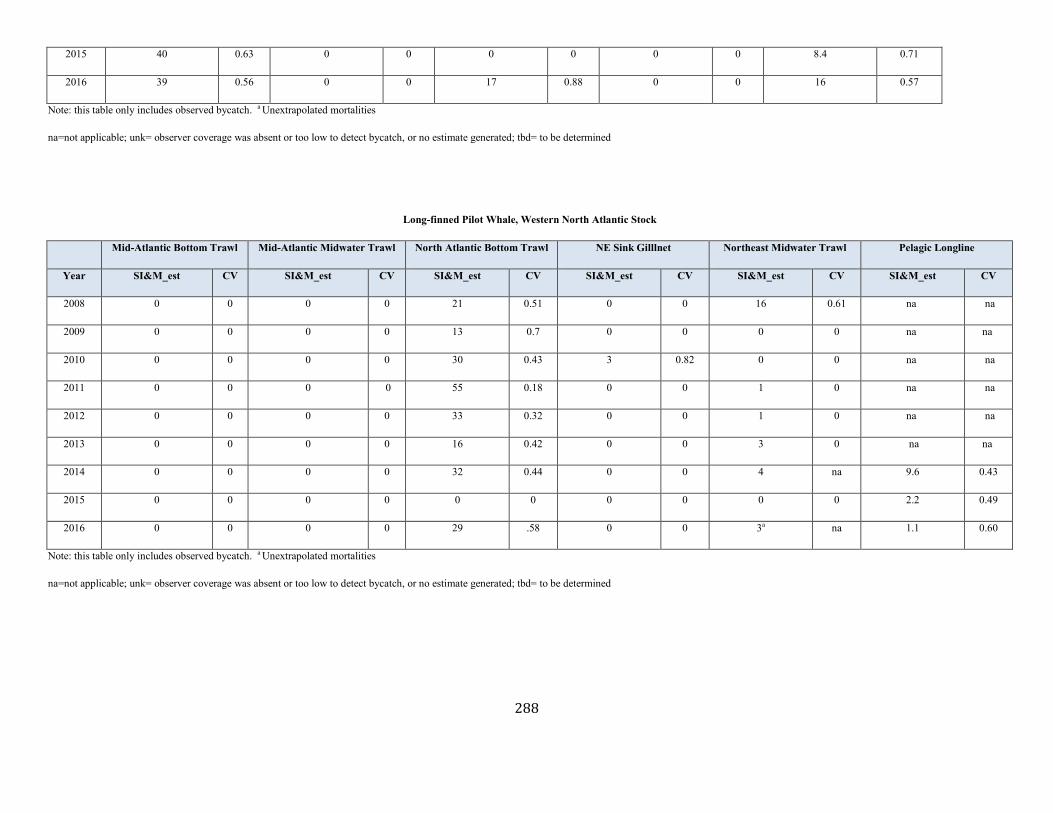
288
2015 40 0.63 0 0 0 0 0 0 8.4 0.71
2016 39 0.56 0 0 17 0.88 0 0 16 0.57
Note: this table only includes observed bycatch. a Unextrapolated mortalities
na=not applicable; unk= observer coverage was absent or too low to detect bycatch, or no estimate generated; tbd= to be determined
Long-finned Pilot Whale, Western North Atlantic Stock
Mid-Atlantic Bottom Trawl Mid-Atlantic Midwater Trawl North Atlantic Bottom Trawl NE Sink Gilllnet Northeast Midwater Trawl Pelagic Longline
Year SI&M_est CV SI&M_est CV SI&M_est CV SI&M_est CV SI&M_est CV SI&M_est CV
2008 0 0 0 0 21 0.51 0 0 16 0.61 na na
2009 0 0 0 0 13 0.7 0 0 0 0 na na
2010 0 0 0 0 30 0.43 3 0.82 0 0 na na
2011 0 0 0 0 55 0.18 0 0 1 0 na na
2012 0 0 0 0 33 0.32 0 0 1 0 na na
2013 0 0 0 0 16 0.42 0 0 3 0 na na
2014 0 0 0 0 32 0.44 0 0 4 na 9.6 0.43
2015 0 0 0 0 0 0 0 0 0 0 2.2 0.49
2016 0 0 0 0 29 .58 0 0 3a na 1.1 0.60
Note: this table only includes observed bycatch. a Unextrapolated mortalities
na=not applicable; unk= observer coverage was absent or too low to detect bycatch, or no estimate generated; tbd= to be determined
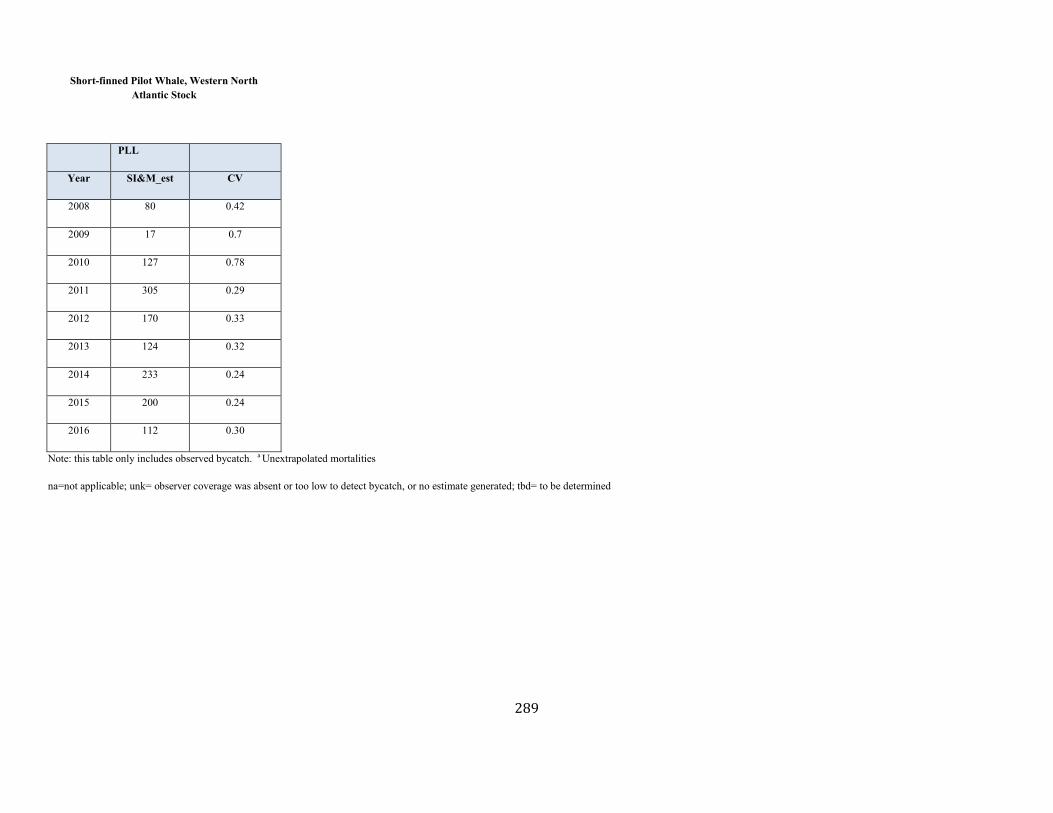
289
Short-finned Pilot Whale, Western North Atlantic Stock
PLL
Year SI&M_est CV
2008 80 0.42
2009 17 0.7
2010 127 0.78
2011 305 0.29
2012 170 0.33
2013 124 0.32
2014 233 0.24
2015 200 0.24
2016 112 0.30
Note: this table only includes observed bycatch. a Unextrapolated mortalities
na=not applicable; unk= observer coverage was absent or too low to detect bycatch, or no estimate generated; tbd= to be determined
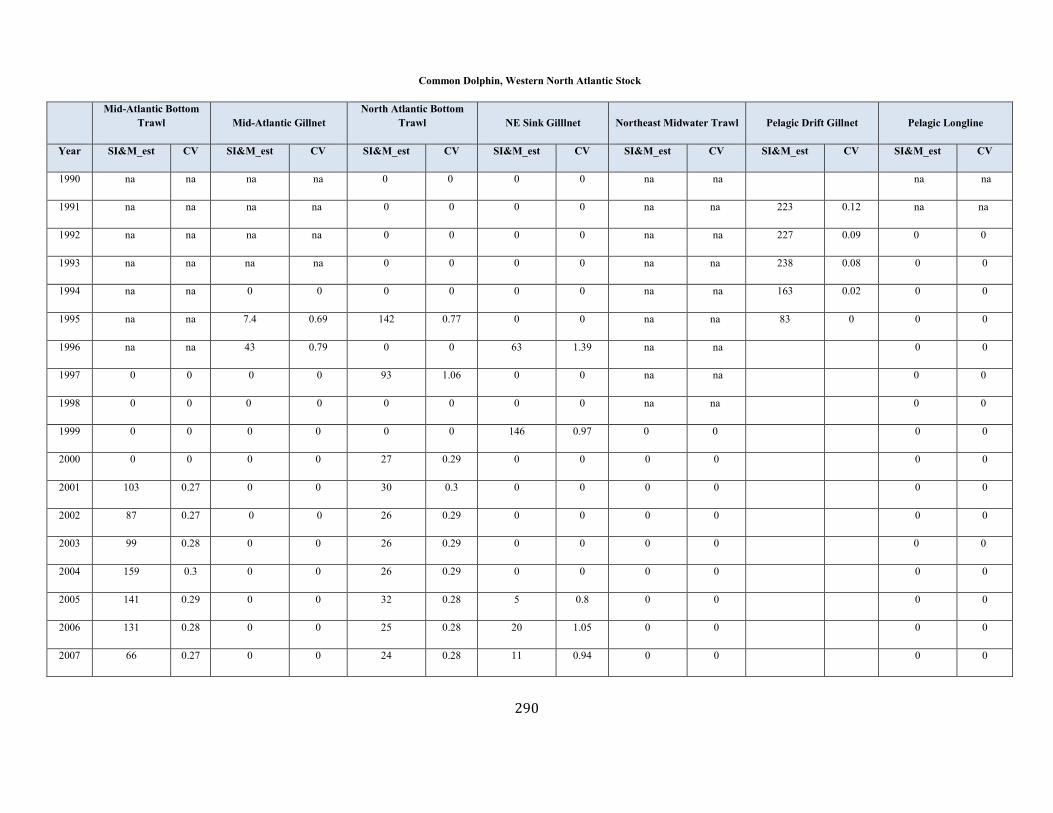
290
Common Dolphin, Western North Atlantic Stock
Mid-Atlantic Bottom
Trawl Mid-Atlantic Gillnet North Atlantic Bottom
Trawl NE Sink Gilllnet Northeast Midwater Trawl Pelagic Drift Gillnet Pelagic Longline
Year SI&M_est CV SI&M_est CV SI&M_est CV SI&M_est CV SI&M_est CV SI&M_est CV SI&M_est CV
1990 na na na na 0 0 0 0 na na na na
1991 na na na na 0 0 0 0 na na 223 0.12 na na
1992 na na na na 0 0 0 0 na na 227 0.09 0 0
1993 na na na na 0 0 0 0 na na 238 0.08 0 0
1994 na na 0 0 0 0 0 0 na na 163 0.02 0 0
1995 na na 7.4 0.69 142 0.77 0 0 na na 83 0 0 0
1996 na na 43 0.79 0 0 63 1.39 na na 0 0
1997 0 0 0 0 93 1.06 0 0 na na 0 0
1998 0 0 0 0 0 0 0 0 na na 0 0
1999 0 0 0 0 0 0 146 0.97 0 0 0 0
2000 0 0 0 0 27 0.29 0 0 0 0 0 0
2001 103 0.27 0 0 30 0.3 0 0 0 0 0 0
2002 87 0.27 0 0 26 0.29 0 0 0 0 0 0
2003 99 0.28 0 0 26 0.29 0 0 0 0 0 0
2004 159 0.3 0 0 26 0.29 0 0 0 0 0 0
2005 141 0.29 0 0 32 0.28 5 0.8 0 0 0 0
2006 131 0.28 0 0 25 0.28 20 1.05 0 0 0 0
2007 66 0.27 0 0 24 0.28 11 0.94 0 0 0 0
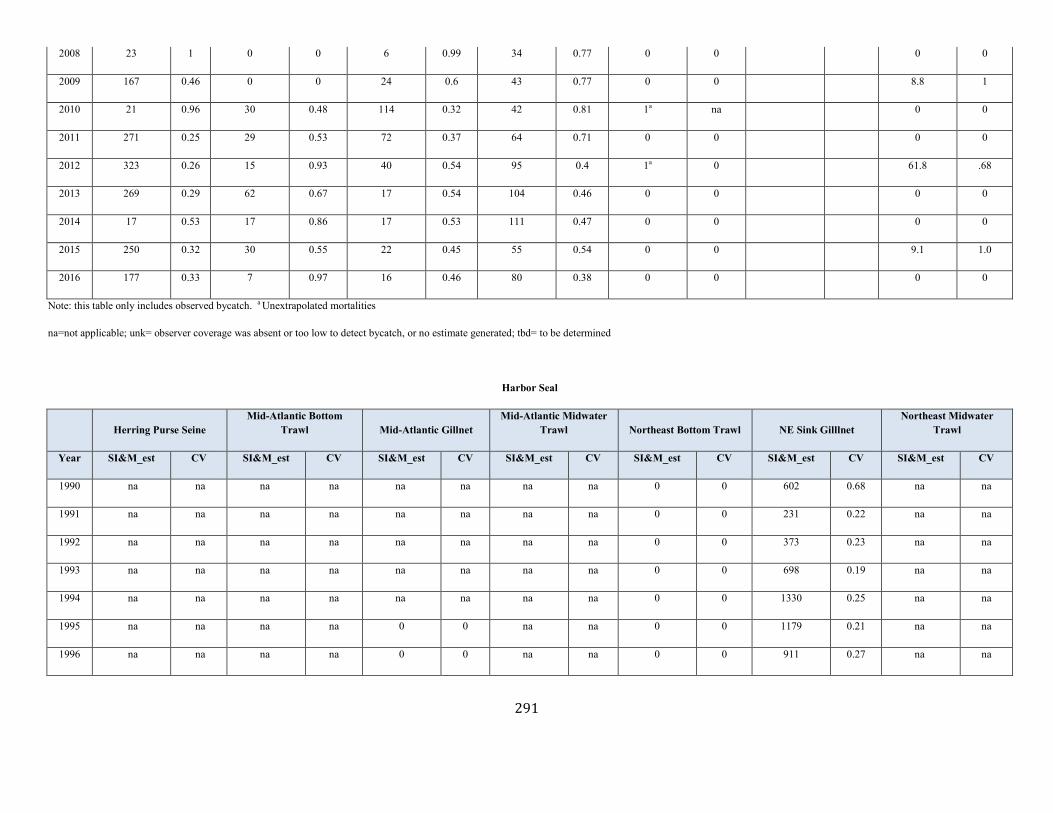
291
2008 23 1 0 0 6 0.99 34 0.77 0 0 0 0
2009 167 0.46 0 0 24 0.6 43 0.77 0 0 8.8 1
2010 21 0.96 30 0.48 114 0.32 42 0.81 1a na 0 0
2011 271 0.25 29 0.53 72 0.37 64 0.71 0 0 0 0
2012 323 0.26 15 0.93 40 0.54 95 0.4 1a 0 61.8 .68
2013 269 0.29 62 0.67 17 0.54 104 0.46 0 0 0 0
2014 17 0.53 17 0.86 17 0.53 111 0.47 0 0 0 0
2015 250 0.32 30 0.55 22 0.45 55 0.54 0 0 9.1 1.0
2016 177 0.33 7 0.97 16 0.46 80 0.38 0 0 0 0
Note: this table only includes observed bycatch. a Unextrapolated mortalities
na=not applicable; unk= observer coverage was absent or too low to detect bycatch, or no estimate generated; tbd= to be determined
Harbor Seal
Herring Purse Seine Mid-Atlantic Bottom
Trawl Mid-Atlantic Gillnet Mid-Atlantic Midwater
Trawl Northeast Bottom Trawl NE Sink Gilllnet Northeast Midwater
Trawl
Year SI&M_est CV SI&M_est CV SI&M_est CV SI&M_est CV SI&M_est CV SI&M_est CV SI&M_est CV
1990 na na na na na na na na 0 0 602 0.68 na na
1991 na na na na na na na na 0 0 231 0.22 na na
1992 na na na na na na na na 0 0 373 0.23 na na
1993 na na na na na na na na 0 0 698 0.19 na na
1994 na na na na na na na na 0 0 1330 0.25 na na
1995 na na na na 0 0 na na 0 0 1179 0.21 na na
1996 na na na na 0 0 na na 0 0 911 0.27 na na
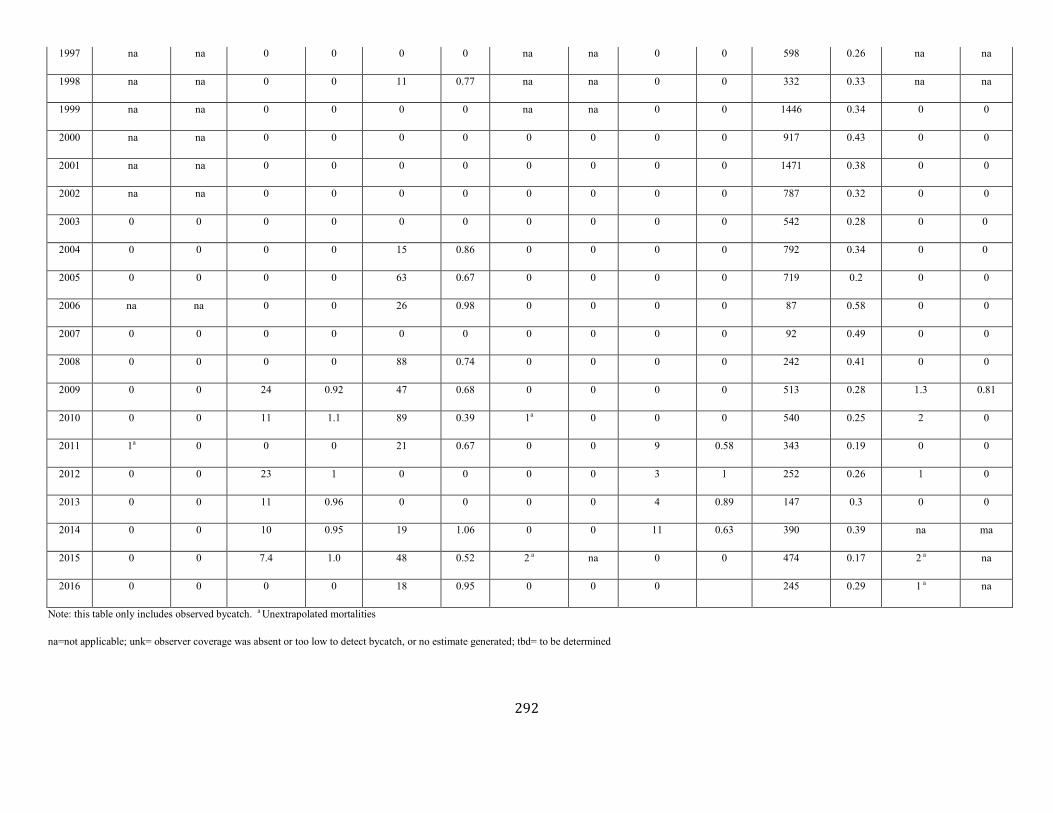
292
1997 na na 0 0 0 0 na na 0 0 598 0.26 na na
1998 na na 0 0 11 0.77 na na 0 0 332 0.33 na na
1999 na na 0 0 0 0 na na 0 0 1446 0.34 0 0
2000 na na 0 0 0 0 0 0 0 0 917 0.43 0 0
2001 na na 0 0 0 0 0 0 0 0 1471 0.38 0 0
2002 na na 0 0 0 0 0 0 0 0 787 0.32 0 0
2003 0 0 0 0 0 0 0 0 0 0 542 0.28 0 0
2004 0 0 0 0 15 0.86 0 0 0 0 792 0.34 0 0
2005 0 0 0 0 63 0.67 0 0 0 0 719 0.2 0 0
2006 na na 0 0 26 0.98 0 0 0 0 87 0.58 0 0
2007 0 0 0 0 0 0 0 0 0 0 92 0.49 0 0
2008 0 0 0 0 88 0.74 0 0 0 0 242 0.41 0 0
2009 0 0 24 0.92 47 0.68 0 0 0 0 513 0.28 1.3 0.81
2010 0 0 11 1.1 89 0.39 1a 0 0 0 540 0.25 2 0
2011 1a 0 0 0 21 0.67 0 0 9 0.58 343 0.19 0 0
2012 0 0 23 1 0 0 0 0 3 1 252 0.26 1 0
2013 0 0 11 0.96 0 0 0 0 4 0.89 147 0.3 0 0
2014 0 0 10 0.95 19 1.06 0 0 11 0.63 390 0.39 na ma
2015 0 0 7.4 1.0 48 0.52 2 a na 0 0 474 0.17 2 a na
2016 0 0 0 0 18 0.95 0 0 0 245 0.29 1 a na
Note: this table only includes observed bycatch. a Unextrapolated mortalities
na=not applicable; unk= observer coverage was absent or too low to detect bycatch, or no estimate generated; tbd= to be determined
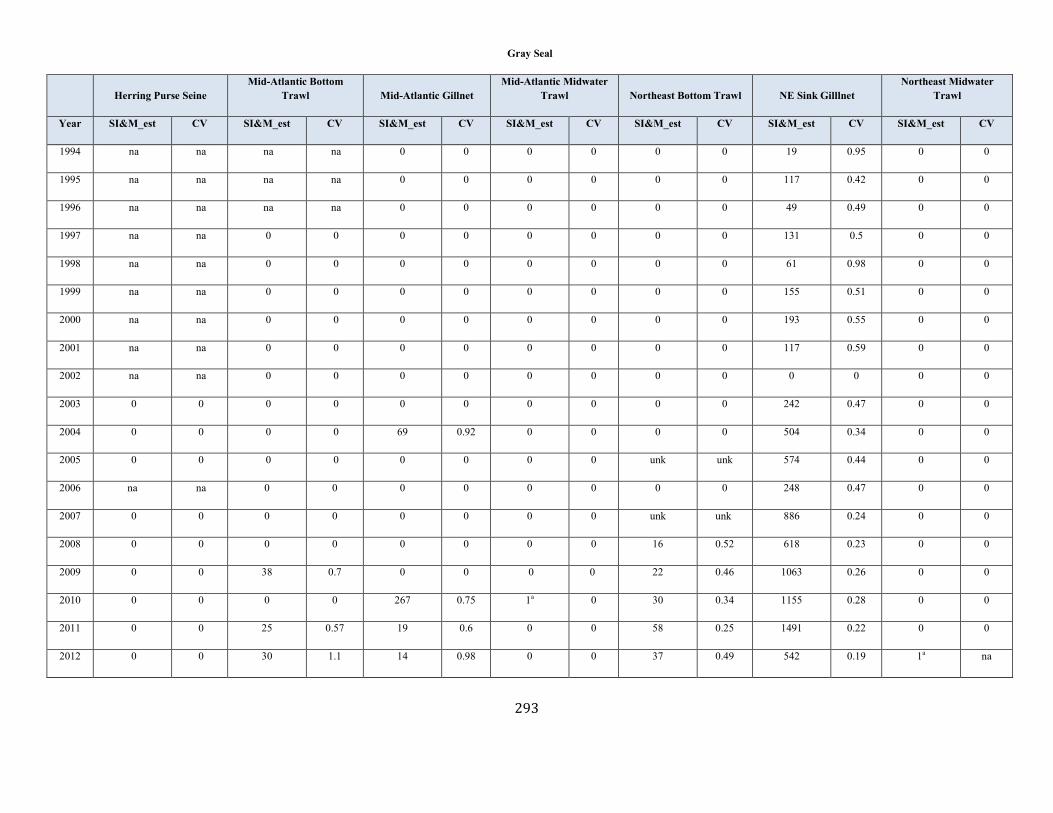
293
Gray Seal
Herring Purse Seine Mid-Atlantic Bottom
Trawl Mid-Atlantic Gillnet Mid-Atlantic Midwater
Trawl Northeast Bottom Trawl NE Sink Gilllnet Northeast Midwater
Trawl
Year SI&M_est CV SI&M_est CV SI&M_est CV SI&M_est CV SI&M_est CV SI&M_est CV SI&M_est CV
1994 na na na na 0 0 0 0 0 0 19 0.95 0 0
1995 na na na na 0 0 0 0 0 0 117 0.42 0 0
1996 na na na na 0 0 0 0 0 0 49 0.49 0 0
1997 na na 0 0 0 0 0 0 0 0 131 0.5 0 0
1998 na na 0 0 0 0 0 0 0 0 61 0.98 0 0
1999 na na 0 0 0 0 0 0 0 0 155 0.51 0 0
2000 na na 0 0 0 0 0 0 0 0 193 0.55 0 0
2001 na na 0 0 0 0 0 0 0 0 117 0.59 0 0
2002 na na 0 0 0 0 0 0 0 0 0 0 0 0
2003 0 0 0 0 0 0 0 0 0 0 242 0.47 0 0
2004 0 0 0 0 69 0.92 0 0 0 0 504 0.34 0 0
2005 0 0 0 0 0 0 0 0 unk unk 574 0.44 0 0
2006 na na 0 0 0 0 0 0 0 0 248 0.47 0 0
2007 0 0 0 0 0 0 0 0 unk unk 886 0.24 0 0
2008 0 0 0 0 0 0 0 0 16 0.52 618 0.23 0 0
2009 0 0 38 0.7 0 0 0 0 22 0.46 1063 0.26 0 0
2010 0 0 0 0 267 0.75 1a 0 30 0.34 1155 0.28 0 0
2011 0 0 25 0.57 19 0.6 0 0 58 0.25 1491 0.22 0 0
2012 0 0 30 1.1 14 0.98 0 0 37 0.49 542 0.19 1a na

294
2013 0 0 29 0.67 0 0 0 0 20 0.37 1127 0.2 1a na
2014 0 0 7 0.96 22 1.09 0 0 19 0.45 917 0.14 0 0
2015 0 0 0 0 15 1.04 0 0 23 0.46 1021 0.25 0 0
2016 0 0 26 .57 7 0.93 0 0 0 0 498 0.33 0 0
Note: this table only includes observed bycatch. a Unextrapolated mortalities
na=not applicable; unk= observer coverage was absent or too low to detect bycatch, or no estimate generated; tbd= to be determined
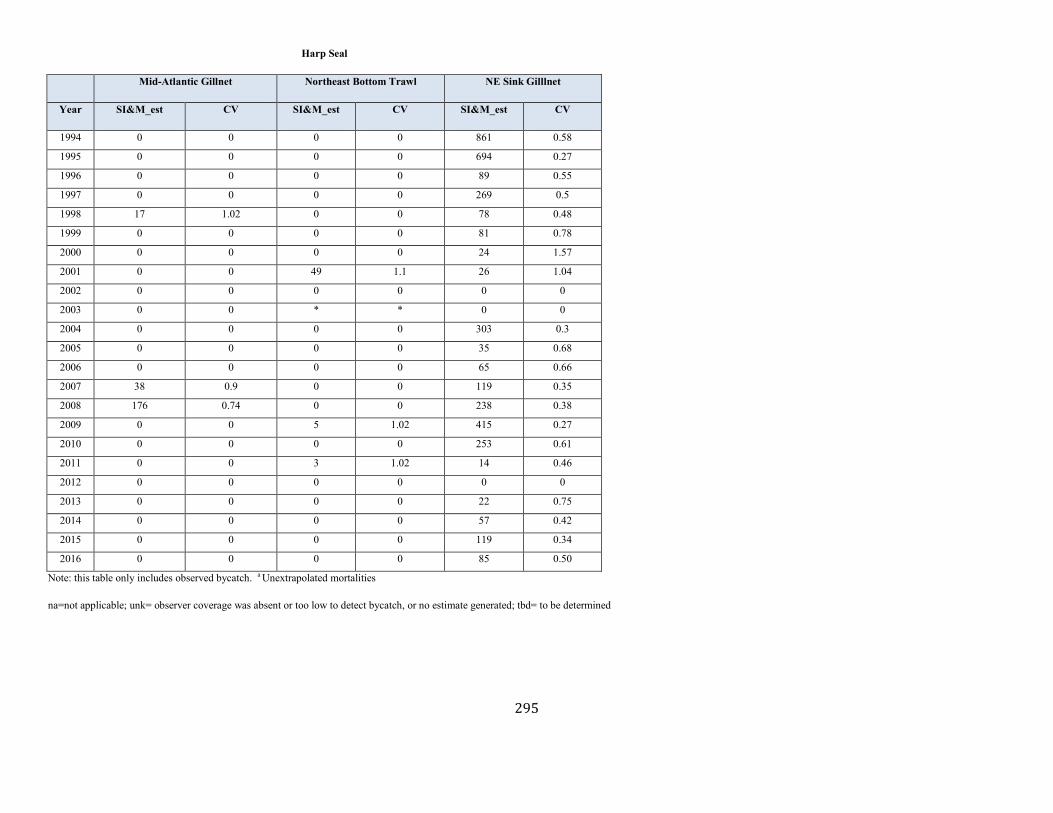
295
Harp Seal
Mid-Atlantic Gillnet Northeast Bottom Trawl NE Sink Gilllnet
Year SI&M_est CV SI&M_est CV SI&M_est CV
1994 0 0 0 0 861 0.58
1995 0 0 0 0 694 0.27
1996 0 0 0 0 89 0.55
1997 0 0 0 0 269 0.5
1998 17 1.02 0 0 78 0.48
1999 0 0 0 0 81 0.78
2000 0 0 0 0 24 1.57
2001 0 0 49 1.1 26 1.04
2002 0 0 0 0 0 0
2003 0 0 * * 0 0
2004 0 0 0 0 303 0.3
2005 0 0 0 0 35 0.68
2006 0 0 0 0 65 0.66
2007 38 0.9 0 0 119 0.35
2008 176 0.74 0 0 238 0.38
2009 0 0 5 1.02 415 0.27
2010 0 0 0 0 253 0.61
2011 0 0 3 1.02 14 0.46
2012 0 0 0 0 0 0
2013 0 0 0 0 22 0.75
2014 0 0 0 0 57 0.42
2015 0 0 0 0 119 0.34
2016 0 0 0 0 85 0.50
Note: this table only includes observed bycatch. a Unextrapolated mortalities
na=not applicable; unk= observer coverage was absent or too low to detect bycatch, or no estimate generated; tbd= to be determined
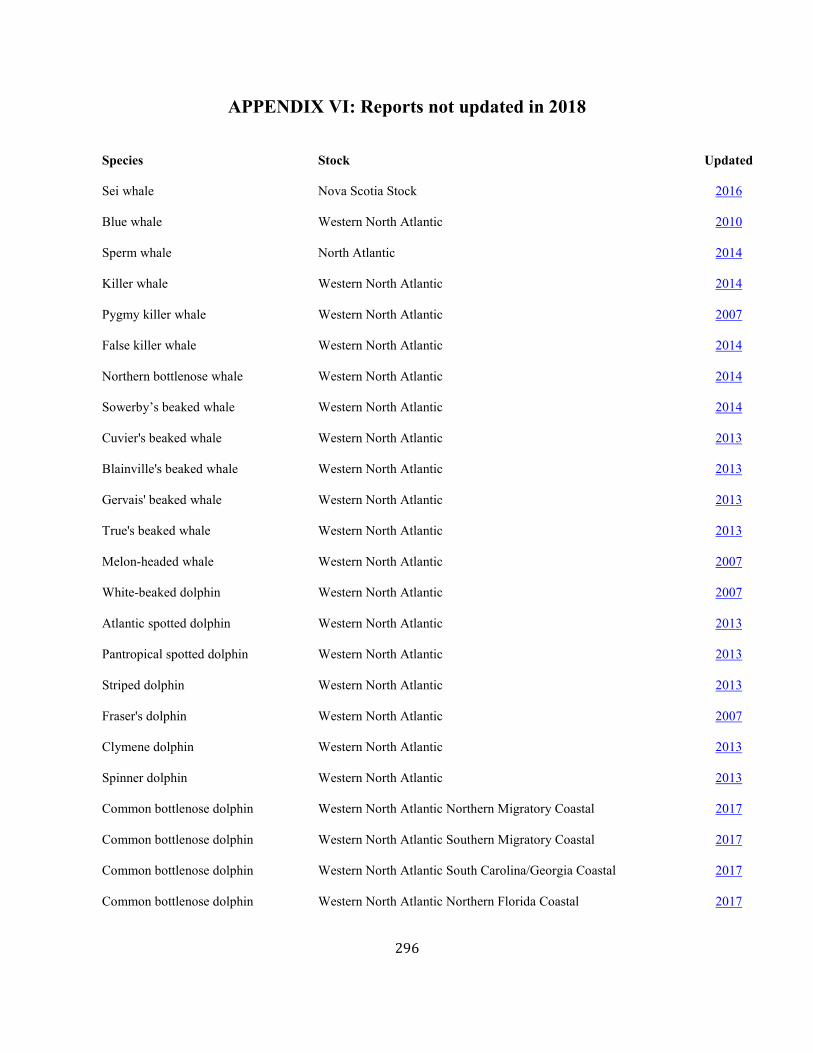
296
APPENDIX VI: Reports not updated in 2018
Species Stock Updated
Sei whale Nova Scotia Stock 2016
Blue whale Western North Atlantic 2010
Sperm whale North Atlantic 2014
Killer whale Western North Atlantic 2014
Pygmy killer whale Western North Atlantic 2007
False killer whale Western North Atlantic 2014
Northern bottlenose whale Western North Atlantic 2014
Sowerby’s beaked whale Western North Atlantic 2014
Cuvier's beaked whale Western North Atlantic 2013
Blainville's beaked whale Western North Atlantic 2013
Gervais' beaked whale Western North Atlantic 2013
True's beaked whale Western North Atlantic 2013
Melon-headed whale Western North Atlantic 2007
White-beaked dolphin Western North Atlantic 2007
Atlantic spotted dolphin Western North Atlantic 2013
Pantropical spotted dolphin Western North Atlantic 2013
Striped dolphin Western North Atlantic 2013
Fraser's dolphin Western North Atlantic 2007
Clymene dolphin Western North Atlantic 2013
Spinner dolphin Western North Atlantic 2013
Common bottlenose dolphin Western North Atlantic Northern Migratory Coastal 2017
Common bottlenose dolphin Western North Atlantic Southern Migratory Coastal 2017
Common bottlenose dolphin Western North Atlantic South Carolina/Georgia Coastal 2017
Common bottlenose dolphin Western North Atlantic Northern Florida Coastal 2017
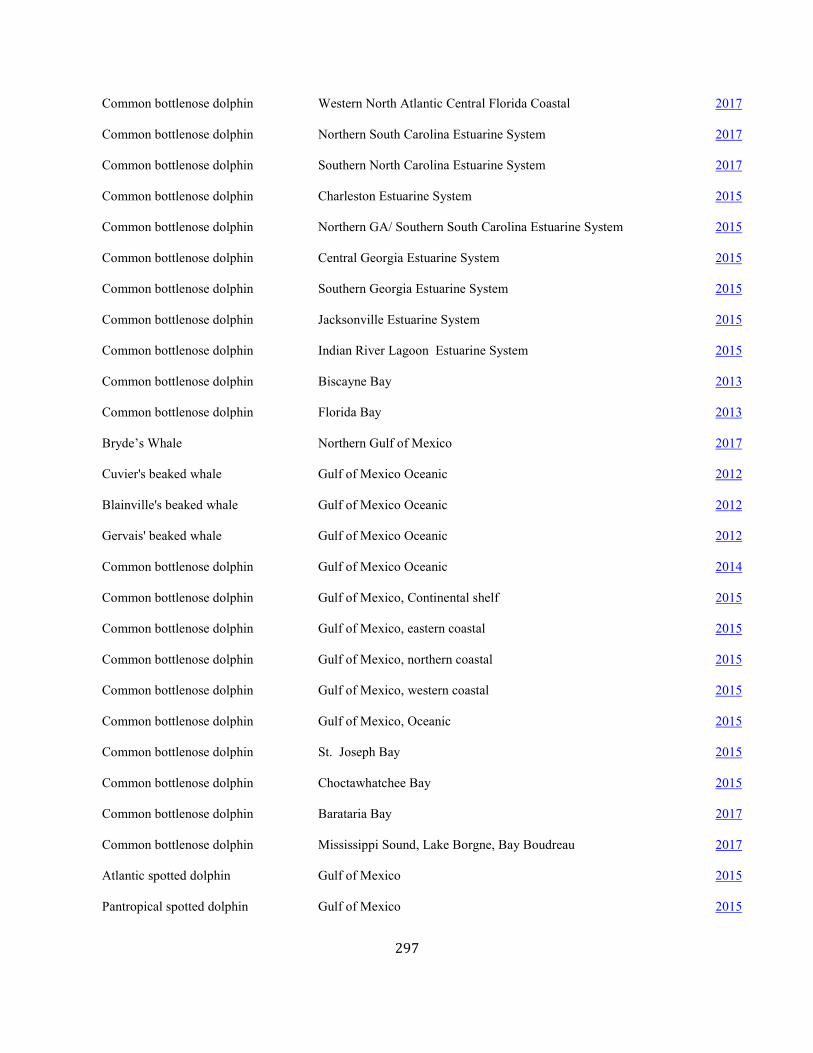
297
Common bottlenose dolphin Western North Atlantic Central Florida Coastal 2017
Common bottlenose dolphin Northern South Carolina Estuarine System 2017
Common bottlenose dolphin Southern North Carolina Estuarine System 2017
Common bottlenose dolphin Charleston Estuarine System 2015
Common bottlenose dolphin Northern GA/ Southern South Carolina Estuarine System 2015
Common bottlenose dolphin Central Georgia Estuarine System 2015
Common bottlenose dolphin Southern Georgia Estuarine System 2015
Common bottlenose dolphin Jacksonville Estuarine System 2015
Common bottlenose dolphin Indian River Lagoon Estuarine System 2015
Common bottlenose dolphin Biscayne Bay 2013
Common bottlenose dolphin Florida Bay 2013
Bryde’s Whale Northern Gulf of Mexico 2017
Cuvier's beaked whale Gulf of Mexico Oceanic 2012
Blainville's beaked whale Gulf of Mexico Oceanic 2012
Gervais' beaked whale Gulf of Mexico Oceanic 2012
Common bottlenose dolphin Gulf of Mexico Oceanic 2014
Common bottlenose dolphin Gulf of Mexico, Continental shelf 2015
Common bottlenose dolphin Gulf of Mexico, eastern coastal 2015
Common bottlenose dolphin Gulf of Mexico, northern coastal 2015
Common bottlenose dolphin Gulf of Mexico, western coastal 2015
Common bottlenose dolphin Gulf of Mexico, Oceanic 2015
Common bottlenose dolphin St. Joseph Bay 2015
Common bottlenose dolphin Choctawhatchee Bay 2015
Common bottlenose dolphin Barataria Bay 2017
Common bottlenose dolphin Mississippi Sound, Lake Borgne, Bay Boudreau 2017
Atlantic spotted dolphin Gulf of Mexico 2015
Pantropical spotted dolphin Gulf of Mexico 2015

298
Rough-toothed dolphin Gulf of Mexico (Outer continental shelf and Oceanic) 2016
Clymene dolphin Gulf of Mexico Oceanic 2012
Fraser's dolphin Gulf of Mexico Oceanic 2012
Killer whale Gulf of Mexico Oceanic 2012
False killer whale Gulf of Mexico Oceanic 2012
Pygmy killer whale Gulf of Mexico Oceanic 2012
Dwarf sperm whale Gulf of Mexico Oceanic 2012
Pygmy sperm whale Gulf of Mexico Oceanic 2012
Melon-headed whale Gulf of Mexico Oceanic 2012
Risso’s dolphin Gulf of Mexico 2015
Pilot whale, short-finned Gulf of Mexico 2015
Sperm whale Gulf of Mexico 2015
Sperm whale Puerto Rico and US Virgin Islands stock 2010
Common bottlenose dolphin Puerto Rico and US Virgin Islands stock 2011
Cuvier's beaked whale Puerto Rico and US Virgin Islands stock 2011
Pilot whale, short-finned Puerto Rico and US Virgin Islands stock 2011
Spinner dolphin Puerto Rico and US Virgin Islands stock 2011
Atlantic spotted dolphin Puerto Rico and US Virgin Islands stock 2011
Procedures for Issuing Manuscripts in the Northeast Fisheries Science Center Reference Document (CRD) Series
CLEARANCE All manuscripts submitted for issuance as CRDs must have cleared the NEFSC’s manuscript/abstract/webpage review process. If any author is not a federal employee, he/she will be required to sign an “NEFSC Release-of-Copyright Form.” If your manuscript includes material from another work which has been copyrighted, then you will need to work with the NEFSC’s Editorial Office to arrange for permission to use that material by securing release signatures on the “NEFSC Use-of-Copyrighted-Work Permission Form.” For more information, NEFSC authors should see the NEFSC’s online publication policy manual, “Manuscript/abstract/webpage preparation, review, and dissemination: NEFSC author’s guide to policy, process, and procedure,” located in the Publications/Manuscript Review section of the NEFSC intranet page. ORGANIZATION Manuscripts must have an abstract and table of contents, and (if applicable) lists of figures and tables. As much as possible, use traditional scientific manuscript organization for sections: “Introduction,” “Study Area” and/or “Experimental Apparatus,” “Methods,” “Results,” “Discussion,” “Conclusions,” “Acknowledgments,” and “Literature/References Cited.” STYLE The CRD series is obligated to conform with the style contained in the current edition of the United States Government Printing Office Style Manual. That style manual is silent on many aspects of scientific manuscripts. The CRD series relies more on the CSE Style Manual. Manuscripts should be prepared to conform with these style manuals. The CRD series uses the American Fisheries Society’s guides to names of fishes, mollusks, and decapod crustaceans, the Society for Marine Mammalogy’s guide to names of marine
mammals, the Biosciences Information Service’s guide to serial title abbreviations, and the ISO’s (International Standardization Organization) guide to statistical terms. For in-text citation, use the name-date system. A special effort should be made to ensure that all necessary bibliographic information is included in the list of cited works. Personal communications must include date, full name, and full mailing address of the contact. PREPARATION Once your document has cleared the review process, the Editorial Office will contact you with publication needs – for example, revised text (if necessary) and separate digital figures and tables if they are embedded in the document. Materials may be submitted to the Editorial Office as email attachments or intranet downloads. Text files should be in Microsoft Word, tables may be in Word or Excel, and graphics files may be in a variety of formats (JPG, GIF, Excel, PowerPoint, etc.). PRODUCTION AND DISTRIBUTION The Editorial Office will perform a copy-edit of the document and may request further revisions. The Editorial Office will develop the inside and outside front covers, the inside and outside back covers, and the title and bibliographic control pages of the document. Once the CRD is ready, the Editorial Office will contact you to review it and submit corrections or changes before the document is posted online. A number of organizations and individuals in the Northeast Region will be notified by e-mail of the availability of the document online.

Procedures for Issuing Manuscripts in the
Northeast Fisheries Science Center Reference Document (CRD) Series The mission of NOAA’s National Marine Fisheries Service (NMFS) is “stewardship of living marine resources for the benefit of the nation through their science-based conservation and management and promotion of the health of their environment.” As the research arm of the NMFS’s Northeast Region, the Northeast Fisheries Science Center (NEFSC) supports the NMFS mission by “conducting ecosystem-based research and assessments of living marine resources, with a focus on the Northeast Shelf, to promote the recovery and long-term sustainability of these resources and to generate social and economic opportunities and benefits from their use.” Results of NEFSC research are largely reported in primary scientific media (e.g., anonymously-peer-reviewed scientific journals). However, to assist itself in providing data, information, and advice to its constituents, the NEFSC occasionally releases its results in its own media. Currently, there are three such media: NOAA Technical Memorandum NMFS-NE -- This series is issued irregularly. The series typically includes: data reports of long-term field or lab studies of important species or habitats; synthesis reports for important species or habitats; annual reports of overall assessment or monitoring programs; manuals describing program-wide surveying or experimental techniques; literature surveys of important species or habitat topics; proceedings and collected papers of scientific meetings; and indexed and/or annotated bibliographies. All issues receive internal scientific review and most issues receive technical and copy editing. Northeast Fisheries Science Center Reference Document -- This series is issued irregularly. The series typically includes: data reports on field and lab studies; progress reports on experiments, monitoring, and assessments; background papers for, collected abstracts of, and/or summary reports of scientific meetings; and simple bibliographies. Issues receive internal scientific review and most issues receive copy editing. TO OBTAIN A COPY of a NOAA Technical Memorandum NMFS-NE or a Northeast Fisheries Science Center Reference Document, either contact the NEFSC Editorial Office (166 Water St., Woods Hole, MA 02543-1026; 508-495-2350) or consult the NEFSC webpage on “Reports and Publications” (http://www.nefsc.noaa.gov/publications/).
Copyright © 2022 FDOKUMEN