Detection of zero-day attacks: An unsupervised port-based ...
20
HAL Id: hal-02889708 https://hal.archives-ouvertes.fr/hal-02889708 Submitted on 15 Jul 2020 HAL is a multi-disciplinary open access archive for the deposit and dissemination of sci- entific research documents, whether they are pub- lished or not. The documents may come from teaching and research institutions in France or abroad, or from public or private research centers. L’archive ouverte pluridisciplinaire HAL, est destinée au dépôt et à la diffusion de documents scientifiques de niveau recherche, publiés ou non, émanant des établissements d’enseignement et de recherche français ou étrangers, des laboratoires publics ou privés. Detection of zero-day attacks: An unsupervised port-based approach Agathe Blaise, Mathieu Bouet, Vania Conan, Stefano Secci To cite this version: Agathe Blaise, Mathieu Bouet, Vania Conan, Stefano Secci. Detection of zero-day attacks: An unsupervised port-based approach. Computer Networks, Elsevier, 2020, 180, pp.107391. 10.1016/j.comnet.2020.107391. hal-02889708
-
Upload
khangminh22 -
Category
Documents
-
view
2 -
download
0
Transcript of Detection of zero-day attacks: An unsupervised port-based ...
HAL Id: hal-02889708https://hal.archives-ouvertes.fr/hal-02889708
Submitted on 15 Jul 2020
HAL is a multi-disciplinary open accessarchive for the deposit and dissemination of sci-entific research documents, whether they are pub-lished or not. The documents may come fromteaching and research institutions in France orabroad, or from public or private research centers.
L’archive ouverte pluridisciplinaire HAL, estdestinée au dépôt et à la diffusion de documentsscientifiques de niveau recherche, publiés ou non,émanant des établissements d’enseignement et derecherche français ou étrangers, des laboratoirespublics ou privés.
Detection of zero-day attacks: An unsupervisedport-based approach
Agathe Blaise, Mathieu Bouet, Vania Conan, Stefano Secci
To cite this version:Agathe Blaise, Mathieu Bouet, Vania Conan, Stefano Secci. Detection of zero-day attacks:An unsupervised port-based approach. Computer Networks, Elsevier, 2020, 180, pp.107391.�10.1016/j.comnet.2020.107391�. �hal-02889708�
Detection of zero-day attacks: an unsupervised port-based approachI
Agathe Blaisea,b, Mathieu Boueta, Vania Conana, Stefano Seccic
aThales, Gennevillers, FrancebSorbonne Université, CNRS LIP6, Paris, France
cCnam, Cedric, 75003 Paris, France
Abstract
Last years have witnessed more and more DDoS attacks towards high-profile websites, as the Mirai botnet attack onSeptember 2016, or more recently the memcached attack on March 2018, this time with no botnet required. These twooutbreaks were not detected nor mitigated during their spreading, but only at the time they happened. Such attacksare generally preceded by several stages, including infection of hosts or device fingerprinting; being able to capture thisactivity would allow their early detection. In this paper, we propose a technique for the early detection of emergingbotnets and newly exploited vulnerabilities, which consists in (i) splitting the detection process over different networksegments and retaining only distributed anomalies, (ii) monitoring at the port-level, with a simple yet efficient change-detection algorithm based on a modified Z-score measure. We argue how our technique, named Split-and-Merge, canensure the detection of large-scale attacks and drastically reduce false positives. We apply the method on two datasets:the MAWI dataset, which provides daily traffic traces of a transpacific backbone link, and the UCSD Network Telescopedataset which contains unsolicited traffic mainly coming from botnet scans. The assumption of a normal distribution –for which the Z-score computation makes sense – is verified through empirical measures. We also show how the solutiongenerates very few alerts; an extensive evaluation on the last three years allows identifying major attacks (includingMirai and memcached) that current Intrusion Detection Systems (IDSs) have not seen. Finally, we classify detectedknown and unknown anomalies to give additional insights about them.
1. Introduction
Back in September 2016, the Mirai botnet [2] struckthe internet with a massive distributed denial of service(DDoS) attack. During several months, it spread slowlyand reunited nearby 50,000 bots distributed over variousparts of the internet, without being noticed. More recently,a record-breaking DDoS attack hit Github on February2018 with a new amplification attack vector: UDP-basedmemcached traffic [1]. The caching system is supposedto be used internally, but sometimes runs on servers ex-posed without any authentication protection; several dayslater, most memcached servers have been patched, makingthe attack not efficient anymore [50]. Actually, malwarestargeting Internet-of-Things (IoT) devices and misconfig-ured servers are responsible for many Distributed Denial-of-Service (DDoS) attacks [53]. Detecting these botnetsand exploited vulnerabilities during their spreading couldavoid many harms. There is thus an urgent need to de-tect this kind of threats as soon as possible, and currentanomaly detection tools appear deficient in this respect.
IA preliminary version of this paper has been presented atIFIP/IEEE IM 2019 [7].
Email addresses: [email protected] (Agathe Blaise),[email protected] (Mathieu Bouet),[email protected] (Vania Conan),[email protected] (Stefano Secci)
Ensuring cyber-security in networks, Intrusion Detec-tion Systems (IDSs) monitor network traffic for maliciousactivities and related threats. However, as a matter offact most botnets go under the radars for three reasons:(i) Current IDSs work at different traffic granularities, e.g.,flow, host or packet. However, they miss global changes onapplication ports that are involved during the propagationof botnets. Ports can be scanned to fingerprint the targetmachine, to exploit known vulnerabilities, or to communi-cate with a Command-and-Control (C&C) server [6]. Thesole common denominator for a botnet coming from verydistinct sources and targeting lots of hosts is the port itscans. However, an IDS working on IP addresses would beunable to notice the anomalous port. (ii) Most IDSs workon small variations of traffic, generally using time-slidingwindows of several seconds. Therefore, they cannot buildlong-term profiles per port and detect major changes intheir usage. (iii) IDSs are usually deployed at a singlepoint in the network, while ISP-scale attacks are only vis-ible by looking at a holistic view of a wide area network.
In this paper, we propose an anomaly detection tech-nique that spots main changes in the usage of a single portto identify botnets. Intuitively, the most obvious way toidentify it is to observe a sudden rise in traffic towardsa port. However, this may not be sufficient as it can bea well-known vulnerable port, already massively scanned.For example, before the Mirai attack, many TCP SYN
Preprint submitted to Elsevier July 15, 2020
scans targeted the Telnet port whose vulnerabilities werealready known and exploited. Then, when the Mirai attackwas actually hitting, one could not observe an increase inthe number of scans targeting this port. Our goal is todetect early stealthy changes in the scans behavior, as anincrease in the number of distinct attackers (i.e., sourceIP addresses) or an increase in port spoofing, to then spotthem as unknown botnets or newly exploited vulnerabili-ties, even on ports already scanned before.
In our method, we use features representing particularport usages; large packets batches picked at a frequencyof several days enable to profile the evolution of featuresover time, then statistical measures can spot anomaliesin the features time-series. A port-based approach maygenerate a large number of alarms, as for instance eachephemeral port used in a arbitrary manner would producean anomaly. Therefore, we adopt a collaborative schemeto ensure that changes in one port are distributed and arenot due to random or localized traffic variations. In ourapproach, called Split-and-Merge, local detection modules,geographically split in the network, collect traffic and sendanomalies to a central controller in charge of aggregatingthem, like a Collaborative IDS (CIDS) [45] would do (Fig-ure 1b). The number of false positives can so be signifi-cantly reduced as only anomalies detected in several placesare taken into consideration. Our contributions differ fromexisting botnet’s detection approaches given the followingreasons. First, it targets long-term anomaly detection en-abling to detect major changes in the use of ports, andthus underlying botnets. As a matter of fact, current ap-proaches for botnets’ detection [3, 9, 12, 15, 19, 22, 24, 26,38, 44–46, 48, 54] focus on real-time intrusions and maymiss stealthy changes visible at a several days scale. Sec-ond, it focuses on destination ports, compared to otherapproaches [3, 9, 12, 15, 19, 22, 24, 44–46, 48, 54] aggre-gating packets per flow or IP address, which thus are notable to detect scans coming from very distinct source IPaddresses and targeting a large variety of destination IPaddresses. Third, it leverages on several detection modulesgeographically split in the network, in order to reduce thenumber of false positives. While most IDSs are localized ata single vantage point [9, 15, 20, 22, 24, 26, 38, 46, 48, 54],we explore a collaborative IDS approach only marginallyadopted at the state of the art [3, 12, 19, 44, 45]. Finally,its features are computed over diversity indices, packetsize and TCP flags, using a change-point detection system,which is not done in [3, 9, 12, 15, 19, 20, 22, 24, 26, 38, 44–46, 54]..
For our evaluation, we use the MAWI dataset [31] whichprovides daily traces of a transpacific backbone link. Thedataset is restricted to a single Internet Service Provider(ISP), hence corresponds to what could be used at theISP-level. Differently than the common approach thatuses real traces to generate background traffic, we usethe MAWI traces as they are, with the aim at detectingreal attacks from it, providing a better knowledge of thedataset at the same time. We also use the UCSD Network
Telescope dataset which consists of a globally routed, butlightly utilized /8 network prefix. Inbound traffic to non-existent machines is unsolicited and results from a widerange of events, including misconfiguration, scanning ofaddress space by attackers or malware looking for vul-nerable targets and backscatter from randomly spoofeddenial-of-service attacks. This way, we are able to comparethe anomalies found in both datasets. We present the in-trusion detection results against known attacks arisen thelast three years, not detected by the MAWILab detectionalgorithm [18], and we show that we can detect some un-known anomalies as well; in order to classify anomalies, weobserve the simultaneous evolutions of features. We ex-perimentally show that our algorithm greatly reduces thenumber of false positives compared to a single IDS run-ning on the whole dataset. For the sake of reproducibilityand further research, our source code is publicly availableat [21].
This paper is organized as follows. Section 2 surveysthe related work. Section 3 presents our solution detectingdistributed changes in port usages, along with the analy-sis of its complexity. In Section 4, we present results fromnumerical evaluation, highlighting the benefits Split-and-Merge can grant in terms of false detection rate and de-tection accuracy, and also proposing a classification of thenoticed anomalies. Finally, Section 6 concludes the paper.
2. Related work
In this section, we present intrusion detection method-ologies and review related work.
2.1. Intrusion detection methodologiesMany algorithms are proposed in the literature for net-
work intrusion detection [5]. We can classify them in twomain families: knowledge-based and anomaly-based tech-niques.
Knowledge-based (or signature-based) solutions suchas Snort [13] and Bro [39] rely on a signature database tofind attacks that match given patterns, such as maliciousbyte sequences or known malware signatures. Up to now,most companies rely on signature-based IDSs as they areexpressive and understandable by network administrators.Nevertheless, they are not able to detect zero-day attacks,i.e., attacks exploiting unknown vulnerabilities, for whichno patch is available [28]
Anomaly-based approaches attempt to detect zero-dayattacks, in addition to known ones. They model the nor-mal network traffic and qualify an anomaly as a significantdeviation from it, with statistical or machine learning tech-niques. In such a case, we talk about anomalies ratherthan attacks. BotSniffer [22] utilizes statistical methodsto detect C&C botnets, by observing coincident behaviorsamong hosts, like messages to servers, network scan orspam. The authors in [27] observe changes in feature dis-tributions to identify anomalies. Entropy and/or volumeare such metrics used for this purpose.
2
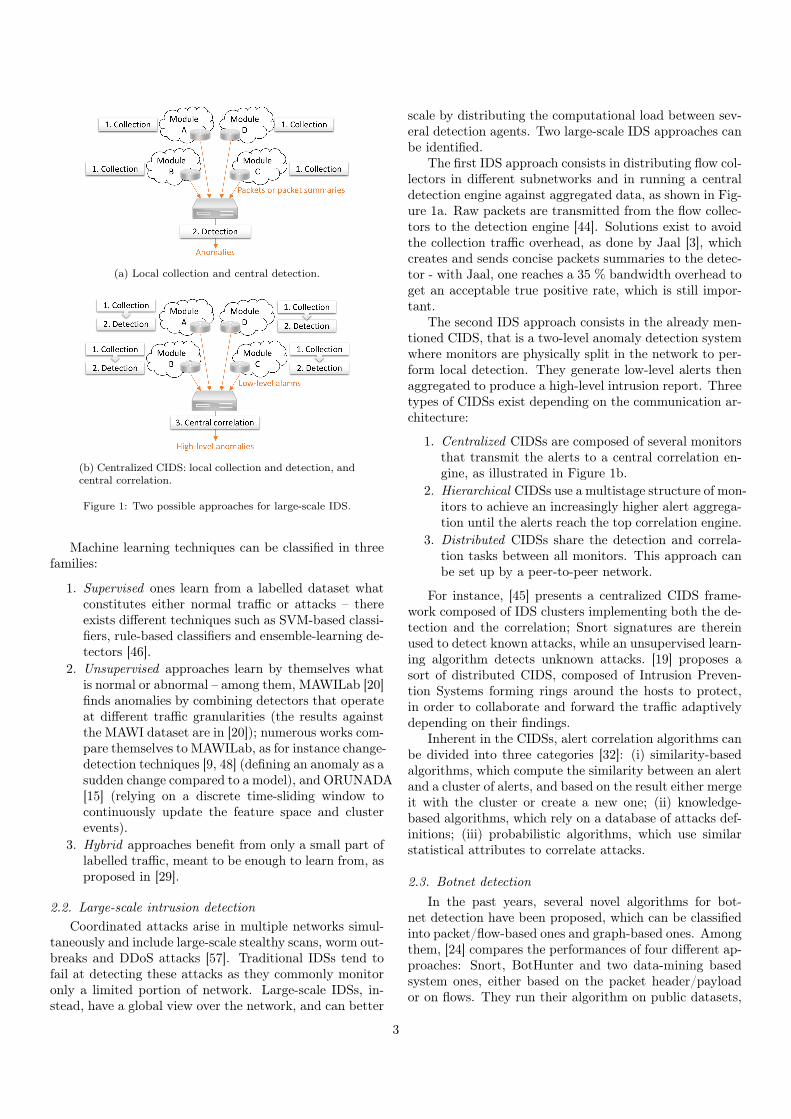
(a) Local collection and central detection.
(b) Centralized CIDS: local collection and detection, andcentral correlation.
Figure 1: Two possible approaches for large-scale IDS.
Machine learning techniques can be classified in threefamilies:
1. Supervised ones learn from a labelled dataset whatconstitutes either normal traffic or attacks – thereexists different techniques such as SVM-based classi-fiers, rule-based classifiers and ensemble-learning de-tectors [46].
2. Unsupervised approaches learn by themselves whatis normal or abnormal – among them, MAWILab [20]finds anomalies by combining detectors that operateat different traffic granularities (the results againstthe MAWI dataset are in [20]); numerous works com-pare themselves to MAWILab, as for instance change-detection techniques [9, 48] (defining an anomaly as asudden change compared to a model), and ORUNADA[15] (relying on a discrete time-sliding window tocontinuously update the feature space and clusterevents).
3. Hybrid approaches benefit from only a small part oflabelled traffic, meant to be enough to learn from, asproposed in [29].
2.2. Large-scale intrusion detectionCoordinated attacks arise in multiple networks simul-
taneously and include large-scale stealthy scans, worm out-breaks and DDoS attacks [57]. Traditional IDSs tend tofail at detecting these attacks as they commonly monitoronly a limited portion of network. Large-scale IDSs, in-stead, have a global view over the network, and can better
scale by distributing the computational load between sev-eral detection agents. Two large-scale IDS approaches canbe identified.
The first IDS approach consists in distributing flow col-lectors in different subnetworks and in running a centraldetection engine against aggregated data, as shown in Fig-ure 1a. Raw packets are transmitted from the flow collec-tors to the detection engine [44]. Solutions exist to avoidthe collection traffic overhead, as done by Jaal [3], whichcreates and sends concise packets summaries to the detec-tor - with Jaal, one reaches a 35 % bandwidth overhead toget an acceptable true positive rate, which is still impor-tant.
The second IDS approach consists in the already men-tioned CIDS, that is a two-level anomaly detection systemwhere monitors are physically split in the network to per-form local detection. They generate low-level alerts thenaggregated to produce a high-level intrusion report. Threetypes of CIDSs exist depending on the communication ar-chitecture:
1. Centralized CIDSs are composed of several monitorsthat transmit the alerts to a central correlation en-gine, as illustrated in Figure 1b.
2. Hierarchical CIDSs use a multistage structure of mon-itors to achieve an increasingly higher alert aggrega-tion until the alerts reach the top correlation engine.
3. Distributed CIDSs share the detection and correla-tion tasks between all monitors. This approach canbe set up by a peer-to-peer network.
For instance, [45] presents a centralized CIDS frame-work composed of IDS clusters implementing both the de-tection and the correlation; Snort signatures are thereinused to detect known attacks, while an unsupervised learn-ing algorithm detects unknown attacks. [19] proposes asort of distributed CIDS, composed of Intrusion Preven-tion Systems forming rings around the hosts to protect,in order to collaborate and forward the traffic adaptivelydepending on their findings.
Inherent in the CIDSs, alert correlation algorithms canbe divided into three categories [32]: (i) similarity-basedalgorithms, which compute the similarity between an alertand a cluster of alerts, and based on the result either mergeit with the cluster or create a new one; (ii) knowledge-based algorithms, which rely on a database of attacks def-initions; (iii) probabilistic algorithms, which use similarstatistical attributes to correlate attacks.
2.3. Botnet detectionIn the past years, several novel algorithms for bot-
net detection have been proposed, which can be classifiedinto packet/flow-based ones and graph-based ones. Amongthem, [24] compares the performances of four different ap-proaches: Snort, BotHunter and two data-mining basedsystem ones, either based on the packet header/payloador on flows. They run their algorithm on public datasets,
3
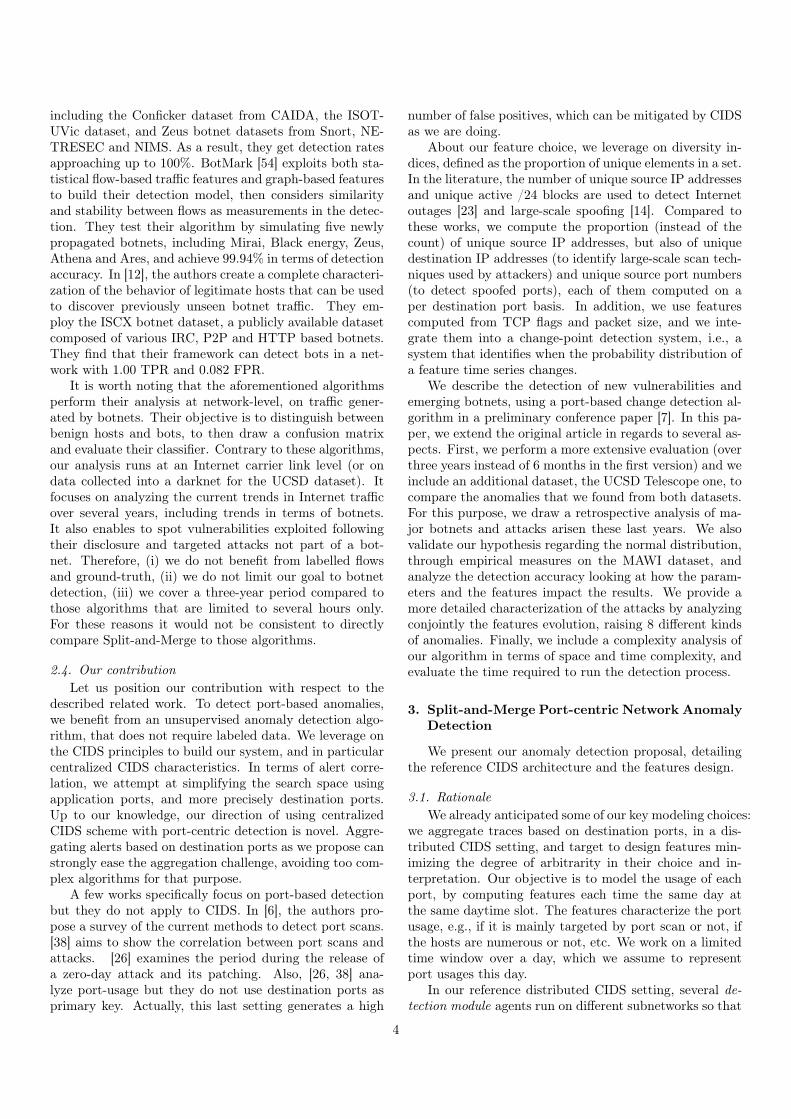
including the Conficker dataset from CAIDA, the ISOT-UVic dataset, and Zeus botnet datasets from Snort, NE-TRESEC and NIMS. As a result, they get detection ratesapproaching up to 100%. BotMark [54] exploits both sta-tistical flow-based traffic features and graph-based featuresto build their detection model, then considers similarityand stability between flows as measurements in the detec-tion. They test their algorithm by simulating five newlypropagated botnets, including Mirai, Black energy, Zeus,Athena and Ares, and achieve 99.94% in terms of detectionaccuracy. In [12], the authors create a complete characteri-zation of the behavior of legitimate hosts that can be usedto discover previously unseen botnet traffic. They em-ploy the ISCX botnet dataset, a publicly available datasetcomposed of various IRC, P2P and HTTP based botnets.They find that their framework can detect bots in a net-work with 1.00 TPR and 0.082 FPR.
It is worth noting that the aforementioned algorithmsperform their analysis at network-level, on traffic gener-ated by botnets. Their objective is to distinguish betweenbenign hosts and bots, to then draw a confusion matrixand evaluate their classifier. Contrary to these algorithms,our analysis runs at an Internet carrier link level (or ondata collected into a darknet for the UCSD dataset). Itfocuses on analyzing the current trends in Internet trafficover several years, including trends in terms of botnets.It also enables to spot vulnerabilities exploited followingtheir disclosure and targeted attacks not part of a bot-net. Therefore, (i) we do not benefit from labelled flowsand ground-truth, (ii) we do not limit our goal to botnetdetection, (iii) we cover a three-year period compared tothose algorithms that are limited to several hours only.For these reasons it would not be consistent to directlycompare Split-and-Merge to those algorithms.
2.4. Our contributionLet us position our contribution with respect to the
described related work. To detect port-based anomalies,we benefit from an unsupervised anomaly detection algo-rithm, that does not require labeled data. We leverage onthe CIDS principles to build our system, and in particularcentralized CIDS characteristics. In terms of alert corre-lation, we attempt at simplifying the search space usingapplication ports, and more precisely destination ports.Up to our knowledge, our direction of using centralizedCIDS scheme with port-centric detection is novel. Aggre-gating alerts based on destination ports as we propose canstrongly ease the aggregation challenge, avoiding too com-plex algorithms for that purpose.
A few works specifically focus on port-based detectionbut they do not apply to CIDS. In [6], the authors pro-pose a survey of the current methods to detect port scans.[38] aims to show the correlation between port scans andattacks. [26] examines the period during the release ofa zero-day attack and its patching. Also, [26, 38] ana-lyze port-usage but they do not use destination ports asprimary key. Actually, this last setting generates a high
number of false positives, which can be mitigated by CIDSas we are doing.
About our feature choice, we leverage on diversity in-dices, defined as the proportion of unique elements in a set.In the literature, the number of unique source IP addressesand unique active /24 blocks are used to detect Internetoutages [23] and large-scale spoofing [14]. Compared tothese works, we compute the proportion (instead of thecount) of unique source IP addresses, but also of uniquedestination IP addresses (to identify large-scale scan tech-niques used by attackers) and unique source port numbers(to detect spoofed ports), each of them computed on aper destination port basis. In addition, we use featurescomputed from TCP flags and packet size, and we inte-grate them into a change-point detection system, i.e., asystem that identifies when the probability distribution ofa feature time series changes.
We describe the detection of new vulnerabilities andemerging botnets, using a port-based change detection al-gorithm in a preliminary conference paper [7]. In this pa-per, we extend the original article in regards to several as-pects. First, we perform a more extensive evaluation (overthree years instead of 6 months in the first version) and weinclude an additional dataset, the UCSD Telescope one, tocompare the anomalies that we found from both datasets.For this purpose, we draw a retrospective analysis of ma-jor botnets and attacks arisen these last years. We alsovalidate our hypothesis regarding the normal distribution,through empirical measures on the MAWI dataset, andanalyze the detection accuracy looking at how the param-eters and the features impact the results. We provide amore detailed characterization of the attacks by analyzingconjointly the features evolution, raising 8 different kindsof anomalies. Finally, we include a complexity analysis ofour algorithm in terms of space and time complexity, andevaluate the time required to run the detection process.
3. Split-and-Merge Port-centric Network AnomalyDetection
We present our anomaly detection proposal, detailingthe reference CIDS architecture and the features design.
3.1. RationaleWe already anticipated some of our key modeling choices:
we aggregate traces based on destination ports, in a dis-tributed CIDS setting, and target to design features min-imizing the degree of arbitrarity in their choice and in-terpretation. Our objective is to model the usage of eachport, by computing features each time the same day atthe same daytime slot. The features characterize the portusage, e.g., if it is mainly targeted by port scan or not, ifthe hosts are numerous or not, etc. We work on a limitedtime window over a day, which we assume to representport usages this day.
In our reference distributed CIDS setting, several de-tection module agents run on different subnetworks so that
4
they can capture subnetwork peculiarities and cover theCIDS network context completely. Based on the time evo-lution of the features of a port, the detection modulesdetect anomalies and report them to a correlation mod-ule. Hereafter we detail the different steps of our detectionmodule logic, as well as the anomaly aggregation logic ofthe correlation module. At each daytime slot, every detec-tion module performs several tasks in a row (each task isthen further detailed in the following subsections).
3.1.1. Data collectionFirst, the detection module collects packets in its scope
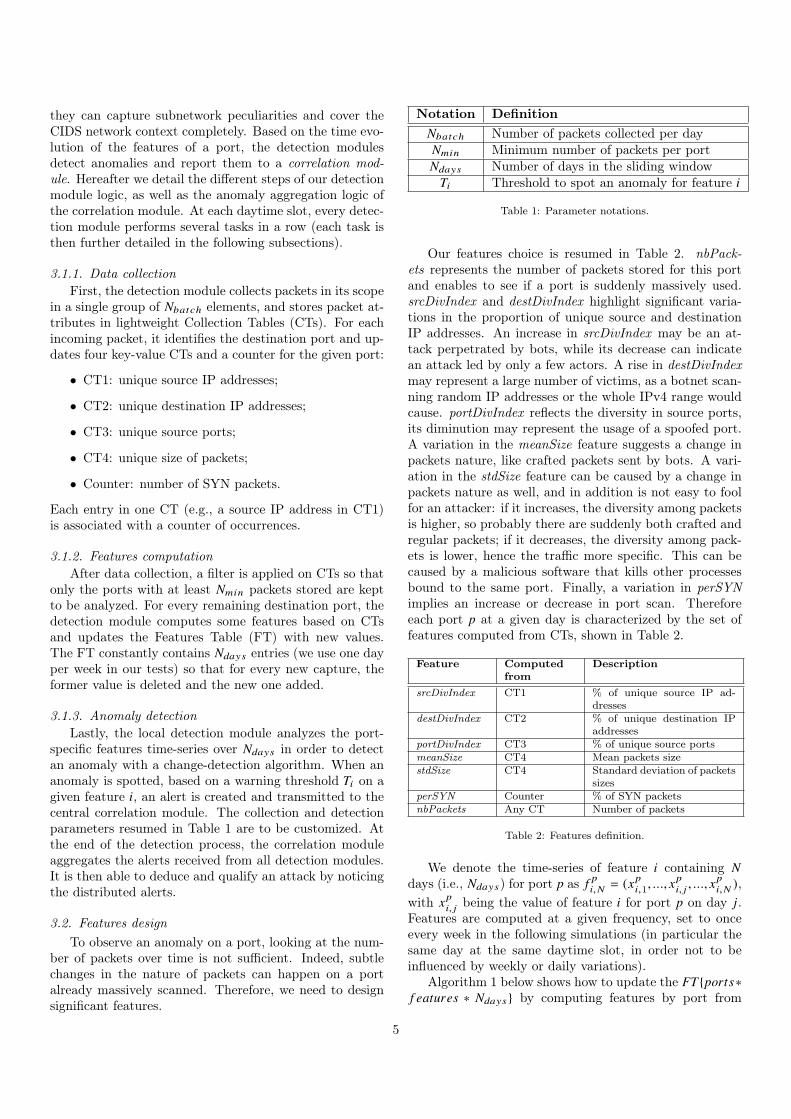
in a single group of Nbatch elements, and stores packet at-tributes in lightweight Collection Tables (CTs). For eachincoming packet, it identifies the destination port and up-dates four key-value CTs and a counter for the given port:
• CT1: unique source IP addresses;
• CT2: unique destination IP addresses;
• CT3: unique source ports;
• CT4: unique size of packets;
• Counter: number of SYN packets.
Each entry in one CT (e.g., a source IP address in CT1)is associated with a counter of occurrences.
3.1.2. Features computationAfter data collection, a filter is applied on CTs so that
only the ports with at least Nmin packets stored are keptto be analyzed. For every remaining destination port, thedetection module computes some features based on CTsand updates the Features Table (FT) with new values.The FT constantly contains Ndays entries (we use one dayper week in our tests) so that for every new capture, theformer value is deleted and the new one added.
3.1.3. Anomaly detectionLastly, the local detection module analyzes the port-
specific features time-series over Ndays in order to detectan anomaly with a change-detection algorithm. When ananomaly is spotted, based on a warning threshold Ti on agiven feature i, an alert is created and transmitted to thecentral correlation module. The collection and detectionparameters resumed in Table 1 are to be customized. Atthe end of the detection process, the correlation moduleaggregates the alerts received from all detection modules.It is then able to deduce and qualify an attack by noticingthe distributed alerts.
3.2. Features designTo observe an anomaly on a port, looking at the num-
ber of packets over time is not sufficient. Indeed, subtlechanges in the nature of packets can happen on a portalready massively scanned. Therefore, we need to designsignificant features.
Notation DefinitionNbatch Number of packets collected per dayNmin Minimum number of packets per portNdays Number of days in the sliding window
Ti Threshold to spot an anomaly for feature i
Table 1: Parameter notations.
Our features choice is resumed in Table 2. nbPack-ets represents the number of packets stored for this portand enables to see if a port is suddenly massively used.srcDivIndex and destDivIndex highlight significant varia-tions in the proportion of unique source and destinationIP addresses. An increase in srcDivIndex may be an at-tack perpetrated by bots, while its decrease can indicatean attack led by only a few actors. A rise in destDivIndexmay represent a large number of victims, as a botnet scan-ning random IP addresses or the whole IPv4 range wouldcause. portDivIndex reflects the diversity in source ports,its diminution may represent the usage of a spoofed port.A variation in the meanSize feature suggests a change inpackets nature, like crafted packets sent by bots. A vari-ation in the stdSize feature can be caused by a change inpackets nature as well, and in addition is not easy to foolfor an attacker: if it increases, the diversity among packetsis higher, so probably there are suddenly both crafted andregular packets; if it decreases, the diversity among pack-ets is lower, hence the traffic more specific. This can becaused by a malicious software that kills other processesbound to the same port. Finally, a variation in perSYNimplies an increase or decrease in port scan. Thereforeeach port p at a given day is characterized by the set offeatures computed from CTs, shown in Table 2.
Feature Computedfrom
Description
srcDivIndex CT1 % of unique source IP ad-dresses
destDivIndex CT2 % of unique destination IPaddresses
portDivIndex CT3 % of unique source portsmeanSize CT4 Mean packets sizestdSize CT4 Standard deviation of packets
sizesperSYN Counter % of SYN packetsnbPackets Any CT Number of packets
Table 2: Features definition.
We denote the time-series of feature i containing Ndays (i.e., Ndays) for port p as f pi,N = (xp
i,1, ..., xpi, j , ..., x
pi,N ),
with xpi, j being the value of feature i for port p on day j.
Features are computed at a given frequency, set to onceevery week in the following simulations (in particular thesame day at the same daytime slot, in order not to beinfluenced by weekly or daily variations).
Algorithm 1 below shows how to update the FT {ports∗f eatures ∗ Ndays } by computing features by port from
5
packet attributes found in CTs.
Algorithm 1 updateFT(CTs, FT, Nmin)
1: Delete first column of FT and shift others2: for all port p ∈ ports do3: // Check condition on the number of packets4: if length(CT1[p]) > Nmin then5: for all att ∈ attributes do6: feature f ← relativeMetric(att) // 1 or 2
features per attribute (e.g., mean and std for packetsize)
7: FT[p][ f ][currentDay] = CT f [p].apply( f )8: return FT
3.3. Local anomaly detectionAssuming a feature is more or less likely to vary (stan-
dard deviation) depending on its type, and usually aroundthe same (mean) value, the normal distribution logicallyquite fits as its distribution. The validity of this assump-tion is assessed later in Section 4.2. We model the time-series f pi,N = (xp
i,1, ..., xpi,N ) over N days as a normal distri-
bution N (µp ,σp2) of mean µp and standard deviation σp
such that:
µp =
N∑j=1
xpi, j and σp =
√√√1N
N∑j=1
(xpi, j − µ
p )2. (1)
The Z-score is a well-known simple statistical-based al-gorithm, commonly used to automatically detect a changein time-series. More precisely, it is the measure of howmany standard deviations below or above the mean a datapoint is. Basically, a Z-score equal to zero means thatthe data point is equal to the mean and the larger theZ-score, the more unusual the value. For the given time-series f pi,N = (xp
i,1, ..., xpi,N ) approximated by a normal dis-
tribution N (µp ,σp2), the Z-score of the new value xp
i,N+1of feature i at time N + 1 is computed as follows:
Z pi,N+1 =
xpi,N+1 − µ
p
σp. (2)
However, the Z-score is computed from the mean, ametric influenced by outliers and especially extreme val-ues. Alternatively, the modified Z-score uses the medianand the median absolute deviation (MAD) from the me-dian, instead of the classical mean and standard deviationrespectively, which makes it outlier-resistant [25].
Given the time-series median f̃ pi,N , the modified Z-scoreM p
i,N+1 of the new value xpi,N+1 of feature i at time N + 1
is computed as:
M pi,N+1 =
0.6745 · (xpi,N+1 − f̃ pi,N )
median(|xpi,N+1 − f̃ pi,N |)
(3)
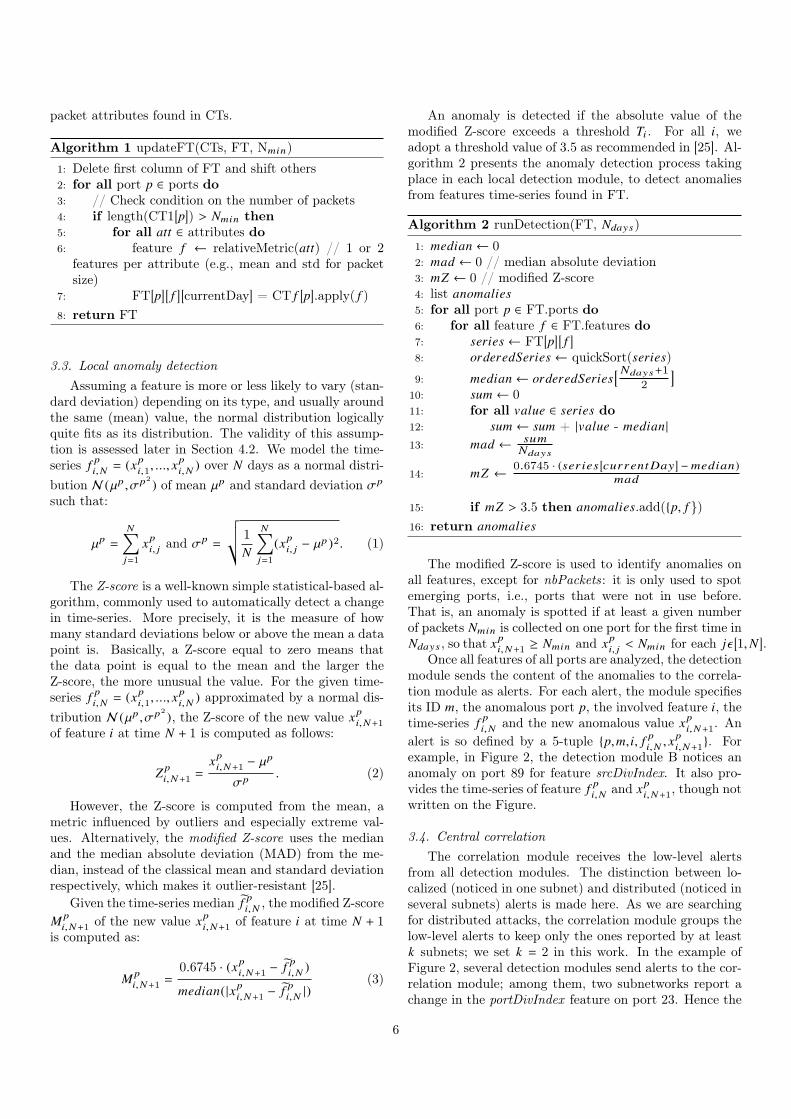
An anomaly is detected if the absolute value of themodified Z-score exceeds a threshold Ti . For all i, weadopt a threshold value of 3.5 as recommended in [25]. Al-gorithm 2 presents the anomaly detection process takingplace in each local detection module, to detect anomaliesfrom features time-series found in FT.
Algorithm 2 runDetection(FT, Ndays)
1: median ← 02: mad ← 0 // median absolute deviation3: mZ ← 0 // modified Z-score4: list anomalies5: for all port p ∈ FT.ports do6: for all feature f ∈ FT.features do7: series ← FT[p][ f ]8: orderedSeries ← quickSort(series)
9: median ← orderedSeries[ Ndays+12 ]
10: sum ← 011: for all value ∈ series do12: sum ← sum + |value - median|13: mad ← sum
Ndays
14: mZ ←0.6745 · (ser ies[currentDay] −median)
mad
15: if mZ > 3.5 then anomalies.add({p, f })16: return anomalies
The modified Z-score is used to identify anomalies onall features, except for nbPackets: it is only used to spotemerging ports, i.e., ports that were not in use before.That is, an anomaly is spotted if at least a given numberof packets Nmin is collected on one port for the first time inNdays , so that xp
i,N+1 ≥ Nmin and xpi, j < Nmin for each jε [1,N ].
Once all features of all ports are analyzed, the detectionmodule sends the content of the anomalies to the correla-tion module as alerts. For each alert, the module specifiesits ID m, the anomalous port p, the involved feature i, thetime-series f pi,N and the new anomalous value xp
i,N+1. Analert is so defined by a 5-tuple {p,m, i, f pi,N , x
pi,N+1}. For
example, in Figure 2, the detection module B notices ananomaly on port 89 for feature srcDivIndex. It also pro-vides the time-series of feature f pi,N and xp
i,N+1, though notwritten on the Figure.
3.4. Central correlationThe correlation module receives the low-level alerts
from all detection modules. The distinction between lo-calized (noticed in one subnet) and distributed (noticed inseveral subnets) alerts is made here. As we are searchingfor distributed attacks, the correlation module groups thelow-level alerts to keep only the ones reported by at leastk subnets; we set k = 2 in this work. In the example ofFigure 2, several detection modules send alerts to the cor-relation module; among them, two subnetworks report achange in the portDivIndex feature on port 23. Hence the
6
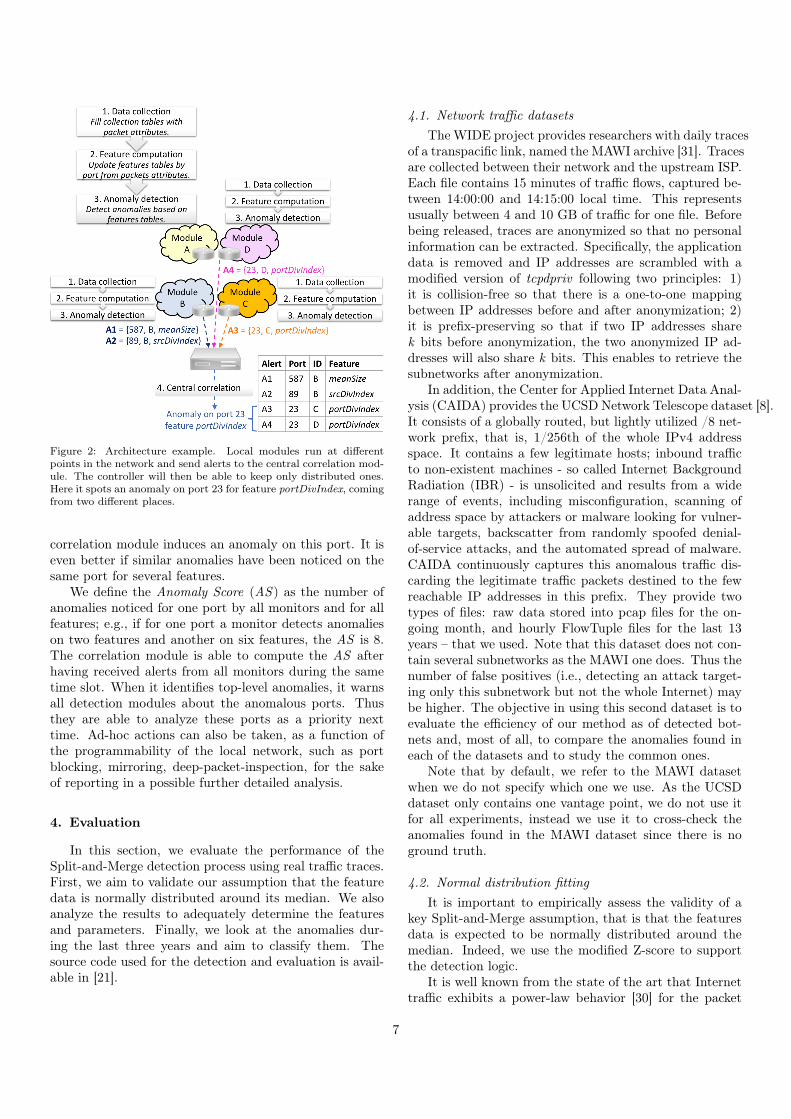
Figure 2: Architecture example. Local modules run at differentpoints in the network and send alerts to the central correlation mod-ule. The controller will then be able to keep only distributed ones.Here it spots an anomaly on port 23 for feature portDivIndex, comingfrom two different places.
correlation module induces an anomaly on this port. It iseven better if similar anomalies have been noticed on thesame port for several features.
We define the Anomaly Score (AS ) as the number ofanomalies noticed for one port by all monitors and for allfeatures; e.g., if for one port a monitor detects anomalieson two features and another on six features, the AS is 8.The correlation module is able to compute the AS afterhaving received alerts from all monitors during the sametime slot. When it identifies top-level anomalies, it warnsall detection modules about the anomalous ports. Thusthey are able to analyze these ports as a priority nexttime. Ad-hoc actions can also be taken, as a function ofthe programmability of the local network, such as portblocking, mirroring, deep-packet-inspection, for the sakeof reporting in a possible further detailed analysis.
4. Evaluation
In this section, we evaluate the performance of theSplit-and-Merge detection process using real traffic traces.First, we aim to validate our assumption that the featuredata is normally distributed around its median. We alsoanalyze the results to adequately determine the featuresand parameters. Finally, we look at the anomalies dur-ing the last three years and aim to classify them. Thesource code used for the detection and evaluation is avail-able in [21].
4.1. Network traffic datasetsTheWIDE project provides researchers with daily traces
of a transpacific link, named the MAWI archive [31]. Tracesare collected between their network and the upstream ISP.Each file contains 15 minutes of traffic flows, captured be-tween 14:00:00 and 14:15:00 local time. This representsusually between 4 and 10 GB of traffic for one file. Beforebeing released, traces are anonymized so that no personalinformation can be extracted. Specifically, the applicationdata is removed and IP addresses are scrambled with amodified version of tcpdpriv following two principles: 1)it is collision-free so that there is a one-to-one mappingbetween IP addresses before and after anonymization; 2)it is prefix-preserving so that if two IP addresses sharek bits before anonymization, the two anonymized IP ad-dresses will also share k bits. This enables to retrieve thesubnetworks after anonymization.
In addition, the Center for Applied Internet Data Anal-ysis (CAIDA) provides the UCSD Network Telescope dataset [8].It consists of a globally routed, but lightly utilized /8 net-work prefix, that is, 1/256th of the whole IPv4 addressspace. It contains a few legitimate hosts; inbound trafficto non-existent machines - so called Internet BackgroundRadiation (IBR) - is unsolicited and results from a widerange of events, including misconfiguration, scanning ofaddress space by attackers or malware looking for vulner-able targets, backscatter from randomly spoofed denial-of-service attacks, and the automated spread of malware.CAIDA continuously captures this anomalous traffic dis-carding the legitimate traffic packets destined to the fewreachable IP addresses in this prefix. They provide twotypes of files: raw data stored into pcap files for the on-going month, and hourly FlowTuple files for the last 13years – that we used. Note that this dataset does not con-tain several subnetworks as the MAWI one does. Thus thenumber of false positives (i.e., detecting an attack target-ing only this subnetwork but not the whole Internet) maybe higher. The objective in using this second dataset is toevaluate the efficiency of our method as of detected bot-nets and, most of all, to compare the anomalies found ineach of the datasets and to study the common ones.
Note that by default, we refer to the MAWI datasetwhen we do not specify which one we use. As the UCSDdataset only contains one vantage point, we do not use itfor all experiments, instead we use it to cross-check theanomalies found in the MAWI dataset since there is noground truth.
4.2. Normal distribution fittingIt is important to empirically assess the validity of a
key Split-and-Merge assumption, that is that the featuresdata is expected to be normally distributed around themedian. Indeed, we use the modified Z-score to supportthe detection logic.
It is well known from the state of the art that Internettraffic exhibits a power-law behavior [30] for the packet
7
(a) Normal distribution basedon mean.
(b) Normal distribution basedon median.
(c) Log-normal distributionbased on mean.
(d) Log-normal distribution basedon median.
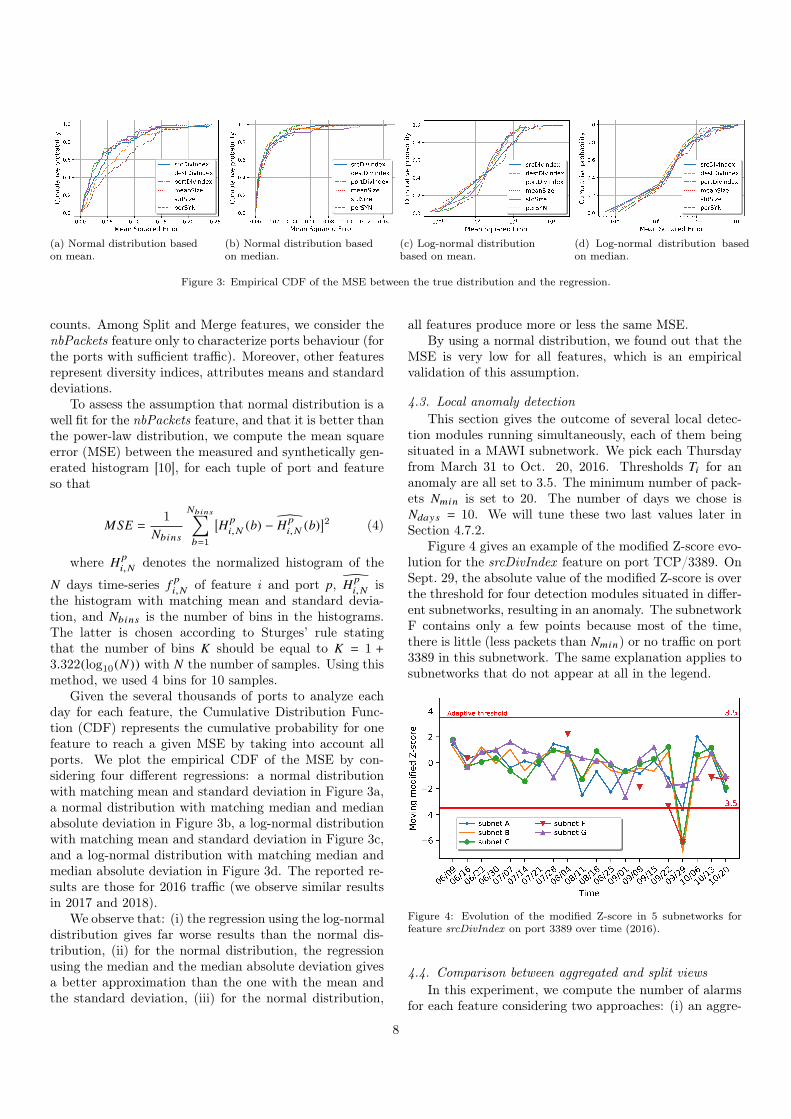
Figure 3: Empirical CDF of the MSE between the true distribution and the regression.
counts. Among Split and Merge features, we consider thenbPackets feature only to characterize ports behaviour (forthe ports with sufficient traffic). Moreover, other featuresrepresent diversity indices, attributes means and standarddeviations.
To assess the assumption that normal distribution is awell fit for the nbPackets feature, and that it is better thanthe power-law distribution, we compute the mean squareerror (MSE) between the measured and synthetically gen-erated histogram [10], for each tuple of port and featureso that
MSE =1
Nbins
Nbins∑b=1
[H pi,N (b) −EH p
i,N (b)]2 (4)
where H pi,N denotes the normalized histogram of the
N days time-series f pi,N of feature i and port p, EH pi,N is
the histogram with matching mean and standard devia-tion, and Nbins is the number of bins in the histograms.The latter is chosen according to Sturges’ rule statingthat the number of bins K should be equal to K = 1 +3.322(log10(N )) with N the number of samples. Using thismethod, we used 4 bins for 10 samples.
Given the several thousands of ports to analyze eachday for each feature, the Cumulative Distribution Func-tion (CDF) represents the cumulative probability for onefeature to reach a given MSE by taking into account allports. We plot the empirical CDF of the MSE by con-sidering four different regressions: a normal distributionwith matching mean and standard deviation in Figure 3a,a normal distribution with matching median and medianabsolute deviation in Figure 3b, a log-normal distributionwith matching mean and standard deviation in Figure 3c,and a log-normal distribution with matching median andmedian absolute deviation in Figure 3d. The reported re-sults are those for 2016 traffic (we observe similar resultsin 2017 and 2018).
We observe that: (i) the regression using the log-normaldistribution gives far worse results than the normal dis-tribution, (ii) for the normal distribution, the regressionusing the median and the median absolute deviation givesa better approximation than the one with the mean andthe standard deviation, (iii) for the normal distribution,
all features produce more or less the same MSE.By using a normal distribution, we found out that the
MSE is very low for all features, which is an empiricalvalidation of this assumption.
4.3. Local anomaly detectionThis section gives the outcome of several local detec-
tion modules running simultaneously, each of them beingsituated in a MAWI subnetwork. We pick each Thursdayfrom March 31 to Oct. 20, 2016. Thresholds Ti for ananomaly are all set to 3.5. The minimum number of pack-ets Nmin is set to 20. The number of days we chose isNdays = 10. We will tune these two last values later inSection 4.7.2.
Figure 4 gives an example of the modified Z-score evo-lution for the srcDivIndex feature on port TCP/3389. OnSept. 29, the absolute value of the modified Z-score is overthe threshold for four detection modules situated in differ-ent subnetworks, resulting in an anomaly. The subnetworkF contains only a few points because most of the time,there is little (less packets than Nmin) or no traffic on port3389 in this subnetwork. The same explanation applies tosubnetworks that do not appear at all in the legend.
Figure 4: Evolution of the modified Z-score in 5 subnetworks forfeature srcDivIndex on port 3389 over time (2016).
4.4. Comparison between aggregated and split viewsIn this experiment, we compute the number of alarms
for each feature considering two approaches: (i) an aggre-
8
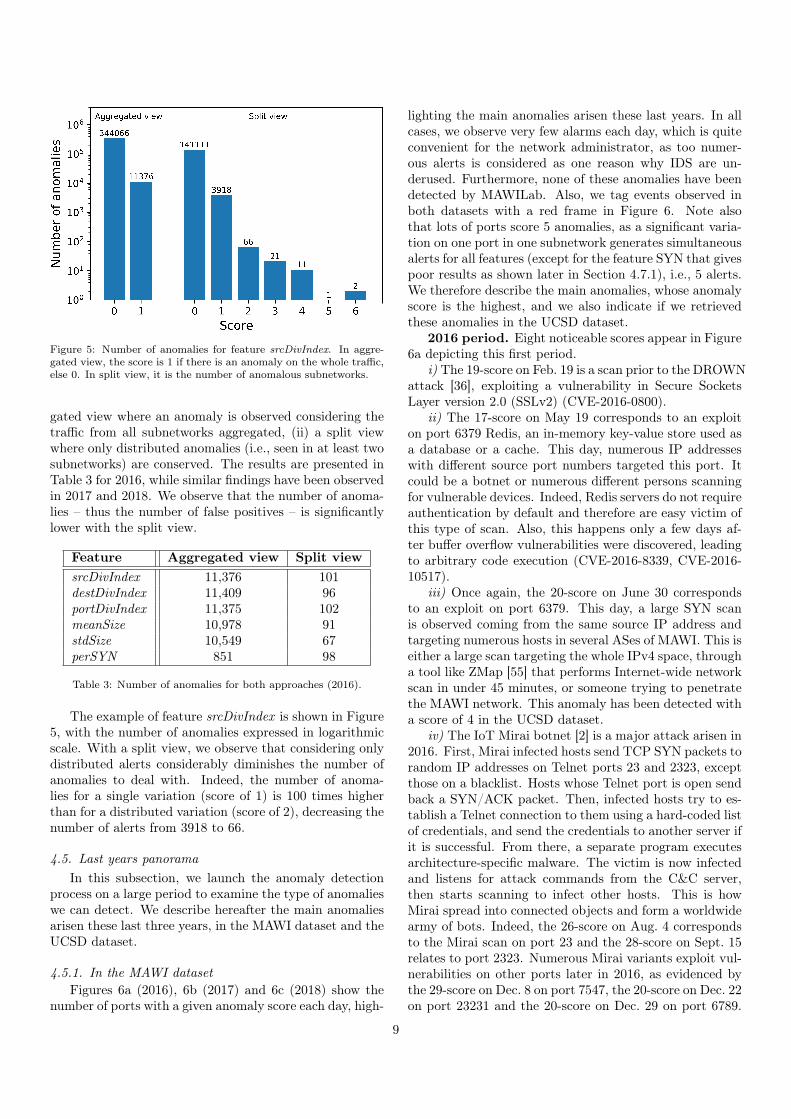
Figure 5: Number of anomalies for feature srcDivIndex. In aggre-gated view, the score is 1 if there is an anomaly on the whole traffic,else 0. In split view, it is the number of anomalous subnetworks.
gated view where an anomaly is observed considering thetraffic from all subnetworks aggregated, (ii) a split viewwhere only distributed anomalies (i.e., seen in at least twosubnetworks) are conserved. The results are presented inTable 3 for 2016, while similar findings have been observedin 2017 and 2018. We observe that the number of anoma-lies – thus the number of false positives – is significantlylower with the split view.
Feature Aggregated view Split viewsrcDivIndex 11,376 101destDivIndex 11,409 96portDivIndex 11,375 102meanSize 10,978 91stdSize 10,549 67perSYN 851 98
Table 3: Number of anomalies for both approaches (2016).
The example of feature srcDivIndex is shown in Figure5, with the number of anomalies expressed in logarithmicscale. With a split view, we observe that considering onlydistributed alerts considerably diminishes the number ofanomalies to deal with. Indeed, the number of anoma-lies for a single variation (score of 1) is 100 times higherthan for a distributed variation (score of 2), decreasing thenumber of alerts from 3918 to 66.
4.5. Last years panoramaIn this subsection, we launch the anomaly detection
process on a large period to examine the type of anomalieswe can detect. We describe hereafter the main anomaliesarisen these last three years, in the MAWI dataset and theUCSD dataset.
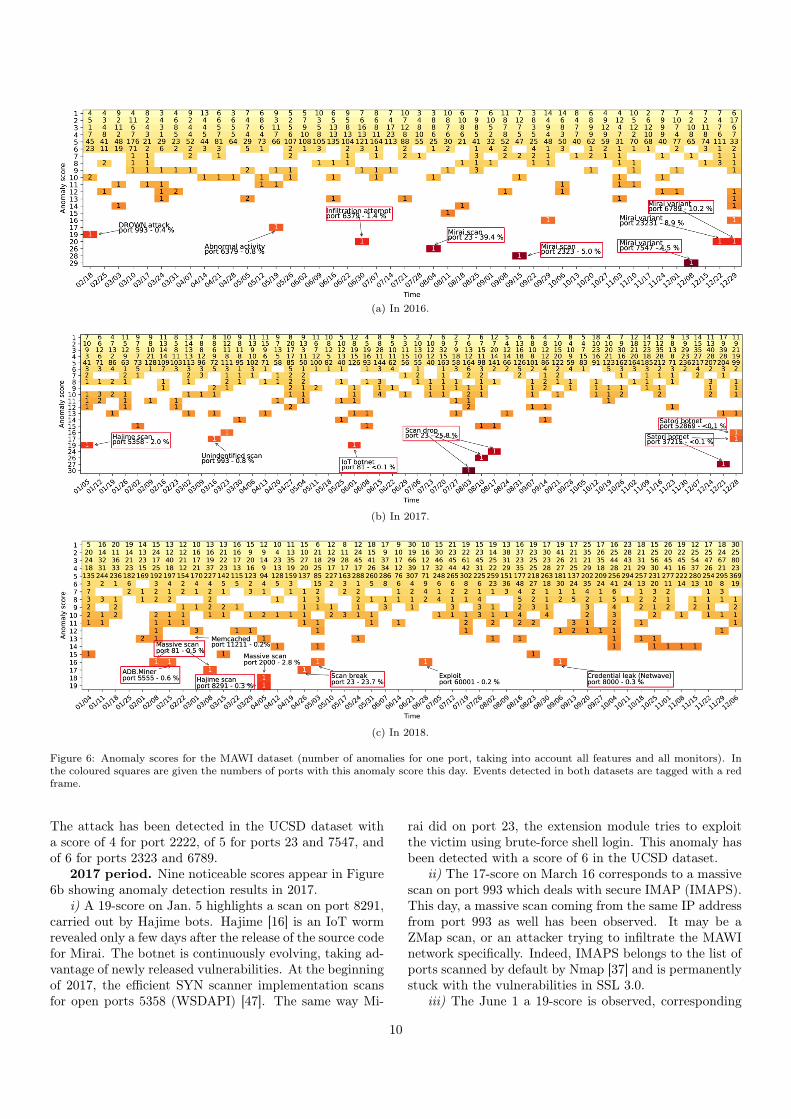
4.5.1. In the MAWI datasetFigures 6a (2016), 6b (2017) and 6c (2018) show the
number of ports with a given anomaly score each day, high-
lighting the main anomalies arisen these last years. In allcases, we observe very few alarms each day, which is quiteconvenient for the network administrator, as too numer-ous alerts is considered as one reason why IDS are un-derused. Furthermore, none of these anomalies have beendetected by MAWILab. Also, we tag events observed inboth datasets with a red frame in Figure 6. Note alsothat lots of ports score 5 anomalies, as a significant varia-tion on one port in one subnetwork generates simultaneousalerts for all features (except for the feature SYN that givespoor results as shown later in Section 4.7.1), i.e., 5 alerts.We therefore describe the main anomalies, whose anomalyscore is the highest, and we also indicate if we retrievedthese anomalies in the UCSD dataset.
2016 period. Eight noticeable scores appear in Figure6a depicting this first period.
i) The 19-score on Feb. 19 is a scan prior to the DROWNattack [36], exploiting a vulnerability in Secure SocketsLayer version 2.0 (SSLv2) (CVE-2016-0800).
ii) The 17-score on May 19 corresponds to an exploiton port 6379 Redis, an in-memory key-value store used asa database or a cache. This day, numerous IP addresseswith different source port numbers targeted this port. Itcould be a botnet or numerous different persons scanningfor vulnerable devices. Indeed, Redis servers do not requireauthentication by default and therefore are easy victim ofthis type of scan. Also, this happens only a few days af-ter buffer overflow vulnerabilities were discovered, leadingto arbitrary code execution (CVE-2016-8339, CVE-2016-10517).
iii) Once again, the 20-score on June 30 correspondsto an exploit on port 6379. This day, a large SYN scanis observed coming from the same source IP address andtargeting numerous hosts in several ASes of MAWI. This iseither a large scan targeting the whole IPv4 space, througha tool like ZMap [55] that performs Internet-wide networkscan in under 45 minutes, or someone trying to penetratethe MAWI network. This anomaly has been detected witha score of 4 in the UCSD dataset.
iv) The IoT Mirai botnet [2] is a major attack arisen in2016. First, Mirai infected hosts send TCP SYN packets torandom IP addresses on Telnet ports 23 and 2323, exceptthose on a blacklist. Hosts whose Telnet port is open sendback a SYN/ACK packet. Then, infected hosts try to es-tablish a Telnet connection to them using a hard-coded listof credentials, and send the credentials to another server ifit is successful. From there, a separate program executesarchitecture-specific malware. The victim is now infectedand listens for attack commands from the C&C server,then starts scanning to infect other hosts. This is howMirai spread into connected objects and form a worldwidearmy of bots. Indeed, the 26-score on Aug. 4 correspondsto the Mirai scan on port 23 and the 28-score on Sept. 15relates to port 2323. Numerous Mirai variants exploit vul-nerabilities on other ports later in 2016, as evidenced bythe 29-score on Dec. 8 on port 7547, the 20-score on Dec. 22on port 23231 and the 20-score on Dec. 29 on port 6789.
9
(a) In 2016.
(b) In 2017.
(c) In 2018.
Figure 6: Anomaly scores for the MAWI dataset (number of anomalies for one port, taking into account all features and all monitors). Inthe coloured squares are given the numbers of ports with this anomaly score this day. Events detected in both datasets are tagged with a redframe.
The attack has been detected in the UCSD dataset witha score of 4 for port 2222, of 5 for ports 23 and 7547, andof 6 for ports 2323 and 6789.
2017 period. Nine noticeable scores appear in Figure6b showing anomaly detection results in 2017.
i) A 19-score on Jan. 5 highlights a scan on port 8291,carried out by Hajime bots. Hajime [16] is an IoT wormrevealed only a few days after the release of the source codefor Mirai. The botnet is continuously evolving, taking ad-vantage of newly released vulnerabilities. At the beginningof 2017, the efficient SYN scanner implementation scansfor open ports 5358 (WSDAPI) [47]. The same way Mi-
rai did on port 23, the extension module tries to exploitthe victim using brute-force shell login. This anomaly hasbeen detected with a score of 6 in the UCSD dataset.
ii) The 17-score on March 16 corresponds to a massivescan on port 993 which deals with secure IMAP (IMAPS).This day, a massive scan coming from the same IP addressfrom port 993 as well has been observed. It may be aZMap scan, or an attacker trying to infiltrate the MAWInetwork specifically. Indeed, IMAPS belongs to the list ofports scanned by default by Nmap [37] and is permanentlystuck with the vulnerabilities in SSL 3.0.
iii) The June 1 a 19-score is observed, corresponding
10
to a new IoT botnet spreading and exploiting vulnera-bility in security cameras [33], several days after the re-searcher Pierre Kim released a vulnerability analysis re-port on GoAhead and other OEM cameras. This anomalyhas been detected with a score of 6 in the UCSD dataset.
iv) The 30-score, 26-score and 24-score, respectively onAug. 3, Aug. 10 and Aug. 17 correspond to a sensible dropin the scan perpetrated by Mirai on port 23. This maybe due to the Internet of Things (IoT) Cybersecurity Im-provement Act of 2017 [52], adopted on Aug. 1, 2017. Thelatter seeks to improve the security of internet-connecteddevices, so that devices do not contain any known secu-rity vulnerabilities and are conceived using standard pro-tocols. It also claims that the eventual patches shouldbe applied even retroactively, which can explain the scandrops. These changes have also been noticed in the UCSDdataset, producing anomalies with scores of 4 and 5.
v) The 27-score on Dec. 21, and 15-score and 16-scoreon Dec. 28 involve ports 37215 and 52869, that receivednumerous scans from the newest version of Satori (a Miraivariant) [34]. These anomalies have been detected in theUCSD dataset with scores of 4 and 5.
2018 period. Nine noticeable scores appear in Fig-ure 6c depicting the 2018 year. Compared to previousyears, large scores are much rarer this time. Indeed, themaximum AS is up to 19, compared to 29 and 30 respec-tively in 2016 and 2017. We can still identify several mainanomalies.
i) On Feb. 8 and March 8, exploits on port 81 are no-ticed. These days, almost the same IP address launchedTCP SYN scans from the same source port number, tar-geting numerous MAWI subnetworks. This may be onceagain an Internet-wide network scan (e.g., by ZMap) or anattacker that targets the MAWI dataset specifically.
ii) The 16-score on Feb. 15 is actually a scan on port5555. It comes from the ADB.Miner botnet, which iden-tifies Android devices with Android Debug Bridge turnedon, to control them and make them execute commands [35].Hence, this day, numerous IP addresses sent SYN pack-ets to various hosts in the MAWI network using differentsource port numbers, as seen for the Mirai botnet in 2016.This anomaly has been detected in the UCSD dataset witha score of 4.
iii) The 12-score on March 1 corresponds to the mem-cached attack on port 11211. Prior to the huge DDoSattack towards Github, large TCP SYN scans across theworld targeted port 11211 in order to identify memcachedservers exposed without any authentication protection (CVE-2018-1000115). The anomaly observed this day is a markof this large scan. These changes have also been noticedin the UCSD dataset, producing anomalies with scores of4 and 5.
iv) The 18-score on Apr. 5 corresponds to a large scanon port 2000 coming from various source IP addresses withdifferent source port numbers, and targeting many IP ad-dresses from several ASes in the MAWI dataset. CiscoSkinny Call Control Protocol (SCCP) is often bound to
this port, allowing terminal control for voice over IP. Thisscan is symptomatic of an IoT botnet, willing to exploitthe few vulnerabilities disclosed last years for this protocol,and maybe IoTroop [11].
v) The 19-score on Apr. 5 highlights a scan on port8291, carried out by Hajime bots. On May 2018, it ex-ploits a vulnerability (CVE-2018-7445) published 13 daysbefore. First, infected hosts scan random IP addresseson port 8291 to identify MikroTik devices. Once the bothas identified one device, it tries to infect it with a pub-lic exploit package sent via port 80 or an alternate port.If successful, the device infects new victims in turn un-der the same protocol. This day, as for the Mirai botnet,our program saw many IP addresses targeting the MAWInetwork on port 8291, using various source port numbers.This anomaly has been detected with a score of 4 in theUCSD dataset.
vi) On Apr. 26 and March 3, two anomalies on port 23are detected. We observe that these days, meanSize con-siderably rises while srcDivIndex and destDivIndex fall.The number of packets is also lower than usual. Thus itlooks like there are less malicious scans towards this portthese days. Actually, botnets tend to use alternate portsbecause vulnerabilities are progressively patched and de-vices are armed against possible exploits on port 23. Thesechanges have also been noticed in the UCSD dataset, pro-ducing anomalies with scores of 4 and 5.
vii) On June 28, a 16-score is stored for port 60001,probably corresponding to a Trojan named Trinity. Itfirst connects to one of 11 IRC servers on UnderNet. TheTrojan then joins a chat room and waits for commandsto attack individual agents on the channel. The noticedanomaly probably results from that trojan, that we iden-tified coming from two different IP addresses.
viii) On Sept. 6, a 16-score anomaly is observed on port8000. Several days before, the possibility for an unauthen-ticated attacker to exfiltrate sensitive information aboutthe network configuration (network SSID and password)has been made possible by an information disclosure inNetwave IP camera (CVE-2018-11653 and CVE-2018-11654).This anomaly has been detected in the UCSD dataset witha score of 4.
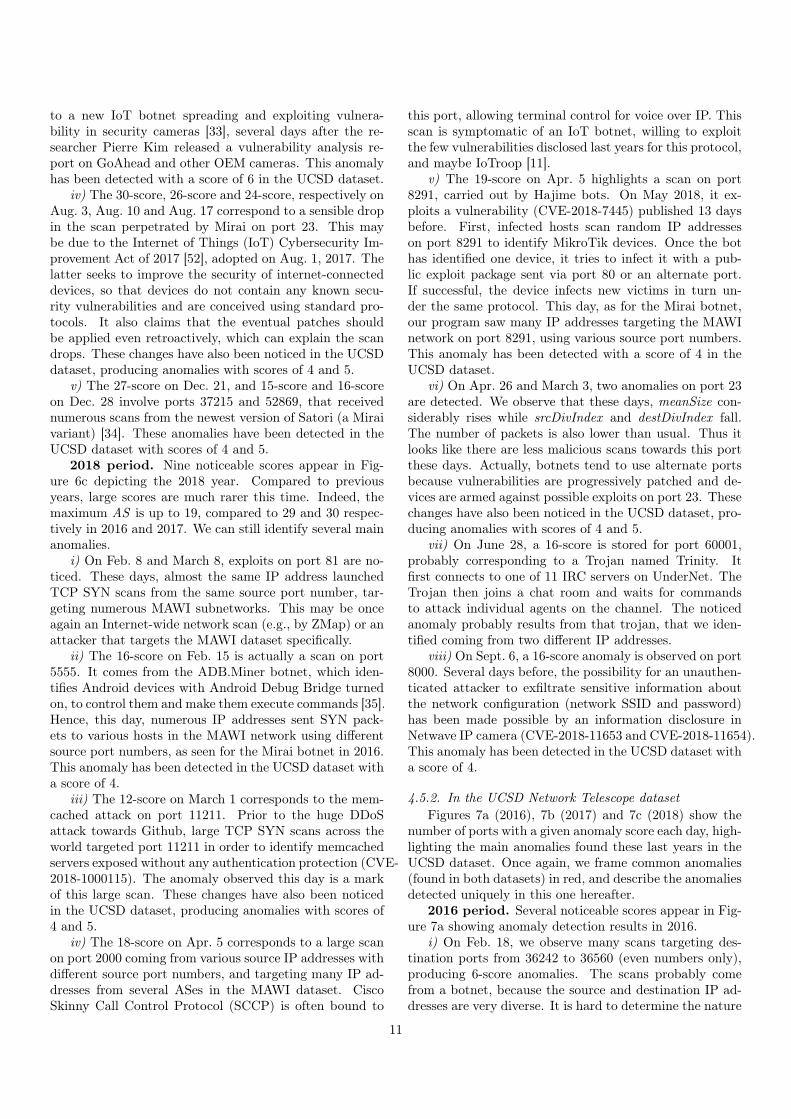
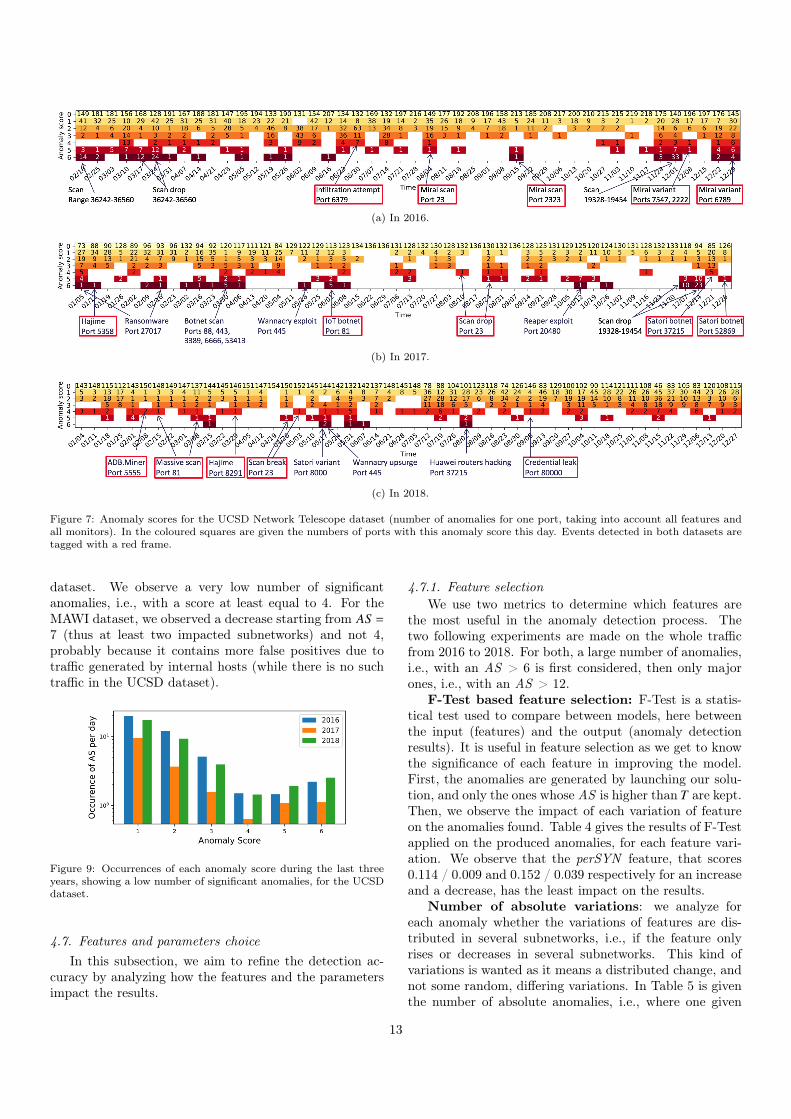
4.5.2. In the UCSD Network Telescope datasetFigures 7a (2016), 7b (2017) and 7c (2018) show the
number of ports with a given anomaly score each day, high-lighting the main anomalies found these last years in theUCSD dataset. Once again, we frame common anomalies(found in both datasets) in red, and describe the anomaliesdetected uniquely in this one hereafter.
2016 period. Several noticeable scores appear in Fig-ure 7a showing anomaly detection results in 2016.
i) On Feb. 18, we observe many scans targeting des-tination ports from 36242 to 36560 (even numbers only),producing 6-score anomalies. The scans probably comefrom a botnet, because the source and destination IP ad-dresses are very diverse. It is hard to determine the nature
11
of these scans, because they target registered ports withno known vulnerabilities. It may be a stealthy scan tech-nique to first determine if the host is up, to then focus onsome ports showing vulnerabilities (as the Reaper botnetdoes, cf. [41]).
ii) On March. 17 and 24, a decrease in the scans target-ing the range 36242-36560 is observed, producing 6-scoreanomalies.
iii) Once again, several scans targeting the range 19328-19454, producing 6-score anomalies have been noticed onDec. 1.
iv) On Dec. 8, an anomaly is detected with a score of 5,highlighting a scan performed by Mirai on port TCP/2222,running Rockwell Automation ControlLogix whose severalvulnerabilities are known [51]. The MAWI dataset con-tains traffic from a backbone link, and port 2222 may alsobe used as an alternative port for SSH, producing noise indata. This may explain why we did not detect the scan inthe MAWI dataset
2017 period. Several noticeable scores appear in Fig-ure 7b showing anomaly detection results in 2017.
i) A 6-score anomaly on Jan. 5 highlights a scan on portTCP/27017 that runs MongoDB. A few days later, it hasbeen reported and confirmed that many unsecured Mon-goDB databases have been scanned and vandalized aroundthe world [49]. This attack affects only those databaseswhich maintain default configurations, which leaves thedatabase open to external connections via the Internet.We observe also a scan of the same nature on Feb. 16.
ii) We observe on March. 30 several scans targetingdestination ports 88, 443, 3389, 6666 and 54313, comingfrom very distinct source IP addresses and with no flags (anetwork scanning technique known as Inverse TCP FlagScanning). All of these ports present known vulnerabil-ities. A vulnerability on port 54313 to exploit a NetisRouter Backdoor has been detected and exploited by bot-nets back in Aug. 2016[43]. We did not find any informa-tion about a botnet targeting all these ports conjointly inthe literature, thus we assume it is a small-scale attack.
iii) A 6-score on May. 18 highlights a scan on portTCP/445 that runs Server Message Block (SMB) knownfor its "EternalBlue" vulnerability. On May. 17, the recentWannaCry ransomware takes advantage of this vulnerabil-ity to compromise Windows machines [17].
iv)A 6-score on Oct. 12 highlights a scan on port 20480,probably from the Reaper botnet targeting a sequence ofdestination ports including 20480 [41]. However, insteadof doing aggressive, asynchronous SYN scans for open Tel-net ports, Reaper performs a more elaborate, conservativeTCP SYN scan on a series of different ports, one IP at atime, targeting uncommon ports. Only after the first waveof scans on the victim, a second wave starts consisting ofpotential IoT web service ports: 80, 81, 82, 83, 84, 88, etc.
v) As in 2016, we observe a decrease in the scans tar-geting the range 19328-19454, producing 6-score anomalieson Dec. 7 and 14.
2018 period. Several noticeable scores appear in Fig-ure 7c showing anomaly detection results in 2018.
i) A 6-score on May. 17 highlights a scan on port TCP/8000,performed by the Satori botnet exploiting a buffer over-flow vulnerability, tracked as CVE-2018-10088 [42]. Theexploit could be used by remote attackers to execute arbi-trary code by sending a malformed package via ports 80 or8000. The upsurge of malicious scanning activity has beenobserved on June 15 but we could think that we detected apreliminary scan campaign from Satori developers. More-over, this scan was probably not targeting the whole IPv4range because we did not detect it in the MAWI dataset.
ii) A 6-score on May. 17 highlights a scan on portTCP/445, a port known for its "EternalBlue" vulnerabil-ity exploited by Wannacry. We noticed at this time animportant increase in the botnet scan activities.
iii) A 6-score on Aug. 2 highlights a scan on portTCP/37215, a port used by Huawei HG532 routers. At theend of July, an IoT hacker identifying himself as "Anarchy"claimed to have hacked about 18000+ Huawei routers [4].It works by exploiting an already known vulnerability whichCVE is 2017-17215, used in Satori.
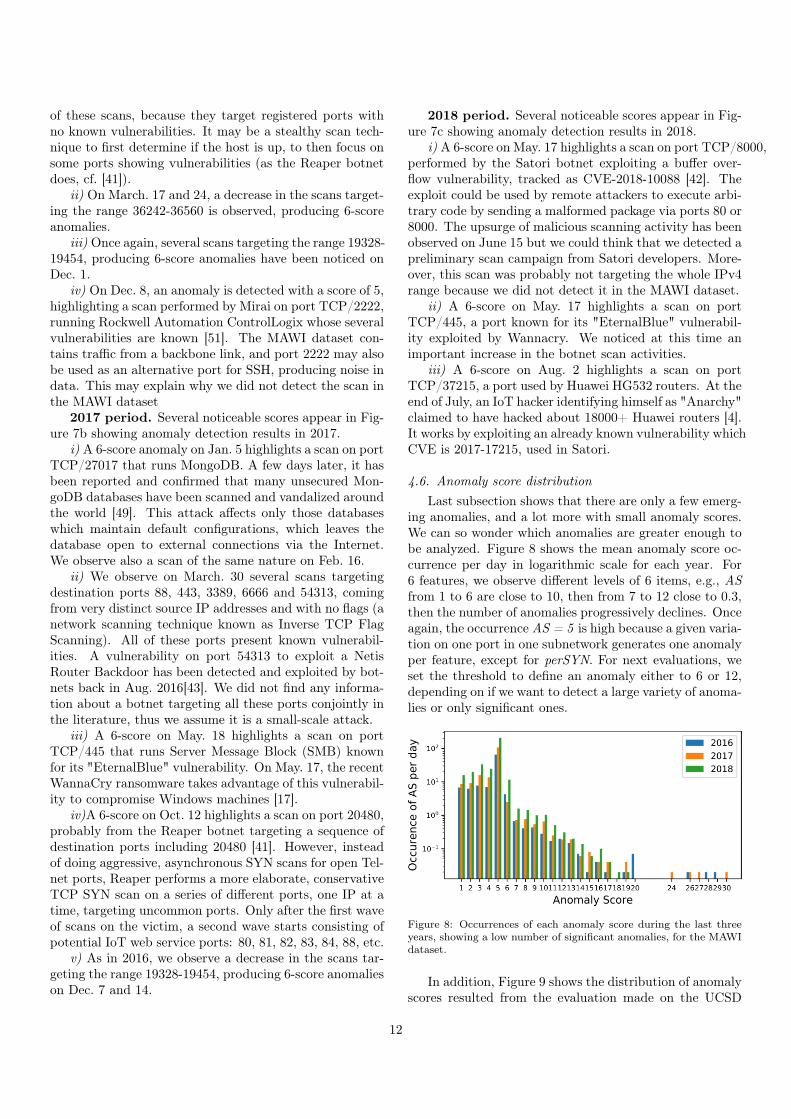
4.6. Anomaly score distributionLast subsection shows that there are only a few emerg-
ing anomalies, and a lot more with small anomaly scores.We can so wonder which anomalies are greater enough tobe analyzed. Figure 8 shows the mean anomaly score oc-currence per day in logarithmic scale for each year. For6 features, we observe different levels of 6 items, e.g., ASfrom 1 to 6 are close to 10, then from 7 to 12 close to 0.3,then the number of anomalies progressively declines. Onceagain, the occurrence AS = 5 is high because a given varia-tion on one port in one subnetwork generates one anomalyper feature, except for perSYN. For next evaluations, weset the threshold to define an anomaly either to 6 or 12,depending on if we want to detect a large variety of anoma-lies or only significant ones.
Figure 8: Occurrences of each anomaly score during the last threeyears, showing a low number of significant anomalies, for the MAWIdataset.
In addition, Figure 9 shows the distribution of anomalyscores resulted from the evaluation made on the UCSD
12
(a) In 2016.
(b) In 2017.
(c) In 2018.
Figure 7: Anomaly scores for the UCSD Network Telescope dataset (number of anomalies for one port, taking into account all features andall monitors). In the coloured squares are given the numbers of ports with this anomaly score this day. Events detected in both datasets aretagged with a red frame.
dataset. We observe a very low number of significantanomalies, i.e., with a score at least equal to 4. For theMAWI dataset, we observed a decrease starting from AS =7 (thus at least two impacted subnetworks) and not 4,probably because it contains more false positives due totraffic generated by internal hosts (while there is no suchtraffic in the UCSD dataset).
Figure 9: Occurrences of each anomaly score during the last threeyears, showing a low number of significant anomalies, for the UCSDdataset.
4.7. Features and parameters choiceIn this subsection, we aim to refine the detection ac-
curacy by analyzing how the features and the parametersimpact the results.
4.7.1. Feature selectionWe use two metrics to determine which features are
the most useful in the anomaly detection process. Thetwo following experiments are made on the whole trafficfrom 2016 to 2018. For both, a large number of anomalies,i.e., with an AS > 6 is first considered, then only majorones, i.e., with an AS > 12.
F-Test based feature selection: F-Test is a statis-tical test used to compare between models, here betweenthe input (features) and the output (anomaly detectionresults). It is useful in feature selection as we get to knowthe significance of each feature in improving the model.First, the anomalies are generated by launching our solu-tion, and only the ones whose AS is higher than T are kept.Then, we observe the impact of each variation of featureon the anomalies found. Table 4 gives the results of F-Testapplied on the produced anomalies, for each feature vari-ation. We observe that the perSYN feature, that scores0.114 / 0.009 and 0.152 / 0.039 respectively for an increaseand a decrease, has the least impact on the results.
Number of absolute variations: we analyze foreach anomaly whether the variations of features are dis-tributed in several subnetworks, i.e., if the feature onlyrises or decreases in several subnetworks. This kind ofvariations is wanted as it means a distributed change, andnot some random, differing variations. In Table 5 is giventhe number of absolute anomalies, i.e., where one given
13
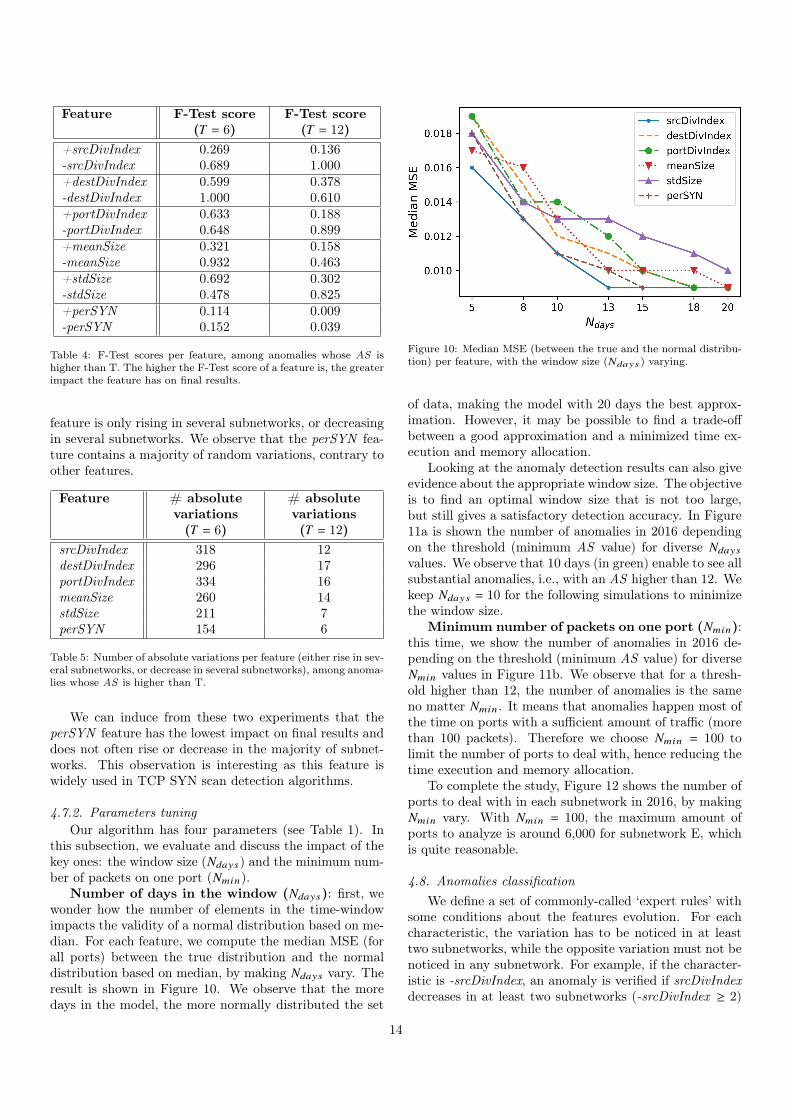
Feature F-Test score(T = 6)
F-Test score(T = 12)
+srcDivIndex 0.269 0.136-srcDivIndex 0.689 1.000+destDivIndex 0.599 0.378-destDivIndex 1.000 0.610+portDivIndex 0.633 0.188-portDivIndex 0.648 0.899+meanSize 0.321 0.158-meanSize 0.932 0.463+stdSize 0.692 0.302-stdSize 0.478 0.825+perSYN 0.114 0.009-perSYN 0.152 0.039
Table 4: F-Test scores per feature, among anomalies whose AS ishigher than T. The higher the F-Test score of a feature is, the greaterimpact the feature has on final results.
feature is only rising in several subnetworks, or decreasingin several subnetworks. We observe that the perSYN fea-ture contains a majority of random variations, contrary toother features.
Feature # absolutevariations(T = 6)
# absolutevariations(T = 12)
srcDivIndex 318 12destDivIndex 296 17portDivIndex 334 16meanSize 260 14stdSize 211 7perSYN 154 6
Table 5: Number of absolute variations per feature (either rise in sev-eral subnetworks, or decrease in several subnetworks), among anoma-lies whose AS is higher than T.
We can induce from these two experiments that theperSYN feature has the lowest impact on final results anddoes not often rise or decrease in the majority of subnet-works. This observation is interesting as this feature iswidely used in TCP SYN scan detection algorithms.
4.7.2. Parameters tuningOur algorithm has four parameters (see Table 1). In
this subsection, we evaluate and discuss the impact of thekey ones: the window size (Ndays) and the minimum num-ber of packets on one port (Nmin).
Number of days in the window (Ndays): first, wewonder how the number of elements in the time-windowimpacts the validity of a normal distribution based on me-dian. For each feature, we compute the median MSE (forall ports) between the true distribution and the normaldistribution based on median, by making Ndays vary. Theresult is shown in Figure 10. We observe that the moredays in the model, the more normally distributed the set
Figure 10: Median MSE (between the true and the normal distribu-tion) per feature, with the window size (Ndays) varying.
of data, making the model with 20 days the best approx-imation. However, it may be possible to find a trade-offbetween a good approximation and a minimized time ex-ecution and memory allocation.
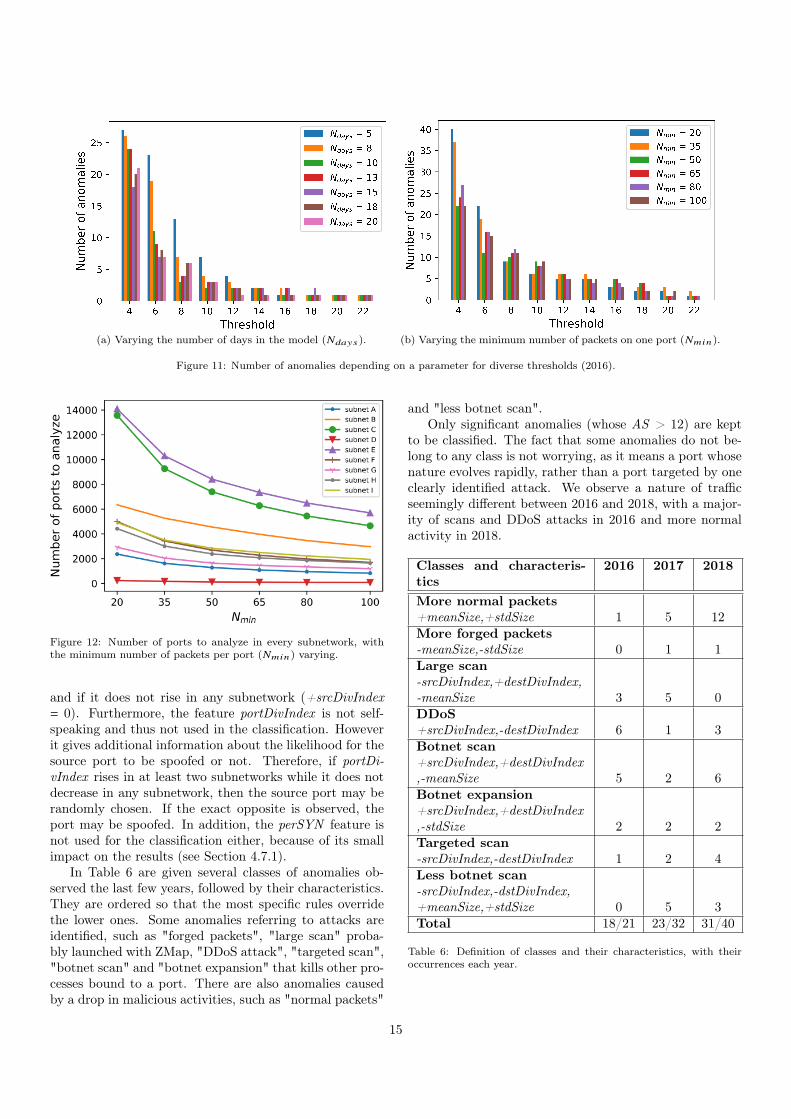
Looking at the anomaly detection results can also giveevidence about the appropriate window size. The objectiveis to find an optimal window size that is not too large,but still gives a satisfactory detection accuracy. In Figure11a is shown the number of anomalies in 2016 dependingon the threshold (minimum AS value) for diverse Ndays
values. We observe that 10 days (in green) enable to see allsubstantial anomalies, i.e., with an AS higher than 12. Wekeep Ndays = 10 for the following simulations to minimizethe window size.
Minimum number of packets on one port (Nmin):this time, we show the number of anomalies in 2016 de-pending on the threshold (minimum AS value) for diverseNmin values in Figure 11b. We observe that for a thresh-old higher than 12, the number of anomalies is the sameno matter Nmin . It means that anomalies happen most ofthe time on ports with a sufficient amount of traffic (morethan 100 packets). Therefore we choose Nmin = 100 tolimit the number of ports to deal with, hence reducing thetime execution and memory allocation.
To complete the study, Figure 12 shows the number ofports to deal with in each subnetwork in 2016, by makingNmin vary. With Nmin = 100, the maximum amount ofports to analyze is around 6,000 for subnetwork E, whichis quite reasonable.
4.8. Anomalies classificationWe define a set of commonly-called ‘expert rules’ with
some conditions about the features evolution. For eachcharacteristic, the variation has to be noticed in at leasttwo subnetworks, while the opposite variation must not benoticed in any subnetwork. For example, if the character-istic is -srcDivIndex, an anomaly is verified if srcDivIndexdecreases in at least two subnetworks (-srcDivIndex ≥ 2)
14
(a) Varying the number of days in the model (Ndays). (b) Varying the minimum number of packets on one port (Nmin).
Figure 11: Number of anomalies depending on a parameter for diverse thresholds (2016).
Figure 12: Number of ports to analyze in every subnetwork, withthe minimum number of packets per port (Nmin) varying.
and if it does not rise in any subnetwork (+srcDivIndex= 0). Furthermore, the feature portDivIndex is not self-speaking and thus not used in the classification. Howeverit gives additional information about the likelihood for thesource port to be spoofed or not. Therefore, if portDi-vIndex rises in at least two subnetworks while it does notdecrease in any subnetwork, then the source port may berandomly chosen. If the exact opposite is observed, theport may be spoofed. In addition, the perSYN feature isnot used for the classification either, because of its smallimpact on the results (see Section 4.7.1).
In Table 6 are given several classes of anomalies ob-served the last few years, followed by their characteristics.They are ordered so that the most specific rules overridethe lower ones. Some anomalies referring to attacks areidentified, such as "forged packets", "large scan" proba-bly launched with ZMap, "DDoS attack", "targeted scan","botnet scan" and "botnet expansion" that kills other pro-cesses bound to a port. There are also anomalies causedby a drop in malicious activities, such as "normal packets"
and "less botnet scan".Only significant anomalies (whose AS > 12) are kept
to be classified. The fact that some anomalies do not be-long to any class is not worrying, as it means a port whosenature evolves rapidly, rather than a port targeted by oneclearly identified attack. We observe a nature of trafficseemingly different between 2016 and 2018, with a major-ity of scans and DDoS attacks in 2016 and more normalactivity in 2018.
Classes and characteris-tics
2016 2017 2018
More normal packets+meanSize,+stdSize 1 5 12More forged packets-meanSize,-stdSize 0 1 1Large scan-srcDivIndex,+destDivIndex,-meanSize 3 5 0DDoS+srcDivIndex,-destDivIndex 6 1 3Botnet scan+srcDivIndex,+destDivIndex,-meanSize 5 2 6Botnet expansion+srcDivIndex,+destDivIndex,-stdSize 2 2 2Targeted scan-srcDivIndex,-destDivIndex 1 2 4Less botnet scan-srcDivIndex,-dstDivIndex,+meanSize,+stdSize 0 5 3Total 18/21 23/32 31/40
Table 6: Definition of classes and their characteristics, with theiroccurrences each year.
15
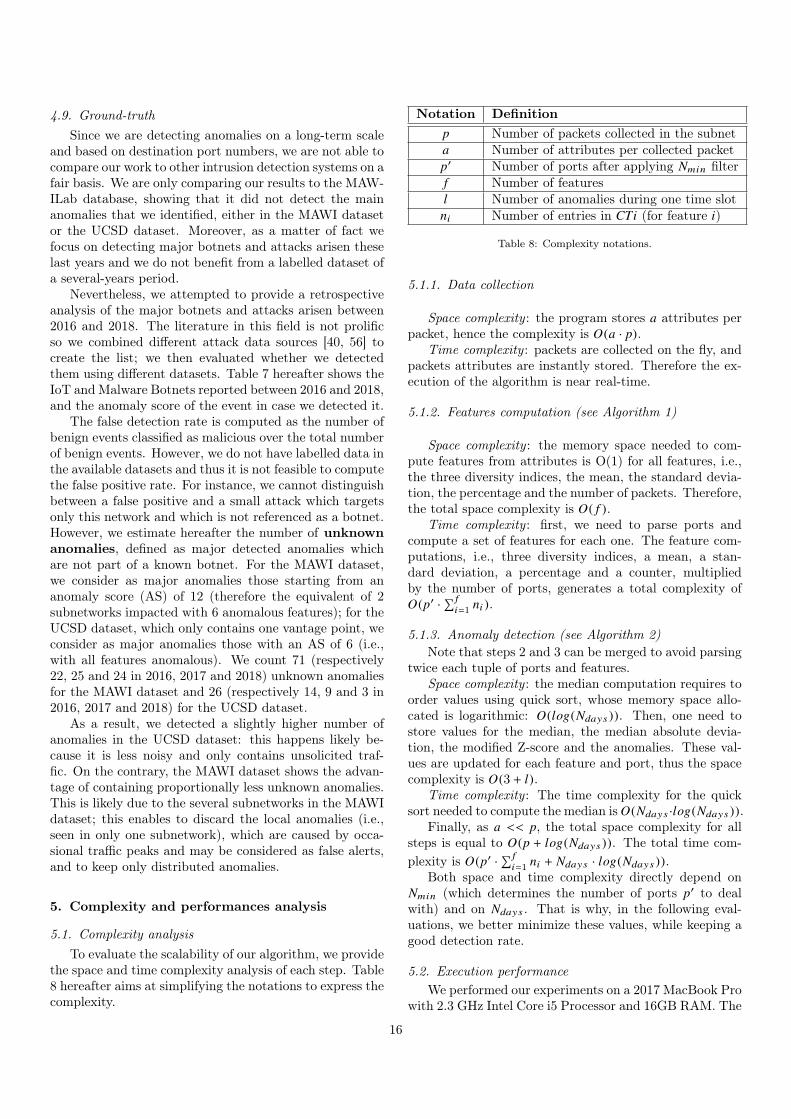
4.9. Ground-truthSince we are detecting anomalies on a long-term scale
and based on destination port numbers, we are not able tocompare our work to other intrusion detection systems on afair basis. We are only comparing our results to the MAW-ILab database, showing that it did not detect the mainanomalies that we identified, either in the MAWI datasetor the UCSD dataset. Moreover, as a matter of fact wefocus on detecting major botnets and attacks arisen theselast years and we do not benefit from a labelled dataset ofa several-years period.
Nevertheless, we attempted to provide a retrospectiveanalysis of the major botnets and attacks arisen between2016 and 2018. The literature in this field is not prolificso we combined different attack data sources [40, 56] tocreate the list; we then evaluated whether we detectedthem using different datasets. Table 7 hereafter shows theIoT and Malware Botnets reported between 2016 and 2018,and the anomaly score of the event in case we detected it.
The false detection rate is computed as the number ofbenign events classified as malicious over the total numberof benign events. However, we do not have labelled data inthe available datasets and thus it is not feasible to computethe false positive rate. For instance, we cannot distinguishbetween a false positive and a small attack which targetsonly this network and which is not referenced as a botnet.However, we estimate hereafter the number of unknownanomalies, defined as major detected anomalies whichare not part of a known botnet. For the MAWI dataset,we consider as major anomalies those starting from ananomaly score (AS) of 12 (therefore the equivalent of 2subnetworks impacted with 6 anomalous features); for theUCSD dataset, which only contains one vantage point, weconsider as major anomalies those with an AS of 6 (i.e.,with all features anomalous). We count 71 (respectively22, 25 and 24 in 2016, 2017 and 2018) unknown anomaliesfor the MAWI dataset and 26 (respectively 14, 9 and 3 in2016, 2017 and 2018) for the UCSD dataset.
As a result, we detected a slightly higher number ofanomalies in the UCSD dataset: this happens likely be-cause it is less noisy and only contains unsolicited traf-fic. On the contrary, the MAWI dataset shows the advan-tage of containing proportionally less unknown anomalies.This is likely due to the several subnetworks in the MAWIdataset; this enables to discard the local anomalies (i.e.,seen in only one subnetwork), which are caused by occa-sional traffic peaks and may be considered as false alerts,and to keep only distributed anomalies.
5. Complexity and performances analysis
5.1. Complexity analysisTo evaluate the scalability of our algorithm, we provide
the space and time complexity analysis of each step. Table8 hereafter aims at simplifying the notations to express thecomplexity.
Notation Definitionp Number of packets collected in the subneta Number of attributes per collected packetp′ Number of ports after applying Nmin filterf Number of featuresl Number of anomalies during one time slot
ni Number of entries in CTi (for feature i)
Table 8: Complexity notations.
5.1.1. Data collection
Space complexity : the program stores a attributes perpacket, hence the complexity is O(a · p).
Time complexity : packets are collected on the fly, andpackets attributes are instantly stored. Therefore the ex-ecution of the algorithm is near real-time.
5.1.2. Features computation (see Algorithm 1)
Space complexity : the memory space needed to com-pute features from attributes is O(1) for all features, i.e.,the three diversity indices, the mean, the standard devia-tion, the percentage and the number of packets. Therefore,the total space complexity is O( f ).
Time complexity : first, we need to parse ports andcompute a set of features for each one. The feature com-putations, i.e., three diversity indices, a mean, a stan-dard deviation, a percentage and a counter, multipliedby the number of ports, generates a total complexity ofO(p′ ·
∑ fi=1 ni ).
5.1.3. Anomaly detection (see Algorithm 2)Note that steps 2 and 3 can be merged to avoid parsing
twice each tuple of ports and features.Space complexity : the median computation requires to
order values using quick sort, whose memory space allo-cated is logarithmic: O(log(Ndays )). Then, one need tostore values for the median, the median absolute devia-tion, the modified Z-score and the anomalies. These val-ues are updated for each feature and port, thus the spacecomplexity is O(3 + l).
Time complexity : The time complexity for the quicksort needed to compute the median is O(Ndays ·log(Ndays )).
Finally, as a << p, the total space complexity for allsteps is equal to O(p + log(Ndays )). The total time com-plexity is O(p′ ·
∑ fi=1 ni + Ndays · log(Ndays )).
Both space and time complexity directly depend onNmin (which determines the number of ports p′ to dealwith) and on Ndays . That is why, in the following eval-uations, we better minimize these values, while keeping agood detection rate.
5.2. Execution performanceWe performed our experiments on a 2017 MacBook Pro
with 2.3 GHz Intel Core i5 Processor and 16GB RAM. The
16
Botnet Port Year MAWI dataset UCSD datasetMirai (IoT botnet) 23 2016 X(26/54) X(5/6)Mirai (IoT botnet) 2323 2016 X(28/54) X(6/6)Mirai (IoT botnet) 7547 2016 X(29/54) X(5/6)Mirai (IoT botnet) 6789 2016 X(20/54) X(6/6)Mirai (IoT botnet) 2222 2016 X X(5/6)Mirai (IoT botnet) 23231 2016 X(20/54) X
Hajime (Malware botnet) 5358 2017 X(19/54) X(6/6)Reaper (IoT botnet) 20480 2017 X X(6/6)Satori (IoT botnet) 37215 2017 X(27/54) X(4/6)Satori (IoT botnet) 52869 2017 X(17/54) X(5/6)
ADB.Miner (IoT botnet) 5555 2018 X(19/54) X(4/6)Memcached (Malware botnet) 11211 2018 X(12/54) XHajime (Malware botnet) 8291 2018 X(19/54) X(4/6)
Satori (IoT botnet) 8000 2018 X X(6/6)Total 11/14 detected (T PR = 78.6%) 12/14 detected (T PR = 85.7%)
Table 7: List of most impactful botnets reported these last three years.
time spent to detect anomalies depends on the number ofanalyzed ports, thus on Nmin , the minimum number pack-ets on a port to consider it. We consider here the UCSDdataset, composed of 152 days picked from 2016 to 2018,each one containing one million of packets. The learningphase (building per-port profiles) and the detection phase(computing the Z-score) are run simultaneously. In fact,we dispose of a sliding window, thus the model is updatedeach time and the detection is made on the updated modelon the fly. In total, it took 6390 seconds to run the fullalgorithm (i.e., the learning and detection phases) on 152days, covering 17,152 ports and one subnetwork.
6. Conclusion and perspectives
The port-based anomaly detection algorithm we pro-posed is able to detect known and unknown attacks target-ing connected objects and servers around the world. Earlystages of the attacks, namely the exploited vulnerabilities,can be detected beforehand.
Our method, called Split-and-Merge detection, lever-age on statistics to detect main changes in the usage ofapplication ports. The empirical results obtained apply-ing our method to real traces are very promising, since ouralgorithm detected a number of world-wide attacks from2016 to 2018. In contrast, current IDSs, among whichthe notorious MAWILab, have not detected them. Weevaluated the scalability of our algorithm by computingits complexity in terms of space and time. Moreover, weshowed that our algorithm produces a very low number offalse positives. We demonstrated the validity of our statis-tical model assumptions, showing how leveraging on dis-tribution analysis of features we can refine the detectionaccuracy by analyzing how the parameters and featuresimpact the results. We provide a classification of detectedattacks given expert rules by analyzing jointly the features
evolution.The objective of this work is to detect the early appari-
tion of botnets, newly exploited vulnerabilities and otherdiverse attacks within a given network. However, we no-ticed that we could obtain a comprehensive list of majorbotnets that emerged last years by coupling different datasources. For example, some preliminary scans target alimited IPv4 range only and thus are visible only on somedatasets. As a result, we found that some attacks de-tected in one real traffic source (the MAWI dataset), con-taining both attack traffic and background traffic, werenot found in another source containing only attack or un-solicited traffic (the UCSD dataset). We thus believe itwould be interesting in future work to leverage these dif-ferent data sources in order to describe the landscape ofmajor attacks and botnets in recent years.
As a further work, we also plan to implement our pro-posal in an SDN environment, using a controller and sev-eral switches running the algorithm. This way the identi-fied attacks could be mitigated, for example by patchingthe appropriate services or network programming.
References
[1] Akamai, 2018. Memcached UDP reflection attacks.URL https://blogs.akamai.com/2018/02/memcached-udp-reflection-attacks.html
[2] Antonakakis, M., April, T., Bailey, M., Bernhard, M.,Bursztein, E., Cochran, J., Durumeric, Z., Halderman, J. A.,Invernizzi, L., Kallitsis, M., Kumar, D., Lever, C., Ma, Z., Ma-son, J., Menscher, D., Seaman, C., Sullivan, N., Thomas, K.,Zhou, Y., 2017. Understanding the Mirai botnet. In: Proceed-ings of the USENIX Security Symposium (USENIX Security).pp. 1093–1110.
[3] Aqil, A., Khalil, K., Atya, A. O., Papalexakis, E. E., Krishna-murthy, S. V., Jaeger, T., Ramakrishnan, K. K., Yu, P., Swami,A., 2017. Jaal: Towards network intrusion detection at isp scale.In: Proceedings of the International COnference on emergingNetworking EXperiments and Technologies - (CoNEXT).
17
[4] Avira, 2018. 18000 routers taken hostage in less than a day.URL https://blog.avira.com/18000-routers-taken-hostage-in-less-than-a-day/
[5] Bhuyan, M. H., Bhattacharyya, D. K., Kalita, J. K., 2014. Net-work anomaly detection: Methods, systems and tools. IEEECommunications Surveys & Tutorials 16 (1), 303–336.
[6] Bhuyan, M. H., Bhattacharyya, D. K., Kalita, J. K., April 2011.Surveying port scans and their detection methodologies. TheComputer Journal 54 (10), 1565–1581.
[7] Blaise, A., Bouet, M., Secci, S., Conan, V., 2019. Split-and-Merge: detecting unknown botnets. In: Proceedings of theIFIP/IEEE International Symposium on Integrated NetworkManagement (IM).
[8] CAIDA, 2020. UCSD Network Telescope Aggregated FlowDataset.URL https://www.caida.org/data/passive/telescope-flowtuple.xml
[9] Callegari, C., Giordano, S., Pagano, M., 2017. Entropy-basednetwork anomaly detection. In: Proceedings of InternationalConference on Computing, Networking and Communications(ICNC).
[10] Celenk, M., Conley, T., Willis, J., Graham, J., jun 2010. Predic-tive network anomaly detection and visualization. IEEE Trans-actions on Information Forensics and Security 5 (2), 288–299.
[11] CheckPoint, 2018. IoTroop botnet: The full investigation.URL https://research.checkpoint.com/iotroop-botnet-full-investigation/
[12] Cid-Fuentes, J. Á., Szabo, C., Falkner, K., nov 2018. An adap-tive framework for the detection of novel botnets. Computers &Security 79, 148–161.
[13] Cisco, 2018. Snort - network intrusion detection & preventionsystem.URL https://www.snort.org/
[14] Dainotti, A., Benson, K., King, A., kc claffy, Kallitsis, M.,Glatz, E., Dimitropoulos, X., dec 2013. Estimating internet ad-dress space usage through passive measurements. ACM SIG-COMM Computer Communication Review 44 (1), 42–49.
[15] Dromard, J., Roudiere, G., Owezarski, P., March 2017. Onlineand scalable unsupervised network anomaly detection method.IEEE Transactions on Network and Service Management 14 (1),34–47.
[16] Edwards, S., Profetis, I., 2016. Hajime: Analysis of a decen-tralized internet worm for IoT devices.URL https://security.rapiditynetworks.com/publications/2016-10-16/hajime.pdf
[17] FireEye, 2017. Smb exploited: Wannacry use of "eternalblue".URL https://www.fireeye.com/blog/threat-research/2017/05/smb-exploited-wannacry-use-of-eternalblue.html
[18] Fontugne, R., Borgnat, P., Abry, P., Fukuda, K., 2010. MAW-ILab: Combining diverse anomaly detectors for automatedanomaly labeling and performance benchmarking. In: Proceed-ings of the International COnference on emerging NetworkingEXperiments and Technologies (Co-NEXT).
[19] Francois, J., Aib, I., Boutaba, R., Dec 2012. FireCol: A collab-orative protection network for the detection of flooding DDoSattacks. IEEE/ACM Transactions on Networking 20 (6), 1828–1841.
[20] FukudaLab, 2019. MAWILab database.URL http://www.fukuda-lab.org/mawilab
[21] Github, 2019. Source code for Split-and-Merge detection algo-rithm.URL https://github.com/a-blaise/split-and-merge
[22] Gu, G., Zhang, J., Lee, W., Feb 2008. BotSniffer: Detectingbotnet command and control channels in network traffic. In:Proceedings of the Network and Distributed System SecuritySymposium (NDSS).
[23] Guillot, A., Fontugne, R., Winter, P., MÃľrindol, P., Dainotti,A., Pelsser, C., 2019. Chocolatine: Outage detection for internetbackground radiation. In: Network Traffic Measurement andAnalysis Conference (TMA).
[24] Haddadi, F., Cong, D. L., Porter, L., Zincir-Heywood, A. N.,
2015. On the effectiveness of different botnet detection ap-proaches. In: Information Security Practice and Experience.Springer International Publishing, pp. 121–135.
[25] Iglewicz, B., Hoaglin, D., 1993. How to detect and handle out-liers. In: Edward F. Mykytka, P. (Ed.), The ASQC Basic Ref-erences in Quality Control: Statistical Techniques. Vol. 16.
[26] Kao, C.-N., Chang, Y.-C., Huang, N.-F., S, I. S., Liao, I.-J., Liu,R.-T., Hung, H.-W., Sep 2015. A predictive zero-day networkdefense using long-term port-scan recording. In: 2015 IEEEConference on Communications and Network Security (CNS).
[27] Lakhina, A., Crovella, M., Diot, C., 2005. Mining anomalies us-ing traffic feature distributions. In: Proceedings of the confer-ence on Applications, technologies, architectures, and protocolsfor computer communications - SIGCOMM. ACM Press.
[28] Lobato, A. G. P., Lopez, M. A., Sanz, I. J., Cardenas, A. A.,Duarte, O. C. M. B., Pujolle, G., 2018. An adaptive real-timearchitecture for zero-day threat detection. In: IEEE Interna-tional Conference on Communications (ICC).
[29] Lu, W., Tong, H., 2009. Detecting network anomalies usingCUSUM and EM clustering. In: Advances in Computation andIntelligence. pp. 297–308.
[30] Mahanti, A., Carlsson, N., Mahanti, A., Arlitt, M., Williamson,C., jan 2013. A tale of the tails: Power-laws in internet mea-surements. IEEE Network 27 (1), 59–64.
[31] MAWI, 2019. MAWI working group traffic archive.URL http://mawi.wide.ad.jp/mawi/
[32] Mirheidari, S. A., Arshad, S., Jalili, R., 2013. Alert correlationalgorithms: A survey and taxonomy. In: Cyberspace Safety andSecurity. pp. 183–197.
[33] Netlab360, 2017. New threat report: A new IoT botnet isspreading over http 81 on a large scale.URL http://blog.netlab.360.com/a-new-threat-an-iot-botnet-scanning-internet-on-port-81-en/
[34] Netlab360, 2017. Warning: Satori, a Mirai branch is spreadingin worm style on port 37215 and 52869.URL http://blog.netlab.360.com/warning-satori-a-new-mirai-variant-is-spreading-in-worm-style-on-port-37215-and-52869-en/
[35] Netlab360, Feb 2018. ADB.Miner: More information.URL http://blog.netlab.360.com/adb-miner-more-information-en/
[36] Nimrod Aviram, 2016. DROWN Attack.URL https://drownattack.com/
[37] Nmap, 2018. Nmap: the network Mapper.URL https://nmap.org/
[38] Panjwani, S., Tan, S., Jarrin, K., Cukier, M., 2005. An exper-imental evaluation to determine if port scans are precursors toan attack. In: 2005 International Conference on DependableSystems and Networks (DSN).
[39] Paxson, V., Dec 1999. Bro: a system for detecting networkintruders in real-time. Computer Networks 31 (23-24), 2435–2463.
[40] PentaSecurity, 2017. Top 5 botnets of 2017.URL https://www.pentasecurity.com/blog/top-5-botnets-2017/
[41] Radware, 2017. Why the world is under the spell of IoTReaper.URL https://blog.radware.com/security/2017/10/iot_reaper-botnet/
[42] Radware, 2018. Satori iot botnet variant.URL https://security.radware.com/ddos-threats-attacks/threat-advisories-attack-reports/satori-iot-botnet/
[43] SANS ISC InfoSec Forums, 2017. Surge in exploit attempts fornetis router backdoor (udp/53413).URL https://isc.sans.edu/forums/diary/Surge+in+Exploit+Attempts+for+Netis+Router+Backdoor+UDP53413/21337/
[44] Shanmugam, P. K., Subramanyam, N. D., Breen, J., Roach, C.,der Merwe, J. V., 2014. DEIDtect: towards distributed elasticintrusion detection. In: Proceedings of the ACM SIGCOMMworkshop on Distributed cloud computing (DCC).
[45] Singh, D., Patel, D., Borisaniya, B., Modi, C., 2015. Collabora-tive IDS framework for cloud. International Journal of Network
18
Security 18, 699–709.[46] Su, M.-Y., Yu, G.-J., Lin, C.-Y., jul 2009. A real-time network
intrusion detection system for large-scale attacks based on anincremental mining approach. Computers & Security 28 (5),301–309.
[47] Symantec, 2017. Hajime worm battles mirai for control of theinternet of things.URL https://www.symantec.com/connect/blogs/hajime-worm-battles-mirai-control-internet-things
[48] Tartakovsky, A. G., Polunchenko, A. S., Sokolov, G., Feb 2013.Efficient computer network anomaly detection by changepointdetection methods. IEEE Journal of Selected Topics in SignalProcessing 7 (1), 4–11.
[49] TechRepublic, 2017. Massive ransomware attack takes out27,000 mongodb servers.URL https://www.techrepublic.com/article/massive-ransomware-attack-takes-out-27000-mongodb-servers/
[50] TechRepublic, March, 2018. How to stop Memcached DDoSattacks with a simple command.URL https://www.techrepublic.com/article/how-to-stop-memcached-ddos-attacks-with-a-simple-command/
[51] US CERT, 2019. Ics advisory (icsa-13-011-03), rockwell au-tomation controllogix plc vulnerabilities.URL https://www.us-cert.gov/ics/advisories/ICSA-13-011-03
[52] US Congress, 2017. Internet of Things (IoT) CybersecurityImprovement Act of 2017.URL https://www.congress.gov/115/bills/s1691/BILLS-115s1691is.pdf
[53] Wang, A., Chang, W., Chen, S., Mohaisen, A., 2018. Delvinginto internet DDoS attacks by botnets: Characterization andanalysis. IEEE/ACM Transactions on Networking 26 (6), 2843–2855.
[54] Wang, W., Shang, Y., He, Y., Li, Y., Liu, J., feb 2020. Bot-Mark: Automated botnet detection with hybrid analysis of flow-based and graph-based traffic behaviors. Information Sciences511, 284–296.
[55] Zakir Durumeric, E. W., Halderman, J. A., 2013. ZMap: Fastinternet-wide scanning and its security applications. In: Pro-ceedings of the USENIX Security Symposium (USENIX Secu-rity).
[56] ZDNet, 2019. A decade of malware: Top botnets of the 2010s.URL https://www.zdnet.com/article/a-decade-of-malware-top-botnets-of-the-2010s/
[57] Zhou, C. V., Leckie, C., Karunasekera, S., Feb 2010. A survey ofcoordinated attacks and collaborative intrusion detection. Com-puters & Security 29 (1), 124–140.
Agathe Blaise is currently a Ph.D. student at ThalesCommunications & Security (Gennevilliers, France) andLIP6, Sorbonne University (Paris, France). She receivedher Engineering degree in Computer Science from ISEN(Lille, France) in 2017. Her research interests are in thefield of data analysis applied to network security.
Mathieu Bouet received the Ph.D. degree in ComputerScience and the Habilitation degree from Sorbonne Univer-sity (formerly UPMC – Paris VI) in 2009 and 2017, respec-tively. He is a Research Expert in networking and commu-nications with Thales, France, where he currently managesresearch activities on network softwarization with the Net-working Laboratory, Advanced Studies Department. Hisresearch interests are mainly focused on network virtual-ization and network optimization.
Vania Conan received the Engineering and Ph.D. degreesin Computer Science from Mines ParisTech in 1990 and1996, respectively, and the Habilitation degree from Sor-bonne University, Paris in 2012. He is a Senior ResearchExpert in networking and communications with Thales,France. He is currently the Head of the Networking Lab-oratory, Advanced Studies Department in Thales. He hasbeen conducting research in the fields of software-definedcommunications and wireless networking. He has pub-lished over 100 international conference and journal pa-pers and holds 10 patents in networking technologies. Hiscurrent research topics include mobile network protocolsand virtualized network design.
Stefano Secci is professor of networking at Cnam (Con-servatoire national des arts et metiers), Paris, France. Hereceived the M.Sc. Degree in telecommunications engi-neering from Politecnico di Milano, Italy, in 2005, and adual Ph.D. Degree in computer science and networks fromPolitecnico di Milano and Telecom ParisTech, France, in2009. He was associate professor at LIP6, UPMC from2010 to 2018. His current interests cover novel routing andswitching architectures and network virtualization. Web-page: http://cedric.cnam.fr/~seccis/.
19