Detection of Uterine MMG Contractions Using a Multiple Change Point Estimator and the K-Means...
15
IEEE TRANSACTIONS ON BIOMEDICAL ENGINEERING, VOL. 55, NO. 2, FEBRUARY 2008 453 Detection of Uterine MMG Contractions Using a Multiple Change Point Estimator and the K-Means Cluster Algorithm Patricio S. La Rosa*, Student Member, IEEE, Arye Nehorai, Fellow, IEEE, Hari Eswaran, Curtis L. Lowery, and Hubert Preissl Abstract—We propose a single channel two-stage time-segment discriminator of uterine magnetomyogram (MMG) contractions during pregnancy. We assume that the preprocessed signals are piecewise stationary having distribution in a common family with a fixed number of parameters. Therefore, at the first stage, we propose a model-based segmentation procedure, which detects multiple change-points in the parameters of a piecewise constant time-varying autoregressive model using a robust formulation of the Schwarz information criterion (SIC) and a binary search approach. In particular, we propose a test statistic that depends on the SIC, derive its asymptotic distribution, and obtain closed-form optimal detection thresholds in the sense of the Neyman–Pearson criterion; therefore, we control the probability of false alarm and maximize the probability of change-point detection in each stage of the binary search algorithm. We compute and evaluate the relative energy variation [root mean squares (RMS)] and the dominant frequency component [first order zero crossing (FOZC)] in discriminating between time segments with and without contractions. The former consistently detects a time segment with contractions. Thus, at the second stage, we apply a nonsupervised K-means cluster algorithm to classify the detected time segments using the RMS values. We apply our detection algorithm to real MMG records obtained from ten patients admitted to the hospital for contractions with gesta- tional ages between 31 and 40 weeks. We evaluate the performance of our detection algorithm in computing the detection and false alarm rate, respectively, using as a reference the patients’ feedback. We also analyze the fusion of the decision signals from all the sensors as in the parallel distributed detection approach. Index Terms—Autoregressive process, changepoint detection, magnetomyogram (MMG), uterine contraction. I. INTRODUCTION T HE analysis of uterine contractions during pregnancy is clinically important, especially predicting labor [1], [2]. Therefore, an automated method to detect uterine contractions Manuscript received August 3, 2006; revised April 19, 2007. This work was supported by the NIH/NINDS and NIBIB under Grants 2 R01 NS36277-04A1 and 1 R33 EB000978. Asterisk indicates corresponding author. *P. S. La Rosa is with the Department of Electrical and Systems Engineering, Washington University in St. Louis, St. Louis, MO 63130 USA (e-mail: pla@ ese.wustl.edu). A. Nehorai is with the Department of Electrical and Systems Engineering, Washington University in St. Louis, St. Louis, MO 63130 USA (e-mail: nehorai @ese.wustl.edu). H. Eswaran and C. L. Lowery are with the Department of Obstetrics and Gy- necology, University of Arkansas for Medical Sciences, Little Rock, AR 72205 USA. H. Preissl is with the Department of Obstetrics and Gynecology, University of Arkansas for Medical Sciences, Little Rock, AR 72204 USA and also with the MEG-Center, University of Tübingen, Tübingen D-72076, Germany. Color versions of one or more of the figures in this paper are available online at http://ieeexplore.ieee.org. Digital Object Identifier 10.1109/TBME.2007.912663 can be very helpful in the clinical evaluation of a patient. Uterine contractions can be described by their mechanical and electro- physiological aspects. Mechanical contractions manifest as the result of the excitation and propagation of electrical activity in the uterine muscle and appear in the form of an intrauterine pressure increase. Different techniques have been developed to quantify uterine contractions, such as tocography (TOCO), elec- trohysterogram (EHG) or electromyogram (EMG), and magne- tomyogram (MMG). TOCO measures the strength of the uterine muscle exerted on the abdominal wall using an external mechan- ical method, and the contractions are recorded using tensometric transducers attached to the patient’s abdomen. This technique is attractive because it is noninvasive and simple, but it is of lim- ited value due to its low sensitivity and accuracy [3]. The uterine EHG measures the action potentials of the myometrium cells using either internal electrodes or abdominal surface electrodes [1], [4]. This technique has a high temporal resolution and has captured more attention in the past decade, in particular for de- veloping filtering techniques for noise and artifacts, as well as for time-frequency characterization of the EHG waveforms [1], [4]–[8]. However, because of differences in the conductivities of tissue layers, the uterine EHG signals get filtered during their propagation to the surface of the maternal abdomen. The uterine magnetomyogram (MMG) is a noninvasive tech- nique that measures the magnetic fields associated with the ac- tion potentials. The first MMG recordings were reported by Eswaran et al. in 2002 [3], using a 151-channel noninvasive de- vice, known as the superconducting quantum interference de- vice array for reproductive assessment (SARA). The authors established the feasibility of recording uterine contractile ac- tivities with a spatial-temporal resolution high enough to de- termine localized regions of activation and propagation through the uterus. Unlike electrical recordings, magnetic recordings are independent of any kind of references, thus ensuring that each sensor mainly records localized activities. Hence, MMG seems to permit determining propagation patterns in the uterus [3]. Detection of uterine contractions has been performed in the past using a single EHG channel [6]–[9] and an array of MMG channels [10]. Among these references, we find time domain and multiresolution domain analysis. In the time-domain anal- ysis, the uterine contractions are detected by applying a dis- crimination rule (threshold) on the values of a function (feature) evaluated on a sliding time window. For example, using EHG measurements, the authors in [11] discriminate the root mean square (RMS) values using an experimental threshold. In [6] the authors discuss the feasibility of using the first-order zero- 0018-9294/$25.00 © 2008 IEEE
-
Upload
independent -
Category
Documents
-
view
1 -
download
0
Transcript of Detection of Uterine MMG Contractions Using a Multiple Change Point Estimator and the K-Means...
IEEE TRANSACTIONS ON BIOMEDICAL ENGINEERING, VOL. 55, NO. 2, FEBRUARY 2008 453
Detection of Uterine MMG Contractions Using aMultiple Change Point Estimator and the K-Means
Cluster AlgorithmPatricio S. La Rosa*, Student Member, IEEE, Arye Nehorai, Fellow, IEEE, Hari Eswaran, Curtis L. Lowery, and
Hubert Preissl
Abstract—We propose a single channel two-stage time-segmentdiscriminator of uterine magnetomyogram (MMG) contractionsduring pregnancy. We assume that the preprocessed signals arepiecewise stationary having distribution in a common family witha fixed number of parameters. Therefore, at the first stage, wepropose a model-based segmentation procedure, which detectsmultiple change-points in the parameters of a piecewise constanttime-varying autoregressivemodel usinga robust formulation of theSchwarz information criterion (SIC) and a binary search approach.In particular, we propose a test statistic that depends on the SIC,derive its asymptotic distribution, and obtain closed-form optimaldetection thresholds in the sense of the Neyman–Pearson criterion;therefore, we control the probability of false alarm and maximizethe probability of change-point detection in each stage of the binarysearch algorithm. We compute and evaluate the relative energyvariation [root mean squares (RMS)] and the dominant frequencycomponent [first order zero crossing (FOZC)] in discriminatingbetween time segments with and without contractions. The formerconsistently detects a time segment with contractions. Thus, at thesecond stage, we apply a nonsupervised K-means cluster algorithmto classify the detected time segments using the RMS values. Weapply our detection algorithm to real MMG records obtained fromten patients admitted to the hospital for contractions with gesta-tional ages between 31 and 40 weeks. We evaluate the performanceof our detection algorithm in computing the detection and falsealarm rate, respectively, using as a reference the patients’ feedback.We also analyze the fusion of the decision signals from all thesensors as in the parallel distributed detection approach.
Index Terms—Autoregressive process, changepoint detection,magnetomyogram (MMG), uterine contraction.
I. INTRODUCTION
THE analysis of uterine contractions during pregnancy isclinically important, especially predicting labor [1], [2].
Therefore, an automated method to detect uterine contractions
Manuscript received August 3, 2006; revised April 19, 2007. This work wassupported by the NIH/NINDS and NIBIB under Grants 2 R01 NS36277-04A1and 1 R33 EB000978. Asterisk indicates corresponding author.
*P. S. La Rosa is with the Department of Electrical and Systems Engineering,Washington University in St. Louis, St. Louis, MO 63130 USA (e-mail: [email protected]).
A. Nehorai is with the Department of Electrical and Systems Engineering,Washington University in St. Louis, St. Louis, MO 63130 USA (e-mail: [email protected]).
H. Eswaran and C. L. Lowery are with the Department of Obstetrics and Gy-necology, University of Arkansas for Medical Sciences, Little Rock, AR 72205USA.
H. Preissl is with the Department of Obstetrics and Gynecology, Universityof Arkansas for Medical Sciences, Little Rock, AR 72204 USA and also withthe MEG-Center, University of Tübingen, Tübingen D-72076, Germany.
Color versions of one or more of the figures in this paper are available onlineat http://ieeexplore.ieee.org.
Digital Object Identifier 10.1109/TBME.2007.912663
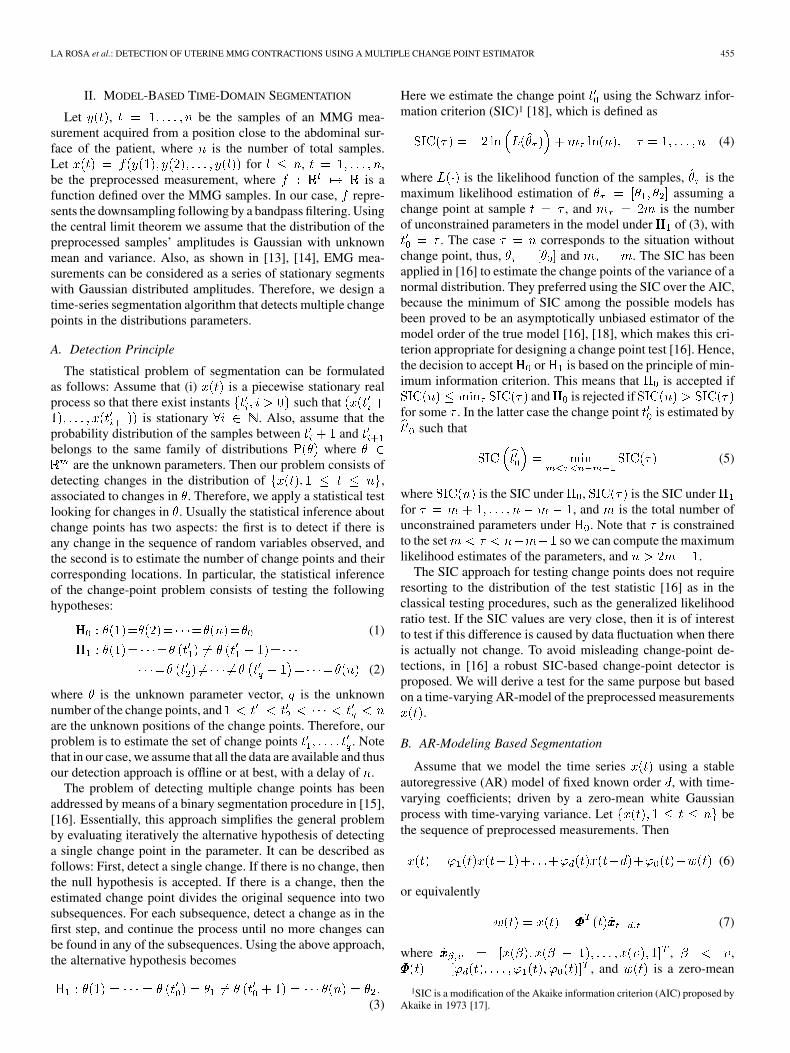
can be very helpful in the clinical evaluation of a patient. Uterinecontractions can be described by their mechanical and electro-physiological aspects. Mechanical contractions manifest as theresult of the excitation and propagation of electrical activity inthe uterine muscle and appear in the form of an intrauterinepressure increase. Different techniques have been developed toquantify uterine contractions, such as tocography (TOCO), elec-trohysterogram (EHG) or electromyogram (EMG), and magne-tomyogram (MMG). TOCO measures the strength of the uterinemuscle exerted on the abdominal wall using an external mechan-ical method, and the contractions are recorded using tensometrictransducers attached to the patient’s abdomen. This technique isattractive because it is noninvasive and simple, but it is of lim-ited value due to its low sensitivity and accuracy [3]. The uterineEHG measures the action potentials of the myometrium cellsusing either internal electrodes or abdominal surface electrodes[1], [4]. This technique has a high temporal resolution and hascaptured more attention in the past decade, in particular for de-veloping filtering techniques for noise and artifacts, as well asfor time-frequency characterization of the EHG waveforms [1],[4]–[8]. However, because of differences in the conductivitiesof tissue layers, the uterine EHG signals get filtered during theirpropagation to the surface of the maternal abdomen.
The uterine magnetomyogram (MMG) is a noninvasive tech-nique that measures the magnetic fields associated with the ac-tion potentials. The first MMG recordings were reported byEswaran et al. in 2002 [3], using a 151-channel noninvasive de-vice, known as the superconducting quantum interference de-vice array for reproductive assessment (SARA). The authorsestablished the feasibility of recording uterine contractile ac-tivities with a spatial-temporal resolution high enough to de-termine localized regions of activation and propagation throughthe uterus. Unlike electrical recordings, magnetic recordings areindependent of any kind of references, thus ensuring that eachsensor mainly records localized activities. Hence, MMG seemsto permit determining propagation patterns in the uterus [3].
Detection of uterine contractions has been performed in thepast using a single EHG channel [6]–[9] and an array of MMGchannels [10]. Among these references, we find time domainand multiresolution domain analysis. In the time-domain anal-ysis, the uterine contractions are detected by applying a dis-crimination rule (threshold) on the values of a function (feature)evaluated on a sliding time window. For example, using EHGmeasurements, the authors in [11] discriminate the root meansquare (RMS) values using an experimental threshold. In [6]the authors discuss the feasibility of using the first-order zero-
0018-9294/$25.00 © 2008 IEEE

454 IEEE TRANSACTIONS ON BIOMEDICAL ENGINEERING, VOL. 55, NO. 2, FEBRUARY 2008
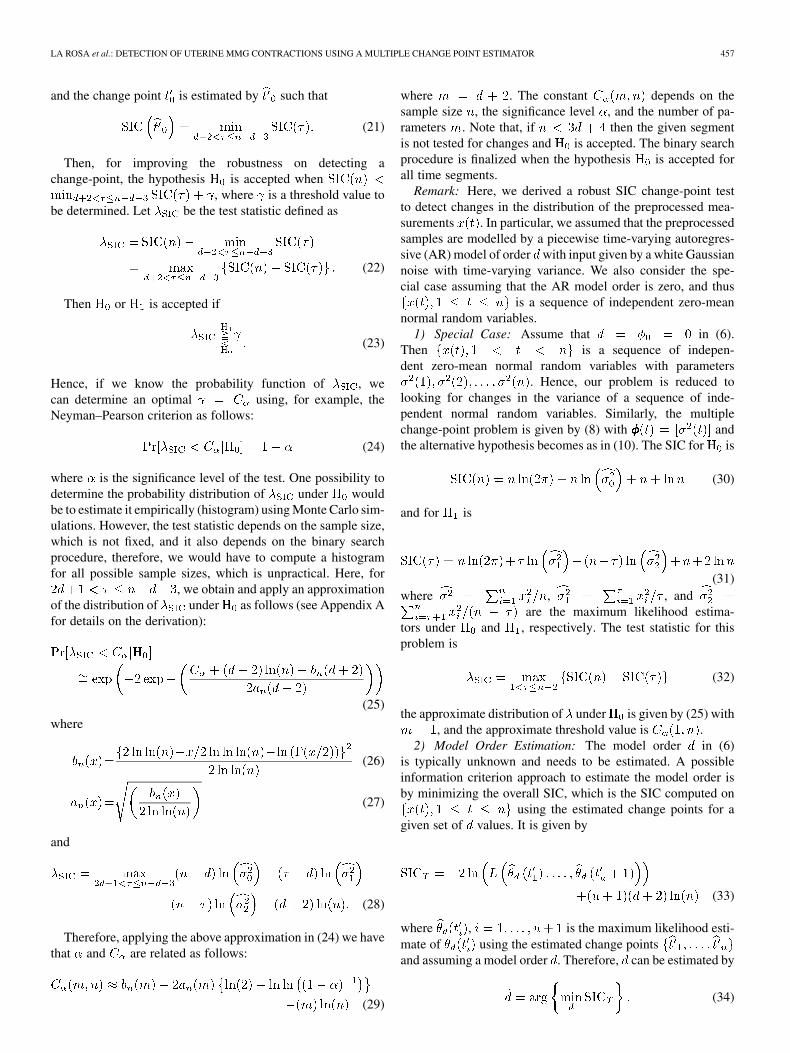
Fig. 1. Overview of the single channel processing scheme implemented to estimate uterine MMG contractions. On the left, a simplified illustration of the sensingarray and the uterine MMG field. On the right, a functional block scheme of the proposed single channel detector.
crossing (FOZC) as a feature. However, no threshold for detec-tion is provided. In [8], the authors discriminate the RMS valuesusing an adaptive threshold level, determined by applying a me-dian-moving average filter on an overlapping sliding window ofEHG measurements. In [10] the authors propose to use the gen-eralized synchronization index as an indicator of uterine con-tractions using an array of MMG channels.
In a multiresolution analysis, a single EHG measurement isrepresented in a higher dimensional linear space, which is formedby decomposing the signal into several subspaces spanned by aset of basis functions [12]. For example, in [9] a single channelEHG measurement is decomposed using a set of biorthogonalwavelet functions and the contraction detected using a two-stagealgorithm. In the first stage, the authors design a multivariablesequential cumulative likelihood ratio test to sequentially detectchanges in the covariance matrix of the decomposed signal.Then, in the second stage, the diagonal parameters of the covari-ance matrices are classified using a neural network trained by anexpert. As with the time-domain techniques, the segmentationstage of this multiresolution approach requires setting up a timewindow as well as a threshold level to detect changes in the pa-rameters. Also, the basis functions (wavelets) are selected basedon the average performance obtained in the classification stage.
One common restriction of the above techniques is that thetime-window length as well as the threshold level is determinedexperimentally based on a particular data set. In general the se-lection of the time-window length depends on the length of theshortest event to be detected, the global detection delay, and thenumber of samples required to properly estimate the hypoth-esis parameters [9]. Therefore, the detection performance mightchange from patient to patient because of, for example, differ-ences in the pregnancy stage, tissue conductivities, etc.
In this paper, we propose a single channel two-stage time-segment discriminator of uterine magnetomyogram (MMG)
contractions during pregnancy. At the first stage, we proposea model-based segmentation procedure, which detects mul-tiple change-points in the parameters of a piecewise constanttime-varying autoregressive model using a robust formulationof the Schwarz information criterion (SIC) and a binary searchapproach. This novel segmentation technique does not requirethe use of a sliding window as in previous work. In particular,we propose a test statistic that depends on the SIC, derive itsasymptotic distribution, and obtain closed-form optimal detec-tion thresholds in the sense of the Neyman–Pearson criterion;therefore, we control the probability of false alarm and max-imize the probability of change-point detection in each stageof the binary search algorithm. Then, at the second stage, weapply the nonsupervised K-means cluster algorithm to classifyeach time segment using the RMS and FOZC as candidatefeatures. Finally, we provide a discrete-time binary decisionsignal indicating the presence of a contraction. We validateour method using real MMG measurements and compare thedetected time intervals with the patients’ feedback. Since eachsingle channel detector provides local information regardingthe presence of a contraction, we also analyze the fusion ofthe decision signals from all the sensors as in the paralleldistributed detection approach. As we illustrate with real data,this approach proves to be helpful in understanding the uterineMMG contraction activity spatially and temporally. Fig. 1 il-lustrates the uterine MMG field, the sensing array, and theproposed single channel scheme to estimate the contractionintervals.
This work is organized as follows: in Section II we present themodel-based time-domain segmentation method and analyze itsperformance; in Section III we define the feature space and de-scribe the classification method; we discuss the performance ofour algorithm using real MMG data in Section IV, and summa-rize our results in Section V.
LA ROSA et al.: DETECTION OF UTERINE MMG CONTRACTIONS USING A MULTIPLE CHANGE POINT ESTIMATOR 455
II. MODEL-BASED TIME-DOMAIN SEGMENTATION
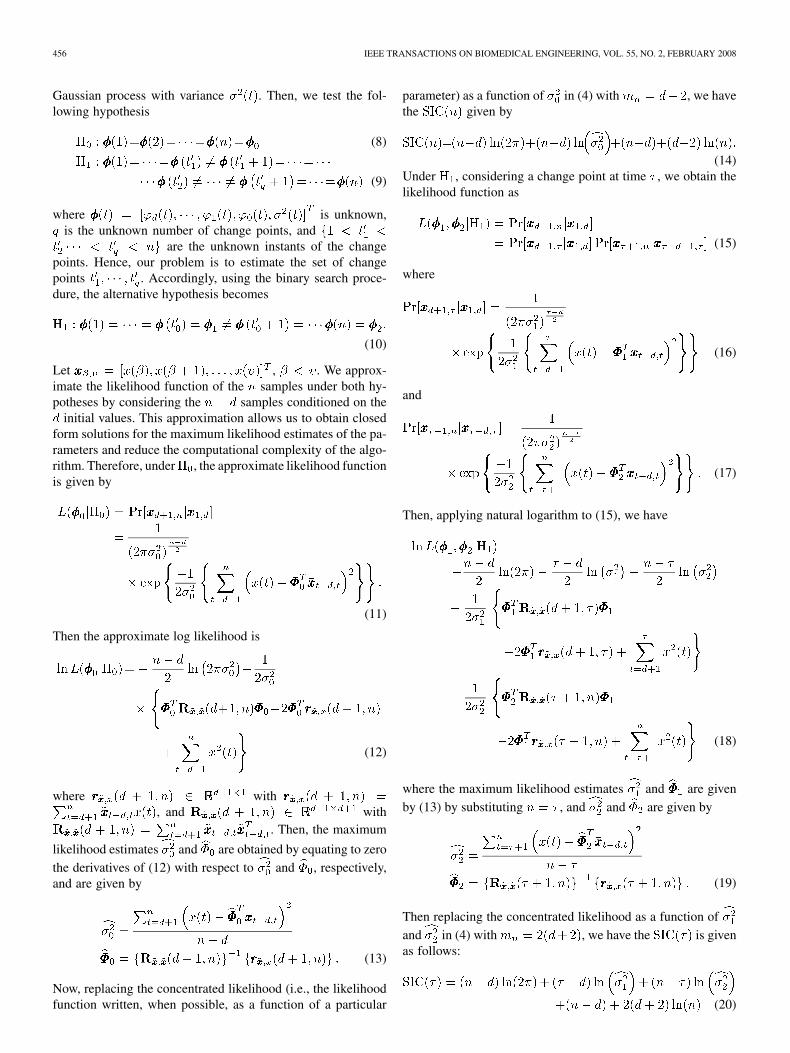
Let , be the samples of an MMG mea-surement acquired from a position close to the abdominal sur-face of the patient, where is the number of total samples.Let for , ,be the preprocessed measurement, where is afunction defined over the MMG samples. In our case, repre-sents the downsampling following by a bandpass filtering. Usingthe central limit theorem we assume that the distribution of thepreprocessed samples’ amplitudes is Gaussian with unknownmean and variance. Also, as shown in [13], [14], EMG mea-surements can be considered as a series of stationary segmentswith Gaussian distributed amplitudes. Therefore, we design atime-series segmentation algorithm that detects multiple changepoints in the distributions parameters.
A. Detection Principle
The statistical problem of segmentation can be formulatedas follows: Assume that (i) is a piecewise stationary realprocess so that there exist instants such that
is stationary . Also, assume that theprobability distribution of the samples between andbelongs to the same family of distributions where
are the unknown parameters. Then our problem consists ofdetecting changes in the distribution of ,associated to changes in . Therefore, we apply a statistical testlooking for changes in . Usually the statistical inference aboutchange points has two aspects: the first is to detect if there isany change in the sequence of random variables observed, andthe second is to estimate the number of change points and theircorresponding locations. In particular, the statistical inferenceof the change-point problem consists of testing the followinghypotheses:
(1)
(2)
where is the unknown parameter vector, is the unknownnumber of the change points, andare the unknown positions of the change points. Therefore, ourproblem is to estimate the set of change points . Notethat in our case, we assume that all the data are available and thusour detection approach is offline or at best, with a delay of .
The problem of detecting multiple change points has beenaddressed by means of a binary segmentation procedure in [15],[16]. Essentially, this approach simplifies the general problemby evaluating iteratively the alternative hypothesis of detectinga single change point in the parameter. It can be described asfollows: First, detect a single change. If there is no change, thenthe null hypothesis is accepted. If there is a change, then theestimated change point divides the original sequence into twosubsequences. For each subsequence, detect a change as in thefirst step, and continue the process until no more changes canbe found in any of the subsequences. Using the above approach,the alternative hypothesis becomes
(3)
Here we estimate the change point using the Schwarz infor-mation criterion (SIC)1 [18], which is defined as
(4)
where is the likelihood function of the samples, is themaximum likelihood estimation of assuming achange point at sample , and is the numberof unconstrained parameters in the model under of (3), with
. The case corresponds to the situation withoutchange point, thus, and . The SIC has beenapplied in [16] to estimate the change points of the variance of anormal distribution. They preferred using the SIC over the AIC,because the minimum of SIC among the possible models hasbeen proved to be an asymptotically unbiased estimator of themodel order of the true model [16], [18], which makes this cri-terion appropriate for designing a change point test [16]. Hence,the decision to accept or is based on the principle of min-imum information criterion. This means that is accepted if
and is rejected iffor some . In the latter case the change point is estimated by
such that
(5)
where is the SIC under , is the SIC underfor , and is the total number ofunconstrained parameters under . Note that is constrainedto the set so we can compute the maximumlikelihood estimates of the parameters, and .
The SIC approach for testing change points does not requireresorting to the distribution of the test statistic [16] as in theclassical testing procedures, such as the generalized likelihoodratio test. If the SIC values are very close, then it is of interestto test if this difference is caused by data fluctuation when thereis actually not change. To avoid misleading change-point de-tections, in [16] a robust SIC-based change-point detector isproposed. We will derive a test for the same purpose but basedon a time-varying AR-model of the preprocessed measurements
.
B. AR-Modeling Based Segmentation
Assume that we model the time series using a stableautoregressive (AR) model of fixed known order , with time-varying coefficients; driven by a zero-mean white Gaussianprocess with time-varying variance. Let bethe sequence of preprocessed measurements. Then
(6)
or equivalently
(7)
where , ,, and is a zero-mean
1SIC is a modification of the Akaike information criterion (AIC) proposed byAkaike in 1973 [17].
456 IEEE TRANSACTIONS ON BIOMEDICAL ENGINEERING, VOL. 55, NO. 2, FEBRUARY 2008
Gaussian process with variance . Then, we test the fol-lowing hypothesis
(8)
(9)
where is unknown,is the unknown number of change points, and
are the unknown instants of the changepoints. Hence, our problem is to estimate the set of changepoints . Accordingly, using the binary search proce-dure, the alternative hypothesis becomes
(10)
Let , . We approx-imate the likelihood function of the samples under both hy-potheses by considering the samples conditioned on the
initial values. This approximation allows us to obtain closedform solutions for the maximum likelihood estimates of the pa-rameters and reduce the computational complexity of the algo-rithm. Therefore, under , the approximate likelihood functionis given by
(11)
Then the approximate log likelihood is
(12)
where with, and with
. Then, the maximum
likelihood estimates and are obtained by equating to zerothe derivatives of (12) with respect to and , respectively,and are given by
(13)
Now, replacing the concentrated likelihood (i.e., the likelihoodfunction written, when possible, as a function of a particular
parameter) as a function of in (4) with , we havethe given by
(14)Under , considering a change point at time , we obtain thelikelihood function as
(15)
where
(16)
and
(17)
Then, applying natural logarithm to (15), we have
(18)
where the maximum likelihood estimates and are givenby (13) by substituting , and and are given by
(19)
Then replacing the concentrated likelihood as a function ofand in (4) with , we have the is givenas follows:
(20)
LA ROSA et al.: DETECTION OF UTERINE MMG CONTRACTIONS USING A MULTIPLE CHANGE POINT ESTIMATOR 457
and the change point is estimated by such that
(21)
Then, for improving the robustness on detecting achange-point, the hypothesis is accepted when
, where is a threshold value tobe determined. Let be the test statistic defined as
(22)
Then or is accepted if
(23)
Hence, if we know the probability function of , wecan determine an optimal using, for example, theNeyman–Pearson criterion as follows:
(24)
where is the significance level of the test. One possibility todetermine the probability distribution of under wouldbe to estimate it empirically (histogram) using Monte Carlo sim-ulations. However, the test statistic depends on the sample size,which is not fixed, and it also depends on the binary searchprocedure, therefore, we would have to compute a histogramfor all possible sample sizes, which is unpractical. Here, for
, we obtain and apply an approximationof the distribution of under as follows (see Appendix Afor details on the derivation):
(25)
where
(26)
(27)
and
(28)
Therefore, applying the above approximation in (24) we havethat and are related as follows:
(29)
where . The constant depends on thesample size , the significance level , and the number of pa-rameters . Note that, if then the given segmentis not tested for changes and is accepted. The binary searchprocedure is finalized when the hypothesis is accepted forall time segments.
Remark: Here, we derived a robust SIC change-point testto detect changes in the distribution of the preprocessed mea-surements . In particular, we assumed that the preprocessedsamples are modelled by a piecewise time-varying autoregres-sive (AR) model of order with input given by a white Gaussiannoise with time-varying variance. We also consider the spe-cial case assuming that the AR model order is zero, and thus
is a sequence of independent zero-meannormal random variables.
1) Special Case: Assume that in (6).Then is a sequence of indepen-dent zero-mean normal random variables with parameters
. Hence, our problem is reduced tolooking for changes in the variance of a sequence of inde-pendent normal random variables. Similarly, the multiplechange-point problem is given by (8) with andthe alternative hypothesis becomes as in (10). The SIC for is
(30)
and for is
(31)where , , and
are the maximum likelihood estima-tors under and , respectively. The test statistic for thisproblem is
(32)
the approximate distribution of under is given by (25) with, and the approximate threshold value is .
2) Model Order Estimation: The model order in (6)is typically unknown and needs to be estimated. A possibleinformation criterion approach to estimate the model order isby minimizing the overall SIC, which is the SIC computed on
using the estimated change points for agiven set of values. It is given by
(33)
where , is the maximum likelihood esti-mate of using the estimated change pointsand assuming a model order . Therefore, can be estimated by
(34)
458 IEEE TRANSACTIONS ON BIOMEDICAL ENGINEERING, VOL. 55, NO. 2, FEBRUARY 2008
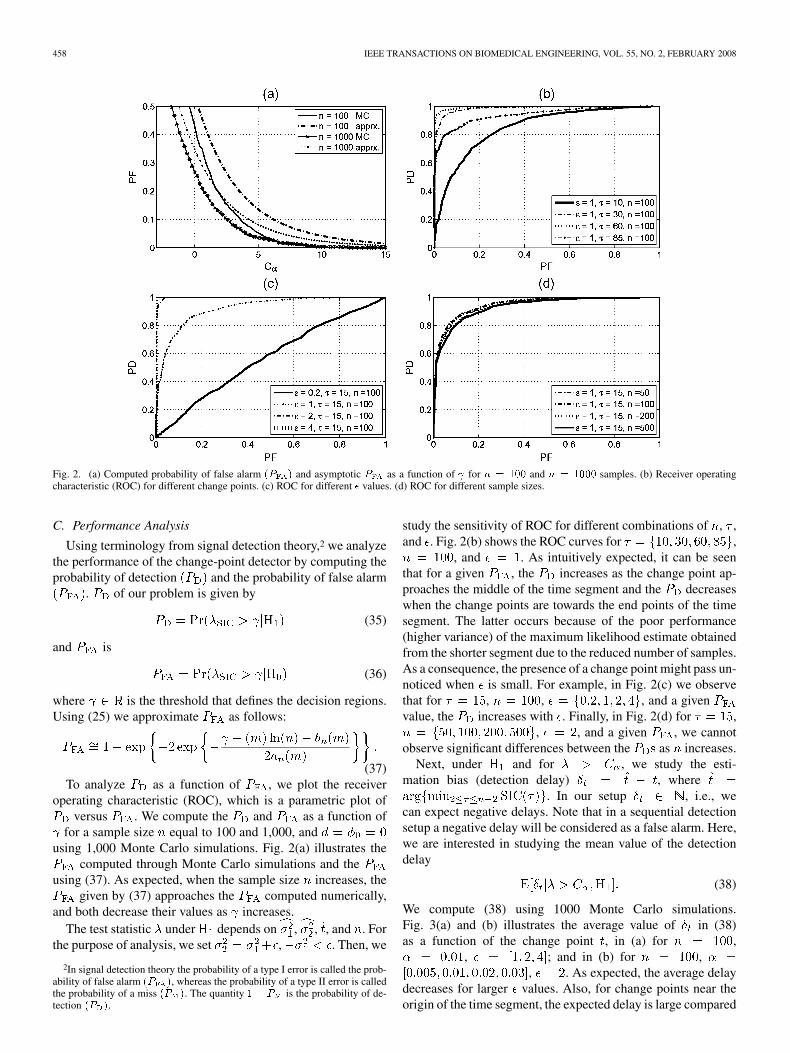
Fig. 2. (a) Computed probability of false alarm (P ) and asymptotic P as a function of for n = 100 and n = 1000 samples. (b) Receiver operatingcharacteristic (ROC) for different change points. (c) ROC for different � values. (d) ROC for different sample sizes.
C. Performance Analysis
Using terminology from signal detection theory,2 we analyzethe performance of the change-point detector by computing theprobability of detection and the probability of false alarm
. of our problem is given by
(35)
and is
(36)
where is the threshold that defines the decision regions.Using (25) we approximate as follows:
(37)To analyze as a function of , we plot the receiver
operating characteristic (ROC), which is a parametric plot ofversus . We compute the and as a function of
for a sample size equal to 100 and 1,000, andusing 1,000 Monte Carlo simulations. Fig. 2(a) illustrates the
computed through Monte Carlo simulations and theusing (37). As expected, when the sample size increases, the
given by (37) approaches the computed numerically,and both decrease their values as increases.
The test statistic under depends on , , , and . Forthe purpose of analysis, we set , . Then, we
2In signal detection theory the probability of a type I error is called the prob-ability of false alarm (P ), whereas the probability of a type II error is calledthe probability of a miss (P ). The quantity 1 � P is the probability of de-tection (P ).
study the sensitivity of ROC for different combinations of , ,and . Fig. 2(b) shows the ROC curves for ,
, and . As intuitively expected, it can be seenthat for a given , the increases as the change point ap-proaches the middle of the time segment and the decreaseswhen the change points are towards the end points of the timesegment. The latter occurs because of the poor performance(higher variance) of the maximum likelihood estimate obtainedfrom the shorter segment due to the reduced number of samples.As a consequence, the presence of a change point might pass un-noticed when is small. For example, in Fig. 2(c) we observethat for , , , and a givenvalue, the increases with . Finally, in Fig. 2(d) for ,
, , and a given , we cannotobserve significant differences between the as increases.
Next, under and for , we study the esti-mation bias (detection delay) , where
. In our setup , i.e., wecan expect negative delays. Note that in a sequential detectionsetup a negative delay will be considered as a false alarm. Here,we are interested in studying the mean value of the detectiondelay
(38)
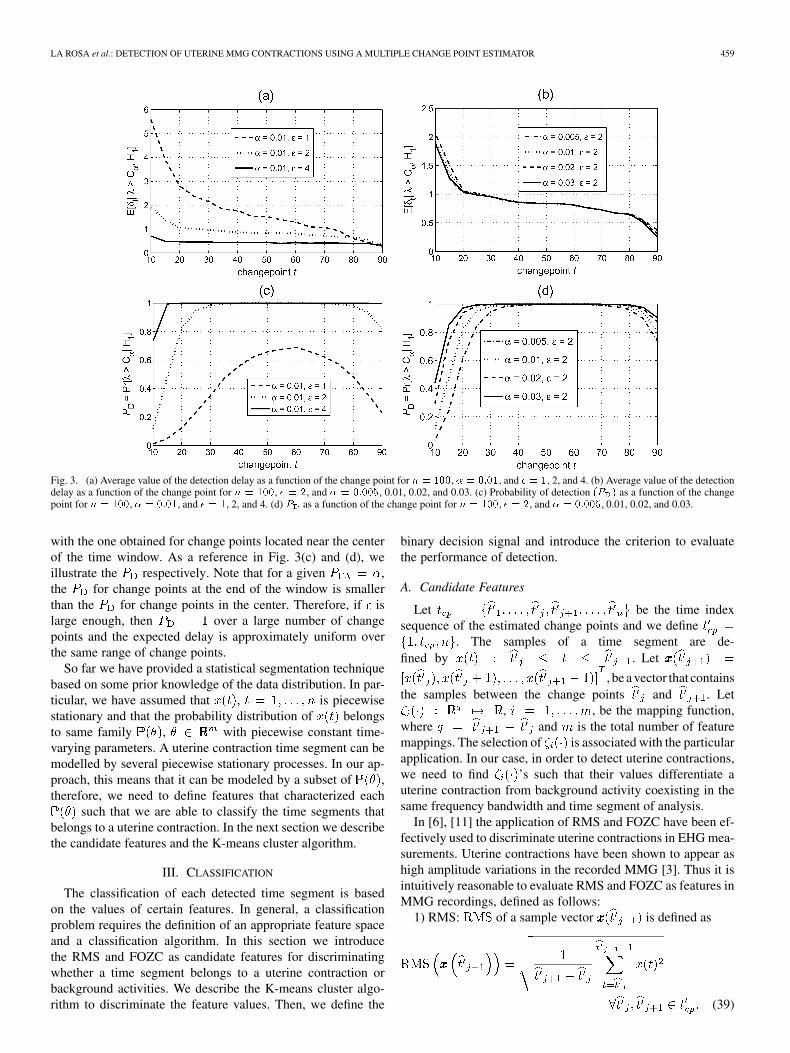
We compute (38) using 1000 Monte Carlo simulations.Fig. 3(a) and (b) illustrates the average value of in (38)as a function of the change point , in (a) for ,
, ; and in (b) for ,, . As expected, the average delay
decreases for larger values. Also, for change points near theorigin of the time segment, the expected delay is large compared
LA ROSA et al.: DETECTION OF UTERINE MMG CONTRACTIONS USING A MULTIPLE CHANGE POINT ESTIMATOR 459
Fig. 3. (a) Average value of the detection delay as a function of the change point for n = 100, � = 0:01, and � = 1, 2, and 4. (b) Average value of the detectiondelay as a function of the change point for n = 100, � = 2, and � = 0:005, 0.01, 0.02, and 0.03. (c) Probability of detection (P ) as a function of the changepoint for n = 100, � = 0:01, and � = 1, 2, and 4. (d) P as a function of the change point for n = 100, � = 2, and � = 0:005, 0.01, 0.02, and 0.03.
with the one obtained for change points located near the centerof the time window. As a reference in Fig. 3(c) and (d), weillustrate the respectively. Note that for a given ,the for change points at the end of the window is smallerthan the for change points in the center. Therefore, if islarge enough, then over a large number of changepoints and the expected delay is approximately uniform overthe same range of change points.
So far we have provided a statistical segmentation techniquebased on some prior knowledge of the data distribution. In par-ticular, we have assumed that , is piecewisestationary and that the probability distribution of belongsto same family , with piecewise constant time-varying parameters. A uterine contraction time segment can bemodelled by several piecewise stationary processes. In our ap-proach, this means that it can be modeled by a subset of ,therefore, we need to define features that characterized each
such that we are able to classify the time segments thatbelongs to a uterine contraction. In the next section we describethe candidate features and the K-means cluster algorithm.
III. CLASSIFICATION
The classification of each detected time segment is basedon the values of certain features. In general, a classificationproblem requires the definition of an appropriate feature spaceand a classification algorithm. In this section we introducethe RMS and FOZC as candidate features for discriminatingwhether a time segment belongs to a uterine contraction orbackground activities. We describe the K-means cluster algo-rithm to discriminate the feature values. Then, we define the
binary decision signal and introduce the criterion to evaluatethe performance of detection.
A. Candidate Features
Let be the time indexsequence of the estimated change points and we define
. The samples of a time segment are de-fined by . Let
, be a vector that containsthe samples between the change points and . Let
, , be the mapping function,where and is the total number of featuremappings. The selection of is associated with the particularapplication. In our case, in order to detect uterine contractions,we need to find ’s such that their values differentiate auterine contraction from background activity coexisting in thesame frequency bandwidth and time segment of analysis.
In [6], [11] the application of RMS and FOZC have been ef-fectively used to discriminate uterine contractions in EHG mea-surements. Uterine contractions have been shown to appear ashigh amplitude variations in the recorded MMG [3]. Thus it isintuitively reasonable to evaluate RMS and FOZC as features inMMG recordings, defined as follows:
1) RMS: of a sample vector is defined as
(39)
460 IEEE TRANSACTIONS ON BIOMEDICAL ENGINEERING, VOL. 55, NO. 2, FEBRUARY 2008
2) FOZC: is the first-order count of the number of zerocrossings on the time series in a given time segment [19]. It isgiven by
(40)
where and denotes the signfunction defined as if , and 0 otherwise.In general, zero crossing analysis is an effective tool for mod-eling the spectral characteristic of stochastic processes [19] andit has been applied for signal detection and estimation [19].For example, in [6] the authors show that the FOZC is appli-cable in detecting uterine contractions in EHG measurements.In particular, the dominant frequency principle [19] says thatthe normalized expected zero-crossing rate
, which is a weighted average of the spectral mass, tendsto admit values in the neighborhood of a significantly domi-nant frequency. Therefore, it is a practical way to discriminatechanges in spectrum between time segments.
B. Classification Algorithm
To discriminate the features we use the K-means clustering al-gorithm [20], which classifies the time segments into groupsbased on a set of features (RMS or FOZC, or both). K-means isone of the simplest unsupervised learning algorithms (althoughit requires a priori ) that solve the well-known clusteringproblem. This algorithm finds a partition in which objects withina cluster are as close to each other as possible, and as far fromobjects in other clusters as possible. The centroid of each clusteris the point to which the sum of the distances from all objects inthat cluster is minimized. The grouping is done by minimizingthe criterion , which is the sum of the squared distances be-tween the feature vectors and the corresponding cluster centroid
(41)
where foris the time-segment feature vector, is the centroid for
the cluster, is the total number of clusters fixed a priori,and is the Euclidean distance. The minimization of isperformed using an iterative algorithm, which essentially movesobjects between clusters until the sum cannot be decreased fur-ther. The algorithm is briefly described as follows [21]: the firststep consists in selecting randomly time-segment feature vec-tors from the population. These features represent initial cen-troids. At the second step, it assigns each features to the clustersthat has the closest centroid. After all the features have beenassigned, as a third step, the positions of the centroids are re-calculated. The second and third steps are repeated until thecentroids no longer move. Note that if the number of segments isless than the number of cluster , then no classification can beperformed and we assume that not contraction has taken place.
For example, if the total number of clusters is and thetotal number of time segments detected is equal to 2, so we onlyhave two features values to be classified, then no classificationis performed and it is assumed that there is not contraction inthe measurements.
C. Cluster Labelling and Binary Decision Signal
An advantage of the K-means cluster algorithm is that it is anonsupervised data classification technique. However, in orderto interpret the results, namely clusters labelling, it is requiredto have certain knowledge of the feature space. In this sense,for example, if the RMS is used as a feature, then we mightexpect the centroid with largest RMS value to be labelled as acontraction. Similarly, if the FOZC is used, we might assign as acontraction the centroid with lowest FOZC value. In practice, aswe discuss in the experimental results section, the feasibility ofdiscriminating a uterine contraction using the RMS and FOZCdepends also on the segmentation stage.
Let be the set of clusters labels,where is the label assigned arbitrarily by the classi-fication algorithm to a resulting cluster. Also, let bethe set of clusters assigned as a contraction based on a certaincriterion. Therefore, a time segment is classified as acontraction if its feature . Then, the binary deci-sion signal is defined as follows:
if
otherwise(42)
where .
D. Performance Evaluation
Let , be the binary reference signal according,for example, to the patient’s feedback, i.e., indicatesthe presence of a contraction at sample . Then, we evaluatethe performance of the detection algorithm by computing thedetection ratio (DR), false alarm ratio (FAR), and correlationcoefficient (CORR) which are defined as follows:
(43)
if or
(44)
The DR computes the percentage of agreements in detectionbetween and for given the total numbersof time-samples with contractions according to . The FARcomputes the percentage of disagreements in detection (falsealarm) between and for given the total num-bers of time-samples without contractions according to .The CORR indicates how similar is the sequence andin the time interval .
LA ROSA et al.: DETECTION OF UTERINE MMG CONTRACTIONS USING A MULTIPLE CHANGE POINT ESTIMATOR 461
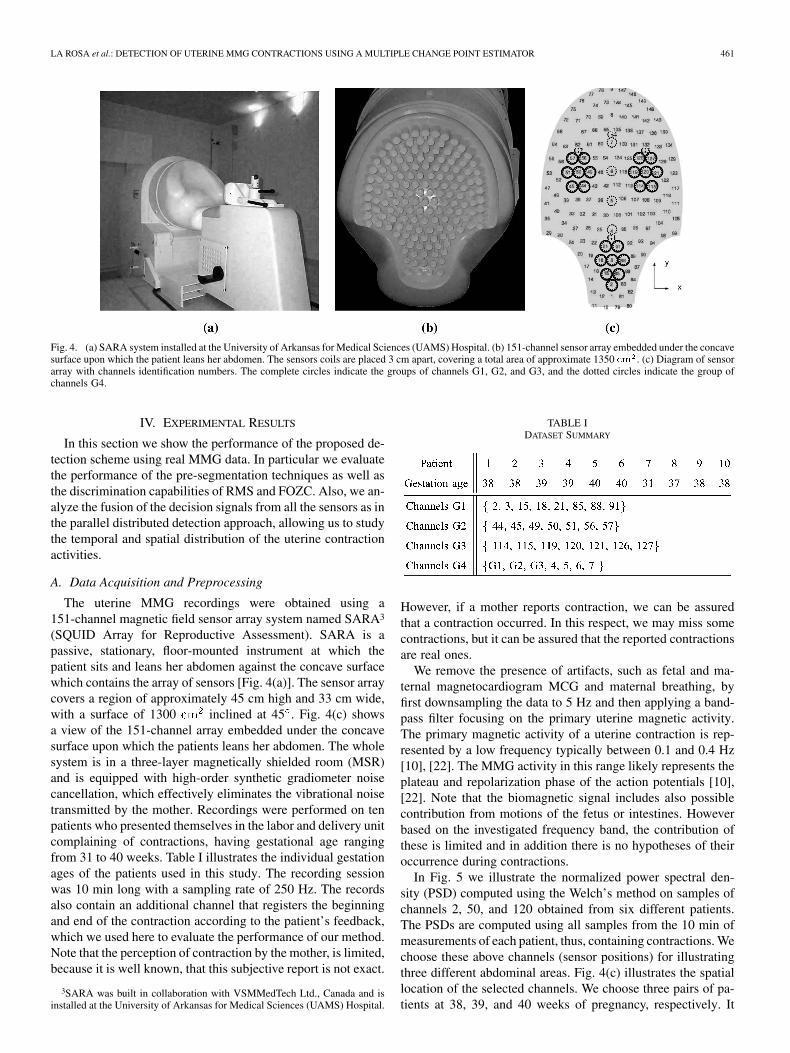
Fig. 4. (a) SARA system installed at the University of Arkansas for Medical Sciences (UAMS) Hospital. (b) 151-channel sensor array embedded under the concavesurface upon which the patient leans her abdomen. The sensors coils are placed 3 cm apart, covering a total area of approximate 1350 cm . (c) Diagram of sensorarray with channels identification numbers. The complete circles indicate the groups of channels G1, G2, and G3, and the dotted circles indicate the group ofchannels G4.
IV. EXPERIMENTAL RESULTS
In this section we show the performance of the proposed de-tection scheme using real MMG data. In particular we evaluatethe performance of the pre-segmentation techniques as well asthe discrimination capabilities of RMS and FOZC. Also, we an-alyze the fusion of the decision signals from all the sensors as inthe parallel distributed detection approach, allowing us to studythe temporal and spatial distribution of the uterine contractionactivities.
A. Data Acquisition and Preprocessing
The uterine MMG recordings were obtained using a151-channel magnetic field sensor array system named SARA3
(SQUID Array for Reproductive Assessment). SARA is apassive, stationary, floor-mounted instrument at which thepatient sits and leans her abdomen against the concave surfacewhich contains the array of sensors [Fig. 4(a)]. The sensor arraycovers a region of approximately 45 cm high and 33 cm wide,with a surface of 1300 inclined at 45 . Fig. 4(c) showsa view of the 151-channel array embedded under the concavesurface upon which the patients leans her abdomen. The wholesystem is in a three-layer magnetically shielded room (MSR)and is equipped with high-order synthetic gradiometer noisecancellation, which effectively eliminates the vibrational noisetransmitted by the mother. Recordings were performed on tenpatients who presented themselves in the labor and delivery unitcomplaining of contractions, having gestational age rangingfrom 31 to 40 weeks. Table I illustrates the individual gestationages of the patients used in this study. The recording sessionwas 10 min long with a sampling rate of 250 Hz. The recordsalso contain an additional channel that registers the beginningand end of the contraction according to the patient’s feedback,which we used here to evaluate the performance of our method.Note that the perception of contraction by the mother, is limited,because it is well known, that this subjective report is not exact.
3SARA was built in collaboration with VSMMedTech Ltd., Canada and isinstalled at the University of Arkansas for Medical Sciences (UAMS) Hospital.
TABLE IDATASET SUMMARY
However, if a mother reports contraction, we can be assuredthat a contraction occurred. In this respect, we may miss somecontractions, but it can be assured that the reported contractionsare real ones.
We remove the presence of artifacts, such as fetal and ma-ternal magnetocardiogram MCG and maternal breathing, byfirst downsampling the data to 5 Hz and then applying a band-pass filter focusing on the primary uterine magnetic activity.The primary magnetic activity of a uterine contraction is rep-resented by a low frequency typically between 0.1 and 0.4 Hz[10], [22]. The MMG activity in this range likely represents theplateau and repolarization phase of the action potentials [10],[22]. Note that the biomagnetic signal includes also possiblecontribution from motions of the fetus or intestines. Howeverbased on the investigated frequency band, the contribution ofthese is limited and in addition there is no hypotheses of theiroccurrence during contractions.
In Fig. 5 we illustrate the normalized power spectral den-sity (PSD) computed using the Welch’s method on samples ofchannels 2, 50, and 120 obtained from six different patients.The PSDs are computed using all samples from the 10 min ofmeasurements of each patient, thus, containing contractions. Wechoose these above channels (sensor positions) for illustratingthree different abdominal areas. Fig. 4(c) illustrates the spatiallocation of the selected channels. We choose three pairs of pa-tients at 38, 39, and 40 weeks of pregnancy, respectively. It

462 IEEE TRANSACTIONS ON BIOMEDICAL ENGINEERING, VOL. 55, NO. 2, FEBRUARY 2008
Fig. 5. Power spectral density (PSD) computed using the Welch’s method on samples of channels 2, 50, and 120 obtained from six different patients with gesta-tional age between 38 and 40 weeks.
can be seen that we cannot distinguish a common PSD patternamong the different patients. Therefore, we study the perfor-mance of the detection algorithm in the frequency ranges givenby 0.1 to 0.4 Hz, and 0.2 to 0.4 Hz, looking for and adequateband range that maximizes in average the detection of contrac-tions. In each case, we apply equiripple FIR bandpass filters tothe downsampled measurement, with lower and upper pass fre-quency limits and , respectively, given by the limits ofthe frequency ranges defined above. The upper and lower stopfrequencies are and , respectively,with . The gains in the pass and stop band are con-strained to 0 dB and 60 dB, respectively, and the maximumallowed ripple in both bands is 0.05 dB.
B. Model Order Estimation, Feature Evaluation and ClusterLabelling
The segmentation stage requires the estimation of the modelorder , which can be estimated, for example, using the approachproposed in Section II-B2. In practice, we found that this ap-proach performed well only in a portion of channels, while in theremaining part, it did not lead to a good performance. Namely, inchannels with visible presence of contractions we obtained thatthe model order that minimized the has a large value and itdid not lead to detection of changes. However, we also found thatfor all the channels the number of change points detected tendsto decrease as the model order increases. Therefore, in practice,the model order can be thought as a resolution parameter interms of the number of change points detected.
We evaluated, the discriminating capabilities of the RMS andFOZC by computing them on the time segments detected in both
frequency ranges for and with significance value. We found that the RMS is a good candidate feature
to discriminate between time segments with and without con-tractions according to the patient’s feedback. In particular, wefound that in both frequencies ranges of analysis the time seg-ments with contractions usually have larger RMS values thantime segments without contractions. In the case of the FOZC,we were not able to find a consistent pattern for discrimination.One possible reason might be the reduced length of some es-timated time segments specially when a contraction is takingplace. Therefore, in our examples below we use the RMS as afeature to identify the presence of a contraction in a particulartime segment.
Assuming that the preprocessed records in the analyzed fre-quency ranges contain only the presence of uterine contractions,then RMS values are related to the energy evolution of the burstof uterine activities. Therefore, if we divide the RMS value intothree groups, the largest values of RMS correspond to the peakphase of the burst of activities, the second larger ones corre-spond to the rising and falling phase, and the smallest values rep-resent the resting state. Using the assumption above, we classifythe RMS values in all the examples below using the K-meanscluster algorithm by fixing the number of clusters at three.Thus, we label as a contraction the time segments during whichRMS values belong to the two clusters with largest centroids.In practice, we observed that the RMS values are more likelyto be classified in three groups rather than two, specially dueto the presence of large RMS values or peaks. In this sense theclassification using only two groups assigns centroids aroundthe peaks, and as a consequence, very often assigns the middlelevel RMS values as background noise.

LA ROSA et al.: DETECTION OF UTERINE MMG CONTRACTIONS USING A MULTIPLE CHANGE POINT ESTIMATOR 463
Fig. 6. Bandpass filtered records from channel 2 of patient 6 with a gestational age of 40 weeks: (a) preprocessed channel with grid lines indicating the estimatedchange points for d = 1 and � = 0:01; (b) RMS in each time segment; (c) FOZC in each time segment; (d) cluster groups using RMS features; (e) estimatedcontractions segments; (f) time segments with contractions according to the patient feedback.
As an example, we illustrate in Fig. 6 the records fromchannel 2 of patient 6 at 40 weeks of pregnancy, bandpass fil-tered between 0.2 and 0.4 Hz. Fig. 6(a) shows the downsampledand filtered signals. The vertical grid lines indicate the estimatedchange points according to an AR model with orderand . We choose since, as we discuss in thenext subsection, the detection methods achieves in average themaximum DR and CORR in the given frequency range. It canbe seen that the number of change points estimated increasesat the time intervals when the patient indicates the presenceof a contraction. This observation suggest that the samplesthat belongs to the contraction interval might be modelledby an AR model with a larger model order. Fig. 6(b) and (c)illustrates the RMS and FOZC computed on the estimated timesegments. In general we observe that in this frequency range theFOZC does not identify the presence of a contraction very wellaccording to the patient’s feedback. Fig. 6(d) shows the clustergroups obtained after applying the K-means algorithm on theRMS values. The cluster labels are given in ascending orderaccording to the centroid RMS values, i.e. label 3 is the centroidwith largest RMS value. Fig. 6(e) shows the binary decisionsignal amplified by 1.2 times the maximum value of thepreprocessed measurements. In this case, the RMS values thatbelongs to the two clusters with largest centroids values wereclassified as a contraction. Fig. 6(f) illustrates the time-intervalswhich the patient acknowledged the presence of a contraction.
C. Performance Analysis and Discussion
We evaluate the DR, FAR, and CORR of the detector algo-rithm in ten patients in four group of channels defined in Table I.We select the groups according to their relative position in the
array. Fig. 4(c) illustrates the array with the selected group ofchannels.
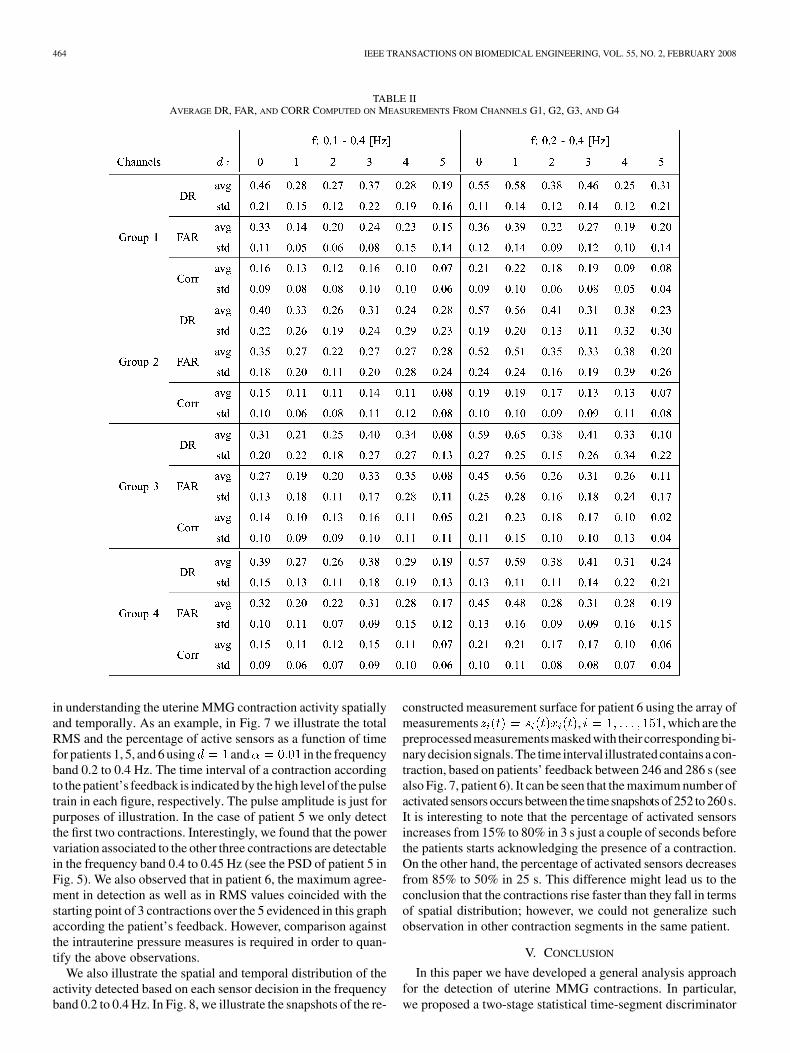
Table II illustrates the average and standard deviation of DR,FAR, and CORR computed in each group of channels G1, G2,G3, and G4 for the ten patients used in this study, for
with . The case , assumes that themean of the process is zero, therefore, we look for changes invariance. Here, to simplify our analyzes below, we apply thesame value to all channels from the same patient. From theresults obtained, the detector performance with respect to thefrequency band and with respect to the sensor positions. Weobserve that the maximum average DR and average CORR areachieved consistently in all groups of channels for equals to 0and 1, in the frequency range 0.2–0.4 Hz. Also, in the same fre-quency range for , 1, the lowest average FAR are obtainedin the group of channels G1. We obtain that in the frequencyrange 0.1–0.4 Hz, the maximum average DR and average CORRare obtained for , 3.
Note that we have to consider that each single channel detectordecides the presence of a contraction based on local spatial in-formation; thus a detection classified as FA might be indicatingthe occurrence of a burst of activity in the myometrium; how-ever its power and surface distribution might not be sufficient tobe detected by the patient. Therefore, we also analyze the tem-poral-spatial detection of the sensor array by fusing the decisionsignals as in the parallel distributed detection approach. In partic-ular, we illustrate the percentage of active sensors as a functionof time, which is the result of adding all binary decision signals,obtained from processing every channel, normalized by the totalnumber of channels. Also, in each sensor, we compute the RMSon the time segment estimated as contraction and we illustrate thetotal RMS as function of time. This approach proves to be helpful
464 IEEE TRANSACTIONS ON BIOMEDICAL ENGINEERING, VOL. 55, NO. 2, FEBRUARY 2008
TABLE IIAVERAGE DR, FAR, AND CORR COMPUTED ON MEASUREMENTS FROM CHANNELS G1, G2, G3, AND G4
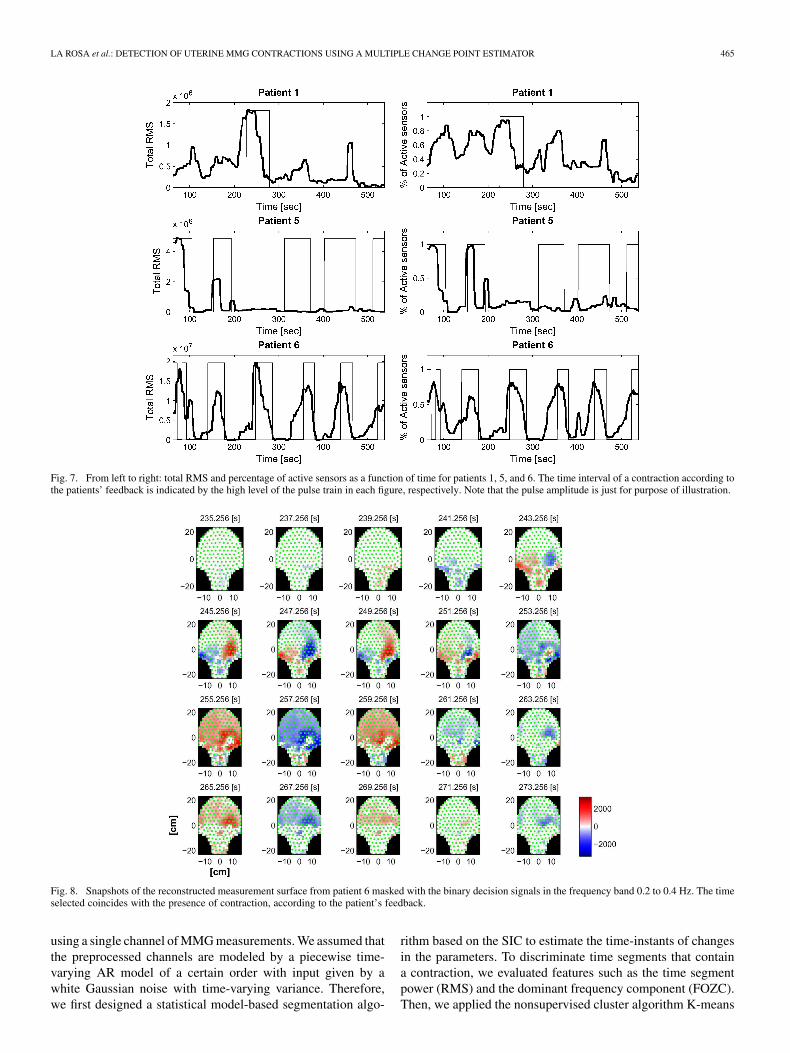
in understanding the uterine MMG contraction activity spatiallyand temporally. As an example, in Fig. 7 we illustrate the totalRMS and the percentage of active sensors as a function of timefor patients 1, 5, and 6 using and in the frequencyband 0.2 to 0.4 Hz. The time interval of a contraction accordingto the patient’s feedback is indicated by the high level of the pulsetrain in each figure, respectively. The pulse amplitude is just forpurposes of illustration. In the case of patient 5 we only detectthe first two contractions. Interestingly, we found that the powervariation associated to the other three contractions are detectablein the frequency band 0.4 to 0.45 Hz (see the PSD of patient 5 inFig. 5). We also observed that in patient 6, the maximum agree-ment in detection as well as in RMS values coincided with thestarting point of 3 contractions over the 5 evidenced in this graphaccording the patient’s feedback. However, comparison againstthe intrauterine pressure measures is required in order to quan-tify the above observations.
We also illustrate the spatial and temporal distribution of theactivity detected based on each sensor decision in the frequencyband 0.2 to 0.4 Hz. In Fig. 8, we illustrate the snapshots of the re-
constructed measurement surface for patient 6 using the array ofmeasurements , , which are thepreprocessed measurements masked with their corresponding bi-nary decisionsignals. The time interval illustrated containsa con-traction, based on patients’ feedback between 246 and 286 s (seealso Fig. 7, patient 6). It can be seen that the maximum number ofactivated sensors occurs between the timesnapshots of 252 to 260 s.It is interesting to note that the percentage of activated sensorsincreases from 15% to 80% in 3 s just a couple of seconds beforethe patients starts acknowledging the presence of a contraction.On the other hand, the percentage of activated sensors decreasesfrom 85% to 50% in 25 s. This difference might lead us to theconclusion that the contractions rise faster than they fall in termsof spatial distribution; however, we could not generalize suchobservation in other contraction segments in the same patient.
V. CONCLUSION
In this paper we have developed a general analysis approachfor the detection of uterine MMG contractions. In particular,we proposed a two-stage statistical time-segment discriminator
LA ROSA et al.: DETECTION OF UTERINE MMG CONTRACTIONS USING A MULTIPLE CHANGE POINT ESTIMATOR 465
Fig. 7. From left to right: total RMS and percentage of active sensors as a function of time for patients 1, 5, and 6. The time interval of a contraction according tothe patients’ feedback is indicated by the high level of the pulse train in each figure, respectively. Note that the pulse amplitude is just for purpose of illustration.
Fig. 8. Snapshots of the reconstructed measurement surface from patient 6 masked with the binary decision signals in the frequency band 0.2 to 0.4 Hz. The timeselected coincides with the presence of contraction, according to the patient’s feedback.
using a single channel of MMG measurements. We assumed thatthe preprocessed channels are modeled by a piecewise time-varying AR model of a certain order with input given by awhite Gaussian noise with time-varying variance. Therefore,we first designed a statistical model-based segmentation algo-
rithm based on the SIC to estimate the time-instants of changesin the parameters. To discriminate time segments that containa contraction, we evaluated features such as the time segmentpower (RMS) and the dominant frequency component (FOZC).Then, we applied the nonsupervised cluster algorithm K-means

466 IEEE TRANSACTIONS ON BIOMEDICAL ENGINEERING, VOL. 55, NO. 2, FEBRUARY 2008
to classify the RMS values, obtaining then a discrete-time bi-nary decision signal indicating the presence of a contraction.
The detection of multiple change points is performed usinga binary search algorithm; therefore, the problem is simplifiedby testing the hypothesis for a single change point. In thiswork, using the asymptotic distribution of the test statisticsbased on SIC, we obtained optimal thresholds in the senseof the Neyman–Pearson criterion; therefore, we controlledthe probability of false alarm and maximized the probabilityof change-point detection in each stage of the binary searchalgorithm. We also proposed an estimate of the model order
. However, in practice, this approach performed well onlyin a group of channels from the same patient, suggesting thata different model for segmentation should be attempted. Forexample, allowing for time segments with piecewise constanttime-varying model orders to avoid over segmentation.
We applied our detection algorithm to real MMG records ob-tained from ten patients with gestational ages between 31 and 40weeks, who were admitted to the hospital for contractions. Wefound that the RMS values discriminate the presence of timesegment with contractions. However, that result was not ob-tained in the case of the FOZC values. We evaluated the perfor-mance of our detection algorithm by computing the DR, FAR,and CORR, respectively, using as a reference the patient’s feed-back. We observed that the maximum average DR and averageCORR are achieved consistently in all groups of channels for
equals to 0 and 1, in the frequency range 0.2–0.4 Hz. Also,in the same frequency range for , 1, the lowest averageFAR are obtained in the group of channels G1. We obtain thatin the frequency range 0.1–0.4 Hz, the maximum average DRand average CORR are obtained for , 3. Thus, in average,a variance based algorithm is suitable to detect contrac-tions using the RMS values.
Since each single channel detector provided local informa-tion, regarding the presence of a burst of activities, we also an-alyzed the fusion of the decision signals from all the sensorsas in the parallel distributed detection approach. This approachproved helpful in understanding the uterine MMG contractionactivity both spatially and temporally. In further studies we willaddress the optimization of the detection by evaluating addi-tional features of the preprocessed measurements. We will alsodevelop a biomagnetic compatible pressure measurement de-vice for a better recording of the intrauterine pressure and pro-vide a more precise approach to validate the performance of ourmethod with real measurements, as well as, to allow for com-parison with other methods.
APPENDIX
DETERMINATION OF FOR THE SIC CHANGE POINT
DETECTOR BASED ON AN AR-MODEL
Let , where.
[23] showed that the asymptotic distribution of is given by
(45)
where
Let . Then,. Thus
(46)
Hence, using (45)
(47)
Then, solving for
(48)
ACKNOWLEDGMENT
The authors are grateful to Dr. C. Muravchick, Dr. N. Cao,and the anonymous reviewers for their helpful comments thatimprove the quality on this work.
REFERENCES
[1] J. Gondry, J. Duchene, and C. Marque, “First results on uterine EMGmonitoring during pregnancy,” in Proc. Ann. Int. Conf. IEEE EMBS,1992, vol. 6, pp. 2609–2610.
[2] H. Eswaran, H. Preissl, J. D. Wilson, P. Murphy, and C. Lowery, “Pre-diction of labor in term and preterm pregnancies using non-invasivemagnetomyographic recordings of uterine contractions,” J. Maternal-Fetal Neonatal Med., vol. 190, pp. 1598–1603, 2004.
[3] H. Eswaran, H. Preissl, J. D. Wilson, P. Murphy, S. Robinson, and C.Lowery, “First magnetomyographic recordings of uterine activity withspatial-temporal information with 151-channel sensor array,” Amer. J.Obstetrics Gyn., vol. 187, pp. 145–151, 2002.
[4] D. Devedeux, C. Marque, D. Mansour, S. Germain, and J. Duchene,“Uterine electromyography: A critical review,” Amer. J. ObstetricsGyn., vol. 169, pp. 1636–1653, 1993.
[5] J. Duchene, D. Devedeux, D. Mansour, and C. Marque, “Analyzinguterine EMG: Tracking instantaneous burst frequency,” IEEE Trans.Eng. Med. Biol. Mag., vol. 14, pp. 125–132, 1993.
[6] N. Radhakrishnan, J. D. Wilson, C. Lowery, H. Eswaran, and P.Murphy, “A fast algorithm for detecting contractions in uterineelectromyography,” IEEE Eng. Med. Biol. Mag., vol. 19, pp. 89–94,Mar./Apr. 2000.
[7] K. Horoba, J. Jezewski, J. Wrobel, and S. Graczyk, “Algorithm fordetection of uterine contractions from electrohysterogram,” in Proc.23rd Int. Conf. IEEE EMBS, 2001, pp. 461–464.
LA ROSA et al.: DETECTION OF UTERINE MMG CONTRACTIONS USING A MULTIPLE CHANGE POINT ESTIMATOR 467
[8] J. Jezewski, K. Horoba, A. Matonia, and J. Wrobel, “Quantitativeanalysis of contraction patterns in electrical activity signal of pregnantuterus as an alternative to mechanical approach,” Physiol. Meas., vol.26, pp. 753–767, Jul. 2005.
[9] M. Khalil and J. Duchene, “Uterine EMG analysis: A dynamic ap-proach for change detection and classification,” IEEE Trans. Biomed.Eng., vol. 47, pp. 748–756, Jun. 2000.
[10] C. Ramon, H. Preissl, P. Murphy, J. D. Wilson, C. Lowery, and H.Eswaran, “Synchronization analysis of the uterine magnetic activityduring contractions,” Biomed. Eng. Online, vol. 4:55, 2005, 10.1186/1475-925X-4-55.
[11] J. Ramondt, C. van Kooten, A. Verhoeff, and H. Wallenburg, “Com-puter analysis of mechanical and electrical uterine activity,” Med. Biol.Eng. Comput., vol. 24, pp. 351–355, 1986.
[12] S. Mallat, “A theory for multiresolution signal decomposition: Thewavelet representation,” IEEE Trans. Pattern Anal. Machine Intell., pp.674–693, Jun. 1989.
[13] J. Duchene and F. Goubel, “Surface electromyogram during volun-tary contraction: Processing tools and relation to physiological events,”Critical Rev. Biomed. Eng., vol. 21, pp. 313–397, Jun. 1993.
[14] G. Inbar, J. Allin, O. Paiss, and H. Kranz, “Monitoring surface EMGspectral changes by the zero crossing rate,” Med. Biol. Eng. Comput.,vol. 31, p. 597, 1984.
[15] L. J. Vostrikova, “Detecting ‘disorder’ in multidimensional randomprocesses,” Soviet Math. Doklady, vol. 24, pp. 55–59, 1981.
[16] J. Chen and A. K. Gupta, “Testing and locating variance changepointswith applications to stock,” J. Amer. Stat. Assoc., vol. 92, pp. 739–747,June 1997.
[17] H. Akaike, “Information theory and an extension of the maximum like-lihood principle,” in Proc. 2nd Int. Symp. Information Theory, B. N.Petrov and B. A. K. E. Csaki, Eds., 1973, pp. 267–281.
[18] G. Schwarz, “Estimating the dimension of a model,” Annals Stat., vol.6, pp. 461–464, Mar. 1978.
[19] B. Kedem, “Spectral analysis and discrimination by zero-crossings,”Proc. IEEE, vol. 74, pp. 282–304, Nov. 1986.
[20] J. MacQueen, “Some methods for classification and analysis of multi-variate observations,” in Proc. 5th Symp. Math. Stat. Probab., Berkeley,CA, 1967, no. 1, pp. 281–297.
[21] C. M. Bishop, Neural Networks for Pattern Recognition. Oxford,U.K.: Oxford Univ. Press, 1995.
[22] R. Nagarajan, H. Eswaran, J. D. Wilson, P. Murphy, C. Lowery, andH. Preissl, “Analysis of uterine contractions: A dynamical approach,”J. Maternal-Fetal Neonatal Med., vol. 14, pp. 8–21, Mar. 2003.
[23] R. A. Davis, D. Huang, and Y. Yao, “Testing for a change in the pa-rameter values and order of an autoregressive model,” Ann. Stat., vol.23, pp. 282–304, Feb. 1995.
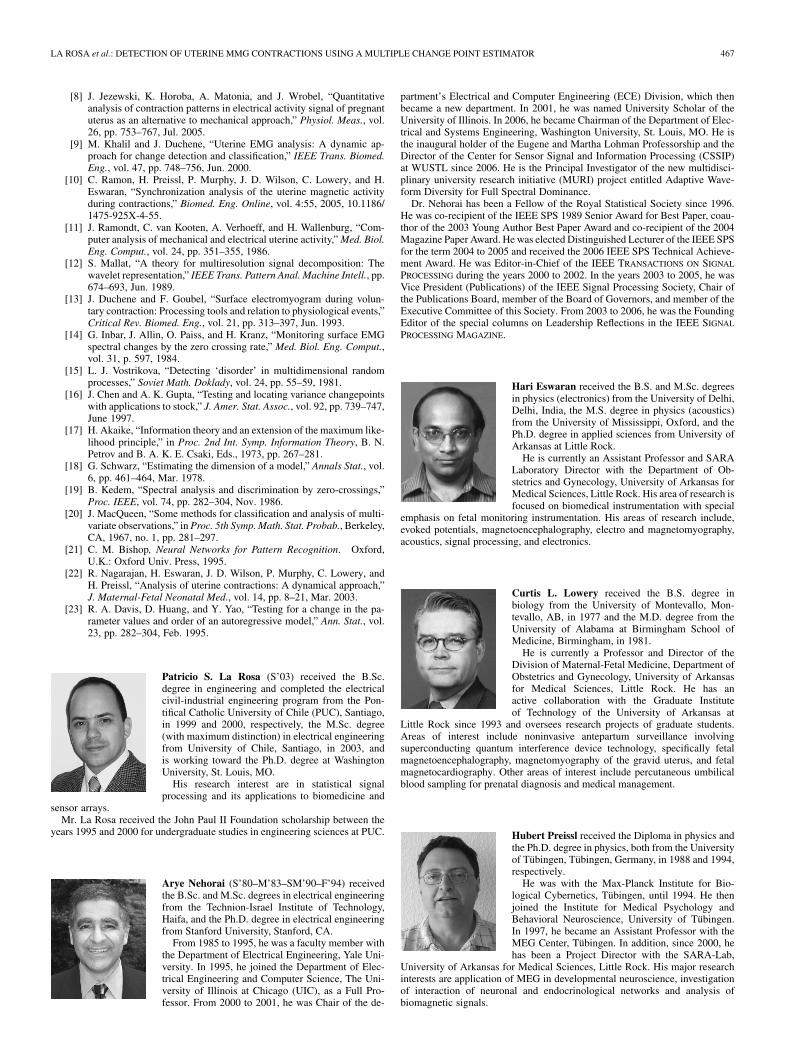
Patricio S. La Rosa (S’03) received the B.Sc.degree in engineering and completed the electricalcivil-industrial engineering program from the Pon-tifical Catholic University of Chile (PUC), Santiago,in 1999 and 2000, respectively, the M.Sc. degree(with maximum distinction) in electrical engineeringfrom University of Chile, Santiago, in 2003, andis working toward the Ph.D. degree at WashingtonUniversity, St. Louis, MO.
His research interest are in statistical signalprocessing and its applications to biomedicine and
sensor arrays.Mr. La Rosa received the John Paul II Foundation scholarship between the
years 1995 and 2000 for undergraduate studies in engineering sciences at PUC.
Arye Nehorai (S’80–M’83–SM’90–F’94) receivedthe B.Sc. and M.Sc. degrees in electrical engineeringfrom the Technion-Israel Institute of Technology,Haifa, and the Ph.D. degree in electrical engineeringfrom Stanford University, Stanford, CA.
From 1985 to 1995, he was a faculty member withthe Department of Electrical Engineering, Yale Uni-versity. In 1995, he joined the Department of Elec-trical Engineering and Computer Science, The Uni-versity of Illinois at Chicago (UIC), as a Full Pro-fessor. From 2000 to 2001, he was Chair of the de-
partment’s Electrical and Computer Engineering (ECE) Division, which thenbecame a new department. In 2001, he was named University Scholar of theUniversity of Illinois. In 2006, he became Chairman of the Department of Elec-trical and Systems Engineering, Washington University, St. Louis, MO. He isthe inaugural holder of the Eugene and Martha Lohman Professorship and theDirector of the Center for Sensor Signal and Information Processing (CSSIP)at WUSTL since 2006. He is the Principal Investigator of the new multidisci-plinary university research initiative (MURI) project entitled Adaptive Wave-form Diversity for Full Spectral Dominance.
Dr. Nehorai has been a Fellow of the Royal Statistical Society since 1996.He was co-recipient of the IEEE SPS 1989 Senior Award for Best Paper, coau-thor of the 2003 Young Author Best Paper Award and co-recipient of the 2004Magazine Paper Award. He was elected Distinguished Lecturer of the IEEE SPSfor the term 2004 to 2005 and received the 2006 IEEE SPS Technical Achieve-ment Award. He was Editor-in-Chief of the IEEE TRANSACTIONS ON SIGNAL
PROCESSING during the years 2000 to 2002. In the years 2003 to 2005, he wasVice President (Publications) of the IEEE Signal Processing Society, Chair ofthe Publications Board, member of the Board of Governors, and member of theExecutive Committee of this Society. From 2003 to 2006, he was the FoundingEditor of the special columns on Leadership Reflections in the IEEE SIGNAL
PROCESSING MAGAZINE.
Hari Eswaran received the B.S. and M.Sc. degreesin physics (electronics) from the University of Delhi,Delhi, India, the M.S. degree in physics (acoustics)from the University of Mississippi, Oxford, and thePh.D. degree in applied sciences from University ofArkansas at Little Rock.
He is currently an Assistant Professor and SARALaboratory Director with the Department of Ob-stetrics and Gynecology, University of Arkansas forMedical Sciences, Little Rock. His area of research isfocused on biomedical instrumentation with special
emphasis on fetal monitoring instrumentation. His areas of research include,evoked potentials, magnetoencephalography, electro and magnetomyography,acoustics, signal processing, and electronics.
Curtis L. Lowery received the B.S. degree inbiology from the University of Montevallo, Mon-tevallo, AB, in 1977 and the M.D. degree from theUniversity of Alabama at Birmingham School ofMedicine, Birmingham, in 1981.
He is currently a Professor and Director of theDivision of Maternal-Fetal Medicine, Department ofObstetrics and Gynecology, University of Arkansasfor Medical Sciences, Little Rock. He has anactive collaboration with the Graduate Instituteof Technology of the University of Arkansas at
Little Rock since 1993 and oversees research projects of graduate students.Areas of interest include noninvasive antepartum surveillance involvingsuperconducting quantum interference device technology, specifically fetalmagnetoencephalography, magnetomyography of the gravid uterus, and fetalmagnetocardiography. Other areas of interest include percutaneous umbilicalblood sampling for prenatal diagnosis and medical management.
Hubert Preissl received the Diploma in physics andthe Ph.D. degree in physics, both from the Universityof Tübingen, Tübingen, Germany, in 1988 and 1994,respectively.
He was with the Max-Planck Institute for Bio-logical Cybernetics, Tübingen, until 1994. He thenjoined the Institute for Medical Psychology andBehavioral Neuroscience, University of Tübingen.In 1997, he became an Assistant Professor with theMEG Center, Tübingen. In addition, since 2000, hehas been a Project Director with the SARA-Lab,
University of Arkansas for Medical Sciences, Little Rock. His major researchinterests are application of MEG in developmental neuroscience, investigationof interaction of neuronal and endocrinological networks and analysis ofbiomagnetic signals.