Detection of Phytophthora taxon Agathis (PTA): Final Report
91
Detection of Phytophthora taxon Agathis (PTA): Final Report Contracts: 11213, 11215, 12093
-
Upload
khangminh22 -
Category
Documents
-
view
6 -
download
0
Transcript of Detection of Phytophthora taxon Agathis (PTA): Final Report

Detection of Phytophthora taxon Agathis (PTA):
Final Report
Contracts: 11213, 11215, 12093

Detection of Phytophthora taxon Agathis (PTA):
Final Report
Ross E Beever, Stanley E Bellgard
Landcare Research
Margaret A Dick1, Ian J Horner2 and Tod D Ramsfield1
1Scion and 2Plant and Food Research
Prepared for:
Ministry for Agriculture & Forestry, Biosecurity New Zealand (on behalf of Kauri Dieback Joint Agency)
PO Box 2526 Wellington 6140 New Zealand
October 2010
Landcare Research, 231 Morrin Road, St Johns, Private Bag 92170, Auckland 1142, New Zealand, Ph +64 9 574 4100, Fax +64 9 574 4101, www.landcareresearch.co.nz
Scion, Private Bag 3020, Rotorua 3046, New Zealand
Plant and Food Research, Private Bag 1401, Havelock North 4157, New Zealand


Landcare Research Page iii
Contents
Foreword.....................................................................................................................................v
Summary ................................................................................................................................... vii
1 Introduction.......................................................................................................................1
2 Background........................................................................................................................1
2.1 History of PTA in New Zealand.................................................................................1
2.2 Knowledge gaps .......................................................................................................2
2.3 Phytophthora diseases worldwide...........................................................................2
2.4 Phytophthora diseases in forest ecosystems...........................................................3
2.5 Phytophthora taxonomy, biology and epidemiology ..............................................3
2.6 Isolation and detection of Phytophthora spp. .........................................................5
2.7 Interpretation of kauri symptoms ...........................................................................7
3 Objectives ........................................................................................................................10
4 Methods ..........................................................................................................................10
4.1 Soil sampling ..........................................................................................................10
4.2 Bait comparisons....................................................................................................13
4.3 Optimising incubation conditions ..........................................................................17
4.4 Symptomology .......................................................................................................19
5 Soil sampling results ........................................................................................................24
5.1 Bait comparisons: using sterile zoosporangium bioassay .....................................24
5.2 Bait comparisons: using a soil‐based bioassay ......................................................25
5.3 Optimising incubation conditions ..........................................................................26
5.4 Validation of soil sampling and extended bioassay...............................................30
6 Tissue detection results...................................................................................................32
Detection of Phytophthora taxon Agathis (PTA)
Page iv Landcare Research
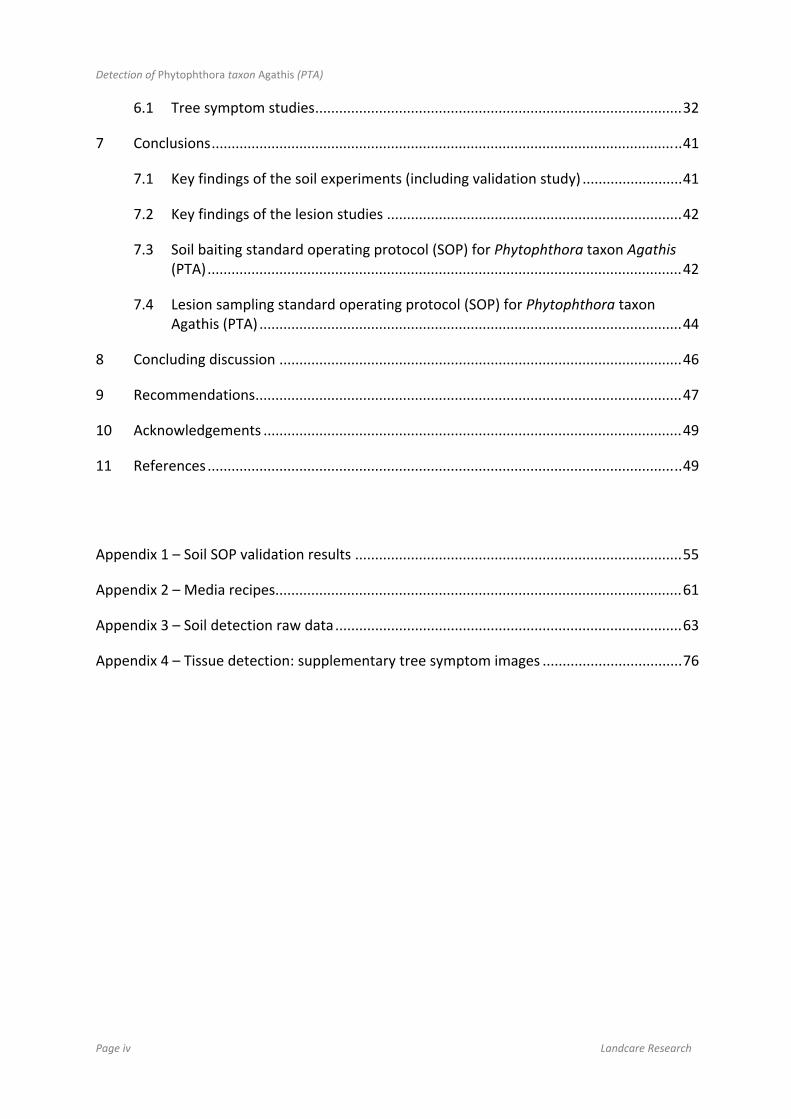
6.1 Tree symptom studies............................................................................................32
7 Conclusions......................................................................................................................41
7.1 Key findings of the soil experiments (including validation study) .........................41
7.2 Key findings of the lesion studies ..........................................................................42
7.3 Soil baiting standard operating protocol (SOP) for Phytophthora taxon Agathis (PTA).......................................................................................................................42
7.4 Lesion sampling standard operating protocol (SOP) for Phytophthora taxon Agathis (PTA) ..........................................................................................................44
8 Concluding discussion .....................................................................................................46
9 Recommendations...........................................................................................................47
10 Acknowledgements .........................................................................................................49
11 References .......................................................................................................................49
Appendix 1 – Soil SOP validation results ..................................................................................55
Appendix 2 – Media recipes......................................................................................................61
Appendix 3 – Soil detection raw data.......................................................................................63
Appendix 4 – Tissue detection: supplementary tree symptom images ...................................76

Landcare Research Page v
Foreword
Before commencing with the formal part of this report, we consider it appropriate to pay due respect to the lead researcher and champion of this research effort, Dr Ross Ewen Beever. Much of what we know about Phytophthora taxon Agathis PTA and kauri collar rot has been gleaned through research that Ross has pioneered. Ross was the first to recognise the association between kauri decline and PTA; and that PTA was not in fact P. heveae as first thought in 1974.
Ross was also the key designer and author of this experimental research package – its execution, and project management. He was pivotal in establishing this cooperative and collaborative research effort and strove tirelessly for the promotion of the ‘kauri – at-risk’ issue, to seek resources to fully understand the risk PTA poses to kauri. Furthermore, he sought to understand the longer-term, potential implications for ecosystem simplification through the selective removal of this keystone taonga species.
Ross also recognised the role of iwi engagement and role of matauranga in the fusion of all complementary expertise to address this urgent issue. To this end he established, on behalf of Landcare Research, a Memorandum of Understanding with Te Roroa and the Waipoua Forest Trust, and sought resources for collaborative projects with iwi. Through his successful negotiation and liaison, we gained the necessary high-level DOC permit and iwi permission necessary to undertake tree and soil sampling in Northland’s Waipoua Forest and Trounson Kauri Park.
With respect to the report herein, we have included only a small proportion of the volumes of meticulous serial dissections of many tissue samples of kauri. This represents part of Ross’s living legacy, and forms the basis to our understanding of the colonisation of kauri by PTA.
Ross also shared his expertise in tree diagnosis through the provision of training in the techniques of tissue-sampling. Ross approached tree dissection and sampling with dignity and a sense of reverence. His skills were shared with field staff from a range of agencies, and he spent days in the Waitakere Ranges with ARC staff, contractors and overseas visitors, ground-truthing observations and collecting data.
There is a silence in the forest now.
Where once a voice of reason and enquiry
Of knowledge and gentle humour
Of passion and intensity
Was heard…
The mighty tōtara has fallen.
And the forest is silent.
Stanley E. Bellgard

Landcare Research Page vii
Summary
Project Code
The research included in this report encompasses the following contracts:
11213 Defining the symptoms of PTA
11215 PTA Response research projects:
Objective A: Developing a method to optimise detection of PTA in soil samples Objective B: Optimising the method of soil sampling
12093 Soil validation
Business/Institution
Landcare Research
Programme Leader
Ross Beever (April 2009-June, 2010)
Stan Bellgard (June 2010-present)
Programme Title
Detection of Phytophthora taxon Agathis (PTA)
Goal
MAFBNZ, acting on behalf of the Kauri Dieback Joint Agency, is seeking research work into aspects of Phytophthora taxon Agathis (PTA) critical to developing effective management methods.
Objectives
This project was managed under four ‘objectives’, summarised as follows:
Determine a method to optimise detection of PTA in soil samples, to increase certaintyof detecting PTA in a cost-effective manner (11215, Part A)
Develop a robust and verifiable method to collect soil samples, and to maximise theprobability of detecting PTA in samples in a cost-effective manner (11215, Part B;12093)
Develop a robust and verifiable method to collect lesion samples, and to maximise theprobability of detecting PTA in samples in a cost-effective manner (11213)

Detection of Phytophthora taxon Agathis (PTA)
Page viii Landcare Research
Determine whether there is a set of field symptoms that allows for reliable diagnosis ofPTA in the field, and if so describe these symptoms (11213)
Key Results
A soil-baiting method to detect PTA in soil samples. To optimise recovery, theefficiency of a range of variables was compared. The final process involves apretreatment of air-drying and wetting prior to flooding the soil and baiting with lupinradicles and Himalayan cedar needles (pp. 25-29).
To verify the robustness of the method, soil-based detection studies were carried out inthree, independent laboratories at the same time – achieving consistent results acrossthe three laboratories. Results validated that the soil standard operating protocol (SOP)effectively recovered PTA from soil associated with symptomatic trees – fromNorthland, the Waitakere Ranges, Great Barrier Island, and the first record of PTA inthe Hunua Ranges, at Mangatangi Hill (pp. 28-29).
A method to collect soil samples was developed, and specific locations around a treewere identified to maximise the probability of detecting PTA in soil samples. In orderto verify the robustness of the technique, the sampling protocol was tested on trees fromtwo separate sites and comparable results were obtained (p. 29).
A method to collect lesion samples was developed, with a description of ways tomaximise the probability of detecting PTA in the tree. The technique was verified overa number of trees, across a range of diseased sites (Northland and Auckland regions),by a number of trained, plant pathologists (pp. 35-37).
It was concluded that there is NOT a set of definitive field symptoms that allows forreliable visual diagnosis of PTA in the field. There is, however, a strong associationbetween pus-like gummosis at the base of the tree and PTA – this may or may not beassociated with foliar and/or crown decline symptoms (p. 35).
Field symptoms assist in choosing whether soil and/or tissue-based sampling arewarranted. Verification of the presence or absence of PTA in a soil and/or tree samplecannot, at this stage, be achieved without some form of physical intervention involvingsampling of soil around a tree (for soil-based detection; pp. 11-12) and excavating someamount of bark from a symptomatic tree (for tissue-based detection; pp. 20-21).
Because of the complexity associated with disease diagnosis, we recommend acomplimentary sampling strategy involving the strategic use of both soil- and tissue-based detection.
Operational implications of key results in relation to broader‐scale surveillance
The first step in minimising the human-assisted spread of PTA into uninfested areas isto use suitably qualified people to detect, diagnose, demarcate and map, using existinginformation or new surveys, the current locations of kauri dieback disease caused byPTA. To achieve this objective, a range of pre-requisite requirements need to be met,including gaining high impact permits through consultation and mediation.Developing an appropriate sampling protocol for kauri-land will also requireoperational protocols to ensure transparency and accountability of the surveillanceprocess. To achieve this, an operational management plan needs to be devised, withinstructions to assist operators of their statutory and cultural responsibilities.

Detection of Phytophthora taxon Agathis (PTA)
Landcare Research Page ix
Necessary points to be considered as part of the development of a PTA SurveillanceOperational Management Plan include (but are not limited to):
o Permitting: obtain multi-agency approvals to undertake surveillance;
Negotiate level of stakeholder involvement
Negotiate fate of all samples (ideally all soil and tissue samples will bedestroyed after processing; we suggest that returning samples afterprocessing is logistically impractical and warrants a significant hygienerisk)
Negotiate timing and mechanisms for delivery of results tostakeholders.
o Training: Surveys need to discriminate between areas that exhibit the visiblesigns of PTA-disease, and those areas that appear to be free of visualsymptoms. Appropriate training from experienced plant pathologists will benecessary to up-skill field surveillance staff. It is considered necessary thattissue-based tree sampling needs to be undertaken by a trained plantpathologist. Very strict criteria need to be established for tree and soilsampling, and a protocol established to treat the wound created by the tissuesampling. It is also noted that soil–based detection will need some level ofsupervision to determine how best to manage soil and root disturbanceassociated with soil sampling.
o Sample database and bar-coding for chain of custody: a chain of custodysystem needs to be developed to track the fate of tissue and soil samples takenunder high level impact permits via a geo-referenced database which collatessample and site data.
o Standardised sampling approach: obtaining outer bark samples of symptomatictrees involves the removal of no more than 24 cm2 of bark from an individualtree. This can be achieved with a sharp, 1 inch wood chisel. Put tissueimmediately into labelled zip-lock bag and seal. Place inside chilly bin toensure the sample remains cool during transport for processing. The samplingof soil can be achieved by using a hand trowel or stainless steel push tubes(see M.A. Dick and S.B. Bellgard; unpublished Sampling Protocol, inpreparation).
o Hygiene issues associated with sampling: hand chisels can be sprayed with95% ethanol between trees. Hand trowels need to be wiped clean of adheringsoil (into sample bag), and sprayed with 2% TriGene II Advance.Decontamination of footwear and sampling tools should be carried out awayfrom tree root zones.
o Sample transportation: tissue samples need to be processed as soon as possible(ideally between 24-48 hours). LFD-assays can be used to prioritise whichtissue samples are Phytophthora-positive. Tissue samples can be stored inchilly bins for up to 1-week, but the longer time between sampling and tissueplating will impact upon viability of samples. Soil samples are a lot more

Detection of Phytophthora taxon Agathis (PTA)
Page x Landcare Research
robust and can be stored for up to 1-year (at 10°C) and retain their infective potential.
o Sample processing: Will be undertaken by participating laboratoriesaccording to the outlined Standard Operating Protocols (SOP) containedwithin this report.
o Sample storage: Soil samples to be kept at 10°C; tissue samples to be keptchilled and plated within 24-48 hours of collection.
o Sample disposal: post-processing, all tissue and soil samples will be treated aspotentially biohazardous materials, including when PTA results are negative.
Summary of Conclusions and Recommendations
Conclusions: Soils
Obtain necessary permits to sample soils
Optimal location for soil sampling around a symptomatic tree <2.0 m dbh:
1–2 m around the trunk of a symptomatic tree
Include ‘cardinal points’ around tree to achieve representative sampling of eachquadrant of the tree’s rhizosphere
Optimal soil sample size: approx. 125 g per soil core
Total composite sample recommended approx. 1.0 kg per tree
From the validation study, it is clear that soil sampling around trees > 2.0 m dbh needs to be “scaled-up” to obtain a representative sample of the soil under the drip line. A proposed approach could be:
4–8 m around the trunk of a symptomatic tree
Include ‘cardinal points’ around tree to achieve representative sampling of eachquadrant of the tree’s rhizosphere (beyond 1-2 m from trunk; resulting in a total of 15samples from between trunk and drip line
Optimal soil sample size: approx. 125 g per soil core
Total composite sample recommended approx. 2.0 kg per tree
N.B. consideration needs to be given to the environmental impacts associated with multiple soil samples taken around a tree causing disturbance of the root zone.
Conclusions: Lesion studies
In summary below the outer bark tissue of freshly bleeding lesions is likely to be the most efficient sampling target for diagnostic assessment of trees in the field. PTA has been isolated from the cork cambium – no isolates have been obtained from the inner vascular cambium. There are three significant positives for this approach:
Sampling the outer bark by itself will likely cause little long-term damage to the tree, asit is probable that the damaged outer tissue will be walled off by the development ofcork cambium under this area. In contrast sampling of the vascular cambium and

Detection of Phytophthora taxon Agathis (PTA)
Landcare Research Page xi
damaging this tissue will cause a permanent wound potentially leading to entry of secondary organisms into the wood.
In terms of field sampling and processing in the laboratory, just taking this tissue (evenif three similar samples may be needed per tree) will speed the process and minimisecost.
Coupled with targeting this tissue, it may prove possible to test for the presence ofPhytophthora in the field using commercial lateral flow devices (LFDs) based onantibodies. Results from a recent sampling effort showed good correlation betweenpositive LFD and direct isolation of PTA.
Recommendations
Recommendation 1: Consent before action
Recommendation 2: Risk-based assessment of the relative cost:benefits of soil- versus tissue-based detection
Recommendation 3: Assess temporal variation of sporulation
Recommendation 4: Further research into disease spread and etiology
Recommendation 5: Development of serological and molecular-based diagnostics
Recommendation 6: Provision of research into other Phytophthora species
Recommendation 7: Quality assurance of comparability of different participating laboratories

Landcare Research Page 1
1 Introduction
MAFBNZ, acting on behalf of the Kauri Dieback Joint Agency, is seeking research work into aspects of Phytophthora taxon Agathis (PTA) critical to developing effective management methods. The research included in this report encompasses the following contracts:
11213 Defining the symptoms of PTA 11215 PTA Response research projects:
Objective A: Developing a method to optimise detection of PTA in soilsamples
Objective B: Optimising the method of soil sampling 12093 Soil validation
A reliable, scientifically-robust detection method is a necessary first step to aid in delimiting the presence of the pathogen in kauri stands. The following report summarises the outputs from a collaborative research effort between Landcare Research, Scion, and Plant & Food Research to jointly develop a robust detection method to aid in our understanding of Phytophthora-induced collar rot of kauri. The cross-CRI-collaboration (CCC) has also built diagnostic capacity for the detection of Phytophthora species within each of the laboratories.
2 Background
2.1 History of PTA in New Zealand
Five species of Phytophthora have been recorded from Agathis australis (kauri) or soil in kauri forests:
P. cinnamomi (Podger & Newhook 1971)
P. cryptogea (Newhook 1959)
P. kernoviae (Ramsfield et al. 2009)
P. nicotianae (Brien & Dingley 1959)
Phytophthora taxon Agathis (PTA) initially recorded as P. heveae by Gadgil (1974)(Beever et al. 2009)
Phytophthora cinnamomi has been found widely in natural stands and has been linked to ill-thrift and occasional tree death (Podger & Newhook 1971); P. cryptogea, P. nicotianae and P. kernoviae have only been recovered once. PTA was first reported from a natural stand of unhealthy kauri on Great Barrier Island (Gadgil 1974). There were no subsequent records until PTA was found in 2006 in a stand of regenerating kauri on the Maungaroa Ridge in the Waitakere Ranges near Auckland (Beever et al. 2009). In 2008 PTA was confirmed at another regenerating site in the Waitakere Ranges, near the township of Huia. In 2009 PTA-positive sites were confirmed to the north of the Auckland Region, e.g. Pakiri Scenic Reserve. This year (2010), sites in Northland including Raetea Plantation, Trounson Kauri Park and the Waipoua Forest were also confirmed to have PTA present in trees and soil (unpubl. Landcare Research report; see Appendix 1).

Detection of Phytophthora taxon Agathis (PTA)
Page 2 Landcare Research
2.2 Knowledge gaps
Gaps in the present knowledge about PTA include (but are not limited to):
1. Confirmation of whether PTA is a species that is new to science?
2. Confirmation of whether the pathogen is an endemic or an exotic organism?
3. If exotic, what is its biogeographic origin?
4. What is the population-level variability among PTA isolates from different parts ofNew Zealand?
5. What is its spatial distribution through the native range of kauri in New Zealand?
6. What are the main types of soil-borne inoculum that occur in infested natural soils?
7. If present, what is the role of oospores in perpetuating the pathogen in an infestedsite?
8. What facilitates the landscape movement of PTA inoculum (pathways/vectors)?
9. What is the rate of spread of disease (and hence, predicted rate of kauri decline ininfested sites)?
10. What is the role of root-to-root contact as a pathway for the spread of the disease frominfected to healthy trees?
In the case of invasive Phytophthora species, the place of origin is generally unknown (see section 2.3). However, the distribution of Agathis species is well understood, and this, coupled with the fact that PTA occurs in Clade 5 of the Phytophthora phylogeny, together with the closely related P. heveae and P. katsurae, suggests it may have an eastern Asian – Australasian origin (Beever et al. 2006, 2009).
2.3 Phytophthora diseases worldwide
Phytophthora species are well known in agriculture, limiting crop production of many important crops from potatoes (e.g. potato blight caused by P. infestans) to root and collar rot of avocado caused by P. cinnamomi (Erwin & Ribeiro 1996; Horner & Jensen 2004). Classically, this is a genus of agricultural and horticultural pathogens especially destructive in poorly drained soils or wet climates (Hansen 2008). The name derives from the Greek for ‘plant killer’. They are oomycetes (water moulds), related to brown algae, and are not true fungi. Despite their unique phylogeny, they grow as filamentous hyphae and reproduce by spores, like fungi. They disperse and infect by motile zoospores and survive unfavourable conditions, especially drying, as thick-walled chlamydospores or oospores. Most cause root diseases but, especially in trees, some cause lethal stem cankers, or infect foliage (Hansen 2008).
In recent years, it has become clear that there is a very diverse community of Phytophthora species resident and probably indigenous in more or less undisturbed temperate forests (Hansen 2008). For example, eight Phytophthora species were isolated from oak forests in north-eastern France (Hansen & Delatour 1999). There were no obvious symptoms of

Detection of Phytophthora taxon Agathis (PTA)
Landcare Research Page 3
phytophthora root rot in this healthy mature stand, yet 12 out of 14 soil samples from one site yielded one or more species. Five of the eight Phytophthora species were undescribed or only recently described. Similar results have been obtained in Germany (e.g. Jung et al. 1996, 2002), eastern deciduous forests of the United States (Balci et al. 2007), and in the western USA (Rizzo & Fichtner 2009). From these examples, it has been hypothesised that the indigenous forest Phytophthora community is numerous and diverse (Hansen 2008). In most cases, the phytophthoras are confined to infecting and killing the fine roots of trees. Under normal soil environmental conditions, the trees replace the roots and maintain a balance between root loss and replacement without dramatic growth loss to the tree. In Europe, Phytophthora species may contribute to the recurrent, chronic disease called oak decline. Oak decline, however, is primarily associated with periods of unusual drought, often coupled with outbreaks of defoliating insects. Under these stressful conditions, loss of additional rootlets to Phytophthora contributes to the decline (Hansen & Delatour 1999; Jung et al. 2000).
2.4 Phytophthora diseases in forest ecosystems
A number of invasive Phytophthora species are dramatically altering ecosystems in various forests around the world today. All are clearly alien to the forests they are invading, but their epidemiology, origins and ecological impacts differ widely. Some of the most dramatic examples of Phytophthora-mediated forest dieback include:
P. cinnamomi is killing trees in several parts of the world where it has been introduced,e.g. jarrah (Eucalyptus marginata) forests of western Australia, and the species-richheathlands of both eastern and western Australia (Hardy 2009).
P. lateralis causes Lawson’s cypress Chamaecyparis lawsoniana (Port-Orford-cedar)root disease in western North America (Hansen et al. 2000).
P. ramorum, the cause of sudden oak death, is causing unprecedented mortality in oakand tanoak forests in California (Rizzo et al. 2005; Rizzo & Fichtner 2009).
P. alni and its variants is a destructive new Phytophthora pathogen of riparian alders inthe UK and other parts of Europe – this new species provides an example of aheteroploid hybrid between probably P. cambivora and P. fragariae (Brasier et al.2004).
2.5 Phytophthora taxonomy, biology and epidemiology
Phytophthora taxon Agathis (PTA) is an oomycete within the phylum Heterokontophyta. Currently this phylum and genus are assigned to the Kingdom Chromalveolata – a eukaryote ‘supergroup’ first proposed by Cavalier-Smith (1986), comprising heterokont, biflagellate, organisms. The majority of species in this phylum are brown algae (i.e. Phaeophyta) and/or diatoms (i.e. Bacilliariophyta). The genus Phytophthora and its closely related genus Pythium are both placed in the family Pythiaceae.
Phytophthora, Pythium and other oomycetes have a number of biological characteristics that distinguish them from the true fungi: the major part of their life history is primarily diploid (whereas fungi are haploid); the cell walls of Phytophthora are composed of cellulose and β-glucans (not chitin as with most fungi); zoospores are biflagellate (one is whiplash and the

Detection of Phytophthora taxon Agathis (PTA)
Page 4 Landcare Research
other a tinsel flagellum); and oomycetes do not synthesise sterols and require an exogenous source of β-hydroxy sterols for sporulation (Erwin & Ribeiro 1996).
Wilcox (1992) produced a generic disease cycle of Phytophthora root and crown rots in pome and stone fruits (Figure 1). It is a convenient way to focus on certain aspects of the biology of PTA relevant to soil- and tissue-based detection. The disease is putatively initiated as a fine root infection. It progressively travels up the major roots until it reaches the collar. The hyphae growing in the root can form resting spores (i.e. oospores) in the woody tissue. After decomposition of the root by saprophytic fungi, the resting oospores are set free into the soil environment, and the cycle begins again (Figure 1).
Predisposing factors such as waterlogging or drought, which reduce the vitality of the tree or favour the pathogen (e.g. excess moisture after heavy rain), can accelerate the disease process and facilitate the spread of the pathogen.
Figure 1 Disease cycle of phytophthora root and crown rots in pome and stone fruits (Wilcox 1992). Note on left-hand-side how oospores germinate to produce sporangia, resulting in the multiplication and release
of many zoospores (i.e. disease amplification).

Detection of Phytophthora taxon Agathis (PTA)
Landcare Research Page 5
2.6 Isolation and detection of Phytophthora spp.
2.6.1 Soils
Since most Phytophthora species can be difficult to isolate from decayed tissue or from soil, the ‘bait’ method has been used for nearly half a century to aid in isolation (Erwin & Ribeiro 1996). The bait, sometimes referred to as a trap, consists of a highly susceptible host that is readily infected by a Phytophthora species. In principle, the baiting method (or bioassay) exploits the selective pathogenicity of Phytophthora species to living host tissue on which an infection caused by the target Phytophthora can be captured. Typical baits used in the past include (but are not limited to):
1. Apple and pear fruit (Van der Scheer 1971)
2. Avocado and citrus fruits (Zentmyer 1980; Klotz & DeWoolfe 1958)
3. Leaf disks (e.g. soybean, Canaday & Schmitthenner 1982)
4. Carnation petals (Ponchet et al. 1972)
5. Himalayan cedar and pine needles; lupin radicles (Dance et al. 1975).
Although a bait technique exploits the pathogenicity of Phytophthora species to a particular host or host tissue, methods that induce or favour production of sporangia and zoospores in soil or diseased tissue samples give an added advantage because the original inoculum is amplified by the production of zoospores (Erwin & Ribeiro 1996). Soil-borne Phytophthora species usually produce sporangia optimally on new mycelial growth only after the culture is changed from rapid growth on a relatively rich medium to a starvation regime in free water or in aqueous salt solutions and soil extract (Erwin & Ribeiro 1996). Swimming zoospores are usually attracted chemotactically to a nutrient source (i.e. the bait tissue), such as a root or plant tissue (Carlile 1983), and the infected tissue-pieces are then plated to Phytophthora-selective media.
Pretreatment of soil for various periods of time before submersion in water has been shown to favour the production of sporangia. Successful pretreatments have included pre-wetting of soil for various periods of time (e.g. Canaday & Schmitthenner 1982; Stack & Millar 1985). Drying of soil has also received some support – these techniques are hypothesised to facilitate the germination of oospores although this has been rarely observed as oospores have an innate dormancy when produced in nature (Erwin & Ribeiro 1996). Additionally, oospores have a maturation time of approx. 30 days, although time varies depending upon species and isolates with the percentage of germination increasing with age (e.g. Meyer 1975; Ribeiro 1983).
2.6.2 Phytophthora‐selective media
Phytophthora spp. are slow-growing on artificial media relative to many common soil-inhabiting fungi. In order to preferentially favour Phytophthora over other soil-borne fungi, it is necessary to plate the infected plant tissues to agar amended with specific chemicals and additives. Variations of cornmeal agar medium amended with antibiotics (e.g. P5ARPH;

Detection of Phytophthora taxon Agathis (PTA)
Page 6 Landcare Research
Appendix 2: Media recipes) are typically used to isolate Phytophthora spp. (e.g. Masago et al. 1977; Tsao & Guy 1977; Erwin & Ribeiro 1996).
In order to reduce competition from other oomycetes, e.g. Pythium spp., Tsao and Guy (1977) first identified the use of hymexazol to inhibit Mortierella and Pythium species. This additive is still used today; however, research from the 1980s and 1990s has demonstrated that growth of some Phytophthora spp. is inhibited by the addition of hymexazol to artificial media (e.g. Solel & Pinkas 1984; Ho 1987; Kato et al. 1990).
2.6.3 Plant tissue
When Phytophthora is suspected as a causal agent of plant disease, the affected tissue selected for isolation should ideally be in an active stage of infection, since Phytophthora is especially difficult to isolate from necrotic tissue (Erwin & Ribeiro 1996). Infected tissue should be selected from margins of plant tissue with actively progressing lesions; and tissue that has dried or has been corked-off from healthy tissue should be avoided (Erwin & Ribeiro 1996).
P10ARPH and P5ARPH are two of the most effective media for direct isolation by tissue plating, and if isolation is carried out with fresh tissue, surface decontamination may not even be necessary (Erwin & Ribeiro 1996).
2.6.4 Serological and molecular detection
In the genus Phytophthora, historically, identification to species was based on measurements of morphological characters, and required isolation on high nutrient media (e.g. V8 juice agar to facilitate oospore growth in homothallic species; Appendix 2). The traditional identification process can take up to 2 weeks from the time of isolation including time taken for oospore maturation, sporangial formation and zoospore differentiation and release. The morphological characters were compared to known species/isolates, using the now outdated standard morphological keys of Stamps et al. (1990).
Since the publication of the first complete molecular phylogeny of Phytophthora and related Oomycetes in 2000 (Cooke et al. 2000), many new species of Phytophthora have been described. In addition to traditional morphological characters, both serological ELISA and DNA-based methods are available to support conventional detection methods described above (e.g. Olsson 1995; Cooke et al. 2000; Schena & Cooke 2006). Portable, serological test-kits are commercially available (e.g. Pocket Diagnostic Test Kit™ http://www.pocketdiagnostic.com/products/31). These simple-to-use kits (referred to as Lateral Flow Devices – LFDs) require an operator to remove small pieces of potentially infected plant tissue, placing them in a reaction vial with buffer and ball-bearings, and shaking vigorously to release the target antigen. A drop of the resultant solution is placed on the ‘test-strip’, and the colour-change reaction (akin to a ‘pregnancy test’) identifies presence/absence of Phytophthora. A recently developed product that works on the same principles as the LFD, the ‘Immunostrip’ also shows considerable promise for this early-detection process.

Detection of Phytophthora taxon Agathis (PTA)
Landcare Research Page 7
The potential advantages of ELISA are:
Rapid identification
Detection at low levels
Detection before symptoms are manifested in the host plant
Accuracy in the detection of Phytophthora despite the presence of plant material andother micro-organisms
The potential disadvantages of ELISA are:
ELISA detects dead as well as living organisms
ELISA might detect a similar organism that contains a common antigen (Erwin &Ribeiro 1996)
PCR, conventional and real-time, has emerged as an important tool for the diagnosis and study of phytopathogenic fungi and has solved some of the problems associated with their detection, control and containment (Schena et al. 2004). Even though culturing of the pathogen for DNA extraction is required with this method, it represents a far-more rapid means of identification compared with morphological techniques alone (Martin & Tooley 2004). Technical challenges still remain, however, around the direct extraction of Phytophthora DNA from soil.
2.7 Interpretation of kauri symptoms
2.7.1 Definitions
Symptom
Disease involves disturbance in the normal physiologic function of a plant – it has many causes and exhibits an array of appearances. Any biological agent that causes disease is called a pathogen. The symptoms of disease are expressions of the disturbed or abnormal physiology resulting from the interaction of the specific pathogen and host (Manion 1991). Pathogens that parasitise the vascular cambium and inner bark (secondary phloem and cork cambium) (Figure 2) for available sugars and other nutrients result in death of the affected area. Death of a localised stem area prevents secondary growth in the affected area. The bark may change colour. A depressed area on the stem may result from the lack of stem enlargement in the diseased area.

Detection of Phytophthora taxon Agathis (PTA)
Page 8 Landcare Research
Figure 2 Cross section schematic of the generic anatomical layers
present within tree stems (source: Britannica.com)
Kauri ‘gum’
Technically, ‘kauri gum’ is not actually a gum. Gums are often confused with resins, and terpenoid resins are frequently called gums commercially (Langanheim 2003). Thus, the sticky, lipid-soluble exudate that occurs on the outside of kauri bark is a resin – and hence, the production of kauri resin is termed resinosis. For the purposes of this study, ‘gummosis’ will be used interchangeably with the term ‘resinosis’.
Source of resin
In the bark of kauri, the phloem cell types include sieve cells, axial and ray parenchyma, fibres and sclereids (Chan 1986). Resin canals occur in the primary cortex, phloem and phelloderm. Phloem resin canals are oriented axially, and tend to occur in tangential rows.
Cause of resinosis
Resinosis occurs as a consequence of damage to the phloem resin canals. Thomas (1969), in a paper on kauri resin, suggested that the bled resin forms in the resin canals of the bark and when these are broken they exude a latex to form a protective layer over the damaged surface. This layer rapidly loses water and some of the monoterpene hydrocarbons present give a soft transparent film which gradually hardens further on exposure to air and light. Eventually it becomes the hard material commonly known as kauri gum. The source of damage can be either physical (e.g. as with gum tapping) or because of microbial parasitism; either way, the result is the release of resin.
2.7.2 Putative symptoms of PTA
A range of non-specific symptoms have been reported for PTA infestation. Generally, especially in ricker stands, the complement of symptoms include yellowing of the foliage, canopy thinning, reduced growth in height, and tree death (Gadgil 1974; Beever et al. 2009; unpubl. data). In some instances, the final collapse of the individual is associated with rapid reddening and browning of leaves. However, similar symptoms have been associated also

Detection of Phytophthora taxon Agathis (PTA)
Landcare Research Page 9
with P. cinnamomi in natural stands (Podger & Newhook 1971) and are also associated with ‘natural’ stand thinning especially on drought-prone sites. Additionally these symptoms have been linked with root disturbance associated with human-mediated disturbances such as road building and track making. In the case of mature trees, the occurrence of ‘stag heads’, where part of the canopy has died and a sector of the trunk is often dead, has been tentatively associated with PTA infection where bleeding lesions are observed at the lower trunk margin between dead and healthy tissue.
A candidate symptom associated specifically with PTA is the occurrence of lesions (cankers) on the lower trunk associated with abnormal gum bleeding or ‘gummosis’ (Gadgil 1974; Beever et al. 2009). These symptoms are so distinctive that we consider it unlikely they were overlooked by Podger and Newhook (1971) in their studies of dense kauri regrowth stands, 80–100 years of age, in the Waitakere Ranges. Their main study site at the Cascades has been revisited and, while fallen rotting trunks were present, the remaining trees were in good health without cankers or gummosis (Beever et al. 2009). Trees showing abnormal gummosis are present at all the study sites and PTA has been recovered from trunk lesions at all sites, but not necessarily from all trees examined. At both the Maungaroa Ridge (Piha, Waitakere Ranges) and the Kaiaraara site (Great Barrier Island), there was an obvious correlation between the presence of lower trunk gummosis, foliage yellowing and canopy thinning and tree death (gummosis can be observed on the bark of dead trees for a considerable time after death). Additionally, no species of Phytophthora other than PTA have to date been recovered from any kauri lesions in our studies, although there is one historical record of P. nicotianae from such tissue (Beever et al. 2009). These observations provide a priori evidence that lower trunk gummosis may be diagnostic for PTA disease.
However, not all trees showing foliage yellowing and canopy thinning at these sites show obvious gummosis, and excessive gummosis is certainly not restricted to the presence of PTA. It is well known that kauri bleeds in response to any sort of mechanical injury, and in addition excessive bleeding is often linked with infections associated with wood-rotting organisms (often basidiomycetes), which in turn may often be associated with injury. An example of this sort of situation was provided recently by some unhealthy kauri in New Plymouth, where gummosis was linked to the presence of Armillaria novae-zelandiae (MA Dick, Scion, unpubl. data). No PTA or other Phytophthora species were recovered from soil at this site (however, Pythium species were recovered). There are two common indigenous species of Armillaria and these are abundant in native forests but are seldom implicated in disease of indigenous plants. However under some circumstances, usually when trees are planted and conditions are not favourable for the plant, Armillaria may infect and kill: of New Zealand’s native trees kauri is particularly prone to pathogenic attack (MA Dick, Scion, unpubl. data).

Detection of Phytophthora taxon Agathis (PTA)
Page 10 Landcare Research
3 Objectives
To achieve the aims outlined in the Introduction, we have managed this project under four ‘objectives’, summarised as follows:
Determine a method to optimise detection of PTA in soil samples, to increase certaintyof detecting PTA in a cost-effective manner (Contract 11215, Part A)
Develop a robust and verifiable method to collect soil samples, and to maximise theprobability of detecting PTA in samples in a cost-effective manner (Contract 11215,Part B; Contract 12093)
Develop a robust and verifiable method to collect lesion samples, and to maximise theprobability of detecting PTA in samples in a cost-effective manner (Contract 11213)
Determine whether there is a set of field symptoms that allows for reliable diagnosis ofPTA in the field, and if so describe these symptoms (Contract 11213)
4 Methods
To meet the Objectives, a series of experiments were undertaken focusing on three aspects of the recovery process. These aspects were preconditioning of soil, choice of bait for the bioassay, and conditions during the bioassay. The most appropriate method of collecting soil samples at the test sites was also investigated. Initially, experiments were conducted in contrived conditions, i.e. bait leaves were tested for efficacy against pure cultures of PTA, followed by a soil-based bioassay. Final tests were conducted on soil collected from a known PTA site, Huia Dam in the Waitakere Ranges. Representative isolates of all Phytophthora species recovered were accessioned to ICMP (International Collection of Microorganisms from Plants, maintained by Landcare Research, Auckland) for cultures (tissue specimens to be accessioned to PDD).
4.1 Soil sampling
4.1.1 Temporal samples
Monthly bulk samples were taken from the Huia Dam site (2649586E; 6466012S) during the last week of each month for a period of one year from March 2009 to March 2010. This site contains a ‘ricker-age’, regenerating stand of kauri from which PTA has been recovered. One tree (so called “Joan’s Tree”; Figure 3) had previously been confirmed to be infected by PTA, and represented an infective focus (unpubl. data; confirmed by DNA sequence as PTA and isolate vested in ICMP # 18245 on 22 Sep. 2009). Soil from around the base of the tree was sampled (1-2 m between stem and drip line of the tree). Its nearest neighbour (adjacent, up-slope) was also sampled: 1-2 m within the drip line area of the tree canopy (this tree was dead at the commencement of sampling). The composite included soil sampled in a similar way from a third tree (1.2 m dbh), twenty metres across slope. The soil at the site was a brown sandy loam.

Detection of Phytophthora taxon Agathis (PTA)
Landcare Research Page 11
At each sampling occasion, approximately 1-3 kg of soil was excavated from around the root boll of the tree using a surface-sterilised (using 2% Trigene II Advance) stainless steel shovel. The top 0–30 cm of humus and mineral soil was recovered and placed into plastic bags and returned to the lab for storage at 10°C in 20-L plastic pails with lids fitted loosely. Prior to analysis, the soil samples were mixed for 3–5 min in a surface-sterilised cement mixer to create “composite samples”.
Figure 3 PTA-positive diseased tree at Huia Dam showing where shovel was inserted to sample soil.
4.1.2 Spatial samples
To determine the spatial relationship of PTA around diseased trees, three trees at the Maungaroa Ridge site were selected for study (2642364E; 64717508S). This site was similar to the Huia Dam site in that it contained ‘ricker-aged’, regenerating kauri, some of which had earlier been confirmed to be infected by PTA (unpubl. data; confirmed by DNA sequence as PTA and isolate vested in ICMP # 18362 on 16 Feb. 2010) (Figure 4). The soil at the site was again a brown, sandy loam.

Detection of Phytophthora taxon Agathis (PTA)
Page 12 Landcare Research
Figure 4 Tree L10 at Maungaroa Ridge, showing diagnostic gummosis of the lesion, confirmed as positive for PTA from tissue isolations.
At each symptomatic tree (from each site), the position of the lesion was noted, and eight soil cores taken 1 m and 2 m from the base of the tree, in a clockwise manner from opposite this point (Figure 5).
Figure 5 Schematic representation of eight soil samples (so-called “cardinal points”) taken around symptomatic trees at Maungaroa Ridge. Red coloured-area identifies position of lesion.
Soil was collected using a stainless steel push-tube 3.5 cm in diameter by 13 cm long, giving an approximate soil volume of 125 cm3 from each core. A clean tube used for each sample. By taking eight cores in total, we had effectively collected a bulk composite of 1000 cm3. For the purposes of this experiment, each soil sample was kept separate and assayed separately to determine which sampling location (if any) was associated with recovering PTA.

Detection of Phytophthora taxon Agathis (PTA)
Landcare Research Page 13
The sampling protocol involved the following steps:
Scrape off any coarse organic wood and leaf matter
Establish the position of the lesion (if a lesion is present), and designate four cardinalpoints based upon the lesion: to the north, east, south and west (Figure 5)
Measure 1 m and 2 m away from the tree trunk in each of the cardinal directions
Surface-sterilise the sampling implements
Push the tube into the soil to a depth of approx. 20 cm
Remove the push-tube / clod of soil with a screwdriver
Extrude the soil from the push-tube into a labelled plastic zip-lock bag and place inchilly bin
Continue procedure to take all eight samples
Store the soils together at 10°C
4.1.3 Test of efficacy of sampling approach
To test the efficacy of the approach, a symptomatic tree was sampled at the Huia site in April 2010 (Figure 6). The disease status of this tree was not known at the time of sampling. The four cardinal directions were established around the tree and, using a hand trowel, approximately 125 cm3 of soil were recovered from each of the eight points.
Figure 6 Symptomatic tree sampled at the Huia site, showing the position of the lesion.
4.2 Bait comparisons
4.2.1 Axenic zoosporangium bioassay
Inoculum from the periphery of 6-day-old PTA cultures (isolate ICMP # 18244) on PDA (Appendix 2) were transferred to fresh V8 juice agar plates (Appendix 2). Plates were incubated in the darkness for 6 days at 20ºC. Oblong blocks 1.5 × 1.0 cm were taken from the

Detection of Phytophthora taxon Agathis (PTA)
Page 14 Landcare Research
advancing edge of each of the two replicate plates of each of the isolates. The blocks were cut out and placed in the bottom of a 7-L plastic box (Figure 7).
Figure 7 Oblong blocks (1.5 × 1 cm) of V8 juice agar from the advancing colony being placed into 7-L ‘Klip It’ bioassay vessel.
The boxes were placed in a 20°C incubator and flooded (Figure 8) with 4 L of sterile soil extract (Appendix 2) to stimulate aseptic sporangium formation.
Figure 8 Flooding V8-juice agar blocks with 4 L of sterile soil extract.
Each box was incubated for 24 h under fluorescent light at 20°C. After 24 h, 10 replicate bait tissues (n = 10) were floated on the water surface. The experiment was carried out by each of three independent laboratories (i.e. Scion – Rotorua (Scion), Plant & Food Research – Havelock North (PFR), and Landcare Research – Tamaki (LCR)) (Table 1).

Detection of Phytophthora taxon Agathis (PTA)
Landcare Research Page 15
Table 1 List of bait tissues assayed by each organisation
Leaf baits Scion Plant & Food Landcare Research
Abelia (Abelia ×grandiflora) SCION
Apple (Malus) cotyledon ‐ PFR ‐
Bay tree (Laurus nobilis) LCR
Camellia (known cv.) ‐ PFR ‐
Fern (Blechnum novaezelandiae) SCION ‐ ‐
Himalayan cedar (Cedrus deodara) SCION PFR LCR
Karamū (Coprosma robusta) ‐ PFR LCR
Kauri (Agathis australis) SCION ‐ LCR
Koromiko (Hebe stricta) ‐ ‐ LCR
Lupin (Lupinus) radicle SCION PFR LCR
Pine (Pinus radiata) needles SCION PFR LCR
Pohutukawa (Metrosideros excelsa) ‐ PFR LCR
Rhododendron (unknown cv.) ‐ PFR LCR
Rhododendron cv. ‘Cunningham’s White’ SCION ‐ ‐
Silver beech (Nothofagus menziesii) SCION ‐
Tōtara (Podocarpus totara) SCION PFR ‐
Vireya Rhododendron (known cv.) SCION ‐ LCR
The leaves of the various baits were floated to minimise overlap (Figure 9). After 24 h, the baits were removed, surface-sterilised in 50% ethanol for 30 s, then rinsed with sterile RO or distilled water. Baits were blotted dry and plated to P5ARP – a selective medium for Phytophthora species (Appendix 2). After the incubation period, 440-µl aliquots of the bioassay reaction water were plated to selective media to determine the number of colony forming units (per litre).

Detection of Phytophthora taxon Agathis (PTA)
Page 16 Landcare Research
Figure 9 Plan view of 10 types of leaf baits floated on sterile soil extract.
4.2.2 Soil‐based bioassay
The second bait comparison utilised a soil-based bioassay, using the shortlist of successful baits identified from the previous experiment (Table 2). The ‘Klip It’ 7-L plastic rectangular containers were again used as the basic experimental bioassay vessel. Five replicates of each baiting experiment were carried out. First, 250 g of air-dried Huia composite soil (see section 4.1) was moist-incubated in the light for 4 days (Figure 10). The soil was placed in the bottom of the box and flooded with 4 L of RO water. Ten baits of each type (Table 2) were added to the surface of the water. Each box was incubated for 24 h under fluorescent light at 20°C.
Table 2 Shortlist of preferred baits
Scion Plant & Food Research Landcare Research
Lupin radicle Lupin radicle Lupin radicle
Himalayan cedar Himalayan cedar needle Himalayan cedar needle
Abelia leaf Rhododendron leaf Kauri leaf
Tōtara leaf Pohutukawa leaf Abelia leaf
After 24 h, the baits were removed; surface-sterilised in 50% ethanol for 30 s, then rinsed with sterile RO water. Baits were blotted dry and plated to P5ARP. Plates were scanned 2, 4, and 7 days after plating.

Detection of Phytophthora taxon Agathis (PTA)
Landcare Research Page 17
Figure 10 Soil-based bioassay in 7-L ‘Klip It’ container.
4.3 Optimising incubation conditions
Several experiments were undertaken to investigate a range of elements of the soil bioassay system. These included soil pre-treatments, the ambient temperature under which the bioassay was run, the mass of the soil sample, and the relationship between the container size in which the bioassay was carried out, the mass of soil, and volume of water to flood the soil (Table 3). The experiments were run concurrently at each of the three CRIs.
The bioassay involved:
1. Two days’ air-drying
2. Four days’ moist incubation (in light)
3. Flooding and baiting and incubations at 20°C (in light on laboratory bench)
4. Extracting baits after 2 days and plating to selective media
5. Plating Phytophthora-like cultures to V8 juice agar
4.3.1 Detection of PTA at a range of soil sample sizes
For this experiment, Huia composite soil sampled in June 2009 (Plant & Food Research) was partitioned into seven different-sized sample aliquots: 0.5, 1.0, 2.0, 5.0, 10, 20 and 50 g. Each sample size was replicated 5–10 times.

Detection of Phytophthora taxon Agathis (PTA)
Page 18 Landcare Research
Table 3 Experimental design of soil bioassay incubation studies
Incubation parameter Experimental design Soil used for bioassay
Soil pretreatment:
2 days’ air‐drying
4 days’ moist incubation
Flood and bait
10 replicates of each monthly sample
Huia composite:
April 09, June 09, July 09, August 09, September 09, October 09, December 09, January 10, February 10, March 10, April 10 (LCR)
Vernalisation (cold treatment):
6 weeks at 3°C
Chilled water added to bioassay vessel
5 replicates of each soil
5 replicates
Huia composite:
December 09, January 10 (LCR)
June 09 (PFR)
Temperature influence on bioassay efficacy
5 replicates at each of 3 temperatures:
15°C
20°C
25°C
Using three leaf baits:
Cedar
Lupin
Silver beech
Huia composite:
June 09 (Scion)
2‐days air drying
4‐days moist incubation
Flood and bait
Harvest after 2 days
Soil sample : bioassay container relationship:
250‐ml plastic cup
300‐ml plastic cup
680‐ml circular plastic take‐away food container
1‐L rectangular plastic take‐away food container
8 replicates
8 replicates
8 replicates
8 replicates
Huia composite:
August 2009
2‐days air drying
4‐days moist incubation
Flood and bait
Harvest after 2‐days (LCR)
Validation experiment 2 replicates of each of the 8 soil samples taken from 1 and 2 m from the base of 2 trees
Tree L10 at Maungaroa Ridge (LCR)

Detection of Phytophthora taxon Agathis (PTA)
Landcare Research Page 19
Incubation parameter Experimental design Soil used for bioassay
Symptomatic tree at Huia Dam site (LCR)
4.4 Symptomology
4.4.1 Survey methods
As mentioned in the introduction, disease symptoms associated with PTA infections are difficult to study in the field, because of the numerous other factors affecting tree health in natural ecosystems. The range of sites listed in Table 4 aimed to cover a range of different ecological situations and, thus, are considered to be reasonably representative of the diversity of affected sites. Symptom evaluation was carried out to capture both stand and individual tree symptoms. Prior to assessing a kauri stand, the following generic diagnostic process was undertaken:
Ascertain the location of the site via GPS
Identify the nature of the kauri stand
What are the symptoms on kauri?
If bleeding/gummosis is present, where is it located on the trunk?
What is the immediate environment of the affected tree(s) (e.g. proximity to track or other disturbance)?
Are there other non-target hosts showing disease symptoms?
If there was enough a priori evidence to suggest that PTA was the causal agent, then the lesion was sampled (in conjunction with representative soil samples using the protocol described previously).
4.4.2 Lesion sampling protocol
The aim of the lesion sampling protocol was to obtain the inner bark and cambium area of living but infected tree tissue. After seeking appropriate permission from the statutory authorities (including iwi), the tree sampling process was as follows:
Sampling implements, e.g. sharp wood chisel surface-sterilised with 70% ethanol. Allow tools to dry before proceeding to biopsy tree
Plastic zip-lock bags labelled with site/sample information and date of sampling
Locate pus-like, active gummosis (Figure 11)
Delimit edge of wood tissue to be excavated, using sharp wood chisel (Figure 12)
Shave outer bark off stem within 5–10 cm (above or beside) of an actively oozing spot – shaving inward to the wood and towards the spot of bleeding/gummosis (Figure 13). If a thin, dark, host-defensive line is evident between the infected and non-infected tree tissues, then remove the inner bark tissue (living cortex and phloem) down to the sapwood on both sides of the defensive line.
Remove the tissue piece with the chisel to produce a wood sample with an approximate area of 60 cm2 (i.e. 10 × 6 cm). As a pre-isolation procedure, the presence of Phytophthora spp. was assessed in some samples using diagnostic lateral flow kits

Detection of Phytophthora taxon Agathis (PTA)
Page 20 Landcare Research
produced by Pocket Diagnostics. Using a surface-sterilised scalpel or grafting knife, three to four small pieces (3 × 3 mm) of necrotic phloem tissue were added to the commercial buffer and macerated. Two drops of the resulting suspension were added to the lateral flow device and the result read after 5–10 min. A blue line for the test material together with a blue line for the control indicated a positive result. Put the remaining sample immediately into the labelled plastic zip-lock bag and seal. Transport immediately, ensuring the sample remains cool, back to the laboratory.
The remaining sampling wound on the tree can be sprayed with a commercial graftwound spray to prevent further infection. Be sure to maintain good sanitation practicesin sampling and moving between sites.
Figure 11 Typical pus-like, active gummosis from tree Phy 95/100.

Detection of Phytophthora taxon Agathis (PTA)
Landcare Research Page 21
Figure 12 Lesion sample delimited by chiselling around edge.
Figure 13 Excavated lesion.
4.4.3 Sites sampled
Lesions on the lower stem were examined in the field and sampled to determine the presence of PTA or other species of Phytophthora. Lesions were mostly examined by Dr Ross Beever, but in addition Dr Nick Waipara (Auckland Regional Council) also sampled lesions and contributed observations from across the Auckland Region (Table 4). Observations

Detection of Phytophthora taxon Agathis (PTA)
Page 22 Landcare Research
summarised in this report also include preliminary samples undertaken prior to the commencement of this contract.
4.4.4 Laboratory examination of plant tissue
From the lesion wood samples, 20 small pieces of necrotic secondary phloem tissue / cork cambium (c. 3–20 mm2), from the junction of dead–live tissues were transferred directly onto P5ARP (10 pieces per Petri dish) within 24–48 h of collection of the sample.
Detailed sequential dissections were undertaken, using a surface sterilised scalpel, working from the inner secondary phloem, to identify the most appropriate section of tissue to sample to maximise the chance of recovery of PTA.

Detection of Phytophthora taxon Agathis (PTA)
Landcare Research Page 23
Table 4 List of sites and trees examined for symptoms and lesion
Code Date(s) Location / GPS Ecology
Phy 88 18 Nov. 2008 Pakiri / 2658945E; 6553685S
Gahnia swamp site probably disturbed by past logging
Phy 89 11 Mar. 2009 Huia ‘Joan’s tree’ / 2649586E; 6466012S
Ricker stand
Phy 91 20 Mar. 2009 Huia ‘Joan’s tree’ / 2649586E; 6466012S
Ricker stand
Phy 92 21 Mar. 2009 Cascades tree C3A / 2649586E; 6466012S
Old forest with large trees (>2 m)
Phy 93 21 May 2009 Great Barrier Island, Kaiaraara / 2724235E, 6554585S
Ricker stand with planted kauri c. 1954–56
Phy 94, 96, 97, 99
4 June, 23 June, 29 July, 10 Sep. 2009
Maungaroa Ridge L10 / 2642364E; 64717508S
Ricker stand
Phy 95/100 16 June 2009 Cascades, Tree R&J1 / 2646090 E; 6478205S
Ricker stand
Phy 103 (Awhitu)
20 Jan., 3 Feb. 2010 Awhitu (Williams tree) / 1740985E, 5897619S
Phy 104/120 5 Feb, 12 Feb. 2010 Cascades ‘Helen’s tree’ / 2645584 E; 6478131S
Old forest with large trees (>2 m).
Phy 121 12 July 2009 Cascades RJ1 / 2646090 E; 6478205S
Old forest with large trees (>2 m).

Detection of Phytophthora taxon Agathis (PTA)
Page 24 Landcare Research
5 Soil sampling results
5.1 Bait comparisons: using sterile zoosporangium bioassay
The sterile zoosporangium bioassay gave approximately 24 500 zoospores per litre available to infect the bait tissues in each reaction vessel. The percentage recovery of PTA by each of the Institutes (providing three replicates) is given below in Figure 14; raw data are presented in Appendix 3A.
From Scion, the top-four preferred bait species were identified to be abelia, silver beech, tōtara and Himalayan cedar. For Plant & Food Research, the top-four preferred baits were Himalayan cedar, rhododendron, karamū, and pohutukawa (and pine needles equally). For Landcare Research, the top-four preferred bait species were lupin radicles, Himalayan cedar, bay tree, and kauri leaves (Figure 14).

Detection of Phytophthora taxon Agathis (PTA)
Landcare Research Page 25
Figure 14 Comparison of mean infection percentage of different bait tissues with PTA after 7 days.
5.2 Bait comparisons: using a soil‐based bioassay
A shortlist of species (Table 5) derived from the top-four preferred baits (Figure 14) were then examined using a soil-based bioassay – this is an experimental design that more realistically reflects the number of PTA inoculum propagules in soil samples and also examines bait effectiveness when there are competing pythiaceous organisms. The summary of the results is presented in Table 5 (the raw data are presented in Appendix 3B).
Table 5 Mean percent recoveries of PTA on top-four baits in soil-based bioassay
Scion Plant & Food Research Landcare Research Approx. average
Detection of Phytophthora taxon Agathis (PTA)
Page 26 Landcare Research
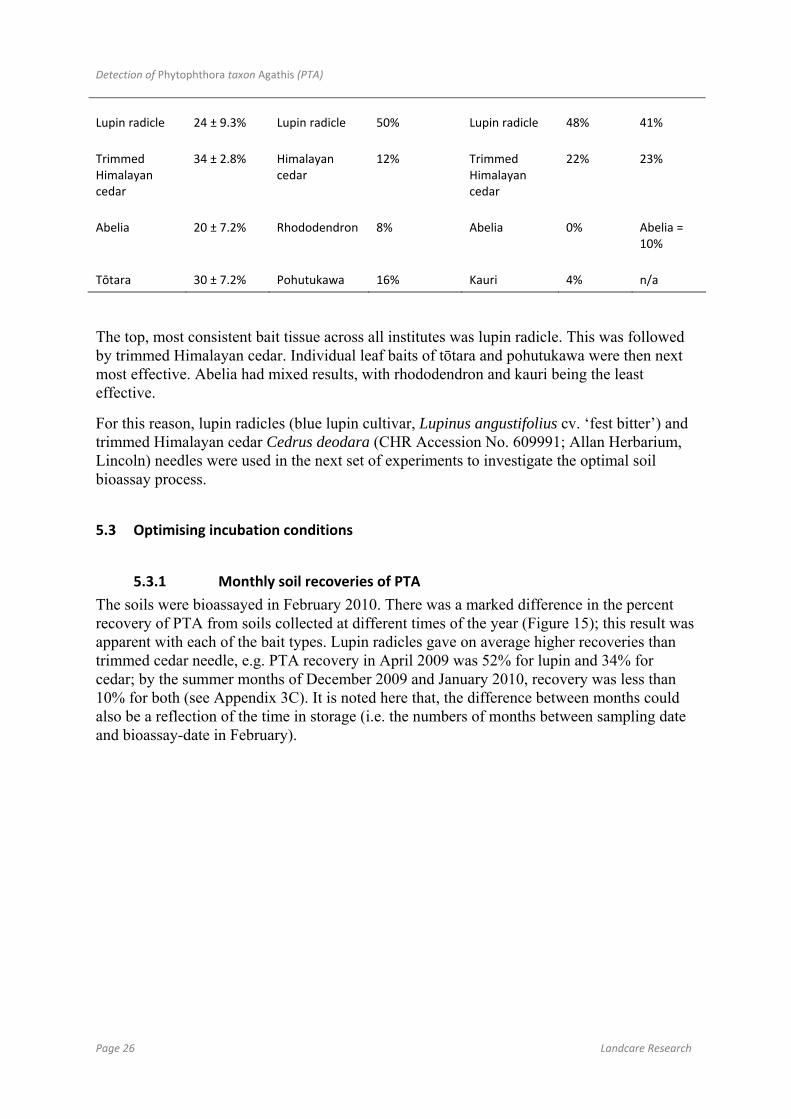
Lupin radicle 24 ± 9.3% Lupin radicle 50% Lupin radicle 48% 41%
Trimmed Himalayan cedar
34 ± 2.8% Himalayan cedar
12% Trimmed Himalayan cedar
22% 23%
Abelia 20 ± 7.2% Rhododendron 8% Abelia 0% Abelia = 10%
Tōtara 30 ± 7.2% Pohutukawa 16% Kauri 4% n/a
The top, most consistent bait tissue across all institutes was lupin radicle. This was followed by trimmed Himalayan cedar. Individual leaf baits of tōtara and pohutukawa were then next most effective. Abelia had mixed results, with rhododendron and kauri being the least effective.
For this reason, lupin radicles (blue lupin cultivar, Lupinus angustifolius cv. ‘fest bitter’) and trimmed Himalayan cedar Cedrus deodara (CHR Accession No. 609991; Allan Herbarium, Lincoln) needles were used in the next set of experiments to investigate the optimal soil bioassay process.
5.3 Optimising incubation conditions
5.3.1 Monthly soil recoveries of PTA
The soils were bioassayed in February 2010. There was a marked difference in the percent recovery of PTA from soils collected at different times of the year (Figure 15); this result was apparent with each of the bait types. Lupin radicles gave on average higher recoveries than trimmed cedar needle, e.g. PTA recovery in April 2009 was 52% for lupin and 34% for cedar; by the summer months of December 2009 and January 2010, recovery was less than 10% for both (see Appendix 3C). It is noted here that, the difference between months could also be a reflection of the time in storage (i.e. the numbers of months between sampling date and bioassay-date in February).

Detection of Phytophthora taxon Agathis (PTA)
Landcare Research Page 27
Figure 15 Monthly variation in PTA recovery from soils sampled every month (except May and November, 2009) and assayed together at one time in February, 2010, using either lupin radicles (lup) or trimmed cedar
needles (Ced) as baits.
5.3.2 Vernalisation (cold treatment)
A 6-week treatment at 3°C did not benefit the recovery of PTA from soil. No PTA was recovered from the December 2009 and January 2010 soils that were subjected to the cold treatment (Table 6, for raw data see Appendix 3D). PTA recovery from the same two soils sampled after only 6 days was around 5% for both December 2009 and January 2010 (see above results). Interestingly, P. cinnamomi was detected after the cold treatment.
The addition of chilled RO water (10°C) to the soil bioassay vessel instead of ambient-temperature RO water was also examined experimentally (raw data in Appendix 3E). There was no difference between the proportions of samples that scored positive for PTA when the soil was treated with cold water versus ambient-temperature water. However, there was a slight reduction in the proportion of baits colonised by PTA.
Table 6 Recoveries from soil stored at 3°C for 6 weeks
Sample Replicate % P. cinnamomi and bait % Pythium and bait
Dec‐09 1 20 lupin 0
Dec‐09 2 20 cedar 0
Dec‐09 3 20 lupin 0
Dec‐09 4 20 cedar 0
Dec‐09 5 0 0
Jan‐10 1 20 lupin 0

Detection of Phytophthora taxon Agathis (PTA)
Page 28 Landcare Research
Sample Replicate % P. cinnamomi and bait % Pythium and bait
Jan‐10 2 40 cedar 20 cedar
Jan‐10 3 20 lupin 0
Jan‐10 4 0 0
Jan‐10 5 40 cedar 20 cedar
5.3.3 Temperature influence on bioassay efficacy
The influence of three different incubation temperatures on the percentage recovery of PTA was examined by Scion. A summary of the results is presented in Table 7.
The optimum temperature for bioassaying soils using cedar needles and silver beech is 20°C. The optimum temperature for recovery using lupin in the bioassay is between 20 and 25°C.
5.3.4 Detection‐limit of PTA in a range of soil sample sizes
An analysis of the detection-limit of PTA from a range of increasingly larger soil samples was carried out using soil sampled form Huia in June, 2009. This work is summarised below (Fig. 16), with the raw data from this presented in Appendix 3E.
The analysis shows that PTA can be successfully recovered from soil samples ranging from 0.5 up to 50 g (Figure 16). The proportion of samples positive for PTA in 0.5 g of soil was 30%, compared with 80–100% recovery at the larger sample sizes of 50 g and 20 g respectively. PTA was recovered from all sample sizes across the range – with larger samples giving a correspondingly higher percentage of recovery. Recovery of PTA from 0.5-g samples demonstrates the sensitivity of this baiting procedure.
Table 7 PTA recoveries from soil bioassay incubated at three different temperatures (data represent PTA colonies after 7 days)
Bait Temperature (°C) Total no. leaf pieces No. PTA recoveries Mean % PTA recovery SEM
Cedar needles 15 50 1 2 1.4
20 52 13 25.1 5.7
25 49 2 4 2.9
Lupin radicles 15 54 1 1.8 1.3
20 50 3 6 2.2

Detection of Phytophthora taxon Agathis (PTA)
Landcare Research Page 29
25 50 22 45 5.7
Silver beech 15 52 4 7.5 2.7
20 52 17 31 6.3
25 48 9 18.4 2.6
Figure 16 Comparative PTA recoveries from a range of seven soil-sample sizes (graph includes 10-g soil samples assayed with chilled RO water).
5.3.5 Soil bioassay ratio study
In order to obtain the optimum ratio of soil to water for the bioassay reaction, a range of combinations of plastic disposable containers with varying amounts of soil and RO water was tested. The aim was to use plastic disposable containers that are readily available for bulk purchase, i.e. 250-ml and/or 300-ml plastic drinking cups, 680-ml plastic pottles and 1-L rectangular plastic disposable take-away containers. The data summarised below can be found in Appendix 3F together with the statistical analysis.
The maximum percentage recovery of PTA was 30% – achieved using 15–20 g of soil and 200–250 ml of RO water in a 250-ml or 300-ml plastic cup (Table 8). However, there was no significant difference between the 15–20 g of soil and 160 g of soil (P = 0.6299).
Table 8 Soil mass, vessel size and RO water volumes versus % PTA recoveries
Soil mass (fresh weight in grams)
Vessel size (ml) Replicates RO water volume (ml)
% mean PTA
SEM

Detection of Phytophthora taxon Agathis (PTA)
Page 30 Landcare Research
15 250 8 150 30a 7.9
20 300 8 200 30a 6.7
90 680 8 300 17.5b 7.1
160 1000 8 500 27.5a 14.5
5.4 Validation of soil sampling and extended bioassay
5.4.1 Soil sampling
A summary of the validation of the cardinal-point soil sampling approach is provided in Table 9 (with the raw data contained in Appendix 3G). The analysis identified that PTA was recovered from all four quadrants around the infected tree at Maungaroa Ridge (Figures 4 and 5). Samples 5 and 6 represent soil taken adjacent to the lesion.
At Huia, we did not know the disease status of the tree. However, using the same sampling approach as carried out at Maungaroa Ridge, we successfully recovered PTA from each of the four quadrants sampled around the tree (Table 9).
Thus for re-growth kauri stands, comprising ricker-trees up to 80 cm dbh, a soil sample of 1 kg obtained two metres away from the base of the tree is an appropriate approach to gain a representative sample. For trees over this size class, inhabiting old-growth stands of kauri (i.e. > 2.0 m dbh), an up-scaling of the above sampling strategy is necessary to obtain a representative sample of the soil under the drip-line of these larger specimens (e.g. up to potentially 2-3 kg sample, comprising up to 20 sub-samples). This approach was used as part of the sampling undertaken in March, 2009, the results of which are included in the next section.

Detection of Phytophthora taxon Agathis (PTA)
Landcare Research Page 31
Table 9 Recovery of PTA from Tree L10 at Maungaroa Ridge versus a symptomatic tree at Huia. Red highlighted samples represent soil samples taken adjacent to the lesion
Sample Soil mass (g)
% PTA Sample Soil mass (g) % PTA
L10 ‐1 71 0 Huia 1 117 0
L10‐2 70 20 Huia 2 112 100
L10‐3 67 60 Huia 3 128 60
L10‐4 79 0 Huia 4 106 0
L10‐5 45 20 Huia 5 106 100
L10‐6 70 0 Huia 6 127 100
L10‐7 45 20 Huia 7 142 0
L10‐8 86 0 Huia 8 135 20
5.4.1 PTA recovery from soils using the extended bioassay
A summary of the validation of the sensitivity of the soil SOP to detect PTA in soils from outside the Auckland Region is presented in Appendix 1. The results show that the extended soil bioassay technique successfully detected PTA in soil sampled from under trees displaying gummosis and crown decline (e.g. Sample 1 from Robert Hastie Scenic Reserve).
We also consistently demonstrated that PTA could be recovered from soil taken from around PTA-positive trees sampled from Raetea Plantation and Trounson Kauri Park. However, there were also instances where PTA was not recovered from soil below a PTA-positive tree (e.g. samples 37, 40, and 46).
The extended soil bioassay also recovered PTA from soil under PTA-infected trees at the Kaiaraara site on Great Barrier Island (e.g. sample 18): a result that was consistently achieved across all three CRI’s, from sub-samples originating from one larger, 2 kg bulk sample.
This soil bioassay study also recovered PTA for the first time from symptomatic kauri in the Hunua Ranges from Mangatangi Hill Road. This soil was sampled from under kauri demonstrating pus-like gummosis (see Appendix 4) (Dr Nick W. Waipara and Stacey Hill, ARC, personal communication).
There was some, but not complete consistency in the PTA recoveries (or lack of recovery) for the five soil subsamples assayed by the three CRIs. We all failed to recover PTA from soil samples 11(Mangatangi Trig Track Hunua Ranges), 17 (Little Barrier Island). For sample 19 (Great Barrier Island), only Plant & Food recovered PTA. For soil samples 18 (Great Barrier Island) all three laboratories got PTA. For sample 33 (Trounson Kauri Park), two out of the three laboratories had the same recovery success for PTA (Appendix 1).

Detection of Phytophthora taxon Agathis (PTA)
Page 32 Landcare Research
The soil bioassay also detected other Phytophthora species including; P. cinnamomi and P. multivora. P. cinnamomi has been previously been associated with kauri decline (see Podger and Newhook 1971). The significance of the P. multivora recoveries from soil associated with tree 3 from Great Barrier Island and soil from within the vicinity of the Tane Mahuta Track need further investigation.
6 Tissue detection results
6.1 Tree symptom studies
6.1.1 Stand symptoms
Stands of trees with crown decline or thinning are an indicative marker for the presence of PTA. Usually, such sites are often modified or disturbed in some way. For example, there was a lot of silvicultural work done on the Gadgil site in the 1950s/60s, and pigs are present. Figure 17 highlights some of the symptoms of crown thinning that differentiates the unthrifty trees from the healthy bush at the Gadgil site at Whangaparapara on Great Barrier Island.
Figure 17 Great Barrier Island: the ‘Gadgil site’, showing yellowish pockets with some crown thinning at margins and mid-slope (circled).
The Maungaroa Ridge site (Figure 18) is on a dry ridge and the trees are very water stressed and undergoing natural thinning; a track goes through the stand. The Huia site (Figure 19) is close to a track, and pig disturbance is abundant. The Pakiri site (Figure 20) surrounds a

Detection of Phytophthora taxon Agathis (PTA)
Landcare Research Page 33
Gahnia swamp, probably reflecting tree removal in the early 1950s and bulldozer disturbance leading to a flat ridge-top with impeded drainage.
Figure 18 Maungaroa Ridge site: showing location of ill-thrifty trees just below ridge-top (circled). This is the site reported on by Peter Maddison and sampled by REB 11 Mar 2006 (PTA +ve),
the first mainland PTA-positive kauri (Phy 76, photo taken, 11 Mar 2006).
Figure 19 Huia site: showing ill-thrifty trees. This is the site where Nick Waipara (ARC) has established a monitoring quadrat (photo courtesy of Tod Ramsfield, Scion).

Detection of Phytophthora taxon Agathis (PTA)
Page 34 Landcare Research
Figure 20 Pakiri site: aerial shot showing ill-thrifty trees, with sparse canopies, in the centre of the photograph (photo courtesy of Alistair Jamieson, ARC).
6.1.2 Tree symptoms
From our previous examples, it can be seen that crown thinning can occur in ricker-age trees (e.g. Figure 21).
Figure 21 Canopy thinning – loss of leaves and branchlets at the Maungaroa Ridge site, 12 Mar. 2006 (Phy 76 DSCN8721). PTA was recovered from trees and soil at this site.

Detection of Phytophthora taxon Agathis (PTA)
Landcare Research Page 35
Large trees (i.e. >2 m dbh) also exhibit a crown-thinning phenomenon, but this is more commonly referred to as ‘stag heads’ (Figure 22) – often associated with large sectors of dead trunk flanked near ground level by bleeding lesions.
Figure 22 Cascades site: PTA-infected giant tree (2.6 m dbh, Tree R&J1) showing deteriorating canopy sector – so-called ‘stag heads’, correlating with basal lesion (see Figs 11, 12 and 13).
One large tree (Phy 100, Tree R&J1, Figs 11 & 18), displaying a large basal lesion coupled with a deteriorating canopy, was positively diagnosed with PTA. However, we would be wary of too readily interpreting ‘stag heads’ as solely reflecting PTA presence. Many other agents could result in the development of stag heads, including lightning strike and basidiomycete infections (e.g. Armillaria). Nevertheless, the presence of stag heads could indicate whether a site is worthy of further investigation to determine if PTA is present – if this occurs in combination with overall stand decline and pus-like gummosis.
6.1.3 Stand and tree symptoms correlated with PTA infection
In stands where PTA is known to occur, many trees show a range of disease symptoms. Not all of these symptoms can be attributed to PTA infection disrupting normal plant function, as many other abiotic and biotic factors can also disrupt normal plant function. In Table 10, we attempt to discriminate which disease symptoms are consistently associated with PTA infection.

Detection of Phytophthora taxon Agathis (PTA)
Page 36 Landcare Research
Table 10 Summary of tree disease symptoms and relationship to PTA presence/absence (Appendix 4)
Disease symptoms Association with PTA? Also associated with…
Stand thinning Not always Self‐thinning (Ogden et al. 1987)
Pale‐green to yellowish foliage (chlorosis)
Not always Root rot by P. cinnamomi (Podger & Newhook 1971), nitrogen deficiency (Silvester 2000)
Canopy thinning and branchlet loss; reduced growth
Not always Root rot by P. cinnamomi (Podger & Newhook 1971), insect damage (e.g. leaf miner, leaf roller)?
Foliage browning/reddening and tree collapse (leading to ‘stag‐heads’)
Not always Drought stress (Desprez‐Loustau et al. 2006), basidiomycete infection (McKenzie et al. 2002)
Gummosis Not always – dependent upon nature of resin (see below)
Physical injury (Langenheim 2003), Armillaria butt‐ and root‐rot (McKenzie et al. 2002; Sinclair and Lyon 2005), insect borer damage?
Depressed, sunken lesion at collar of kauri – sometimes encircling stem (i.e. canker)
Strong association with PTA Beever et al. 2009
6.1.4 Gummosis and PTA infection
Of the disease symptoms discussed so far, the fresh, pus-like, ‘blobby’ gummosis is also considered strongly diagnostic for the presence of PTA (Figures 23 and 24).
Figure 23 Pus-like blobby gummosis associated with PTA at Kaiaraara site, Great Barrier (Tree 2, NW2) (photo Nick Waipara, ARC).

Detection of Phytophthora taxon Agathis (PTA)
Landcare Research Page 37
Figure 24 Pus-like blobby gummosis associated with PTA at Kaiaraara site, Great Barrier (Tree 1, NW1) (Photo: Nick Waipara, ARC).
6.1.5 Tree lesions and PTA infection
Detailed dissection of tree lesions was conducted to better understand the distribution of the PTA in the tissue and thus optimise the chances of recovering PTA.
PTA was readily recovered from the cork cambium (see Fig. 2) immediately underneath the outer bark (Figure 25; “cork cambium 9/10”). Recovery success reduced when the samples were taken from the secondary phloem (see Fig. 2) underneath the cork cambium (Figure 25; “waterlogged phloem 2/10”).
By progressing deeper into the trunk, underneath towards the vascular cambium (see Fig. 2), the tissues appeared healthy and no PTA was recovered (Figure 25; “pale area under 0/10”).
Additionally, PTA can also be recovered from further down the trunk from the lesions in the vicinity of damaged cork cambium tissues (Figure 26).

Detection of Phytophthora taxon Agathis (PTA)
Page 38 Landcare Research
Cork cambium = 9/10
‘waterlogged phloem = 2/10
Pale area under = 0/10
Figure 25 Dissection of bark tissue under a region of freshly bleeding pus-like gummosis on a 2.6-m dbh tree at the
Cascades (Waitakere Ranges, Auckland). NB Scores out of 10 indicate success of recovery of PTA.
Figure 26 Recovery of PTA from cork cambial tissues sampled c. 30 cm down the trunk from point of gummosis. Brown lesions of the damaged cambial interface region (marked with white arrow)
are apparent spreading up the trunk from near ground level.

Detection of Phytophthora taxon Agathis (PTA)
Landcare Research Page 39
PTA was seldom recovered from the damaged secondary phloem tissue just beneath the damaged cork cambium (Figure 27).
Figure 27 Demonstration of lower recovery-rate of PTA from the damaged secondary phloem tissues adjacent (and inner) to the cork cambium tissues illustrated in Fig. 26 (N.B. Scores indicate success of
PTA recovery from an excised block of symptomatic cambial tissues).
Our lesion studies indicate that the highest probability of recovering PTA is from below the outer bark, in the region of the cork cambium associated with pus-like blobs of gummosis. This region is likely to reflect recently infected tissue, enhancing the likelihood of PTA recovery.
6.1.6 Tree lesions with no recovery of PTA
Unfortunately, like soil-based detection of PTA, not every lesion behind a blob of gummosis will result in recovery of PTA.
For example, from Figure 28, it can be seen that ‘basal’ gummosis in the upper picture harboured behind it white mycelium present close to the advancing margin of gummosis. A basidiomycete-like fungus was isolated from the tissue margin. This is an example of where there may have been a priori reason to suspect PTA involved as a primary pathogen but this was not supported by PTA recovery on selective medium. This does not discount PTA as the primary pathogen, as the basidiomycete may represent the secondary invader
Another example of some other biotic agent confounding PTA-diagnosis is the presence of small ‘pin-holes’ associated with insect frass and gummosis (Figure 29).
From case-study Phy 120, the pin-hole borer Platypus apicalis was identified to be associated with the clear-gum bleeding from the lesion. This species predominantly attacks ‘southern beech’ (Nothofagus spp.) but will also attacked other native and exotic trees (Reay et al. 2007).

Detection of Phytophthora taxon Agathis (PTA)
Page 40 Landcare Research
Figure 28 Phy 101 Putative, basidiomycete-induced gummosis, or basidiomycete as the secondary invader? Either way, no, PTA recovered.
Figure 29 Insect frass (highlighted by white arrow) associated with clear gum bleeding. The pin-hole borer Platypus apicalis recovered from emergence tunnels.

Detection of Phytophthora taxon Agathis (PTA)
Landcare Research Page 41
7 Conclusions
7.1 Key findings of the soil experiments (including validation study)
Soil sampling protocol
Obtain necessary permits to sample trees
Optimal location for soil sampling around a symptomatic tree <2.0 m dbh:
1–2 m around the trunk of a symptomatic tree
Include ‘cardinal points’ around tree to achieve representative sampling of eachquadrant of the tree’s rhizosphere
Optimal soil sample size: approx. 125 g per soil core
Total composite sample recommended approx. 1.0 kg per tree
From the validation study, it is clear that soil sampling around trees > 2.0 m dbh needs to be “scaled-up” to obtain a representative sample of the soil under the drip line. A proposed approach could be:
4–8 m around the trunk of a symptomatic tree
Include ‘cardinal points’ around tree to achieve representative sampling of eachquadrant of the tree’s rhizosphere (beyond 1-2 m from trunk; resulting in a total of 15samples)
Optimal soil sample size: approx. 125 g per soil core
Total composite sample recommended approx. 2.0 kg per tree
N.B. consideration needs to be given to the impacts associated with multiple soil samples (see Recommendation section)
Storage conditions of soil in the laboratory
10°C
Soil pretreatment conditions
2 days’ air drying
4 days’ moist incubation
Best baits
Lupin radicle (Lupinus angustifolius; blue lupin from Rockfield, Tasmania)
Himalayan cedar needles (Cedrus deodara (Roxb.) G.Don
Temperature for bioassay
20–22°C

Detection of Phytophthora taxon Agathis (PTA)
Page 42 Landcare Research
Length of time of bioassay
2-days
Soil:water ratio for running bioassay
1-3 cm deep layer of soil Flooded with 5-10 cm layer of RO water
7.2 Key findings of the lesion studies
In summary below the outer bark tissue of freshly bleeding lesions is likely to be the most efficient sampling target for diagnostic assessment of trees in the field. PTA was isolated from the cork cambium – no isolates were obtained from the inner vascular cambium. There are three significant positives for this approach:
Sampling the outer bark by itself will likely cause little long-term damage to the tree, asit is probable that the damaged outer tissue will be walled off by the development ofcork cambium under this area. In contrast sampling of the vascular cambium anddamaging this tissue will cause a permanent wound potentially leading to entry ofsecondary organisms into the wood.
In terms of field sampling and processing in the laboratory, just taking this tissue (evenif three similar samples may be needed per tree) will speed the process and minimisecost.
Coupled with targeting this tissue, it may prove possible to test for the presence ofPhytophthora in the field using commercial lateral flow devices (LFDs) based onantibodies. Results from a recent sampling effort showed good correlation betweenpositive LFD and direct isolation of PTA.
7.3 Soil baiting standard operating protocol (SOP) for Phytophthora taxon Agathis (PTA)
Drying of soil samples (pretreatment-phase)
Thoroughly mix soil samples in their bag to remove lumps
Label container
Measure desired amount of soil into bait container, e.g.
175 g into 1-L take-away container 90 g into 680-ml circular plastic pottle 20 g in 300-ml plastic cup
Air-dry on lab bench for 2 days
Check soil each day and crumble clods with pop-sticks (use a new pop-stick for eachsample)
NB Alternatively, soils can be dried on paper towels on laboratory bench – being aware of potential for aerial contamination of soil surface.

Detection of Phytophthora taxon Agathis (PTA)
Landcare Research Page 43
Moist incubation (stimulating-phase):
Using a spray-squirt bottle, moisten soil samples in containers with RO water (using a fine mist)
Spray enough moisture to make soil surface shine. Respray after 1 h, targeting dry spots / clods of soil
Apply lid loosely
Incubate in light for 4 days at room temperature (20–22°C)
Bait tissue preparation
One day after the commencement of moist incubation, prepare desired amount of lupin seed. There are two suggested approaches depending on the number of baits required.
For larger batches (>200 seeds):
Soak lupin seed in RO water for 1 h Sow into moist vermiculite in clean seedling tray Water each day Upon emergence (2-3 days) place in 10°C store
For smaller batches (up to 80 seeds):
Mix lupin seed in dry vermiculite in 200-ml beaker (around 50–80 seeds) Saturate with RO water and then drain off excess Cover with plastic Petri-dish lid and incubate in light at 20°C
Needles of Himalayan cedar (Cedrus deodara). Use mature, dark green needles (not new-season flush), harvested directly off tree
Pull off whorls
Holding complete whorl, snip end of needles (approx. 2-cm pieces) NB Needles can also be left intact
Pull needles off from leaf base
Bioassay
Inundate the soil very slowly with RO or distilled water, e.g.:
500 ml for 1-L take-away container 300 ml for 680-ml circular plastic pottle 150 ml for 300-ml plastic cup
NB aiming to achieve a depth of RO water of 5-10 cm above soil surface
Minimise soil disturbance and water turbulence
The soil must not be mixed once flooded
Sprinkle five 2-cm lengths of Himalayan cedar leaflets on water surface
Add five lupin radicles to the water surface (suspended on polystyrene floats, or floated on the water surface)
Incubate at 20°C in light for 2 days.

Detection of Phytophthora taxon Agathis (PTA)
Page 44 Landcare Research
Bait processing
After 2 days remove the bait tissues
Wash in single rinse of sterile RO water
Soak in 70% ethanol (ETOH) for 30 s
Remove from ETOH, rinse in sterile RO water
Blot dry on paper towels
Place leaflets/lupins onto P5ARPH
Label and seal plates and incubate in the dark at 18–20°C for two-days
Colony isolation
Isolate Phytophthora-like cultures to V8 juice agar
Check V8 juice agar plates after 4 days
If cultures are free of contamination, sub-culture to PDA
Usual timeline
Set up soils to dry on Day 1
Commence moist incubation on Day 3
Commence lupin germination on Day 4 (p.m.)
Flood and bait on Day 7
Harvest and plate out baits on Day 9
Check cultures on Day 11, sub-culturing to V8 juice agar where necessary
Re-check cultures on Day 14 for new colonies, and sub-culture to V8 juice agar
N.B. the transparency of V8-juice agar can be improved through clarification (see Appendix 2).
7.4 Lesion sampling standard operating protocol (SOP) for Phytophthora taxon Agathis (PTA)
Sampling of trees
Obtain necessary permits to sample trees
Conduct necessary consultation to gain permission to sample trees
Document stand symptoms
Site information; topography; aspect; stand characteristics
Record kauri classes present (i.e. seedling < 1 m tall; sapling 1–4 m tall; ricker > 4 m generally 10–30 cm dbh; ‘old growth > 2.0 m dbh)
Record kauri canopy status
Record health of understorey

Detection of Phytophthora taxon Agathis (PTA)
Landcare Research Page 45
Record predominant understorey species
Document soil type
Describe hydrology/major hydrological features
Document evidence of disturbance
Record GPS
Draw a sketch-map of stand and study site
Documentation of tree symptoms
Make unique label for tree sample
Label appropriate number of zip-lock bags to receive wood samples
Record class of kauri (i.e. seedling; sapling, ricker or ‘old growth’)
Describe canopy condition of individual tree (i.e. good condition; foliage thinning; some branch dieback; severe crown dieback; dead)
Observe gummosis – old resin bleed at base?
None? <10% circumference? 10–50% of stem circumference? 51–80% of stem circumference? 81–100% of stem circumference? No need to sample?
Observe gummosis – Fresh resin bleed at base?
Pus-like, gummy lesion low on the trunk Quantify extent of fresh gummosis Surface-sterilise sampling tools (e.g. sharp wood chisel) Delimit boundary of wood sample to the advancing, upward edge of the
gummosis–healthy tissue boundary (20-30 cm2) Sample from outer bark; progressively moving inwards in small depth
increments to cork cambium Do not extend sampling-depth to vascular cambium (or wood) Place bark-tissue pieces into labelled zip-lock bags Spray wound with grafting spray Surface-sterilise sampling implement in between samples
Subsample inner-most tissue from bark sample for LFD assessment
Other relevant tree symptoms:
Presence of canker / sunken, wet, depressed lesion Presence of frass or borer holes? Presence of dead roots in soil sample?
Tissue preparation
Keep tissue samples cool during transit
Plate out tissue samples 2–24 h after obtaining the sample

Detection of Phytophthora taxon Agathis (PTA)
Page 46 Landcare Research
Tissue processing
Surface-sterilise scalpels
Surface-sterilisation of tissue not necessary if processed immediately
Shave thin, tangential slices from the inner surface of the bark sample
Place slices of tissue onto sequentially labelled P5ARP plates
Incubate plates in the dark at 18°C.
Colony isolation
Isolate Phytophthora-like cultures to V8 juice agar
Check V8 juice agar plates after 4 days
If cultures are free of contamination, sub-culture to PDA.
8 Concluding discussion
Although Phytophthora species are one of the world’s most important threats to forest ecosystems, they are notoriously hard to isolate, and many disease complexes remain undiagnosed for many years because of the cryptic nature of some of the representatives of this genus. A classic example of the long time required to diagnose the specific Phytophthora species involved in a native plant-decline syndrome is that of ‘mal del ciprės’, cypress wither, in Patagonia. The decline of Ciprės de la cordillaria Austrocedrus chiliensis has been observed for over 50 years (Greslebin et al. 2005). The decline involves the progressive withering and subsequent defoliation of the tree, which finally dies while standing. A survey of Phytophthora species in declining and healthy Austrocedrus forest was conducted. Five Phytophthora species were recovered, but none of the isolated species showed a clear relationship with cypress wither.
In 2007, a new species of Phytophthora was described, P. austrocedrae (Greslebin et al. 2007). From further study of diseased trees, necrotic inner-bark lesions at the root collar and lower stem were investigated. These lesions originated in the roots and progressed upward towards to the collar. After very careful study, they recovered a very slow growing, Phytophthora with a very low optimal growth temperature of 17.5°C. The reason this organism eluded them previously is because ‘traditional’ recovery techniques (i.e. soil bioassay) favoured the faster, more aggressive Phytophthora species, which out-competed this slower, more recalcitrant species. P. austrocedrae is now considered to be the primary cause of the disease leading to the mortality of A. chilensis known as ‘mal del ciprés’, but its presence would not be known without the use of DNA extraction from the necrotic tissues and PCR with Phytophthora-specific primers, which showed the presence of a cryptic, Phytophthora species. More importantly, the putative causal agent was not recovered from the soil, but rather from the symptomatic tree.
For the present study, there are a number of reasons for the apparent hit-or-miss nature of soil- and plant-based PTA recoveries. Reasons for variation in soil-based recoveries can be attributed to the amount of PTA inoculum present in the soil under an infected tree and its likely uneven distribution. Since only a small subsample of the entire bulk of soil that resides under a kauri tree is only ever sampled, there is the chance of missing the contaminated soil.

Detection of Phytophthora taxon Agathis (PTA)
Landcare Research Page 47
It must also be remembered that there is a lag-time between initial root infection and expression of PTA-disease symptoms in the collar and crown of the infected tree. When first symptoms become visible in the crown, the destruction of the fine root system may be already at a very advanced stage. At this point the inoculum of the primary parasitic Phytophthora may have decreased to a low, nearly undetectable level.
The reasons for variation in tissue recoveries can be attributed to Phytophthora species having an extremely low competitive saprophytic ability and thus, cannot compete with secondary-invading micro-organisms. Once the live phloem and cambium is parasitised by PTA, this will result in a depletion of the nutrient reserve for PTA to utilise. There may also be competition from secondary invading micro-organisms (such as wood-rotting basidiomycetes). Old, hardened gum associated with previous active lesions can also make accessing recently diseased phloem difficult, as the diseased site may already be contaminated with secondary fungi – which will be recovered instead of the primary parasitic Phytophthora species.
Because of the complexity associated with the interactions between pathogen, host, environment and time on disease expression, we consider it necessary to gain as much information as possible when diagnosing PTA. For this reason we advocate the complimentary approaches of soil- and tissue-based diagnoses for the detection of PTA.
9 Recommendations
Recommendation 1: Consent before action
Prior to any survey for the presence of PTA in kauri land, a standardised diagnostic protocol for the sampling of kauri and kauri soils must be established. This protocol should be developed with consideration being given to (and not limited to):
Gaining necessary permits through consultation Engaging local expertise with knowledge of kauri ecology Surveying with local participation Tree and soil sampling Sharing of results and knowledge through consultation with all stakeholders
Recommendation 2: Risk-based assessment of the relative cost:benefits of soil- versus tissue-based detection
Further research is required to understand the consequences and impacts of soil- versus tissue-based sampling. The recommended multiple (approx. 15) soil samples from each tree will potentially cause (fine) root damage. Does this then expose the tree to multiple wound entry points for infection by PTA? In contrast, tree trunk sampling, though conspicuous, is much less damaging to the tree than the potential vulnerability to soil infection of multiple severed roots - which are unseen and unable to be protected. Trunk wounds, on the other hand, are discrete, can be actively protected by graft-wound sprays, and mostly will heal naturally through regeneration of the cork cambium.
Recommendation 3: Assess temporal variation of sporulation

Detection of Phytophthora taxon Agathis (PTA)
Page 48 Landcare Research
The role of season and other temporal changes on the activity of oospores and other soil-borne inoculum needs further investigation. Horner and Wilcox (1996) found that dormant spore populations of P. cactorum were highest in early spring, declined steadily throughout the summer and autumn, and increased the following spring. We cannot extrapolate seasonal variation from the results of the present study because the soils that were sampled in April 2009 had been held in storage at 10°C for approximately 10 months at the time of bioassay. This soil was compared with other samples taken in spring and summer that had been stored for a lesser length of time. The results from the present study could reflect a preconditioning of the soil which is enhanced by storage.
Recommendation 4: Further research into disease spread and etiology
A number of questions emerge around what facilitates the landscape movement of PTA and what are the pathways/vectors spreading the inoculum. Also, related to this, what is the rate of spread of disease, and hence, predicted rate of kauri decline in infested sites?
There is also the question of the role root-to-root contact plays in the etiology of transmission from diseased to healthy trees. The concept is well accepted in the spread of basiodiomycetous diseases such as Armillaria root rot; when uninfected roots contact infected roots, the fungal mycelium invades uninfected roots (see Williams et al. 1989). Is this a possible pathway for the spread of the disease through dense, ricker-age kauri stands from a single disease focus?
There is also potential for research into the anatomical changes associated with resin ducts in relation to systemic infection by PTA. Traumatic resin ducts and polyphenolic parenchyma cells have been observed in conifers as a host-response to herbivores (Kroken et al. 2008). Little information is available on different types of resin structures in Agathis spp. with the only anatomical study on Agathis being carried out by Penhallow (1907).
Recommendation 5: Development of serological and molecular-based diagnostics
Serological detection has continued to develop with the commercial availability of a new ‘immuno-strip’ technology for generic Phytophthora detection. Agdia® has developed a new ImmunoStrip® which not only provides a diagnostic colour-confirmation for the generic presence of Phytophthora, but also allows for the extraction of DNA. The suitability of this modern strip-technology should be assessed for PTA to see if it can be used to assist in-field diagnosis, and then for the recovery of DNA of the parasitic organism. Preliminary results from Scion have demonstrated the ability of this technology to successfully detect Phytophthora.
Development of species-specific PCR-based primers for PTA will also be useful to refine diagnostic approaches to detection. This is currently being pursued through a collaboration between MAFBNZ, FERA (UK) and Landcare Research.
Recommendation 6: Provision of research into other Phytophthora species
The significance of recovery of Phytophthora species other than PTA from kauri forest soils needs investigation. This is especially relevant to broader-scale surveillance which will potentially detect novel Phytophthora species and some that may not have been previously recovered in NZ forests.
Recommendation 7: Quality assurance of comparability of different participating laboratories

Detection of Phytophthora taxon Agathis (PTA)
Landcare Research Page 49
In order to account for potential variation between laboratories participating in tissue- and soil-based diagnostics, a quality assurance system needs to be devised to monitor comparability of PTA recoveries. It is accepted that potential sources of variation still remain between participating laboratories and that origin of bait tissue (especially Himalayan Cedar), needs to be made consistent, or that the potential variation in efficacy of PTA recovery using this bait is quantified.
10 Acknowledgements
We wish to acknowledge the technical support of Karyn Hoksbergen, Elsa Paderes, Daniel Than, Duckchul Park and Chris Winks (Landcare Research), Rita Tetenberg and Judy Gardner (Scion), and Ellena Hough (Plant & Food Research). Discussions and literature sourced by Murray Dawson helped our understanding of the source of kauri gummosis. Nick Waipara (Auckland Regional Council, ARC) carried out a number of tree investigations and we gratefully acknowledge his review of the final report. ARC is thanked for permission to access kauri trees for investigations at Maungaroa Ridge and Huia. Comprehensive tree and stand surveillance by Stacey Hill and Jacqui Brooks (ARC) was invaluable in identifying potential study sites. On-ground logistical support from Alison Davison and Riki Bennett is gratefully acknowledged. Valuable input was also gratefully received from Bruce Burns (Auckland University), Andre Drenth (University of Queensland), Joan Webber (Forest Research, UK Forest Commission) and Andrea Vannini (University of Tuscia, Viterbo, IT). We acknowledge Peter Johnston for comments on an earlier draft of the report, and on-going research support and leadership from both Peter Johnston and Peter Buchanan. Review and discussion with the P&I team from the KDJAR also improved this report and provided the stimulus for the development of the operational implications section.
11 References
Balci Y, Balci S, Eggers J, MacDonald WL, Juzwik J, Long RP, Gottschalk KW 2007. Phytophthora spp. associated with forest soils in eastern and north-central U.S. oak ecosystems. Plant Disease 91: 705–710.
Beever RE, Ramsfield TD, Dick MA, Park D, Fletcher MJ, Horner IJ 2006. Molecular characterisation of New Zealand isolates of the fungus Phytophthora [MBS305]. Landcare Research Contract Report LC0506/155. Confidential report to MAF Policy.
Beever RE, Waipara NW, Ramsfield TD, Dick MA, Horner IJ 2009. Kauri at risk from Phytophthora? Proceedings of the 4th Meeting of the IUFRO Working Party S07.02.09. Pp. 74–85.
Brasier CM, Kirk SA, Delcan J, Cooke DEL, Jung T, Man in’t Veld WA 2004. Phytophthora alni sp. nov. and its variants: designation of emerging heteroploid hybrid pathogens spreading on Alnus trees. Mycological Research 108: 1172–1184.
Brien RM, Dingley JM 1959. A revised list of plant diseases in New Zealand. DSIR Bulletin 192.

Detection of Phytophthora taxon Agathis (PTA)
Page 50 Landcare Research
Canaday CH, Schmitthenner AF 1982. Isolating Phytophthora megasperma f.sp. glycinea from soil with a baiting method that minimises Pythium contamination. Soil Biology and Biochemistry 14: 67–68.
Carlile MJ 1983. Motility, taxis, and tropism in Phytophthora. In: Erwin DC , Bartnicki-Garcia S, Tsao PH eds Phytophthora: its biology, taxonomy, ecology and physiology. St Paul, MN, The American Phytopathological Society.
Cavalier-Smith T 1986. The kingdom Chromista, origin and systematics. In: Round FE, Chapman D eds Progress in phycological research, Vol. 4. Amsterdam, Elsevier. Pp. 309–347.
Chan L-L 1986. The anatomy of the bark of Agathis in New Zealand. IAWA Bulletin n.s., 7: 229–241.
Cooke DEL, Drenth A, Duncan JM, Wagels G, Brasier CM 2000. A molecular phylogeny of Phytophtohra and related Oomycetes. Fungal Genetics and Biology 30: 17–32.
Dance MH, Newhook FJ, Cole JS 1975 Bioassay of Phytophthora spp. in soil. Plant Disease Reporter 59: 523–527.
Desprez-Loustau M-L, Marçais B, Nageleisen L-M, Piou D, Vannini A 2006. Interactive effects of drought and pathogens in forest trees. Annals of Forestry Science 63: 597–612.
Erwin DC, Ribeiro OK 1996. Phytophthora diseases worldwide. St Paul, MN, APS Press.
Gadgil PD 1974. Phytophthora heveae, a pathogen of kauri. New Zealand Journal of Forestry Science 4: 59–63.
Greslebin AG, Hansem EM, Winton LM, Rajchenberg M 2005. Phytophthora species from decliing Austrocedrus chilensis forests in Patagonia, Argentina. Mycologia 97: 218–228.
Greslebin AG, Hansen EM Sutton W 2007. Phytophhthora austrocedrae sp. nov., a new species associated with Austrocedrus chilensis mortality in Patagonia (Argentina). Mycological Research 111: 308–316.
Hansen EM 2008. Alien forest pathogens: Phytophthora species are changing world forests. Boreal Environment Research 13: 33–41.
Hansen EM, Delatour C 1999. Phytophthora species in oak forests. Annals of Forest Science 56: 539–547.
Hansen EM, Goheen DJ, Jules ES, Ullian B 2000. Managing Port-Orford-Cedar and the introduced pathogen Phytophthora lateralis. Plant Disease 84: 4–14.
Hardy 2009. Phytophthora research and management in Australia. Proceedings of the 4th Meeting of the IUFRO Working Party S07.02.09. Pp. 25–34.

Detection of Phytophthora taxon Agathis (PTA)
Landcare Research Page 51
Ho HH 1987. Effects of hymexazol on growth and reproduction of low temperature Phytophthora species. Mycopathologia 98: 17–20.
Horner IJ, Jensen EH 2004. Evaluation of Phytophthora control on avocados. New Zealand Avocado Growers’ Association Annual Research Report 2004. 4, 1–7.
Horner IJ, Wilcox WF 1996. Temporal change in activity and dormant spore populations of Phytophthora cactorum in New York apple orchard soil. Phytopathology 86(10), 1133-1139.
Jung T, Blaschke H, Neumann P 1996. Isolation, identification and pathogenicity of Phytophthora species from declining oak stands. European Journal of Forest Pathology 26: 253–272.
Jung T, Blaschke H, Osswald W 2000. Involvement of Phytophthora species in Central European oak decline and the effect of site factors on the disease. Plant Pathology 49: 706–718.
Jung T, Hansen EM, Winton L, Osswald W, Delatour C 2002. Three new species of Phytophthora from European oak forests. Mycological Research 106: 397–411.
Kato S, Coe R, New L, Dick MW 1990. Sensitivities of various oomycetes to hymexazol and metalaxyl. Journal of General Microbiology 136: 2127–2134.
Klotz LJ, DeWoolfe TA 1958. Techniques for isolating Phytophthora spp. which attack citrus. Plant Disease Reporter 42: 675–676.
Kroken P, Nagy NE, Krekling T 2008. Traumatic resin ducts and polypheolic parenchyma cells in conifers. In: Schaller A ed. Induced plant resistance to herbivory. Springer. Pp. 147–169.
Langanheim JH 2003. Plant resins: chemistry, evolution, ecology, ethnobotany. Portland, OR, Timber Press.
Manion P 1991. Tree disease concepts, 2nd edn. NJ, Prentice Hall.
Martin FN, Tooley PW 2004. The use of mitochondrial DNA for clarifying phylogenetic relationships and isolate identification with the genus Phytophthora. Phytopathology 94: S66.
Masago H, Yoshikawa M, Fukada M, Nakanishi N 1977. Selective inhibition of Pythium spp. on medium for direct isolation of Phytophthora spp. from soils and plants. Phytopathology 67: 425–428.
McKenzie EHC, Buchanan PK, Johnston PR 2002. Checklist of fungi on kauri (Agathis australis) in New Zealand. New Zealand Journal of Botany 40: 269–296.
Meyer D 1975. Studies on the germination of oospores of Phytophthora cactorum. Zeitschrift für Planzenkrankheiten und Pflanzenschutz 82: 168–172.

Detection of Phytophthora taxon Agathis (PTA)
Page 52 Landcare Research
Newhook FJ 1959. The association of Phytophthora species with mortality of Pinus radiata and other conifers. I Symptoms and epidemiology in shelter belts. New Zealand Journal of Agricultural Research 2: 808–843.
Ogden J, Wardle GM, Ahmed M 1987. Population dynamics of the emergent conifer Agathis australis (D. Don) Lindl. (Kauri) in New Zealand II. Seedling population sizes and gap-phase regeneration. New Zealand Journal of Botany 25: 231–242.
Olsson CHB 1995. Diagnosis of Phytophthora infections in raspberry and strawberry plants by ELISA tests. Journal of Phytopathology 143: 307–310.
Penhallow DP 1907. A manual of the Northern American gymnosperms: exclusive of the Cycadales but together with certain exotic species. Boston, MA, Athenaeum Press.
Podger FD, Newhook FJ 1971. Phytophtohra cinnamomi in indigenous plant communities in New Zealand. NewcZealand ournal of Botany 9: 625–638.
Ponchet J, Richie P, Andreoli Augé G 1972.Selective methods of isolation for Phytophthora nicotianae f.sp. parasitica from the soil. Annals of Phytopathology 4: 97–108.
Ramsfield TD, Dick MA, Beever RE, Horner IJ, McAlonan MJ, Hill CF 2009. Phytophthora kernoviae in New Zealand. Proceedings of the 4th Meeting of the IUFRO Working Party S07.02.09. Pp. 47–53.
Reay SD, Hachet C, Nelson TL, Brownbridge M, Glare TR 2007. Persistence of conidia and potential efficacy of Beauveria bassiana against pinhole borers in New Zealand southern beech forests. Forest Ecology and Management 246: 232–239.
Ribeiro OK 1983. Physiology and asexual sporulation and spore germination In: Erwin DC, Bartnicki-Garcia S, Tsao PH eds Phytophthora: its biology, taxonomy, ecology and pathology. St Paul, MN, APS Press.
Rizzo DM, Fichtner EJ 2009. Phytophthora in forests and natural ecosystems of the Americas. Proceedings of the 4th Meeting of the IUFRO Working Party S07.02.09. Pp. 35–44.
Rizzo DM, Garbelotto M, Hansen EM 2005. Phytophthora ramorum: integrative research and management of an emerging pathogen in California and Oregon forests. Phytopathology 43: 309–335.
Schena L, Cooke DEL 2006. Assessing the potential of regions of the nuclear and mitchondrial genome to develop a ‘molecular tool box’ for the detection and characterization of Phytophthora species. Journal of Microbiological Techniques 67: 70–85.
Schena L Nigro F, Ippolito A, Gallitelli D 2004. Real-time quantitative PCR: a new technology to detect and study phytopathogenic and antagonistic fungi. European Journal of Plant Pathology 10: 893–908.
Silvester WB 2000. The biology of kauri (Agathis australis) in New Zealand. II. Nitrogen cycling of four kauri forest remnants. New Zealand Journal of Botany 38: 205–220.

Detection of Phytophthora taxon Agathis (PTA)
Landcare Research Page 53
Sinclair WA, Lyon HH 2005. Diseases of trees and shrubs. 2nd edn. Ithaca, NY, Comstock Publishing Associates, a division of Cornell University Press.
Solel Z, Pinkas Y 1984. A modified selective medium for detecting Phytophthora cinnamomi on Avocado roots. Phytopathology 84: 506–508.
Stack JP, Millar RL 1985. Isolation and characterisation of a metalaxyl-insensitive isolate of Phytophthora megasperma f.sp. medicaginis. Phytopathology 75: 1387–1392.
Stamps DJ, Waterhouse GM, Newhook FJ, Hall GS 1990. Revised tabular key to the species of Phytophthora. CAB International and International Mycological Institute, Mycological Papers 162. 28 p.
Thomas BR 1969. Kauri resin - modern and fossil. In: Eglinton G, Murphy MTJ eds Organic geochemistry. Berlin, Heidelberg, New York, Springer-Verlag. Pp. 599–618.
Tsao PH, Guy SO 1977. Inhibition of Mortierella and Pythium in a Phytophthora islation medium containing hymexazol. Phytopathology 67: 796–801.
Van der Scheer HAT 1971. Isolation of Phytophthora cactorum from soil in orchards and strawberry fields and difference to pathogenicity to apple. Netherlands Plant Pathology 77: 65–72.
Wilcox WF 1992. Phytophthora root and crown roots. Disease Identification Sheet No. 7. Cornell, NY, Cornell Cooperative Extension.
Williams RE, Shaw CG III, Wargo PM, Sites WH 1989. Armillaria root disease. Forest Insect and Diseases Leaflet 78, USDA Forest Service.
Zentmyer GA 1980. Phytophthora cinnamomi and the diseases it causes. Monograph No. 10, St Paul, MN, APS Press.


Page 55
Appendix 1 – Soil SOP validation results
Colour coding of soil samples; Yellow for LCR Green for Scion and Blue for Plant & Food
Sample Number Code GPS Mass (g) Landcare Research results from March, 2009
Landcare Research (n = 35)
Landcare Research recoveries
Scion Recoveries
(n = 12)
Plant & Food Recoveries
(n = 12)
1 AJB 001 Robert Haste Scenic Reserve Mangawhai (May 2009) 2651734; 6570495
437 Not tested PTA
2 AJB002 Robert Haste Scenic Reserve Mangawhai (May 2009) 2651734; 6570495
498 Not tested Pythium
3 AJB 003 Russell Forest Bowl Stand (May 2009) 2624221; 6654817
372 Not tested 180.0 g nil
4 AJB 004 Russell Grove Track (May 2009) 2622986; 6654762
241 Not tested 180.0 g nil
5 Te Ngahere Track Waipoua Forest (Dec. 2008)
785 Not tested P. cinnamomi
6 Tane Mahuta Track Waipoua Forest (Dec. 2008)
945 Not tested 185.0 g Pythium
7 Raetea Plantation, Victoria Valley
2550335; 6669968
1036 Not tested 185.0 g PTA; Pythium PTA; Pythium
8 Hunua Gorge (2009) 1777721; 5894814 237 Not tested 185.0 g P. cinnamomi
9 Hunua Gorge (2008) 1777721; 5894814 373 Not tested 185.0 g nil
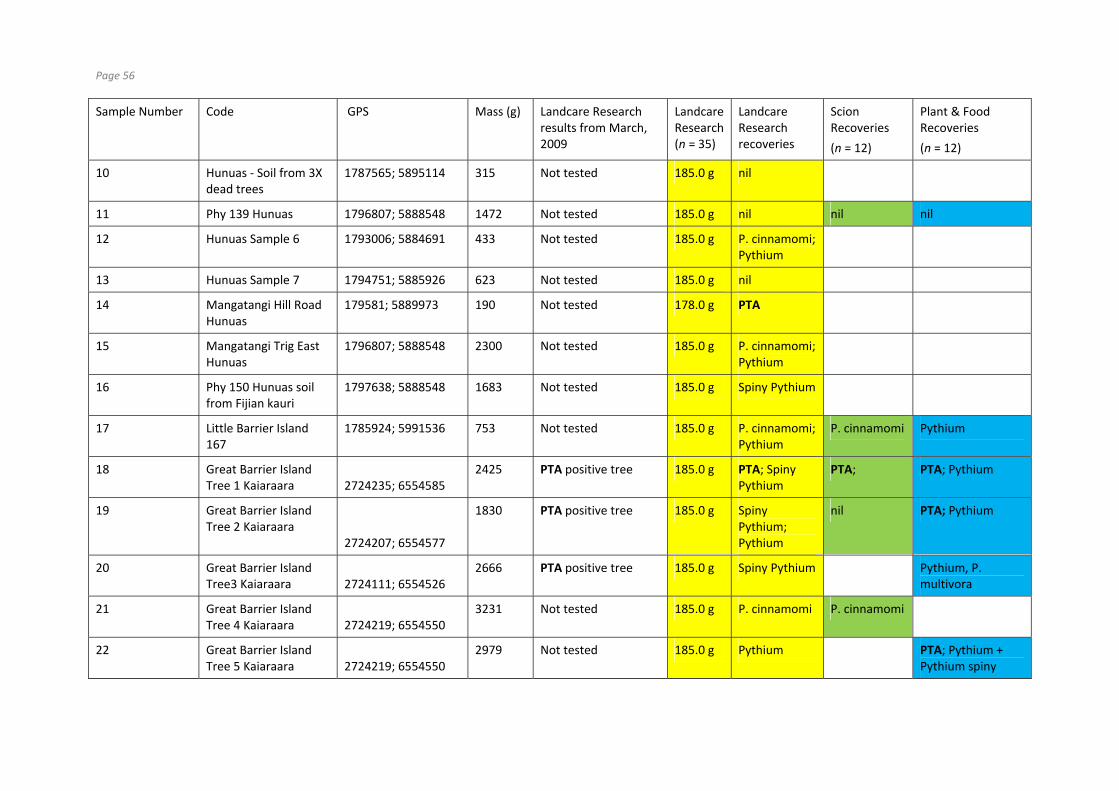
Page 56
Sample Number Code GPS Mass (g) Landcare Research results from March, 2009
Landcare Research (n = 35)
Landcare Research recoveries
Scion Recoveries
(n = 12)
Plant & Food Recoveries
(n = 12)
10 Hunuas ‐ Soil from 3X dead trees
1787565; 5895114 315 Not tested 185.0 g nil
11 Phy 139 Hunuas 1796807; 5888548 1472 Not tested 185.0 g nil nil nil
12 Hunuas Sample 6 1793006; 5884691 433 Not tested 185.0 g P. cinnamomi; Pythium
13 Hunuas Sample 7 1794751; 5885926 623 Not tested 185.0 g nil
14 Mangatangi Hill Road Hunuas
179581; 5889973 190 Not tested 178.0 g PTA
15 Mangatangi Trig East Hunuas
1796807; 5888548 2300 Not tested 185.0 g P. cinnamomi; Pythium
16 Phy 150 Hunuas soil from Fijian kauri
1797638; 5888548 1683 Not tested 185.0 g Spiny Pythium
17 Little Barrier Island 167
1785924; 5991536 753 Not tested 185.0 g P. cinnamomi; Pythium
P. cinnamomi Pythium
18 Great Barrier Island Tree 1 Kaiaraara 2724235; 6554585
2425 PTA positive tree 185.0 g PTA; Spiny Pythium
PTA; PTA; Pythium
19 Great Barrier Island Tree 2 Kaiaraara
2724207; 6554577
1830 PTA positive tree 185.0 g Spiny Pythium; Pythium
nil PTA; Pythium
20 Great Barrier Island Tree3 Kaiaraara 2724111; 6554526
2666 PTA positive tree 185.0 g Spiny Pythium Pythium, P. multivora
21 Great Barrier Island Tree 4 Kaiaraara 2724219; 6554550
3231 Not tested 185.0 g P. cinnamomi P. cinnamomi
22 Great Barrier Island Tree 5 Kaiaraara 2724219; 6554550
2979 Not tested 185.0 g Pythium PTA; Pythium + Pythium spiny

Page 57
Sample Number Code GPS Mass (g) Landcare Research results from March, 2009
Landcare Research (n = 35)
Landcare Research recoveries
Scion Recoveries
(n = 12)
Plant & Food Recoveries
(n = 12)
23 Phy 130 Raetea Tree 1* Raetea Plantation
1753 PTA from soil
24 Phy 130 Raetea Tree 2* Raetea Plantation
3218 PTA positive tree 185.0 g PTA
25 Phy 130 Raetea Tree 3* Raetea Plantation
1250 PTA positive tree; P. cinnamomi from soil
185.0 g PTA; P. cinnamomi; Pythium
26 Phy 130‐1 Raetea* Raetea Plantation
952 Not tested 185.0 g P. cinnamomi
27 Phy 130‐2 Raetea* Raetea Plantation
776 Not tested PTA
28 Phy 130‐3 Raetea* Raetea Plantation
766 Not tested Pythium
29 Phy 130 Raetea drainage line* Raetea Plantation
740 Not tested 185.0 g P. cinnamomi; Pythium
30 Phy 130 Raetea diseased sapling* Raetea Plantation
Raetea Infection Zone: 2550335; 6669968
404 Not tested 185.0 g P. cinnamomi; Pythium
31 Phy 131 Trounson Tree 1‐1*
2569362; 6608693 790 PTA positive tree 185.0 g PTA
32 Phy 131 Tree 1‐2* Trounson
2569362; 6608693 570 PTA positive tree 185.0 g PTA
33 Phy 131 Tree 1‐3 between dead and ‘infected' tree*
2569362; 6608693 939 Not tested 185.0 g PTA spiny Pythium, P. cinnamomi
PTA; Pythium

Page 58
Sample Number Code GPS Mass (g) Landcare Research results from March, 2009
Landcare Research (n = 35)
Landcare Research recoveries
Scion Recoveries
(n = 12)
Plant & Food Recoveries
(n = 12)
Trounson
34 Phy 131 Tree 1‐4 dead root zone* Trounson
2569362; 6608693 185 Not tested 176.0 g PTA
35 Phy 131 Tree 2 – soil* Trounson
2569509; 6608621 2158 PTA n/t
36 Phy 131 Tree 2 – root* Trounson
2569509; 6608621 238 PTA n/t
37 Phy 131 Tree 3* Trounson
2569278; 6608721 1390 PTA 185.0 g P. cinnamomi; Pythium
38 Phy 131 Old track line AG* Trounson
2569381; 6608702 928 Not tested 185.0 g PTA
39 Phy 132 Tane Mahuta Track soil 1* Waipoua Forest
2558436; 6622189 378 P. cinnamomi in soil Pythium + P. multivora
40 Phy 132 Tane Mahuta area double ricker tree* (within 500 m of Tane Mahuta) Waipoua Forest
2558328; 6622247 821 PTA positive tree 185.0 g P. cinnamomi; Pythium
P. cinnamomi
41 Phy 132 Tane Mahuta area gum flow tree*
(within 400 m of Tane Mahuta) Waipoua Forest
2558314; 6622240 773 Not tested 185.0 g PTA; Spiny Pythium; Pythium; P. cinnamomi
spiny Pythium, P. cinnamomi
42 Phy 132 Tane Mahuta 2558314; 6622240 251 P. cinnamomi in soil 185.0 g P. cinnamomi;

Page 59
Sample Number Code GPS Mass (g) Landcare Research results from March, 2009
Landcare Research (n = 35)
Landcare Research recoveries
Scion Recoveries
(n = 12)
Plant & Food Recoveries
(n = 12)
area logging track* Waipoua Forest
Pythium
43 Phy 133 Yakas Track Tree 1* Waipoua Forest
2557505; 6621024 694 No recoveries nil
44 Phy 133 Drainage area opposite entry to 4‐sisters* Waipoua Forest
2557507; 6621245 920 No recoveries 185.0 g P. cinnamomi; Pythium
nil
45 Phy 134 Waipoua Forest*
2560501; 6619026 1955 P. cinnamomi in soil
46 Phy 135 Waipoua Forest*
2561172; 6617082 570 PTA positive tree 185.0 g nil
47 Phy 136 Waipoua Forest*
2561911; 6616786 2044 P. cinnamomi in soil
* Sampled under DOC High Impact Research and Collection Permit number # NO‐27331‐Res


Detection of Phytophthora taxon Agathis (PTA)
Landcare Research Page 61
Appendix 2 – Media recipes
Potato Dextrose Agar (PDA)
Difco™ PDA 39 g
RO water 1 L
Autoclave at 121ºC for 15 min at 15 p.s.i. (15 ml per 8.5-cm plate)
V8 juice agar
V8 Juice 200 ml
CaCO3 3.0 g
RO water 800 ml
Agar 15.0 g
Autoclave at 121ºC for 15 min at 15 p.s.i. (15 ml per 8.5-cm plate)
Clarified V8 juice broth
Clarified V8 juice 100 ml (Campbell’s®)
CaCO3 2% (in 100 ml)
RO water 800 ml
Clarify V8 juice by centrifugation at 4000 rpm for 15 min. Vacuum-filter three times through one layer of Whatman No. 1 filter paper and twice through two layers. Autoclave at 121ºC for 15 min at 15 p.s.i. (15 ml / plate).
Sterile soil extract
Garden soil 200 g garden soil
RO water 1 L
Stir vigorously for 2 min, then stir vigorously again 30 min later and allow to stand overnight.
Filter through paper hand towel, bottle and autoclave at 121º C for 15 min at 15 p.s.i. Store in refrigerator.

Detection of Phytophthora taxon Agathis (PTA)
Page 62 Landcare Research
P5ARPH-CMA selective medium for Phytophthora spp.
Difco corn meal agar 17 g
RO water 1 L
Pimaricin 5 mg/L
Sodium Ampicillin 250 mg/L
Rifamycin-SV (sodium salt) 10 mg/L
PCNB (75%) 66.7 mg/L
Hymexazol 50 mg/L
Autoclave at 121ºC for 15 min at 15 p.s.i. (15 ml per plate).

Detection of Phytophthora taxon Agathis (PTA)
Landcare Research Page 63
Appendix 3 – Soil detection raw data
3A Recovery of PTA from different bait types by three institutions
Mean infection %
Species Scion Plant & Food Research Landcare Research
Abelia 100
Silver beech 88
Tōtara 80 92
Himalayan cedar 76 100 88
Blechnum 51
Lupin 46 88 100
Rhododendron Cunn.
white
45 100 23
Kauri 14 44
Pine 13 96 25
Vireya 11 2
Karamu 100 4
Pohutukawa 96 24
Camellia 76
Apple 52
Bay tree 56
Koromiko 3
Number of infections:
Scion No. leaf pieces 48 h 96 h 108 h
Cedar Rep. A 5 0 2 2 Rep. B 5 0 5 9 Rep. C 5 2 4 6 Rep. D 5 0 3 4 Rep. E 5 ‐ ‐ 3
2 14 24
Rhododendron A 79 2 7 6 (lge) B 65 0 14 >19
C 68 0 11 >14 D 68 1 8 13 E 48 1 14 >19
4 54 >71
Rhododendron A 55 0 3 5 (hair) B 56 0 2 5
C 47 0 2 4 D Not done ‐ ‐ ‐ E 74 0 1 4
0 8 18

Detection of Phytophthora taxon Agathis (PTA)
Page 64 Landcare Research
Pine A 30 0 0 0 B 30 0 4 4 C 30 0 2 5 D 30 0 3 4 E 30 0 1 3
10 16
Kauri A 54 0 2 3 B 65 0 3 >10 C 39 0 2 6 D 52 1 1 7 E 50 0 3 6
1 11 >32
Abelia A 10 0 10 2 B 10 0 17 >25 C 10 5 >16 >23 D 10 0 13 16 E 10 0 12 16
5 >68 >82
Blechnum A 51 0 11 19 B 78 0 14 >17 C 56 0 11 >20 D 51 1 29 >24 E 60 0 20 >20
1 85 >100
Silver beech A 5 0 3 5 B 5 0 3 4 C 5 2 4 3 D 5 3 4 4 E 5 1 4 5
6 18 21
Tōtara A 5 0 0 2 B 5 0 1 3 C 5 1 3 3 D 5 0 4 5 E 5 0 3 3
1 11 16

Detection of Phytophthora taxon Agathis (PTA)
Landcare Research Page 65
Landcare Research Replicate Base +ve (n = 10)
Tip +ve (n = 10)
Cedar 1 1 4 2 2 2 3 2 2 4 4 1 5 2 2
11/50 11/50
Lupin 1 2 4 2 5 2 3 7 2 4 7 1 5 6 2
27/50 13/50
Kauri 1 0 0 2 0 0 3 0 0 4 0 0 5 1 0
1/50 0/50
Abelia1 1 0 0 2 0 0 3 0 0 4 0 0 5 0 0
0/50 0/50 1 Abelia produced nil results for base, mid, tip and lamina samples


Page 67
3B PTA: Bait comparison (plated 18 Nov. 2009; replated to PARPH 20 Nov., 96 h 24 Nov.)
Bait Replicate No. pieces No. colonies 72 h No. colonies 96 h Total colonies No. of PTA colonies % PTA recoveries Mean % recoveries SD SEM
Cedar 1 10 3 4 7 3 30 34 6.4 2.8
2 10 1 1 2 5 50
3 10 4 4 8 3 30
4 10 4 4 8 3 30
5 10 4 5 9 3 30
Lupin 1 5 0 1 1 0 0 24 20.8 9.3
2 5 2 2 4 1 20
3 5 0 0 0 0 0
4 5 1 3 4 2 40
5 5 3 1 4 1 60
Abelia 1 5 0 3 3 1 20 20 16 7.17
2 5 0 5 5 0 0
3 5 0 5 5 0 0
4 5 0 6 6 2 40
5 5 0 5 5 2 40
Totara 1 10 4 4 8 3 30 30 16 7.17
2 10 4 7 11 6 60
3 10 6 6 12 4 40
4 10 2 2 4 2 20
5 10 0 0 0 0 0


Detection of Phytophthora taxon Agathis (PTA)
Landcare Research Page 69
3C Monthly PTA recovery from soils collected at Huia
Month Mean % lupin Mean % cedar
Apr‐09 52 34
Jun‐09 16 24
Jul‐09 10 24
Aug‐09 34 28
Sep‐09 22 8
Oct‐09 28 18
Dec‐09 6 2
Jan‐10 6 4
3D PTA recovery from soil after 6 weeks at 3°C
Sample1 Rep PTA % P. cinnamomi % Pythium % lupin PTA % cedar PTA
9‐Dec‐09 1 0 20 lupin 0 0 0
2 0 20 cedar 0 0 0
3 0 20 lupin 0 0 0
4 0 20 cedar 0 0 0
5 0 0 0 0 0
10‐Jan‐10 1 0 20 lupin 0 0 0
2 0 40 cedar 20 cedar 0 0
3 0 20 lupin 0 0 0
4 0 0 0 0 0
5 0 40 cedar 20 cedar 0 0
1Soil mass = 200 g.


Page 71
3E Comparative PTA recoveries from different soil-sample sizes (includes 10-g soil samples assayed with chilled (10°C) RO water
Vol (ml)
Data 0.5 1 2 5 10 20 50 10 chilled Total
Average of baits+ve 0.4 0.3 0.4 0.9 1 4.2 3 0.5 1.03
Count of baits+ve 10 10 10 10 8 5 5 8 66
Average of sample ±2 0.3 0.3 0.3 0.6 0.5 1 0.8 0.5 0.48
Count of sample 2 10 10 10 10 8 5 5 8 66
0.5 g 1 g 2 g 5 g 10 g 20 g 50 g 10 g chill
#of replicate samples 10 10 10 10 8 5 5 8
Propn samples +ve 0.3 0.3 0.3 0.6 0.5 1 0.8 0.5
Baits +ve (out of 5) 0.4 0.3 0.4 0.9 1 4.2 3 0.5
Propn baits +ve 0.08 0.06 0.08 0.18 0.2 0.84 0.6 0.1

Page 72
3F Soil mass versus % PTA recoveries Cup size % PTA Prop. Arcsine Two decimal places
a 20 0.2 0.201358 0.2
a 0 0 0 0
a 20 0.2 0.201358 0
a 40 0.4 0.411517 0.41
a 60 0.6 0.643501 0.64
a 20 0.2 0.201358 0.2 Groups n = 32 Mean SE Pooled SE SD
a 20 0.2 0.201358 0.2 a 8 0.286 0.0898 0.0872 0.254
a 60 0.6 0.643501 0.64 b 8 0.309 0.0696 0.0872 0.197
b 0 0 0 0 c 8 0.181 0.084 0.0872 0.235
b 20 0.2 0.201358 0.2 d 8 0.185 0.01022 0.0872 0.289
b 40 0.4 0.411517 0.41
b 20 0.2 0.201358 0.2 Source of variation Sum of sq. d.f. Mean sq. F‐stat P
b 20 0.2 0.201358 0.2 Groups 0.107 3.000 0.036 0.58 0.6299
b 40 0.4 0.411517 0.41 Residual 1.703 28.000 0.061
b 60 0.6 0.643501 0.64 Total 1.81 31.000
b 40 0.4 0.411517 0.41
c 0 0 0 0 LSD contrast Difference
c 60 0.6 0.643501 0.64 a v. b −0.023
c 20 0.2 0.201358 0.2 a v. c 0.105
c 40 0.4 0.411517 0.41 a v. d 0.101
c 20 0.2 0.201358 0.2 b v. c 0.128
c 0 0 0 0 b v. d 0.124
c 0 0 0 0 c v. d −0.004
c 0 0 0 0
d 60 0.6 0.643501 0.64
d 20 0.2 0.201358 0.2
d 80 0.8 0 0
d 0 0 0 0
d 0 0 0 0
d 60 0.6 0.643501 0.64
d 0 0 0 0

Page 73
d 0 0 0 0

Detection of Phytophthora taxon Agathis (PTA)
Page 74 Landcare Research
3G Validation of the cardinal-point soil sampling approach
Sample Soil mass
Plate number
PTA
% P. cinnamomi % Pythium spp. % Lupin PTA
% Cedar PTA
L10 ‐1 71 33 0 0 40 cedar 0 0
L10 ‐1 71 34 0 0 0 0 0
L10‐2 70 39 0 100 lupine 67 0 0
L10‐2 70 40 PTA
80 lupine; 20 cedar
20 cedar 20 0
L10‐3 67 29 0 0 60 cedar 0 0
L10‐3 67 30 PTA
0 0 60 0
L10‐4 79 27 0 0 0 0 0
L10‐4 79 28 0 0 0 0 0
L10‐5 45 31 PTA
0 0 20 0
L10‐5 45 32 0 0 60 cedar 0 0
L10‐6 70 37 PTA
0 0 40 0
L10‐6 70 38 0 0 0 0 0
L10‐7 45 25 0 0 100 cedar 0 0
L10‐7 45 26 PTA
0 0 20 0
L10‐8 86 35 0 0 50 lupine; 100 cedar
0 0
L10‐8 86 36 0 0 0 0 0
Huia 1 117 5 0 0 0 0 0
Huia 1 117 6 0 0 0 0 0
Huia 2 112 7 20 cedar 80 cedar 0 0
Huia 2 112 8 PTA
0 0 100 0
Huia 3 128 11 0 0 0 0 0
Huia 3 128 12 PTA
0 0 60 0
Huia 4 106 9 0 0 0 0 0
Huia 4 106 10 0 0 0 0 0
Huia 5 106 15 PTA
0 60 cedar 20 20
Huia 5 106 16 PTA
0 0 100 0
Huia 6 127 1 0 0 100 cedar 0 0
Huia 6 127 2 PTA
0 0 100 0
Huia 7 142 3 0 0 80 cedar 0 0
Huia 7 142 4 0 60 lupine 0 0 0
Huia 8 135 13 PTA
0 0 20 0
Huia 8 135 14 0 0 0 0 0

Detection of Phytophthora taxon Agathis (PTA)
Landcare Research Page 75

Page 76
Appendix 4 – Tissue detection: supplementary tree symptom images
(Photographs taken by Dr Ross E. Beever and Dr Nick W. Waipara, ARC)
Stand symptom Crown symptom Lesion
Phy 88
Pakiri Reserve (northern Auckland Region)

Page 77
Stand symptom Crown symptom Lesion
Phy 89
Waitakere / Cascade Ranges

Page 78
Stand symptom Crown symptom Lesion

Page 79
Stand symptom Crown symptom Lesion
Phy 93
Great Barrier Island; Kaiaraara

Page 80
Stand symptom Crown symptom Lesion
Hunuas Mangatangi Hill Road


![Binder 216, Terminology [Trematoda Taxon Notebooks]](https://static.fdokumen.com/doc/165x107/63338ab23108fad7760f19c8/binder-216-terminology-trematoda-taxon-notebooks.jpg)