Century-scale Methylome Stability in a Recently Diverged Arabidopsis thaliana Lineage
Upload
independentCategory
view
1download
0
This Provisional PDF corresponds to the article as it appeared upon acceptance. Fully formattedPDF and full text (HTML) versions will be made available soon.
Transcriptome dynamics of Arabidopsis thaliana root penetration by theoomycete pathogen Phytophthora parasitica
BMC Genomics 2014, 15:538 doi:10.1186/1471-2164-15-538
Agnès Attard ([email protected])Edouard Evangelisti ([email protected])
Naïma Kebdani-Minet ([email protected])Franck Panabières ([email protected])
Emeline Deleury ([email protected])Cindy Maggio ([email protected])
Michel Ponchet ([email protected])Mathieu Gourgues ([email protected])
ISSN 1471-2164
Article type Research article
Submission date 4 October 2013
Acceptance date 3 June 2014
Publication date 29 June 2014
Article URL http://www.biomedcentral.com/1471-2164/15/538
Like all articles in BMC journals, this peer-reviewed article can be downloaded, printed anddistributed freely for any purposes (see copyright notice below).
Articles in BMC journals are listed in PubMed and archived at PubMed Central.
For information about publishing your research in BMC journals or any BioMed Central journal, go to
http://www.biomedcentral.com/info/authors/
BMC Genomics
© 2014 Attard et al.This is an Open Access article distributed under the terms of the Creative Commons Attribution License (http://creativecommons.org/licenses/by/2.0), which
permits unrestricted use, distribution, and reproduction in any medium, provided the original work is properly credited. The Creative Commons Public DomainDedication waiver (http://creativecommons.org/publicdomain/zero/1.0/) applies to the data made available in this article, unless otherwise stated.

Transcriptome dynamics of Arabidopsis thaliana root penetration by the oomycete pathogen Phytophthora parasitica
Agnès Attard1 Email: [email protected]
Edouard Evangelisti2 Email: [email protected]
Naïma Kebdani-Minet1 Email: [email protected]
Franck Panabières1 Email: [email protected]
Emeline Deleury1 Email: [email protected]
Cindy Maggio1 Email: [email protected]
Michel Ponchet1 Email: [email protected]
Mathieu Gourgues1* * Corresponding author Email: [email protected]
1 Université de Nice Sophia-Antipolis, UMR Institut Sophia Agrobiotech, INRA1355-CNRS7254-UNSA, 400 route des chappes, F-06903 Sophia Antipolis, France
2 Sainsbury Laboratory (SLCU), University of Cambridge, Bateman Street, Cambridge CB2 1LR, UK

Abstract
Background
Oomycetes are a group of filamentous microorganisms that includes both animal and plant pathogens and causes major agricultural losses. Phytophthora species can infect most crops and plants from natural ecosystems. Despite their tremendous economic and ecologic importance, few effective methods exist for limiting the damage caused by these species. New solutions are required, and their development will require improvements in our understanding of the molecular events governing infection by these pathogens. In this study, we characterized the genetic program activated during penetration of the plant by the soil-borne pathogen Phytophthora parasitica.
Results
Using all the P. parasitica sequences available in public databases, we generated a custom oligo-array and performed a transcriptomic analysis of the early events of Arabidopsis thaliana infection. We characterized biological stages, ranging from the appressorium-mediated penetration of the pathogen into the roots to the occurrence of first dead cells in the plant. We identified a series of sequences that were transiently modulated during host penetration. Surprisingly, we observed an overall down regulation of genes encoding proteins involved in lipid and sugar metabolism, and an upregulation of functions controlling the transport of amino acids. We also showed that different groups of genes were expressed by P. parasitica during host penetration and the subsequent necrotrophic phase. Differential expression patterns were particularly marked for cell wall-degrading enzymes and other proteins involved in pathogenicity, including RXLR effectors. By transforming P. parasitica with a transcriptional fusion with GFP, we showed that an RXLR-ecoding gene was expressed in the appressorium and infectious hyphae during infection of the first plant cell.
Conclusion
We have characterized the genetic program activated during the initial invasion of plant cells by P. parasitica. We showed that a specific set of proteins, including effectors, was mobilized for penetration and to facilitate infection. Our detection of the expression of an RXLR encoding gene by the appressorium and infection hyphae highlights a role of this structure in the manipulation of the host cells.
Keywords
Phytophthora, Arabidopsis thaliana, Appressorium, Transcriptome, Root infection
Background
Plant pathogenic oomycetes are have a particular physiology and are known for their devastating effects on agricultural crops and natural ecosystems. A small number of oomycetes, including downy mildews and Phytophthora and Pythium species, which are pathogenic on virtually all dicots and on some cereals [1], have a major impact on agriculture worldwide. Oomycete control strategies are currently very limited, because very few

chemicals are effective against these microorganisms. Indeed, most of the molecules used to reduce the incidence of plant diseases caused by filamentous pathogens target fungal functions that are absent or dispensable in oomycetes, such as melanin, sterol or chitin biosynthesis. These organisms are phylogenetically related to brown algae and diatoms within the Stramenopiles and they have unusual biological, genetic and physiological features [2,3]. The selection of resistant plant genotypes remains an efficient anti-oomycete strategy, but this approach is costly and time-consuming and is, thus, restricted to crops with a high added value. The development of new methods to combat oomycetes thus requires improvements in our knowledge of the physiology and infection strategies of these pathogens. In particular, early events in infection, including the mechanisms underlying penetration and the modulation of plant responses to ensure successful infection are poorly documented. The modification of these processes through the development of new chemicals or plant engineering would reduce the incidence of diseases caused by oomycetes.
Characterizations of plant penetration by oomycetes at the cellular level have focused mostly on Phytophthora spp. Entry into the host is mediated principally by a specialized cellular structure called the appressorium [4-8]. Poor nutrient content, surface hydrophobicity and topography have been shown to induce appressorium differentiation in Phytophthora infestans [9]. This process also requires calcium [10]. Little is known about the molecular events governing the differentiation and functioning of appressoria. Gene inactivation strategies have clearly demonstrated a requirement for four proteins for the penetration process. The RNAi-mediated silencing of a family of four cellulose synthase genes from P. infestans revealed that cell wall organization is important for appressorium differentiation and plant infection [11]. The PiHMP1 gene encodes a membrane protein that accumulates in appressoria and haustoria and is required for early infection [12]. The PiBZP1 transcription factor from P. infestans is required for appressorium differentiation [13]. Finally, the silencing of the P. sojae mitogen-activated protein kinase PsSAK1 greatly decreases appressorium differentiation, providing a first clue to the signaling pathways involved in the control of this process [14].
Beyond candidate gene silencing strategies, a few medium- to large-scale analyses have been performed to decipher the molecular mechanisms governing appressorium differentiation in Phytophthora spp. Kramer and coworkers first detected, by 2D-SDS-gel electrophoresis, stage-specific peptides in P. infestans appressorium-like structures differentiated on artificial surfaces [15]. A comparative analysis then showed an accumulation of transcripts and proteins involved in amino-acid synthesis during the formation of appressorium-like structures in vitro [16]. These findings were confirmed by a second analysis of protein extracts from appressorium-like structures [17]. This study highlighted the accumulation of proteins involved in protein synthesis and energy metabolism, together with putative pathogenicity factors, such as the Crinkling and Necrosis protein CRN2 and proteins involved in protection against reactive oxygen species. Grenville-Briggs and coworkers recently made use of a coupled liquid chromatography/ MS-MS system to identify membrane and cell wall-associated proteins [18]. These proteins included a transglutaminase, a glycosyl hydrolase and a group of three previously unknown but related proteins containing two repeats that accumulated in P. infestans appressoria. Numerous proteins previously characterized as PAMPs (pathogen-associated molecular patterns), such as CBEL-like proteins or elicitins, and crinkler-like proteins accumulated in the cell walls of germinating cysts, suggesting that all these proteins accumulate before infection. Recent transcriptome studies, based on full genome data for P. infestans, P. sojae and P. capsici, have highlighted the upregulation of transcripts encoding proteins involved in gene expression and translation,

primary metabolism, protein kinases, cell wall-degrading enzymes (CWDE) and various proteins used to manipulate plant cells (effectors) during in vitro appressorium differentiation [19-21]. Similar observations have been obtained with an expressed sequence tag (EST) approach applied to the broad-host range pathogen P. parasitica. An investigation of the genes expressed during appressorium formation identified sequences encoding numerous cell wall-degrading enzymes and pathogenicity-related proteins [8].
Taken together, these analyses provide interesting clues to the developmental program occurring during appressorium differentiation. However, all the studies investigating early events in plant-oomycete interactions have made use of artificial surfaces to induce appressorium differentiation or were performed on aerial parts of plants [16,18-20]. Artificial hydrophobic surfaces cannot be pierced and only the events from zoospore encystment to the differentiation of appressorium-like structures can be analyzed. It is not possible to characterize the steps from appressorium maturation to early plant penetration with such systems. Furthermore, most pathogenic oomycetes infect plant roots and the molecular events described on aerial tissues may not reflect those governing root infection. Information is therefore required concerning the molecular events occurring during the appressorium-mediated penetration of the host root system by oomycetes.
We addressed this question, by analyzing early events in P. parasitica infection by a transcriptome analysis. This species infects the roots of a wide range of plants and is emerging as a model species [22]. We made use of the P. parasitica/Arabidopsis thaliana pathosystem to analyze the events occurring during the first few hours after the inoculation of roots with motile zoospores [23]. We hybridized a custom oligoarray containing almost one quarter of the P. parasitica genome with samples recovered from a time-course of infection ranging from penetration to the switch to necrotrophy. We identified a subset of sequences that specifically accumulated or were repressed during appressorium-mediated penetration of the host. We then investigated the functions of the proteins encoded by these sequences.
Methods
P. parasitica and plant culture conditions
Phytophthora parasitica INRA-310 strain, selected as the reference for the P. parasitica genome sequencing project was mainly used for this study. Cultures were performed on V8 Medium and zoospore production was induced as previously described [24]. A P. parasitica race 0 strain was kindly provided by Elodie Gaulin (Toulouse III University) and was used for transformation experiments.
Arabidopsis thaliana plantlets were grown, inoculated and observed as previously described [23]. A. thaliana Col-O ecotype was used. An A. thaliana transgenic line expressing the mCherry plasma membrane marker PM-RB was kindly supplied by Professor Torii from Washington University and was used for the cytological analysis of the expression profile of a P. parasitica appressorium specific gene [25].
Appressorium differentiation was induced on onion epidermis as previously described [8].

Sample preparation and RNA extractions
For hybridization and subsequent validations of expression patterns by RT-qPCR, a series of two biological replicates each corresponding to RNA extractions of the following biological conditions were used: 1-Vegetative mycelium (recovered from two samples of 4 day-old cultures in liquid V8 medium at 24°C), 2- Motile zoospores (recovered from 8 independent cultures), 3-Appressoria differentiated on onion epidermis (epidermis from 20 onion bulbs inoculated with zoospores collected from 8 independent Petri dishes); appressoria collected 3 hours after inoculation (24°C), 4- Infection of A. thaliana roots by P. parasitica zoospores (samples recovered at 2.5, 6, 10.5, 30 and 96 hours post inoculation; 5 inoculated plants for each sample) as already reported [23].
As a rule, independent samples were used for Array hybridizations and RT-qPCR analyzes with an exception for purified appressoria RNA that are hardly obtained. RNA extraction from inoculated plant tissues was performed as described by [26]. P. parasitica RNA was extracted using Trizol reagent (Invitrogen, France).
P. parasitica oligoarray design and hybridizations
An unisequence set was obtained by clustering all P. parasitica EST sequences available in dbEST (Additional file 1: Figure S1). They originated from vegetative mycelium [27], zoospores and germinating cysts [28,29], appressoria [8] and P. parasitica-infected tomato plantlets, displaying symptoms of the necrotic step of the invasion [30]. Clustering was performed using TGICL package (http://compbio.dfci.harvard.edu/tgi/software/) and default parameters (Additional file 1: Figure S1). Unisequence composition is detailed in the supporting information (Additional file 2: Table S1). Ascribing sequences to plant or Phytophthora was initially done as already described [8]. This was supported by a subsequent BLASTN search against the recently released P. parasitica genome V2.0 (www.broadinstitute.org). Functional annotation was performed using blastx against the NCBI non redundant protein database (E value < 1E-05), searches against the Interpro database [31] and using Blast2GO annotation tool [32]. The P. parasitica oligoarray manufactured by NimbleGen systems (NimbleGen Systems, Reykjavik, Iceland) contained 11 independent 60-mer probes per unisequence with 4 technical replicates (Additional file 1: Figure S1). This array is fully described in the platform GPL17781 stored in the Gene Expression Omnibus (GEO) at NCBI (http://www.ncbi.nlm.nih.gov/geo).
CDNA synthesis, sample labeling, hybridization procedures, data acquisition and normalization were performed at the NimbleGen facilities (NimbleGen Systems, Reykjavik, Iceland). The complete expression dataset is available as series accession number GSE51252 in the GEO at NCBI. Average expression levels were calculated for each gene from the independent probes on array and were used for further analysis. Genes were considered as not expressed in a sample (background level) if the normalized value was less that the 95th percentile of random probes found on the array. Data were subjected to the Anaïs statistical framework to identify differentially expressed sequences (Pvalue <0.05) [33]. Data were mean-centered and log-2 transformed using Epclust (http://www.bioinf.ebc.ee/EP/EP/EPCLUST/). Hierarchical clustering (Pierson correlations, average linkage) and K-mean clustering (default parameters) were performed using Genesis program [34].
Real time RT-PCR analyses
Total RNA was treated with DNAse I (Ambion, Austin, USA) and reverse transcribed (1 µg) to cDNA using I-Script cDNA synthesis (Biorad, Hercules, USA). Real Time PCR experiments were performed using 5 µl of 1:50 dilution of first strand cDNA and SYBRGreen (Eurogentec SA, Seraing, Belgium) using the Opticon 3 (Biorad, Hercules, USA). All assays were carried out in triplicates. Gene-specific oligonucleotides were designed using primer3 (http://frodo.wi.mit.edu) and their specificity was validated by the analysis of dissociation curves using genomic DNA as a template. The genes encoding ubiquitin conjugating enzyme (Ubc, CK859493), the 40S ribosomal protein S3A (WS21, CF891675), and the P. parasitica homolog (PpGAM26e01: BlastN, 91% identity) of the P. infestans Mago-Nashi protein (Pi000681) described to be stably expressed were selected as constitutive internal controls [19,35]. Quantification of gene expression was performed using delta CT method [36].
GO enrichment analysis
Full Gene Ontology files were downloaded at http://www.geneontology.org/GO.downloads.ontology.shtml. After reconstitution of GO pathways, occurrences of each GO term and their parent terms were numbered for each cluster and for the P. parasitica array dataset. Proportion of GO terms in each cluster was then compared to the proportion observed on the P. parasitica array. Terms with significant enrichment were identified using Fisher Exacts test with a p-value cut off at 0.05. To facilitate the analysis, only GO parent terms with level higher than 4 were considered.
P. parasitica transformation
A Gateway vector was obtained to accelerate gene expression analyses in Phytophthora spp. using transcriptional and translational fusions. The reporter system, corresponding to a fusion between Green Fluorescent protein (GFP) and Escherichia coli β-glucuronidase (GUS), was derived from the pKGWSF7 vector dedicated to plant transformation (from University of Gent, http://gateway.psb.ugent.be/; [37]). It was modified to be suitable for Phytophthora transformation. A geneticin resistance cassette was obtained as a ClaI (blunt ends with DNA pol I)/ SacI fragment from the pTefGHNH vector [30]. It contains the P. parasitica translation elongation factor 1 (Tef1) promoter, the NPTII coding sequence conferring geneticin resistance and the Ham34 terminator from Bremia lactucae. This fragment was cloned into a vector fragment corresponding to an AflII (blunt)/SacI fragment from the pKGWFS7 Gateway cloning vector, replacing the kanamycin resistance cassette used for plant selection. The resulting plasmid was named pIPO-1.
To obtain a translational fusion between the promoter sequence of a RXLR encoding gene (CL380) with the GFP-GUS reporter system (pCL380::GFP-GUS), a 1144 bp fragment upstream of CL380 sequence start codon was amplified on genomic DNA from P. parasitica PP-INRA310 and cloned into the pIPO-1 vector. P. parasitica race 0 protoplast transformation was performed as previously described [30].
Confocal microscopy
A Zeiss LSM 510 META confocal microscope was used (Carl Zeiss GmbH, Jena, Germany). GFP excitation was obtained at 488 nm. Penetration structures were observed two to thirty hours after inoculation of 5x10⁵ zoospores on onion epidermis. Infection of A. thaliana roots was observed eight and thirty hours after inoculation of 5x10⁵ zoospores. For imaging of penetration and invasion on onion epidermis, acquisition parameters were calibrated at two hours post inoculation and unchanged at the following time points to enable comparison.
Results
Design of the P. parasitica oligoarray
We retrieved all the P. parasitica EST sequences available from public databases. These sequences were obtained at various developmental stages and from cell types involved in plant infection: mycelium, zoospores, appressoria differentiated on onion and tomato necrotrophic stage of infection [8,27-30]. In total, 12632 ESTs were assembled into 1572 contigs and 3879 singletons, giving a final 5451-unisequence set (Additional file 2: Table S1). A NimbleGen custom oligo-array was designed (Additional file 1: Figure S1). Approximately 97% of the unisequences were represented by more than five 60-bp probes. Only 24 sequences did not fit the NimbleGen criteria for probe design and were discarded from the analysis. Following this design step, 56524 probes corresponding to 5427 sequences were spotted onto the array. We attributed 4398 sequences (81%) to P. parasitica and 729 sequences (13%) to the plant (Additional file 1: Figure S1). The origin of 324 sequences (6%) remained unknown (Additional file 3: Table S2). In total, 4700 probe sets corresponded to sequences from P. parasitica or of unknown origin. The remaining probe sets matched sequences of plant origin. Finally, 163000 random probes were added to complete the array, as controls.
Blastx searches of sequences attributed to P. parasitica against a protein set based on the recently released genome annotation gave 3806 hits with identity levels of more than 95%. Blastx searches (e-value = 1E-20) using the 4398 P. parasitica sequences as queries also revealed that 320 sequences (7%) had no ortholog in the genomes of P. infestans, P. ramorum and P. sojae and therefore constituted probable species-specific sequences. Functional annotation of the 4398 and 324 sequences attributed to P. parasitica and of unknown origin, respectively, was performed following blastx searches (E-value cut off: 1E-05) against the NCBI non-redundant (NR) protein database, with the blast2GO tool [32]. A GO term was associated with 3516 sequences (65%), whereas the function of 1935 sequences remained unknown (Additional file 3: Table S2).
Analysis of gene expression during early steps of the P. parasitica/A. thaliana interaction
The custom oligo-array was used to identify the modulations of the P. parasitica transcriptome during the onset of a compatible interaction. The samples analyzed corresponded to vegetative mycelium, motile zoospores, purified appressoria and a time course of early infection in A. thaliana. The A. thaliana samples were collected 2.5, 6, 10.5 and 30 hours after inoculation (hai), from roots inoculated with P. parasitica motile zoospores, thus reflecting the natural mode of infection. We selected stages ranging from

appressorium-mediated penetration (2.5 hai) to the first occurrence of dead cells, indicative of the switch to necrotrophy (30 hai), as previously described [23]. There were two biological replicates. Each replicate corresponded to RNA extracts from pooled independent biological samples for each condition, to ensure the robustness of our results.
Only hybridization data relevant to P. parasitica or sequences of unknown origin were retained for analysis. In total, 4194 sequences (89% of the 4700 probes corresponding to P. parasitica sequences or sequences of unknown origin) gave a hybridization signal stronger than the background in at least one condition and were considered to correspond to expressed genes. The oligo-array contained 314 of the 320 putative P. parasitica-specific sequences. Significant expression in at least one biological sample was detected for 266 of these sequences, confirming that they corresponded to P. parasitica-specific expressed genes. Interestingly, 2864 sequences (61%) and 2987 sequences (64%) were expressed in purified appressoria and during the appressorium-mediated penetration of A. thaliana roots (2.5 hai), respectively. Thus, with the inoculation method used for this analysis, a high proportion of transcripts can be detected even at the earliest stages of the interaction.
The Anaïs statistical framework was used to identify differentially expressed sequences [33]. Using a P-value threshold of 0.05, 3783 sequences were considered to display differential patterns of accumulation between at least two sets of conditions. Maximum fold-change, defined as the ratio of the maximum and minimum hybridization signal values, was calculated for each sequence. In total, 3471 sequences had a maximum fold-change of more than 2 and 1806 sequences had a maximum fold-change of at least 4.
Cluster analysis of gene expression patterns
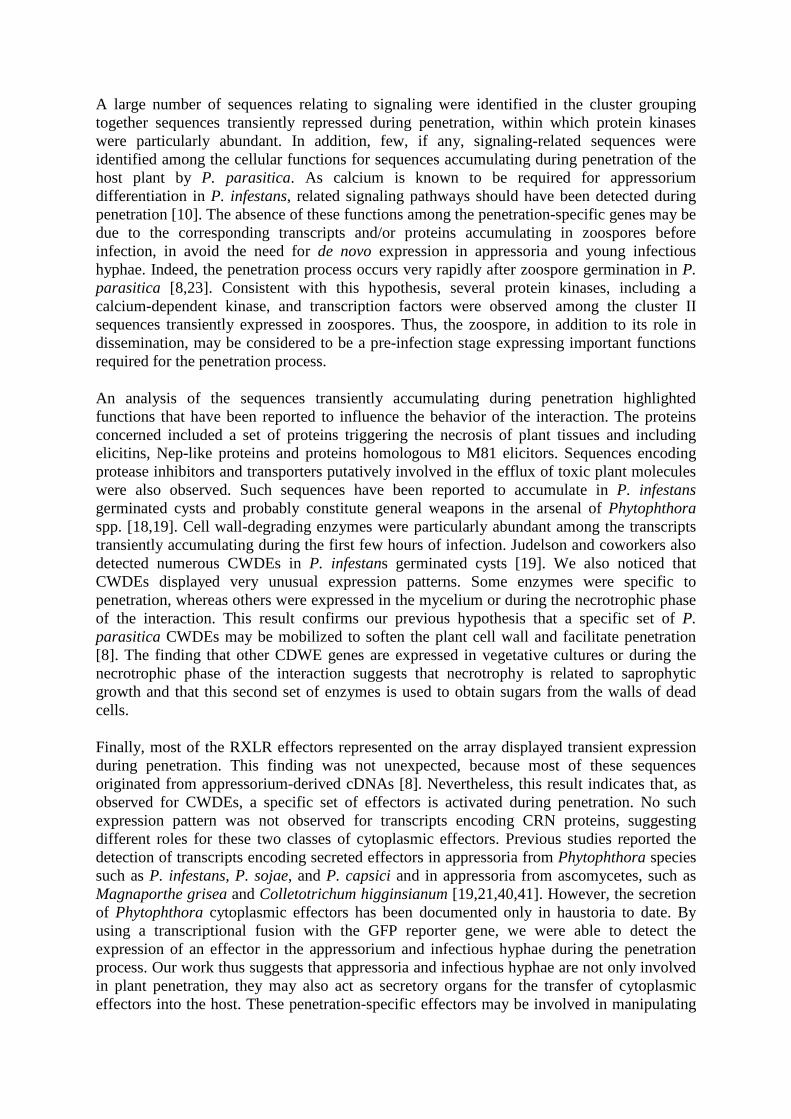
The expression patterns of the 1806 sequences displaying at least a four-fold modulation of expression were analyzed. We performed a hierarchical clustering of the expression patterns (Figure 1A) and genes with coordinated expression were grouped into 12 major clusters (K-mean clustering, Figure 1B, Additional file 4: Table S3).
Figure 1 Hierarchical and K-mean clustering of four-fold expressed genes. (A) Hierarchical clustering of the 1806 genes modulated by 4-fold. Pearson correlation method with average linkage on conditions was used. Gene expression level is indicated as a Log2 transformation of relative value calculated on gene average signal value. Green and red were used for down-regulated and up-regulated conditions respectively. Lines mark major K-mean groups. (B) Expression profiles were K-mean clustered based on euclidean distance. The twelve main K-mean clusters are represented. The center line represents average expression with standard deviation. Number of genes within each cluster is indicated. The six clusters used for subsequent characterization of the molecular events occurring during early infection are colored in red. Myc, mycelium; Zoo, zoospores, App, Appressorium; 2.5 h, Arabidopsis thaliana infected roots recovered 2.5 hours after inoculation (appressorium-mediated penetration); 6 h, A. thaliana infected roots recovered 6 hours after inoculation (biotrophic growth, two to three cells invaded); 10.5 h, A. thaliana infected roots recovered 10.5 hours after inoculation (invasive growth along the stele); 30 h, A. thaliana infected roots recovered 30 hours after inoculation (switch to necrotrophy).
Clusters I (124 sequences), II (154 sequences), III (144 sequences), IV (388 sequences), V (94 sequences), VI (101 sequences) and XX (92 sequences) contained sequences for which expression was modulated during the onset of infection (Figure 1B). Clusters I, II, V, VI and

XX contained sequences with a specific modulation of expression (induced or repressed) during early contact with plant cells, as they were detected in purified appressoria and during the first few hours of A. thaliana infection (2.5, 6 and 10.5 hai). By contrast, clusters III and IV contained sequences whose accumulation or repression begins in motile zoospores, corresponding to the pre-infection stage.
Sequences from cluster VII (366 sequences) were specifically modulated in zoospores. Interestingly, clusters VIII (70 sequences) and IX (130 sequences) contained sequences with similar patterns of expression in zoospores and in A. thaliana roots collected 2.5 hours after inoculation (Figure 1B). This may be due to the contamination of A. thaliana root tissues by zoospores, either motile or initiating cyst formation, in the first sample collected for the interaction. This finding is consistent with previous reports indicating that plant infection by motile P. parasitica zoospores is an asynchronous process. It thus highlights the advantages of the simplified system previously used to obtain purified appressoria [8].
Cluster XI (74 sequences) grouped together sequences that accumulated preferentially in mycelium (K-mean clustering, Figure 1B). However, most of the sequences found in this cluster also accumulated 2.5 hours after A. thaliana inoculation. This may be due to cysts failing to penetrate and the plant and instead initiating mycelial growth around A. thaliana roots, as reported during the initial steps of tomato root infection by P. parasitica [30].
Finally, transcripts from cluster XII (69 sequences) accumulated throughout the development of plant infection (Figure 1B). This accumulation increased during infection, reaching a maximum at the last stage studied (30 hai).
Validation of the transcriptome data by RT-qPCR
The expression patterns observed on hybridization of the P. parasitica oligo array were validated by quantitative RT-PCR. We selected 58 sequences from the six clusters containing sequences with expression modulated during the appressorium-mediated penetration of the host (clusters I, II, III, IV, V and VI; red on Figure 1). A biological sample corresponding to the A. thaliana / P. parasitica interaction was added, to monitor expression of the selected sequences during the necrotrophic stage. This sample corresponded to inoculated A. thaliana root tissues collected four days after inoculation with zoospores. Forty-four of the 58 genes assessed (75%) displayed a modulation of expression during the onset of the interaction, consistent with the results of array hybridization (Figure 2 and Additional file 5: Table S4). Nine of the 14 sequences for which expression profiling results were not validated by RT-qPCR were from cluster V (Additional file 5: Table S4).
Figure 2 Quantification of mRNAs corresponding to one gene from each of the clusters I to IV. Relative mRNA levels were quantified by quantitative RT-PCR in biological replicates of samples used in figure 1. A condition corresponding to A. thaliana roots 4 days after inoculation (4d), corresponding to necrotrophic stage of the interaction was added. Data are presented as expression ratios relative to UBC, WS21 and Mago Nashi reference genes (2−∆CT). Grey bars represent mean signal obtained following oligoarray hybridizations (black left axis). Red point and crosses represent relative expression values obtained for two independent biological replicates analyzed using qRT-PCR (red right axis).
This cluster probably included sequences with artifactual hybridization signals. After we had discarded data for the members of this cluster, the expression patterns for 43 of 48 (90%)
sequences were validated by RT-qPCR, demonstrating the robustness of our transcriptome data.
We also used the RT-PCR results to improve our clustering analysis. The grouping of sequences in cluster I, which contained transcripts transiently accumulating during the onset of infection was validated, because eight of the nine sequences had expression patterns consistent with that deduced from oligoarray hybridization (Figure 2, Additional file 5: Table S4). The transcripts of these genes accumulated in smaller amounts during the necrotrophic phase of the P. parasitica/A. thaliana interaction (4 days after inoculation). This cluster included sequences that accumulated during early infection of the host. The content of clusters III and IV was also validated with all and 8 of the 10 sequences, respectively, displaying the predicted expression pattern (Figure 2, Additional file 5: Table S4). The use of the sample corresponding to necrotrophy also confirmed that the sequences grouped in these clusters accumulated or were repressed transiently in zoospores and during the penetration process. Sequences from cluster II had lower accumulation during early infection than during vegetative mycelial growth and the necrotrophic phase (4 days after inoculation). Nevertheless, seven of these nine sequences also accumulated to low levels in zoospores (Figure 2, Additional file 5: Table S4). This suggests that cluster II could be grouped with cluster IV for a single analysis. Cluster VI contained sequences specifically induced during the penetration of onion epidermis (purified appressoria, Figure 1). This cluster was poorly validated because five of the 10 sequences accumulated during the penetration of both A. thaliana roots and onion (Additional file 5: Table S4). This confirms that the results obtained with our simplified inoculation protocol reflect the situation occurring in natural conditions of plant penetration [8]. On the basis of this RT-qPCR analysis, clusters I and VI were grouped together for subsequent analyses.
Functions of the sequences accumulating during appressorium-mediated plant penetration
We focused our analysis on transcripts modulated during the onset of a compatible interaction (clusters I-VI). A functional annotation of the 20 genes displaying the highest fold-change in each cluster is presented in Table 1. We performed a GO enrichment analysis of the clusters, for annotation purposes. Sequences specifically accumulating during the appressorium-mediated penetration of the host plant (purified appressoria, A. thaliana 2.5 hai, 6 hai and 10.5 hai, clusters I and VI) were highly enriched in cell wall-degrading enzymes (CWDEs, Additional file 6: Table S5_I and Additional file 7: Table S5_VI). There were 64 sequences encoding CWDE on the array: 14 and 8 had expression patterns characteristic of clusters I (grouping 124 sequences) and VI (grouping 101 sequences), respectively (Additional file 4: Table S3). Figure 3A shows the expression patterns of all the sequences associated with GO terms relating to cell wall degradation. Thirty CWDEs were found to be preferentially expressed during the first few hours of infection. The other 34 enzymes were expressed in zoospores, mycelium or both mycelium and at the necrotrophic stage of interaction with A. thaliana. GO terms associated with the modulation of plant defenses were also overrepresented during the early stages of infection (Additional file 6: Table S5_I). Hence, six of the 14 sequences encoding RXLR effectors present on the oligoarray were present in cluster I. One of these six sequences corresponded to the PSE1 effector, which has recently been demonstrated to contribute to P. parasitica pathogenicity [38]. The expression patterns of sequences encoding cytoplasmic (RXLR and CRN) effectors are presented in Figure 3B. Twelve of the RXLR effectors are induced during the penetration process, whereas only a few CRN effector transcripts accumulated at this stage. Other functions

relevant to pathogenicity or the elicitation of plant defense responses were also identified in clusters I (2 elicitin-like, 2 NPP1-like and 1 M81 elicitor-like) and VI (a putative protease inhibitor) (Table 1 and Additional file 4: Table S3). GO annotations relating to ribosomes were also enriched in cluster VI, providing evidence for the activation of the translation machinery during early infection (Additional file 7: Table S5_VI).

Table 1 Functional annotation of the sequences from clusters I-VI Normalized hydridization signal blastx Best Hit
CL Sequence Myc Zoo App 2,5h 6h 10,5h 30h FC ID Description E value
I CL1533Contig1 102 749 95 10813 1022 712 139 114 no hit I ppgam36a11r.1 127 131 336 1972 3482 13284 713 105 XP_002895059.1 elicitin-like protein INF4 [P. infestans] 3E-10 I ppo3h07a24t.1 97 104 9105 1711 4473 1226 450 94 XP_002998010.1 secreted RxLR effector peptide protein, [P. infestans] 2E-13 I CL1408Contig1 120 178 10915 1767 3707 5999 7470 91 XP_002896645.1 Amino Acid/Auxin Permease (AAAP) Family [P. infestans] 1E-134 I ppo3h11p12t.1 296 334 4984 26369 10531 11172 2378 89 no hit I CL262Contig1 196 391 5444 14553 9894 3628 1081 74 no hit I CL380Contig1 108 120 7702 1192 3335 848 336 72 XP_002998010.1 secreted RxLR effector peptide protein, [P. infestans] 5E-19 I CL1335Contig1 333 1011 13535 15140 18621 22234 10825 67 no hit I ppgam18a12r.1 112 116 119 6434 1077 814 167 57 no hit I ppo3h08i21t.1 122 128 6892 5236 3381 818 288 57 XP_002901148.1 carbohydrate-binding protein, [P. infestans] 2E-13 I ppgam09e02r.1 100 110 116 5457 539 400 126 55 XP_001339148.2 PREDICTED: polymerase polyprotein-like [Danio rerio] 3E-53 I CL42Contig1 132 134 7202 5692 3174 681 233 55 XP_002901145.1 hypothetical protein PITG_11596 [P. infestans] 1E-09 I ppt4j31g10r.1 126 120 135 5163 639 381 163 43 no hit I ppo3h12o13t.1 118 154 4926 1188 4607 2779 1464 42 XP_002900991.1 conserved hypothetical protein [P. infestans] 2E-32 I ppo3h06d21t.1 190 699 990 3799 7709 4416 2482 41 XP_002904652.1 ATP-binding Cassette (ABC) superfamily [P. infestans] 2E-17 I ppo3h05p06t.1 96 96 2003 1513 3273 884 212 34 Q56TU4.1 S-adenosylmethionine synthase 1; Daucus carota 1E-13 I CL382Contig1 180 190 5393 3807 3160 987 403 30 XP_002901148.1 carbohydrate-binding protein, [P. infestans] 6E-11 I CL1026Contig1 125 144 900 1436 3606 2879 845 29 XP_002901054.1 secreted RxLR effector peptide protein, [P. infestans] 2E-15 I CL366Contig1 122 228 274 3032 2717 1029 146 25 no hit I CL1109Contig1 135 138 3025 1229 3268 2982 2582 24 XP_002898673.1 ribonuclease, [P. infestans] 1E-89 II CL1024Contig1 5212 1169 195 341 160 154 481 34 XP_500020.1 YALI0A12705p [Yarrowia lipolytica] emb 1E-13 II ppgam23f03r.1 3620 1975 358 224 136 126 158 29 XP_002895853.1 sporangia induced phosphatidyl inositol kinase [P. infestans] 1E-142 II CL1233Contig1 3966 6902 240 430 353 738 1651 29 XP_002899328.1 Ca2+−transporting ATPase endoplasmic reticulum type, [P. infestans] 0 II CL1149Contig1 903 2978 308 207 297 436 462 14 XP_002905211.1 protein kinase, [P. infestans] 0 II CD051670.1.1 1313 2611 2387 248 185 207 625 14 no hit II CL1407Contig1 10595 4542 757 1385 2211 3020 2338 14 XP_002908946.1 dihydroflavonol-4-reductase, [P. infestans] 1E-159 II ppt4j11b07r.1 636 2408 175 259 352 341 343 14 XP_002903886.1 conserved hypothetical protein [P. infestans] 3E-99 II CL772Contig1 4458 2341 605 336 991 969 1198 13 XP_002997937.1 conserved hypothetical protein [P. infestans] 0 II CL864Contig1 9998 4700 787 1220 1070 1225 2643 13 XP_002898044.1 conserved hypothetical protein [P. infestans] 0 II CL112Contig2 5791 4284 1116 2745 2166 1535 463 13 XP_002895909.1 ATP-binding Cassette (ABC) Superfamily [P. infestans] 0 II ppgam04e11r.1 649 2816 231 262 328 349 557 12 no hit II CL1478Contig1 771 2708 235 250 347 341 514 12 XP_002907456.1 conserved hypothetical protein [P. infestans] 7E-76 II ppgam07d02r.1 634 2263 196 293 225 275 345 12 XP_002998017.1 transmembrane protein, [P. infestans] 7E-71 II CL471Contig1 5487 4101 582 848 477 756 1567 12 XP_002896830.1 conserved hypothetical protein [P. infestans] 1E-100 II CL1485Contig1 1608 838 158 143 186 180 347 11 XP_002897750.1 short/branched chain specific acyl-CoA dehydrogenase, [P. infestans] 1E-125 II CL349Contig1 1340 4691 549 502 543 431 729 11 XP_002909307.1 conserved hypothetical protein [P. infestans] 0 II ppgam33a03r.1 2179 1553 202 508 579 938 701 11 XP_002905400.1 L-aminoadipate-semialdehyde dehydrogenase, [P. infestans] 1E-128 II CL874Contig1 1039 2304 216 452 351 573 601 11 XP_002997338.1 HECT E3 ubiquitin ligase, [P. infestans] 7E-89

II CL176Contig1 2239 5389 710 506 573 549 834 11 XP_002897342.1 conserved hypothetical protein [P. infestans] 8E-61 II ppt4j38b11r.1 681 2149 332 246 230 202 432 11 XP_002896848.1 conserved hypothetical protein [P. infestans] 1E-108 III ppo3h14g02t.1 142 11120 10795 18486 7479 2452 503 130 XP_002997786.1 glycoside hydrolase, [P. infestans] 1E-43 III ppo3h14f01t.1 126 5446 7895 14463 5042 1485 437 115 no hit III CD051442.1.1 218 15744 14847 23012 17903 9763 5659 105 no hit III CL369Contig1 122 11151 4457 12379 4521 1277 268 102 XP_002997786.1 glycoside hydrolase, [P. infestans] 1E-138 III CD051500.1.1 157 15890 5422 7601 5856 5131 1149 101 no hit III CL306Contig1 148 14591 3542 5108 3343 3089 710 99 XP_002898718.1 conserved hypothetical protein [P. infestans] 1E-146 III CL804Contig1 130 9313 6270 2748 2823 2240 1429 72 XP_002904112.1 sulfatase-like protein [P. infestans] 1E-132 III CL515Contig1 131 7782 2639 1063 1153 1103 519 59 XP_002904421.1 conserved hypothetical protein [P. infestans] 0 III CD051686.1.1 135 6845 2453 1660 868 844 290 51 no hit III CL1187Contig1 181 9106 1049 3912 5197 6878 5043 50 XP_002896478.1 poly [ADP-ribose] polymerase, [P. infestans] 1E-174 III CF891673.1.1 157 5465 5871 2105 4405 2699 1995 37 no hit III CL232Contig1 200 7317 3970 3044 4343 2281 3612 37 XP_002904949.1 conserved hypothetical protein [P. infestans] 1E-168 III CL1195Contig1 135 4941 2491 3037 2412 1683 724 37 XP_002895053.1 conserved hypothetical protein [P. infestans] 1E-129 III CL181Contig1 276 7495 9615 1909 1423 1212 1047 35 XP_002900508.1 conserved hypothetical protein [P. infestans] 1E-119 III ppo3h09b05t.1 172 5371 703 1742 819 937 463 31 ABG80552.1 cell 5A endo-1,4-betaglucanase [P. ramorum] 2E-97 III ppo3h07h24t.1 112 3238 1398 543 840 680 469 29 XP_002906516.1 transmembrane protein, [P. infestans] 1E-117 III ppo3h13d10t.1 115 3128 1867 885 647 518 171 27 XP_002998505.1 GPI-anchored serine-rich elicitin INL3b-like protein [P. infestans] 1E-38 III CL449Contig1 125 3223 2186 1589 1510 843 410 26 XP_002898095.1 conserved hypothetical protein [P. infestans] 7E-96 III ppt4j29b11r.1 158 3765 2184 1048 557 849 399 24 XP_002902649.1 Drug/Metabolite Transporter (DMT) Superfamily [P. infestans] 1E-108 III CL330Contig1 1867 23600 43890 40265 40618 35214 14295 24 XP_002904340.1 conserved hypothetical protein [P. infestans] 1E-102 IV CL8Contig1 44525 163 325 452 825 9662 7144 274 XP_002899844.1 conserved hypothetical protein [P. infestans] 1E-152 IV CL639Contig1 22961 606 806 221 192 166 413 139 ABG23233.1 unknown [Hyaloperonospora parasitica] 1E-36 IV ppo3h02e04t.1 19582 157 3139 1151 2639 7487 7743 124 XP_002900352.1 Proton-dependent Oligopeptide Transporter (POT) Family [P. infestans] 8E-98 IV ppgam01h01r.1 17201 173 339 204 164 142 881 121 XP_002901432.1 conserved hypothetical protein [P. infestans] 6E-33 IV ppo3h10m18t.1 25224 224 6090 1667 2610 4991 19398 113 no hit IV CL90Contig1 13934 167 1552 489 7712 8560 18029 108 XP_002999240.1 pyrophosphate vacuolar membrane proton pump, [P. infestans] 0 IV CL32Contig1 14467 189 275 148 258 429 4440 97 AAM18483.1 AF494014_1 exo-1,3-beta-glucanase [P. infestans] 0 IV ppgam24d04r.1 13873 149 200 667 295 697 973 93 XP_002907089.1 protein kinase, [P. infestans] 1E-127 IV CL210Contig1 12224 133 178 647 362 905 11665 92 XP_002909387.1 conserved hypothetical protein [P. infestans] 7E-69 IV ppgam36c10r.1 16676 187 4612 1365 566 1463 8770 89 XP_002904661.1 Major Facilitator Superfamily (MFS) [P. infestans] 1E-126 IV CL119Contig1 10489 126 163 144 246 461 494 84 XP_002900778.1 Annexin (Annexin) Family [P. infestans] 1E-166 IV ppgam37e05r.1 15664 342 205 390 190 188 2589 83 XP_002907653.1 oxidoreductase, [P. infestans] 4E-85 IV CL71Contig1 10898 137 1568 339 1504 4481 9186 79 ABH11757.1 elicitin-like protein 6 precursor [P. nicotianae] 4E-44 IV ppo3h07a23t.1 9263 118 124 161 162 175 1752 78 XP_002907297.1 P-type ATPase (P-ATPase) Superfamily [P. infestans] 1E-120 IV CL92Contig1 12589 213 871 357 5799 12282 16142 76 XP_002998388.1 carbohydrate-binding protein, [P. infestans] 1E-127 IV ppgam07a10r.1 8342 249 671 275 1663 9237 18817 76 XP_002903354.1 mucin-like protein [P. infestans] 8E-38 IV ppgam02h08r.1 4632 136 625 454 3462 10250 8890 75 XP_002896569.1 glucosylceramidase, [P. infestans] 1E-109 IV ppt4j09a01r.1 8222 115 199 259 220 399 8676 75 XP_002909387.1 conserved hypothetical protein [P. infestans] 2E-46 IV ppgam18e03r.1 15537 715 353 538 227 207 2704 75 XP_002902980.1 acyl-CoA synthetase short-chain family member, [P. infestans] 1E-124

IV CL758Contig1 12392 169 311 676 908 2489 3671 73 XP_002904197.1 glucosylceramidase, [P. infestans] 1E-156 V ppo3h06f02t.1 409 777 214 8582 1544 1290 509 40 XP_002997773.1 conserved hypothetical protein [P. infestans] 7E-78 V ppgam12h06r.1 781 868 171 5385 359 274 138 39 no hit V ppgam31f01r.1 119 197 159 2339 520 353 164 20 no hit V ppt4j25b05r.1 97 176 126 1823 424 369 127 19 AAR21576.1 heat shock protein 70 [P. nicotianae] 2E-20 V CL1505Contig1 480 596 349 5757 3617 1585 1274 17 XP_002895485.1 ATP-binding Cassette (ABC) superfamily [P. infestans] 1E-136 V ppt4j21a06r.1 445 118 199 1866 303 357 311 16 XP_002895988.1 maltose O-acetyltransferase, [P. infestans] 5E-86 V ppgam36f04r.1 108 116 171 1707 275 240 140 16 no hit V ppgam17d07r.1 159 458 362 2083 608 514 333 13 XP_002906389.1 conserved hypothetical protein [P. infestans] 2E-65 V CL344Contig1 138 179 483 1684 534 446 257 12 no hit V ppgam04f05r.1 128 167 462 1554 521 297 166 12 no hit V ppo3h02b24t.1 112 407 356 1344 495 796 671 12 XP_002895175.1 conserved hypothetical protein [P. infestans] 5E-51 V ppo3h06n03t.1 129 135 526 1544 284 204 175 12 NP_001063268.1 Os09g0438100 [Oryza sativa Japonica Group] dbj 0,000009 V ppt4j01f03r.1 106 122 165 1257 236 187 145 12 XP_002903318.1 conserved hypothetical protein [P. infestans] 1E-15 V ppo3h03i13t.1 161 608 253 1692 729 454 216 11 XP_002904470.1 conserved hypothetical protein [P. infestans] 5E-97 V ppo3h01k13t.1 126 418 348 1275 506 395 230 10 XP_002903425.1 conserved hypothetical protein [P. infestans] 3E-45 V ppt4j36c04r.1 291 127 168 1285 233 258 241 10 XP_002182839.1 predicted protein [Phaeodactylum tricornutum CCAP 1055/1] 4E-51 V ppo3h12p16t.1 564 1450 1037 5589 1138 1127 581 10 XP_002898514.1 conserved hypothetical protein [P. infestans] 1E-36 V ppo3h03o24t.1 240 119 230 1158 360 368 185 10 no hit V ppt4j38e02r.1 102 102 100 943 200 196 117 9 no hit V ppgam22f11r.1 122 120 153 1082 249 223 145 9 XP_002896344.1 conserved hypothetical protein [P. infestans] 2E-14 VI ppo3h12n08t.1 104 106 37783 103 124 120 116 365 no hit VI ppo3h10g01t.1 113 131 9703 121 207 111 112 87 no hit VI ppo3h12n20t.1 104 128 8715 707 225 478 128 84 XP_002909505.1 mannitol dehydrogenase, [P. infestans] 5E-41 VI ppo3h13j21t.1 92 94 4826 93 122 112 96 52 no hit VI CL613Contig1 117 129 5082 224 1021 1359 1803 43 XP_002904550.1 folate-Biopterin Transporter (FBT) family [P. infestans] 0 VI ppo3h03f02t.1 132 996 5251 350 169 144 142 40 XP_002904736.1 conserved hypothetical protein [P. infestans] 2E-69 VI ppo3h05l14t.1 95 173 3749 261 179 118 114 39 XP_002905279.1 cleavage induced hypothetical protein [P. infestans] 5E-86 VI CL419Contig1 139 323 5306 737 1879 924 595 38 ABB22029.1 cell 12A endoglucanase [P. sojae] 1E-117 VI ppo3h06d03t.1 112 124 4159 443 816 580 173 37 XP_002904437.1 conserved hypothetical protein [P. infestans] 1E-112 VI ppt4j22c09r.1 118 593 3355 2610 422 405 321 28 XP_002909523.1 Amino Acid-Polyamine-Organocation (APC) Family [P. infestans] 1E-115 VI ppo3h04p13t.1 113 118 2658 565 195 151 129 24 XP_002901038.1 carbohydrate-binding protein, [P. infestans] 1E-58 VI CL118Contig1 105 106 2438 176 140 160 118 23 XP_002902444.1 conserved hypothetical protein [P. infestans] 1E-107 VI CL999Contig1 117 131 2593 402 881 527 270 22 XP_002901373.1 conserved hypothetical protein [P. infestans] 1E-86 VI CL1422Contig1 138 172 3038 797 222 254 913 22 XP_002904844.1 ATP-binding Cassette (ABC) Superfamily [P. infestans] 1E-165 VI CL317Contig1 160 124 2693 276 585 516 953 22 XP_002901401.1 conserved hypothetical protein [P. infestans] 7E-26 VI CL1406Contig1 105 112 1979 156 169 164 117 19 ABG23232.1 N-acetyltransferase-like protein [Hyaloperonospora parasitica] 3E-49 VI CL448Contig1 237 228 4124 1663 1472 745 545 18 XP_002900313.1 cutinase, [P. infestans] 1E-103 VI CL1513Contig1 124 124 2132 264 650 571 264 17 XP_002903927.1 pectin lyase, [P. infestans] 2E-61 VI CL1176Contig1 106 116 1784 152 122 124 108 17 XP_002999045.1 conserved hypothetical protein [P. infestans] 1E-142 VI ppo3h13a15t.1 97 100 1585 101 119 110 102 16 XP_002518625.1 conserved hypothetical protein [Ricinus communis] 1E-51

Annotation proposed for the 20 genes with the highest fold change in each cluster (CL) is presented. For all sequences, normalized hybridization signal in each condition (mean of the two biological replicates) is indicated. Maximum fold change (max FC) observed between the different biological samples and BlastX best hit result (E value < 1E-05) against NCBI non-redundant (NR) protein database are presented.

Figure 3 Hierarchical clustering of the genes encoding cell wall degrading enzymes and cytoplasmic effectors. Based on GO annotations, sequences corresponding to cell wall degrading enzymes (A) and sequences corresponding to RXLR and Crinkler effectors (B) are presented. Pearson correlation method with average linkage on conditions was used. Gene expression level is indicated as a Log2 transformation of relative value calculated on gene average signal value. Green and red were used for down-regulated and up-regulated conditions respectively. Myc, mycelium; Zoo, zoospores, App, Appressorium; 2.5 h, A. thaliana infected roots recovered 2.5 hours after inoculation; 6 h, A. thaliana infected roots recovered 6 hours after inoculation; 10.5 h, A. thaliana infected roots recovered 10.5 hours after inoculation; 30 h, A. thaliana infected roots recovered 30 hours after inoculation.
An analysis of clusters I and VI showed these clusters to contain sequences involved in protein and amino-acid metabolism, including four proteases and four putative amino-acid transporters. Similarly, eight and three sequences encoding functions involved in the detoxification of plant toxic metabolites (ABC transporters and major facilitator superfamily members) were identified in clusters I and VI, respectively (Additional file 4: Table S3). Interestingly, sequences relating to sugar metabolism were poorly represented in these clusters. Cluster I included a sequence corresponding to mannose 6P isomerase, a pyruvate kinase and a NAD-dependent malic enzyme. A single sequence encoding a malate dehydrogenase was identified in cluster VI (Additional file 4: Table S3). A similar situation was observed for sequences relating to fatty-acid catabolism. Only one sequence encoding a long-chain fatty acid CoA ligase and one sequence encoding an acyl-CoA dehydrogenase were identified in clusters I and VI, respectively (Table 1 and Additional file 4: Table S3).
The prominent functions identified for sequences from cluster III (sequences accumulating in zoospores and during host penetration, 144 sequences) were mostly similar to those identified in clusters I and VI. GO enrichment analysis highlighted the accumulation of sequences with functions relating to ribosome biogenesis (Additional file 8: Table S5_III). However, a detailed analysis of this cluster revealed the occurrence of three additional cell wall-degrading enzymes and numerous infection-associated sequences, including five M81-like sequences, two OPEL-like sequences, one EPIC-like sequence and one elicitin (Table 1 and Additional file 4: Table S3). Three sequences encoding functions involved in the evasion of toxic molecules (ABC transporters and major facilitator superfamily members) were observed. Finally, this cluster also contained four proteases and one amino acid/auxin permease, confirming the importance of amino-acid uptake during early infection. Only two glycolytic enzymes (glucokinase and a glyceraldehyde 3P dehydrogenase) and a fatty-acid metabolism-related short-chain dehydrogenase were identified in this cluster.
Cluster V, which contained 94 sequences specifically expressed during the penetration of A. thaliana roots, but not onion epidermis, was not supported by RT-qPCR experiments, suggesting that this cluster should be considered with caution. Moreover, most of the sequences in this cluster lacked robust annotation. Nevertheless, like clusters I and VI, this group contained various pathogenicity-related sequences, including a range of apoplastic and cytoplasmic effectors: four RXLR effectors, two CRNs, one elicitin-like sequence, one IPI-like sequence, one NPP1-like sequence and one protease (Table 1, Additional file 9: Table S5_V and Additional file 4: Table S3).

Functions of sequences repressed during appressorium mediated penetration of the host
An analysis of the sequences of cluster II (154 sequences specifically repressed during appressorium-mediated penetration) revealed enrichment for functions involved in signaling (Additional file 10: Table S5_B). A more detailed analysis identified 15 potential protein kinases, including three phosphatidyl-inositol kinases and two MAP-kinases (Table 1 and Additional file 4: Table S3). Sequences relating to lipid metabolism (2 acyl-CoA dehydrogenases, 2 acyl-CoA ligases) and ubiquitin-mediated protein degradation (2 E3 ubiquitin ligases and one ubiquitin-like protein) were also identified in this cluster.
For sequences repressed both in zoospores and during the penetration process (cluster IV, 388 sequences), most of the associated GO terms identified related to metabolism (Additional file 11: Table S5_IV). Primary metabolism was globally downregulated, as indicated by the numbers of sequences relating to glycolysis/neoglucogenesis, the pentose phosphate pathway, lipid metabolism, and their overall repression level (Table 1 and Additional file 4: Table S3). Similarly, the ubiquitin-proteasome pathway (12 proteasome components and 9 sequences associated with the proteolytic process) was repressed during early infection (Table 1 and Additional file 4: Table S3).
Surprisingly, an analysis of cluster IV led to the identification of functions otherwise overrepresented during the penetration process. The sequences of this cluster included sequences encoding enzymes involved in cell wall degradation (15 sequences), proteases (13 sequences), elicitin-like proteins (4 sequences) and potential ABC transporters (8 sequences, Table 1 and Additional file 4: Table S3). These findings suggest that multiple functions are achieved by specific proteins during the penetration process, with these proteins being downregulated during the other steps of the P. parasitica life cycle.
An RXLR effector is expressed in the appressorium and infectious hyphae
A significant number of transcripts encoding RXLR effectors were found to accumulate during host penetration. These proteins are generally thought to be delivered into the plant cytoplasm via haustoria [39]. We analyzed the expression pattern of an RXLR sequence from cluster I. This gene, represented by the unisequence CL380, was chosen for study because it was strongly expressed during the penetration process (Table 1). P. parasitica transformants expressing a pCL380::GFP-GUS transcriptional fusion were obtained and used in the onion epidermis-based simplified penetration assay, for a precise analysis of CL380 expression during penetration. Two independent transformants gave similar GFP expression patterns. Expression was detected in germinated cysts (2 hai) and a faint GFP signal was observed in the cyst and germ tube (Figure 4A, 2 h). Fluorescence remained weak in germinated cysts differentiating into appressoria (Figure 4A, 2 h). The GFP signal increased 3 hours after inoculation, at the onset of penetration, and peaked six hours after inoculation (Figure 4A, 3 h and 6 h). The GFP signal was localized in infectious hyphae, and the cysts and appressoria appeared to have no cytoplasm at this stage (Figure 4A, 6 h). The GFP signal decreased 10 hours after inoculation, when the infectious hyphae grew into the cells and became weakly detectable, 30 hours after inoculation, in heavily colonized tissues. As GFP is stable for almost 24 h, the decrease in fluorescence intensity is accounted for by both transcription arrest and the dilution of the existing GFP in the developing infectious hyphae. This result confirmed that the CL380 effector accumulated transiently during the penetration process. Zoospores from transformants expressing the pCL380::GFP-GUS transcriptional fusion were

then used to inoculate A. thaliana plantlets. A transgenic line accumulating a plasma membrane-targeted mCherry fluorescent protein was used to visualize the boundaries of the plant cell cytoplasm. We observed mCherry fluorescence around the infectious hyphae, suggesting that P. parasitica invades plant cells by growing between the plasma membrane and the cell wall (Figure 4B). As in onion epidermis, GFP fluorescence was observed just after penetration, in the infectious hyphae of the transgenic P. parasitica strain, whereas no fluorescence was detected with the wild-type strain (8 hours post inoculation for the image presented, Figure 4B). This result confirms that this RXLR-encoding gene is expressed during penetration of the first plant cell. The fluorescence subsequently decreased but continued to be observed in some areas of the infected roots at the late biotrophy stage (24 hours post inoculation for the image presented, Figure 4B). This may be due, in part, to the stability of GFP, which delays the decrease in fluorescence. Moreover, as P. parasitica infection is an asynchronous process, the infection events observed 30 hours after the inoculation of A. thaliana may correspond to different biological stages. Some parts of the roots may undergo early biotrophic P. parasitica colonization, even 30 hours after inoculation. It was more difficult to detect mCherry fluorescence at this stage, which suggests that plant cells are already affected by P. parasitica colonization. Taken together, these results confirm that P. parasitica transiently expresses RXLR effectors during the penetration process.
Figure 4 P. Parasitica appressorium transiently express a RXLR encoding effector during the penetration process. (A and B) Expression pattern of the CL380 RXLR encoding gene using a pCL380::GFP-GUS fusion. (A) Kinetic of early infection steps using a simplified penetration assay based on onion epidermis. GFP fluorescence from a P. parasitica strain carrying the pCL380::GFP-GUS construct was monitored 2 to 30 hours after inoculation of zoospores on onion epidermis. (B) Analysis of the CL380 expression pattern during early A. thaliana infection. A. thaliana plantlets where inoculated with zoospores from a P. parasitica strain carrying the pCL380::GFP-GUS construct and fluorescence was monitored during infection of the first cell (6 hours after inoculation for the presented image) and late biotrophic phase (24 hours after inoculation for the proposed image). Plant cell membranes (red) are visualized with the mCherry plasma membrane marker pm-RB. A representative image for each stage is presented. GFP and mCherry fluorescence was visualized using a confocal laser scanning microscope. Bars: 10 µM; Arrows: appressoria; Stars: Infectious hyphae.
Discussion
We developed a custom oligoarray, using all the P. parasitica sequences available at the start of this project. These sequences were obtained in a range of biological conditions, including plant infection. A set of 5451 unisequences was generated by EST clustering and assembly and oligonucleotides were designed for all but 24 of these sequences. Overall, 87% of these sequences were attributed to P. parasitica or were of unknown origin. Based on the recently released complete P. parasitica genome sequence, we determined that the array made it possible to study the expression of about 20% of the predicted genes of this species. The oligoarray was used to monitor gene expression during the onset of infection. The objective was to characterize the genetic program activated during appressorium differentiation and the penetration of the first host cells. RNA recovered from vegetative cultures, pre-infection structures (motile zoospores and cysts differentiating into appressoria on onion) and samples collected from the plant (corresponding to A. thaliana tissues collected from 2.5 to 30 hours
after infection) was used to characterize the initial steps of infection. We detected 89% of the sequences in at least one set of conditions. This high rate of detection is slightly higher than the 69%, 79% and 75% reported during analyses of the early infection process in P. infestans, P. sojae and P. capsici, respectively [19-21]. This result is unsurprising, because EST sequences were used for the design of the array, rather than genome-based predicted open reading frames. In particular, 64% of the sequences were detected 2.5 hours after the inoculation of A. thaliana roots, which is not surprising because 20% of the ESTs used for the assembly of sequences analyzed with the array were obtained from germinated cysts with appressoria [8]. Thus, our methods were effective for detecting sequences expressed at early stages of infection. A large proportion of the sequences were differentially expressed, with 74% and 38% displaying modulations of at least two-fold and at least four-fold, respectively, between at least two sets of conditions. This proportion is higher than the proportion of genes displaying a two-fold modulation of expression (46%) described by Judelson and coworkers, who analyzed the events from sporangium cleavage to the in vitro differentiation of appressoria [19]. This difference may reflect the large proportion of genes with expression modulated during plant penetration, a biological condition not tested in the transcriptome analysis for P. infestans. Other studies on fungi have generated findings consistent with this conclusion. Only 29% of Magnaporthe grisea genes have been shown to display a two-fold modulation of expression during in vitro appressorium differentiation, whereas up to 44% of Colletotrichum higginsianum genes were found to display a four-fold modulation of expression in a transcriptome analysis of samples corresponding to plant infection [40,41].
A clustering analysis identified five highly validated clusters containing sequences modulated during appressorium-mediated penetration of the host. Sequences accumulating transiently during the penetration of the first plant cells, some of which were already accumulating in zoospores before infection, were identified. Similarly, sequences displaying transient downregulation upon host penetration were also identified. Such sequences, displaying specific downregulation in appressoria, were not identified in P. infestans germinated cysts with appressoria obtained in vitro [19]. The perception of environmental cues at the plant surface may contribute to this downregulation.
An analysis of the predicted function of the genes transiently expressed or repressed provided insight into the genetic program activated during early infection. The cluster grouping together sequences specifically repressed during the first few hours of infection (cluster II) contained a large number of genes relating to lipid and sugar metabolism. Consistent with this observation, only a few sequences relating to sugar or lipid degradation were identified in cluster I, which contained sequences transiently accumulating during the penetration process. By contrast, many sequences relating to protein degradation and amino-acid uptake were identified among the sequences accumulating at this stage. Taken together, these results suggest that P. parastica may use amino-acid uptake from the plant as a carbon source, as soon as penetration occurs. By contrast, sugar and lipid metabolism may be repressed at early stages of infection. Jupe and coworkers recently reported an enrichment in functions relating to gene expression and metabolism during the biotrophic phase of tomato infection by P. capsici [21]. They suggested that amino-acid uptake from the plant would not be favored by P. capsici at early stages of infection. This study provided no information about sugar and lipid metabolism but, as we obtained conflicting results, additional studies are required to determine which carbon sources are used by Phytophthora species during early stages of infection.
A large number of sequences relating to signaling were identified in the cluster grouping together sequences transiently repressed during penetration, within which protein kinases were particularly abundant. In addition, few, if any, signaling-related sequences were identified among the cellular functions for sequences accumulating during penetration of the host plant by P. parasitica. As calcium is known to be required for appressorium differentiation in P. infestans, related signaling pathways should have been detected during penetration [10]. The absence of these functions among the penetration-specific genes may be due to the corresponding transcripts and/or proteins accumulating in zoospores before infection, in avoid the need for de novo expression in appressoria and young infectious hyphae. Indeed, the penetration process occurs very rapidly after zoospore germination in P. parasitica [8,23]. Consistent with this hypothesis, several protein kinases, including a calcium-dependent kinase, and transcription factors were observed among the cluster II sequences transiently expressed in zoospores. Thus, the zoospore, in addition to its role in dissemination, may be considered to be a pre-infection stage expressing important functions required for the penetration process.
An analysis of the sequences transiently accumulating during penetration highlighted functions that have been reported to influence the behavior of the interaction. The proteins concerned included a set of proteins triggering the necrosis of plant tissues and including elicitins, Nep-like proteins and proteins homologous to M81 elicitors. Sequences encoding protease inhibitors and transporters putatively involved in the efflux of toxic plant molecules were also observed. Such sequences have been reported to accumulate in P. infestans germinated cysts and probably constitute general weapons in the arsenal of Phytophthora spp. [18,19]. Cell wall-degrading enzymes were particularly abundant among the transcripts transiently accumulating during the first few hours of infection. Judelson and coworkers also detected numerous CWDEs in P. infestans germinated cysts [19]. We also noticed that CWDEs displayed very unusual expression patterns. Some enzymes were specific to penetration, whereas others were expressed in the mycelium or during the necrotrophic phase of the interaction. This result confirms our previous hypothesis that a specific set of P. parasitica CWDEs may be mobilized to soften the plant cell wall and facilitate penetration [8]. The finding that other CDWE genes are expressed in vegetative cultures or during the necrotrophic phase of the interaction suggests that necrotrophy is related to saprophytic growth and that this second set of enzymes is used to obtain sugars from the walls of dead cells.
Finally, most of the RXLR effectors represented on the array displayed transient expression during penetration. This finding was not unexpected, because most of these sequences originated from appressorium-derived cDNAs [8]. Nevertheless, this result indicates that, as observed for CWDEs, a specific set of effectors is activated during penetration. No such expression pattern was not observed for transcripts encoding CRN proteins, suggesting different roles for these two classes of cytoplasmic effectors. Previous studies reported the detection of transcripts encoding secreted effectors in appressoria from Phytophthora species such as P. infestans, P. sojae, and P. capsici and in appressoria from ascomycetes, such as Magnaporthe grisea and Colletotrichum higginsianum [19,21,40,41]. However, the secretion of Phytophthora cytoplasmic effectors has been documented only in haustoria to date. By using a transcriptional fusion with the GFP reporter gene, we were able to detect the expression of an effector in the appressorium and infectious hyphae during the penetration process. Our work thus suggests that appressoria and infectious hyphae are not only involved in plant penetration, they may also act as secretory organs for the transfer of cytoplasmic effectors into the host. These penetration-specific effectors may be involved in manipulating

plant cells to facilitate establishment of the pathogen. Wang and coworkers described successive waves of effector expression during plant infection by P. sojae [42]. These authors suggested a relay between these successive waves, interfering with plant immunity at various levels. We have shown that the PSE1 effector, which is transiently expressed during penetration, can interfere with auxin physiology to facilitate plant infection [38]. Additional functional analyses of effectors transiently expressed during the onset of infection are required to determine whether this specific set of proteins plays a particular role in modulating plant development.
This study provides new insight into the process by which Phytophthora species penetrate their hosts. Based on our results for about one fifth of the gene content of this species, we propose several hypotheses concerning the biology of the infection process of P. parasitica. Future projects, making use of the full genome sequence, which is now available, will complete this analysis and should make it possible to test our hypotheses.
Conclusion
By using precisely calibrated interaction systems, we characterized the genetic program activated by P. parasitica during the initial infection of A. thaliana cells. Expression of a series of genes is transiently modulated during the penetration of the host. These modulations account for a specific developmental program occurring at the penetration stage. During penetration, genes encoding proteins involved in lipid and sugar metabolism are down-regulated whereas genes encoding functions controlling the transport of amino acids seemed favored. Similarly, cell wall degrading enzymes and other proteins involved in pathogenicity including RXLR effectors are highly modulated. Interestingly, P. parasitica uses distinct genes from these families during penetration and subsequent necrotrophic phase. We reconsidered the respective roles of the different developmental stages occurring during the infection cycle in this study. We suggest that the appressorium is involved in manipulating host cells to facilitate infection.
Competing interests
The authors declare that they have no competing interests.
Authors’ contributions
AA participated to the design of the oligoarray, obtained the biological samples, analyzed the transcriptome data and edited the manuscript. EE performed the gene enrichment analysis of the clusters, obtained the transgenic strains and performed the confocal analyses. NMK obtained the biological samples, performed the q-RT-PCR validations and obtained the transgenic strains. FP edited the manuscript. ED obtained the EST assembly and participated to the design of the oligoarray. CM performed the q-RT-PCR validations. MP obtained the biological samples. MG participated to the design of the oligoarray, obtained the biological samples, analyzed the transcriptome data, obtained the transgenic strains, performed the confocal analyses and wrote the manuscript. All authors read and approved the final manuscript.

Acknowledgements
This work was funded by grants from INRA, Direction scientifique ‘Plante et Produits du végétal’ and Department ‘Santé des Plantes et Environnement’. We thank Prof. Torii (Washington USA) for providing the A. thaliana transgenic line expressing the PM-RB marker.
References
1. Erwin DC, Ribeiro OK: Phytophthora Diseases Worldwide. St. Paul, MN: American Phytopathological Society; 1996.
2. Beakes GW, Glockling SL, Sekimoto S: The evolutionary phylogeny of the oomycete “fungi.”. Protoplasma 2011, 249:3–19.
3. Cavalier-Smith T, Chao EE-Y: Phylogeny and Megasystematics of Phagotrophic Heterokonts (Kingdom Chromista). J Mol Evol 2006, 62:388–420.
4. Swiecki TJ, Donald M: Histology of chrysanthemum roots exposed to salinity stress and Phytophthora cryptogea. Can J Bot 1988, 66:280–288.
5. Dale ML, Irwin JAG: Stomata as an infection court for Phytophtora megasperma f. sp. medicaginis in chickpea and a histological study of infection. Phytopathology 1991, 91:375–379.
6. Enkerli K, Hahn MG, Mims CW: Ultrastructure of compatible and incompatible interactions of soybean roots infected with the plant pathogenic oomycete Phytophthora sojae. Can J Bot 1997, 75:1493–1508.
7. Widmer TL, Graham JH, Mitchell DJ: Histological Comparison of Fibrous Root Infection of Disease-Tolerant and Susceptible Citrus Hosts by Phytophthora nicotianae and P. palmivora. Phytopathology 1998, 88:389–395.
8. Kebdani N, Pieuchot L, Deleury E, Panabieres F, Le Berre JY, Gourgues M: Cellular and molecular characterization of Phytophthora parasitica appressorium-mediated penetration. New Phytol 2010, 185:248–257.
9. Bircher U, Hohl HR: Environmental signalling during induction of appressorium formation in Phytophthora. Mycol Res 1997, 101:395–402.
10. Bircher U, Hohl HR: A role for calcium in appressorium induction in Phytophthora palmivora. Bot Helv 1999, 109:55–65.
11. Grenville-Briggs LJ, Anderson VL, Fugelstad J, Avrova AO, Bouzenzana J, Williams A, Wawra S, Whisson SC, Birch PR, Bulone V, van West P: Cellulose Synthesis in Phytophthora infestans Is Required for Normal Appressorium Formation and Successful Infection of Potato. Plant Cell 2008, 20(6):1725.

12. Avrova AO, Boevink PC, Young V, Grenville-Briggs LJ, van West P, Birch PR, Whisson SC: A novel Phytophthora infestans haustorium-specific membrane protein is required for infection of potato. Cell Microbiol 2008, 10:2271–2284.
13. Blanco FA, Judelson HS: A bZIP transcription factor from Phytophthora interacts with a protein kinase and is required for zoospore motility and plant infection. Mol Microbiol 2005, 56:638–648.
14. Li A, Wang Y, Tao K, Dong S, Huang Q, Dai T, Zheng X, Wang Y: PsSAK1, a stress-activated MAP kinase of Phytophthora sojae, is required for zoospore viability and infection of soybean. Mol Plant Microbe Interact 2010, 23:1022–1031.
15. Krämer R, Freytag S, Schmelzer E: In vitro formation of infection structures of Phytophthora infestans is associated with synthesis of stage specific polypeptides. Eur J Plant Pathol 1997, 103:43–53.
16. Grenville-Briggs LJ, Avrova AO, Bruce CR, Williams A, Whisson SC, Birch PR, van West P: Elevated amino acid biosynthesis in Phytophthora infestans during appressorium formation and potato infection. Fungal Genet Biol 2005, 42:244–256.
17. Ebstrup T, Saalbach G, Egsgaard H: A proteomics study of in vitro cyst germination and appressoria formation in Phytophthora infestans. Proteomics 2005, 5:2839–2848.
18. Grenville-Briggs LJ, Avrova AO, Hay RJ, Bruce CR, Whisson SC, van West P: Identification of appressorial and mycelial cell wall proteins and a survey of the membrane proteome of Phytophthora infestans. Fungal Biol 2010, 114:702–723.
19. Judelson HS, Ah-Fong AM, Aux G, Avrova AO, Bruce C, Cakir C, da Cunha L, Grenville-Briggs L, Latijnhouwers M, Ligterink W, Meijer HJ, Roberts S, Thurber CS, Whisson SC, Birch PR, Govers F, Kamoun S, van West P, Windass J: Gene expression profiling during asexual development of the late blight pathogen Phytophthora infestans reveals a highly dynamic transcriptome. Mol Plant Microbe Interact 2008, 21:433–447.
20. Ye W, Wang X, Tao K, Lu Y, Dai T, Dong S, Dou D, Gijzen M, Wang Y: Digital gene expression profiling of the Phytophthora sojae transcriptome. Mol Plant Microbe Interact 2011, 24:1530–1539.
21. Jupe J, Stam R, Howden AJ, Morris JA, Zhang R, Hedley PE, Huitema E: Phytophthora capsici-tomato interaction features dramatic shifts in gene expression associated with a hemi-biotrophic lifestyle. Genome Biol 2013, 14:R63.
22. Attard A, Gourgues M, Galiana E, Panabieres F, Ponchet M, Keller H: Strategies of attack and defense in plant-oomycete interactions, accentuated for Phytophthora parasitica Dastur (syn. P. Nicotianae Breda de Haan). J Plant Physiol 2008, 165:83–94.
23. Attard A, Gourgues M, Callemeyn-Torre N, Keller H: The immediate activation of defense responses in Arabidopsis roots is not sufficient to prevent Phytophthora parasitica infection. New Phytol 2010, 187:449–460.

24. Galiana E, Riviere MP, Pagnotta S, Baudouin E, Panabieres F, Gounon P, Boudier L: Plant-induced cell death in the oomycete pathogen Phytophthora parasitica. Cell Microbiol 2005, 7:1365–1378.
25. Pillitteri LJ, Peterson KM, Horst RJ, Torii KU: Molecular Profiling of Stomatal Meristemoids Reveals New Component of Asymmetric Cell Division and Commonalities among Stem Cell Populations in Arabidopsis. Plant Cell 2011, 23:3260–3275.
26. Laroche-Raynal M, Aspart L, Delseny M, Penon P: Characterization of radish mRNA at three developmental stages. Plant Sci 1984, 35:139–146.
27. Panabières F, Anselem J, Galiana E, Le Berre J-Y: Gene identification in the oomycete pathogen Phytophthora parasitica during in vitro vegetative growth through Expressed sequence tags (ESTs). Fungal Genet Biol 2005, 42:611–623.
28. Shan W, Marshall JS, Hardham AR: Gene expression in germinated cysts of Phytophthora nicotianae. Mol Plant Pathol 2004, 5:317–330.
29. Skalamera D, Wasson AP, Hardham AR: Genes expressed in zoospores of Phytophthora nicotianae. Mol Genet Genomics 2004, 270:549–557.
30. Le Berre JY, Engler G, Panabières F: Exploration of the late stages of the tomato-Phytophthora parasitica interactions through histological analysis and generation of expressed sequence tags. New Phytol 2008, 177:480–492.
31. Apweiler R, Attwood TK, Bairoch A, Bateman A, Birney E, Biswas M, Bucher P, Cerutti L, Corpet F, Croning MD, Durbin R, Falquet L, Fleischmann W, Gouzy J, Hermjakob H, Hulo N, Jonassen I, Kahn D, Kanapin A, Karavidopoulou Y, Lopez R, Marx B, Mulder NJ, Oinn TM, Pagni M, Servant F, Sigrist CJ, Zdobnov EM: The InterPro database, an integrated documentation resource for protein families, domains and functional sites. Nucleic Acids Res 2001, 29:37–40.
32. Gotz S, Garcia-Gomez JM, Terol J, Williams TD, Nagaraj SH, Nueda MJ, Robles M, Talon M, Dopazo J, Conesa A: High-throughput functional annotation and data mining with the Blast2GO suite. Nucleic Acids Res 2008, 36:3420–3435.
33. Simon A, Biot E: ANAIS: analysis of NimbleGen arrays interface. Bioinformatics 2010, 26:2468–2469.
34. Sturn A, Quackenbush J, Trajanoski Z: Genesis: Cluster analysis of microarray data. Bioinformatics 2002, 18:207–208.
35. Yan HZ, Liou RF: Selection of internal control genes for real-time quantitative RT-PCR assays in the oomycete plant pathogen Phytophthora parasitica. Fungal Genet Biol 2006, 43:430–438.
36. Livak KJ, Schmittgen TD: Analysis of relative gene expression data using real-time quantitative PCR and the 2(−Delta Delta C(T)) Method. Methods 2001, 25:402–408.

37. Earley KW, Haag JR, Pontes O, Opper K, Juehne T, Song K, Pikaard CS: Gateway-compatible vectors for plant functional genomics and proteomics. Plant J 2006, 45:616–629.
38. Evangelisti E, Govetto B, Minet-Kebdani N, Kuhn M-L, Attard A, Ponchet M, Panabières F, Gourgues M: The Phytophthora parasitica RXLR effector Penetration-Specific Effector 1 favours Arabidopsis thaliana infection by interfering with auxin physiology. New Phytol 2013, 199(2):476–489.
39. Whisson SC, Boevink PC, Moleleki L, Avrova AO, Morales JG, Gilroy EM, Armstrong MR, Grouffaud S, van West P, Chapman S, Hein I, Toth IK, Pritchard L, Birch PR: A translocation signal for delivery of oomycete effector proteins into host plant cells. Nature 2007, 450:115–118.
40. Oh YY, Donofrio N, Pan H, Coughlan S, Brown DE, Meng S, Mitchell T, Dean RA: Transcriptome analysis reveals new insight into appressorium formation and function in the rice blast fungus Magnporthe orizae. Genome Biol 2008, 9:R85. doi:10.1186/gb-2008-9-5-r85.
41. O’Connell RJ, Thon MR, Hacquard S, Amyotte SG, Kleemann J, Torres MF, Damm U, Buiate EA, Epstein L, Alkan N, Altmüller J, Alvarado-Balderrama L, Bauser CA, Becker C, Birren BW, Chen Z, Choi J, Crouch JA, Duvick JP, Farman MA, Gan P, Heiman D, Henrissat B, Howard RJ, Kabbage M, Koch C, Kracher B, Kubo Y, Law AD, Lebrun M-H, et al: Lifestyle transitions in plant pathogenic Colletotrichum fungi deciphered by genome and transcriptome analyses. Nat Genet 2012, 44:1060–1065.
42. Wang Q, Han C, Ferreira AO, Yu X, Ye W, Tripathy S, Kale SD, Gu B, Sheng Y, Sui Y, Wang X, Zhang Z, Cheng B, Dong S, Shan W, Zheng X, Dou D, Tyler BM, Wang Y: Transcriptional programming and functional interactions within the Phytophthora sojae RXLR effector repertoire. Plant Cell 2011, 23:2064–2086.
Additional files
Additional_file_1 as JPEG Additional file 1: Figure S1 Pipeline used for sequence clustering, sequence origin determination and oligoarray design.
Additional_file_2 as TXT Additional file 2: Table S1 Clustering of P. parasitica EST sequences. Sequence composition of each contig as obtained with TGICL package is presented. Each contig was named CLxContigx, with x corresponding to the cluster and contig number.
Additional_file_3 as XLSX Additional file 3: Table S2 Functional annotation of the sequences. Predicted origin of the sequences is indicated together with BlastX result (E value < 1E-05) against the P. parasitica protein database (Broad Institute) and BlastX result (E value < 1E-05) against NCBI non-redundant (NR) protein database are presented together with GO annotations as proposed by blast2GO tool.

Additional_file_4 as XLSX Additional file 4: Table S3 Clustering of the expression patterns. Sequences contained in each expression profile clusters as obtained after K-mean clustering are presented. For all the sequences, normalized hybridization signal in each condition (mean of the two biological replicates), maximum fold change (max FC) observed between the different biological samples and BlastX best hit result (E value < 1E-05) against NCBI non-redundant (NR) protein database are indicated. For oligoarray hybridizations results, samples corresponded to mycelium grown in V8 medium (Myc), swimming zoospores (Zoo), samples enriched for appressoria differentiated on onion epidermis (App), and A. thaliana plantlets inoculated with P. parasitica zoospores and recovered at different time points of the infection : 2.5 h (appressorium-mediated penetration), 6 h (biotrophic growth, two to three cells invaded), 10 h (invasive growth along the stele) and 30 h (switch to necrotrophy).
Additional_file_5 as XLSX Additional file 5: Table S4 Validation of the transcriptome results and clustering analysis. mRNAs corresponding to sequences from clusters A to F were quantified by quantitative RT-PCR in samples corresponding to mycelium grown in V8 medium (Mycelium), swimming zoospores (Zoospores), samples enriched for appressoria differentiated on onion epidermis (Appressorium), and A. thaliana plantlets inoculated with P. parasitica zoospores at different time points of the infection : A. thaliana 2.5 hours after inoculation (appressorium-mediated penetration), A. thaliana 6 hours after inoculation (biotrophic growth, two to three cells invaded), A. thaliana 10 hours after inoculation (invasive growth along the stele), A. thaliana 30 hours after inoculation (switch to necrotrophy) and A. thaliana 4 days after inoculation (necrotrophy). Biological replicated are indicated as rep1 and rep2. Data are presented as expression ratios relative to UBC, WS21 and Mago Nashi reference genes (2 − _CT). nd: not detected. Colum “array validation” indicates if the expression values obtained following quantitative RT-PCR show the same variation as that observed following oligoarray hybridization. Yes (except XXX) is indicated if all but one condition are in agreement with oligoarray hybridization results. Columns “cluster validation”: indicates if the observed variation corresponds to the predicted variation within each cluster (k-mean clustering, Genesis program). → Cluster X indicates if, based on the qRT-PCR expression analysis, the sequence must be analyzed with a different cluster.
Additional_file_6 as XLSX Additional file 6: Table S5_I GO enrichment analysis of cluster. We estimated the differences between the observed number of sequences associated to GO terms in each cluster with expected number if randomly distributed. For each GO term, the number of sequences associated to this term in the cluster (column “occurrence in cluster”) and the number of sequences associated to this term represented on the array (column “occurrence on array”) are indicated. The total number of sequence represented in the cluster and on the oligoarray that were used for calculations of the frequencies, are mentioned (columns “sequences in cluster” and “sequences on array”). Fisher Exacts test was used to identify significant enrichment for individual GO terms. P-value of the test is indicated for each GO term. Column “sequences” indicated the names of each sequence with the corresponding GO term in the cluster.
Additional_file_7 as XLSX Additional file 7: Table S5_VI GO enrichment analysis of cluster VI.

Additional_file_8 as XLSX Additional file 8: Table S5_III GO enrichment analysis of cluster III.
Additional_file_9 as XLSX Additional file 9: Table S5_V GO enrichment analysis of cluster V.
Additional_file_10 as XLSX Additional file 10: Table S5_II GO enrichment analysis of cluster II.
Additional_file_11 as XLSX Additional file 11: Table S5_IV GO enrichment analysis of cluster IV.
My
c
Zo
o
Ap
p
2.5
h
6h
10
.5h
30
h
-3.0 1:1 3.0
I
VII
IX
IV
XI
X
II
VII
VIII
I
V
X
VI
III
XII
(V) n=94
(II) n=154
(XI) n=74 (XII) n=69
(VII) n=366
(VI) n=101
1
-1
-2
2
0
(VIII) n=70
1
-1
-2
2
0
(X) n=92
1
-1
-2
2
0
(IV) n=388(III) n=144
1
-1
-2
2
0
(IX) n=130
1
-1
-2
2
0
(I) n=124
1
-1
-2
2
0
My
c
Zo
o
Ap
p
2.5
h
6h
10
.5h
30
h
IV
My
c
Zo
o
Ap
p
2.5
h
6h
10
.5h
30
h
A. thaliana
inoculation
A. thaliana
inoculation
A. thaliana
inoculationA B
Figure 1

Figure 2

Figure 3

Figure 4

Additional files provided with this submission:
Additional file 1: 1064081282109808_add1.jpeg, 134Khttp://www.biomedcentral.com/imedia/5386545971340982/supp1.jpegAdditional file 2: 1064081282109808_add2.txt, 149Khttp://www.biomedcentral.com/imedia/1141048001340982/supp2.txtAdditional file 3: 1064081282109808_add3.xlsx, 568Khttp://www.biomedcentral.com/imedia/8807669051340982/supp3.xlsxAdditional file 4: 1064081282109808_add4.xlsx, 306Khttp://www.biomedcentral.com/imedia/1517694659134098/supp4.xlsxAdditional file 5: 1064081282109808_add5.xlsx, 26Khttp://www.biomedcentral.com/imedia/1417476871340982/supp5.xlsxAdditional file 6: 1064081282109808_add6.xlsx, 32Khttp://www.biomedcentral.com/imedia/1777425108134098/supp6.xlsxAdditional file 7: 1064081282109808_add7.xlsx, 35Khttp://www.biomedcentral.com/imedia/6497105461340982/supp7.xlsxAdditional file 8: 1064081282109808_add8.xlsx, 36Khttp://www.biomedcentral.com/imedia/2045142380134098/supp8.xlsxAdditional file 9: 1064081282109808_add9.xlsx, 22Khttp://www.biomedcentral.com/imedia/5451867881340982/supp9.xlsxAdditional file 10: 1064081282109808_add10.xlsx, 39Khttp://www.biomedcentral.com/imedia/3893312241340982/supp10.xlsxAdditional file 11: 1064081282109808_add11.xlsx, 83Khttp://www.biomedcentral.com/imedia/6304125913409821/supp11.xlsx
Copyright © 2022 FDOKUMEN