Design and fabrication of an on-chip PCR device.
121
April 2019
-
Upload
khangminh22 -
Category
Documents
-
view
0 -
download
0
Transcript of Design and fabrication of an on-chip PCR device.
Design and fabrication of an on-chip PCR
device.
by
G.H.C. Maybery
Thesis presented in partial ful�lment of the requirements for
the degree of Master of Engineering in Electronic Engineering
in the Faculty of Engineering at Stellenbosch University
Supervisor: Prof. W.J. Perold
April 2019
The �nancial assistance of the Council for Scienti�c and Industrial Research (CSIR) towards this researchis hereby acknowledged. Opinions expressed and conclusions arrived at, are those of the author and arenot necessarily to be attributed to the CSIR.
Declaration
By submitting this thesis electronically, I declare that the entirety of the workcontained therein is my own, original work, that I am the sole author thereof(save to the extent explicitly otherwise stated), that reproduction and pub-lication thereof by Stellenbosch University will not infringe any third partyrights and that I have not previously in its entirety or in part submitted it forobtaining any quali�cation.
April 2019Date: . . . . . . . . . . . . . . . . . . . . . . . . . . . . . . .
Copyright © 2019 Stellenbosch University All rights reserved.
i
Stellenbosch University https://scholar.sun.ac.za
Abstract
Design and fabrication of an on-chip PCR device.G.H.C Maybery
Thesis:
April 2019
An investigation into micro�uidic-based PCR (Polymerase Chain Reactiondevices was conducted. A continous-�ow serpentine-channel device was fabri-cated. Channels were etched on a Poly(methyl methacrylate (PMMA sub-strate using CO2 laser ablation and channels with dimensions 150 × 150µmwere obtained. A PMMA lid was bonded via thermal-assisted solvent bondingusing Isopropanol. An in-house external connection schema was fabricatedfor �uid inlet and outlet ports and pressure driven �ow was achieved using abenchtop syringe pump. Notable ampli�cation of a 250bp ( NisinA fragmentwas achieved within 30 minutes, a �nal concentration of 1.5 µg/L was de-tected. The relationship between �ow rates, temperature zone residency timesand ampli�cation e�ciency was examined. This device serves as a proof-of-concept for two purposes, to show that fabrication of micro�uidic devices canbe accomplished in low-tech lab spaces and to provide a roadmap towards thedesign of a fully-portable, low cost PCR device.
ii
Stellenbosch University https://scholar.sun.ac.za
Uittreksel
G.H.C Maybery
Tesis:
April 2019
'n Ondersoek na mikro-uidiese-gebaseerde PCR (Polimerase Kettingreak-sie toestelle was uitgevoer. 'n Deurlopende-serpentine-kanaal toestel was ver-vaardig. Kanale was geëts op 'n Poly (methylmethacrylaat (PMMA sub-straat met CO2 laser ablasie en kanale met afmetings 150x150µm was behaal.'n PMMA-deksel was gebind deur middel van hitte-geassisteerde oplosmiddelbindinggebruik Isopropanol. 'N interne eksterne konneksie skema was ver-vaardig vir inlaat en uitlaat poorte en druk gedrewe was behaal met behulpvan a spuitbuisprop. Merkbare ampli�kasie van 'n 250bp (NisinA fragmentwas binne 30 minute bereik, 'n nal konsentrasie van 1.5µg/L was opgespoor.Die verhouding tussen ow tariewe, temperatuursone verblyf tye en amptelikekategese was ondersoek. Hierdie toestel dien as 'n bewys van konsepte virtwee doeleindes, om aan te toon dat vervaardiging van mikro uidiese toestellekan word behaal in lae-tegnologie laboratoriumruimtes en 'n padkaart na dieontwerp van 'n vol draagbare, laekoste-PCR-toestel.
iii
Stellenbosch University https://scholar.sun.ac.za

Acknowledgements
I would like to express my sincere gratitude to the following people and organ-isations.
Firstly, my parents, without whom I would'nt have been where I am today.Their love and support is unconditional and honestly I am forever greatful.Thanks Mom and Dad, I'm �nally done.
Secondly, Professor Willem J. Perold for his continued support and guidance.Prof Perold is always willing to discuss concepts and o�er his valuable input ona subject, his infectious positivity made the entire process far more bearable.Thanks Prof for all the help over the years.
Thirdly, to my research group. Thank you for all the input and advice givenon my project, some of which was implemented in the �nal product. I wishyou all the best and hope we will stay in contact.
Prof Leon Dicks for tolerating my engineer self in the microbiology lab. Thankyou for allowing me to work in your lab, without which I would not have beenable to complete the biological side of my project.
Lastly to anyone I missed, you know who you are. To the people closest tome, Deon Nevelling, Joshua Hensberg, Robey Beswick, Jonathan Humphriesand Philippa Dietmann. All the late nights listening to my babbling aboutmy project did not go unnoticed. Thanks for all the good times, there will bemany more.
iv
Stellenbosch University https://scholar.sun.ac.za
Contents
Declaration i
Abstract ii
Uittreksel iii
Acknowledgements iv
Contents v
List of Figures viii
List of Tables x
Nomenclature xi
1 Introduction 11.1 Background . . . . . . . . . . . . . . . . . . . . . . . . . . . . . 11.2 Motivation . . . . . . . . . . . . . . . . . . . . . . . . . . . . . . 21.3 Literature synopsis . . . . . . . . . . . . . . . . . . . . . . . . . 31.4 Objectives of the investigation . . . . . . . . . . . . . . . . . . . 51.5 Contributions made . . . . . . . . . . . . . . . . . . . . . . . . . 61.6 Summary . . . . . . . . . . . . . . . . . . . . . . . . . . . . . . 61.7 Brief Chapter overview . . . . . . . . . . . . . . . . . . . . . . . 7
2 Literature Review 82.1 Micro�uidics . . . . . . . . . . . . . . . . . . . . . . . . . . . . . 8
2.1.1 Introduction . . . . . . . . . . . . . . . . . . . . . . . . . 82.1.2 Micro�uidics fundamentals . . . . . . . . . . . . . . . . . 8
2.1.2.1 Physics at the micro scale . . . . . . . . . . . . 92.1.2.2 Low Reynold's numbers . . . . . . . . . . . . . 92.1.2.3 Capillarity . . . . . . . . . . . . . . . . . . . . . 102.1.2.4 Electro-osmotic �ow . . . . . . . . . . . . . . . 112.1.2.5 Dielectrophoresis . . . . . . . . . . . . . . . . . 122.1.2.6 Electrowetting . . . . . . . . . . . . . . . . . . 12
v
Stellenbosch University https://scholar.sun.ac.za
CONTENTS vi
2.1.2.7 Micro�uidics and thermal transfers . . . . . . . 132.1.3 Conclusion . . . . . . . . . . . . . . . . . . . . . . . . . . 14
2.2 Fabrication and bonding of micro�uidic substrates . . . . . . . . 152.2.1 Substrate channel fabrication and bonding techniques . . 15
2.2.1.1 Silicon/Glass . . . . . . . . . . . . . . . . . . . 152.2.1.2 Polymer/Thermoplastics . . . . . . . . . . . . . 182.2.1.3 Fabrication Techniques . . . . . . . . . . . . . . 192.2.1.4 Bonding techniques . . . . . . . . . . . . . . . . 22
2.3 PCR micro�uidics . . . . . . . . . . . . . . . . . . . . . . . . . . 242.3.1 Introduction . . . . . . . . . . . . . . . . . . . . . . . . . 242.3.2 The Polymerase Chain Reaction . . . . . . . . . . . . . . 25
2.3.2.1 DNA . . . . . . . . . . . . . . . . . . . . . . . . 252.3.2.2 Enzymes . . . . . . . . . . . . . . . . . . . . . 252.3.2.3 The PCR process . . . . . . . . . . . . . . . . . 27
2.3.3 PCR micro�uidic designs . . . . . . . . . . . . . . . . . . 272.3.3.1 Stationary chamber PCR . . . . . . . . . . . . 282.3.3.2 Continuous Flow . . . . . . . . . . . . . . . . . 302.3.3.3 Droplet PCR . . . . . . . . . . . . . . . . . . . 30
2.3.4 Temperature regulation . . . . . . . . . . . . . . . . . . . 312.3.4.1 Contact heating . . . . . . . . . . . . . . . . . . 312.3.4.2 Non-contact heating . . . . . . . . . . . . . . . 33
2.3.5 Flow control . . . . . . . . . . . . . . . . . . . . . . . . . 342.3.5.1 Common micro�uidic �ow control systems . . . 34
2.4 Conclusion . . . . . . . . . . . . . . . . . . . . . . . . . . . . . . 36
3 Design and fabrication 373.1 Design overview . . . . . . . . . . . . . . . . . . . . . . . . . . . 373.2 Heaters . . . . . . . . . . . . . . . . . . . . . . . . . . . . . . . 38
3.2.1 Physical con�guration . . . . . . . . . . . . . . . . . . . 383.3 Temperature Regulation . . . . . . . . . . . . . . . . . . . . . . 41
3.3.1 Circuit Schematic . . . . . . . . . . . . . . . . . . . . . . 423.3.2 Power supply calibration . . . . . . . . . . . . . . . . . . 42
3.4 Channel Fabrication . . . . . . . . . . . . . . . . . . . . . . . . 443.4.1 PMMA substrate . . . . . . . . . . . . . . . . . . . . . . 443.4.2 Laser ablation . . . . . . . . . . . . . . . . . . . . . . . . 453.4.3 Channel morphology testing . . . . . . . . . . . . . . . . 45
3.4.3.1 Speed tests . . . . . . . . . . . . . . . . . . . . 453.4.3.2 Power tests . . . . . . . . . . . . . . . . . . . . 47
3.4.4 Serpentine channel design . . . . . . . . . . . . . . . . . 503.4.5 Lid bonding . . . . . . . . . . . . . . . . . . . . . . . . . 513.4.6 External connections . . . . . . . . . . . . . . . . . . . . 533.4.7 Flow control . . . . . . . . . . . . . . . . . . . . . . . . . 53
3.5 Conclusion . . . . . . . . . . . . . . . . . . . . . . . . . . . . . . 53
Stellenbosch University https://scholar.sun.ac.za
CONTENTS vii
4 Testing methodology and results. 564.1 Introduction . . . . . . . . . . . . . . . . . . . . . . . . . . . . . 564.2 Heating calibration tests . . . . . . . . . . . . . . . . . . . . . . 56
4.2.1 Test Protocols . . . . . . . . . . . . . . . . . . . . . . . . 564.2.2 Temperature calibration on Peltier surfaces. . . . . . . . 574.2.3 Temperature calibration on steel heat dispersers. . . . . . 584.2.4 Temperature calibration with PCR chip . . . . . . . . . 59
4.3 Micro�uidics channel and transport. . . . . . . . . . . . . . . . . 614.3.1 Sample encapsulation. . . . . . . . . . . . . . . . . . . . 61
4.3.1.1 Samples in micro�uidic channels. . . . . . . . . 624.3.2 Flow rates. . . . . . . . . . . . . . . . . . . . . . . . . . 63
4.3.2.1 Theoretical calculations. . . . . . . . . . . . . . 634.3.2.2 Calculations using measured values. . . . . . . 644.3.2.3 Measured residency times. . . . . . . . . . . . . 644.3.2.4 Comparison between theoretical and actual �ow
rates/residency times. . . . . . . . . . . . . . . 664.4 DNA ampli�cation . . . . . . . . . . . . . . . . . . . . . . . . . 68
4.4.1 DNA test protocol: . . . . . . . . . . . . . . . . . . . . . 684.4.2 Ampli�cation results. . . . . . . . . . . . . . . . . . . . . 70
4.5 Conclusion . . . . . . . . . . . . . . . . . . . . . . . . . . . . . . 71
5 Conclusion 73
6 Future work and recommendations. 766.1 Evaluation of current implementation. . . . . . . . . . . . . . . 766.2 Proposed speci�cations for future design. . . . . . . . . . . . . . 776.3 Future development. . . . . . . . . . . . . . . . . . . . . . . . . 78
Appendices 80
A Technical drawings 81
B Datasheets 84
Bibliography 98
Stellenbosch University https://scholar.sun.ac.za
List of Figures
2.1 Potential distribution and resulting velocity pro�le from electroos-motic induced �ow [1]. . . . . . . . . . . . . . . . . . . . . . . . . . 11
2.2 Illustration regarding change in liquid contact angle after chargingof the dielectric . . . . . . . . . . . . . . . . . . . . . . . . . . . . . 13
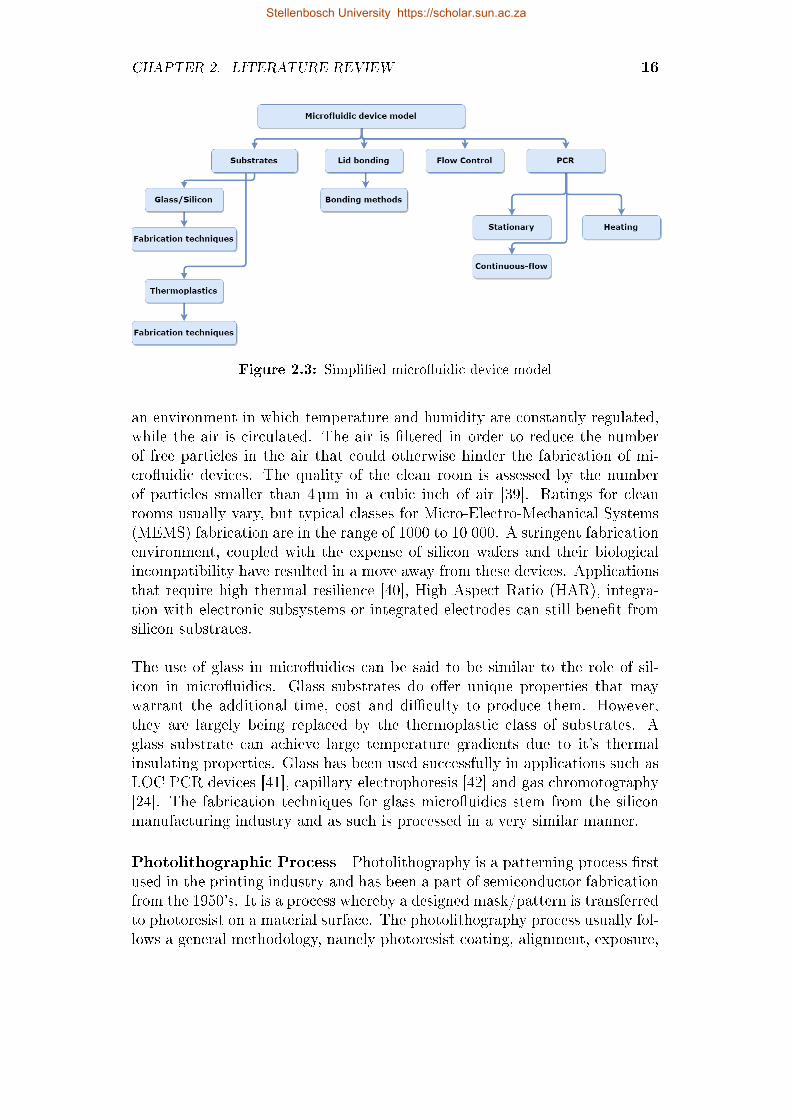
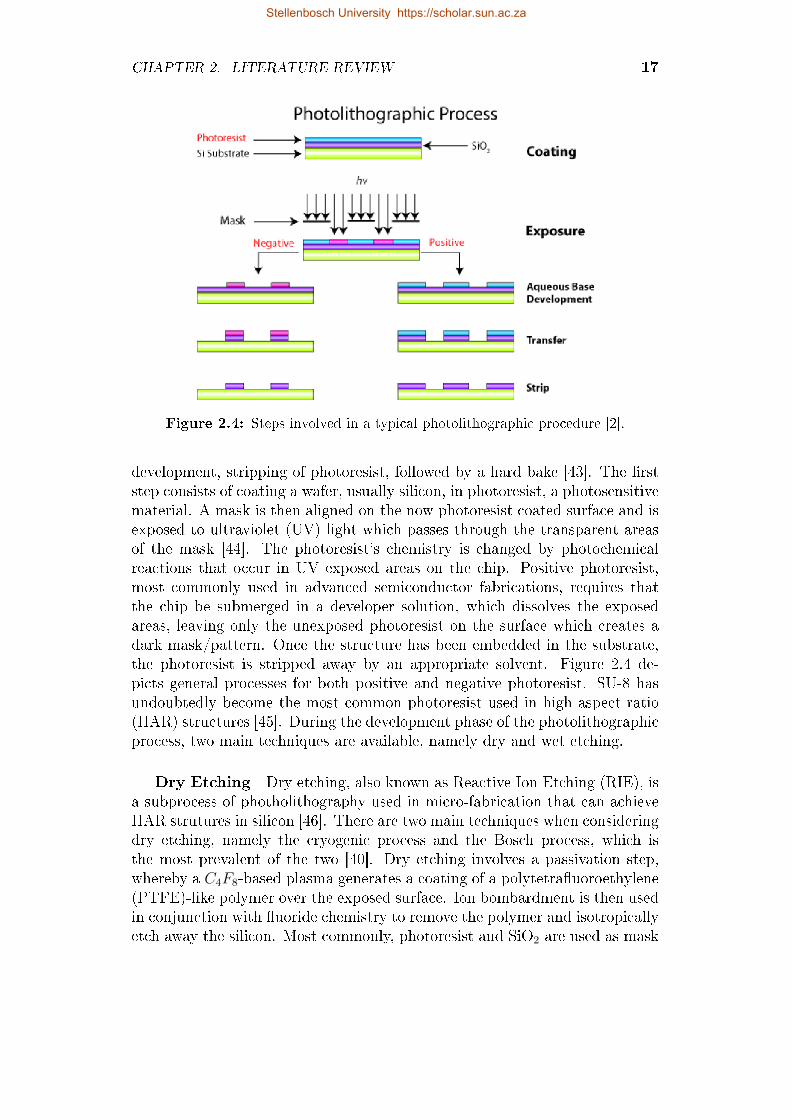
2.3 Simpli�ed micro�uidic device model . . . . . . . . . . . . . . . . . . 162.4 Steps involved in a typical photolithographic procedure [2]. . . . . . 172.5 Soft-lithography process. . . . . . . . . . . . . . . . . . . . . . . . . 202.6 Injection molding process [3]. . . . . . . . . . . . . . . . . . . . . . 212.7 Structure of DNA [4]. . . . . . . . . . . . . . . . . . . . . . . . . . . 262.8 Enzyme models [5] . . . . . . . . . . . . . . . . . . . . . . . . . . . 262.9 The PCR process cycles [6]. . . . . . . . . . . . . . . . . . . . . . . 282.10 The multi-chamber PCR chip produced by Matsubra et al, 2006 [7]. 292.11 Example of a serpentine channel PCR chip by Moschou et al.[8] . . 302.12 Two droplet based systems, namely (A) T-junction and (B) �ow
focusing [9]. . . . . . . . . . . . . . . . . . . . . . . . . . . . . . . . 322.13 A custom built re-entrant microwave cavity operating at 8 GHz [10]. 332.14 Fluid control systems employed in micro�uidics research [11]. . . . . 342.15 Micro�uidic Dual Programmable Syringe Pump 11 Pico Plus Elite
(Darwin Micro�uidics). . . . . . . . . . . . . . . . . . . . . . . . . 35
3.1 Peltier heaters obtained from RS-ZA (40x40 mm) . . . . . . . . . . 383.2 CAD representation of base with aluminum sheet. . . . . . . . . . . 393.3 CAD representation of aluminum sheets with Peltier elements (black)
placed on top. . . . . . . . . . . . . . . . . . . . . . . . . . . . . . . 393.4 CAD representation of aluminum sheets increasing heating area in
comparison with Figure 3.3 . . . . . . . . . . . . . . . . . . . . . . 403.5 CAD representation of aluminum sheets and bolts extruding from
base. . . . . . . . . . . . . . . . . . . . . . . . . . . . . . . . . . . . 403.6 CAD representation of device con�guration with micro�uidics chip
(black) in place. . . . . . . . . . . . . . . . . . . . . . . . . . . . . . 413.7 CAD representation of the entire device con�guration. . . . . . . . 413.8 Image of W1209 digital thermostat used for temperature control of
Peltier elements. . . . . . . . . . . . . . . . . . . . . . . . . . . . . 42
viii
Stellenbosch University https://scholar.sun.ac.za
LIST OF FIGURES ix
3.9 Circuit schematic for thermo-controller/Peltier coupling. Powersupply values are representative of the maximum source values re-quired. . . . . . . . . . . . . . . . . . . . . . . . . . . . . . . . . . . 43
3.10 Peltier device heat pattern, with temperature set at 57.5°C. . . . . 433.11 Peltier device heat pattern, with temperature set at 72°C. . . . . . 443.12 Peltier device heat pattern, with temperature set at 95°C. . . . . . 443.13 Images displaying channel morphology (depth, width) for varying
laser speeds. . . . . . . . . . . . . . . . . . . . . . . . . . . . . . . . 463.14 Images displaying channel morphology (depth, width) for varying
laser power settings. . . . . . . . . . . . . . . . . . . . . . . . . . . 483.15 Channel dimensions variances (µm2). . . . . . . . . . . . . . . . . . 493.16 Final channel geometry based on optimized laser parameters. . . . . 493.17 Schematic of the channel geometry, designed within RDWorkz. . . . 503.18 Schematic of the channel geometry, temperature zones indicated by
colored areas. . . . . . . . . . . . . . . . . . . . . . . . . . . . . . . 513.19 Tubing inserted into connections points. Epoxy (Quickset) can be
seen surrounding the connection point. . . . . . . . . . . . . . . . . 533.20 The NE-300 syringe pump used (New Era Pump Systems, Inc). . . 543.21 An image of the fabricated device with the micro�uidics chip in place. 55
4.1 Peltier device heat pattern, with temperature set at 91°C. . . . . . 574.2 Heat patterns for temperature measured on "hot" Peltier surface. . 584.3 Heat patterns for temperature measured on steel heat dispersers. . 594.4 PMMA micro�uidic chip measured temperature pattern. Temper-
atures set for 95°C, 57°C and 72°C, respectively. . . . . . . . . . . . 604.5 PMMA micro�uidic chip measured temperature pattern with val-
ues. Temperatures set for 95°C, 57°C and 72°C, respectively. . . . . 604.6 Temperature pattern at channel depth with calculated values. Tem-
peratures set for 95°C, 57°C and 72°C, respectively. . . . . . . . . . 614.7 Image of a liquid sample (top left) encapsulated in the micro�uidic
channel. . . . . . . . . . . . . . . . . . . . . . . . . . . . . . . . . . 624.8 Image of small volume liquid sample in channel (indicated). The
top 3 channels also contain liquid. . . . . . . . . . . . . . . . . . . . 634.9 Length of temperature zones. . . . . . . . . . . . . . . . . . . . . . 654.10 Depiction of temperature zones with a channel indicated in black. . 664.11 Theoretical vs. actual Reynold's numbers. . . . . . . . . . . . . . . 674.12 Theoretical vs. actual �ow through times. . . . . . . . . . . . . . . 674.13 Optimal temperature zone residency times for the Q5 polymerase. . 694.14 Concentration post ampli�cation for respective �ow rates. . . . . . 71
Stellenbosch University https://scholar.sun.ac.za
List of Tables
2.1 Table summarizing the physical properties of polymers commonlyused in micro�uidics [12]. . . . . . . . . . . . . . . . . . . . . . . . 19
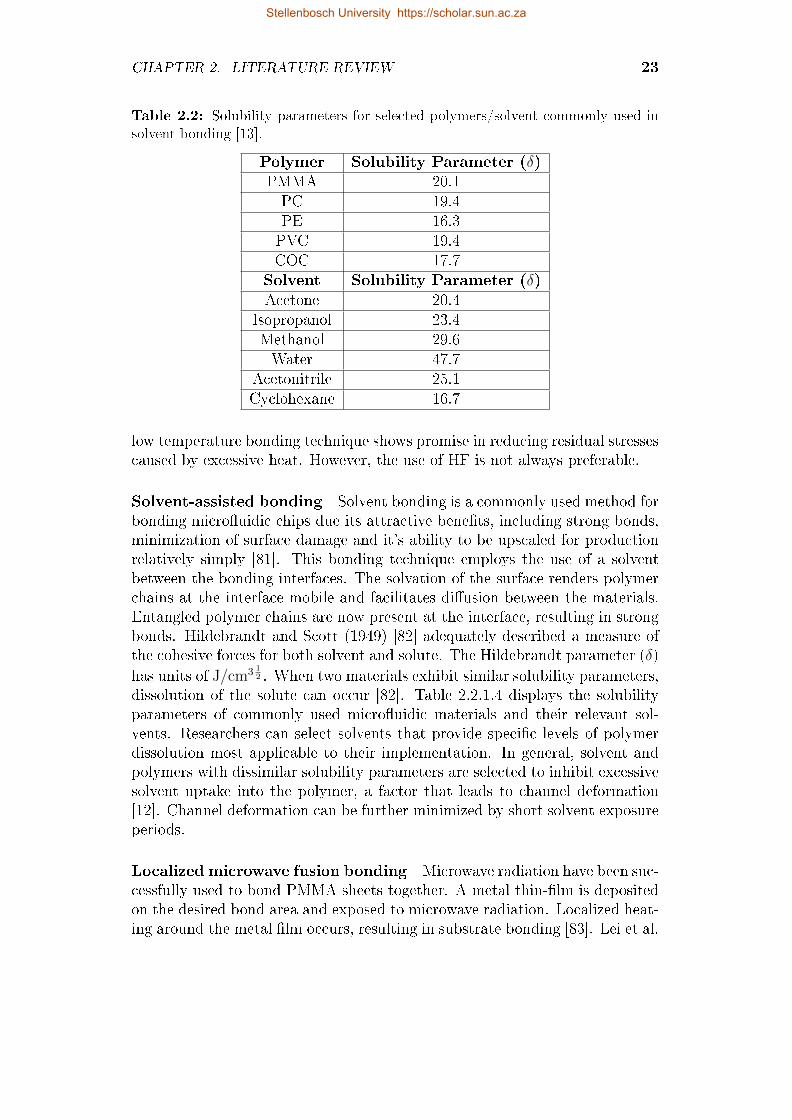
2.2 Solubility parameters for selected polymers/solvent commonly usedin solvent bonding [13]. . . . . . . . . . . . . . . . . . . . . . . . . . 23
3.1 Laser parameters used to investigate the relationship between speedand channel geometry. . . . . . . . . . . . . . . . . . . . . . . . . . 47
3.2 Laser parameters used to investigate the relationship between chan-nel morphology and power parameters. . . . . . . . . . . . . . . . . 47
4.1 Theoretically calculated values of average velocity and total �owthrough time. . . . . . . . . . . . . . . . . . . . . . . . . . . . . . . 64
4.2 Theoretical Reynold's numbers for varying �ow rates. . . . . . . . . 644.3 Calculated average linear velocity using measured values. . . . . . . 644.4 Actual Reynold's numbers for varying �ow rates. . . . . . . . . . . 654.5 Residency times (seconds) per cycle for �ow rates (mm/s) . . . . . 664.6 Comparison of �ow rates, total reaction time and ampli�cation con-
centrations. . . . . . . . . . . . . . . . . . . . . . . . . . . . . . . . 714.7 Comparison of �ow rates, ampli�cation concentrations and stan-
dard error of the mean(SEM). . . . . . . . . . . . . . . . . . . . . . 724.8 Residency times (seconds) per cycle for �ow rates (µL/second) . . . 72
6.1 Future design speci�cation for a portable PCR device. . . . . . . . 78
x
Stellenbosch University https://scholar.sun.ac.za
Nomenclature
Abbreviations
LOC Lab-on-chip
PCR Polymerase Chain Reaction
HIV Human Immunode�ciency Virus
AIDS Acquired Immune De�ciency Syndrome
POC Point-of-care
SVR Surface to volume ratio
OTS O� the shelf
PDMS Polydimethylsiloxane
PMMA Poly(methyl methacrylate)
PC Polycarbonate
µTAS Micro Total Analysis Systems
EWOD Electrowetting-on-dielectric
DEP Dielectrophoresis
MEMS Micro-Electro-Mechanical Systems
HAR High aspect ratio
RIE Reactive ion etching
HF Hydro�uoric acid
Variables
q Local heat �ux density . . . . . . . . . . . . . . . . . . . . [W/M2 ]
k Thermal conductivity . . . . . . . . . . . . . . . . . . . . . [W/M·K ]
T Temperature . . . . . . . . . . . . . . . . . . . . . . . . . . . [ K ]
Q Thermal energy . . . . . . . . . . . . . . . . . . . . . . . . . [ J ]
Cth Speci�c heat . . . . . . . . . . . . . . . . . . . . . . . . . . . [ J/K·kg ]γ Surface tension . . . . . . . . . . . . . . . . . . . . . . . . . [ N/m ]
θt Contact angle with channel top . . . . . . . . . . . . . . . [ rad/m ]
θr Contact angle with channel right side . . . . . . . . . . . [ rad/m ]
θb Contact angle with channel bottom . . . . . . . . . . . . [ rad/m ]
xi
Stellenbosch University https://scholar.sun.ac.za

NOMENCLATURE xii
θl Contact angle with channel left side . . . . . . . . . . . . [ rad/m ]
σsv Surface energy solid-vapour . . . . . . . . . . . . . . . . . . [ J/m2 ]
σsl Surface energy solid-liquid . . . . . . . . . . . . . . . . . . [ J/m2 ]
σlv Surface energy liquid-vapour . . . . . . . . . . . . . . . . . [ J/m2 ]
θY oung Young contact angle . . . . . . . . . . . . . . . . . . . . [ rad/m ]
ε Dielectric constant . . . . . . . . . . . . . . . . . . . . . . . [W/M2 ]
η Dimensionless electrowetting number . . . . . . . . . . . . [ ]
Stellenbosch University https://scholar.sun.ac.za
Chapter 1
Introduction
The contents of this chapter provide an overview of the investigation intoportable analytical devices, with speci�c reference to Polymerase Chain Re-action (PCR) devices based on micro�uidic concepts. Relevant backgroundknowledge is presented alongside the motivation for such devices. Brie�y, mi-cro�uidics is presented as a basis for portable analytical devices and its bene�tsto this category of devices are discussed. The PCR is presented as a meansfor disease diagnostics and current implementations are discussed. A litera-ture synopsis is provided to outline the theme of the investigation, relevantliterature is presented and critically examined. The goals and objectives ofthis investigation are de�ned to ensure a benchmark on which to judge theoutcome of this thesis. A general overview of the contributions made by thiswork are presented and principal results put forth. The structure of the thesiswill be brie�y outlined to provide an insight into the �ow of this investigation.
1.1 Background
It was written in Nature that 'micro�uidics has the potential to in�uencesubject areas from chemical synthesis and biological analysis to optics andinformation technology' [14]. Micro�uidics is the science and study of liquidsin the submilliliter range. At this length of scale liquids display interestingproperties in comparison to their macro counterparts. At the micron range,�uids within channels can be manipulated more predictability due to di�er-ent temporal-spatial properties such as low Reynold's numbers (laminar �ow),capillary force's dominance over gravity and surface and interfacial tension.This allows for the production of devices capable of accurately manipulatingmicroliter (10−6) down to the picoliter (10−12)L volumes. Applications includea number of tasks, such as performing rapid PCR [15, 10, 16, 17, 18, 19], form-ing mono-disperse droplets in �uid streams [20] and passively pumping �uidsin microchannels [21].
1
Stellenbosch University https://scholar.sun.ac.za
CHAPTER 1. INTRODUCTION 2
One application which shows particular promise in the micro�uidics regionis the Polymerase Chain Reaction (PCR), a precursory step to many diagnos-tic and analytical procedures. The PCR reaction ampli�es sequences of genesthrough a thermo-circulatory process whereby a DNA fragment is exposed to3 unique temperatures, in the presence of polymerase, nucleotides and othernecessary reagents. Once the sample has been exposed to these cycled tem-peratures, usually from 20-40 cycles, the genetic sequence will be ampli�ed.Conventional PCR machines are large pieces of instrumentation and it is highlyunlikely one would �nd such a device in rural areas. PCR on-chip devices canbe fully portable, which would allow for more complex analytical proceduresto be performed in an in-�eld environment. This could help alleviate the di-agnostic burdens faced by these communities.
1.2 Motivation
The need for portable, reliable and inexpensive disease testing solutions is anissue that still needs to be solved. Rural areas that lack access to sophisticatedmedical treatment and diagnostic centers can bene�t through the provision ofportable disease diagnostic equipment. South Africa su�ers from the largestHIV epidemic in the world, with HIV prevalence being as high as 18.9% in thepopulation [22]. An estimated 7.2 million people were living with AIDS/HIVin 2017 in South Africa. Governmental spending was reported at R 2 billionfor this time period. These numbers are showing improvement, however, muchcan still be done to aid in the battle against such diseases [23].
There are a number of genes that can a�ect the course of the HIV infection ina patient. Genetic mutations have been linked to protein defects (CCR5 delta32) and HIV drug resistances [24]. Genetic testing can be performed to detectthe presence of these genes which could improve patient prognosis.
Diagnosis is not the primary purpose PCR devices, although portable PCRdevices do show great promise for in-�eld use. The improvements that mi-cro�uidics o�er over conventional machinery such as improved reaction timesand reduction in reagent volumes, warrant it's inclusion into laboratory envi-ronments.
Over the last 20 years an increasing amount of research has been focusedon the production of Lab-on-Chip devices (LOC). These devices, in theory,are capable of performing a number of complex analytical laboratory proce-dures on a miniaturized platform. These devices are manufactured, not onlyin an e�ort to reduce size, cost and complexity of such procedures, but also
Stellenbosch University https://scholar.sun.ac.za
CHAPTER 1. INTRODUCTION 3
to provide a portable solution to those a�ected by diseases in areas lackingdiagnostic infrastructure.
The PCR reaction is an analytical procedure that is capable of amplifyingDNA from a single strand to billions of copies. This procedure can be deemedthe "revolutionary" discovery within the �eld of genetics. Through the use ofthis technique researchers and medical technicians can study DNA fragmentsamples with increased ease. The introduction of the LOC variant of PCR hasprovided a number of bene�ts over traditional methodology. Conventionally,PCR is performed by a device known as a thermal-cycler, a large laboratorybased piece of equipment. These devices can typically take anywhere between120-180 minutes to complete a reaction. Micro�uidic PCR devices have re-ported ampli�cation times within 30 minutes, a signi�cant reduction whencompared to traditional machinery. This reduction in time, coupled with theirportability, point towards the possibility of being used as Point-of-Care (POC)devices to aid in rapid diagnosis of diseases.
The need for POC disease diagnostic devices is evident. These devices notonly o�er improved response times and reduced costs, their portability allowsthem to provide diagnostic solutions for those lacking access. The motivationfor this project is to aid research into these portable LOC devices, speci�callyto provide a micro�uidics PCR system that could be used in-�eld. The deviceitself should conform to low cost, simple operation and portability criteria asto achieve it's goal of alleviating the diagnostic burden faced by those in ru-ral areas. Secondly, the device should aim to improve on conventional PCRequipment and serve as an investigation into the possibility of acting as areplacement device.
1.3 Literature synopsis
Relevant literature pertaining to micro�uidics device fabrication, with speci�creference to PCR implementations, was reviewed. The review details funda-mental micro�uidic laws and discusses their applicability to device design. Theevolution of micro�uidic fabrication technologies was studied, from their initialfabrication on glass/silicon substrates to the more recent use of thermoplasticsas an alternative material. An investigation into current implementations ofmicro�uidic PCR devices was performed and presented.
Micro�uidics has it's own set of constraints when compared to it's macro coun-terpart. Volumes of liquid encapsulated in micro/nano-scale channels displayinteresting properties, properties that have been leveraged to fabricate mi-cro�uidic devices. Due to the increased surface to volume ratio (SVR) at thisscale, interfaces tend to play a larger role. Capillary forces become dominant
Stellenbosch University https://scholar.sun.ac.za
CHAPTER 1. INTRODUCTION 4
over gravitational forces, Reynold's numbers tend to fall within the laminarregion allowing for concise control, molecular di�usion forms more predictablepatterns and due to the reduced volume of liquids, a reduced thermal massis noted, allowing for rapid heating of samples. It is these and other proper-ties of micro�uidics that researchers have harnessed to fabricate a plethora ofmicro-devices.
Fabrication of micro�uidic devices is possible through a number of techniques.During it's initial phase, considerable research was focused on the use of glassand silicon as substrates on which to fabricate channels. Techniques commonlyused included dry and wet etching procedures, usually involving a maskingprocess followed by a photo-lithographic step after which, the pattern revealedthrough a form of exposure. In recent years focus has shifted from glass/siliconsubstrates to thermoplastics. This class of materials o�ers some attractive ad-vantages to micro�uidic fabrication, such as rapid prototyping, good biocom-patability and their cost when compared to traditional substrates.
The use of micro�uidics to implement PCR devices has been reported fora number of years. The reduction in volume of analytes and reagants notonly leads to reduced costs, but the reduced thermal mass allows for far morerapid heating and cooling of samples, which has led to greatly reduced reac-tion times. Micro�uidic PCR devices can be categorized into two main types,namely stationary and continuous. Stationary PCR involves loading of thesample into discrete wells, which are then exposed to the appropriate temper-ature cycles. Contrastingly, continuous-�ow PCR makes use of a "time-space"principle, whereby temperature zones remain stationary and the sample vol-ume is driven through channels across the temperature regions on the chip.
A number of continous-�ow PCR implementations have been proposed, whichinclude serpentine channel �ow, oscillatory �ow and centrifugal driven �ow.A vast number of materials have been investigated as the substrate for suchdevices and each category of substrate has within it a number of fabricationtechniques. Polymer substrates allow for relatively simple fabrication proce-dures, a feat that aids in rapid prototyping of multiple channel geometries.Lid bonding is an essential step in the construction process and a number oftechniques exist to achieve air-tight bonds, each with their own pitfalls, caveatsand bene�ts. Samples are driven through the channels by a variety of methods.Syringe pumps are commonly used to create a pressure-driven �ow, however,alternatives such as peristaltic pumps, electro-osmotic �ow and others exist.
Micro�uidics, as a whole, is presented in the literature, focusing on the de-velopment of portable PCR-devices. Current fabrication methodologies wereinvestigated and are discussed.
Stellenbosch University https://scholar.sun.ac.za
CHAPTER 1. INTRODUCTION 5
1.4 Objectives of the investigation
The following is a list of objectives for the investigation:
� Brie�y overview a number of relevant micro�uidics operation principles.
� Review the generalized construction process of micro�uidics devices.
� Investigate current literature with regards to portable PCR-devices.
� Determine the most relevant category of PCR device to be constructed.
� Propose a substrate to be used for the micro�uidics channels, based onliterature.
� Review heating techniques used in micro�uidic devices.
� Design a micro�uidics network for a PCR device.
� Decide upon a relevant heating approach and design its implementation.
� Investigate �ow control in micro�uidics devices and decide upon a rele-vant implementation.
� Review lid bonding methods for micro�uidics devices and decide upon atechnique to be used.
� Investigate an alternative to commercially acquired micro�uidics connec-tions.
� Integrate the subcomponents of the system to produce a functional devicefor PCR ampli�cation.
� Design a test protocol for the constructed device.
� Calculate theoretical �ow rates, Reynold's numbers and temperaturezone residency times for constructed device.
� Calculate actual �ow rates, Reynold's numbers and temperature zonesresidency times based on measured values.
� Compare theoretical and actual calculations for the designed device.
� Evaluate the relationship between residency times and ampli�cation ef-�ciencies.
� Investigate optimal device parameters for e�cient DNA ampli�cation.
� Compare the constructed device to those detailed in literature.
� Propose a design for a low cost, commercial PCR micro�uidics device.
Stellenbosch University https://scholar.sun.ac.za
CHAPTER 1. INTRODUCTION 6
1.5 Contributions made
The contributions made during this project are outlined below:
� A literature review was performed on techniques used for micro�uidicdevice fabrication, with a focus on portable, low-cost PCR devices.
� Current methodologies for performing PCR were investigated, literatureindicated large, non-portable equipment is most commonly used to per-form PCR, usually in a laboratory environment. This indicated the needfor a portable solution.
� A heating system based on Peltier elements was implemented using o�-the-shelf (OTS) controllers. This proved that cost-e�ective heating im-plementations for PCR are possible.
� An in-house micro�uidic connector scheme was devised which did notrely on expensive commercial connectors.
� A non-expensive micro�uidics chip manufacturing process was estab-lished. PMMA was etched using CO2 laser ablation and lid bondingwas performed using solvent-assisted thermal bonding.
� A system for performing rapid PCR was manufactured and was capableof notable ampli�cation within 30 minutes (compared to the conventional150 minute process time).
� A relationship between temperature zone residency periods and ampli�-cation e�ciencies was proposed.
� A system model/speci�cation sheet was produced for use in future portablePCR device designs.
1.6 Summary
This thesis focuses on the design and fabrication of a micro�uidics devicecapable of rapid DNA ampli�cation through the PCR. A detailed overviewof micro�uidic device construction is presented with a focus on polymer mi-cro�uidics. Principal micro�uidic fundamentals are presented and discussedin relation to the PCR. A serpentine-channel micro�uidics chip was manu-factured on a PMMA substrate, using CO2 laser ablation. Lid bonding wasachieved using solvent-assisted thermal bonding and �ow control was achievedby a syringe-pump.
DNA ampli�cation of a 200-bp fragment was performed at varying �ow ratesto investigate the relationship between temperature zone residency times and
Stellenbosch University https://scholar.sun.ac.za
CHAPTER 1. INTRODUCTION 7
ampli�cation e�ciencies. Successful ampli�cation was achieved at greatly im-proved rates (30 minutes) when compared to conventional laboratory proce-dures (150-180 minutes.) A speci�cation was produced for future work on acommercially viable, portable PCR device. This device represents a low costalternative to traditional approaches and provides a possible solution for aLOC implementation of a PCR device.
1.7 Brief Chapter overview
The chapters in this thesis detail the work contributed as follows:
� Chapter 2: A literature review covering micro�uidic fundamentals, gen-eralized fabrication procedures for micro�uidic devices and an in-depthinvestigation into micro�uidic PCR device's current literature.
� Chapter 3: This chapter presents the fabrication methodology followedto produce the PCR device.
� Chapter 4: Results and characterization techniques are presented.
� Chapter 5: Summarizing and concluding remarks are given.
� Chapter 6: Future recommendations and designs are proposed for use infurther investigations.
Stellenbosch University https://scholar.sun.ac.za
Chapter 2
Literature Review
2.1 Micro�uidics
2.1.1 Introduction
Micro�uidics is a promising, relatively new �eld pertaining to the control andmanipulation of droplets within the 10−6 to 10−9 scale [14]. Micro�uidics'potential to provide unique solutions to �elds such as analytical chemistry,microbiology and microelectronics is substantial. Systems used within these�elds can bene�t from attractive properties such as reduced reagent and sam-ple usage, high resolution, faster processing and the laminar �ow property of�uids �owing at this scale.The origin of micro�uidics stems from a gas chro-matograph developed by Standford in 1979 [25], the development of which waspromoted by the advancement of silicon manufacturing due to the microelec-tronics and semiconductor industry. Since then the �eld has made considerableprogress and complex 3D structures are now possible on a variety of substrates,paving the way for a wider range of applications. The adoption of polymersas substrates, speci�cally Polydimethylsiloxane (PDMS), is providing contin-ually expanding room for applications. Silicon and glass micro�uidics havebeen somewhat replaced by the addition of thermoplastics, stemming fromtheir easier fabrication, optical transparency, �exibility and favorable surfaceproperties.
This review will cover micro�uidics and it's role in ongoing research into lab-on-chip devices, with speci�c focus on PCR micro�uidic systems. The funda-mental laws governing micro�uidic systems will be explained and recent workpertaining to device subcomponents will be presented.
2.1.2 Micro�uidics fundamentals
A better understanding regarding the advantages and capabilities that mi-cro�uidics o�er can be achieved through examining the physical laws that
8
Stellenbosch University https://scholar.sun.ac.za
CHAPTER 2. LITERATURE REVIEW 9
govern �uids and molecules at this scale.
2.1.2.1 Physics at the micro scale
Micro�uidics is only made possible due to the unique properties �uid/gas �owsexhibit on a micrometer scale. One would expect that microscopic �uid �owswould mimic their macroscopic counterparts and although that is true forsome cases, exceptions do exist, and it is these exceptions that brought aboutthe study of microhydrodynamics, the study of �uids at micrometric scales.When we inspect the laws prevalent at a miniaturized scale, it is importantto introduce the concept of the scaling law [26]. A "scaling law" de�nes therule for variations of the physical quantities of a system, with respect to thedimension l of the system or object. When examining the physical quantitiesof a system, we are usually left with two considerations:
� the physical quantities that a�ect the scaling law are constants
� physical quantities appearing in the scaling law are dependent on scale.
When looking at miniaturized systems, a general rule of thumb can be drawn:forces with the weaker exponent tend to dominate the forces in a miniaturizedsystem [26]. Considering the scale laws, we see that when examing forcesdominant in the micro�uidics context, capillary forces (l1) are more prevalentthan those of gravity (l3) or centrifugal forces (l4).
2.1.2.2 Low Reynold's numbers
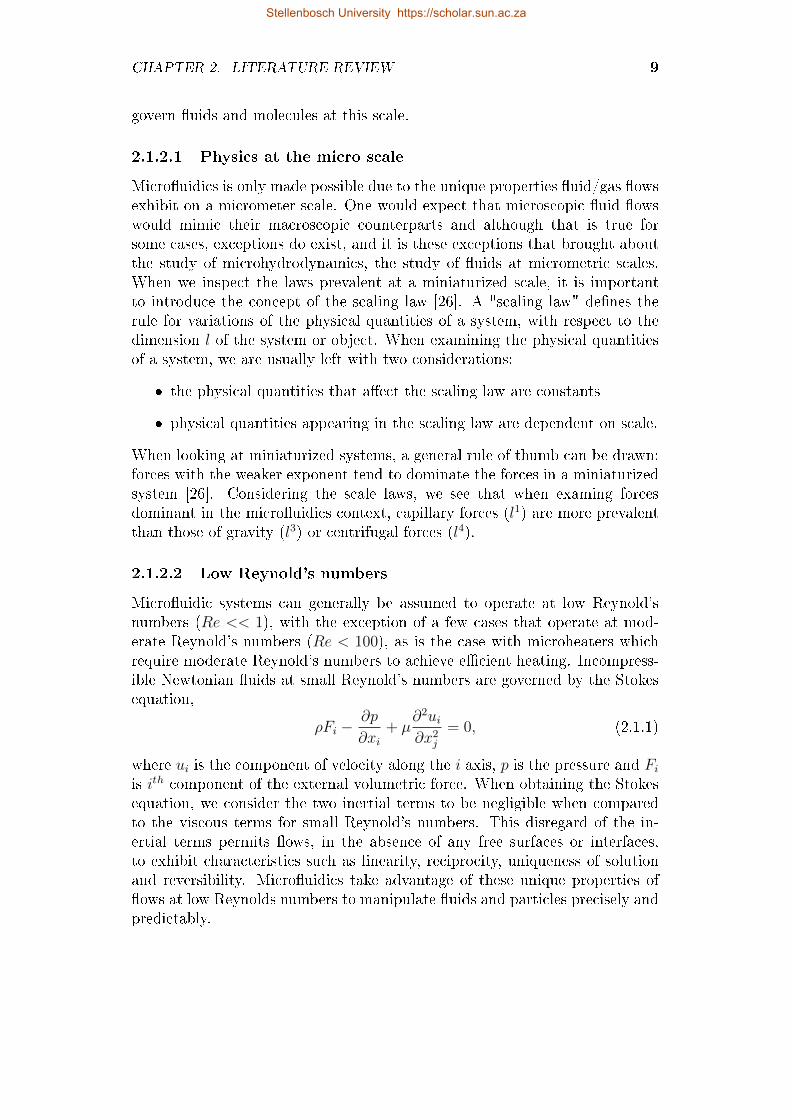
Micro�uidic systems can generally be assumed to operate at low Reynold'snumbers (Re << 1), with the exception of a few cases that operate at mod-erate Reynold's numbers (Re < 100), as is the case with microheaters whichrequire moderate Reynold's numbers to achieve e�cient heating. Incompress-ible Newtonian �uids at small Reynold's numbers are governed by the Stokesequation,
ρFi −∂p
∂xi+ µ
∂2ui∂x2j
= 0, (2.1.1)
where ui is the component of velocity along the i axis, p is the pressure and Fi
is ith component of the external volumetric force. When obtaining the Stokesequation, we consider the two inertial terms to be negligible when comparedto the viscous terms for small Reynold's numbers. This disregard of the in-ertial terms permits �ows, in the absence of any free surfaces or interfaces,to exhibit characteristics such as linearity, reciprocity, uniqueness of solutionand reversibility. Micro�uidics take advantage of these unique properties of�ows at low Reynolds numbers to manipulate �uids and particles precisely andpredictably.
Stellenbosch University https://scholar.sun.ac.za
CHAPTER 2. LITERATURE REVIEW 10
2.1.2.3 Capillarity
Capillary action is a dominant force when considered on a micro�uidics scale.Micro�uidic devices that are capillary force driven are considered "passive"�ow devices, as these systems can operate with very little user input. Cap-illary forces are largely governed by surface tensions, surface chemistry andthe geometry of the channels [27]. A large pitfall of conventional micro�u-idic devices is the need for complex external equipment, i.e. �ow control andheaters. The capillary driven devices reduce the need for external �ow controland thus simplify the equipment necessary to perform diagnostics, thus bring-ing micro�uidics closer to their ideal form as a fully self-enclosed LOC [28].
To gain a better understanding of how capillary forces operate on a micro�u-idic level and how researchers leverage these properties to create passive �owdevices, we must examine the laws that de�ne capillarity.
Surface Wettability Surface wettability is de�ned by the contact angle ofliquids to the surface. If the angle is <90°, the surface is considered wettable.These systems produce negative capillary action, which pulls liquid into thechannels. Conversely, for angles >90°a positive pressure is generated thatforces liquid out of the channels.
Capillary pressure Flow in capillary micro�uidics is generated by the cap-illary pressure within the channels. Capillary forces are as a result of a liquid'ssurface tension and the adhesive forces at the solid-liquid interface. In general,we can assume that micro-channels utilizing capillary forces are of a rectan-gular geometry, the capillary force of which is governed by the Young-Laplaceequation,
P = −γ(cos θt + cosθbh
+cos θl + cosθr
w), (2.1.2)
where P is the capillary pressure, γ the surface tension, θl, θr, θb and θt arethe contact angles with the channel sides and h, w are the height and widthrespectively.
Capillary micro�uidic applications Since it's inception around the 1980's,capillary micro�uidics has seen a wide range of applications evolve, from it'sinitial phase where abrupt geometry changes were used to halt �ow, pumpsthat allowed unidirectional �ow and dilution devices that leverage capillaryand gravitational e�ects to dilute samples [29].
Capillary micro�uidics underwent a resurgence with the emergence of micrototal analysis systems (µTAS) in the 90's [30]. Notable work done by Del-marche et. al. [30], illustrates how capillary forces started to integrate with
Stellenbosch University https://scholar.sun.ac.za
CHAPTER 2. LITERATURE REVIEW 11
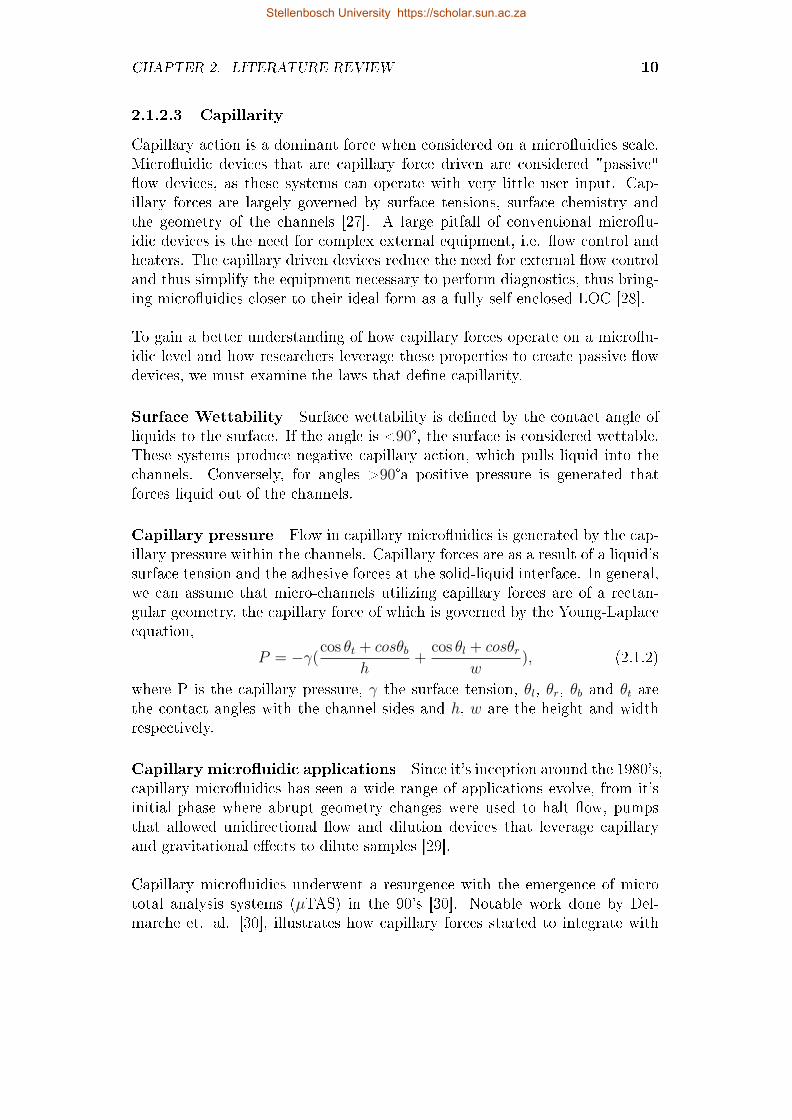
Figure 2.1: Potential distribution and resulting velocity pro�le from electroosmoticinduced �ow [1].
biological assays to create self-powered diagnostics devices. A micro�uidic net-work was constructed, consisting of micro-channels patterned with proteins,capillary forces were used to �ll these channels and delivery reagents to theappropriate regions[30]. Since these initial designs, complex capillary circuitshave been produced, able to deliver reagents to preprogrammed areas on amicro�uidic platform.
2.1.2.4 Electro-osmotic �ow
Electro-hydrodynamics are subject to di�erent operating conditions at themicro�uidics level, where surface to volume ratios are far larger. Surface re-actions within a micro�uidic channel lead to charge separations at boundarywalls. When subjected to a directional electric �eld ~E , these charges will beattracted to the oppositely charged electrode and by viscous drag, set the bulk�uid in motion [1][31]. Uniform �uid �ows are produced by this technique andthis advantageous �uid �ow is known as Electro-osmotic Flow (EOF), and isdescribed by
veof =εξE
4πη, (2.1.3)
where ε is the dielectric constant of the �uid, η is �uid viscosity, E is the ap-plied electric �eld strength and ξ is the Zeta potential of the surface [32].
The study of electro-hydrodynamics at the micro�uidic level led researchers tothe development of electroosmotic pumps, which provide a pulse free, stable�ow, a high level of integration and no mechanical part [33]. Liu and Dasgupta[34] developed one of the earliest versions of an EOP. Consisting of a capillaryelectrophoresis system, Fe2+ was electrophoretically migrated to the reagent
Stellenbosch University https://scholar.sun.ac.za
CHAPTER 2. LITERATURE REVIEW 12
zone and the product was retrieved using electro-osmotic �ow. A concentrationrange within 5-200 mg/L of Fe2+ samples were analyzed in this manner.
2.1.2.5 Dielectrophoresis
The separation of charged species has been a topic of research for a number ofyears. It has been shown that the use of non-uniform ac �elds results in themovement of polarized particles, a result of the dielectrophoretic (DEP) forcegiven by
〈~FDEP 〉 =1
2υα5 ~E2
rms. (2.1.4)
The use of electrophoresis is a well-studied and developed �eld, used in sepera-tion techniques, such as capillary electrophoresis that can seperate DNA, pro-teins and other biomolecules. These particles, in a non-uniform electric �eld,experience movement due to the interaction of their dipole and the spatialgradient of the electric �eld [35].
2.1.2.6 Electrowetting
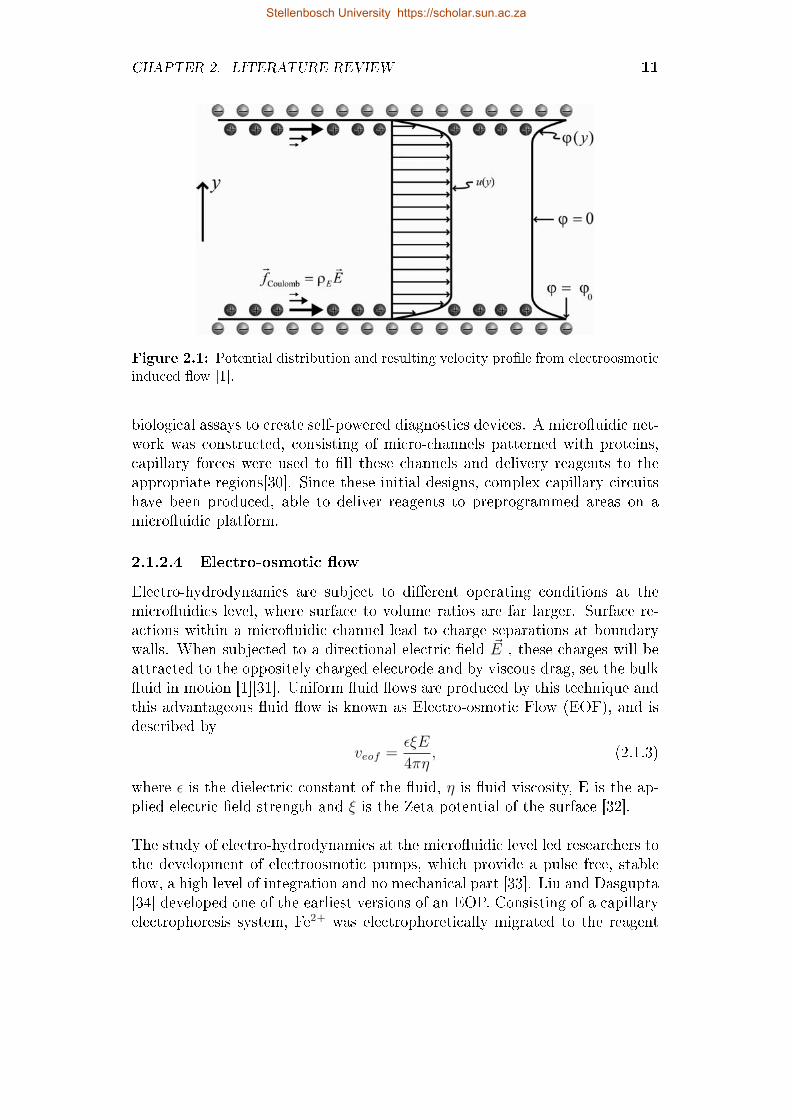
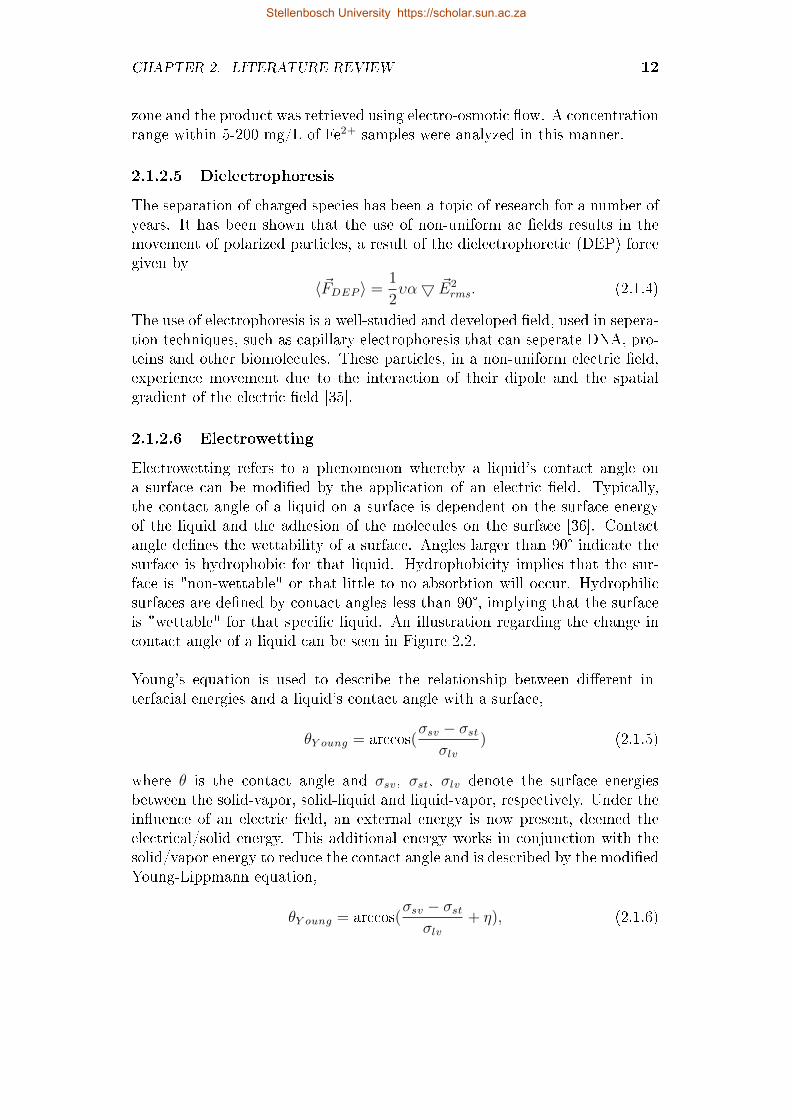
Electrowetting refers to a phenomenon whereby a liquid's contact angle ona surface can be modi�ed by the application of an electric �eld. Typically,the contact angle of a liquid on a surface is dependent on the surface energyof the liquid and the adhesion of the molecules on the surface [36]. Contactangle de�nes the wettability of a surface. Angles larger than 90° indicate thesurface is hydrophobic for that liquid. Hydrophobicity implies that the sur-face is "non-wettable" or that little to no absorbtion will occur. Hydrophilicsurfaces are de�ned by contact angles less than 90°, implying that the surfaceis "wettable" for that speci�c liquid. An illustration regarding the change incontact angle of a liquid can be seen in Figure 2.2.
Young's equation is used to describe the relationship between di�erent in-terfacial energies and a liquid's contact angle with a surface,
θY oung = arccos(σsv − σst
σlv) (2.1.5)
where θ is the contact angle and σsv, σst, σlv denote the surface energiesbetween the solid-vapor, solid-liquid and liquid-vapor, respectively. Under thein�uence of an electric �eld, an external energy is now present, deemed theelectrical/solid energy. This additional energy works in conjunction with thesolid/vapor energy to reduce the contact angle and is described by the modi�edYoung-Lippmann equation,
θY oung = arccos(σsv − σst
σlv+ η), (2.1.6)
Stellenbosch University https://scholar.sun.ac.za
CHAPTER 2. LITERATURE REVIEW 13
Figure 2.2: Illustration regarding change in liquid contact angle after charging ofthe dielectric
where η is the dimensionless electrowetting number. This principle of Elec-trowetting on Dielectric (EWOD) has been leveraged to allow for the trans-portation of droplets through a system whereby droplets are propelled by theplacement of electrodes at interval gaps. Gunji and Masahide [37] used asimilar technique to move droplets around an oval track.
2.1.2.7 Micro�uidics and thermal transfers
When considering the thermal response of micro�uidic systems, it is necessaryto review the thermodynamic laws in e�ect at that scale. Temperature regula-tion is an important aspect required in a multitude of micro�uidic applications,PCR probably being the most notable. We require an understanding of ther-mal mass and conduction in order to explain most of the observed responseswe see in a micro�uidics context.
Thermal Conduction Heat conduction is the transport of energy from highenergy particles to low energy particles within a material, in the absence ofany �ow of mass. Incropera et al. (2006) [38] stated that heat conductionis the transportation of vibrational states within a substance, devoid of anymass transport forced by �ow or di�usive forces. Heat conduction is the coremethod for heat transfer in solids and as such the conduction of heat throughthe micro-channel walls/surfaces is the main mechanism for heat transfer [38].Essentially, when a temperature gradient exists within a substance, the energyin the high temperature area will migrate towards the lower temperature areas.Fourier's law of heat conduction, credited to Jean-Baptiste Joseph Fourier in1822, introduced the thermal conductivity parameter (k) and it's relationshipto the local �ux density and negative temperature gradient:
~q = −k5 T, (2.1.7)
Stellenbosch University https://scholar.sun.ac.za
CHAPTER 2. LITERATURE REVIEW 14
where ~q is the local heat �ux density in (W/m2), k the thermal conductivityof a material (W/m·K) and T , the temperature in Kelvin.
When considering a substrate used in a thermal regulatory micro�uidics sys-tem, special attention should be paid to it's thermal conductivity. Devicesrequiring rapidly transitioning temperature regions should consider applicablesubstances with a high thermal conductivity, allowing for the rapid transfer ofheat. Stationary PCR devices, in which the sample is held in a reservoir andcycled through 3 temperatures, requires substrates that allow e�cient transferof thermal energy. In contrast, continuous �ow PCR, which uses �xed temper-ature regions that samples �ow through, require a substrate that is more stablethermally. Materials with lower thermal conductivity tend to be more stablearound a temperature point due to their reduced thermal energy transfer.
Thermal Mass The thermal mass of an object determines the amount ofthermal energy an object can store. Thermal mass is dependent on the speci�cheat of a material, the mass of the body and is expressed as
Q = Cth · 4T, (2.1.8)
where Q is the thermal energy in Joules, Cth the thermal mass(JK) and 4T is
the change in temperature in (K ). Speci�c heat of a material is de�ned as theamount of heat to increase the temperature of a mass by 1 degree Kelvin andis de�ned as,
Cth = m · Cp, (2.1.9)
where Cth is speci�c heat (J
K·kg ). Using (2.1.8) in (2.1.9), we can relate thermalenergy directly to mass, speci�c heat capacity and the temperature change,
Q = m · Cp · 4T. (2.1.10)
Equation (2.1.10) depicts the relationship between the mass of an object inrelation to the thermal energy. In a micro�uidics context, the greatly reducedmass of samples leads to a greatly reduced thermal mass. This reduced ther-mal mass allows for the heating/cooling of samples in a far more rapid mannerthan previously possible in macro systems, allowing for more time e�cientheating cycles. This is one of the greatest advantages when considering ther-mal transfer in micro�uidic systems. PCR micro�uidics exploit this speci�cproperty to greatly reduce reaction times, as a result of the e�cient thermaltransfer to microlitre samples.
2.1.3 Conclusion
After reviewing the relevant physical laws at work on a micro�uidics level, itis evident that through the leveraging of these unique properties, a plethora of
Stellenbosch University https://scholar.sun.ac.za
CHAPTER 2. LITERATURE REVIEW 15
applications are possible. Whether it be smaller thermal mass, reduced reagentconsumption, electro-kinetically driven �ow or any of the other bene�ts, it canbe seen why micro�uidics has shown great promise for developing a completeLOC device.
2.2 Fabrication and bonding of micro�uidic
substrates
In this section a general micro�uidics model will be proposed in an e�ortto compartmentalize the components and methods common to micro�uidicsdevices. Each category will be discussed independently and recent work pre-sented for each subcomponent of the model. The model is depicted in Figure2.3 and it can be seen that micro�uidic devices follow a general layout thatcan be categorized according to their substrates and fabrication methods, lidbonding techniques and �ow control systems. This is not an exhaustive modeland thus applications requiring speci�c con�gurations are not covered. Themodel can be altered to �t the requirements of such devices by additional sub-components. An additional subcomponent, temperature regulation, will bediscussed due to it's pertinence to PCR devices. However it is not applicableto all micro�uidic devices.
2.2.1 Substrate channel fabrication and bonding
techniques
The fabrication of micro�uidic devices is continuously evolving, improvementsin technologies have led to a plethora of new techniques being developed and assuch this section will serve as a brief overview of the commonly used methodsand substrates in the �eld. When considering types of materials that micro�u-idic devices are fabricated from, we can generally assume they will fall underone of two categories, namely silicon/glass-based or thermoplastic/polymerbase. The introduction of thermoplastics/polymers to the �eld is quite recentand researchers are only starting to exploit the favorable characteristics thesematerials can bring to micro�uidics.
2.2.1.1 Silicon/Glass
The fabrication of silicon devices is a mature �eld, the semiconductor industryhas driven the study of this material tremendously in the past 30 years and asa result we have a wealth of knowledge for fabrication of silicon-based devices.Silicon also provides certain advantages when it comes to the integration ofdevices. However, it's advantages are shadowed by it's price when comparedto that of thermoplastics. The environment in which silicon devices are fabri-cated also needs to be dust free, referred to as a clean room. A clean room is
Stellenbosch University https://scholar.sun.ac.za
CHAPTER 2. LITERATURE REVIEW 16
Figure 2.3: Simpli�ed micro�uidic device model
an environment in which temperature and humidity are constantly regulated,while the air is circulated. The air is �ltered in order to reduce the numberof free particles in the air that could otherwise hinder the fabrication of mi-cro�uidic devices. The quality of the clean room is assessed by the numberof particles smaller than 4 µm in a cubic inch of air [39]. Ratings for cleanrooms usually vary, but typical classes for Micro-Electro-Mechanical Systems(MEMS) fabrication are in the range of 1000 to 10 000. A stringent fabricationenvironment, coupled with the expense of silicon wafers and their biologicalincompatibility have resulted in a move away from these devices. Applicationsthat require high thermal resilience [40], High Aspect Ratio (HAR), integra-tion with electronic subsystems or integrated electrodes can still bene�t fromsilicon substrates.
The use of glass in micro�uidics can be said to be similar to the role of sil-icon in micro�uidics. Glass substrates do o�er unique properties that maywarrant the additional time, cost and di�culty to produce them. However,they are largely being replaced by the thermoplastic class of substrates. Aglass substrate can achieve large temperature gradients due to it's thermalinsulating properties. Glass has been used successfully in applications such asLOC PCR devices [41], capillary electrophoresis [42] and gas chromotography[24]. The fabrication techniques for glass micro�uidics stem from the siliconmanufacturing industry and as such is processed in a very similar manner.
Photolithographic Process Photolithography is a patterning process �rstused in the printing industry and has been a part of semiconductor fabricationfrom the 1950's. It is a process whereby a designed mask/pattern is transferredto photoresist on a material surface. The photolithography process usually fol-lows a general methodology, namely photoresist coating, alignment, exposure,
Stellenbosch University https://scholar.sun.ac.za
CHAPTER 2. LITERATURE REVIEW 17
Figure 2.4: Steps involved in a typical photolithographic procedure [2].
development, stripping of photoresist, followed by a hard bake [43]. The �rststep consists of coating a wafer, usually silicon, in photoresist, a photosensitivematerial. A mask is then aligned on the now photoresist coated surface and isexposed to ultraviolet (UV) light which passes through the transparent areasof the mask [44]. The photoresist's chemistry is changed by photochemicalreactions that occur in UV exposed areas on the chip. Positive photoresist,most commonly used in advanced semiconductor fabrications, requires thatthe chip be submerged in a developer solution, which dissolves the exposedareas, leaving only the unexposed photoresist on the surface which creates adark mask/pattern. Once the structure has been embedded in the substrate,the photoresist is stripped away by an appropriate solvent. Figure 2.4 de-picts general processes for both positive and negative photoresist. SU-8 hasundoubtedly become the most common photoresist used in high aspect ratio(HAR) structures [45]. During the development phase of the photolithographicprocess, two main techniques are available, namely dry and wet etching.
Dry Etching Dry etching, also known as Reactive Ion Etching (RIE), isa subprocess of photholithography used in micro-fabrication that can achieveHAR strutures in silicon [46]. There are two main techniques when consideringdry etching, namely the cryogenic process and the Bosch process, which isthe most prevalent of the two [40]. Dry etching involves a passivation step,whereby a C4F8-based plasma generates a coating of a polytetra�uoroethylene(PTFE)-like polymer over the exposed surface. Ion bombardment is then usedin conjunction with �uoride chemistry to remove the polymer and isotropicallyetch away the silicon. Most commonly, photoresist and SiO2 are used as mask
Stellenbosch University https://scholar.sun.ac.za
CHAPTER 2. LITERATURE REVIEW 18
layers. Cryogenic techniques make use of cooled wafers (around -110°C), whichprovides sidewall passivation and SF6/O2 for �uorine radicals for etching [47].
Wet Etching Wet etching of silicon involves the use of "wet" chemicalsto etch into the substrate and form structures. However, it has largely been re-placed by dry etching due to the advantages it provides. Wet isotropic etchingof silicon is performed in HNA solutions. During this redox reaction, HNO3
oxidizes the Si surfaces, while HF dissolves the generated oxide layer [48]. Thissolution results in aggressive etching and is largely dependent on the temper-ature and concentration of the acid. Orientation etching of silicon is possibleand relies on the selective etching of the di�erent crystallographic planes [49].A number of etching solutions are available for this method, however, KOH isthe most commonly used, most likely due to it's selective etching of the <100>and <111> crystallographic planes [50].
2.2.1.2 Polymer/Thermoplastics
With the initial boom of the LOC era, glass and silicon micro�uidics were atthe forefront, with most devices being made from one of the two substrates.However, in the early 1990's polymers were proposed as an alternative toglass/silicon substrates due to their rapid prototyping and reduced expense.Polymers are inexpensive in comparison to glass/silicon substrates. Addition-ally, there are a wide range of polymers allowing researchers to choose a mate-rial that best suits their application [51]. Fabrication techniques for polymersrequire no hazardous etchants and can be manufactured in relatively simplelaboratories, a fact which has driven their use in micro�uidics [51].
When introducing polymers as substrates, speci�cally thermoplastics, the glasstransition point of materials (Tg) is an important parameter. Thermoplasticsuniquely can undergo softening around the glass transition temperature, whichallows their molding/reshaping while retaining the ability to return to theiroriginal chemical state upon cooling. This characteristic is exploited in mi-cro�uidic fabrication techniques, allowing for rapid prototyping on substratesfar more cost e�cient than their silicon/glass counterparts. PDMS is cur-rently the most widely used substrate in micro�uidic devices, due to its easeof fabrication, biocompatability and cost [52]. Fabrication techniques are farsimpler (replica molding, injection molding, hot embossing)[53] than those ofsilicon/glass substrates (wet etching, RIE). Important to the LOC realizationis the need for single-use devices, which can eliminate cross sample contamina-tion. Other polymers used in micro�uidic devices include polycarbonate (PC)[54], Poly (methyl methacrylate) (PMMA) [55], polyvinylchloride (PVC) [56],and polyethylene [57]. This section will focus on polymer substrates, theirfabrication techniques and recent applications in the LOC �eld.
Stellenbosch University https://scholar.sun.ac.za
CHAPTER 2. LITERATURE REVIEW 19
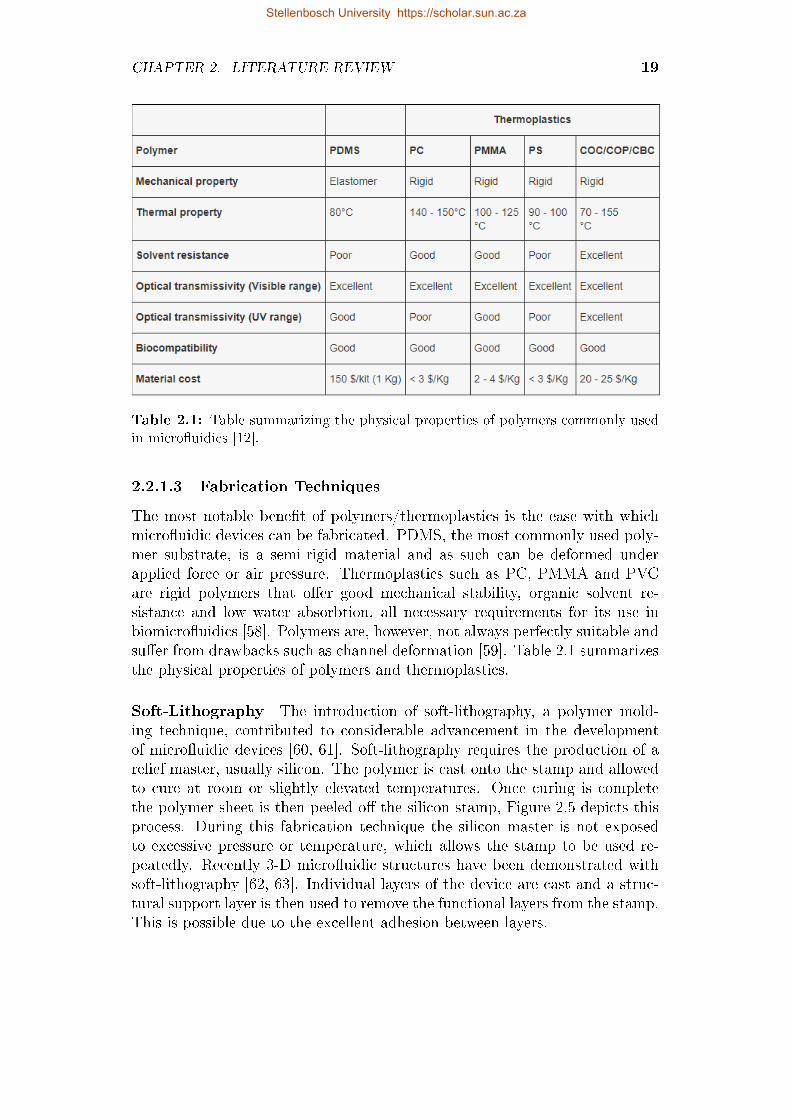
Table 2.1: Table summarizing the physical properties of polymers commonly usedin micro�uidics [12].
2.2.1.3 Fabrication Techniques
The most notable bene�t of polymers/thermoplastics is the ease with whichmicro�uidic devices can be fabricated. PDMS, the most commonly used poly-mer substrate, is a semi-rigid material and as such can be deformed underapplied force or air pressure. Thermoplastics such as PC, PMMA and PVCare rigid polymers that o�er good mechanical stability, organic solvent re-sistance and low water absorbtion, all necessary requirements for its use inbiomicro�uidics [58]. Polymers are, however, not always perfectly suitable andsu�er from drawbacks such as channel deformation [59]. Table 2.1 summarizesthe physical properties of polymers and thermoplastics.
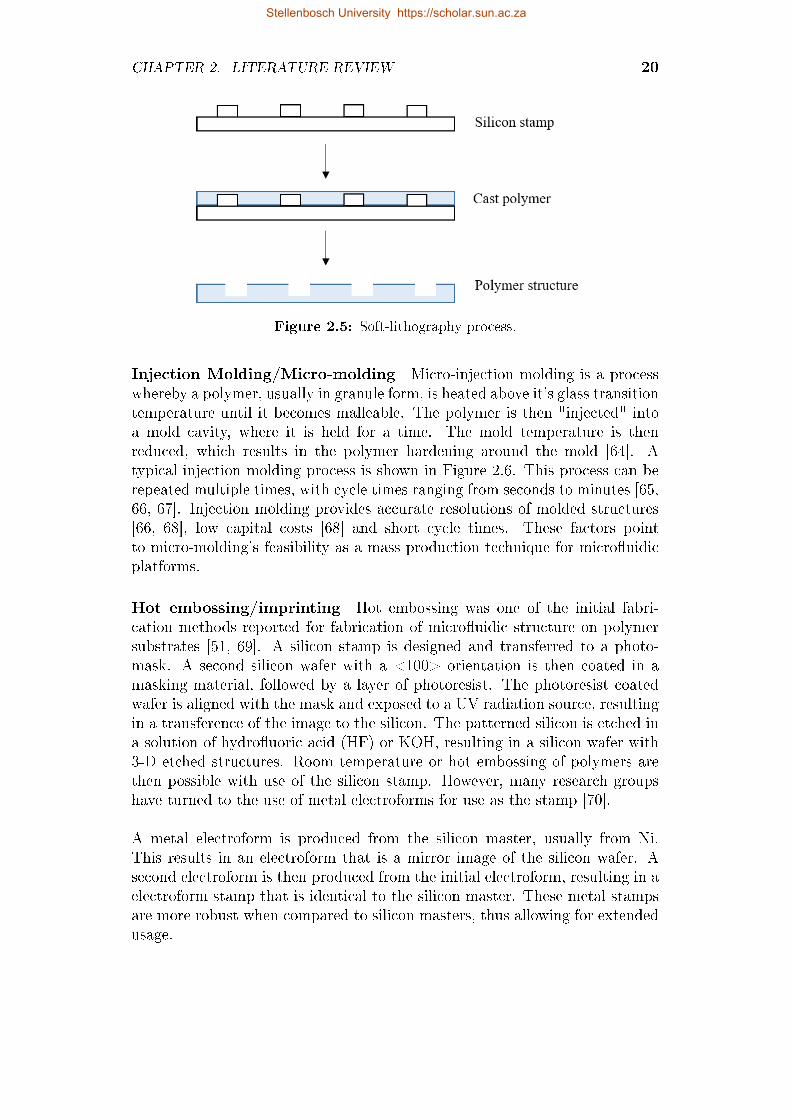
Soft-Lithography The introduction of soft-lithography, a polymer mold-ing technique, contributed to considerable advancement in the developmentof micro�uidic devices [60, 61]. Soft-lithography requires the production of arelief master, usually silicon. The polymer is cast onto the stamp and allowedto cure at room or slightly elevated temperatures. Once curing is completethe polymer sheet is then peeled o� the silicon stamp, Figure 2.5 depicts thisprocess. During this fabrication technique the silicon master is not exposedto excessive pressure or temperature, which allows the stamp to be used re-peatedly. Recently 3-D micro�uidic structures have been demonstrated withsoft-lithography [62, 63]. Individual layers of the device are cast and a struc-tural support layer is then used to remove the functional layers from the stamp.This is possible due to the excellent adhesion between layers.
Stellenbosch University https://scholar.sun.ac.za
CHAPTER 2. LITERATURE REVIEW 20
Figure 2.5: Soft-lithography process.
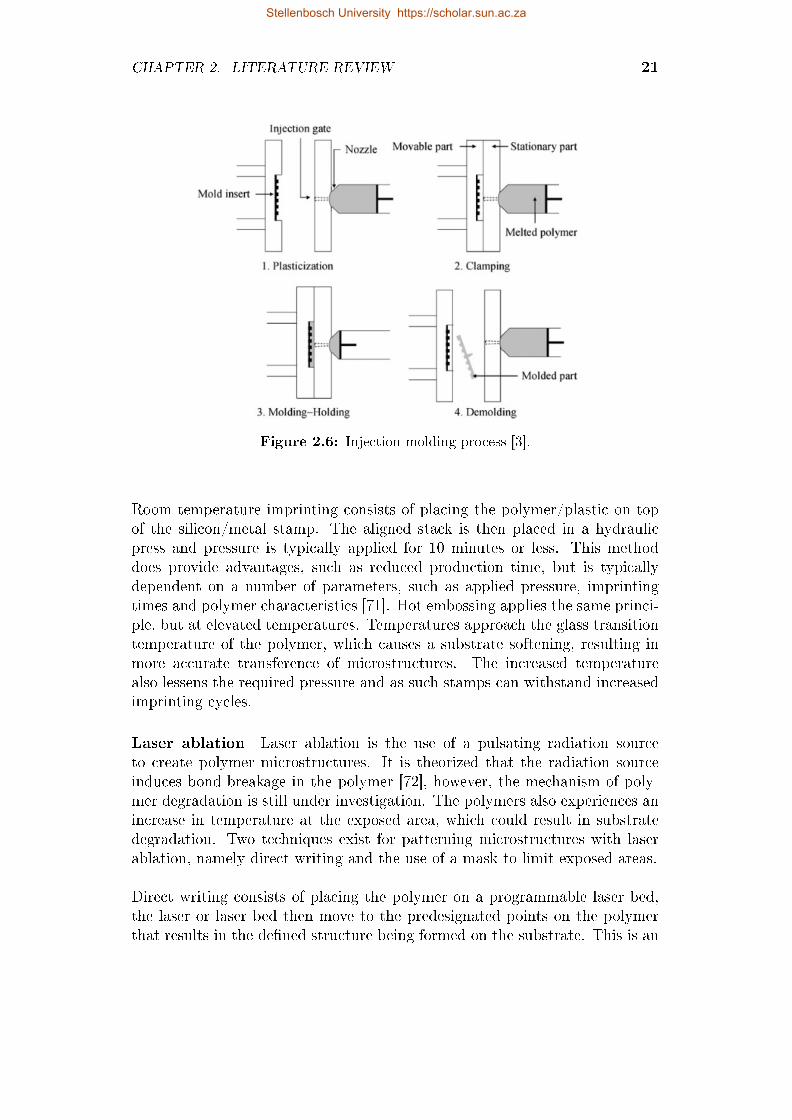
Injection Molding/Micro-molding Micro-injection molding is a processwhereby a polymer, usually in granule form, is heated above it's glass transitiontemperature until it becomes malleable. The polymer is then "injected" intoa mold cavity, where it is held for a time. The mold temperature is thenreduced, which results in the polymer hardening around the mold [64]. Atypical injection molding process is shown in Figure 2.6. This process can berepeated multiple times, with cycle times ranging from seconds to minutes [65,66, 67]. Injection molding provides accurate resolutions of molded structures[66, 68], low capital costs [68] and short cycle times. These factors pointto micro-molding's feasibility as a mass production technique for micro�uidicplatforms.
Hot embossing/imprinting Hot embossing was one of the initial fabri-cation methods reported for fabrication of micro�uidic structure on polymersubstrates [51, 69]. A silicon stamp is designed and transferred to a photo-mask. A second silicon wafer with a <100> orientation is then coated in amasking material, followed by a layer of photoresist. The photoresist coatedwafer is aligned with the mask and exposed to a UV radiation source, resultingin a transference of the image to the silicon. The patterned silicon is etched ina solution of hydro�uoric acid (HF) or KOH, resulting in a silicon wafer with3-D etched structures. Room temperature or hot embossing of polymers arethen possible with use of the silicon stamp. However, many research groupshave turned to the use of metal electroforms for use as the stamp [70].
A metal electroform is produced from the silicon master, usually from Ni.This results in an electroform that is a mirror image of the silicon wafer. Asecond electroform is then produced from the initial electroform, resulting in aelectroform stamp that is identical to the silicon master. These metal stampsare more robust when compared to silicon masters, thus allowing for extendedusage.
Stellenbosch University https://scholar.sun.ac.za
CHAPTER 2. LITERATURE REVIEW 21
Figure 2.6: Injection molding process [3].
Room temperature imprinting consists of placing the polymer/plastic on topof the silicon/metal stamp. The aligned stack is then placed in a hydraulicpress and pressure is typically applied for 10 minutes or less. This methoddoes provide advantages, such as reduced production time, but is typicallydependent on a number of parameters, such as applied pressure, imprintingtimes and polymer characteristics [71]. Hot embossing applies the same princi-ple, but at elevated temperatures. Temperatures approach the glass transitiontemperature of the polymer, which causes a substrate softening, resulting inmore accurate transference of microstructures. The increased temperaturealso lessens the required pressure and as such stamps can withstand increasedimprinting cycles.
Laser ablation Laser ablation is the use of a pulsating radiation sourceto create polymer microstructures. It is theorized that the radiation sourceinduces bond-breakage in the polymer [72], however, the mechanism of poly-mer degradation is still under investigation. The polymers also experiences anincrease in temperature at the exposed area, which could result in substratedegradation. Two techniques exist for patterning microstructures with laserablation, namely direct writing and the use of a mask to limit exposed areas.
Direct writing consists of placing the polymer on a programmable laser bed,the laser or laser bed then move to the predesignated points on the polymerthat results in the de�ned structure being formed on the substrate. This is an
Stellenbosch University https://scholar.sun.ac.za
CHAPTER 2. LITERATURE REVIEW 22
advantageous method for structure fabrication due to the fact that no mask isrequired, thus allowing for rapid design changes, improving the prototype pro-cess. The use of masks to prede�ne areas exposed to radiation is also employedin the fabrication of microstructures in polymers [73].
2.2.1.4 Bonding techniques
A complete, enclosed micro�uidic device requires the bonding of a lid to thefabricated channels. Polymers provide a variety of methods for lid bonding,each with their own advantages/characteristics and as such the appropriatepolymer/bonding technique must be selected based on device requirements. Anumber of methods exist for bonding/sealing of micro�uidic devices, namelyfusion bonding, anodic bonding, solvent bonding and adhesive bonding. Thissection will detail the di�erent bonding techniques used in micro�uidic appli-cations.
Fusion bonding Fusion bonding is the most commonly used polymer bond-ing technique and under ideal conditions, the resulting bond strength can ap-proach that of the bulk material. Substrates are heated to above or near theirTg under su�cient pressure. The combined pressure and temperature result ina �ow of polymer at the interface, resulting in a strong bond due to the inter-di�usion of polymers at the surface. Thermal bonding has been reported bya number of researchers, achieving successful bonding with a variety of poly-mers [74, 75, 58]. Channel deformation is a major drawback when consideringthis bonding technique. Temperatures and pressure need to be optimized toprevent signi�cant channel deformation.
Anodic bonding Anodic bonding is used to permanently bond silicon toglass in the prescence of an electrostatic �eld, providing high stability at theglass/silicon interface [76]. Typically, a silicon wafer, placed on the anode, isbound to an alkali-rich conductive borosilicate glass plate placed on the cath-ode side [77]. The bond is formed through a compound voltage/temperaturee�ect, which results in a hermetically sealed bond at relatively low tempera-tures (<500°C) [78].
Adhesive Bonding Adhesive bonding employs an adhesive to bond twosimilar/dissimilar materials permanently. Liquid adhesives that bond throughsolvent evaporation [51] have been investigated. More recently the use ofUV-curable adhesives have been employed to bond micro�uidic devices [79].The major limitation of this technique is the �ow of adhesive into channels,resulting in channel blockages.
HF welding The use of hydro�uoric acid has been reported to bond glass-glass, glass-silicon and silicon-silicon substrates at room temperature [80]. This
Stellenbosch University https://scholar.sun.ac.za
CHAPTER 2. LITERATURE REVIEW 23
Table 2.2: Solubility parameters for selected polymers/solvent commonly used insolvent bonding [13].
Polymer Solubility Parameter (δ)PMMA 20.1PC 19.4PE 16.3PVC 19.4COC 17.7
Solvent Solubility Parameter (δ)Acetone 20.4
Isopropanol 23.4Methanol 29.6Water 47.7
Acetonitrile 25.1Cyclohexane 16.7
low temperature bonding technique shows promise in reducing residual stressescaused by excessive heat. However, the use of HF is not always preferable.
Solvent-assisted bonding Solvent bonding is a commonly used method forbonding micro�uidic chips due its attractive bene�ts, including strong bonds,minimization of surface damage and it's ability to be upscaled for productionrelatively simply [81]. This bonding technique employs the use of a solventbetween the bonding interfaces. The solvation of the surface renders polymerchains at the interface mobile and facilitates di�usion between the materials.Entangled polymer chains are now present at the interface, resulting in strongbonds. Hildebrandt and Scott (1949) [82] adequately described a measure ofthe cohesive forces for both solvent and solute. The Hildebrandt parameter (δ)
has units of J/cm3 12 . When two materials exhibit similar solubility parameters,
dissolution of the solute can occur [82]. Table 2.2.1.4 displays the solubilityparameters of commonly used micro�uidic materials and their relevant sol-vents. Researchers can select solvents that provide speci�c levels of polymerdissolution most applicable to their implementation. In general, solvent andpolymers with dissimilar solubility parameters are selected to inhibit excessivesolvent uptake into the polymer, a factor that leads to channel deformation[12]. Channel deformation can be further minimized by short solvent exposureperiods.
Localized microwave fusion bonding Microwave radiation have been suc-cessfully used to bond PMMA sheets together. A metal thin-�lm is depositedon the desired bond area and exposed to microwave radiation. Localized heat-ing around the metal �lm occurs, resulting in substrate bonding [83]. Lei et al.
Stellenbosch University https://scholar.sun.ac.za
CHAPTER 2. LITERATURE REVIEW 24
[83] achieved localized bonding by depositing a 100nm metal chromium/gold�lm onto a PMMA substrate and placing the substrate in a microwave chamberoperating at 2.4 GHz. Although this technique does provide accurate bondswith relatively high bond strengths, it has not been widely adopted, largelydue to the extra fabrication techniques required to achieve bonding.
2.3 PCR micro�uidics
2.3.1 Introduction
In recent years, a monumental amount of research is being done on micro�u-idics and its role in providing devices capable of replacing commonplace labora-tory procedures, a large portion of which usually require expensive equipmentor the aid of laboratory technicians [84].These LOC devices provide bene�tsover traditional methodology due to their reduced consumption of analytesand reagants, cost reduction, portability and their potential to be automated.This reduction in size translates to a higher surface to volume ration, a fea-ture that can be of bene�t to a multitude of �elds. Biosensors, for example,require binding of target analytes to recognition elements and a higher surfacearea allows for more recognition elements to be bound resulting in increasedsensitivity. The bene�ts that LOC devices can provide to the biological andanalytical chemistry �elds have led to the adoption of micro�uidics as a plat-form for future laboratory procedures.
One application which shows particular promise in the micro�uidics area isthe Polymerase Chain Reaction (PCR), a precursory step to many diagnosisand analytical procedures. The PCR reaction ampli�es sequences of genesthrough a thermo-circulatory process, whereby a liquid is exposed to 3 uniquetemperatures in the presence of some polymerase and nucleotides. Once thesample has cycled through the temperature zones the genetic sequence will beampli�ed. Micro�uidics has been applied to PCR in a variety of forms, whichcan now be classi�ed into distinct categories of PCR devices, i.e. stationarywells compared to continuous �ow. The reduction in sample volume is espe-cially bene�cial to PCR due to it being a temperature dependent process. Thisreduction in liquid volumes directly translates to a reduction in thermal mass,which in turn results in better temperature ramping rates. Conventional PCRmachines are large pieces of instrumentation and it is highly unlikely one would�nd such a device in rural areas. On the other hand, PCR on-chip devices canbe fully portable, which would allow for more complex analytical procedures tobe performed in an in-�eld environment. This review details an investigationinto µTAS devices, with speci�c focus on a micro�uidics approach to PCR.
Stellenbosch University https://scholar.sun.ac.za
CHAPTER 2. LITERATURE REVIEW 25
2.3.2 The Polymerase Chain Reaction
Kary Mullis �rst developed the PCR in 1984, as a means of amplifying DNA[85]. The PCR is an important precursory step for a number of �elds, includingclinical diagnosis, medical, biological and forensic analysis [86]. It's LOC real-ization was not proposed until the 1990's, once the bene�ts of µTAS deviceswere realized. This section will introduce the concepts of DNA, enzymes andthe PCR process, with speci�c attention to micro�uidic realizations of PCRdevices.
2.3.2.1 DNA
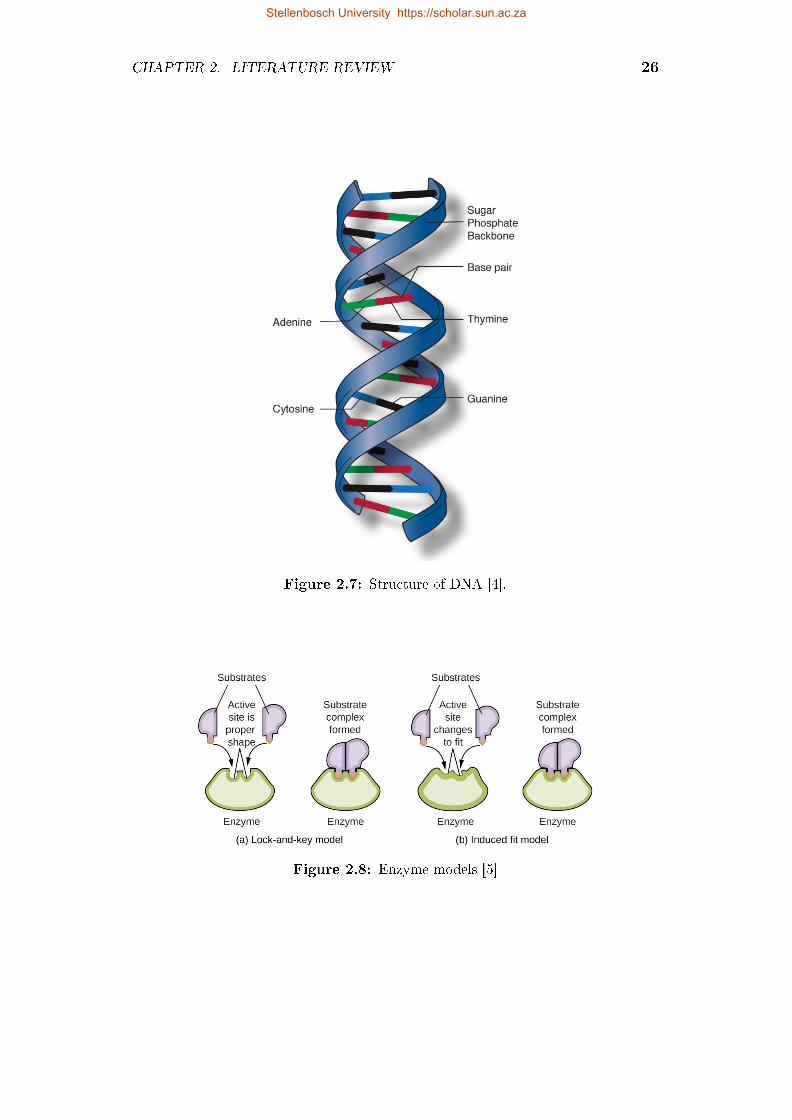
Deoxyribonucleic acid (DNA) consists of two long polynucleotide chains com-posed of four types of nucleotide subunits. These bases are adenine (A), gua-nine (G), cytosine (C), and thymine (T). DNA bases tend to form pairs, Awith T and C with G. These bases are held together through hydrogen bonds[87]. Base pairs connected to a sugar and a phosphate molecule are called nu-cleotides. Nucleotides are arranged in a spiral structure referred to as a doublehelix. The structure can be seen in Figure 2.7 . An important property of DNAis it's ability to replicate itself, each strand within a double helix can serve asa pattern for replicating it's sequence. DNA encodes information through thesequencing of nucleotides in each strand. This information holds the instruc-tions for all proteins an organism will ever synthesize [88]. This mechanismis responsible for passing down hereditary information between organisms andtheir o�spring.
2.3.2.2 Enzymes
An enzyme is a biological catalyst that initiates speci�c biochemical reactions.These enzymes control the rates of a number of biochemical reactions withinliving cells, such as the biosynthesis of macromolecules, the controlled releaseof energy and digestion of food [88].
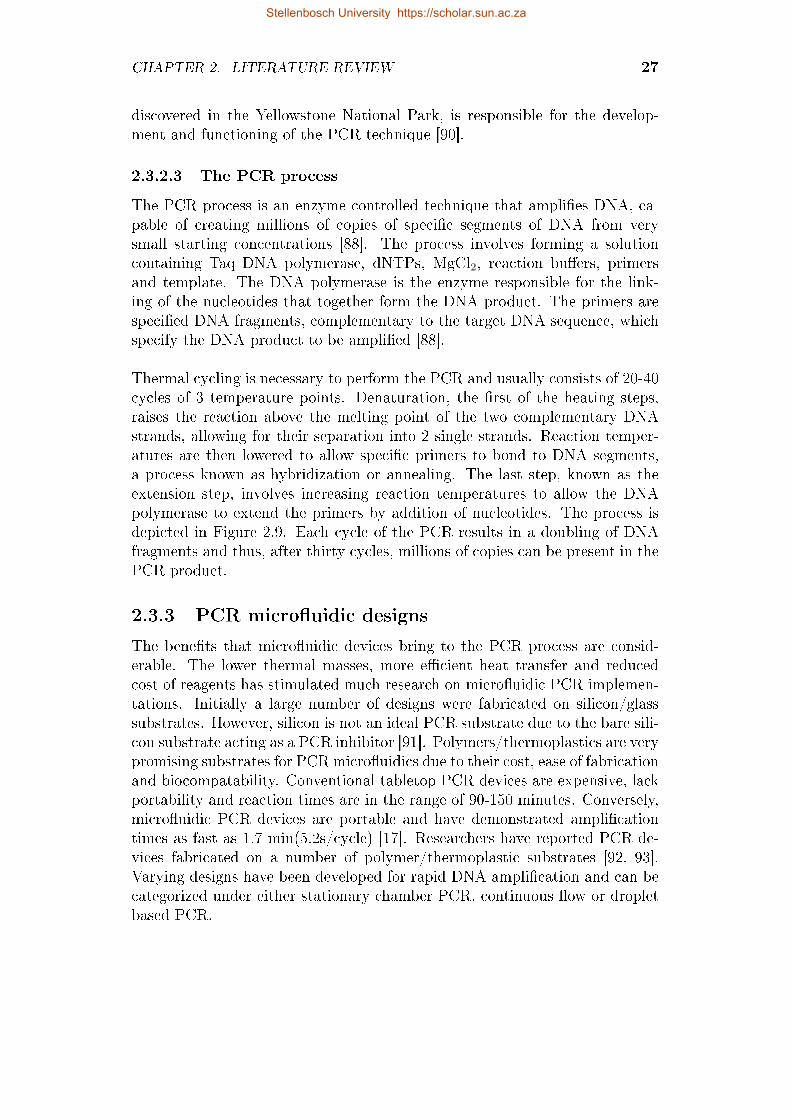
The mechanism by which enzymes catalyze chemical reactions is as a resultof a substrate binding to the active site on an enzyme. This binding of thesubstrate and enzyme produces a change in the substrates electron distribu-tion that ultimately leads to the formation of products [89]. The active site onthe enzyme posses unique geometry, which only allows the binding of speci�csubstrates. Two models exist for describing the way in which the active siteand substrate interact with each other, namely the Lock and Key model andthe Induced Fit model, see Figure 2.8. The theory proposes that the substrateplays an active role in the active site geometry and that the active site is par-tially �exible [89].
The discovery of the Taq polymerase, an enzyme from Thermus aquaticus,
Stellenbosch University https://scholar.sun.ac.za
CHAPTER 2. LITERATURE REVIEW 26
Figure 2.7: Structure of DNA [4].
Figure 2.8: Enzyme models [5]
Stellenbosch University https://scholar.sun.ac.za
CHAPTER 2. LITERATURE REVIEW 27
discovered in the Yellowstone National Park, is responsible for the develop-ment and functioning of the PCR technique [90].
2.3.2.3 The PCR process
The PCR process is an enzyme controlled technique that ampli�es DNA, ca-pable of creating millions of copies of speci�c segments of DNA from verysmall starting concentrations [88]. The process involves forming a solutioncontaining Taq DNA polymerase, dNTPs, MgCl2, reaction bu�ers, primersand template. The DNA polymerase is the enzyme responsible for the link-ing of the nucleotides that together form the DNA product. The primers arespeci�ed DNA fragments, complementary to the target DNA sequence, whichspecify the DNA product to be ampli�ed [88].
Thermal cycling is necessary to perform the PCR and usually consists of 20-40cycles of 3 temperature points. Denaturation, the �rst of the heating steps,raises the reaction above the melting point of the two complementary DNAstrands, allowing for their separation into 2 single strands. Reaction temper-atures are then lowered to allow speci�c primers to bond to DNA segments,a process known as hybridization or annealing. The last step, known as theextension step, involves increasing reaction temperatures to allow the DNApolymerase to extend the primers by addition of nucleotides. The process isdepicted in Figure 2.9. Each cycle of the PCR results in a doubling of DNAfragments and thus, after thirty cycles, millions of copies can be present in thePCR product.
2.3.3 PCR micro�uidic designs
The bene�ts that micro�uidic devices bring to the PCR process are consid-erable. The lower thermal masses, more e�cient heat transfer and reducedcost of reagents has stimulated much research on micro�uidic PCR implemen-tations. Initially a large number of designs were fabricated on silicon/glasssubstrates. However, silicon is not an ideal PCR substrate due to the bare sili-con substrate acting as a PCR inhibitor [91]. Polymers/thermoplastics are verypromising substrates for PCR micro�uidics due to their cost, ease of fabricationand biocompatability. Conventional tabletop PCR devices are expensive, lackportability and reaction times are in the range of 90-150 minutes. Conversely,micro�uidic PCR devices are portable and have demonstrated ampli�cationtimes as fast as 1.7 min(5.2s/cycle) [17]. Researchers have reported PCR de-vices fabricated on a number of polymer/thermoplastic substrates [92, 93].Varying designs have been developed for rapid DNA ampli�cation and can becategorized under either stationary chamber PCR, continuous �ow or dropletbased PCR.
Stellenbosch University https://scholar.sun.ac.za
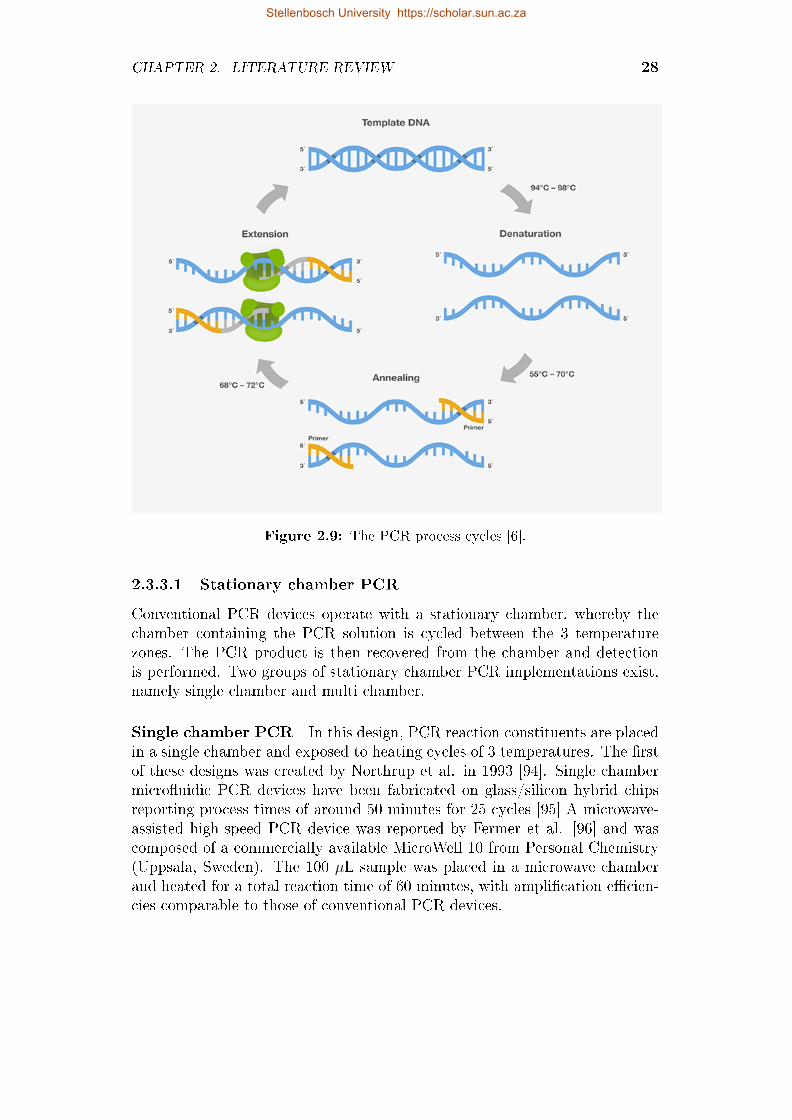
CHAPTER 2. LITERATURE REVIEW 28
Figure 2.9: The PCR process cycles [6].
2.3.3.1 Stationary chamber PCR
Conventional PCR devices operate with a stationary chamber, whereby thechamber containing the PCR solution is cycled between the 3 temperaturezones. The PCR product is then recovered from the chamber and detectionis performed. Two groups of stationary chamber PCR implementations exist,namely single chamber and multi chamber.
Single chamber PCR In this design, PCR reaction constituents are placedin a single chamber and exposed to heating cycles of 3 temperatures. The �rstof these designs was created by Northrup et al. in 1993 [94]. Single chambermicro�uidic PCR devices have been fabricated on glass/silicon hybrid chipsreporting process times of around 50 minutes for 25 cycles [95] A microwave-assisted high-speed PCR device was reported by Fermer et al. [96] and wascomposed of a commercially available MicroWell 10 from Personal Chemistry(Uppsala, Sweden). The 100 µL sample was placed in a microwave chamberand heated for a total reaction time of 60 minutes, with ampli�cation e�cien-cies comparable to those of conventional PCR devices.
Stellenbosch University https://scholar.sun.ac.za
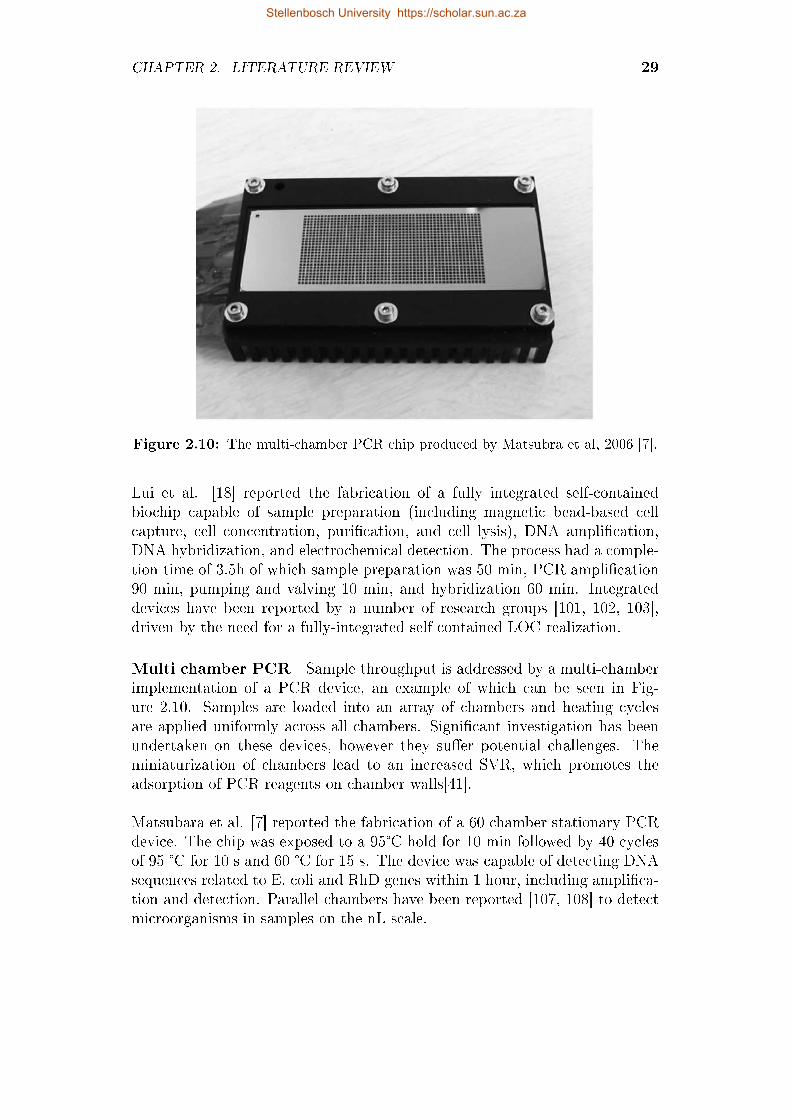
CHAPTER 2. LITERATURE REVIEW 29
Figure 2.10: The multi-chamber PCR chip produced by Matsubra et al, 2006 [7].
Lui et al. [18] reported the fabrication of a fully integrated self-containedbiochip capable of sample preparation (including magnetic bead-based cellcapture, cell concentration, puri�cation, and cell lysis), DNA ampli�cation,DNA hybridization, and electrochemical detection. The process had a comple-tion time of 3.5h of which sample preparation was 50 min, PCR ampli�cation90 min, pumping and valving 10 min, and hybridization 60 min. Integrateddevices have been reported by a number of research groups [101, 102, 103],driven by the need for a fully-integrated self contained LOC realization.
Multi chamber PCR Sample throughput is addressed by a multi-chamberimplementation of a PCR device, an example of which can be seen in Fig-ure 2.10. Samples are loaded into an array of chambers and heating cyclesare applied uniformly across all chambers. Signi�cant investigation has beenundertaken on these devices, however they su�er potential challenges. Theminiaturization of chambers lead to an increased SVR, which promotes theadsorption of PCR reagents on chamber walls[41].
Matsubara et al. [7] reported the fabrication of a 60 chamber stationary PCRdevice. The chip was exposed to a 95°C hold for 10 min followed by 40 cyclesof 95 °C for 10 s and 60 °C for 15 s. The device was capable of detecting DNAsequences related to E. coli and RhD genes within 1 hour, including ampli�ca-tion and detection. Parallel chambers have been reported [107, 108] to detectmicroorganisms in samples on the nL scale.
Stellenbosch University https://scholar.sun.ac.za
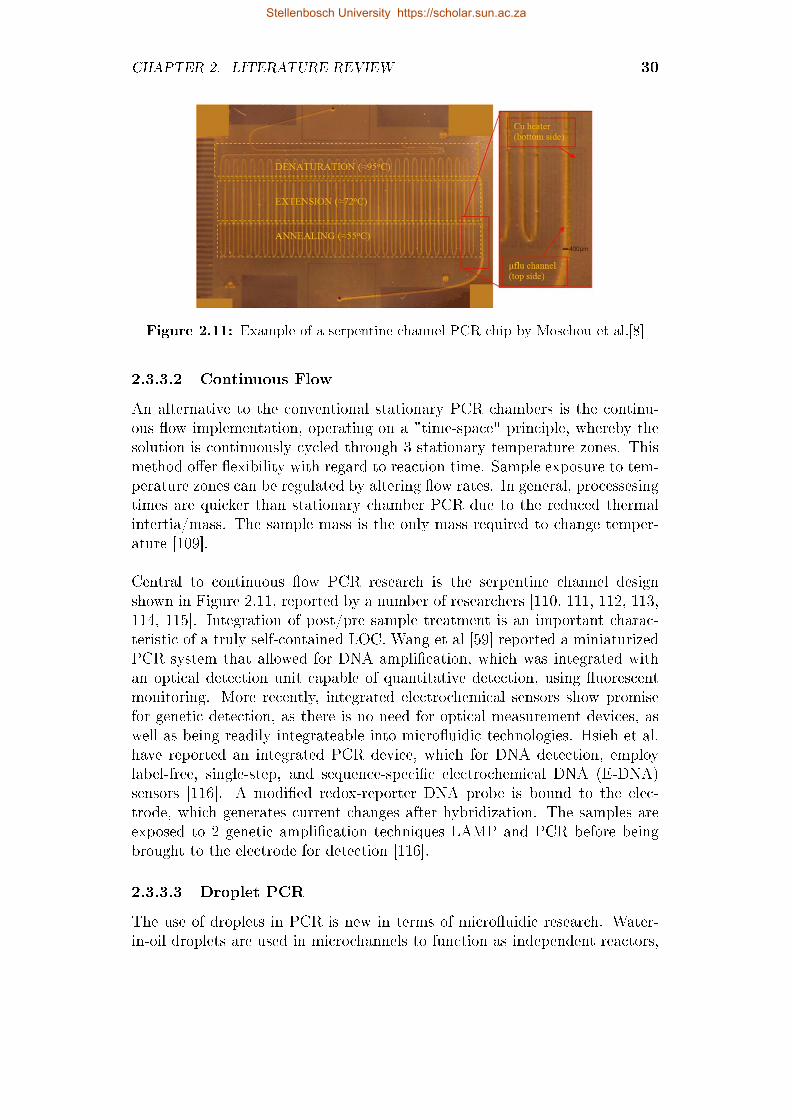
CHAPTER 2. LITERATURE REVIEW 30
Figure 2.11: Example of a serpentine channel PCR chip by Moschou et al.[8]
2.3.3.2 Continuous Flow
An alternative to the conventional stationary PCR chambers is the continu-ous �ow implementation, operating on a "time-space" principle, whereby thesolution is continuously cycled through 3 stationary temperature zones. Thismethod o�er �exibility with regard to reaction time. Sample exposure to tem-perature zones can be regulated by altering �ow rates. In general, processesingtimes are quicker than stationary chamber PCR due to the reduced thermalintertia/mass. The sample mass is the only mass required to change temper-ature [109].
Central to continuous �ow PCR research is the serpentine channel designshown in Figure 2.11, reported by a number of researchers [110, 111, 112, 113,114, 115]. Integration of post/pre sample treatment is an important charac-teristic of a truly self-contained LOC. Wang et al [59] reported a miniaturizedPCR system that allowed for DNA ampli�cation, which was integrated withan optical detection unit capable of quantitative detection, using �uorescentmonitoring. More recently, integrated electrochemical sensors show promisefor genetic detection, as there is no need for optical measurement devices, aswell as being readily integrateable into micro�uidic technologies. Hsieh et al.have reported an integrated PCR device, which for DNA detection, employlabel-free, single-step, and sequence-speci�c electrochemical DNA (E-DNA)sensors [116]. A modi�ed redox-reporter DNA probe is bound to the elec-trode, which generates current changes after hybridization. The samples areexposed to 2 genetic ampli�cation techniques LAMP and PCR before beingbrought to the electrode for detection [116].
2.3.3.3 Droplet PCR
The use of droplets in PCR is new in terms of micro�uidic research. Water-in-oil droplets are used in microchannels to function as independent reactors,
Stellenbosch University https://scholar.sun.ac.za
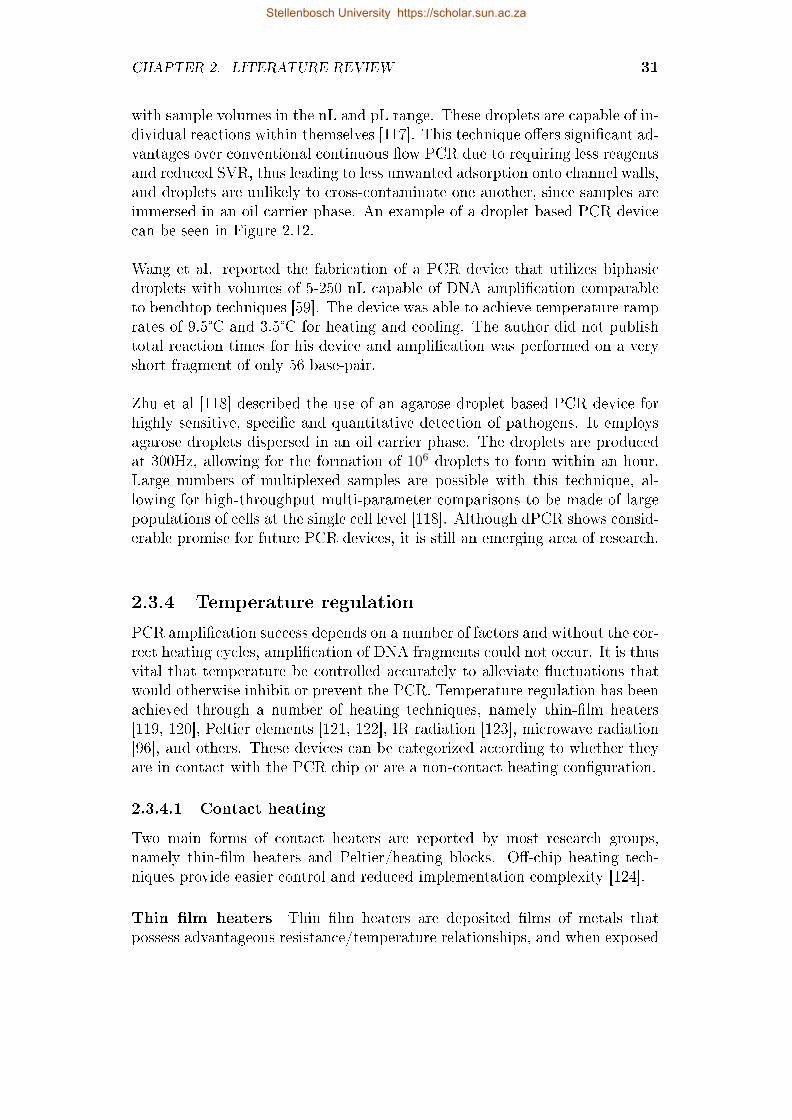
CHAPTER 2. LITERATURE REVIEW 31
with sample volumes in the nL and pL range. These droplets are capable of in-dividual reactions within themselves [117]. This technique o�ers signi�cant ad-vantages over conventional continuous �ow PCR due to requiring less reagentsand reduced SVR, thus leading to less unwanted adsorption onto channel walls,and droplets are unlikely to cross-contaminate one another, since samples areimmersed in an oil carrier phase. An example of a droplet based PCR devicecan be seen in Figure 2.12.
Wang et al. reported the fabrication of a PCR device that utilizes biphasicdroplets with volumes of 5-250 nL capable of DNA ampli�cation comparableto benchtop techniques [59]. The device was able to achieve temperature ramprates of 9.5°C and 3.5°C for heating and cooling. The author did not publishtotal reaction times for his device and ampli�cation was performed on a veryshort fragment of only 56 base-pair.
Zhu et al [118] described the use of an agarose droplet based PCR device forhighly sensitive, speci�c and quantitative detection of pathogens. It employsagarose droplets dispersed in an oil carrier phase. The droplets are producedat 300Hz, allowing for the formation of 106 droplets to form within an hour.Large numbers of multiplexed samples are possible with this technique, al-lowing for high-throughput multi-parameter comparisons to be made of largepopulations of cells at the single cell level [118]. Although dPCR shows consid-erable promise for future PCR devices, it is still an emerging area of research.
2.3.4 Temperature regulation
PCR ampli�cation success depends on a number of factors and without the cor-rect heating cycles, ampli�cation of DNA fragments could not occur. It is thusvital that temperature be controlled accurately to alleviate �uctuations thatwould otherwise inhibit or prevent the PCR. Temperature regulation has beenachieved through a number of heating techniques, namely thin-�lm heaters[119, 120], Peltier elements [121, 122], IR radiation [123], microwave radiation[96], and others. These devices can be categorized according to whether theyare in contact with the PCR chip or are a non-contact heating con�guration.
2.3.4.1 Contact heating
Two main forms of contact heaters are reported by most research groups,namely thin-�lm heaters and Peltier/heating blocks. O�-chip heating tech-niques provide easier control and reduced implementation complexity [124].
Thin �lm heaters Thin �lm heaters are deposited �lms of metals thatpossess advantageous resistance/temperature relationships, and when exposed
Stellenbosch University https://scholar.sun.ac.za
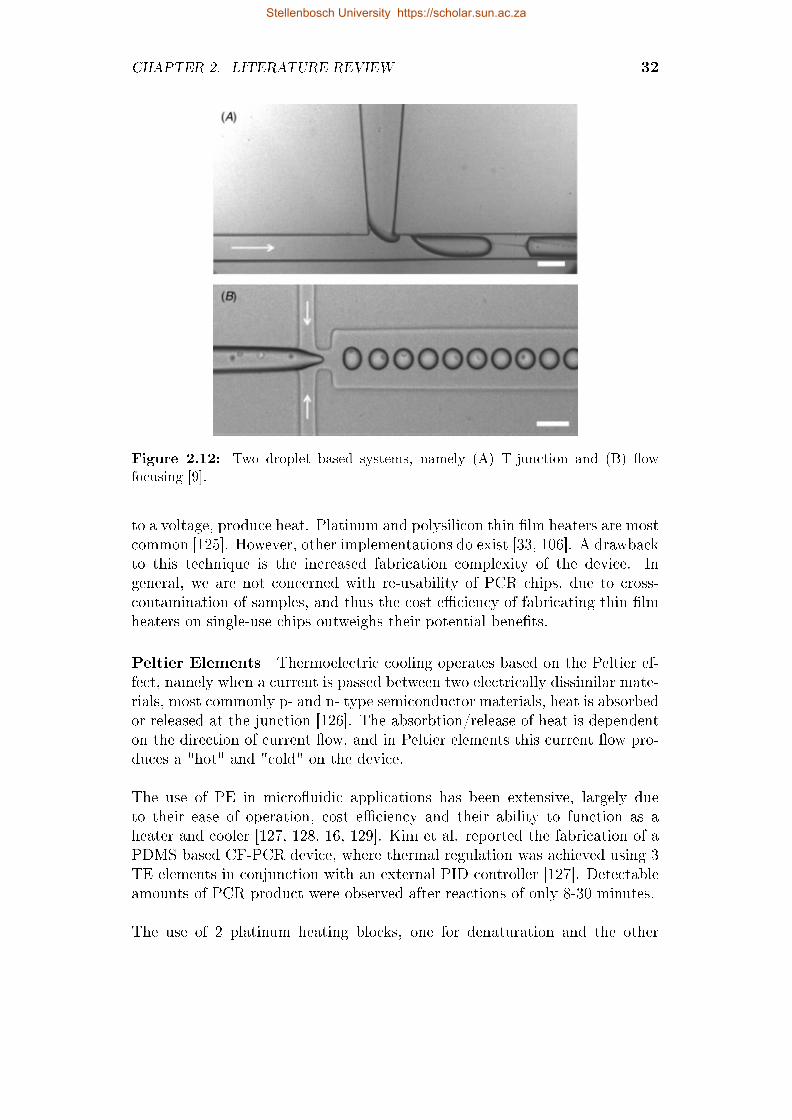
CHAPTER 2. LITERATURE REVIEW 32
Figure 2.12: Two droplet based systems, namely (A) T-junction and (B) �owfocusing [9].
to a voltage, produce heat. Platinum and polysilicon thin �lm heaters are mostcommon [125]. However, other implementations do exist [33, 106]. A drawbackto this technique is the increased fabrication complexity of the device. Ingeneral, we are not concerned with re-usability of PCR chips, due to cross-contamination of samples, and thus the cost e�ciency of fabricating thin �lmheaters on single-use chips outweighs their potential bene�ts.
Peltier Elements Thermoelectric cooling operates based on the Peltier ef-fect, namely when a current is passed between two electrically dissimilar mate-rials, most commonly p- and n- type semiconductor materials, heat is absorbedor released at the junction [126]. The absorbtion/release of heat is dependenton the direction of current �ow, and in Peltier elements this current �ow pro-duces a "hot" and "cold" on the device.
The use of PE in micro�uidic applications has been extensive, largely dueto their ease of operation, cost e�ciency and their ability to function as aheater and cooler [127, 128, 16, 129]. Kim et al. reported the fabrication of aPDMS based CF-PCR device, where thermal regulation was achieved using 3TE elements in conjunction with an external PID controller [127]. Detectableamounts of PCR product were observed after reactions of only 8-30 minutes.
The use of 2 platinum heating blocks, one for denaturation and the other
Stellenbosch University https://scholar.sun.ac.za
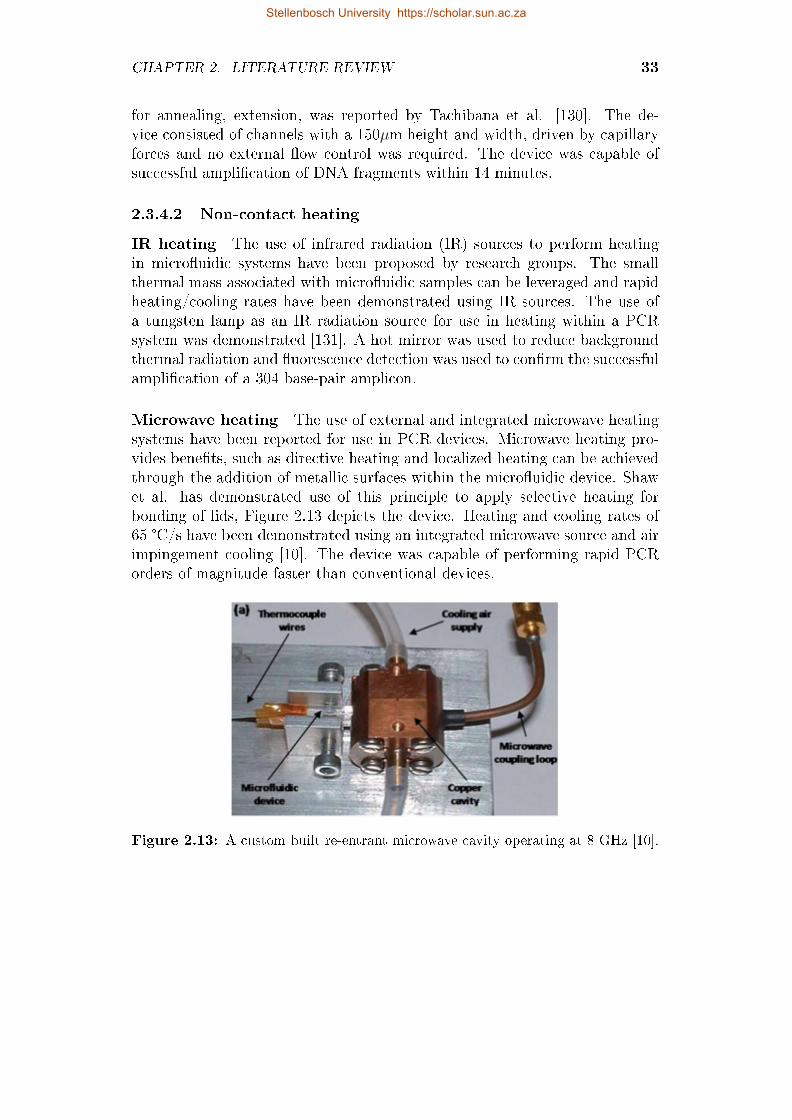
CHAPTER 2. LITERATURE REVIEW 33
for annealing, extension, was reported by Tachibana et al. [130]. The de-vice consisted of channels with a 150µm height and width, driven by capillaryforces and no external �ow control was required. The device was capable ofsuccessful ampli�cation of DNA fragments within 14 minutes.
2.3.4.2 Non-contact heating
IR heating The use of infrared radiation (IR) sources to perform heatingin micro�uidic systems have been proposed by research groups. The smallthermal mass associated with micro�uidic samples can be leveraged and rapidheating/cooling rates have been demonstrated using IR sources. The use ofa tungsten lamp as an IR radiation source for use in heating within a PCRsystem was demonstrated [131]. A hot mirror was used to reduce backgroundthermal radiation and �uorescence detection was used to con�rm the successfulampli�cation of a 304 base-pair amplicon.
Microwave heating The use of external and integrated microwave heatingsystems have been reported for use in PCR devices. Microwave heating pro-vides bene�ts, such as directive heating and localized heating can be achievedthrough the addition of metallic surfaces within the micro�uidic device. Shawet al. has demonstrated use of this principle to apply selective heating forbonding of lids, Figure 2.13 depicts the device. Heating and cooling rates of65 °C/s have been demonstrated using an integrated microwave source and airimpingement cooling [10]. The device was capable of performing rapid PCRorders of magnitude faster than conventional devices.
Figure 2.13: A custom built re-entrant microwave cavity operating at 8 GHz [10].
Stellenbosch University https://scholar.sun.ac.za
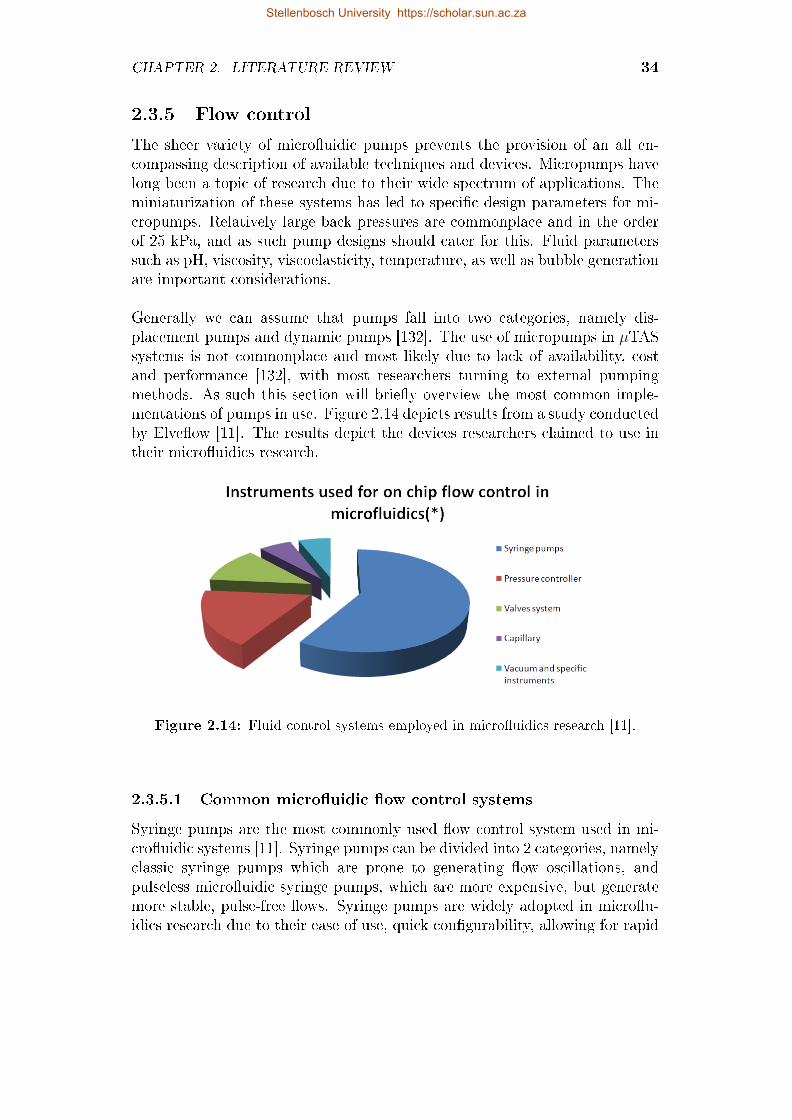
CHAPTER 2. LITERATURE REVIEW 34
2.3.5 Flow control
The sheer variety of micro�uidic pumps prevents the provision of an all en-compassing description of available techniques and devices. Micropumps havelong been a topic of research due to their wide spectrum of applications. Theminiaturization of these systems has led to speci�c design parameters for mi-cropumps. Relatively large back pressures are commonplace and in the orderof 25 kPa, and as such pump designs should cater for this. Fluid parameterssuch as pH, viscosity, viscoelasticity, temperature, as well as bubble generationare important considerations.
Generally we can assume that pumps fall into two categories, namely dis-placement pumps and dynamic pumps [132]. The use of micropumps in µTASsystems is not commonplace and most likely due to lack of availability, costand performance [132], with most researchers turning to external pumpingmethods. As such this section will brie�y overview the most common imple-mentations of pumps in use. Figure 2.14 depicts results from a study conductedby Elve�ow [11]. The results depict the devices researchers claimed to use intheir micro�uidics research.
Figure 2.14: Fluid control systems employed in micro�uidics research [11].
2.3.5.1 Common micro�uidic �ow control systems
Syringe pumps are the most commonly used �ow control system used in mi-cro�uidic systems [11]. Syringe pumps can be divided into 2 categories, namelyclassic syringe pumps which are prone to generating �ow oscillations, andpulseless micro�uidic syringe pumps, which are more expensive, but generatemore stable, pulse-free �ows. Syringe pumps are widely adopted in micro�u-idics research due to their ease of use, quick con�gurability, allowing for rapid
Stellenbosch University https://scholar.sun.ac.za
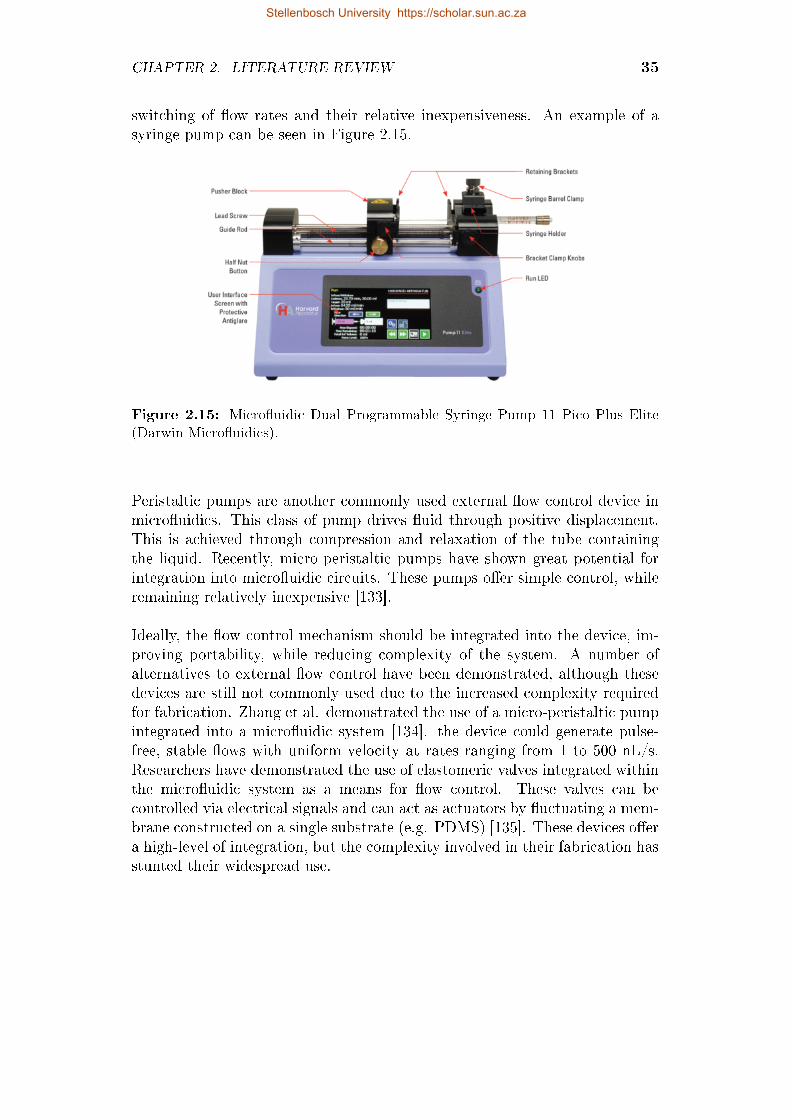
CHAPTER 2. LITERATURE REVIEW 35
switching of �ow rates and their relative inexpensiveness. An example of asyringe pump can be seen in Figure 2.15.
Figure 2.15: Micro�uidic Dual Programmable Syringe Pump 11 Pico Plus Elite(Darwin Micro�uidics).
Peristaltic pumps are another commonly used external �ow control device inmicro�uidics. This class of pump drives �uid through positive displacement.This is achieved through compression and relaxation of the tube containingthe liquid. Recently, micro-peristaltic pumps have shown great potential forintegration into micro�uidic circuits. These pumps o�er simple control, whileremaining relatively inexpensive [133].
Ideally, the �ow control mechanism should be integrated into the device, im-proving portability, while reducing complexity of the system. A number ofalternatives to external �ow control have been demonstrated, although thesedevices are still not commonly used due to the increased complexity requiredfor fabrication. Zhang et al. demonstrated the use of a micro-peristaltic pumpintegrated into a micro�uidic system [134]. the device could generate pulse-free, stable �ows with uniform velocity at rates ranging from 1 to 500 nL/s.Researchers have demonstrated the use of elastomeric valves integrated withinthe micro�uidic system as a means for �ow control. These valves can becontrolled via electrical signals and can act as actuators by �uctuating a mem-brane constructed on a single substrate (e.g. PDMS) [135]. These devices o�era high-level of integration, but the complexity involved in their fabrication hasstunted their widespread use.
Stellenbosch University https://scholar.sun.ac.za
CHAPTER 2. LITERATURE REVIEW 36
2.4 Conclusion
The literature review provided a brief overview of the general micro�uidicsprinciples that researchers leverage to fabricate a variety of micro�uidic de-vices. A detailed investigation on current fabrication technologies, substratesand devices was conducted and presented. Silicon/glass micro�uidic deviceshave been largely abandoned, except in special cases, for the newer thermo-plastic/polymer class of substrates, due to their favorable properties. Bondingtechniques were described and �ow mechanisms currently employed in litera-ture were discussed. The PCR was detailed and micro�uidic implementationswere presented as a comparable basis for the
en design.
Stellenbosch University https://scholar.sun.ac.za
Chapter 3
Design and fabrication
3.1 Design overview
The importance of disposability and it's relation to cost is a key design con-sideration for PCR micro�uidic chips. Cross-contamination of samples can beavoided by using cheap, readily disposable chips. Commercial grade PMMAwas acquired for the substrate in an e�ort to conform to the disposabilityand cost criteria for POC PCR devices. A serpentine channel continuous-�ow device was designed to transport the droplet through 3 static tempera-ture regions on the device. Channels were etched using CO2 laser ablation, atechnique which allowed for the rapid fabrication of multiple prototype chipswithin minutes. The temperature regions were realized by Peltier heaters,coupled to OTS digital thermostats. Integration of heat measurements wasavoided to provide disposability of chips, temperature probes were mountedon aluminum sheets and temperature was measured externally. Temperaturegradients across PMMA chips were realized with 2 heater con�gurations. Theavoidance of costly micro�uidic connector components was avoided by design-ing inlet/outlet holes to allow for the tubing to �t within and applying anepoxy mixture to act as a sealant. A syringe pump was used to achieve �owcontrol of 20 µL samples and a bench-top PSU was used as a supply for theelectronics and heaters.
Although this device is not strictly "POC", through replacement of the PSUand �ow control methods, a fully portable POC version could be realized. Con-forming to low cost was a large factor in the realization of a fully POC devicewith acquisition of micro-pumps, micro-Peltiers being di�cult and costly. Asthis was the prototype device, benchtop equivalents were used.
37
Stellenbosch University https://scholar.sun.ac.za
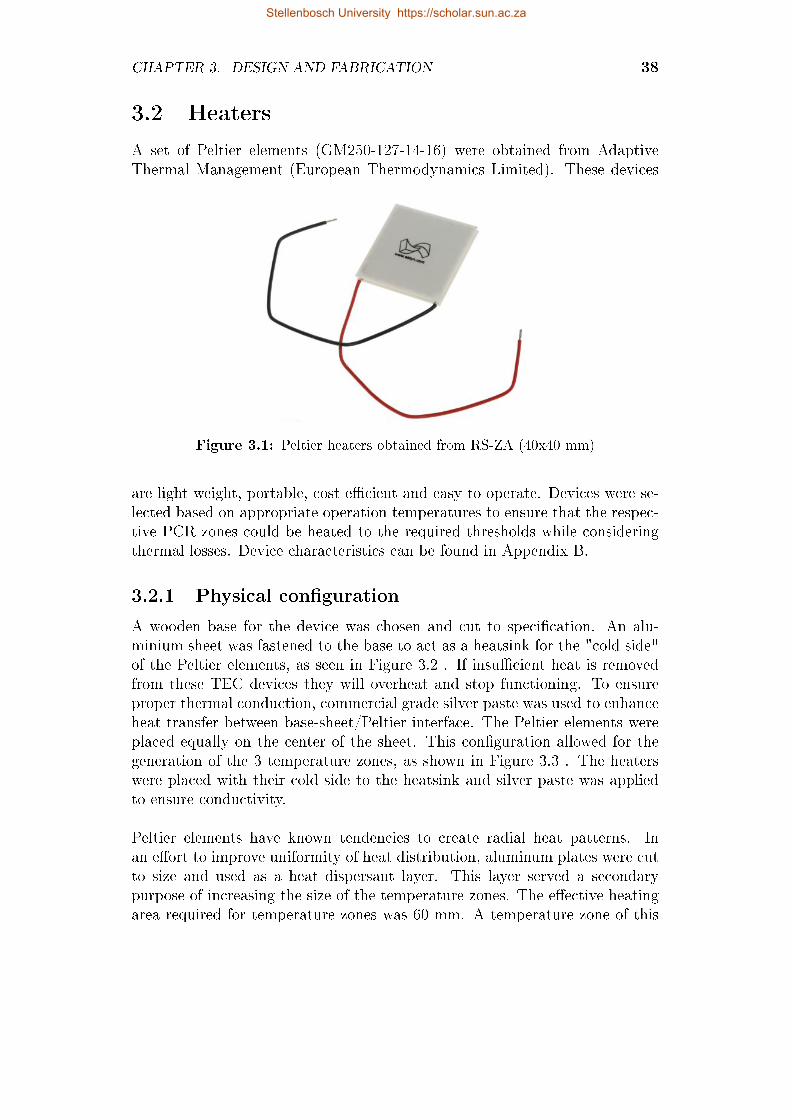
CHAPTER 3. DESIGN AND FABRICATION 38
3.2 Heaters
A set of Peltier elements (GM250-127-14-16) were obtained from AdaptiveThermal Management (European Thermodynamics Limited). These devices
Figure 3.1: Peltier heaters obtained from RS-ZA (40x40 mm)
are light weight, portable, cost e�cient and easy to operate. Devices were se-lected based on appropriate operation temperatures to ensure that the respec-tive PCR zones could be heated to the required thresholds while consideringthermal losses. Device characteristics can be found in Appendix B.
3.2.1 Physical con�guration
A wooden base for the device was chosen and cut to speci�cation. An alu-minium sheet was fastened to the base to act as a heatsink for the "cold side"of the Peltier elements, as seen in Figure 3.2 . If insu�cient heat is removedfrom these TEC devices they will overheat and stop functioning. To ensureproper thermal conduction, commercial grade silver paste was used to enhanceheat transfer between base-sheet/Peltier interface. The Peltier elements wereplaced equally on the center of the sheet. This con�guration allowed for thegeneration of the 3 temperature zones, as shown in Figure 3.3 . The heaterswere placed with their cold side to the heatsink and silver paste was appliedto ensure conductivity.
Peltier elements have known tendencies to create radial heat patterns. Inan e�ort to improve uniformity of heat distribution, aluminum plates were cutto size and used as a heat dispersant layer. This layer served a secondarypurpose of increasing the size of the temperature zones. The e�ective heatingarea required for temperature zones was 60 mm. A temperature zone of this
Stellenbosch University https://scholar.sun.ac.za
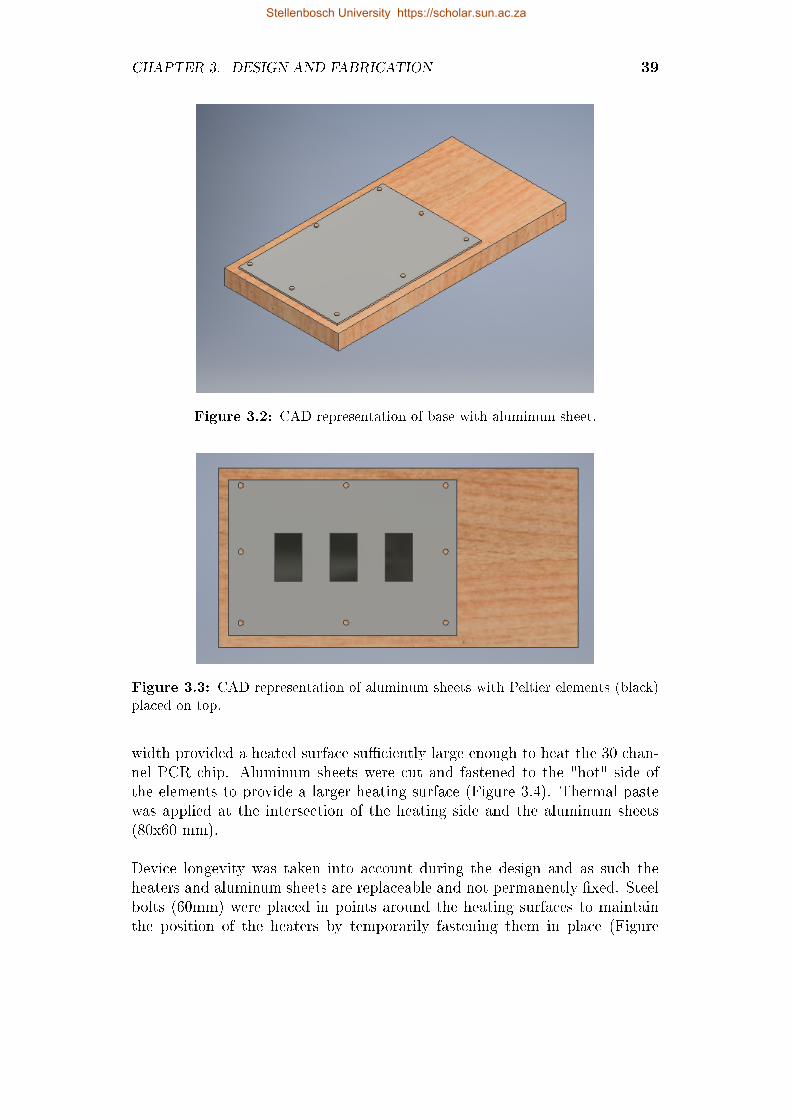
CHAPTER 3. DESIGN AND FABRICATION 39
Figure 3.2: CAD representation of base with aluminum sheet.
Figure 3.3: CAD representation of aluminum sheets with Peltier elements (black)placed on top.
width provided a heated surface su�ciently large enough to heat the 30 chan-nel PCR chip. Aluminum sheets were cut and fastened to the "hot" side ofthe elements to provide a larger heating surface (Figure 3.4). Thermal pastewas applied at the intersection of the heating side and the aluminum sheets(80x60 mm).
Device longevity was taken into account during the design and as such theheaters and aluminum sheets are replaceable and not permanently �xed. Steelbolts (60mm) were placed in points around the heating surfaces to maintainthe position of the heaters by temporarily fastening them in place (Figure
Stellenbosch University https://scholar.sun.ac.za
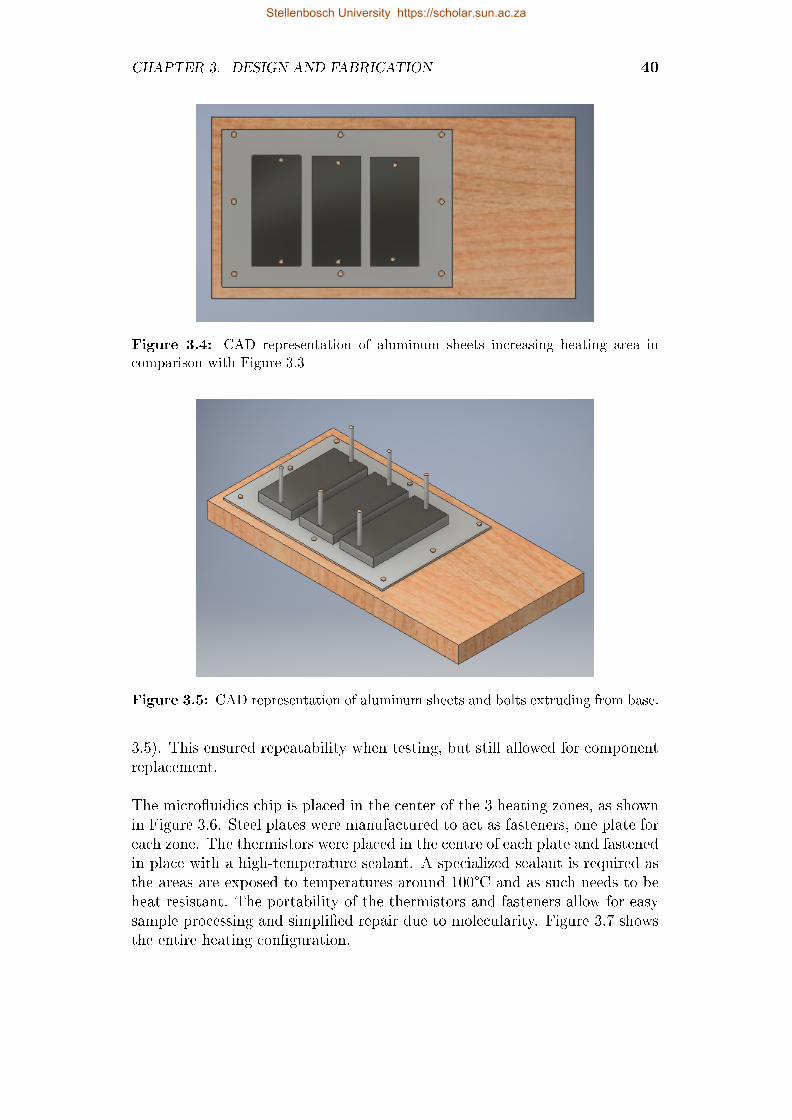
CHAPTER 3. DESIGN AND FABRICATION 40
Figure 3.4: CAD representation of aluminum sheets increasing heating area incomparison with Figure 3.3
Figure 3.5: CAD representation of aluminum sheets and bolts extruding from base.
3.5). This ensured repeatability when testing, but still allowed for componentreplacement.
The micro�uidics chip is placed in the center of the 3 heating zones, as shownin Figure 3.6. Steel plates were manufactured to act as fasteners, one plate foreach zone. The thermistors were placed in the centre of each plate and fastenedin place with a high-temperature sealant. A specialized sealant is required asthe areas are exposed to temperatures around 100°C and as such needs to beheat resistant. The portability of the thermistors and fasteners allow for easysample processing and simpli�ed repair due to molecularity. Figure 3.7 showsthe entire heating con�guration.
Stellenbosch University https://scholar.sun.ac.za
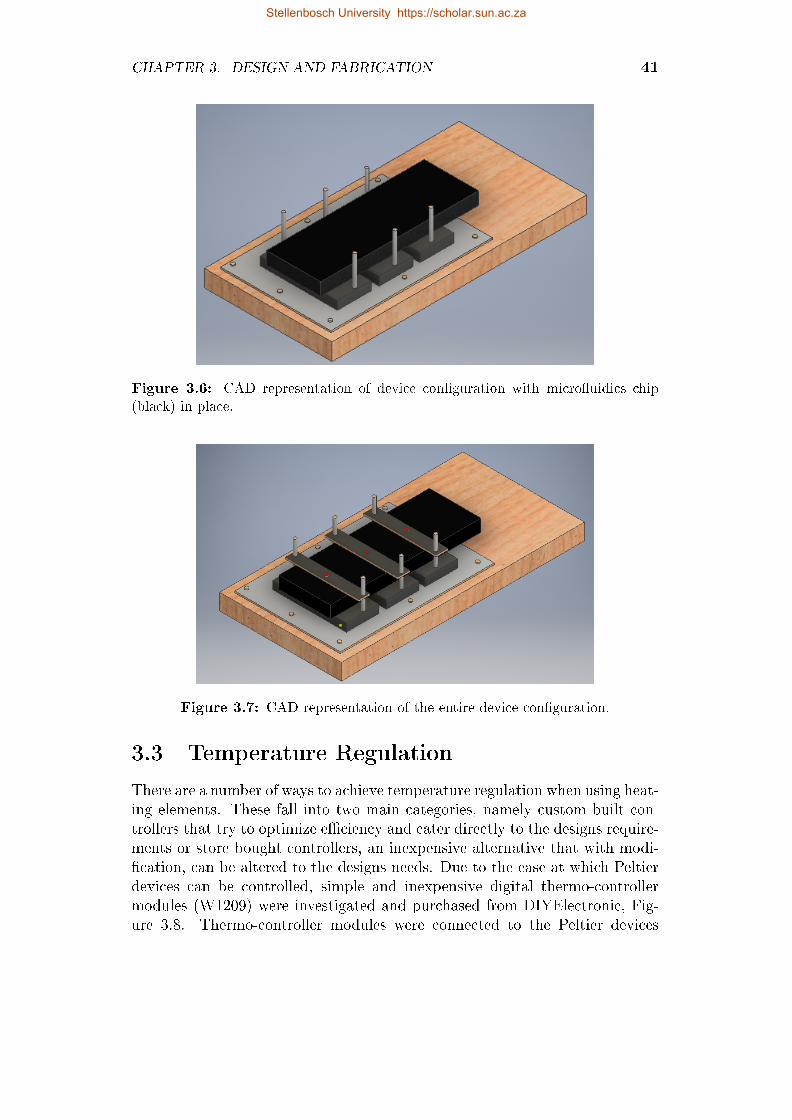
CHAPTER 3. DESIGN AND FABRICATION 41
Figure 3.6: CAD representation of device con�guration with micro�uidics chip(black) in place.
Figure 3.7: CAD representation of the entire device con�guration.
3.3 Temperature Regulation
There are a number of ways to achieve temperature regulation when using heat-ing elements. These fall into two main categories, namely custom built con-trollers that try to optimize e�ciency and cater directly to the designs require-ments or store bought controllers, an inexpensive alternative that with modi-�cation, can be altered to the designs needs. Due to the ease at which Peltierdevices can be controlled, simple and inexpensive digital thermo-controllermodules (W1209) were investigated and purchased from DIYElectronic, Fig-ure 3.8. Thermo-controller modules were connected to the Peltier devices
Stellenbosch University https://scholar.sun.ac.za
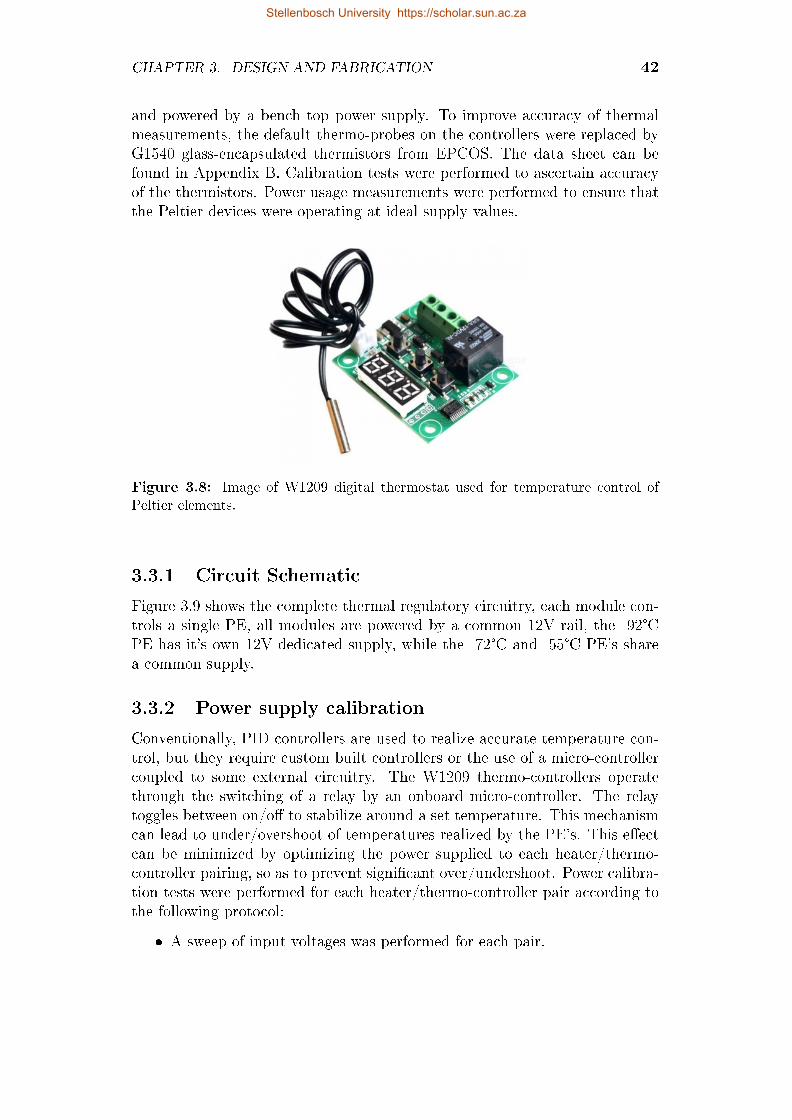
CHAPTER 3. DESIGN AND FABRICATION 42
and powered by a bench top power supply. To improve accuracy of thermalmeasurements, the default thermo-probes on the controllers were replaced byG1540 glass-encapsulated thermistors from EPCOS. The data sheet can befound in Appendix B. Calibration tests were performed to ascertain accuracyof the thermistors. Power usage measurements were performed to ensure thatthe Peltier devices were operating at ideal supply values.
Figure 3.8: Image of W1209 digital thermostat used for temperature control ofPeltier elements.
3.3.1 Circuit Schematic
Figure 3.9 shows the complete thermal regulatory circuitry, each module con-trols a single PE, all modules are powered by a common 12V rail, the 92°CPE has it's own 12V dedicated supply, while the 72°C and 55°C PE's sharea common supply.
3.3.2 Power supply calibration
Conventionally, PID controllers are used to realize accurate temperature con-trol, but they require custom built controllers or the use of a micro-controllercoupled to some external circuitry. The W1209 thermo-controllers operatethrough the switching of a relay by an onboard micro-controller. The relaytoggles between on/o� to stabilize around a set temperature. This mechanismcan lead to under/overshoot of temperatures realized by the PE's. This e�ectcan be minimized by optimizing the power supplied to each heater/thermo-controller pairing, so as to prevent signi�cant over/undershoot. Power calibra-tion tests were performed for each heater/thermo-controller pair according tothe following protocol:
� A sweep of input voltages was performed for each pair.
Stellenbosch University https://scholar.sun.ac.za
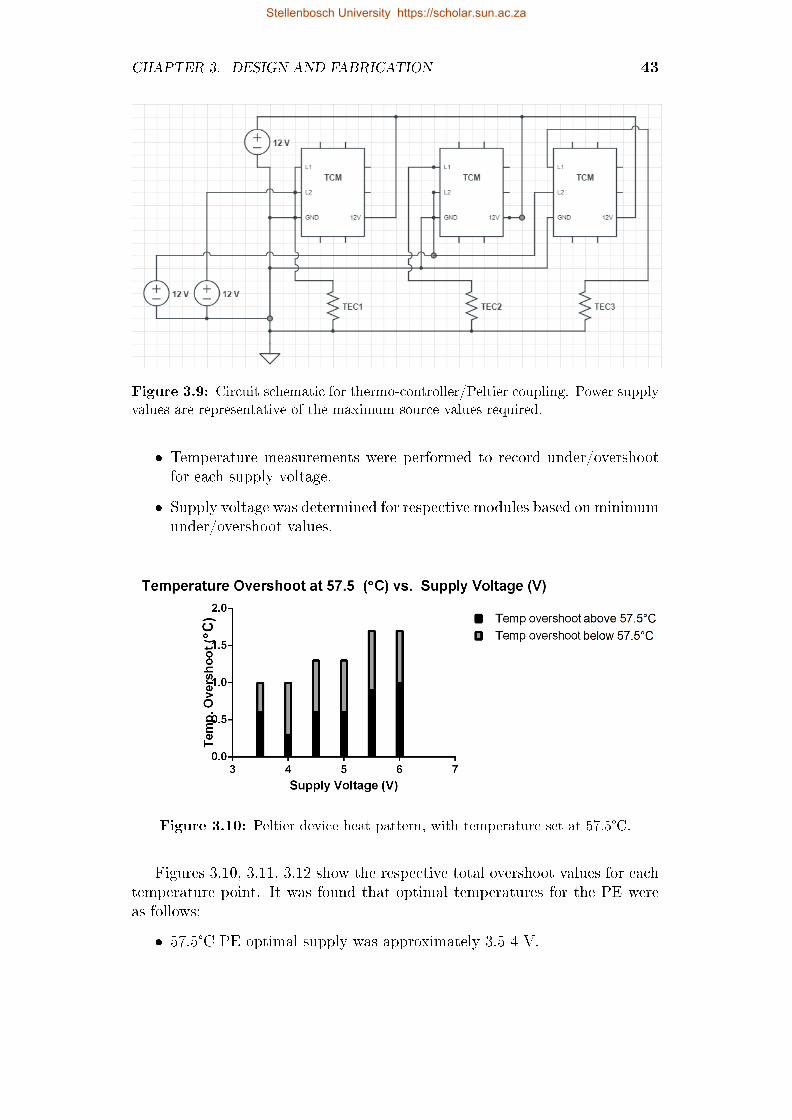
CHAPTER 3. DESIGN AND FABRICATION 43
Figure 3.9: Circuit schematic for thermo-controller/Peltier coupling. Power supplyvalues are representative of the maximum source values required.
� Temperature measurements were performed to record under/overshootfor each supply voltage.
� Supply voltage was determined for respective modules based on minimumunder/overshoot values.
Figure 3.10: Peltier device heat pattern, with temperature set at 57.5°C.
Figures 3.10, 3.11, 3.12 show the respective total overshoot values for eachtemperature point. It was found that optimal temperatures for the PE wereas follows:
� 57.5°C PE optimal supply was approximately 3.5-4 V.
Stellenbosch University https://scholar.sun.ac.za
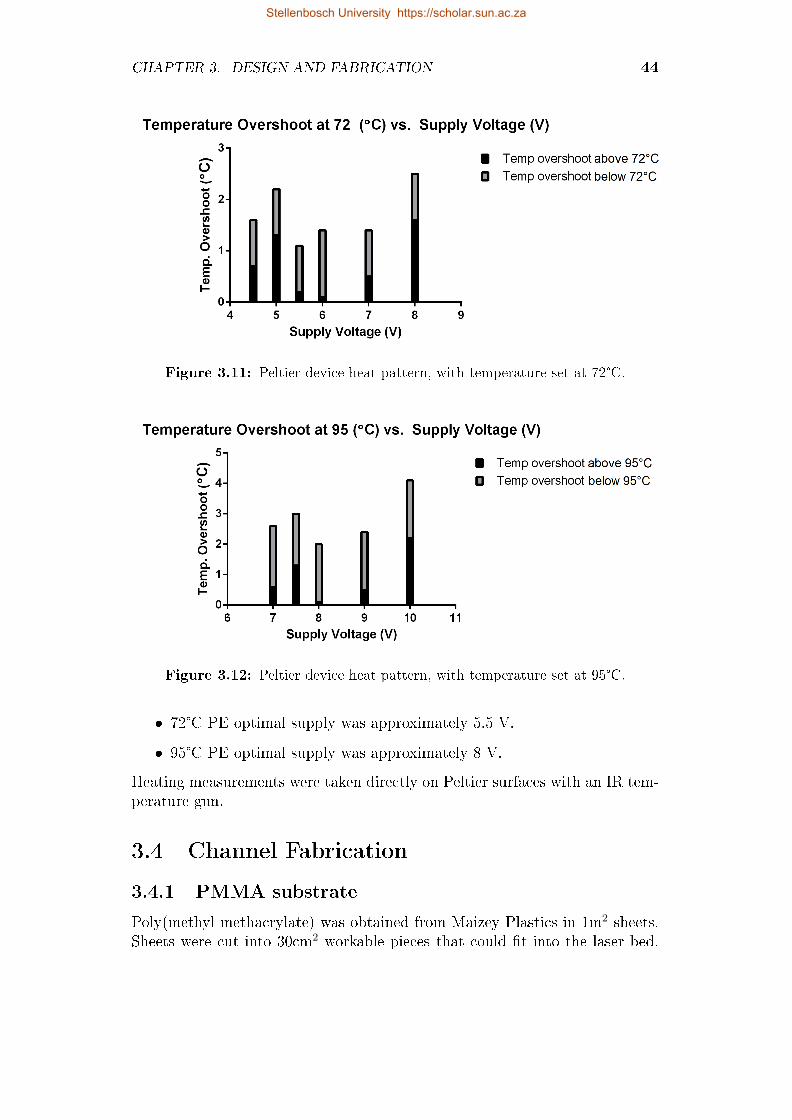
CHAPTER 3. DESIGN AND FABRICATION 44
Figure 3.11: Peltier device heat pattern, with temperature set at 72°C.
Figure 3.12: Peltier device heat pattern, with temperature set at 95°C.
� 72°C PE optimal supply was approximately 5.5 V.
� 95°C PE optimal supply was approximately 8 V.
Heating measurements were taken directly on Peltier surfaces with an IR tem-perature gun.
3.4 Channel Fabrication
3.4.1 PMMA substrate
Poly(methyl methacrylate) was obtained from Maizey Plastics in 1m2 sheets.Sheets were cut into 30cm2 workable pieces that could �t into the laser bed.
Stellenbosch University https://scholar.sun.ac.za
CHAPTER 3. DESIGN AND FABRICATION 45
PMMA allows for the use of laser ablation as a fabrication technique, whichis suitable for rapid prototyping of multiple channel designs. Due to it's lowthermal conductivity (0.167-0.25 W/m.K.) it is an ideal substrate for creatingtemperature gradients. PMMA also displays reduced non-speci�c adsorption ofDNA molecules, making it a good choice for the biocompatability requirementsof PCR devices [41]. The PMMA itself is relatively inexpensive compared toconventional micro�uidic substrates and thus ful�lled the criteria of cost anddisposability.
3.4.2 Laser ablation
Channels were realized on PMMA substrate through use of a CO2 laser (TS4040,Jinan Transcon CNC Equipment Co. LTD). The use of laser ablation allowedfor rapid prototyping of multiple device geometries until a �nal design was set-tled upon. The laser ablation process produces channels of varying dimensionsas a result of laser parameters. In order to obtain the ideal channel geometry,testing was performed to ascertain the relationship between laser parametersand channel dimensions.
3.4.3 Channel morphology testing
The relationship between channel morphology and CO2 laser parameters wasinvestigated. The CO2 laser software allows for the adjustment of 3 parameters:
� Speed (mm/s)
� Power Minimum (%)
� Power Maximum (%)
The channel's top and side pro�les were imaged using a Motic 1.3Mp micro-scope camera and measured in Motic's imaging software (Motic ImagePlus2.0). Ideally we would like the parameters that re�ect the smallest channelsize and smoothest pro�les.
3.4.3.1 Speed tests
The e�ect of the laser speed parameter was investigated by varying speed andkeeping the power variables constant. Speed values less than 50mm/s resultedin cuts too large for the imaging area and thus speeds were investigated up-wards to a speed of 100 mm/s. Table 3.1 depicts the values of parameters forthe testing.
The initial testing indicated that an increase in speed resulted in a decreaseof channel width, as shown in Figure 3.13. This was as expected as longer
Stellenbosch University https://scholar.sun.ac.za
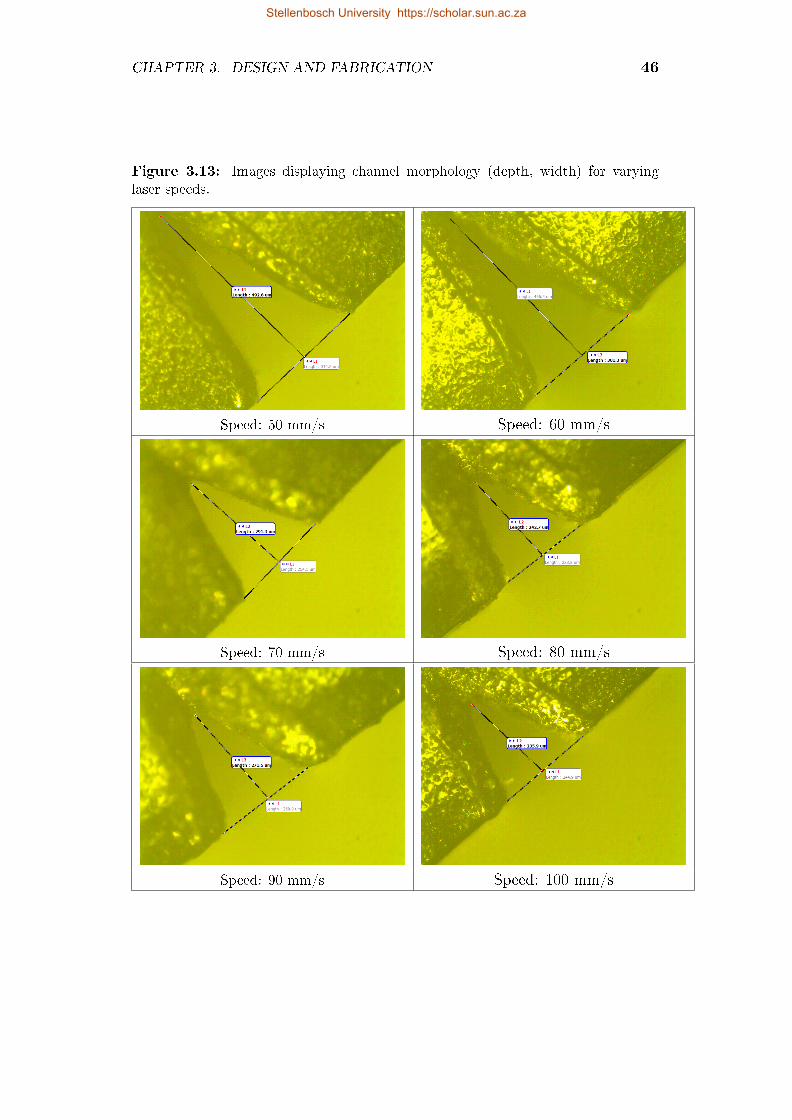
CHAPTER 3. DESIGN AND FABRICATION 46
Figure 3.13: Images displaying channel morphology (depth, width) for varyinglaser speeds.
Speed: 50 mm/s Speed: 60 mm/s
Speed: 70 mm/s Speed: 80 mm/s
Speed: 90 mm/s Speed: 100 mm/s
Stellenbosch University https://scholar.sun.ac.za
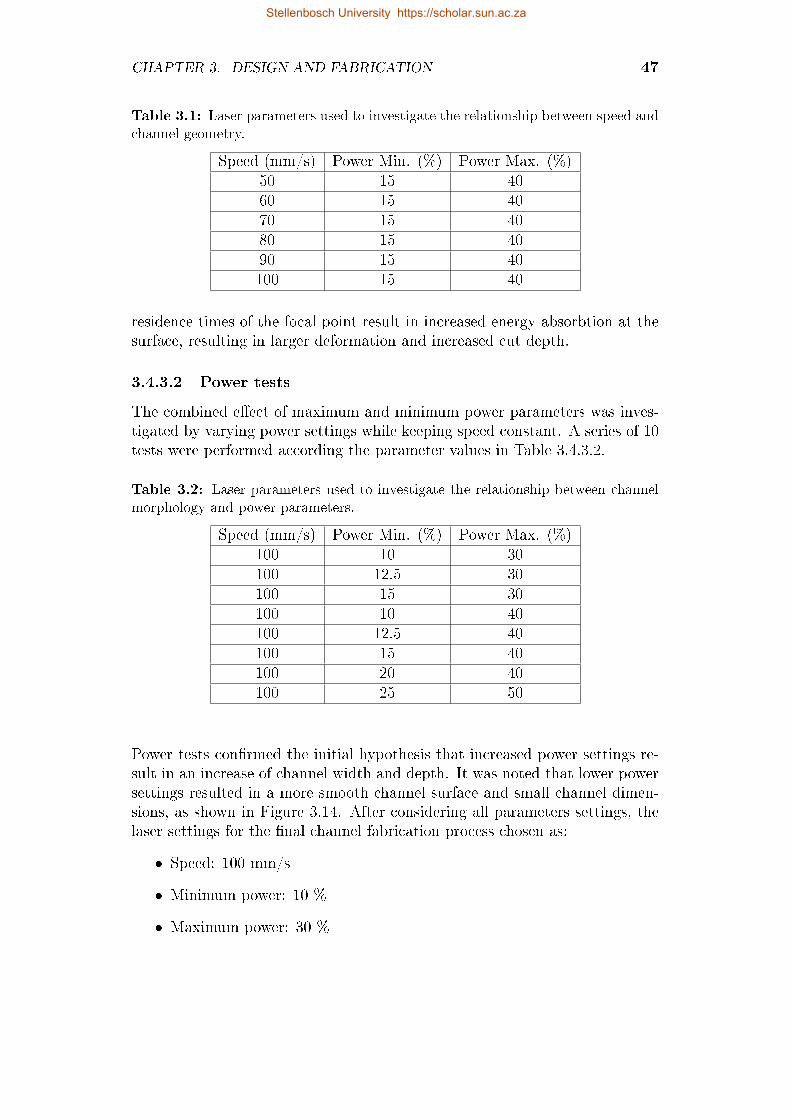
CHAPTER 3. DESIGN AND FABRICATION 47
Table 3.1: Laser parameters used to investigate the relationship between speed andchannel geometry.
Speed (mm/s) Power Min. (%) Power Max. (%)50 15 4060 15 4070 15 4080 15 4090 15 40100 15 40
residence times of the focal point result in increased energy absorbtion at thesurface, resulting in larger deformation and increased cut depth.
3.4.3.2 Power tests
The combined e�ect of maximum and minimum power parameters was inves-tigated by varying power settings while keeping speed constant. A series of 10tests were performed according the parameter values in Table 3.4.3.2.
Table 3.2: Laser parameters used to investigate the relationship between channelmorphology and power parameters.
Speed (mm/s) Power Min. (%) Power Max. (%)100 10 30100 12.5 30100 15 30100 10 40100 12.5 40100 15 40100 20 40100 25 50
Power tests con�rmed the initial hypothesis that increased power settings re-sult in an increase of channel width and depth. It was noted that lower powersettings resulted in a more smooth channel surface and small channel dimen-sions, as shown in Figure 3.14. After considering all parameters settings, thelaser settings for the �nal channel fabrication process chosen as:
� Speed: 100 mm/s
� Minimum power: 10 %
� Maximum power: 30 %
Stellenbosch University https://scholar.sun.ac.za
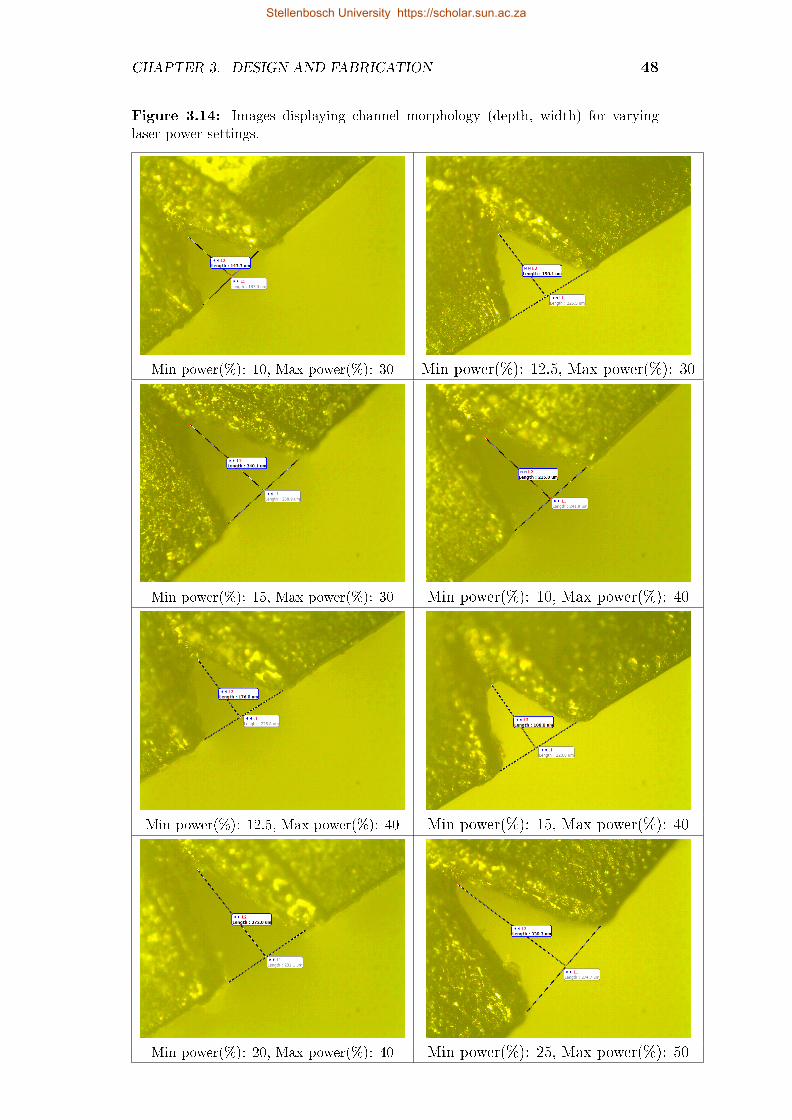
CHAPTER 3. DESIGN AND FABRICATION 48
Figure 3.14: Images displaying channel morphology (depth, width) for varyinglaser power settings.
Min power(%): 10, Max power(%): 30 Min power(%): 12.5, Max power(%): 30
Min power(%): 15, Max power(%): 30 Min power(%): 10, Max power(%): 40
Min power(%): 12.5, Max power(%): 40 Min power(%): 15, Max power(%): 40
Min power(%): 20, Max power(%): 40 Min power(%): 25, Max power(%): 50
Stellenbosch University https://scholar.sun.ac.za
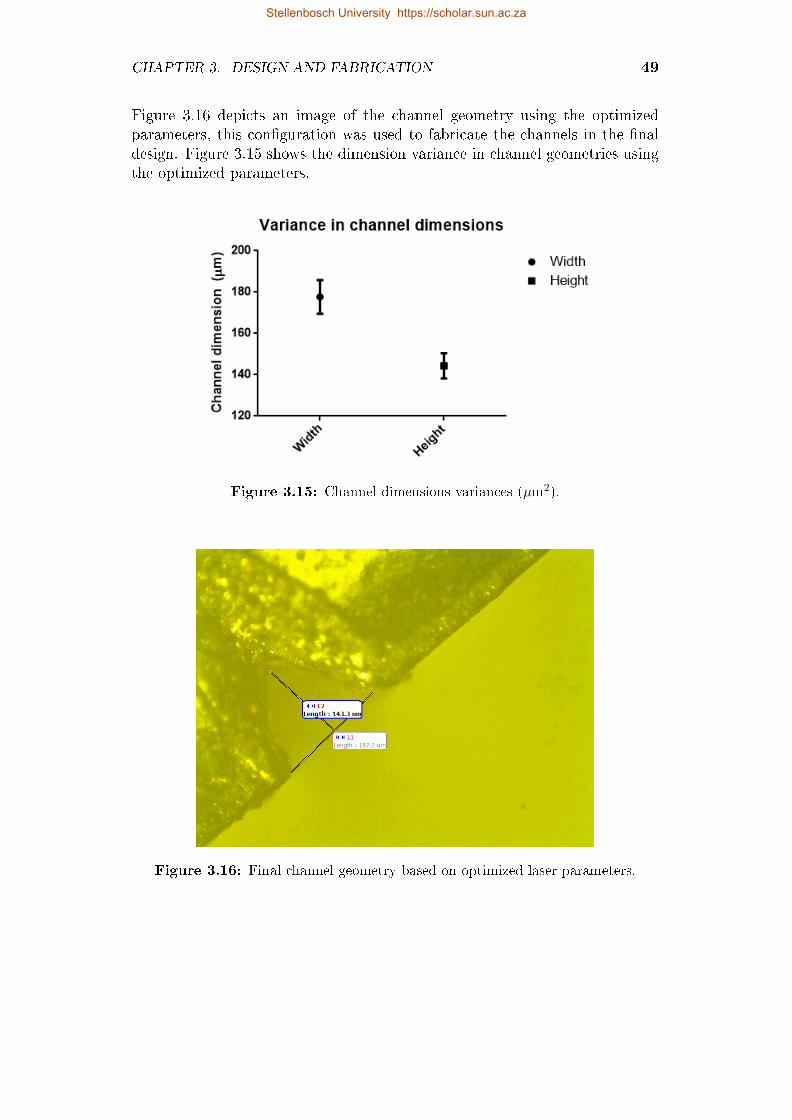
CHAPTER 3. DESIGN AND FABRICATION 49
Figure 3.16 depicts an image of the channel geometry using the optimizedparameters, this con�guration was used to fabricate the channels in the �naldesign. Figure 3.15 shows the dimension variance in channel geometries usingthe optimized parameters.
Figure 3.15: Channel dimensions variances (µm2).
Figure 3.16: Final channel geometry based on optimized laser parameters.
Stellenbosch University https://scholar.sun.ac.za
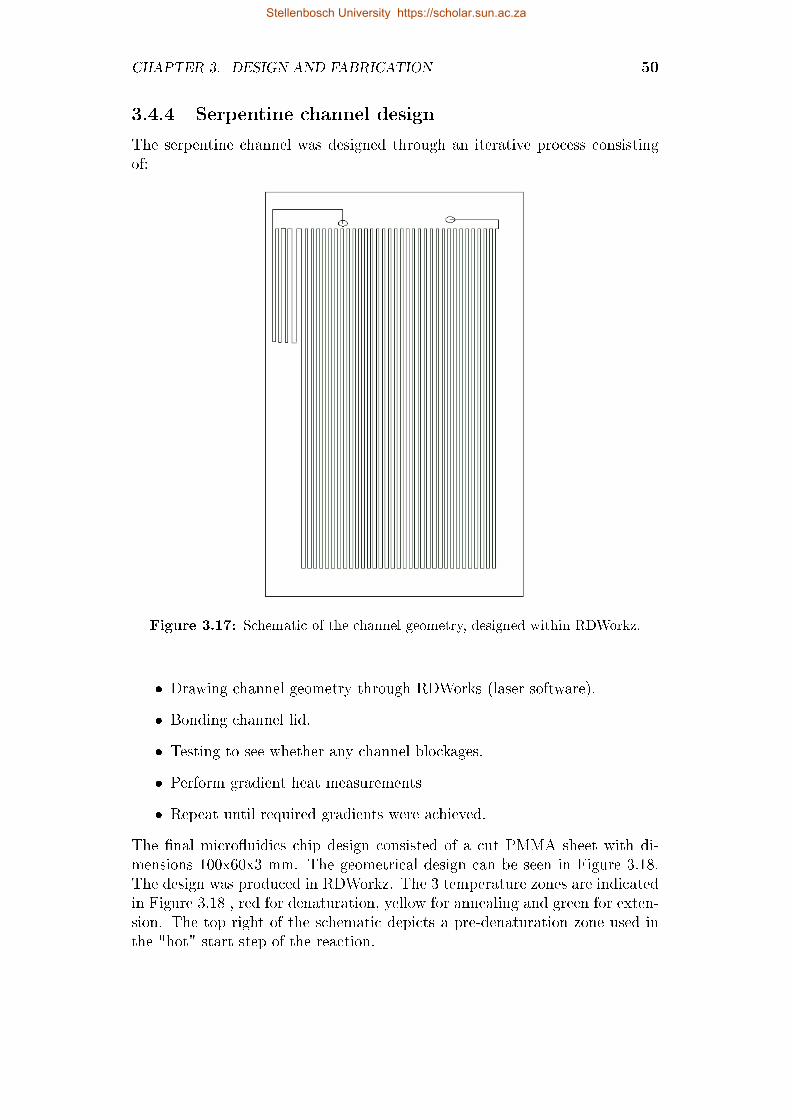
CHAPTER 3. DESIGN AND FABRICATION 50
3.4.4 Serpentine channel design
The serpentine channel was designed through an iterative process consistingof:
Figure 3.17: Schematic of the channel geometry, designed within RDWorkz.
� Drawing channel geometry through RDWorks (laser software).
� Bonding channel lid.
� Testing to see whether any channel blockages.
� Perform gradient heat measurements
� Repeat until required gradients were achieved.
The �nal micro�uidics chip design consisted of a cut PMMA sheet with di-mensions 100x60x3 mm. The geometrical design can be seen in Figure 3.18.The design was produced in RDWorkz. The 3 temperature zones are indicatedin Figure 3.18 , red for denaturation, yellow for annealing and green for exten-sion. The top right of the schematic depicts a pre-denaturation zone used inthe "hot" start step of the reaction.
Stellenbosch University https://scholar.sun.ac.za
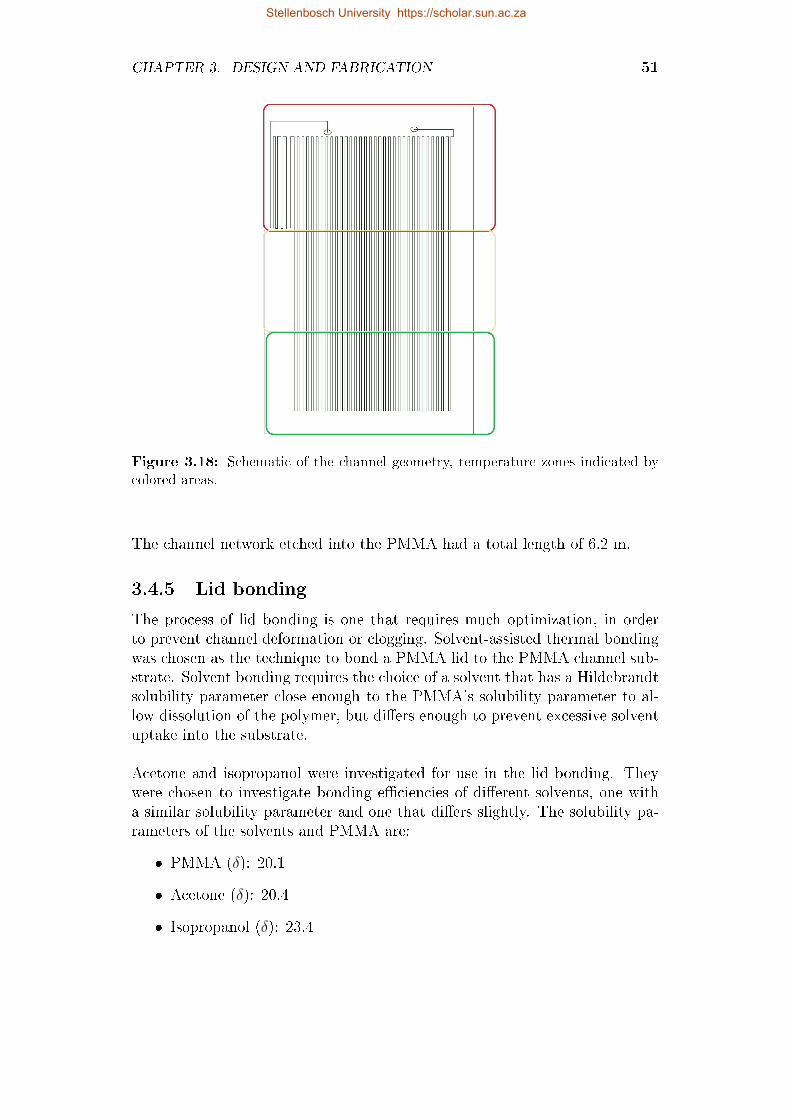
CHAPTER 3. DESIGN AND FABRICATION 51
Figure 3.18: Schematic of the channel geometry, temperature zones indicated bycolored areas.
The channel network etched into the PMMA had a total length of 6.2 m.
3.4.5 Lid bonding
The process of lid bonding is one that requires much optimization, in orderto prevent channel deformation or clogging. Solvent-assisted thermal bondingwas chosen as the technique to bond a PMMA lid to the PMMA channel sub-strate. Solvent bonding requires the choice of a solvent that has a Hildebrandtsolubility parameter close enough to the PMMA's solubility parameter to al-low dissolution of the polymer, but di�ers enough to prevent excessive solventuptake into the substrate.
Acetone and isopropanol were investigated for use in the lid bonding. Theywere chosen to investigate bonding e�ciencies of di�erent solvents, one witha similar solubility parameter and one that di�ers slightly. The solubility pa-rameters of the solvents and PMMA are:
� PMMA (δ): 20.1
� Acetone (δ): 20.4
� Isopropanol (δ): 23.4
Stellenbosch University https://scholar.sun.ac.za
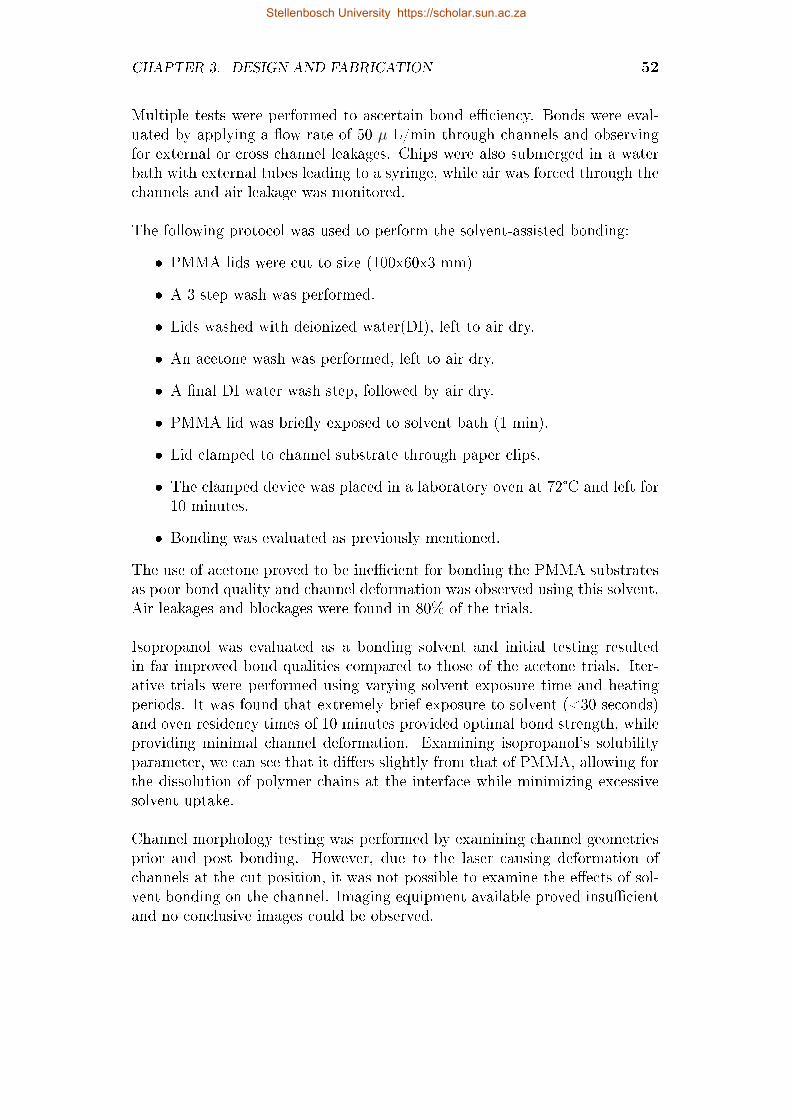
CHAPTER 3. DESIGN AND FABRICATION 52
Multiple tests were performed to ascertain bond e�ciency. Bonds were eval-uated by applying a �ow rate of 50 µ L/min through channels and observingfor external or cross channel leakages. Chips were also submerged in a waterbath with external tubes leading to a syringe, while air was forced through thechannels and air leakage was monitored.
The following protocol was used to perform the solvent-assisted bonding:
� PMMA lids were cut to size (100x60x3 mm)
� A 3 step wash was performed.
� Lids washed with deionized water(DI), left to air dry.
� An acetone wash was performed, left to air dry.
� A �nal DI water wash step, followed by air dry.
� PMMA lid was brie�y exposed to solvent bath (1 min).
� Lid clamped to channel substrate through paper clips.
� The clamped device was placed in a laboratory oven at 72°C and left for10 minutes.
� Bonding was evaluated as previously mentioned.
The use of acetone proved to be ine�cient for bonding the PMMA substratesas poor bond quality and channel deformation was observed using this solvent.Air leakages and blockages were found in 80% of the trials.
Isopropanol was evaluated as a bonding solvent and initial testing resultedin far improved bond qualities compared to those of the acetone trials. Iter-ative trials were performed using varying solvent exposure time and heatingperiods. It was found that extremely brief exposure to solvent (<30 seconds)and oven residency times of 10 minutes provided optimal bond strength, whileproviding minimal channel deformation. Examining isopropanol's solubilityparameter, we can see that it di�ers slightly from that of PMMA, allowing forthe dissolution of polymer chains at the interface while minimizing excessivesolvent uptake.
Channel morphology testing was performed by examining channel geometriesprior and post bonding. However, due to the laser causing deformation ofchannels at the cut position, it was not possible to examine the e�ects of sol-vent bonding on the channel. Imaging equipment available proved insu�cientand no conclusive images could be observed.
Stellenbosch University https://scholar.sun.ac.za
CHAPTER 3. DESIGN AND FABRICATION 53
3.4.6 External connections
The use of commercial micro�uidic connections was avoided due to cost andavailability. Tygon �exible tubing (Saint-Gobain Performance Plastics France),with inner and outer diamaters (φi and φD) of 0.8 mm and 2.4 mm respec-tively, was used. External connections for the syringe pump (inlet) and outletwere laser ablated on the PMMA substrate and circular through-holes with di-mensions of 2.35 mm were used. Due to the compressible nature of the tubing,end points of the tube could be inserted into external connection ports on themicro�uidics chip with minimal air leakage, as shown in Figure 3.19. Epoxy(Quickset Clear, Pratley) was used to ensure that connections were secure andno air or �uid loss occurred during operation.
Figure 3.19: Tubing inserted into connections points. Epoxy (Quickset) can beseen surrounding the connection point.
3.4.7 Flow control
Flow control of the sample was achieved by using a NE-300 Syringe pump (NewEra Pump Systems, Inc), as shown in Figure 3.20. The pump was connectedto the micro�uidics chip through placing the connector tube in the syringe'soutlet and placing the syringe on the stage. Variable �ow rates are possibleand a number of these were tested. The results can be seen in Chapter 4.
3.5 Conclusion
A PCR micro�uidic device was fabricated according to the methodologies andmaterials mentioned in Chapter 3. An image of the fabricated device can be
Stellenbosch University https://scholar.sun.ac.za
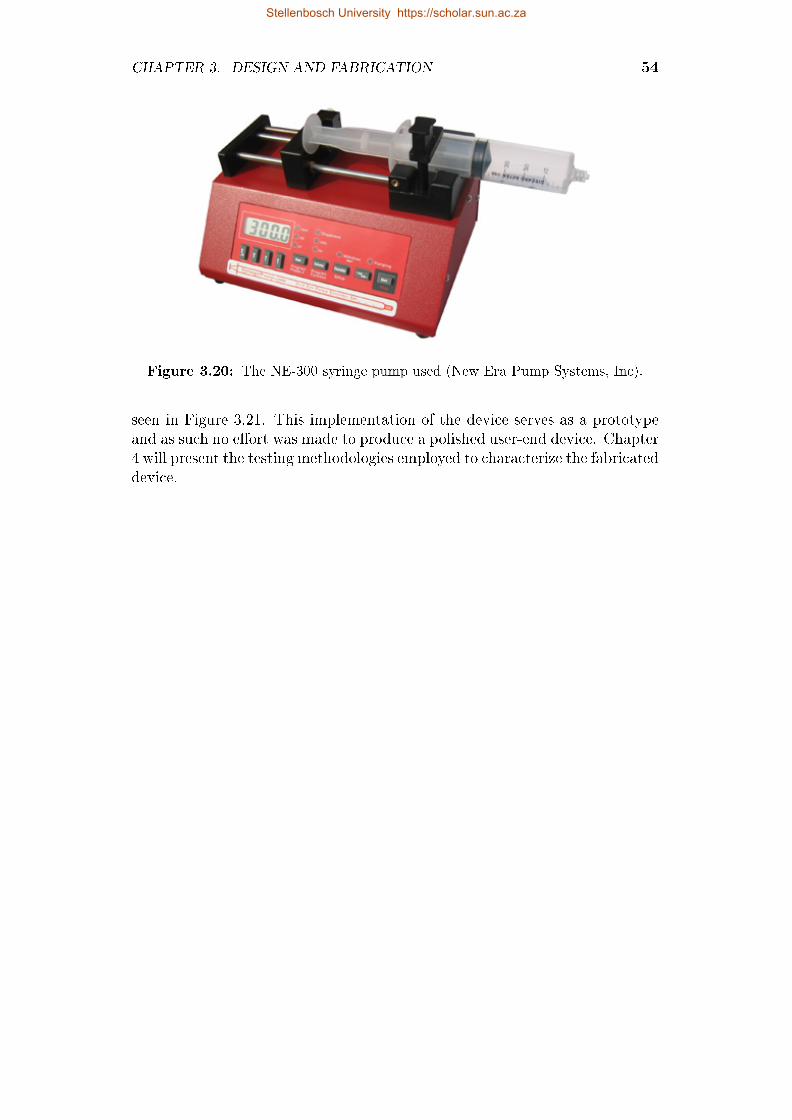
CHAPTER 3. DESIGN AND FABRICATION 54
Figure 3.20: The NE-300 syringe pump used (New Era Pump Systems, Inc).
seen in Figure 3.21. This implementation of the device serves as a prototypeand as such no e�ort was made to produce a polished user-end device. Chapter4 will present the testing methodologies employed to characterize the fabricateddevice.
Stellenbosch University https://scholar.sun.ac.za
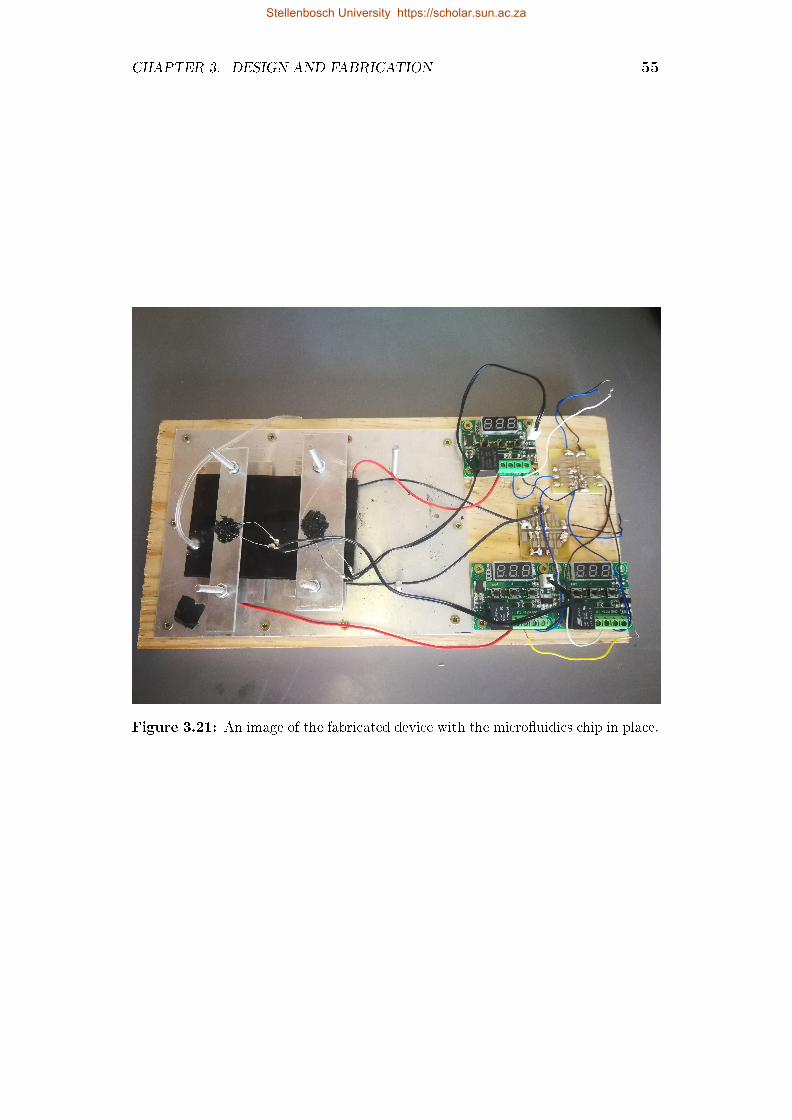
CHAPTER 3. DESIGN AND FABRICATION 55
Figure 3.21: An image of the fabricated device with the micro�uidics chip in place.
Stellenbosch University https://scholar.sun.ac.za
Chapter 4
Testing methodology and results.
4.1 Introduction
This chapter will present the testing methodology adapted to characterize thedevice fabricated according to the speci�cations in Chapter 3. Heating testswere performed to ensure that the correct temperature gradients were cre-ated across the PMMA micro�uidics chip. Thermistor measurements werecalibrated with an IR temperature gun. Flow rate was characterized by com-paring predicted �ow rates with actual �ow through times. Fluid samples wereimaged to verify that �uids remained within their channels, no cross channel�ow occurred and bubble formation was minimal. These tests were necessaryto validate that device conditions matched those required for correct PCRampli�cation, namely that temperature zones were accurate and distinct, andsample residency times within thermal zones were su�cient.
Ampli�cation of a 200 bp DNA fragment was performed at varying �ow rates.Ampli�cation e�ciencies at di�erent sample residency times were comparedand a conclusion on optimal �ow rates was reached, based on ampli�cationresults.
4.2 Heating calibration tests
4.2.1 Test Protocols
Sets of temperature measurements were taken to con�rm the thermistor accu-racy against actual temperature. An Infrared(IR) thermometer, MT695 (Ma-jorTECH), was used to calibrate thermistor measurements. The test protocolused was as follows:
� Heating zones were split into a grid of 12 elements.
� Controllers were with supplied power.
56
Stellenbosch University https://scholar.sun.ac.za
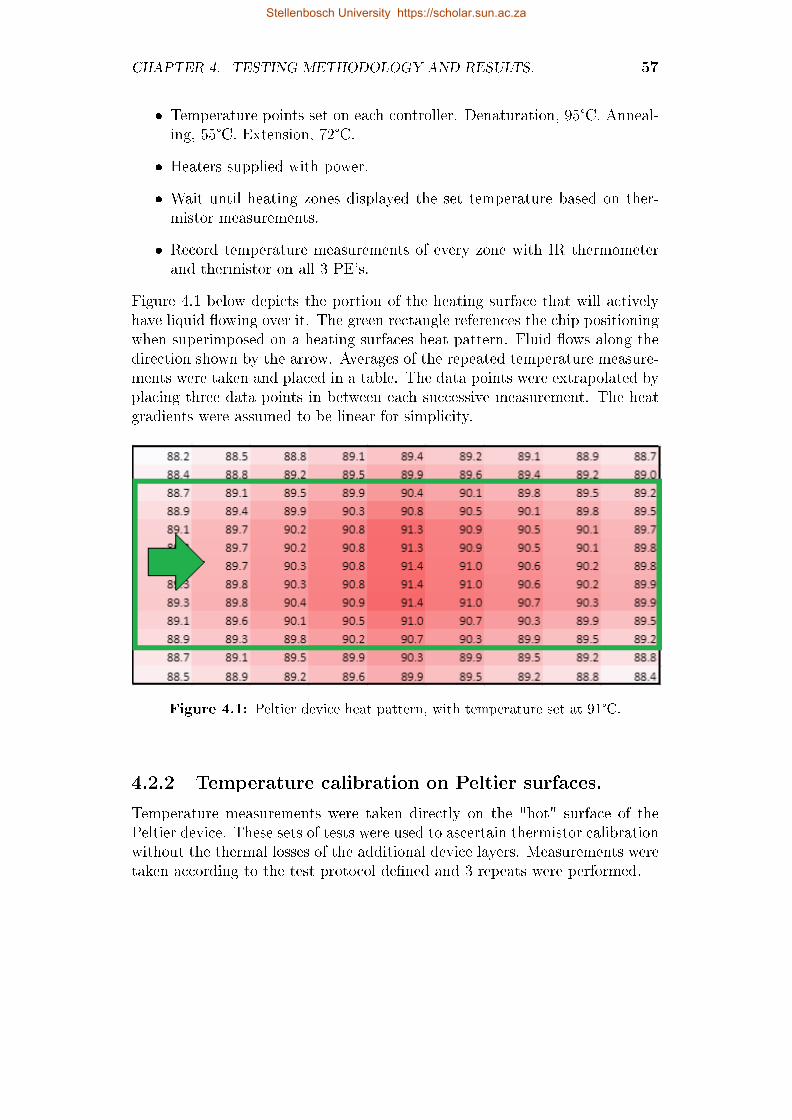
CHAPTER 4. TESTING METHODOLOGY AND RESULTS. 57
� Temperature points set on each controller. Denaturation, 95°C. Anneal-ing, 55°C. Extension, 72°C.
� Heaters supplied with power.
� Wait until heating zones displayed the set temperature based on ther-mistor measurements.
� Record temperature measurements of every zone with IR thermometerand thermistor on all 3 PE's.
Figure 4.1 below depicts the portion of the heating surface that will activelyhave liquid �owing over it. The green rectangle references the chip positioningwhen superimposed on a heating surfaces heat pattern. Fluid �ows along thedirection shown by the arrow. Averages of the repeated temperature measure-ments were taken and placed in a table. The data points were extrapolated byplacing three data points in between each successive measurement. The heatgradients were assumed to be linear for simplicity.
Figure 4.1: Peltier device heat pattern, with temperature set at 91°C.
4.2.2 Temperature calibration on Peltier surfaces.
Temperature measurements were taken directly on the "hot" surface of thePeltier device. These sets of tests were used to ascertain thermistor calibrationwithout the thermal losses of the additional device layers. Measurements weretaken according to the test protocol de�ned and 3 repeats were performed.
Stellenbosch University https://scholar.sun.ac.za
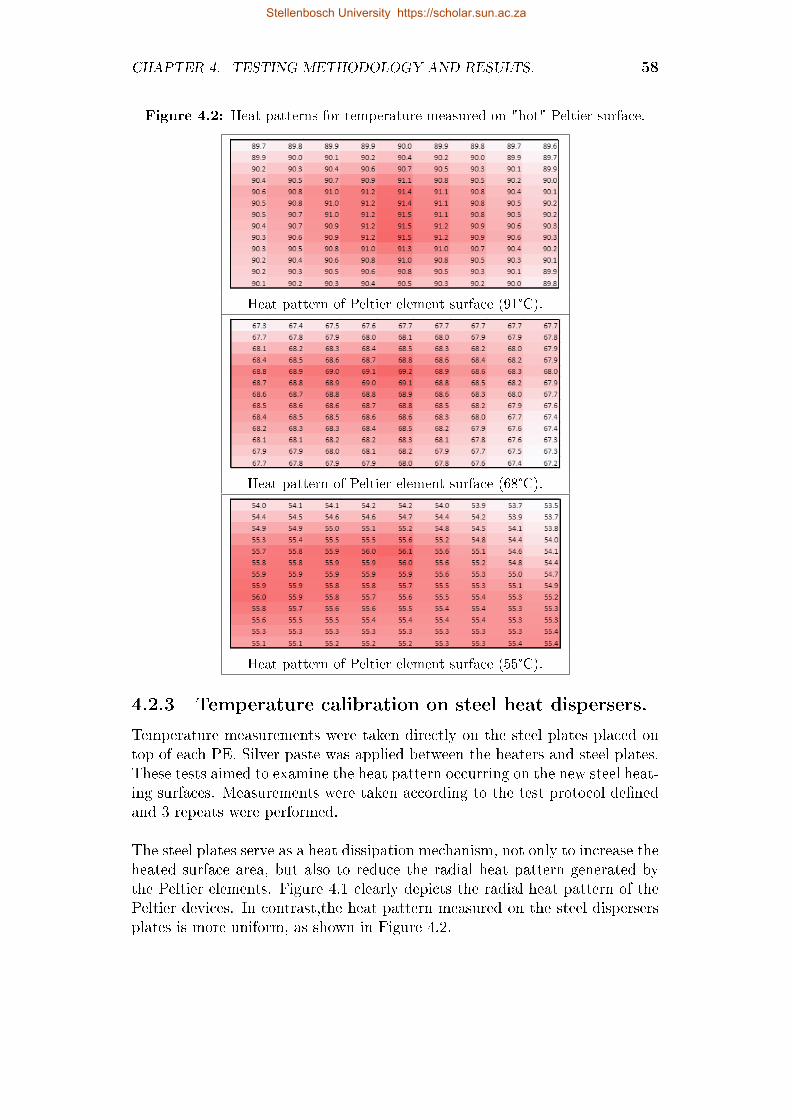
CHAPTER 4. TESTING METHODOLOGY AND RESULTS. 58
Figure 4.2: Heat patterns for temperature measured on "hot" Peltier surface.
Heat pattern of Peltier element surface (91°C).
Heat pattern of Peltier element surface (68°C).
Heat pattern of Peltier element surface (55°C).
4.2.3 Temperature calibration on steel heat dispersers.
Temperature measurements were taken directly on the steel plates placed ontop of each PE. Silver paste was applied between the heaters and steel plates.These tests aimed to examine the heat pattern occurring on the new steel heat-ing surfaces. Measurements were taken according to the test protocol de�nedand 3 repeats were performed.
The steel plates serve as a heat dissipation mechanism, not only to increase theheated surface area, but also to reduce the radial heat pattern generated bythe Peltier elements. Figure 4.1 clearly depicts the radial heat pattern of thePeltier devices. In contrast,the heat pattern measured on the steel dispersersplates is more uniform, as shown in Figure 4.2.
Stellenbosch University https://scholar.sun.ac.za
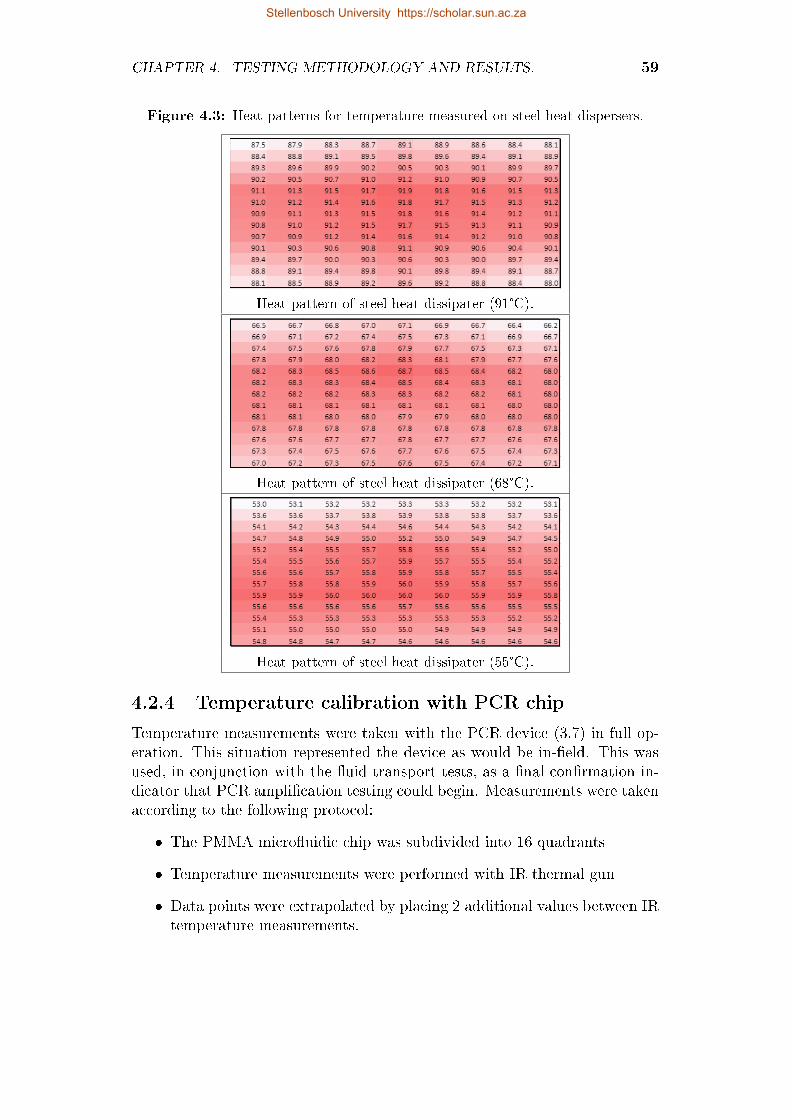
CHAPTER 4. TESTING METHODOLOGY AND RESULTS. 59
Figure 4.3: Heat patterns for temperature measured on steel heat dispersers.
Heat pattern of steel heat dissipater (91°C).
Heat pattern of steel heat dissipater (68°C).
Heat pattern of steel heat dissipater (55°C).
4.2.4 Temperature calibration with PCR chip
Temperature measurements were taken with the PCR device (3.7) in full op-eration. This situation represented the device as would be in-�eld. This wasused, in conjunction with the �uid transport tests, as a �nal con�rmation in-dicator that PCR ampli�cation testing could begin. Measurements were takenaccording to the following protocol:
� The PMMA micro�uidic chip was subdivided into 16 quadrants
� Temperature measurements were performed with IR thermal gun
� Data points were extrapolated by placing 2 additional values between IRtemperature measurements.
Stellenbosch University https://scholar.sun.ac.za
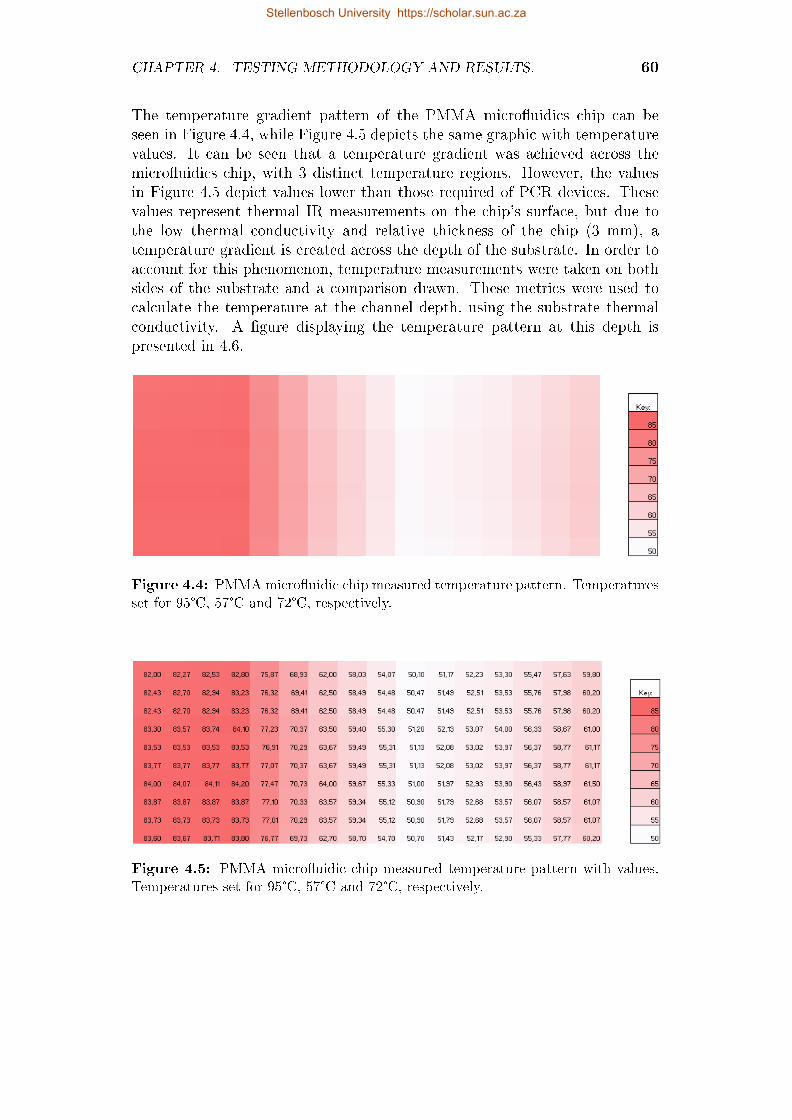
CHAPTER 4. TESTING METHODOLOGY AND RESULTS. 60
The temperature gradient pattern of the PMMA micro�uidics chip can beseen in Figure 4.4, while Figure 4.5 depicts the same graphic with temperaturevalues. It can be seen that a temperature gradient was achieved across themicro�uidics chip, with 3 distinct temperature regions. However, the valuesin Figure 4.5 depict values lower than those required of PCR devices. Thesevalues represent thermal IR measurements on the chip's surface, but due tothe low thermal conductivity and relative thickness of the chip (3 mm), atemperature gradient is created across the depth of the substrate. In order toaccount for this phenomenon, temperature measurements were taken on bothsides of the substrate and a comparison drawn. These metrics were used tocalculate the temperature at the channel depth, using the substrate thermalconductivity. A �gure displaying the temperature pattern at this depth ispresented in 4.6.
Figure 4.4: PMMAmicro�uidic chip measured temperature pattern. Temperaturesset for 95°C, 57°C and 72°C, respectively.
Figure 4.5: PMMA micro�uidic chip measured temperature pattern with values.Temperatures set for 95°C, 57°C and 72°C, respectively.
Stellenbosch University https://scholar.sun.ac.za
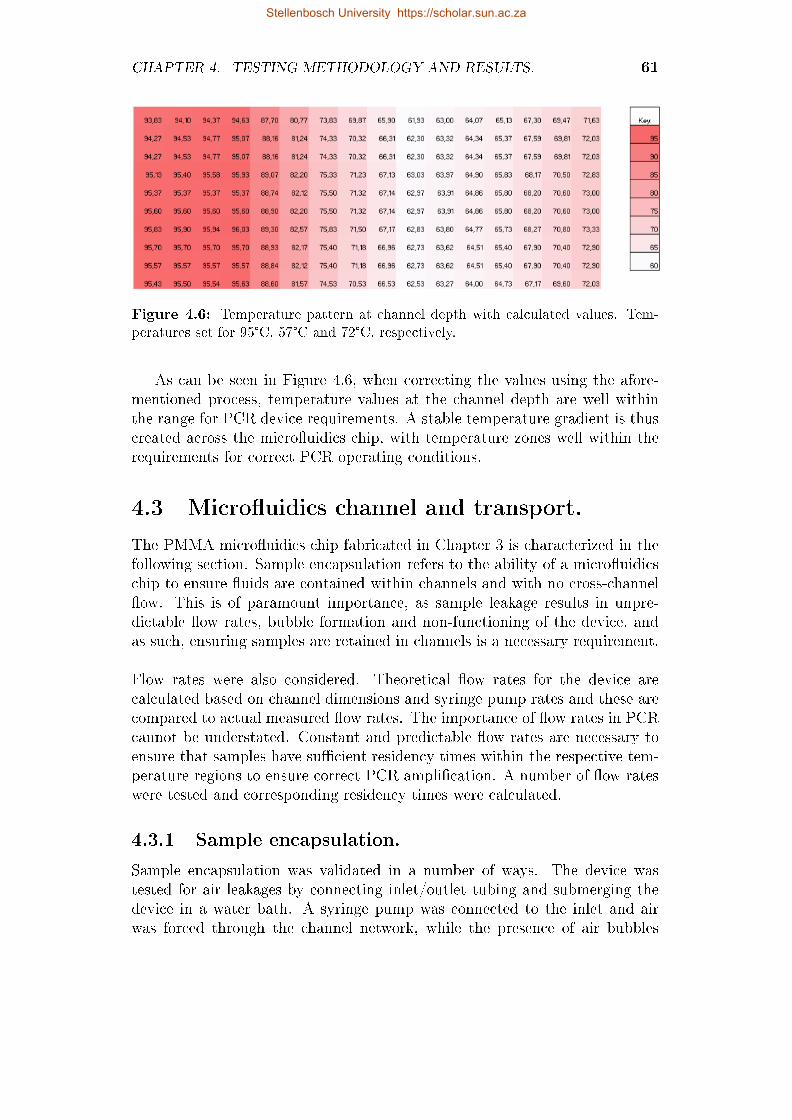
CHAPTER 4. TESTING METHODOLOGY AND RESULTS. 61
Figure 4.6: Temperature pattern at channel depth with calculated values. Tem-peratures set for 95°C, 57°C and 72°C, respectively.
As can be seen in Figure 4.6, when correcting the values using the afore-mentioned process, temperature values at the channel depth are well withinthe range for PCR device requirements. A stable temperature gradient is thuscreated across the micro�uidics chip, with temperature zones well within therequirements for correct PCR operating conditions.
4.3 Micro�uidics channel and transport.
The PMMA micro�uidics chip fabricated in Chapter 3 is characterized in thefollowing section. Sample encapsulation refers to the ability of a micro�uidicschip to ensure �uids are contained within channels and with no cross-channel�ow. This is of paramount importance, as sample leakage results in unpre-dictable �ow rates, bubble formation and non-functioning of the device, andas such, ensuring samples are retained in channels is a necessary requirement.
Flow rates were also considered. Theoretical �ow rates for the device arecalculated based on channel dimensions and syringe pump rates and these arecompared to actual measured �ow rates. The importance of �ow rates in PCRcannot be understated. Constant and predictable �ow rates are necessary toensure that samples have su�cient residency times within the respective tem-perature regions to ensure correct PCR ampli�cation. A number of �ow rateswere tested and corresponding residency times were calculated.
4.3.1 Sample encapsulation.
Sample encapsulation was validated in a number of ways. The device wastested for air leakages by connecting inlet/outlet tubing and submerging thedevice in a water bath. A syringe pump was connected to the inlet and airwas forced through the channel network, while the presence of air bubbles
Stellenbosch University https://scholar.sun.ac.za
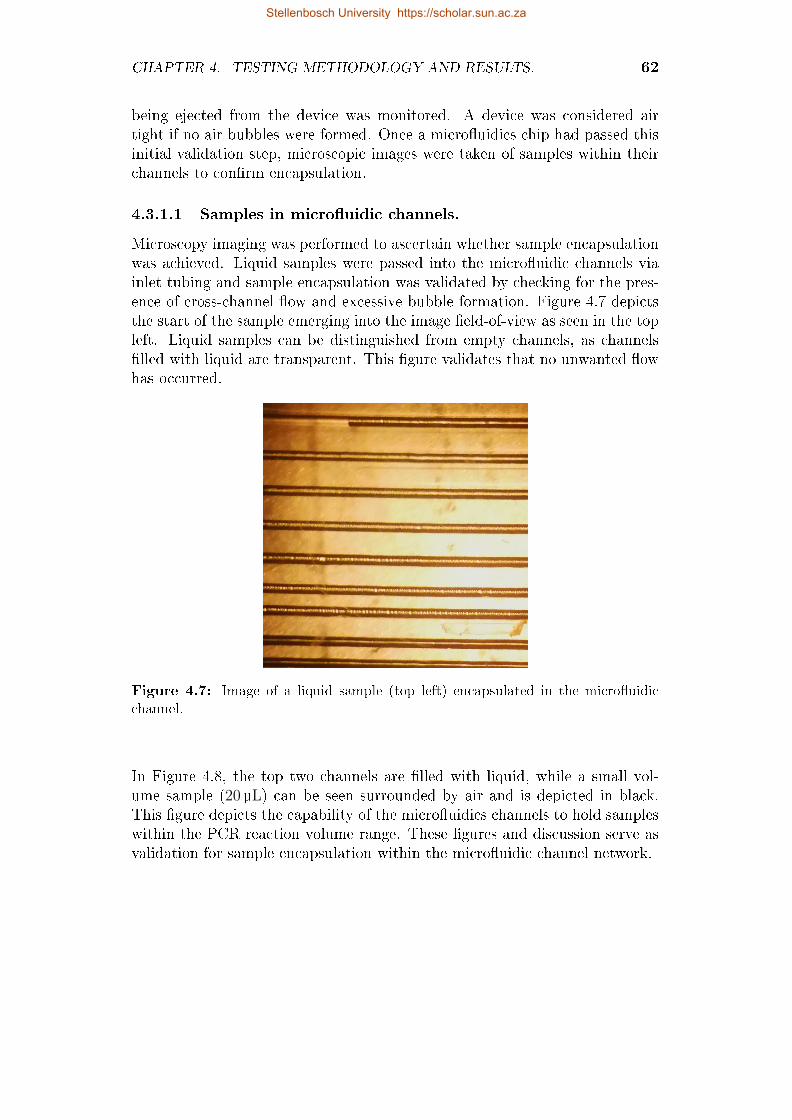
CHAPTER 4. TESTING METHODOLOGY AND RESULTS. 62
being ejected from the device was monitored. A device was considered airtight if no air bubbles were formed. Once a micro�uidics chip had passed thisinitial validation step, microscopic images were taken of samples within theirchannels to con�rm encapsulation.
4.3.1.1 Samples in micro�uidic channels.
Microscopy imaging was performed to ascertain whether sample encapsulationwas achieved. Liquid samples were passed into the micro�uidic channels viainlet tubing and sample encapsulation was validated by checking for the pres-ence of cross-channel �ow and excessive bubble formation. Figure 4.7 depictsthe start of the sample emerging into the image �eld-of-view as seen in the topleft. Liquid samples can be distinguished from empty channels, as channels�lled with liquid are transparent. This �gure validates that no unwanted �owhas occurred.
Figure 4.7: Image of a liquid sample (top left) encapsulated in the micro�uidicchannel.
In Figure 4.8, the top two channels are �lled with liquid, while a small vol-ume sample (20 µL) can be seen surrounded by air and is depicted in black.This �gure depicts the capability of the micro�uidics channels to hold sampleswithin the PCR reaction volume range. These �gures and discussion serve asvalidation for sample encapsulation within the micro�uidic channel network.
Stellenbosch University https://scholar.sun.ac.za
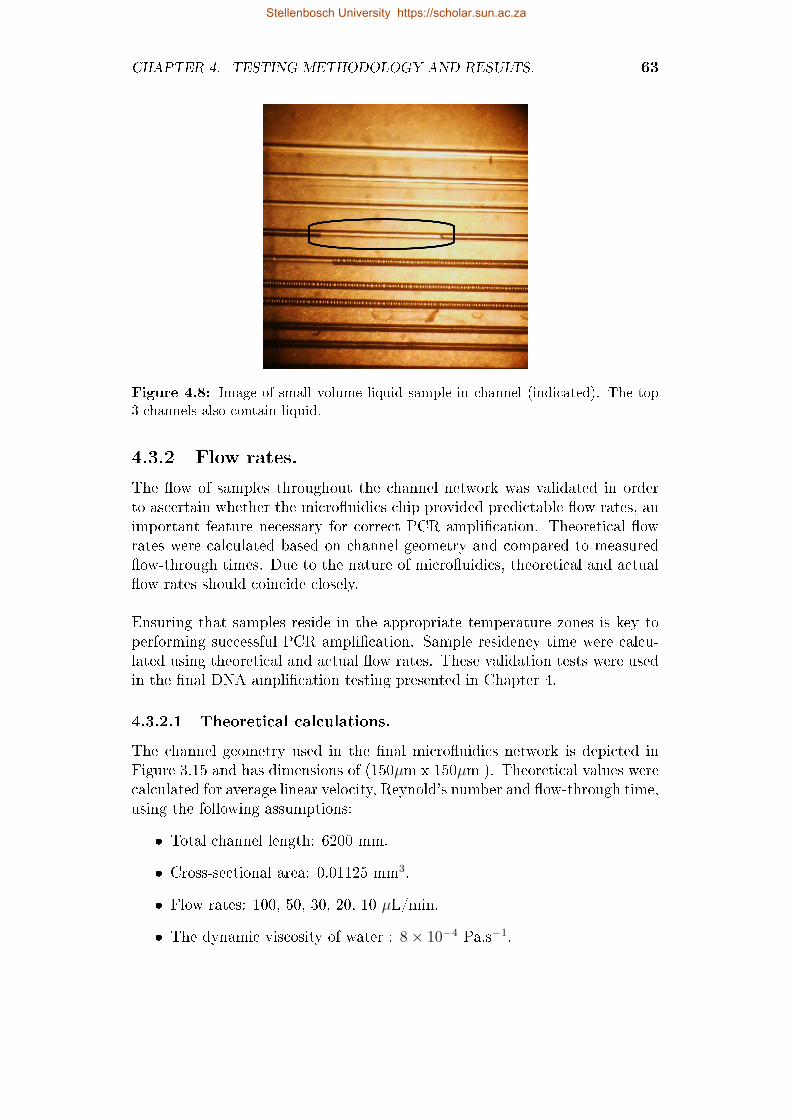
CHAPTER 4. TESTING METHODOLOGY AND RESULTS. 63
Figure 4.8: Image of small volume liquid sample in channel (indicated). The top3 channels also contain liquid.
4.3.2 Flow rates.
The �ow of samples throughout the channel network was validated in orderto ascertain whether the micro�uidics chip provided predictable �ow rates, animportant feature necessary for correct PCR ampli�cation. Theoretical �owrates were calculated based on channel geometry and compared to measured�ow-through times. Due to the nature of micro�uidics, theoretical and actual�ow rates should coincide closely.
Ensuring that samples reside in the appropriate temperature zones is key toperforming successful PCR ampli�cation. Sample residency time were calcu-lated using theoretical and actual �ow rates. These validation tests were usedin the �nal DNA ampli�cation testing presented in Chapter 4.
4.3.2.1 Theoretical calculations.
The channel geometry used in the �nal micro�uidics network is depicted inFigure 3.15 and has dimensions of (150µm x 150µm ). Theoretical values werecalculated for average linear velocity, Reynold's number and �ow-through time,using the following assumptions:
� Total channel length: 6200 mm.
� Cross-sectional area: 0.01125 mm3.
� Flow rates: 100, 50, 30, 20, 10 µL/min.
� The dynamic viscosity of water : 8× 10⁻⁴ Pa.s−1.
Stellenbosch University https://scholar.sun.ac.za
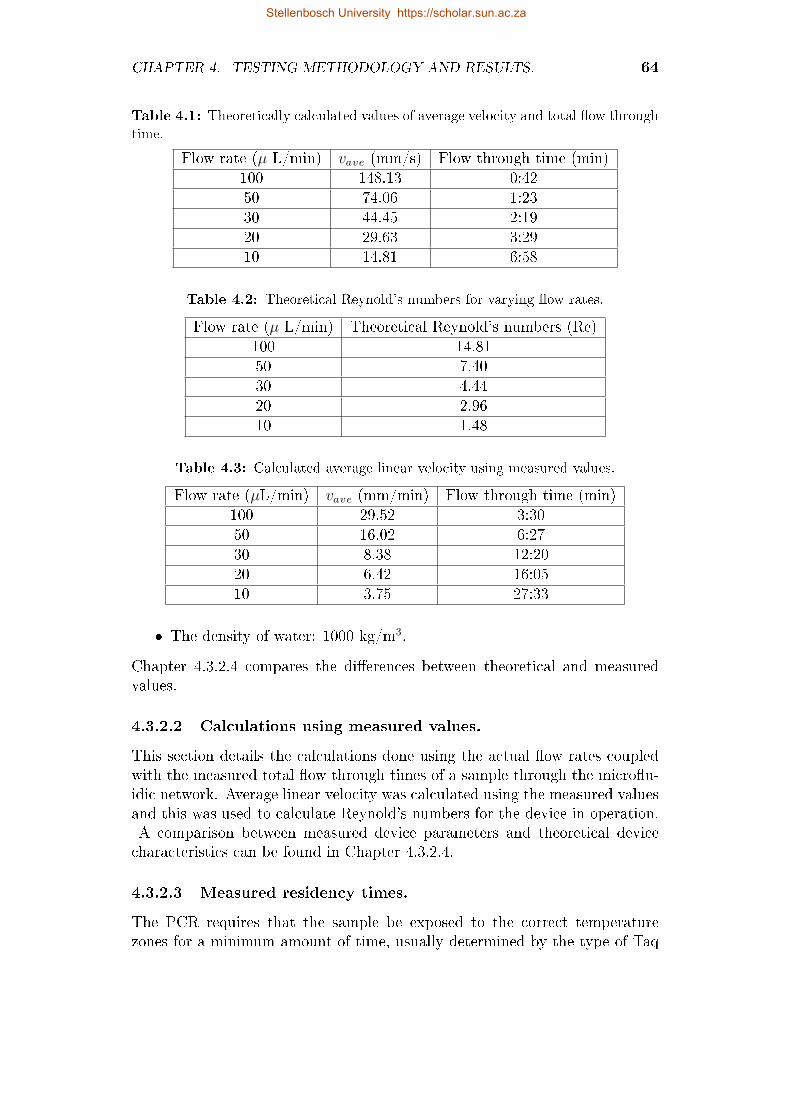
CHAPTER 4. TESTING METHODOLOGY AND RESULTS. 64
Table 4.1: Theoretically calculated values of average velocity and total �ow throughtime.
Flow rate (µ L/min) vave (mm/s) Flow through time (min)100 148.13 0:4250 74.06 1:2330 44.45 2:1920 29.63 3:2910 14.81 6:58
Table 4.2: Theoretical Reynold's numbers for varying �ow rates.
Flow rate (µ L/min) Theoretical Reynold's numbers (Re)100 14.8150 7.4030 4.4420 2.9610 1.48
Table 4.3: Calculated average linear velocity using measured values.
Flow rate (µL/min) vave (mm/min) Flow through time (min)100 29.52 3:3050 16.02 6:2730 8.38 12:2020 6.42 16:0510 3.75 27:33
� The density of water: 1000 kg/m3.
Chapter 4.3.2.4 compares the di�erences between theoretical and measuredvalues.
4.3.2.2 Calculations using measured values.
This section details the calculations done using the actual �ow rates coupledwith the measured total �ow through times of a sample through the micro�u-idic network. Average linear velocity was calculated using the measured valuesand this was used to calculate Reynold's numbers for the device in operation.A comparison between measured device parameters and theoretical devicecharacteristics can be found in Chapter 4.3.2.4.
4.3.2.3 Measured residency times.
The PCR requires that the sample be exposed to the correct temperaturezones for a minimum amount of time, usually determined by the type of Taq
Stellenbosch University https://scholar.sun.ac.za
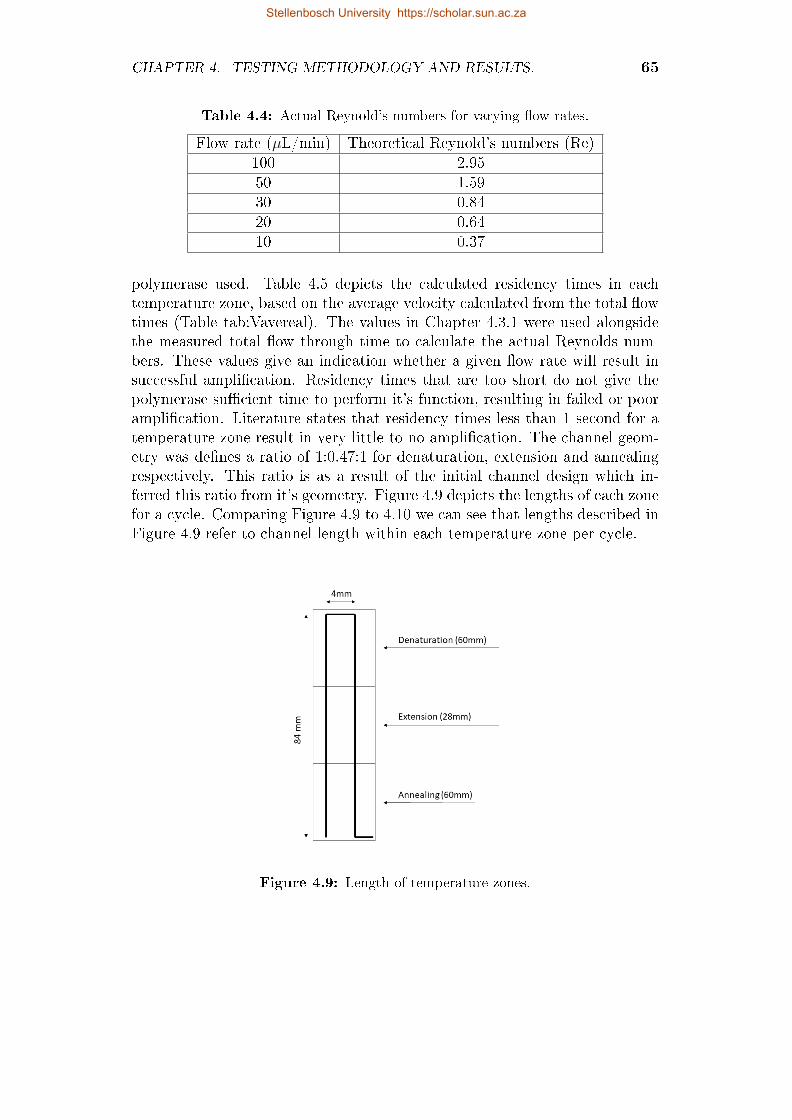
CHAPTER 4. TESTING METHODOLOGY AND RESULTS. 65
Table 4.4: Actual Reynold's numbers for varying �ow rates.
Flow rate (µL/min) Theoretical Reynold's numbers (Re)100 2.9550 1.5930 0.8420 0.6410 0.37
polymerase used. Table 4.5 depicts the calculated residency times in eachtemperature zone, based on the average velocity calculated from the total �owtimes (Table tab:Vavereal). The values in Chapter 4.3.1 were used alongsidethe measured total �ow through time to calculate the actual Reynolds num-bers. These values give an indication whether a given �ow rate will result insuccessful ampli�cation. Residency times that are too short do not give thepolymerase su�cient time to perform it's function, resulting in failed or poorampli�cation. Literature states that residency times less than 1 second for atemperature zone result in very little to no ampli�cation. The channel geom-etry was de�nes a ratio of 1:0.47:1 for denaturation, extension and annealingrespectively. This ratio is as a result of the initial channel design which in-ferred this ratio from it's geometry. Figure 4.9 depicts the lengths of each zonefor a cycle. Comparing Figure 4.9 to 4.10 we can see that lengths described inFigure 4.9 refer to channel length within each temperature zone per cycle.
Figure 4.9: Length of temperature zones.
Stellenbosch University https://scholar.sun.ac.za
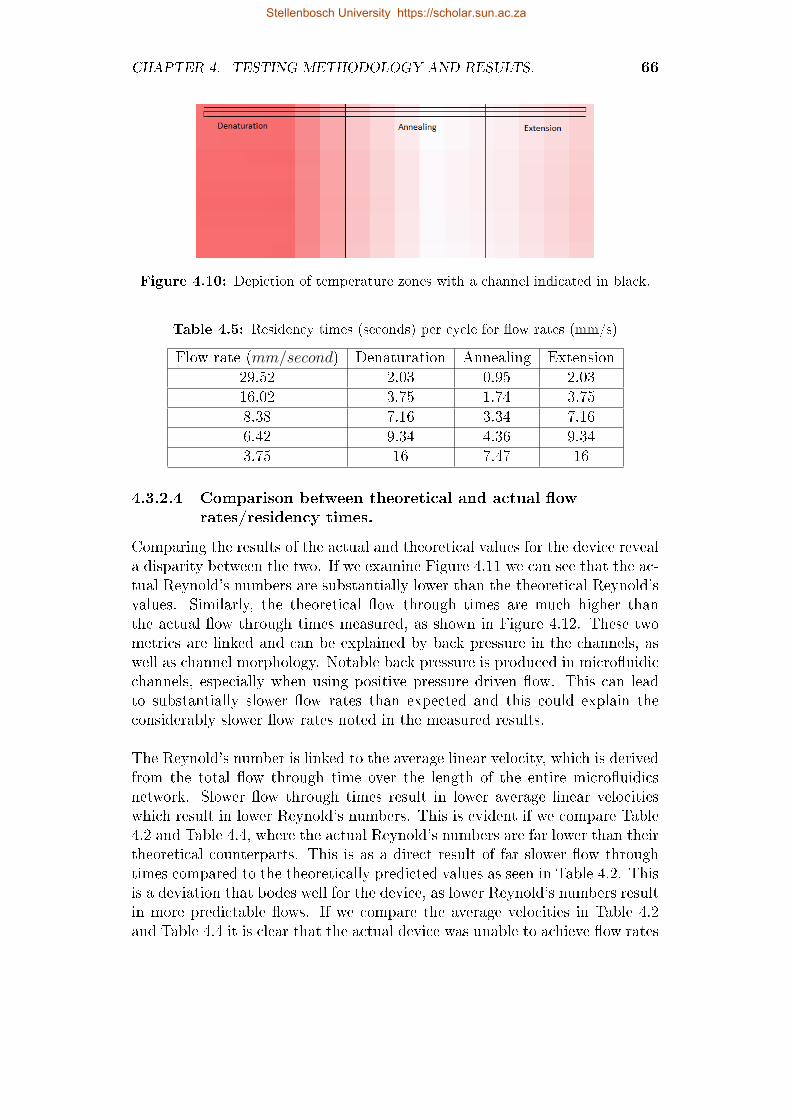
CHAPTER 4. TESTING METHODOLOGY AND RESULTS. 66
Figure 4.10: Depiction of temperature zones with a channel indicated in black.
Table 4.5: Residency times (seconds) per cycle for �ow rates (mm/s)
Flow rate (mm/second) Denaturation Annealing Extension29.52 2.03 0.95 2.0316.02 3.75 1.74 3.758.38 7.16 3.34 7.166.42 9.34 4.36 9.343.75 16 7.47 16
4.3.2.4 Comparison between theoretical and actual �owrates/residency times.
Comparing the results of the actual and theoretical values for the device reveala disparity between the two. If we examine Figure 4.11 we can see that the ac-tual Reynold's numbers are substantially lower than the theoretical Reynold'svalues. Similarly, the theoretical �ow through times are much higher thanthe actual �ow through times measured, as shown in Figure 4.12. These twometrics are linked and can be explained by back pressure in the channels, aswell as channel morphology. Notable back pressure is produced in micro�uidicchannels, especially when using positive pressure driven �ow. This can leadto substantially slower �ow rates than expected and this could explain theconsiderably slower �ow rates noted in the measured results.
The Reynold's number is linked to the average linear velocity, which is derivedfrom the total �ow through time over the length of the entire micro�uidicsnetwork. Slower �ow through times result in lower average linear velocitieswhich result in lower Reynold's numbers. This is evident if we compare Table4.2 and Table 4.4, where the actual Reynold's numbers are far lower than theirtheoretical counterparts. This is as a direct result of far slower �ow throughtimes compared to the theoretically predicted values as seen in Table 4.2. Thisis a deviation that bodes well for the device, as lower Reynold's numbers resultin more predictable �ows. If we compare the average velocities in Table 4.2and Table 4.4 it is clear that the actual device was unable to achieve �ow rates
Stellenbosch University https://scholar.sun.ac.za
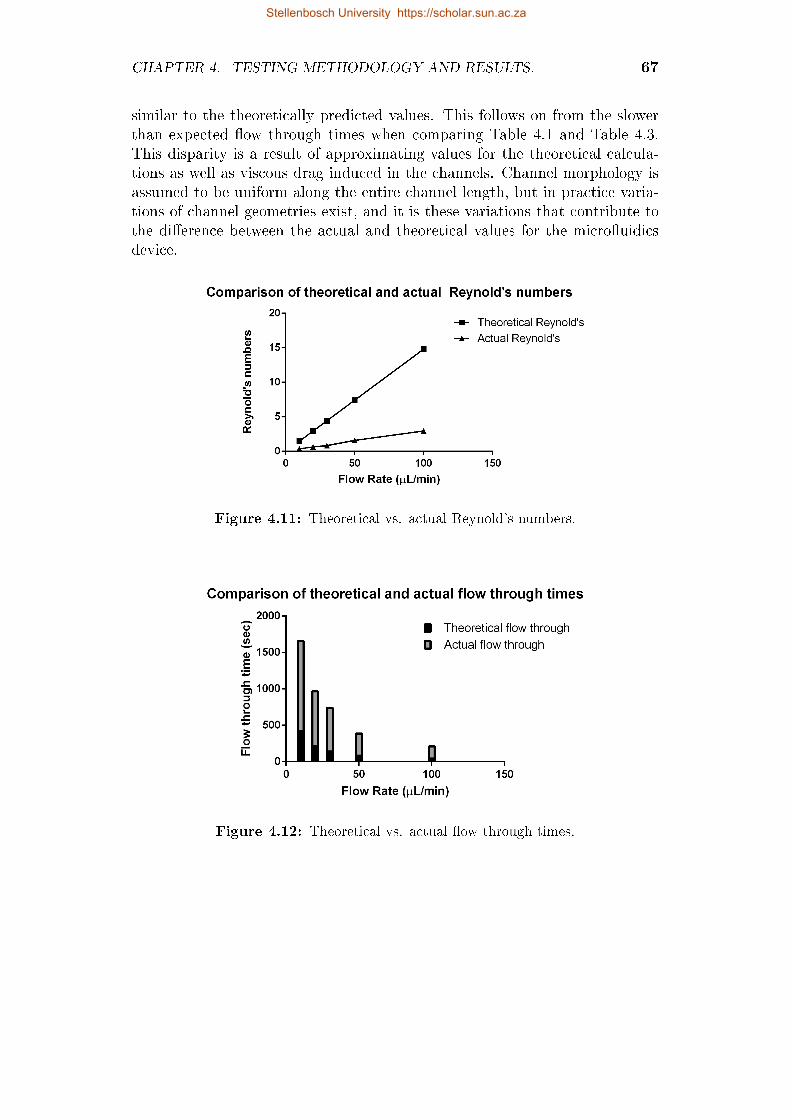
CHAPTER 4. TESTING METHODOLOGY AND RESULTS. 67
similar to the theoretically predicted values. This follows on from the slowerthan expected �ow through times when comparing Table 4.1 and Table 4.3.This disparity is a result of approximating values for the theoretical calcula-tions as well as viscous drag induced in the channels. Channel morphology isassumed to be uniform along the entire channel length, but in practice varia-tions of channel geometries exist, and it is these variations that contribute tothe di�erence between the actual and theoretical values for the micro�uidicsdevice.
Figure 4.11: Theoretical vs. actual Reynold's numbers.
Figure 4.12: Theoretical vs. actual �ow through times.
Stellenbosch University https://scholar.sun.ac.za
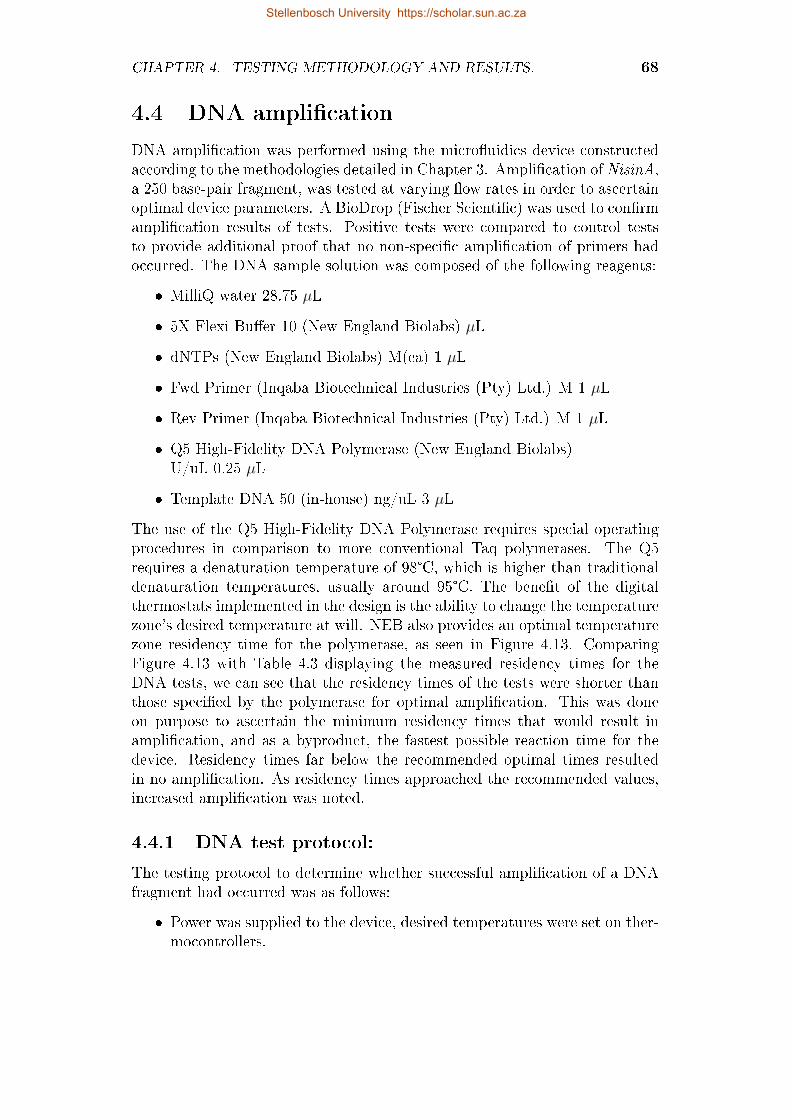
CHAPTER 4. TESTING METHODOLOGY AND RESULTS. 68
4.4 DNA ampli�cation
DNA ampli�cation was performed using the micro�uidics device constructedaccording to the methodologies detailed in Chapter 3. Ampli�cation of NisinA,a 250 base-pair fragment, was tested at varying �ow rates in order to ascertainoptimal device parameters. A BioDrop (Fischer Scienti�c) was used to con�rmampli�cation results of tests. Positive tests were compared to control teststo provide additional proof that no non-speci�c ampli�cation of primers hadoccurred. The DNA sample solution was composed of the following reagents:
� MilliQ water 28.75 µL
� 5X Flexi Bu�er 10 (New England Biolabs) µL
� dNTPs (New England Biolabs) M(ea) 1 µL
� Fwd Primer (Inqaba Biotechnical Industries (Pty) Ltd.) M 1 µL
� Rev Primer (Inqaba Biotechnical Industries (Pty) Ltd.) M 1 µL
� Q5 High-Fidelity DNA Polymerase (New England Biolabs)U/uL 0.25 µL
� Template DNA 50 (in-house) ng/uL 3 µL
The use of the Q5 High-Fidelity DNA Polymerase requires special operatingprocedures in comparison to more conventional Taq polymerases. The Q5requires a denaturation temperature of 98°C, which is higher than traditionaldenaturation temperatures, usually around 95°C. The bene�t of the digitalthermostats implemented in the design is the ability to change the temperaturezone's desired temperature at will. NEB also provides an optimal temperaturezone residency time for the polymerase, as seen in Figure 4.13. ComparingFigure 4.13 with Table 4.3 displaying the measured residency times for theDNA tests, we can see that the residency times of the tests were shorter thanthose speci�ed by the polymerase for optimal ampli�cation. This was doneon purpose to ascertain the minimum residency times that would result inampli�cation, and as a byproduct, the fastest possible reaction time for thedevice. Residency times far below the recommended optimal times resultedin no ampli�cation. As residency times approached the recommended values,increased ampli�cation was noted.
4.4.1 DNA test protocol:
The testing protocol to determine whether successful ampli�cation of a DNAfragment had occurred was as follows:
� Power was supplied to the device, desired temperatures were set on ther-mocontrollers.
Stellenbosch University https://scholar.sun.ac.za
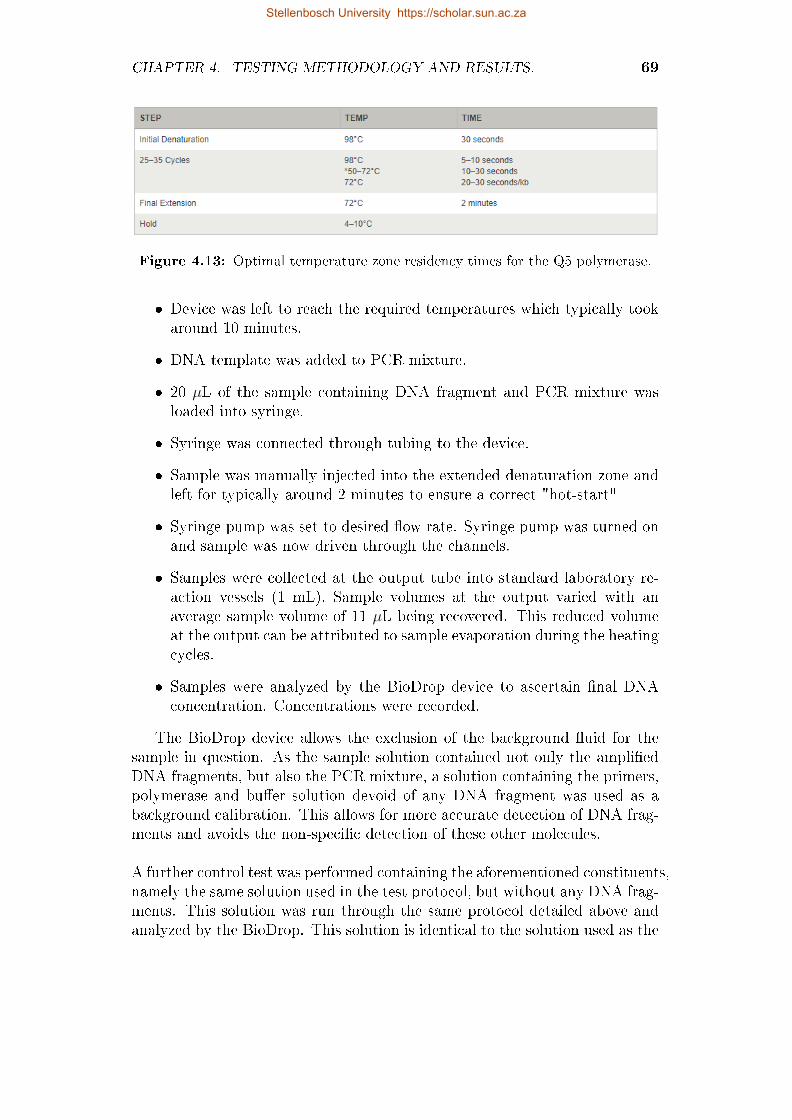
CHAPTER 4. TESTING METHODOLOGY AND RESULTS. 69
Figure 4.13: Optimal temperature zone residency times for the Q5 polymerase.
� Device was left to reach the required temperatures which typically tookaround 10 minutes.
� DNA template was added to PCR mixture.
� 20 µL of the sample containing DNA fragment and PCR mixture wasloaded into syringe.
� Syringe was connected through tubing to the device.
� Sample was manually injected into the extended denaturation zone andleft for typically around 2 minutes to ensure a correct "hot-start"
� Syringe pump was set to desired �ow rate. Syringe pump was turned onand sample was now driven through the channels.
� Samples were collected at the output tube into standard laboratory re-action vessels (1 mL). Sample volumes at the output varied with anaverage sample volume of 11 µL being recovered. This reduced volumeat the output can be attributed to sample evaporation during the heatingcycles.
� Samples were analyzed by the BioDrop device to ascertain �nal DNAconcentration. Concentrations were recorded.
The BioDrop device allows the exclusion of the background �uid for thesample in question. As the sample solution contained not only the ampli�edDNA fragments, but also the PCR mixture, a solution containing the primers,polymerase and bu�er solution devoid of any DNA fragment was used as abackground calibration. This allows for more accurate detection of DNA frag-ments and avoids the non-speci�c detection of these other molecules.
A further control test was performed containing the aforementioned constituents,namely the same solution used in the test protocol, but without any DNA frag-ments. This solution was run through the same protocol detailed above andanalyzed by the BioDrop. This solution is identical to the solution used as the
Stellenbosch University https://scholar.sun.ac.za
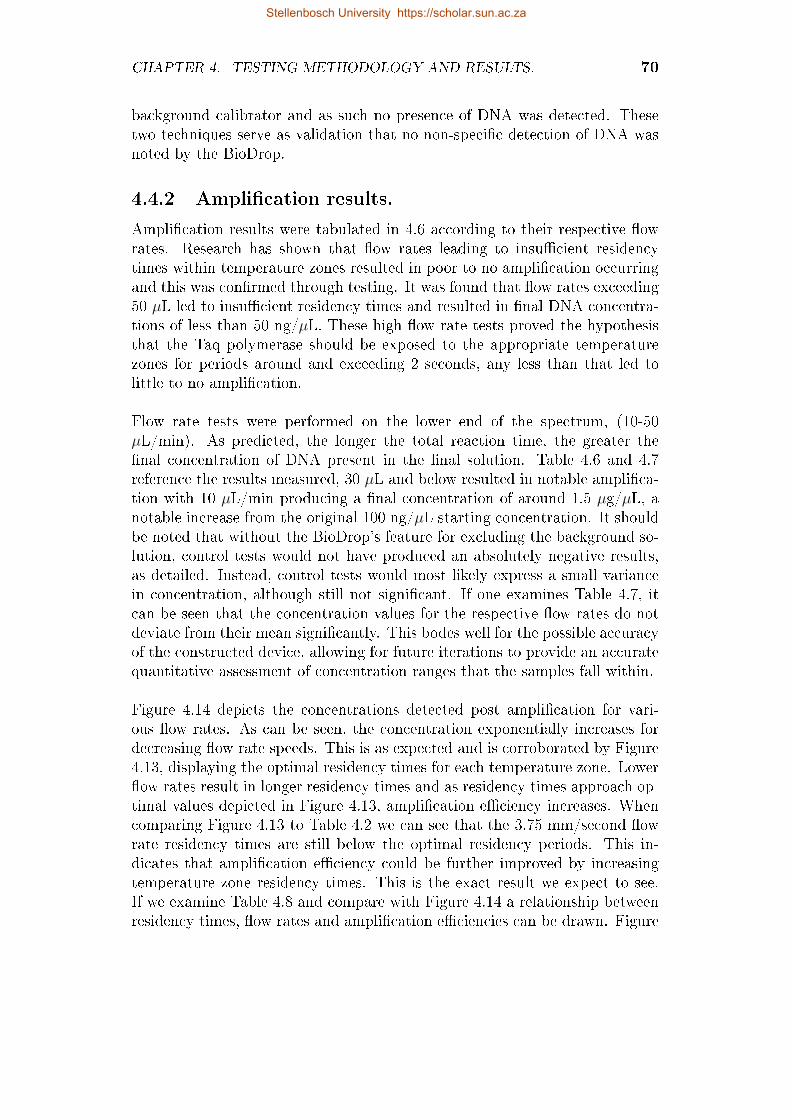
CHAPTER 4. TESTING METHODOLOGY AND RESULTS. 70
background calibrator and as such no presence of DNA was detected. Thesetwo techniques serve as validation that no non-speci�c detection of DNA wasnoted by the BioDrop.
4.4.2 Ampli�cation results.
Ampli�cation results were tabulated in 4.6 according to their respective �owrates. Research has shown that �ow rates leading to insu�cient residencytimes within temperature zones resulted in poor to no ampli�cation occurringand this was con�rmed through testing. It was found that �ow rates exceeding50 µL led to insu�cient residency times and resulted in �nal DNA concentra-tions of less than 50 ng/µL. These high �ow rate tests proved the hypothesisthat the Taq polymerase should be exposed to the appropriate temperaturezones for periods around and exceeding 2 seconds, any less than that led tolittle to no ampli�cation.
Flow rate tests were performed on the lower end of the spectrum, (10-50µL/min). As predicted, the longer the total reaction time, the greater the�nal concentration of DNA present in the �nal solution. Table 4.6 and 4.7reference the results measured, 30 µL and below resulted in notable ampli�ca-tion with 10 µL/min producing a �nal concentration of around 1.5 µg/µL, anotable increase from the original 100 ng/µL starting concentration. It shouldbe noted that without the BioDrop's feature for excluding the background so-lution, control tests would not have produced an absolutely negative results,as detailed. Instead, control tests would most likely express a small variancein concentration, although still not signi�cant. If one examines Table 4.7, itcan be seen that the concentration values for the respective �ow rates do notdeviate from their mean signi�cantly. This bodes well for the possible accuracyof the constructed device, allowing for future iterations to provide an accuratequantitative assessment of concentration ranges that the samples fall within.
Figure 4.14 depicts the concentrations detected post ampli�cation for vari-ous �ow rates. As can be seen, the concentration exponentially increases fordecreasing �ow rate speeds. This is as expected and is corroborated by Figure4.13, displaying the optimal residency times for each temperature zone. Lower�ow rates result in longer residency times and as residency times approach op-timal values depicted in Figure 4.13, ampli�cation e�ciency increases. Whencomparing Figure 4.13 to Table 4.2 we can see that the 3.75 mm/second �owrate residency times are still below the optimal residency periods. This in-dicates that ampli�cation e�ciency could be further improved by increasingtemperature zone residency times. This is the exact result we expect to see.If we examine Table 4.8 and compare with Figure 4.14 a relationship betweenresidency times, �ow rates and ampli�cation e�ciencies can be drawn. Figure
Stellenbosch University https://scholar.sun.ac.za
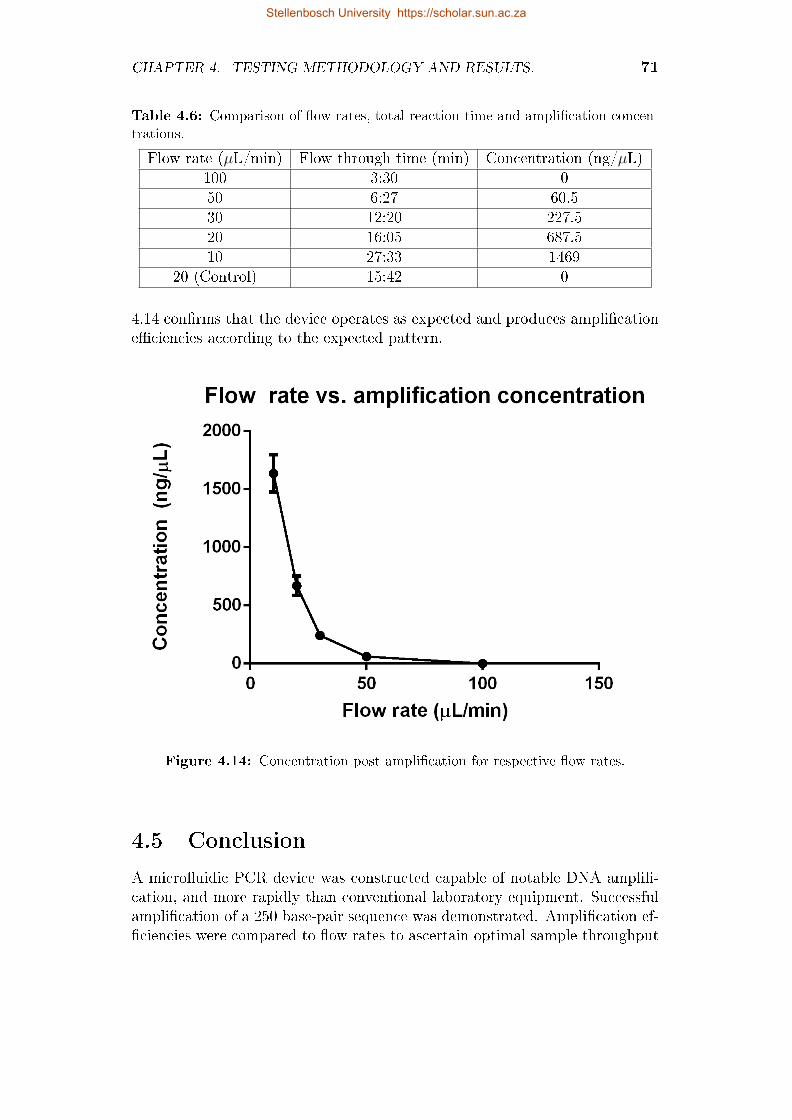
CHAPTER 4. TESTING METHODOLOGY AND RESULTS. 71
Table 4.6: Comparison of �ow rates, total reaction time and ampli�cation concen-trations.
Flow rate (µL/min) Flow through time (min) Concentration (ng/µL)100 3:30 050 6:27 60.530 12:20 227.520 16:05 687.510 27:33 1469
20 (Control) 15:42 0
4.14 con�rms that the device operates as expected and produces ampli�catione�ciencies according to the expected pattern.
Figure 4.14: Concentration post ampli�cation for respective �ow rates.
4.5 Conclusion
A micro�uidic PCR device was constructed capable of notable DNA ampli�-cation, and more rapidly than conventional laboratory equipment. Successfulampli�cation of a 250 base-pair sequence was demonstrated. Ampli�cation ef-�ciencies were compared to �ow rates to ascertain optimal sample throughput
Stellenbosch University https://scholar.sun.ac.za
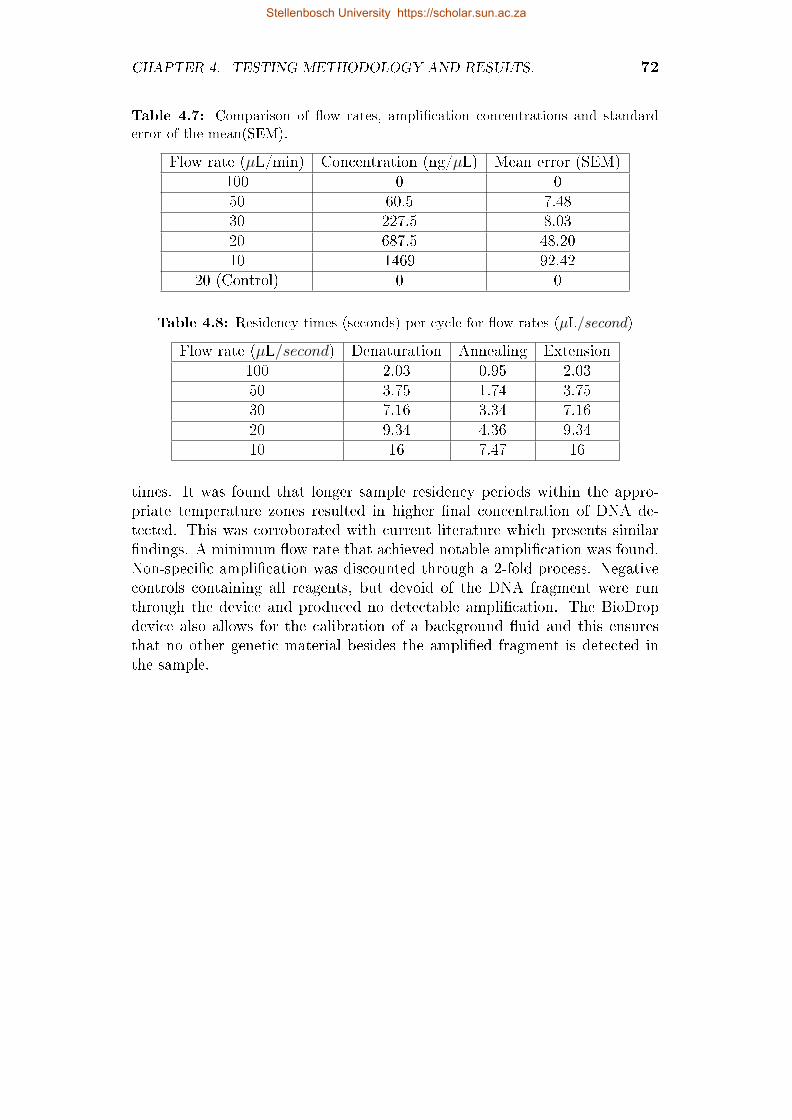
CHAPTER 4. TESTING METHODOLOGY AND RESULTS. 72
Table 4.7: Comparison of �ow rates, ampli�cation concentrations and standarderror of the mean(SEM).
Flow rate (µL/min) Concentration (ng/µL) Mean error (SEM)100 0 050 60.5 7.4830 227.5 8.0320 687.5 48.2010 1469 92.42
20 (Control) 0 0
Table 4.8: Residency times (seconds) per cycle for �ow rates (µL/second)
Flow rate (µL/second) Denaturation Annealing Extension100 2.03 0.95 2.0350 3.75 1.74 3.7530 7.16 3.34 7.1620 9.34 4.36 9.3410 16 7.47 16
times. It was found that longer sample residency periods within the appro-priate temperature zones resulted in higher �nal concentration of DNA de-tected. This was corroborated with current literature which presents similar�ndings. A minimum �ow rate that achieved notable ampli�cation was found.Non-speci�c ampli�cation was discounted through a 2-fold process. Negativecontrols containing all reagents, but devoid of the DNA fragment were runthrough the device and produced no detectable ampli�cation. The BioDropdevice also allows for the calibration of a background �uid and this ensuresthat no other genetic material besides the ampli�ed fragment is detected inthe sample.
Stellenbosch University https://scholar.sun.ac.za
Chapter 5
Conclusion
An investigation was performed on portable micro�uidic PCR devices to im-prove POC approaches to patient diagnosis, as well as investigate an alternativeto conventional bench top PCR equipment. A relevant literature, pertainingto the construction of micro�uidic devices was performed, with a focus onPCR implementations. A serpentine-channel PCR device was constructed ona PMMA substrate using laser ablation, solvent-assisted thermal bonding forlid fabrication and a syringe pump for �ow control. The thermal control systemcomprised of OTS thermo-controllers coupled to a set of 3 Peltier heaters. Theconstructed device was evaluated by performing ampli�cation of a 250 base-pair fragment, NisinA. A relationship between temperature zone residencytimes and ampli�cation e�ciency was determined. The device was capable ofnotable ampli�cation within 30 minutes, representing a considerable improve-ment over conventional labratory techniques (150-180 minutes).
The following list constitutes the main contributions made by this project:
� A review was supplied that provided a brief overview of fundamentalmicro�uidic principles and micro�uidic fabrication techniques for bothglass/silicon and thermoplastic devices. PCR devices were discussed indetail and various implementations were presented.
� Conventional methodology for performing PCR was investigated and itwas found that conventional equipment does not meet portability, costor simplicity criteria.
� A micro�uidics PCR device was fabricated. The techniques used to fab-ricate the device can be seen as low cost, with some processes beingscalable. The fabrication of the device can be performed in a "low-tech"labratory, as none of the procedures required the use of specialized equip-ment. This serves as proof that such LOC devices can be produced in a"low-cost" labratory environment. Commercial micro�uidics connectorswere avoided and a low-cost in-house connection scheme was devised.
73
Stellenbosch University https://scholar.sun.ac.za
CHAPTER 5. CONCLUSION 74
� The fabricated device was capable of noteable DNA ampli�cation of aNisinA fragment within 30 minutes. This represents a far improved rateof ampli�cation in comparison to conventional ampli�cation procedures.
� A speci�cation is provided to be used in future work and can be seen in6.1. The speci�cation details a similar approach, however substitutes thecomponents that are not truly portable in the current implementation.
The project suceeded in achieving it's main objectives. However, due to en-vironmental constraints, there were some limitations on the work done. Thedevice fabricated is not portable in it's current form.
The Peltier elements used are not micro-Peltier versions and as such drawconsiderable power. This requires the use of a benchtop power supply unit toprovide su�cient power. Micro-Peltier elements were not obtainable withinthe time or cost frame, but the use of these devices in the future will allow thepowering of the device by a battery con�guration. Secondly, the syringe pumpused is also a benchtop device, further hindering the portability of the device.The solution to this would be the use of micro-peristaltic or micro-syringepump types of devices, which can be powered via batteries. This would allowthe �uid control mechanism to conform to portability criteria. The cost ofthese devices was outside the scope of the budget for the project and acquisi-tion of these devices within a South African context is di�cult.
The device was tested over a range of �ow rates and a relationship was deter-mined between temperature zone residency times and the �nal ampli�cationconcentration. However, future research should look at optimizing this processto obtain a more distinct relationship between the parameters in question inorder increase ampli�cation e�ciency. Although su�cient ampli�cation wasobserved it can be noted that this procedure should be repeated at lower �owrates. The Q5 High Fedility Polymerase speci�es optimal residency times andfuture research can investigate the redesign of channel geometry to match theoptimal residency times speci�ed. Slower �ow rates should be investigatedto determine a point at which further increase of residency periods no longerresults in increasing ampli�cation e�ciencies. Secondarily, future researchshould focus on the portability criteria for future design iterations.
The following presents a list of work for future research:
� Optimization of laser ablation process to produce con�gurable channeldimensions from determined laser parameters.
� Investigation of lid bonding strengths for a number of solvent combina-tion/mixtures, using solvent-assisted thermal bonding.
� Design and implementation of a portable �uid control mechanism/device.
Stellenbosch University https://scholar.sun.ac.za
CHAPTER 5. CONCLUSION 75
� Use of a portable heating system, either in the form of micro-Peltierelements or the design of a Joule heating system.
� Determination of ideal residency periods for a number of polymerases toachieve maximum ampli�cation.
The use of micro�uidic PCR devices can be incorporated into a number of ar-eas. They could function as a possible replacement of conventional benchtopdevices in a laboratory context, providing improvements in terms of cost andtime. Their use in the LOC context is well-documented and can be consideredthe main driving force behind the research done on this category of devices.Their possibility to provide in-�eld diagnostics to improve diagnostic responsetimes is hugely attractive and once incorporated into devices capable of pre-sample treatment and end-point detection, these devices could revolutionizethe way that genetic diseases are diagnosed.
A prototype portable PCR device was constructed based on a micro�uidicframework. The device was constructed in a cost e�cient manner in a "low-tech" laboratory environment, avoiding the use of excessively complex equip-ment or fabrication techniques. The device produced notable ampli�cationof a NisinA DNA fragment within 30 minutes. This device could serve as aprototype for future implementations that would adhere more strictly to theportability, cost and simplicity criteria.
Stellenbosch University https://scholar.sun.ac.za
Chapter 6
Future work and
recommendations.
6.1 Evaluation of current implementation.
A device capable of rapid PCR was fabricated and although successful in itsprimary goal, it did not adhere to its secondary purpose of conforming toportability criteria. This chapter will address this and other limitations ofthe device's current implementation and propose requirements and a potentialdesign for future work. The end goal of such a device is to form part of aLOC device for possible use in rural settings, where populations lack accessto su�cient diagnostic technologies. The proposed speci�cation will focus onthe use of more energy e�cient heaters, a self-contained, low power pumpingsolution and the use of a low power, integrateable power supply.
The heating system used in the current implementation involves Peltier el-ements requiring around 4 A in operation and thus powered by a bench-toppower supply. The peltier elements obtained are relatively large devices (40 x40 mm) and as such draw a substantial amount of power. Initially, the heatersthat were to be used in the design were micro-counterparts of these Peltierelements, but due to availability they were not implemented. The use of moreenergy e�cient heaters will allow for the downsizing of the PSU and heat-ing system, which will greatly increase the device's portability. Temperatureprobes can be positioned better in future iterations, as multiple calibrationtests were required in the current implementation.
The syringe pump used to create pressure driven �ow in the current imple-mentations has advantages in a prototyping environment. Flow rates can beadjusted on the �y allowing for rapid �ow rate testing to be performed, but dueto it's size can not be considered completely portable. A fully integrated PCRdevice requires the use of a micro-pump, or alternatively centrifugal driven
76
Stellenbosch University https://scholar.sun.ac.za
CHAPTER 6. FUTURE WORK AND RECOMMENDATIONS. 77
�ow.
The device was fabricated in what can be considered a "low-tech" laboratory,when compared to the environments in which other research groups fabricatetheir micro�uidic devices. This was initially a challenge, but due to the tech-niques and methodology required to fabricate in such an environment, someof these procedures show potential for automated scalable production. Thedevice channels and lid bonding can be automated to allow large-scale pro-duction. The device, including heating, temperature control and �ow controlform a separate system from the micro�uidics chip. This allows for the use ofmultiple micro�uidic chips, possibly with a variety of channel geometries, tobe used in the device.
The CO2 laser ablation methodology for creating channels is easily up-scalableand commercial lasers should be able to theoretically fabricate thousands ofchips a day. The bonding technique used requires a solvent, a mechanism forapplying pressure to the device and an oven. Lids could be submerged intolarge solvent baths, and then placed in an oven with constant pressure appliedto them. The connection of the external connectors needs to be revised inorder for it to be performed with some autonomy.
Fabrication of a micro�uidics device was demonstrated using "low-tech" ma-chinery and techniques. Although successful in amplifying DNA rapidly, thedevices can be improved in future iterations, allowing for the production of afully-integrated µTAS.
6.2 Proposed speci�cations for future design.
The device proposed focuses on an implementation for use in-�eld and as suchthe speci�cations detailed outline criteria for such a device. The device shouldbe fully portable, requiring no external equipment, adhere to low costs andsimple operation. The following list details requirements that future devicesshould try to adhere to:
� portable-involving no external equipment
� low-cost
� robust-for use in-�eld
� easily up-scalable
� provide rapid diagnosis at a POC level
� low-power, can be battery or 220V operatable.
Stellenbosch University https://scholar.sun.ac.za
CHAPTER 6. FUTURE WORK AND RECOMMENDATIONS. 78
� reliable
� speci�c
� quanti�able
� simple to use
� easily integrateable (universal external connectors)
� preferably hand-held
� data output system
A future design is proposed in Table 6.1 which attempts to adhere to as manyof the aforementioned criteria as possible, while still attempting to remain low-cost. The future design should be principally concerned with addressing the
Table 6.1: Future design speci�cation for a portable PCR device.
portability of the heating, �uid control and power supply systems. A reductionin these systems will greatly improve the portability of the future device.
6.3 Future development.
The following details concluding remarks for future development of this device:
� The heating system used should ideally be low power (<12 V), integrate-able and easily controllable. Micro-Peltier elements provide an applicablesolution.
Stellenbosch University https://scholar.sun.ac.za
CHAPTER 6. FUTURE WORK AND RECOMMENDATIONS. 79
� Improving the energy e�ciency of the heating system will allow for asmaller power supply to be used. Ideally a custom built supply poweredby batteries will be designed.
� The �uid control mechanism should be integrable and easily controllable,preferably programmable for interfacing with a microcontroller. Micro-persistaltic/syringe pumps are attractive for this purpose.
� The use of a micro-controller for control of the power supply, heating sys-tem and �uid �ow would allow for a fully-programmable device capableof con�gurable parameters.
� The design should conform to low cost materials and fabrication tech-niques, while keeping mass production in mind.
� The device could contain an integrated sensing mechanism, be it on-board �uorescence detection or a means of resistive testing to con�rmampli�cation post-PCR.
A fully-integrated, portable PCR device is possible with current technologiesand materials. The proposed design aims to help guide future researcherstowards a more LOC approach. The use of a micro-controller will allow forthe con�gurability of the subsystems and allowing device parameters to be�ne-tuned for speci�c applications. These devices show potential to solving anumber of critical health issues pertaining to early diagnosis and accessibilityand the fabrication of a portable PCR device will aid in this pursuit.
Stellenbosch University https://scholar.sun.ac.za

Appendices
80
Stellenbosch University https://scholar.sun.ac.za

Appendix A
Technical drawings
81
Stellenbosch University https://scholar.sun.ac.za
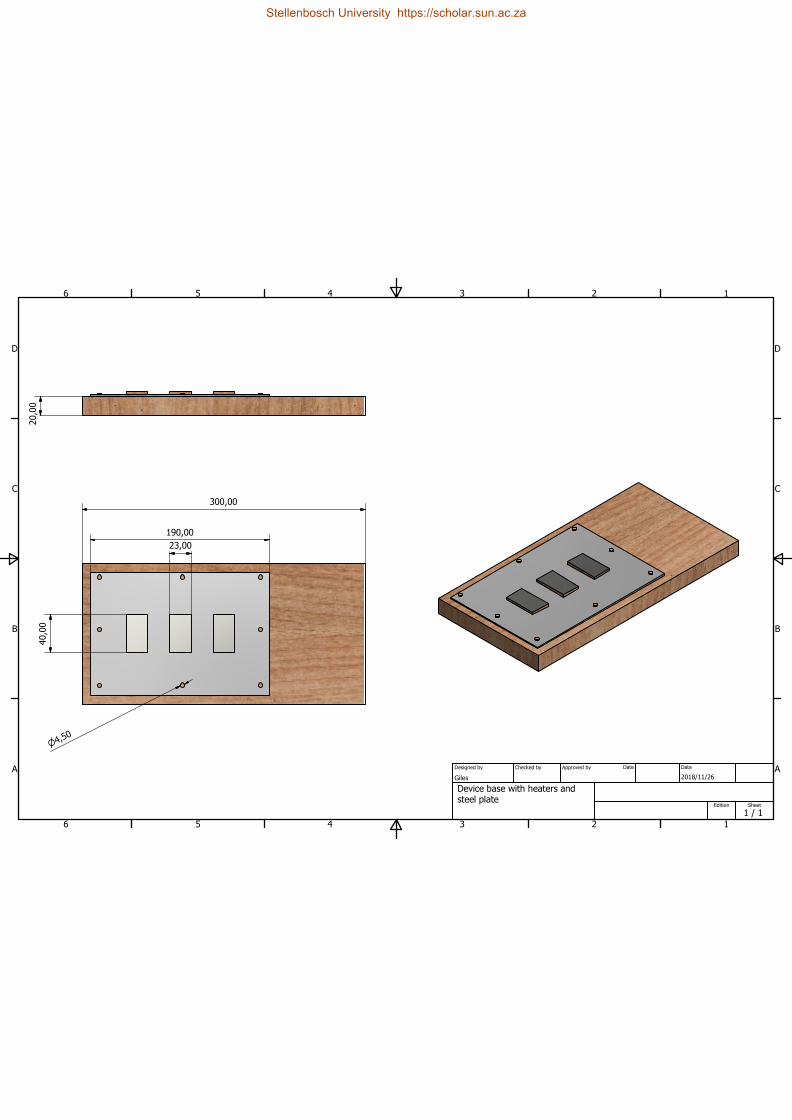
1
1
2
2
3
3
4
4
5
5
6
6
A A
B B
C C
D D
Giles
2018/11/26
Designed by Checked by Approved byDate
1 / 1
Edition Sheet
Date
300,00
190,00
23,00
40,00
4
,
5
0
20,00
Device base with heaters and
steel plate
Stellenbosch University https://scholar.sun.ac.za
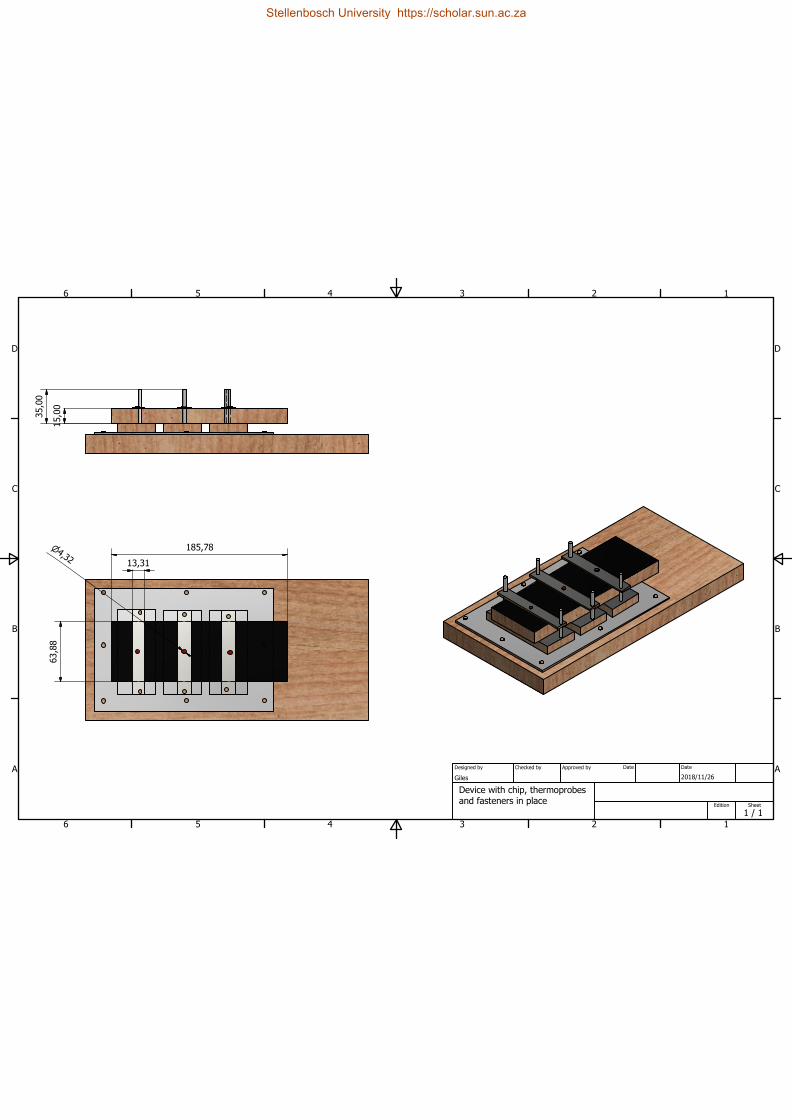
1
1
2
2
3
3
4
4
5
5
6
6
A A
B B
C C
D D
Giles
2018/11/26
Designed by Checked by Approved byDate
1 / 1
Edition Sheet
Date
63,88
185,78
15,00
35,00
13,31
4
,
3
2
Device with chip, thermoprobes
and fasteners in place
Stellenbosch University https://scholar.sun.ac.za

Appendix B
Datasheets
84
Stellenbosch University https://scholar.sun.ac.za
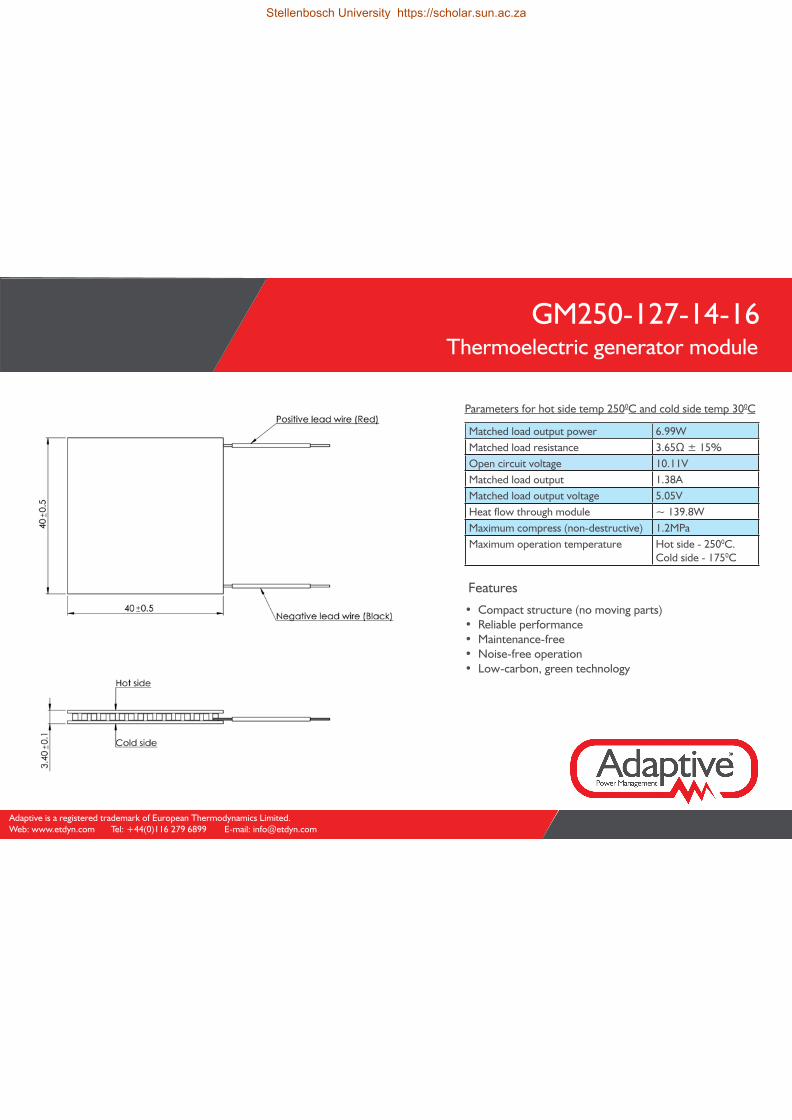
Adaptive is a registered trademark of European Thermodynamics Limited.Web: www.etdyn.com Tel: +44(0)116 279 6899 E-mail: [email protected]
GM250-127-14-16Thermoelectric generator module
Parameters for hot side temp 2500C and cold side temp 300C
Matched load output power 6.99WMatched load resistance 3.65Ω ± 15%Open circuit voltage 10.11VMatched load output 1.38AMatched load output voltage 5.05VHeat flow through module ~ 139.8WMaximum compress (non-destructive) 1.2MPaMaximum operation temperature Hot side - 2500C.
Cold side - 1750C
Features
• Compact structure (no moving parts)• Reliable performance• Maintenance-free• Noise-free operation• Low-carbon, green technology
Stellenbosch University https://scholar.sun.ac.za
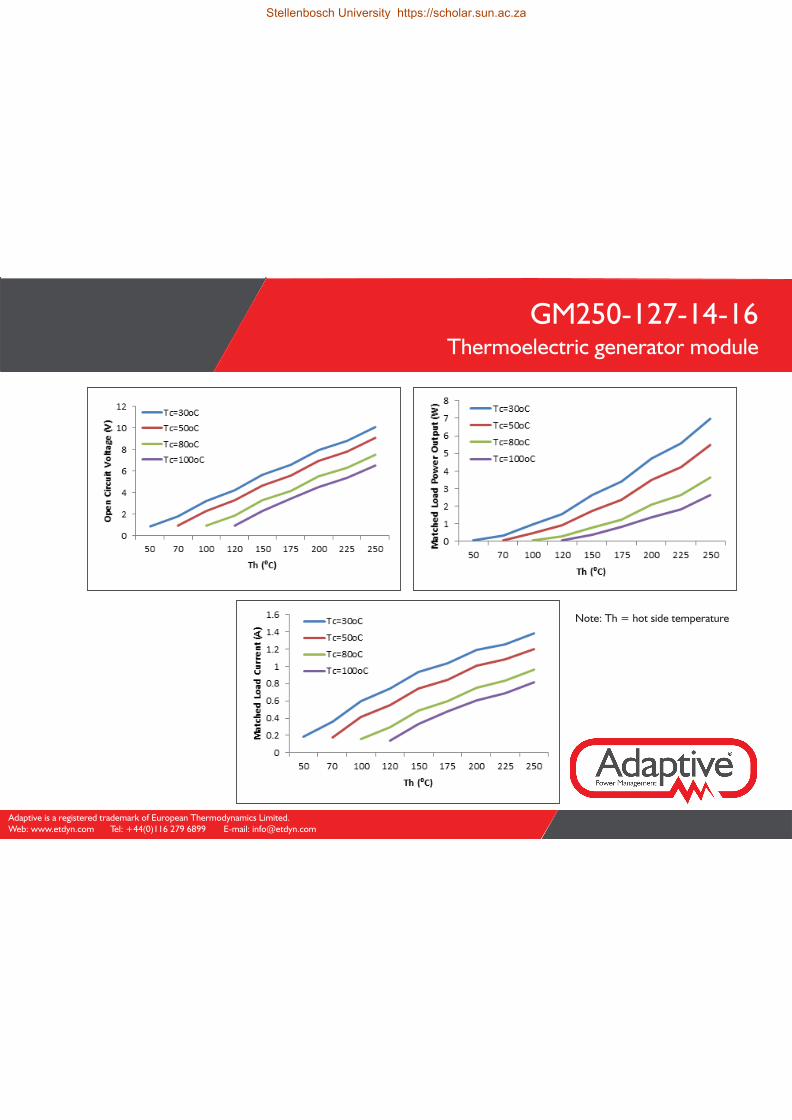
Adaptive is a registered trademark of European Thermodynamics Limited.Web: www.etdyn.com Tel: +44(0)116 279 6899 E-mail: [email protected]
Thermoelectric generator moduleGM250-127-14-16
Note: Th = hot side temperature
Stellenbosch University https://scholar.sun.ac.za
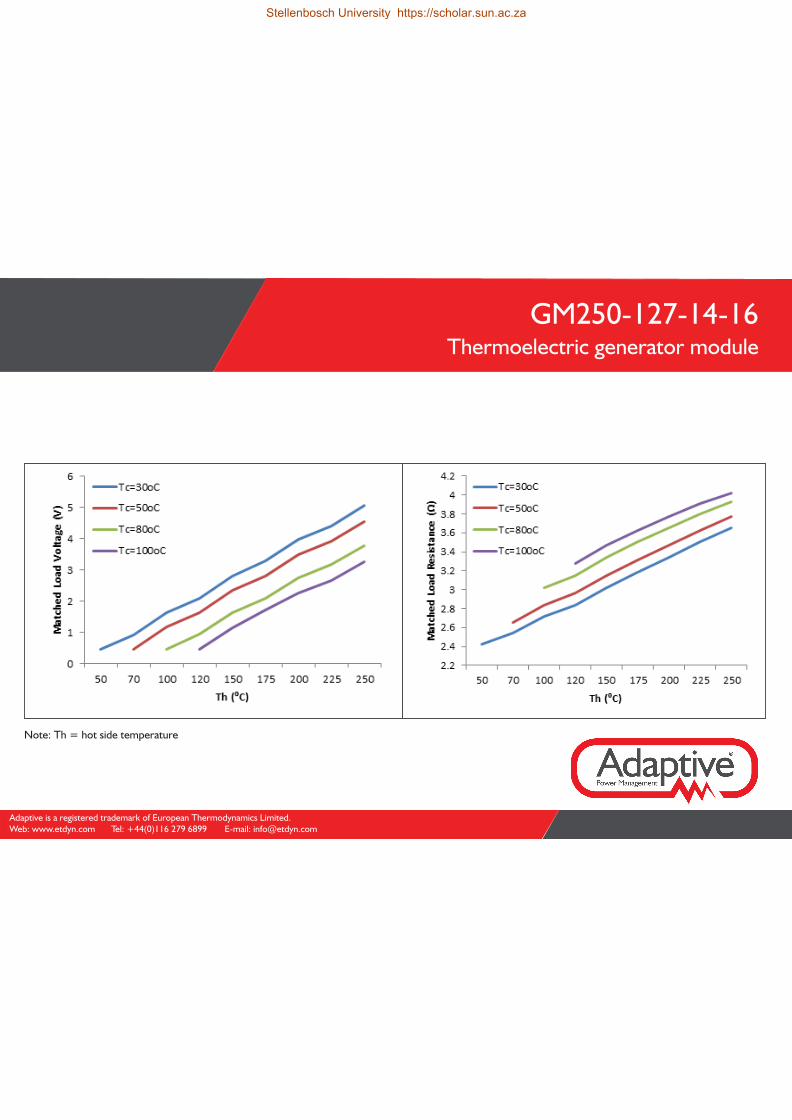
Adaptive is a registered trademark of European Thermodynamics Limited.Web: www.etdyn.com Tel: +44(0)116 279 6899 E-mail: [email protected]
Thermoelectric generator moduleGM250-127-14-16
Note: Th = hot side temperature
Stellenbosch University https://scholar.sun.ac.za
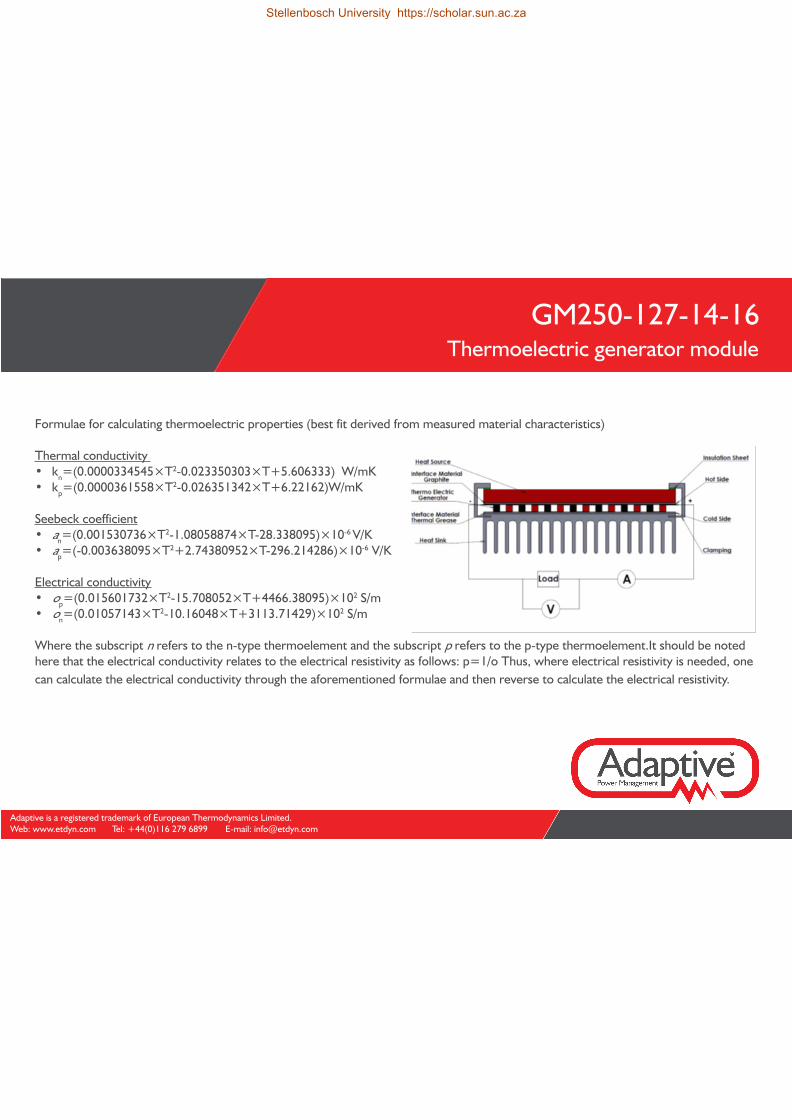
Formulae for calculating thermoelectric properties (best fit derived from measured material characteristics)
Thermal conductivity • kn=(0.0000334545×T2-0.023350303×T+5.606333) W/mK• kp=(0.0000361558×T2-0.026351342×T+6.22162)W/mK
Seebeck coefficient• an=(0.001530736×T2-1.08058874×T-28.338095)×10-6 V/K• ap=(-0.003638095×T2+2.74380952×T-296.214286)×10-6 V/K
Electrical conductivity• op=(0.015601732×T2-15.708052×T+4466.38095)×102 S/m• on=(0.01057143×T2-10.16048×T+3113.71429)×102 S/m
Where the subscript n refers to the n-type thermoelement and the subscript p refers to the p-type thermoelement.It should be noted here that the electrical conductivity relates to the electrical resistivity as follows: p=1/o Thus, where electrical resistivity is needed, one can calculate the electrical conductivity through the aforementioned formulae and then reverse to calculate the electrical resistivity.
Adaptive is a registered trademark of European Thermodynamics Limited.Web: www.etdyn.com Tel: +44(0)116 279 6899 E-mail: [email protected]
Thermoelectric generator moduleGM250-127-14-16
Stellenbosch University https://scholar.sun.ac.za
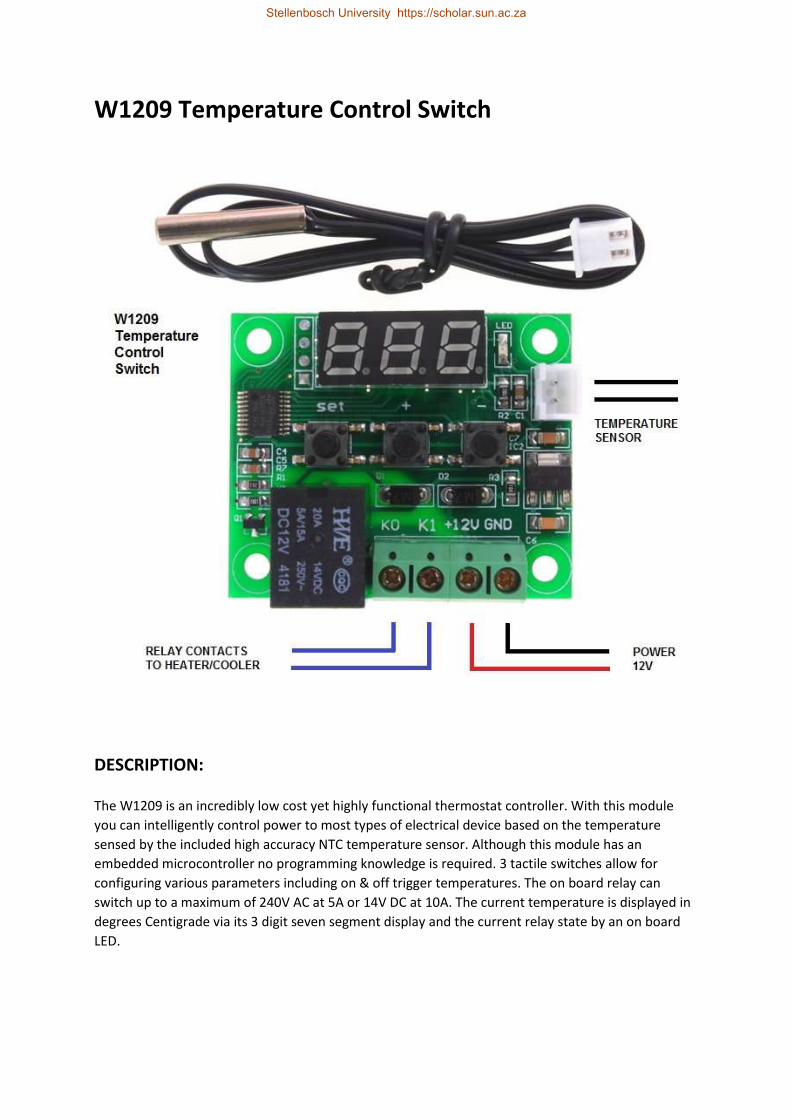
W1209 Temperature Control Switch
DESCRIPTION:
The W1209 is an incredibly low cost yet highly functional thermostat controller. With this module
you can intelligently control power to most types of electrical device based on the temperature
sensed by the included high accuracy NTC temperature sensor. Although this module has an
embedded microcontroller no programming knowledge is required. 3 tactile switches allow for
configuring various parameters including on & off trigger temperatures. The on board relay can
switch up to a maximum of 240V AC at 5A or 14V DC at 10A. The current temperature is displayed in
degrees Centigrade via its 3 digit seven segment display and the current relay state by an on board
LED.
Stellenbosch University https://scholar.sun.ac.za
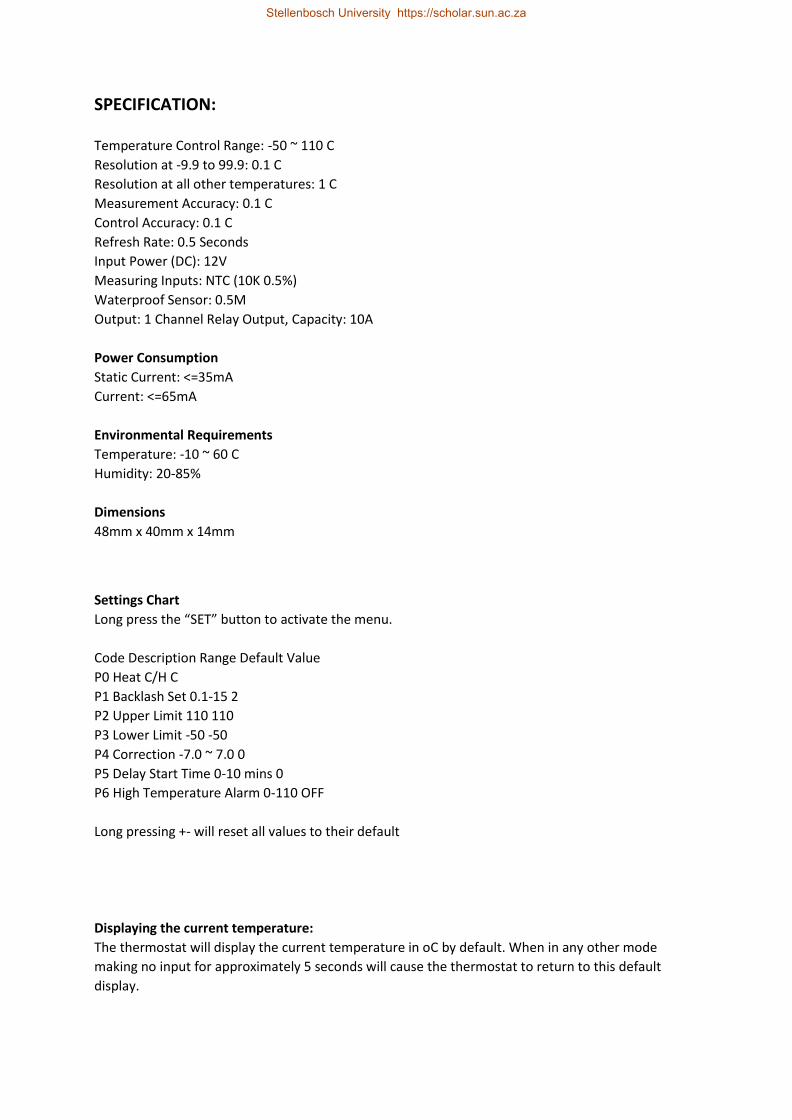
SPECIFICATION:
Temperature Control Range: -50 ~ 110 C
Resolution at -9.9 to 99.9: 0.1 C
Resolution at all other temperatures: 1 C
Measurement Accuracy: 0.1 C
Control Accuracy: 0.1 C
Refresh Rate: 0.5 Seconds
Input Power (DC): 12V
Measuring Inputs: NTC (10K 0.5%)
Waterproof Sensor: 0.5M
Output: 1 Channel Relay Output, Capacity: 10A
Power Consumption
Static Current: <=35mA
Current: <=65mA
Environmental Requirements
Temperature: -10 ~ 60 C
Humidity: 20-85%
Dimensions
48mm x 40mm x 14mm
Settings Chart
Long press the “SET” button to activate the menu.
Code Description Range Default Value
P0 Heat C/H C
P1 Backlash Set 0.1-15 2
P2 Upper Limit 110 110
P3 Lower Limit -50 -50
P4 Correction -7.0 ~ 7.0 0
P5 Delay Start Time 0-10 mins 0
P6 High Temperature Alarm 0-110 OFF
Long pressing +- will reset all values to their default
Displaying the current temperature:
The thermostat will display the current temperature in oC by default. When in any other mode
making no input for approximately 5 seconds will cause the thermostat to return to this default
display.
Stellenbosch University https://scholar.sun.ac.za
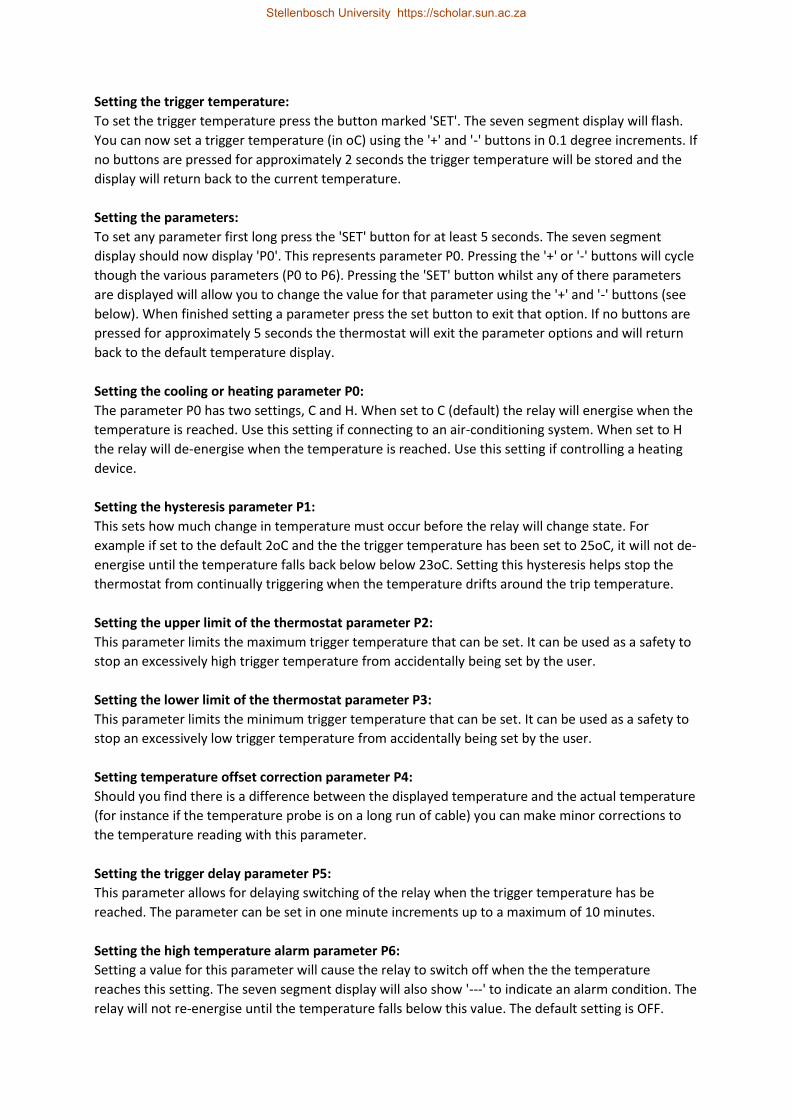
Setting the trigger temperature:
To set the trigger temperature press the button marked 'SET'. The seven segment display will flash.
You can now set a trigger temperature (in oC) using the '+' and '-' buttons in 0.1 degree increments. If
no buttons are pressed for approximately 2 seconds the trigger temperature will be stored and the
display will return back to the current temperature.
Setting the parameters:
To set any parameter first long press the 'SET' button for at least 5 seconds. The seven segment
display should now display 'P0'. This represents parameter P0. Pressing the '+' or '-' buttons will cycle
though the various parameters (P0 to P6). Pressing the 'SET' button whilst any of there parameters
are displayed will allow you to change the value for that parameter using the '+' and '-' buttons (see
below). When finished setting a parameter press the set button to exit that option. If no buttons are
pressed for approximately 5 seconds the thermostat will exit the parameter options and will return
back to the default temperature display.
Setting the cooling or heating parameter P0:
The parameter P0 has two settings, C and H. When set to C (default) the relay will energise when the
temperature is reached. Use this setting if connecting to an air-conditioning system. When set to H
the relay will de-energise when the temperature is reached. Use this setting if controlling a heating
device.
Setting the hysteresis parameter P1:
This sets how much change in temperature must occur before the relay will change state. For
example if set to the default 2oC and the the trigger temperature has been set to 25oC, it will not de-
energise until the temperature falls back below below 23oC. Setting this hysteresis helps stop the
thermostat from continually triggering when the temperature drifts around the trip temperature.
Setting the upper limit of the thermostat parameter P2:
This parameter limits the maximum trigger temperature that can be set. It can be used as a safety to
stop an excessively high trigger temperature from accidentally being set by the user.
Setting the lower limit of the thermostat parameter P3:
This parameter limits the minimum trigger temperature that can be set. It can be used as a safety to
stop an excessively low trigger temperature from accidentally being set by the user.
Setting temperature offset correction parameter P4:
Should you find there is a difference between the displayed temperature and the actual temperature
(for instance if the temperature probe is on a long run of cable) you can make minor corrections to
the temperature reading with this parameter.
Setting the trigger delay parameter P5:
This parameter allows for delaying switching of the relay when the trigger temperature has be
reached. The parameter can be set in one minute increments up to a maximum of 10 minutes.
Setting the high temperature alarm parameter P6:
Setting a value for this parameter will cause the relay to switch off when the the temperature
reaches this setting. The seven segment display will also show '---' to indicate an alarm condition. The
relay will not re-energise until the temperature falls below this value. The default setting is OFF.
Stellenbosch University https://scholar.sun.ac.za

Mounting instructions
1 Soldering
1.1 Leaded NTC thermistors
Leaded thermistors comply with the solderability requirements specified by CECC.
When soldering, care must be taken that the NTC thermistors are not damaged by excessive
heat. The following maximum temperatures, maximum time spans and minimum distances have
to be observed:
Dip soldering Iron soldering
Bath temperature max. 260 °C max. 360 °C
Soldering time max. 4 s max. 2 s
Distance from thermistor min. 6 mm min. 6 mm
Under more severe soldering conditions the resistance may change.
1.2 Leadless NTC thermistors
In case of NTC thermistors without leads, soldering is restricted to devices which are provided
with a solderable metallization. The temperature shock caused by the application of hot solder
may produce fine cracks in the ceramic, resulting in changes in resistance.
To prevent leaching of the metallization, solder with silver additives or with a low tin content
should be used. In addition, soldering methods should be employed which permit short soldering
times.
1.3 SMD NTC thermistors
SMD NTC thermistors can be provided with a nickel barrier termination or on special request with
silver-palladium termination. The usage of mild, non-activated fluxes for soldering is recommend-
ed as well as a proper cleaning of the PCB.
Nickel barrier termination
The nickel barrier layer of the silver/nickel/tin termination (see figure 1) prevents leaching of the
silver base metalization layer. This allows great flexibility in the selection of soldering parameters.
The tin prevents the nickel layer from oxidizing and thus ensures better wetting by the solder. The
nickel barrier termination is suitable for all commonly-used soldering methods.
Note: SMD NTCs with AgPd termination are not approved for lead-free soldering.
Figure 1
SMD NTC thermistors, structure of nickel barrier
termination
Temperature measurement B57540G1
Glass-encapsulated sensors G1540
Page 9 of 21Please read Cautions and warnings andImportant notes at the end of this document.
Stellenbosch University https://scholar.sun.ac.za
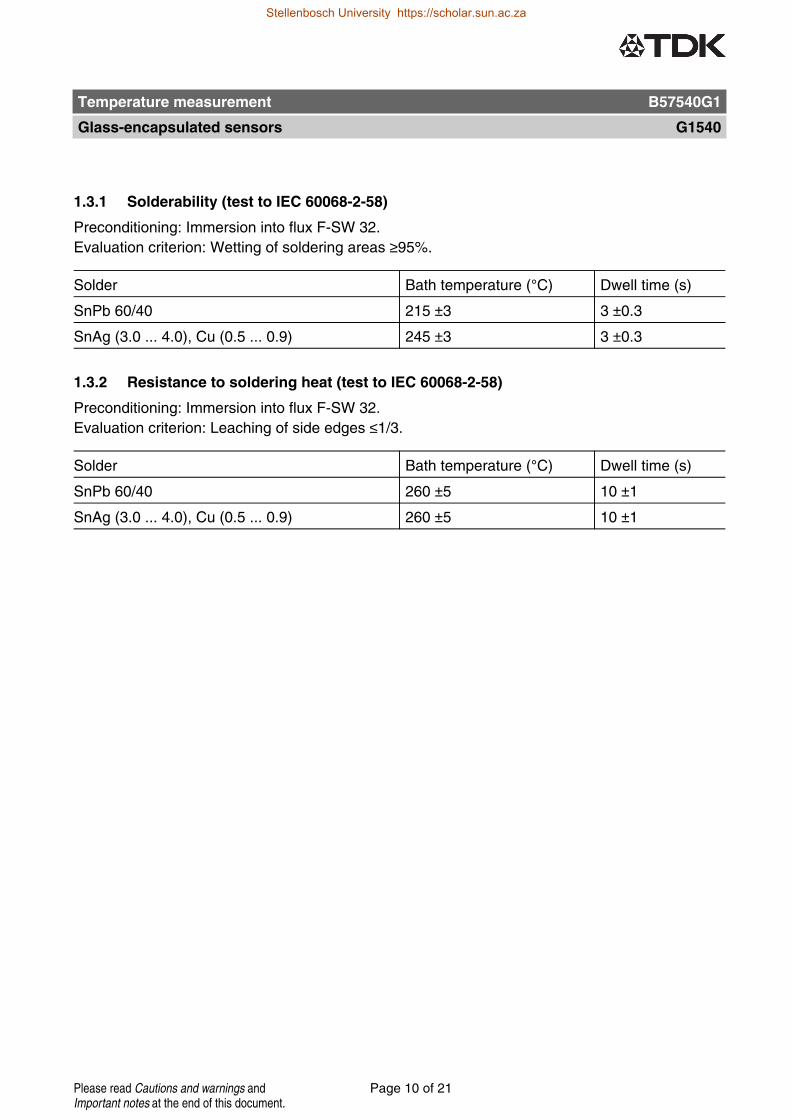
1.3.1 Solderability (test to IEC 60068-2-58)
Preconditioning: Immersion into flux F-SW 32.
Evaluation criterion: Wetting of soldering areas ≥95%.
Solder Bath temperature (°C) Dwell time (s)
SnPb 60/40 215 ±3 3 ±0.3
SnAg (3.0 ... 4.0), Cu (0.5 ... 0.9) 245 ±3 3 ±0.3
1.3.2 Resistance to soldering heat (test to IEC 60068-2-58)
Preconditioning: Immersion into flux F-SW 32.
Evaluation criterion: Leaching of side edges ≤1/3.
Solder Bath temperature (°C) Dwell time (s)
SnPb 60/40 260 ±5 10 ±1
SnAg (3.0 ... 4.0), Cu (0.5 ... 0.9) 260 ±5 10 ±1
Temperature measurement B57540G1
Glass-encapsulated sensors G1540
Page 10 of 21Please read Cautions and warnings andImportant notes at the end of this document.
Stellenbosch University https://scholar.sun.ac.za
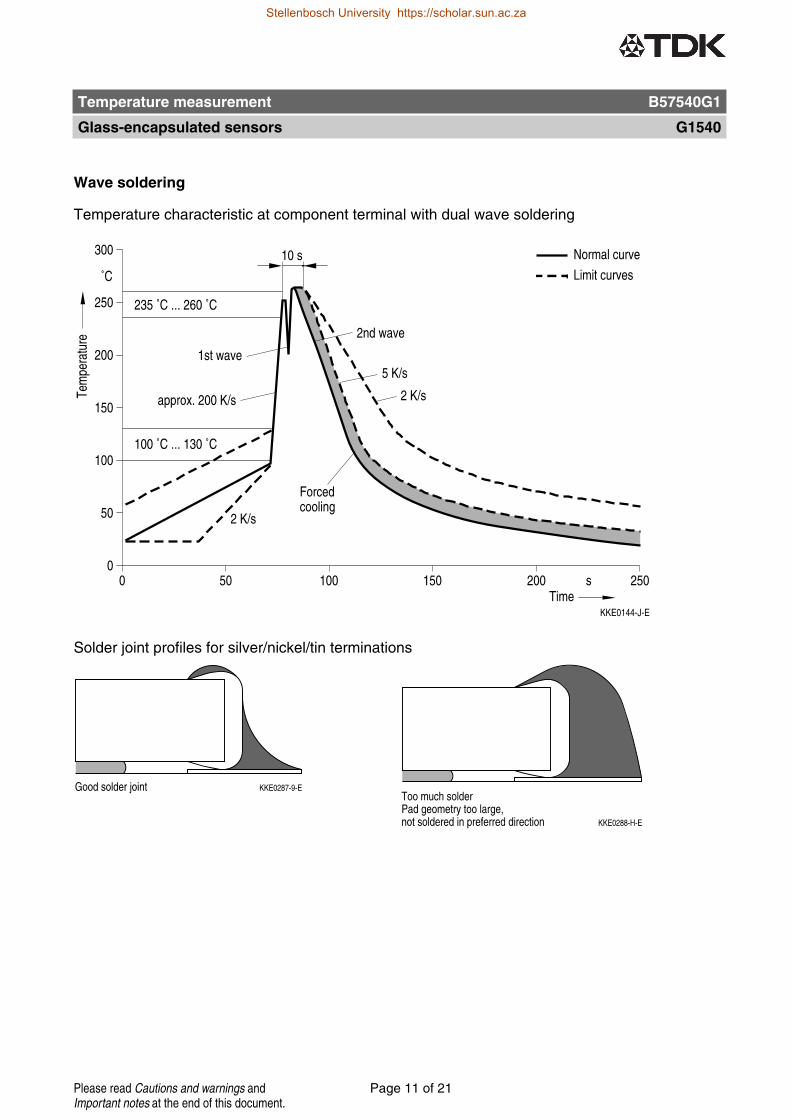
Wave soldering
Temperature characteristic at component terminal with dual wave soldering
Solder joint profiles for silver/nickel/tin terminations
Temperature measurement B57540G1
Glass-encapsulated sensors G1540
Page 11 of 21Please read Cautions and warnings andImportant notes at the end of this document.
Stellenbosch University https://scholar.sun.ac.za
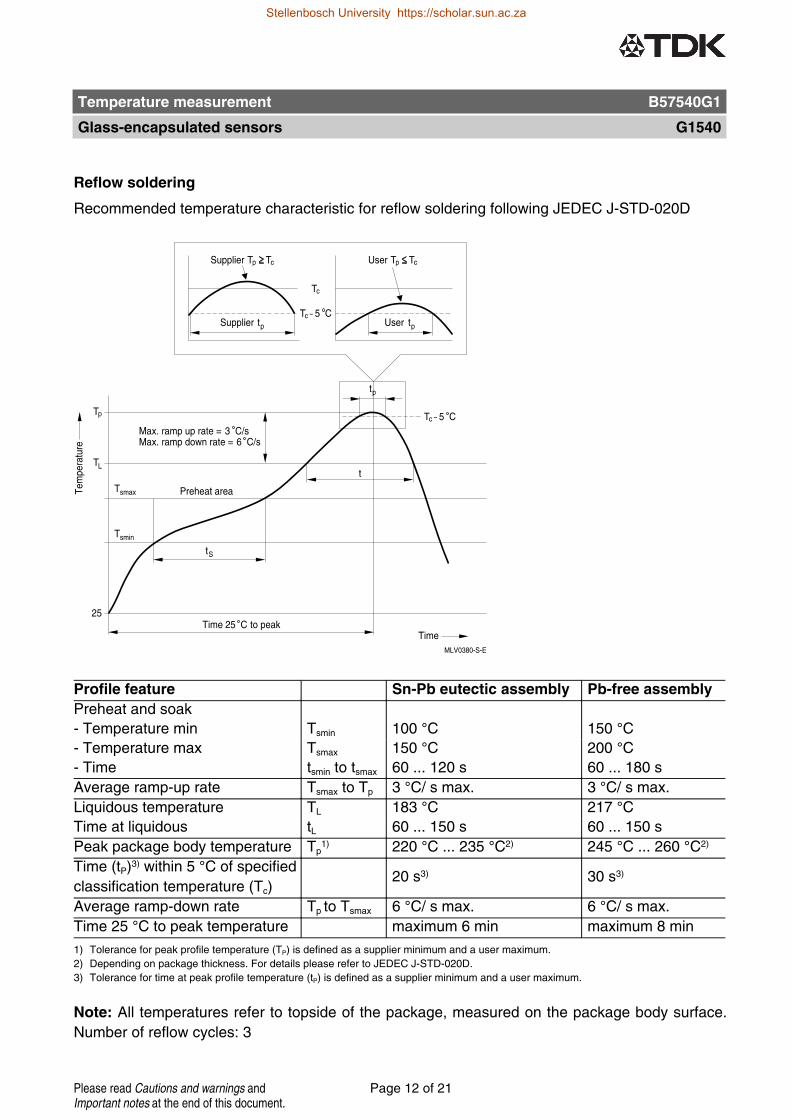
Reflow soldering
Recommended temperature characteristic for reflow soldering following JEDEC J-STD-020D
Profile feature Sn-Pb eutectic assembly Pb-free assembly
Preheat and soak
- Temperature min Tsmin 100 °C 150 °C- Temperature max Tsmax 150 °C 200 °C- Time tsmin to tsmax 60 ... 120 s 60 ... 180 s
Average ramp-up rate Tsmax to Tp 3 °C/ s max. 3 °C/ s max.
Liquidous temperature TL 183 °C 217 °CTime at liquidous tL 60 ... 150 s 60 ... 150 s
Peak package body temperature Tp1) 220 °C ... 235 °C2) 245 °C ... 260 °C2)
Time (tP)3) within 5 °C of specified
classification temperature (Tc)20 s3) 30 s3)
Average ramp-down rate Tp to Tsmax 6 °C/ s max. 6 °C/ s max.
Time 25 °C to peak temperature maximum 6 min maximum 8 min
1) Tolerance for peak profile temperature (TP) is defined as a supplier minimum and a user maximum.
2) Depending on package thickness. For details please refer to JEDEC J-STD-020D.
3) Tolerance for time at peak profile temperature (tP) is defined as a supplier minimum and a user maximum.
Note: All temperatures refer to topside of the package, measured on the package body surface.
Number of reflow cycles: 3
Temperature measurement B57540G1
Glass-encapsulated sensors G1540
Page 12 of 21Please read Cautions and warnings andImportant notes at the end of this document.
Stellenbosch University https://scholar.sun.ac.za
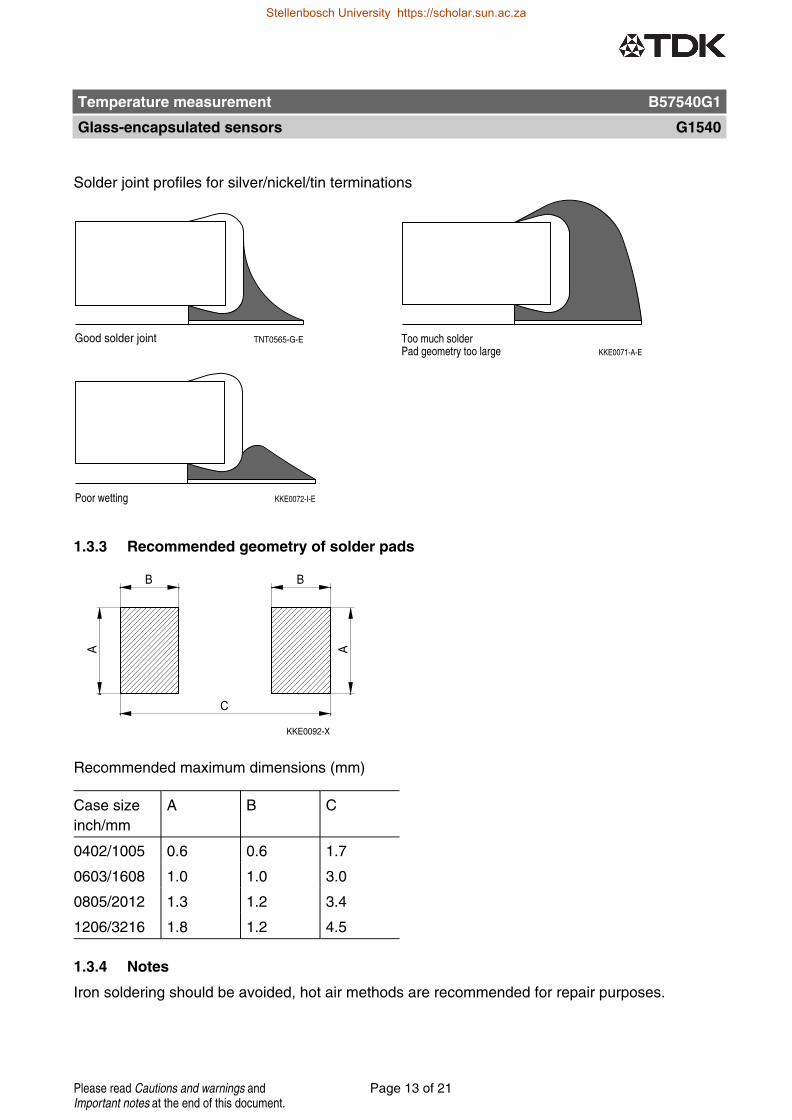
Solder joint profiles for silver/nickel/tin terminations
1.3.3 Recommended geometry of solder pads
Recommended maximum dimensions (mm)
Case size
inch/mm
A B C
0402/1005 0.6 0.6 1.7
0603/1608 1.0 1.0 3.0
0805/2012 1.3 1.2 3.4
1206/3216 1.8 1.2 4.5
1.3.4 Notes
Iron soldering should be avoided, hot air methods are recommended for repair purposes.
Temperature measurement B57540G1
Glass-encapsulated sensors G1540
Page 13 of 21Please read Cautions and warnings andImportant notes at the end of this document.
Stellenbosch University https://scholar.sun.ac.za

2 Conductive adhesion
An alternative to soldering is the gluing of thermistors with conductive adhesives. The benefit of
this method is that it involves no thermal stress. The adhesives used must be chemically inert.
3 Clamp contacting
Pressure contacting by means of clamps is particularly suitable for applications involving frequent
switching and high turn-on powers.
4 Robustness of terminations (leaded types)
The leads meet the requirements of IEC 60068-2-21. They may not be bent closer than 4 mm
from the solder joint on the thermistor body or from the point at which they leave the feed-
throughs. During bending, any mechanical stress at the outlet of the leads must be removed. The
bending radius should be at least 0.75 mm.
Tensile strength: Test Ua1:
Leads ∅ ≤0.25 mm = 1.0 N
0.25 < ∅ ≤0.35 mm = 2.5 N
0.35 < ∅ ≤0.50 mm = 5.0 N
0.50 < ∅ ≤0.80 mm = 10.0 N
0.80 < ∅ ≤1.25 mm = 20.0 N
Bending strength: Test Ub:
Two 90°-bends in opposite directions at a weight of 0.25 kg.
Torsional strength: Test Uc: severity 2
The lead is bent by 90° at a distance of 6 to 6.5 mm from the thermistor body.
The bending radius of the leads should be approx. 0.75 mm. Two torsions of
180° each (severity 2).
When subjecting leads to mechanical stress, the following should be observed:
Tensile stress on leads
During mounting and operation tensile forces on the leads are to be avoided.
Bending of leads
Bending of the leads directly on the thermistor body is not permissible.
A lead may be bent at a minimum distance of twice the wire's diameter +2 mm from the solder
joint on the thermistor body. During bending the wire must be mechanically relieved at its outlet.
The bending radius should be at least 0.75 mm.
Temperature measurement B57540G1
Glass-encapsulated sensors G1540
Page 14 of 21Please read Cautions and warnings andImportant notes at the end of this document.
Stellenbosch University https://scholar.sun.ac.za
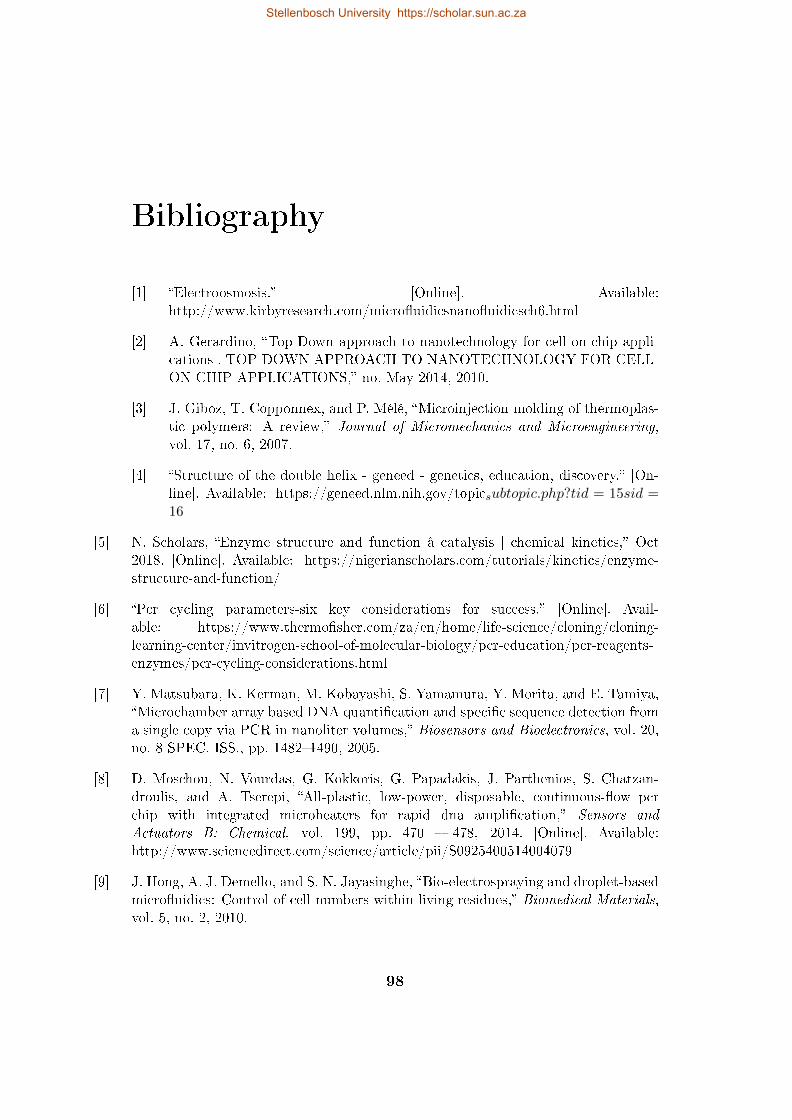
Bibliography
[1] �Electroosmosis.� [Online]. Available:http://www.kirbyresearch.com/micro�uidicsnano�uidicsch6.html
[2] A. Gerardino, �Top-Down approach to nanotechnology for cell-on-chip appli-cations . TOP-DOWN APPROACH TO NANOTECHNOLOGY FOR CELL-ON-CHIP APPLICATIONS,� no. May 2014, 2010.
[3] J. Giboz, T. Copponnex, and P. Mélé, �Microinjection molding of thermoplas-tic polymers: A review,� Journal of Micromechanics and Microengineering,vol. 17, no. 6, 2007.
[4] �Structure of the double helix - geneed - genetics, education, discovery.� [On-line]. Available: https://geneed.nlm.nih.gov/topicsubtopic.php?tid = 15sid =16
[5] N. Scholars, �Enzyme structure and function â catalysis | chemical kinetics,� Oct2018. [Online]. Available: https://nigerianscholars.com/tutorials/kinetics/enzyme-structure-and-function/
[6] �Pcr cycling parameters-six key considerations for success.� [Online]. Avail-able: https://www.thermo�sher.com/za/en/home/life-science/cloning/cloning-learning-center/invitrogen-school-of-molecular-biology/pcr-education/pcr-reagents-enzymes/pcr-cycling-considerations.html
[7] Y. Matsubara, K. Kerman, M. Kobayashi, S. Yamamura, Y. Morita, and E. Tamiya,�Microchamber array based DNA quanti�cation and speci�c sequence detection froma single copy via PCR in nanoliter volumes,� Biosensors and Bioelectronics, vol. 20,no. 8 SPEC. ISS., pp. 1482�1490, 2005.
[8] D. Moschou, N. Vourdas, G. Kokkoris, G. Papadakis, J. Parthenios, S. Chatzan-droulis, and A. Tserepi, �All-plastic, low-power, disposable, continuous-�ow pcrchip with integrated microheaters for rapid dna ampli�cation,� Sensors and
Actuators B: Chemical, vol. 199, pp. 470 � 478, 2014. [Online]. Available:http://www.sciencedirect.com/science/article/pii/S0925400514004079
[9] J. Hong, A. J. Demello, and S. N. Jayasinghe, �Bio-electrospraying and droplet-basedmicro�uidics: Control of cell numbers within living residues,� Biomedical Materials,vol. 5, no. 2, 2010.
98
Stellenbosch University https://scholar.sun.ac.za
BIBLIOGRAPHY 99
[10] K. J. Shaw, P. T. Docker, J. V. Yelland, C. E. Dyer, J. Greenman, G. M. Green-way, and S. J. Haswell, �Rapid PCR ampli�cation using a micro�uidic device withintegrated microwave heating and air impingement cooling,� Lab on a Chip, vol. 10,no. 13, pp. 1725�1728, 2010.
[11] �How to choose the right micro�uidic �ow control system?� [Online].Available: https://www.elve�ow.com/micro�uidic-tutorials/micro�uidic-reviews-and-tutorials/how-to-choose-right-micro�uidic-�ow-control-system/
[12] C.-W. Tsao, �Polymer micro�uidics: Simple, low-cost fabrication process bridgingacademic lab research to commercialized production,� Micromachines, vol. 7, p. 225,12 2016.
[13] L. J. Fitzpatrick and J. R. Dean, �Extraction solvent selection in environmentalanalysis,� Analytical Chemistry, vol. 74, no. 1, pp. 74�79, 2002.
[14] G. M. Whitesides, �The origins and the future of micro�uidics,� Nature, vol. 442, no.7101, pp. 368�373, 2006.
[15] K. Orrling, P. Nilsson, M. Gullberg, and M. Larhed, �An e�cient method toperform milliliter-scale PCR utilizing highly controlled microwave thermocycling.�Chemical communications (Cambridge, England), no. 7, pp. 790�1, 2004. [Online].Available: http://www.ncbi.nlm.nih.gov/pubmed/15045065
[16] J. Khandurina, T. E. McKnight, S. C. Jacobson, L. C. Waters, R. S. Foote, andJ. M. Ramsey, �Integrated system for rapid PCR-based DNA analysis in micro�uidicdevices,� Analytical Chemistry, vol. 72, no. 13, pp. 2995�3000, 2000.
[17] M. Hashimoto, P. C. Chen, M. W. Mitchell, D. E. Nikitopoulos, S. A. Soper, andM. C. Murphy, �Rapid PCR in a continuous �ow device,� Lab on a Chip, vol. 4,no. 6, pp. 638�645, 2004.
[18] P. Liu, T. S. Seo, N. Beyor, K. J. Shin, J. R. Scherer, and R. A. Mathies, �Integratedportable polymerase chain reaction-capillary electrophoresis microsystem for rapidforensic short tandem repeat typing,� Analytical Chemistry, vol. 79, no. 5, pp. 1881�1889, 2007.
[19] M. Amasia, M. Cozzens, and M. J. Madou, �Centrifugal micro�uidic platform forrapid PCR ampli�cation using integrated thermoelectric heating and ice-valving,�Sensors and Actuators, B: Chemical, vol. 161, no. 1, pp. 1191�1197, 2012.
[20] S. L. Anna, N. Bontoux, and H. A. Stone, �Formation of dispersions using "�owfocusing" in microchannels,� Applied Physics Letters, vol. 82, no. 3, pp. 364�366,2003.
[21] G. M. Walker and D. J. Beebe, �A passive pumping method for micro�uidic devices,�Lab on a Chip, vol. 2, no. 3, pp. 131�134, 2002.
[22] �Hiv and AIDS in Southern Africa,� ://www.avert.org/professionals/hiv-around-world/sub-saharan-africa/south-africa.
Stellenbosch University https://scholar.sun.ac.za
BIBLIOGRAPHY 100
[23] �www.unaids.org/en/regionscountries/countries/southafrica,�://www.unaids.org/en/regionscountries/countries/southafrica.
[24] �Genetic Testing for HIV,� ://stanfordhealthcare.org/medical-conditions/sexual-and-reproductive-health/hiv-aids/diagnosis/genetic-testing.html.
[25] S. C. Terry, J. H. Herman, and J. B. Angell, �A Gas Chromatographic Air AnalyzerFabricated on a Silicon Wafer,� IEEE Transactions on Electron Devices, vol. 26,no. 12, pp. 1880�1886, 1979.
[26] B. Giri, �Introduction to Micro�uidics,� Laboratory Meth-
ods in Micro�uidics, pp. 1�7, 2017. [Online]. Available:http://linkinghub.elsevier.com/retrieve/pii/B9780128132357000015
[27] J. C. T. Eijkel and A. V. den Berg, �The use of capillarity for passive �ow handlingin lab on a chip devices,� vol. 6, 2006.
[28] UTP, �Informe De Caracterización De Vertimientos Propios De La Actividad De LaMinería De Oro En Risaralda,� vol. 8, no. 6, pp. 1�30, 2017.
[29] A. Olanrewaju, M. Beaugrand, M. Ya�a, and D. Juncker, �Capillary micro�uidicsin microchannels: From micro�uidic networks to capillaric circuits,� Lab on a Chip,vol. 18, no. 16, pp. 2323�2347, 2018.
[30] H. A.Manz, N.Graber, �Miniaturized total chemical analysis systems: A novel con-cept for chemical sensing,� vol. 1, no. 6, pp. 244�248, 1990.
[31] N. B. A. Manz, C. S. E�enhauser, �Electroosmotic pumping and electrophoreticsepara- tion for miniaturised chemical analysis systems,� vol. 4, p. 257â265, 1994.
[32] A. M. a. T. F. von Heeren, E. Verpoorte, �Electroosmotic pumping and elec-trophoretic separa- tion for miniaturisMicellar electrokinetic chromatography sep-arations and analyses of biological samples on a cyclic planar microstructure,� Anal.Chem., vol. 68, p. 2044â2053, 1996.
[33] S. Zeng, C. H. Chen, J. C. Mikkelsen, and J. G. Santiago, �Fabrication and char-acterization of electroosmotic micropumps,� Sensors and Actuators, B: Chemical,vol. 79, no. 2-3, pp. 107�114, 2001.
[34] S. Liu and P. K. Dasgupta, �Flow-injection analysis in the capillary format usingelectroosmotic pumping,� Analytica Chimica Acta, vol. 268, no. 1, pp. 1�6, 1992.
[35] B. Çetin and D. Li, �Dielectrophoresis in micro�uidics technology,� Electrophoresis,vol. 32, no. 18, pp. 2410�2427, 2011.
[36] J. Wehking, �Electrohydrodynamic Manipulation of Liquid Droplet Emulsions in a,�2013.
[37] G. Masahide and W. Masao, �Self-propulsion of a water droplet in an electric �eld,�Journal of Physics D: Applied Physics, vol. 38, pp. 2417�2423, 2005.
Stellenbosch University https://scholar.sun.ac.za
BIBLIOGRAPHY 101
[38] F. e. a. Incropera, Introduction to Heat Transfer 5th edition., 2006.
[39] P. Rai-Choudhury, Handbook of microlithography, micromachining, and microfabri-
cation: microlithography, 1997.
[40] C. Iliescu, H. Taylor, M. Avram, J. Miao, and S. Franssila, �A practical guide for thefabrication of micro�uidic devices using glass and silicon,� Biomicro�uidics, vol. 6,no. 1, pp. 1�16, 2012.
[41] C. Zhang and D. Xing, �Miniaturized PCR chips for nucleic acid ampli�cation andanalysis: Latest advances and future trends,� Nucleic Acids Research, vol. 35, no. 13,pp. 4223�4237, 2007.
[42] S. Ji, C. Academy, C. Ye, C. Academy, and S. Ji, �Thermal response of transparentsilver nanowire / PEDOT : PSS �lm heaters Thermal Response of Transparent SilverNanowire / PEDOT : PSS Film Heaters,� no. December 2014, 2015.
[43] w. MicroChemicals®, �Lift o� photolithography.�
[44] K. L. Berkowski, K. N. Plunkett, Q. Yu, and J. S. Moore, �Introduction to Pho-tolithography : Preparation of Microscale Polymer Silhouettes W,� vol. 82, no. 9,2005.
[45] �SU-8 Photoresists,Copyright © 2018 MicroChem Corp.�://www.microchem.com/Prod-SU8.htm.
[46] F. Laermer, S. Franssila, L. Sainiemi, and K. Kolari, �Chapter 21 - deep reactive ionetching,� in Handbook of Silicon Based MEMS Materials and Technologies (Second
Edition), second edition ed., ser. Micro and Nano Technologies, M. Tilli, T. Motooka,V.-M. Airaksinen, S. Franssila, M. Paulasto-Kröckel, and V. Lindroos, Eds.Boston: William Andrew Publishing, 2015, pp. 444 � 469. [Online]. Available:http://www.sciencedirect.com/science/article/pii/B978032329965700021X
[47] R. Dussart, T. Tillocher, P. Lefaucheux, and M. Boufnichel, �Plasma cryogenic etch-ing of silicon: From the early days to today's advanced technologies,� Journal of
Physics D: Applied Physics, vol. 47, p. 123001, 03 2014.
[48] M. Morita, T. Ohmi, E. Hasegawa, M. Kawakami, and M. Ohwada, �Growth ofnative oxide on a silicon surface,� Journal of Applied Physics, vol. 68, no. 3, pp.1272�1281, 1990.
[49] J. Haneveld, H. Jansen, E. Berenschot, N. Tas, and M. Elwenspoek, �Wet anisotropicetching for �uidic 1D nanochannels,� Journal of Micromechanics and Microengineer-
ing, vol. 13, no. 4, pp. 3�7, 2003.
[50] S. Tang and G. Whitesides, �Basic micro�uidic and soft lithographic techniques,�Opto�uidics: Fundamentals, Devices, and Applications, pp. 7�32, 2010. [Online].Available: http://www2.egr.uh.edu/ nvaradar/private/Refs/Litho.pdf
Stellenbosch University https://scholar.sun.ac.za

BIBLIOGRAPHY 102
[51] H. Becker and L. E. Locascio, �Polymer micro�uidic devices,� Ta-
lanta, vol. 56, no. 2, pp. 267 � 287, 2002. [Online]. Available:http://www.sciencedirect.com/science/article/pii/S003991400100594X
[52] J. Friend and L. Yeo, �Fabrication of micro�uidic devices using polydimethylsilox-ane,� Biomicro�uidics, vol. 4, no. 2, pp. 1�5, 2010.
[53] L. E. Locascio, C. E. Perso, and C. S. Lee, �Measurement of electroosmotic �owin plastic imprinted micro�uid devices and the e�ect of protein adsorption on �owrate,� Journal of Chromatography A, vol. 857, no. 1, pp. 275 � 284, 1999. [Online].Available: http://www.sciencedirect.com/science/article/pii/S0021967399007748
[54] H.-J. Chiang, S.-L. Yeh, C.-C. Peng, W.-H. Liao, and Y.-C. Tung,�Polydimethylsiloxane-polycarbonate Micro�uidic Devices for Cell MigrationStudies Under Perpendicular Chemical and Oxygen Gradients,� Jour-
nal of Visualized Experiments, no. 120, pp. 1�8, 2017. [Online].Available: http://www.jove.com/video/55292/polydimethylsiloxane-polycarbonate-micro�uidic-devices-for-cell
[55] J. Chen, Y. Lin, and G. Chen, �Fabrication of poly(methyl methacrylate) micro�uidicchips by redox-initiated polymerization,� Electrophoresis, vol. 28, no. 16, pp. 2897�2903, 2007.
[56] X. Zhang, Z. Zhu, Z. Ni, N. Xiang, and H. Yi, �Inexpensive, rapid fabrication ofpolymer-�lm micro�uidic autoregulatory valve for disposable micro�uidics,� Biomed-
ical Microdevices, vol. 19, no. 2, pp. 1�9, 2017.
[57] C. I. Rogers, J. B. Oxborrow, R. R. Anderson, L.-F. Tsai, G. P. Nordin, and A. T.Woolley, �Micro�uidic valves made from polymerized polyethylene glycol diacrylate,�Sensors and Actuators B: Chemical, vol. 191, pp. 438 � 444, 2014. [Online].Available: http://www.sciencedirect.com/science/article/pii/S092540051301191X
[58] C. W. Tsao and D. L. DeVoe, �Bonding of thermoplastic polymer micro�uidics,�Micro�uidics and Nano�uidics, vol. 6, no. 1, pp. 1�16, 2009.
[59] J. H. Wang, L. J. Chien, T. M. Hsieh, C. H. Luo, W. P. Chou, P. H. Chen, P. J. Chen,D. S. Lee, and G. B. Lee, �A miniaturized quantitative polymerase chain reactionsystem for DNA ampli�cation and detection,� Sensors and Actuators, B: Chemical,vol. 141, no. 1, pp. 329�337, 2009.
[60] D. C. Du�y, J. C. Mcdonald, O. J. A. Schu, and G. M. Whitesides, �Polydimethyl-siloxane ( PDMS ) on SU-8 Mold,� vol. 73246, no. 617, pp. 2�4, 1998.
[61] S. A. Soper, K. Brown, A. Ellington, B. Frazier, G. Garcia-Manero, V. Gau,S. I. Gutman, D. F. Hayes, B. Korte, J. L. Landers, D. Larson, F. Ligler,A. Majumdar, M. Mascini, D. Nolte, Z. Rosenzweig, J. Wang, and D. Wilson,�Point-of-care biosensor systems for cancer diagnostics/prognostics,� Biosensors
and Bioelectronics, vol. 21, no. 10, pp. 1932 � 1942, 2006. [Online]. Available:http://www.sciencedirect.com/science/article/pii/S0956566306000121
Stellenbosch University https://scholar.sun.ac.za
BIBLIOGRAPHY 103
[62] B. . Jo, L. M. V. Lerberghe, K. M. Motsegood, and D. J. Beebe, �Three-dimensionalmicro-channel fabrication in polydimethylsiloxane (pdms) elastomer,� Journal of Mi-
croelectromechanical Systems, vol. 9, no. 1, pp. 76�81, March 2000.
[63] Robert Langer and A. Jaklenec, �Fabrication of �llable microparticles and othercomplex 3D microstructures,� Materials Science, vol. 1142, no. September, pp. 1138�1142, 2017.
[64] U. M. Attia, S. Marson, and J. R. Alcock, �Micro-injection moulding of polymermicro�uidic devices,� Micro�uidics and Nano�uidics, vol. 7, no. 1, pp. 1�28, 2009.
[65] S. C. Chen, W. R. Jong, Y. J. Chang, J. A. Chang, and J. C. Cin, �Rapid moldtemperature variation for assisting the micro injection of high aspect ratio micro-feature parts using induction heating technology,� Journal of Micromechanics and
Microengineering, vol. 16, no. 9, pp. 1783�1791, 2006.
[66] D. Yao and B. Kim, �Development of rapid heating and cooling systems for injectionmolding applications,� Polymer Engineering and Science, vol. 42, no. 12, pp. 2471�2481, 2002.
[67] �Micro & nano technologies published 2008 1.� vol. 0, p. 8155, 2008.
[68] L. P. D. Melo, G. V. Salmoria, E. A. Fancello, and C. R. D. M. Roesler, �In�uenceof Processing Conditions on the Mechanical Behavior and Morphology of InjectionMolded Poly(lactic-co-glycolic acid) 85:15,� International Journal of Biomaterials,vol. 2017, no. 2005, 2017.
[69] L. Martynova, L. E. Locascio, M. Gaitan, G. W. Kramer, R. G. Christensen,and W. A. MacCrehan, �Fabrication of plastic micro�uid channels by imprintingmethods,� Analytical Chemistry, vol. 69, no. 23, pp. 4783�4789, 1997, pMID:9406529. [Online]. Available: https://doi.org/10.1021/ac970558y
[70] J. Han, J. Han, B. S. Lee, J. Lim, S. M. Kim, H. Kim, and S. Kang, �Elimination ofnanovoids induced during electroforming of metallic nanostamps with high-aspect-ratio nanostructures by the pulse reverse current electroforming process,� Journal ofMicromechanics and Microengineering, vol. 22, no. 6, 2012.
[71] R. M. McCormick, R. J. Nelson, M. G. Alonso-Amigo, D. J. Benvegnu, and H. H.Hooper, �Microchannel Electrophoretic Separations of DNA in Injection-MoldedPlastic Substrates,� Analytical Chemistry, vol. 69, no. 14, pp. 2626�2630, 1997.
[72] H. Wilski, �The radiation induced degradation of polymers,� International
Journal of Radiation Applications and Instrumentation. Part C. Radiation
Physics and Chemistry, vol. 29, no. 1, pp. 1 � 14, 1987. [Online]. Available:http://www.sciencedirect.com/science/article/pii/1359019787900543
[73] A. d. C. Eduard Arzt, �Fabrication Approaches for Generating Complex Micro- andNanopatterns on Polymeric Surfaces,� Journal of Physics: Conference Series, vol.326, no. 1, 2011.
Stellenbosch University https://scholar.sun.ac.za
BIBLIOGRAPHY 104
[74] Y. Wang, Y. Xie, P. Wei, R. B. King, H. F. Schaefer, P. von R. Schleyer,and G. H. Robinson, �A stable silicon(0) compound with a si=si doublebond,� Science, vol. 321, no. 5892, pp. 1069�1071, 2008. [Online]. Available:http://science.sciencemag.org/content/321/5892/1069
[75] C. Ageorges, L. Ye, and M. Hou, �Advances in fusion bonding techniques forjoining thermoplastic matrix composites: a review,� Composites Part A: Applied
Science and Manufacturing, vol. 32, no. 6, pp. 839 � 857, 2001. [Online]. Available:http://www.sciencedirect.com/science/article/pii/S1359835X00001664
[76] L. Y. Shang, Z. L. Zhang, and B. Skallerud, �Fracture of anodic-bonded silicon-thin�lm glass-silicon triple stacks,� Engineering Fracture Mechanics, vol. 75, no. 5, pp.1064�1082, 2008.
[77] S. Queste, R. Salut, S. Clatot, J.-Y. Rauch, and C. G. Khan Malek, �Manufactureof micro�uidic glass chips by deep plasma etching, femtosecond laser ablation, andanodic bonding,� Microsystem Technologies, vol. 16, pp. 1485�1493, 01 2010.
[78] I.-M. H. Thomas M.H. Lee, Debbie H.Y. Lee, Connie Y.N. Liaw, Alex I.K. Lao,�Detailed characterization of anodic bonding process between glass and thin-�lmcoated silicon substrates,� Sensors and Actuators, vol. 86, no. 3, pp. 103�107, 2000.
[79] C. S. Goh, S. C. Tan, K. T. May, C. Z. Chan, and S. H. Ng, �Adhesive bonding ofpolymeric micro�uidic devices,� Proceedings of the Electronic Packaging Technology
Conference, EPTC, pp. 737�740, 2009.
[80] K. Sun, A. Yamaguchi, Y. Ishida, S. Matsuo, and H. Misawa, �A heater-integrated transparent microchannel chip for continuous-�ow pcr,� Sensors and
Actuators B: Chemical, vol. 84, no. 2, pp. 283 � 289, 2002. [Online]. Available:http://www.sciencedirect.com/science/article/pii/S0925400502000163
[81] S. P. Ng, F. E. Wiria, and N. B. Tay, �Low Distortion Solvent Bonding ofMicro�uidic Chips,� Procedia Engineering, vol. 141, pp. 130�137, 2016. [Online].Available: http://dx.doi.org/10.1016/j.proeng.2015.09.212
[82] J. H. HILDEBRAND, �A critique of the theory of solubility of non-electrolytes.',�pp. 37�45, 1949.
[83] K. F. Lei, S. Ahsan, N. Budraa, W. J. Li, and J. D. Mai, �Microwavebonding of polymer-based substrates for potential encapsulated micro/nano�uidicdevice fabrication,� Sensors and Actuators A: Physical, vol. 114, no. 2, pp.340 � 346, 2004, selected papers from Transducers 03. [Online]. Available:http://www.sciencedirect.com/science/article/pii/S0924424703007209
[84] S. Haeberle and R. Zengerle, �Micro�uidic platforms for lab-on-a-chip ap-plications,� Lab Chip, vol. 7, pp. 1094�1110, 2007. [Online]. Available:http://dx.doi.org/10.1039/B706364B
Stellenbosch University https://scholar.sun.ac.za
BIBLIOGRAPHY 105
[85] K. B. Mullis and F. A. Faloona, �[21] speci�c synthesis of dna in vitro via apolymerase-catalyzed chain reaction,� in Recombinant DNA Part F, ser. Methodsin Enzymology. Academic Press, 1987, vol. 155, pp. 335 � 350. [Online]. Available:http://www.sciencedirect.com/science/article/pii/0076687987550236
[86] M. Agne, A. Valones, R. L. Guimarães, L. André, and C. Brandão, �usefulness ofPCR in mmb,� pp. 1�11, 2009.
[87] �What is dna? - genetics home reference - nih.� [Online]. Available:https://ghr.nlm.nih.gov/primer/basics/dna
[88] B. Alberts, �The structure and function of dna,� Jan 1970. [Online]. Available:https://www.ncbi.nlm.nih.gov/books/NBK26821/
[89] �Mechanism of enzyme action.� [Online]. Available:http://chemistry.elmhurst.edu/vchembook/571lockkey.html
[90] K. Mullis, �The polymerase chain reaction,� 1994.
[91] W. Wang, H.-B. Wang, Z.-X. Li, and Z.-Y. Guo, �Silicon inhibition e�ects on thepolymerase chain reaction: A real-time detection approach,� Journal of Biomedical
Materials Research Part A, vol. 77A, no. 1, pp. 28�34. [Online]. Available:https://onlinelibrary.wiley.com/doi/abs/10.1002/jbm.a.30627
[92] K. Liu and Z. H. Fan, �Thermoplastic micro�uidic devices and their applicationsin protein and dna analysis,� Analyst, vol. 136, pp. 1288�1297, 2011. [Online].Available: http://dx.doi.org/10.1039/C0AN00969E
[93] A. Bhattacharyya and C. M. Klapperich, �Thermoplastic micro�uidic device for on-chip puri�cation of nucleic acids for disposable diagnostics,� Analytical Chemistry,vol. 78, no. 3, pp. 788�792, 2006.
[94] M. Allen Northrup, C. Gonzalez, S. Lehew, and R. Hills, �Development of a pcr-microreactor,� pp. 139�139, 01 1995.
[95] Y. Hong and Æ. F. Wang, �Flow rate e�ect on droplet control in a co-�owing mi-cro�uidic device,� pp. 341�346, 2007.
[96] C. Fermér, P. Nilsson, and M. Larhed, �Microwave-assisted high-speed PCR,� Euro-pean Journal of Pharmaceutical Sciences, vol. 18, no. 2, pp. 129�132, 2003.
[97] Y. Hataoka, L. Zhang, T. Yukimasa, and Y. Baba, �Rapid microvolume PCR ofDNA con�rmed by microchip electrophoresis.� Analytical sciences : the internationaljournal of the Japan Society for Analytical Chemistry, vol. 21, no. 1, pp. 53�6, 2005.[Online]. Available: http://www.ncbi.nlm.nih.gov/pubmed/15675516
[98] C. Ke, A.-M. Kelleher, H. Berney, M. Sheehan, and A. Mathewson, �Single stepcell lysis/pcr detection of escherichia coli in an independently controllable siliconmicroreactor,� Sensors and Actuators B: Chemical, vol. 120, pp. 538�544, 01 2007.
Stellenbosch University https://scholar.sun.ac.za
BIBLIOGRAPHY 106
[99] S. Kondo, N. Morimoto, K. Hori, E. Shinohara, and K. Kano, �Development of amicroreactor for pcr,� IEEJ Transactions on Sensors and Micromachines, vol. 119,pp. 448�453, 01 1999.
[100] B. Shi, G. He, and W. Wu, �A pcr microreactor machinery with passive micropumpand battery-powered heater for thermo-cycled ampli�cations of clinical-level andmultiplexed dna targets,� Microchimica Acta, vol. 185, 10 2018.
[101] B. Batule, H. Mun, and W.-B. Shim, �Development of hrpzyme-integrated pcr plat-form for colorimetric detection of foodborne pathogens,� 03 2018.
[102] S. Jha, Y.-C. Jang, R. Chand, K. Islam, and Y.-S. Kim, �A pdms based integratedpcr microchip for genetic analysis,� pp. 273�275, 01 2011.
[103] K. Cheng, D. Pan, J. Teng, L. Yao, Y. Ye, F. Xue, F. Xia, and W. Chen, �Colorimet-ric integrated pcr protocol for rapid detection of vibrio parahaemolyticus,� Sensors(Basel, Switzerland), vol. 16, 09 2016.
[104] N. Ho Bae, S. Young Lim, Y. Song, S. Woo Jeong, S. Yi Shin, Y. Tae Kim, T. J.Lee, K. Lee, S. Lee, Y.-J. Oh, and Y. Min Park, �A disposable and multi-chamber�lm-based pcr chip for detection of foodborne pathogen,� Sensors, vol. 18, p. 3158,09 2018.
[105] D. Park, P.-C. Chen, B. H. You, N. Kim, T. Park, P. Datta, Y. Desta, S. A. Soper,D. Nikitopoulos, and M. Murphy, �Optimization of geometry for continuous �ow pcrdevices in a titer plate-based pcr multi-reactor platform,� 01 2007.
[106] Z.-Q. Zou, X. Chen, Q.-H. Jin, M.-S. Yang, and Z. Jianlong, �A novel miniaturizedpcr multi-reactor array fabricated using �ip-chip bonding techniques,� Journal of
Micromechanics and Microengineering, vol. 15, p. 1476, 06 2005.
[107] J. S. Marcus, W. F. Anderson, and S. R. Quake, �Parallel picoliter rt-pcr assaysusing micro�uidics,� Analytical Chemistry, vol. 78, no. 3, pp. 956�958, 2006, pMID:16448074. [Online]. Available: https://doi.org/10.1021/ac0513865
[108] E. A. Ottesen, J. W. Hong, S. R. Quake, and J. R. Leadbetter, �Mi-cro�uidic digital pcr enables multigene analysis of individual environmentalbacteria,� Science, vol. 314, no. 5804, pp. 1464�1467, 2006. [Online]. Available:http://science.sciencemag.org/content/314/5804/1464
[109] M. U. Kopp, �Chemical Ampli�cation: Continuous-Flow PCR on a Chip,�Science, vol. 280, no. 5366, pp. 1046�1048, 1998. [Online]. Available:http://www.sciencemag.org/cgi/doi/10.1126/science.280.5366.1046
[110] A. Shamloo and A. Mashhadian, �Inertial particle focusing in serpentine channels ona centrifugal platform,� Physics of Fluids, vol. 30, p. 012002, 01 2018.
[111] C. M. Karale, S. Bhagwat, and V. Ranade, �Flow and heat transfer in serpentinechannels,� AIChE Journal, vol. 59, 05 2013.
Stellenbosch University https://scholar.sun.ac.za
BIBLIOGRAPHY 107
[112] R. Poole, A. Lindner, and M. Alves, �Viscoelastic secondary �ows in serpentinechannels,� Journal of Non-Newtonian Fluid Mechanics, vol. 201, pp. 10�16, 11 2013.
[113] X. Cui, J. Guo, X. Huai, K. Cheng, H. Zhang, and M. Xiang, �Numerical investigationon convective heat transfer of supercritical pressure co2 in serpentine channel,� 082018.
[114] J. Zilz, C. Schäfer, C. Wagner, R. Poole, M. Alves, and A. Lindner, �Serpentinechannels: Micro-rheometers for �uid relaxation times,� Lab on a chip, vol. 14, 112013.
[115] A. Mohammed, A. Adeniyi, and A. Hassan, �Modelling of serpentine continuous�ow polymerase chain reaction micro�uidics,� International Journal of EngineeringScience and Technology (IJEST), vol. 4, pp. 1183�1189, 03 2012.
[116] K. Hsieh, B. Scott Ferguson, M. Eisenstein, K. W. Plaxco, and H. Tom Soh, �Inte-grated electrochemical microsystems for genetic detection of pathogens at the pointof care,� Accounts of Chemical Research, vol. 48, no. 4, pp. 911�920, 2015.
[117] F. Schuler, M. Trotter, M. Geltman, and S. et al., �Digital droplet pcr on disk,� LabChip, vol. 16, 11 2015.
[118] Z. Zhu, W. Zhang, X. Leng, M. Zhang, Z. Guan, J. Lu, and C. J. Yang, �Highlysensitive and quantitative detection of rare pathogens through agarose droplet mi-cro�uidic emulsion PCR at the single-cell level.� Lab on a chip, vol. 12, no. 20, pp.3907�3913, 2012.
[119] L. Yao, B. Liu, T. Chen, S. Liu, and T. Zuo, �Micro �ow-through pcr in a pmmachip fabricated by krf excimer laser,� Biomedical microdevices, vol. 7, pp. 253�7, 102005.
[120] Z. Zhan, C. Dafu, Y. Zhongyao, and W. Li, �Biochip for pcr ampli�cation in silicon,�pp. 25 � 28, 02 2000.
[121] X. Qiu and J. Yuan, �Temperature control for pcr thermocyclers based on peltier-e�ect thermoelectric,� in 2005 IEEE Engineering in Medicine and Biology 27th An-
nual Conference, Jan 2005, pp. 7509�7512.
[122] W. Benett and J. B. Richards, �Pcr thermocycler,� 11 2018.
[123] K. A. Hagan, C. R. Reedy, M. L. Uchimoto, D. Basu, D. A. Engel, and J. P.Landers, �An integrated, valveless system for micro�uidic puri�cation and reversetranscription-PCR ampli�cation of RNA for detection of infectious agents,� Lab on
a Chip, vol. 11, no. 5, pp. 957�961, 2011.
[124] Y. Zhang and H.-R. Jiang, �A review on continuous-�ow micro�u-idic pcr in droplets: Advances, challenges and future,� Analyt-
ica Chimica Acta, vol. 914, pp. 7 � 16, 2016. [Online]. Available:http://www.sciencedirect.com/science/article/pii/S000326701630191X
Stellenbosch University https://scholar.sun.ac.za
BIBLIOGRAPHY 108
[125] J. El-Ali, I. Perch-Nielsen, C. Poulsen, D. Bang, P. Telleman, and A. Wol�,�Simulation and experimental validation of a su-8 based pcr thermocy-cler chip with integrated heaters and temperature sensor,� Sensors and
Actuators A: Physical, vol. 110, no. 1, pp. 3 � 10, 2004, selected Pa-pers from Eurosensors XVI Prague, Czech Republic. [Online]. Available:http://www.sciencedirect.com/science/article/pii/S0924424703004710
[126] M. K. Rawat, H. Chattopadhyay, and S. Neogi, �A review on developments of ther-moelectric refrigeration and air conditioning systems : a novel potential green re-frigeration and air conditioning,� International Journal of Emerging Technology and
Advanced Engineering, vol. 3, no. 3, pp. 362�367, 2013.
[127] J. A. Kim, J. Y. Lee, S. Seong, S. H. Cha, S. H. Lee, J. J. Kim, and T. H. Park, �Fab-rication and characterization of a PDMS-glass hybrid continuous-�ow PCR chip,�Biochemical Engineering Journal, vol. 29, no. 1-2, pp. 91�97, 2006.
[128] R. M. Niemi, I. Heiskanen, K. Wallenius, and K. Lindström, �Extraction and puri�-cation of dna in rhizosphere soil samples for pcr-dgge analysis of bacterial consortia,�Journal of Microbiological Methods, vol. 45, no. 3, pp. 155 � 165, 2001. [Online].Available: http://www.sciencedirect.com/science/article/pii/S0167701201002536
[129] B. Giordano, J. Ferrance, S. Swedberg, A. Hühmer, and J. Landers, �Polymerasechain reaction in polymeric microchips: Dna ampli�cation in less than 240 seconds,�Analytical Biochemistry, vol. 291, no. 1, pp. 124 � 132, 2001. [Online]. Available:http://www.sciencedirect.com/science/article/pii/S0003269700949741
[130] H. Tachibana, M. Saito, S. Shibuya, K. Tsuji, N. Miyagawa, K. Ya-manaka, and E. Tamiya, �On-chip quantitative detection of pathogengenes by autonomous micro�uidic pcr platform,� Biosensors and Bio-
electronics, vol. 74, pp. 725 � 730, 2015. [Online]. Available:http://www.sciencedirect.com/science/article/pii/S0956566315302554
[131] K. D. Foust and B. K. Kaspar, �NIH Public Access,� vol. 8, no. 24, pp. 4017�4018,2010.
[132] D. J. Laser and J. G. Santiago, �A review of micropumps,� Journal of
Micromechanics and Microengineering, vol. 14, no. 6, p. R35, 2004. [Online].Available: http://stacks.iop.org/0960-1317/14/i=6/a=R01
[133] Dolomite, �Peristaltic pump.� [Online]. Available: https://www.dolomite-micro�uidics.com/product/peristaltic-pump/
[134] X. Zhang, Z. Chen, and Y. Huang, �A valve-less micro�uidic peristaltic pumpingmethod,� Biomicro�uidics, vol. 9, no. 1, pp. 1�8, 2015. [Online]. Available:http://dx.doi.org/10.1063/1.4907982
[135] B. Mosadegh, T. Bersano, J. Park, M. A Burns, and S. Takayama, �Next-generationintegrated micro�uidic circuits,� Lab on a chip, vol. 11, pp. 2813�8, 09 2011.
Stellenbosch University https://scholar.sun.ac.za