DESHABHIMANI deffy
139
INTRODUCTION Human resource management (HRM) is concerned with the ‘people’ dimension in management. HRM is the term increasingly used to refer to the philosophy, policies, procedures and practices relating to the management of people within organization. Since every organization is made up of people, acquiring their services, developing their skills, motivating them to higher levels of performance, and ensuring that they continue to maintain their commitment to the organization are essential to achieve organizational objectives. The scope of Human Resource Management (HRM) is indeed vast. All the major activities in the working life of an employee from time of his entry into an organization until he leaves the organization comes under the purview of HRM. Human Resource Management embraces a very wide field of activities. The HR manager plays multiple roles like that of a researcher, counselor, bargainer, mediator, peacemaker, problem solver etc. The functional areas of HRM are employment, selection and training, employee services, wages, industrial 1
Transcript of DESHABHIMANI deffy
INTRODUCTION
Human resource management (HRM) is
concerned with the ‘people’ dimension in management.
HRM is the term increasingly used to refer to the
philosophy, policies, procedures and practices
relating to the management of people within
organization. Since every organization is made up of
people, acquiring their services, developing their
skills, motivating them to higher levels of
performance, and ensuring that they continue to
maintain their commitment to the organization are
essential to achieve organizational objectives.
The scope of Human Resource Management
(HRM) is indeed vast. All the major activities in the
working life of an employee from time of his entry
into an organization until he leaves the organization
comes under the purview of HRM.
Human Resource Management embraces a very
wide field of activities. The HR manager plays
multiple roles like that of a researcher, counselor,
bargainer, mediator, peacemaker, problem solver etc.
The functional areas of HRM are employment, selection
and training, employee services, wages, industrial
1

relations, health, safety and education.
Human Resource Management may be defined
as the field of management which has to do with
planning, organizing and controlling the functions of
procuring, developing, maintaining and utilizing a
labour force, such that the: objectives for which the
company is established are attained economically and
effectively, objectives of all levels of personnel
are served to the highest possible degree, objectives
of society are duly considered and served.
The objectives of Human Resource Management
(HRM) are influenced by organizational objectives and
individual and social goals. Every organization has
some objectives and every part of it should
contribute directly or indirectly to the attainment
of desired objectives. In order to achieve the
organizational objectives, integration of employer’s
interest and employee interests is necessary.
The primary aim of Human Resource Management is
the promotion of effectiveness of the employees with
performance of their allotted duties by the
substitution of cooperation in the common task in
place of the suspicions and hostility that have so
2
long been characteristics of relations between
employees and employers. Deshabhimani is one of the leading Malayalam
dailies in Kerala. It is the mouthpiece of the Kerala
State Committee of the Communist Party of India
(Marxist) it is run and published by the CPM of
Kerala, the paper acts as a media through which the
roots of the party can be firmly strengthened. It is
enjoying a common table circulation compared to other
Malayalam dailies in the scenario. As the literacy
level in Kerala is high, there is good circulation
for all the leading dailies and Deshabhimani has a
good position and status in Kerala.
Deshabhimani has editions at Kozhikode,
Kochi, Kannur, Thiruvanathapuram, Kottayam, Thrissur,
Malapuram, Abudhabi and it started its multi colour
edition at Kochi in 1993 and Thiruvanathapuram,
Kottayam and in 1994. Its internet edition started on
1 January of 1998 is another feather on the cap of
Deshabhimani. Deshabhimani is one among the three
most circulated dailies in Kerala. The children's
Magazine "Thathamma" a sister Publication is widely
accepted. The first spot magazine in
Malayalam"Kalikkalam" brought out by Deshabhimani.
3

Employee welfare work aims at providing such
service facilities and Amenities which enable the
workers employed in an organization to perform their
work in healthy congenial surrounding conductive to
good health and high morale. Employee welfare is a
comprehensive term including various services,
benefits and facilities offered by the employer.
Employee welfare means activities designed
for the promotion of the economic, social and
cultural well being of the employees. It includes
statutory as well as non- statutory activities
undertaken by the employers, trade unions and both
the central and state governments for the physical
and mental development of the workers.
Employee welfare enables workers to have
richer and more satisfying life. It raises the
standard of living of workers by indirectly reducing
the burden on their pocket. Welfare measures improve
the physical and physiological health of the
employees, which in turn enhance their efficiency and
productivity. Employee welfare promotes a sense of
belongings among the workers, preventing them from
resorting to unhealthy practices like absenteeism,
employee unrest strike, etc. welfare work improves
4

the relations between employees and employers.
STATEMENT OF THE PROBLEM
The project report is prepared based on
particular topic that is study on employee
satisfaction towards welfare facilities.
Human resource is an important asset of
every company. The skilled personnel are scarce and
are to be attached and sustained in the company. The
employee welfare measures help to counteract the
negative effects of the factory system. These
measures enable the employee and his family to lead a
good life.
5
Employee welfare improves the morale and
loyalty of workers by making them happy and
satisfied. It also helps to improve the goodwill and
public image to the enterprise.
The various welfare measures provided to
the workers will have immediate impact on the health,
physical and mental efficiency, alertness, morale and
overall efficiency of the workers and thereby
contributing to the highest productivity. Hence, the
research is to attempt to study and identify the
effectiveness of welfare schemes of Deshabhimani,
Cochin.
6

OBJECTIVE OF THE STUDY
Primary objective
The primary objective of the study is to
understand the effectiveness of employee
welfare measures among the employees in
Deshabhimani.
Secondary objectives
To identify various welfare measures provided
by the company for the employees
To see whether employees are satisfied with
the various welfare measures provided by the
company.
To understand whether there is any need of
improvement in the present welfare schemes.
To find out the level of satisfaction of both
the worker and the managerial staff in the
welfare measures taken by the company.
To study the impact of employee welfare on
employee satisfaction in Deshabhimani, Cochin.
To recommend few suggestions to improve the
satisfactory schemes adopted by the company,
based upon the findings.
7
To know about the awareness of statutory
welfare measures in the company.
To measure Employees satisfaction on
Compensation and Benefits.
To compare the desired satisfaction with the
actual one.
SCOPE OF THE STUDY
The scope of the study is on the welfare
measures provided by Deshabhimani daily. Employee
welfare improves the morale and loyalty of workers by
making them happy and satisfied. It also helps to
improve the goodwill and public image to the
enterprise. The test of welfare activities is that it
removes directly or indirectly any hindrance,
physical and mental of the worker and restores to the
peace and joy of living the welfare work embraces the
worker and his family
The major findings of the study provide
valuable information to the management. This helps
8
the management to take necessary steps to review the
welfare measures provided and can take corrective
measures in case of necessity and thereby improve the
satisfaction of the employees towards the welfare
measures.
LIMITATIONS OF THE STUDY
The sample size chosen for the study were only
50, and so the result would not be applicable
to the whole of Deshabhimani.
Managers and the staff members from different
departments are constantly engaged in their
work to meet deadlines; this caused a
limitation in the collection of data from
multiple sources.
The study has been conducted purely for
academic purpose and it is not an exhaustive
one.
Many of the employees are working in night
shifts. This caused a limitation in collection
of data from them.
9

INDUSTRY PROFILE
A news paper is regularly scheduled publication
containing news, information and adverting. By 2007,
there were 6580 daily newspapers in the world selling
395 million copies a day. The worldwide recession of
20008, combined with the rapid growth of web- based
alternatives caused a serious decline in advertising
and circulation, as; many papers closed or sharply
retrenched operation. General- interest newspapers
typically publish stories on local and national
political events and personalities, crime, business,
entertainment, society and sports. Most traditional
papers also feature and editorial page containing
editorials written by an editor and columns that
express the personnel opinion of writers. Other
features include display and classified adverting,
comics and inserts from local merchants.
The newspaper is typically funded by paid
subscriptions and adverting. A wide variety of
material has been published in newspaper ; include
editorial opinions, criticism, persuasion,
obituaries, entertainment features such as crosswords
Sudoku and horoscopes; weather news and forecasts;
advice, food and other columns; reviews of movies,
10

plays and restaurants; classified ads; display ads,
editorial cartoons and comic strips.
When newspapers and magazines are combined, print
is the world's largest advertising medium. An
increase in the newspaper sale has been witnessed in
almost all continents including Asia, Europe, Africa
and South America except North America, which
registered a decline in the sales. Global newspaper
sales rose 2.3% in 2006, India grew 13 %.
Advertising revenues in paid dailies had been found
up 3.77 per cent. China, Japan and India account for
60 of the world’s 100 best-selling dailies while the
five largest markets for newspapers are China, India,
Japan, the US and Germany.
Indian newspaper business In India, over 150 million individuals read
a newspaper each day. One factor that has resulted in
making the print media ever more popular is the fact
India is a country of many diverse languages and more
than a thousand different dialects. In a country of
1.1 billion, there is more room for the newspaper
industry to grow, as the rural areas are largely
untapped.
11

To propel the newspaper growth in India, 26
percent foreign direct investment was allowed in
print media in 2002. Due to a hike in FDI limits in
the newspaper- publishing sector a lot more action is
likely to be seen from the global players wanting to
invest in this sector.
Press Council of India Press council of India (PCI) is a statutory
autonomous body established in 1966 by the parliament
on the recommendations of the First Press Commission
for the purpose of preserving the freedom of the
press, and of maintaining and improving the standards
of newspapers and news agencies in India. The Council
is headed by a Chairman, who is nominated by a
committee consisting of Chairman of Council of states
(Rajya Sabha), the speaker of the House of the People
(Lok Sabha), and a person elected from amongst the
Members of the Press Council cannot be questioned in
any court of law.
National Press Day – 16 November- is symbolic of
a free and responsible press in India. The press
council of India started functioning on this day.
Indian Newspaper SocietyThe Indian and Eastern Newspaper Society, now
12

renamed as The Indian Newspaper Society, enjoys a
unique position as the accredited spokesperson of the
newspaper industry. From newsprint to advertising,
from licenses for machinery to freedom of the Press,
INS today is involved in many spheres of activities.
Registrar of Newspapers for IndiaThe Office of the Registrar of Newspapers for
India, more popularly known as RNI came into being on
1st July, 1956, on the recommendation of the First
Press Commission in 1953 and by amending the Press
and Registration of Books Act 1867. The Office of
the Registrar of Newspapers for India is
headquartered in New Delhi, and has three regional
offices at Calcutta, Mumbai and Chennai to cater to
the needs of publishers in all corners of the
country.
RNI compiles and maintains a Register of
Newspapers containing particulars about all the
newspapers published. It informs the District
Magistrates about availability of titles to intending
publishers for filing declaration and issues
Certificate of Registration to the newspaper. It
ensures that newspapers are published in accordance
with the provisions of the Press and Registration of
Books Act 1867.
13
National Readership Studies Council
It is constituted by Advertising Agencies
Association of India, Audit Bureau of Circulations &
Indian Newspaper Society. The National Readership
Study 2006 (NRS 2006) in India is the largest survey
of its kind in the world, with a sample size of
2,84,373 house-to-house interviews to measure the
media exposure and consumer product penetration in
both urban and rural India – and of course the
estimated readership of publications. The study
covers 535 publications of which 230 are dailies and
305 are magazines.
News paper business in Kerala
Kerala has a rate of newspaper readership that is
among the highest in the world. In Kerala, there are
approximately 1576 newspapers in circulation! Among these,
only a few newspapers are widely circulated with a good
number of readers.
List of Leading Malayalam Language Newspapers
Malayala Manorama First appeared on 14th March
1890, as a weekly, currently has a readership of over
14

15 million, with a circulation base of over 7.4
million copies. Manorama is Kerala's largest selling
and most widely read newspaper.
Mathrubhumi: The first copy of Mathrubhumi went
to press on 18th of March 1923. Mathrubhumi today
is the second most circulated newspaper in Kerala. It
is published from Calicut, Thiruvananthapuram,
Kottayam, Ernakulam, Thrissur, Kannur, Palakkad,
Malappuram and Kollam besides from Chennai,
Bangalore, Mumbai and New Delhi It has a circulation
of over 13 lakhs and its readership is around 75
lakhs.
Deshabhimani is a Malayalam newspaper run by
Communist Party of India (Marxist). Started as a
weekly in 1942 and converted to a daily in 1946.
Deshabhimani now has six different editions:
Kozhikode, Kochi, Thiruvananthapuram, Kannur,
Kottayam and Trichur.
Kerala Kaumudi is a popular Malayalam newspaper,
founded in 1911. Published from Thiruvananthapuram,
Kollam, Alappuzha, Kochi, Kozhikode, Kannur in Kerala
and Bangalore, Kerala Kaumudi is the fourth most
circulated Malayalam daily. The paper has online
15

editions in Malayalam and English that are updated
twice daily.
Deepika is one of the oldest newspapers published
in India. The first issue came out on 1887 April 15.
Deepika publishes editions from Kottayam, Kochi,
Kannur, Thrissur, Thiruvananthapuram and Kozhikode.
News Paper in the 20th Century
The 18th century saw the rise of the news paper
as the preferred media for communication of vast
amounts of information over a large geographical
area, the 18th century also witnessed a wide array of
inventions and progress in the field of
communication, such as the telephone, radio and
telegraph, though this helped in improving the
reporting and the overall effectiveness of the
newspaper, it also proved to be a better alternative
to the newspaper.
In the 1920’s, the radio gained
widespread acceptance due to its simplicity and
availability, a single FM radio station the
capability to cover an area of approximately 130km’s,
16

providing information live and to the minute, this
made it ideal for following sports events,
progressing news topics such as elections, live
weather and hazard updates. A radio receiver, even
though more expensive than a newspaper was only a one
time investment and radio broadcasts were free of
charge, this made the radio a stiff competitor to the
newspaper.
Further decline in the newspaper
readership came from the television; this was similar
to the radio in utility but offered video in addition
to the information. TV and radio both provided up to
the minute information on a wide variety of topics
which the newspaper could only present in the next
day, this made the public in general to opt towards
these media for news updates rather than the
newspaper hence causing a decline in readership,
demand and revenue.
By the beginning of 1990, the Internet was born
which was an even bigger threat as the people could
access information on demand on any topic or news
story. The Internet was considered a threat to the
radio and television due to its versatility,
accessibility and affordability and hence newspaper
readership declined even further.
The newspapers realized this rising trend and had
17
taken measures to counter the competition by
providing more specialized in depth analysis of
events and happenings from around the world. Along
with providing editorials and columns on important
topics with views that are generally different from
those of the other media, most newspaper publishers
now even have their own websites where there are live
updates and articles similar to what is printed.
Newspaper Industry- Global Perspective
According to the New York Times,
there are around 6700 daily newspapers in 215
countries around the world today that sell over 400
million copies daily. Out of these China, Japan and
India are the countries that have the largest
circulation of newspapers.
18

The following is a list of the 10 top selling
newspapers in the world today as published by the
World Association of Newspapers on the World Press
Trends, 2008.
No
Newspaper
Name
Circulat
ion
Country
Langua
ge1 Yomiuiri
Shim bun
14,067,0
00
Japan Japane
se2 Asahi
Shim bun
12,121,0
00
Japan Japane
se3 Mainichi 5,587,00 Japan Japane
19

Shim bun 0 se4 Nihon
Keizai
Shim bun
4,635,00
0
Japan Japane
se
5 Chunichi
Shim bun
4,512,00
0
Japan Japane
se6 Bild 3,548,00
0
Germany German
7 Reference
News
3,183,00
0
China Chines
e8 The Times
Of India
3,146,00
0
India Englis
h9 The Sun 2,986,00
0
United
Kingdom
Englis
h10 People’s
Daily
2,808,00
0
China Chines
e
Modern newspapers, in the quest of generating
maximum revenue in the face of stiff competition
from alternative media like television and radio, now
feature stories which are aimed at catering to the
needs of a much wider variety of readers than before,
covering focus groups, interests of readers based on
geographical areas and other more specific
classification of readers.
Based on these forms of classification, the
20

following categories of newspapers are available
across the world.
Daily
Weekly
National Newspaper
International Newspaper
Newspaper Industry- Indian Perspective
The Indian print industry came into
being in 1780 with the publication of the Bengal
Gazette, based in Calcutta, which was India’s first
printed newspaper created by James Augustus Hickey
who is also known as the “Father of the Indian
Press”. Later in 1789, the Bombay Herald was
introduced, followed by the Bombay Courier, which was
amalgamated with the Times of India in 1861.
As per the latest Newspaper Readership
Surveys, the Indian language papers have more readers
than the English press; this is due to the mother
tongue of the people. The people in general found it
easier to read their papers printed in their mother
tongue rather than English papers; along with this
local language papers have more editions that cater
to the particular geographical area. This makes it
more relevant and up to date in covering a wide
21

variety of news from different parts or the places of
origin. This makes people prefer it to English
Language papers, hence increasing readership.
The growth of the press in India is not limited
and the expansion of Newspapers within the country
are measured in two different ways, because of
circulation and based on readership.
The following are the top 10 newspapers in India
based on circulation.
Ran
k
Newspaper Language Circulat
ion1 Dainik Jagran Hindi 159,50,0
002 Dainik
Bhaskar
Hindi 134,88,0
003 Hindusthan
Dainik
Hindi 108,39,0
004 Malayala
Manorama
Malayala
m
99,27,00
05 Amar Ujala Hindi 85,83,00
06 Lokmat Hindi 78,09,00
0
22

7 The Times Of
India
English 72,54,00
08 Dina Thanthi Tamil 72,45,00
09 Rajasthan
Patrika
Hindi 72,17,00
010 Enadu Telegu 71,05,00
0
COMPANY PROFILE
Deshabhimani is one of the leading Malayalam
dailies in Kerala. It is the mouthpiece of the Kerala
State Committee of the Communist Party of India
23

(Marxist) it is run and published by the CPM of
Kerala, the paper acts as a media through which the
roots of the party can be firmly strengthened. It is
enjoying a common table circulation compared to other
Malayalam dailies in the scenario. As the literacy
level in Kerala is high, there is good circulation
for all the leading dailies and Deshabhimani has a
good positions and status in Kerala.
Deshabhimani has editions at Kozhikode,
Kochi, Kannur, Thiruvanathapuram, Kottayam, Thrissur,
Malapuram, Abudhabi and it started its multi colour
edition at Kochi in 1993 and Thiruvanathapuram,
Kottayam and in 1994. Its internet edition started on
1 January of 1998 is another feather on the cap of
Deshabhimani. Deshabhimani is one among the three
most circulated dailies in Kerala. The children's
Magazine "Thathamma" a sister Publication is widely
accepted. The first spot magazine in
Malayalam"Kalikkalam" brought out by Deshabhimani.
HISTORY OF THE COMPANY Deshabhimani was started as `Prabhatam'
(The dawn) on 9 January 1935 at Shornur near Trichur
under the editorship of EMS Namboodirippad is
considered to be the harbinger of newspaper. When the
party started functioning openly in 1942, it took
24

initiative to have its own mouthpiece and that was
how Deshabhimani was born at Kozhikode. It started as
a weekly on September 6, 1942. The fund collected by
AKG sustained it initially. EMS disposed of his
ancestral property and donated the entire amount (Rs
50,000/- a big sum in those days) to the paper.
Deshabhimani editorial "The Call of Gallows"
in connection with the Kayyar martyrs infuriated the
British imperialists. The government took revenge and
ordered-the paper to security of Rs. 1000.But they
raised this amount within days. Four years later,
despite all onslaughts, Deshabhimani changed to four-
stage morning daily on January 18, 1946.The
proletarian perspective and progressive view of these
papers were so irritating to the erstwhile princely
rulers that the papers were banned once by the Cochin
Government and twice by the Divan of Travancore
during 1942-1946. But, by then, Deshabhimani had
become an instrument of fight for the struggling
people. It took up issues and lent its voice to many
struggles. The agitation of toddy tappers of
Anthikkad (Thrissur) and the strikes of Cochin
harbor, Sitharam Mill (Trichur) and Aaron Mill
(Kannur) were some of the outstanding struggles among
them. Not only had the mass agitations in different
parts of the state, but the struggles in other states
25

also reverberated in Deshabhimani pages.
To improve the quality and meet the growing
demand, the need to replace the double dummy cylinder
press by a speedier modern rotary press was felt in
1947. Again, when the workers approached the people
for fund, the response was fantastic. The experience
of Chombala village near Kozhikode at that time is
etched in people's memory forever. Here, palora
Matha, an illiterate, impoverished rural women who
had nothing else to part with, donated her only calf
to the party, telling the comrades to sell the calf
and utilize the money for Deshabhimani What a
gesture! Is anything more needed to prove the common
people's love for the paper?
SUBSEQUENT EDITIONS The span of time between the second and
subsequent editions was not as long as it was between
Kozhikode and Kochi editions. The growth was rapid,
reflecting the party's increasing popularity in the
state. The third edition of Deshabhimani was started
from Thiruvananthapuram on January 4, 1989. For it,
the party has decided to collect Rs. 25 lakhs but the
response was much greater. In just one day of bucket
collection, people generously donated Rs. 45 lakhs.
The next edition has started at Kannur on
26

January 30, 1994, a stronghold of the communist
movement. One day collection throughout the state for
this edition was Rs. 42 lakhs. Apart from this, Rs.
One crore were collected from Kannur and Kasargode
districts only, by way of 12 years subscriptions. In
1997, the fifth edition started from Kottayam. For it
two days of bucket, collection brought Rs. 75 Lakhs.
Besides Rs. 1.4, crore were collected through annual
subscription from the districts within the limits of
this edition alone.
Within a month, about Rs.1.05 crore were
collected for the sixth edition from Thrissur
district alone. People from all occupations
contributed to the fund. All most all workers,
peasants etc, contributed. The edition came out on
August 31, 2000. The paper started its multi color
edition at Kochi in 1993, and Thiruvanathapuram and
Kozhikode in 1994. Kannur and Kottayam editions
started with the color printing installations right
from the beginning. The internet edition started on
January 1, 1998 another feature in the pape’s cap.
All the printing and publishing companies that bring
out these editions are named after party stalwarts
like P Krishna Pillai, AKG, C H and E M S.
OBJECTIVES AND VISION
27

Its main objectives have always been acting
as the eloquent mouthpiece of the progressive forces
with clear political vision on national and
international issues.
Their vision is to make Deshabhimani the largest
circulated daily.
OTHER PUBLICATIONS (PRODUCT LINE) Deshabhimani Weekly
Sthree Shabdham(Women's Magazine)
Thathamma (Children's magazine)
Deshabhimani Diary(Annual diary from
Deshabhimani)
Deshabhimani Calendar
FUTURE PROSPECTS & GROWTH The main future scope of the Deshabhimani
is extension of circulation. By the extension of the
circulation, they will get more reputation. In
addition, their plan will be starting a new edition
from Malapuram and eighth edition starts from
Abudhabi.
28

DEPARTMENTAL PROFILE
There are eight departments in the company apart from
the editorial department. They are:
29

1. Production department
2. Purchase department
3. Personnel department
4. Administration department
5. HR department
6. Marketing department
7. Circulation department
8. Advertising department
30

PRODUCT PROFILE
SUPPLEMENTS Deshabhimani Varanthappathippu
Aksharamuttam
Sthree
Kilivathil
PUBLICATIONS
Deshabhimani Varika (weekly)
Thathamma (children publication)
ThathammaThathamma is a fortnightly comic
magazine in Malayalam. It is published
by Balasangam state committee Kerala. The magazine,
which features stories, cartoons, and comics,
emphasizes moral values and aims at enhancing
knowledge through humor and hobbies.
Deshabhimani Daily Deshabhimani is a prestigious
daily newspaper in Kerala, and the organ of the
Kerala State Committee of the Communist Party of
India (Marxist). It is one of the most prominent
newspapers in Kerala. It is run and published by CPM
31

of Kerala, the paper helping to strengthen the roots
of Party in Kerala, indisputably. It is published in
six different editions, in Kochi, Thiruvananthapuram,
Kottayam, Trichur, Kannur and Kozhikode. It is an
undeniable fact that the newspaper holds a special
position in the households of Kerala. The publishing
history started in early 1942s, where it was
converted into a daily in 1946. At present, V. V.
Dakshinamoorthi, secretariat member of the CPI (M),
is the Chief Editor of the paper and P. Jayarajan the
G M.
REVIEW OF LITERATURE
EMPLOYEE WELFARE
Employee welfare facilities enable workers
to live a richer and more satisfactory life. After
employees have been hired, trained and remunerated,
they need to be retained and maintained to serve the
organization better. Welfare facilities are designed
to take care of the well- being of the employees
they do not generally result in any monetary benefit
to the employees. Nor are these facilities provided
by employers alone. Governmental and non-governmental
32

agencies and trade unions too, contribute towards
employee welfare.
Labour plays a very important role in the
industrial production of the country. The human
resource managers are concerned with the management
of people at work. It is necessary to secure the co-
operation of labour force in order to increase the
production and to earn higher profits. The co-
operation of labour force is possible only when they
are fully satisfied with their employer and the
working conditions on the job. In the past,
industrialists and the employers believed that their
only duty towards their employees was to pay them
satisfactory wages and salaries. In course of time,
with the introduction the concept of HRM,
psychological researches convinced them that the
workers required something more important. In
addition to providing monetary benefits, human
treatment given to employees plays a very important
role in seeking their co-operation. Labour or
employee welfare activities benefit not only the
workers but also the management in the form of
greater industrial efficiency. The HR managers
realize that the welfare activities pay a good
dividend in the long run, because they contribute a
lot towards the health and efficiency of the workers
33

and towards a high morale. It should be noted that
expenditure on labour welfare is a profitable
investment in the end as it motivates the workers for
higher productivity.
MEANING OF EMPLOYEE WELFARE
The term is derived from the French word
"welfare". The meaning of this French word is "well
being or happiness or prosperity of individuals".
Welfare means faring or doing well. It is a
comprehensive term and refers the physical, mental,
moral and emotional well being of individual.
According to the ILO report,
"Workers Welfare should be understood as
including such services, amenities and facilities
which may be established in or in the immediate
vicinity of undertakings to enable the persons
employed in them to perform their work in healthy and
peaceful surroundings and to avail of facilities
which improve their health and bring high morale"
OBJECTIVES OF EMPLOYEE WELFARE ACTIVITIES
Following are the objectives of the voluntary
employee welfare services by employer-
34

To win over employees loyalty and increase
their morale.
To develop efficiency and productivity among
workers.
To reduce the threat of future government
intervention.
To make recruitment more effective.
To earn goodwill and enhance public image.
To build up stable Employee force to reduce
Employee turnover and absenteeism.
FEATURES OF EMPLOYEE WELFARE Employee welfare is a comprehensive term
including various services, facilities and
amenities provided to workers for improving their
health, efficiency, economic betterment and
social status.
Welfare measures are in addition to regular wages
and other economic benefits available to workers
under legal provision and collective bargaining.
Employee welfare is dynamic in nature varying
from country to country, region to region and
organization to organization.
Employee welfare is a flexible and ever changing
concept as new welfare measures are added from
time to time to the existing measures.
35

Welfare measures may be introduced by the
employers, government, employees or by any social
or charitable agency.
The basic purpose of employee welfare is to
improve the lot of working class, bring about the
development of the whole personality of the
worker to make him a good worker and a good
citizen.
SIGNIFICANCE OF EMPLOYEE WELFARE
The basic objective of employee welfare is
to enable workers to live a richer and more
satisfactory life. Employee welfare is in the
interest of the labour, the employer and the society
as a whole. The main benefits of employee welfare
service are given below.
1.Benefits to the workers
Welfare facilities provide better physical and
mental health to the workers and make them
happy.
Welfare facilities like housing, medical
benefits, education and recreation facilities
for the workers families help to create
36
contended workers.
Improvement in material intellectual and
cultural condition of life protects workers
from social evils like drinking, gambling etc.
welfare facilities tend to make the worker
happy, cheerful and confident looking.
2.Benefits to organization
Employer welfare facilities help to increase
employee productivity or efficiency by improving
their physical and mental health.
Welfare facilities, besides removing
dissatisfaction help to develop loyalty in
workers towards the organization.
Welfare facilities help to motivate and retain
employees.
Welfare measures help to improve the goodwill and
public image of the enterprise
Welfare services serve to maintain some peace
with improve industrial relations and industrial
peace
Employee’s turnover is reduced due to the
provision of Welfare facilities. Employees take
active interest in their jobs and work with a
feeling of involvement and satisfaction.
37

3. Benefits to the Society Labour welfare is also in the interest of
the larger society because the health, efficiency and
happiness of each individual represent the general
well being of all. Well housed, well fed and well
looked after labour is only an asset to the employer
but serves to raise the standards of industry and
labour in the country.
Agencies of Labour welfare in India Labour welfare activities in India are
urgently needed because India is an industrially
backward country and the working conditions are not
satisfactory in Indian industries. The workers are
poor, illiterate, and generally blamed for being
irresponsible and lazy. Labour welfare activities are
necessary for improving their working conditions and
their economic standards. The employers have
recognized the importance of labour welfare
activities in India very recently, by the government
and by other agencies.
The main agencies engaged in labour welfare in India
include:
1. Central Govt.
38

2. State Government
3. Employers
4. Worker's organizations
5. Other agencies.
Types of Welfare activities The meaning of employee welfare may be made
clearer by listing the activities and facilities that
are referred to as welfare measures. Welfare measures
can be divided in to two broad groups; namely:
Welfare measures inside the work place.
Welfare measures outside the work place
I. Welfare measures inside the work
place
1)Condition of the work environment Neighborhood safety and cleanliness; attention
to approaches.
Housekeeping; keeping of premises- Compound
wall, lawns, gardens and so forth; white -
washing of wall and floor maintenance.
Workshop (room) sanitation and cleanliness;
temperature, humidity, ventilation, lighting,
elimination of dust, smoke, fumes, gases.
Control of effluents.
39

Workmen's safety measures i.e. maintenance of
machines and tools, providing helmets, aprons,
goggles and first - aid equipment.
Notice boards; posters, pictures, slogans;
information or communication.
2)Conveniences Wash basins, bathrooms, waste disposal.
Provision for drinking water.
Canteen services; full meal, mobile canteen.
Management of worker's cloak rooms, rest
rooms, reading room and library.
3)Workers health services Factory health centre: dispensary, ambulance,
emergency aid
Medical examination for workers; health
education, health research; family planning
services.
4)Women and child Welfare Antenatal and postnatal care, maternity aid,
crèche and childcare; women's general
education.
Separate service for women workers i.e. lunch
rooms, urinals, rest rooms.
Women’s recreation (indoor); family planning
40

services.
5)Worker's recreation Indoor games,
Strenuous games to be avoided during intervals
of work.
6)Employment follow-up Progress of the operative in his/ her work.
His/ her adjustment problems with regard to
machines and workload.
Supervisors and colleagues.
Industrial counselling.
7)Economic Service Co-operatives, loans, financial grants
Thrift and saving schemes
Budget knowledge
Health insurance
Profit-sharing and bonus schemes
Transport services,
Provident fund
Gratuity and pensions
Rewards and incentives
Workmen's compensation for injury
Family assistance in times of need.
41

8)Labour- Management Participation Formation and working of various committees i.e.
works committee, safety committee, canteen
committee etc.
Workers’ arbitration council.
Research bureau.
9)Workers' Education Reading room
Library
Visual education
Literary classes,
Adult education and social education
Daily news review
Factory news bulletin
Co-operation with workers in education
services.
II. Welfare measures outside the
workplace Housing: bachelor’s quarters, family
residences according to types and rooms.
Water sanitation, waste disposal
42

Roads, lighting, parks, recreation, play
grounds.
School, nursery, primary, secondary and high
school.
Markets, co-operatives, consumer and credit
societies.
Bank
Transport
Communication: post, telegraph and telephone
Security.
Employee Welfare Benefits and Principles
Employee welfare defines as “efforts to make life
worth living for workmen”. “Employee welfare is a
comprehensive term including various services,
benefits and facilities offered to employees and by
the employers. Through such generous fringe benefits
the employer makes life worth living for employees”.
Welfare includes anything that is done for the
comfort and improvement of employees and is provided
over and above the wages. Welfare helps in keeping
the morale and motivation of the employees high so as
to retain the employees for longer duration. The
welfare measures need not be in monetary terms only
but in any kind/forms. Employee welfare included
43
monitoring of working conditions, creation of
industrial harmony through infrastructure for health,
industrial relations and insurance against disease,
accident and unemployment for the workers and their
families.
Employee welfare entails all those activities of
employer which are directed towards providing the
employees with certain facilities and services in
addition to wages or salaries.
WELFARE SCHEMES Organizations provide welfare facilities to
their employees to keep their motivation levels high.
The employee welfare schemes can be classified into
two categories.
1) Statutory welfare schemes
2) Non-statutory welfare schemes
Statutory and Non- Statutory Welfare In India, welfare is of the statutory and
the none — statutory kinds. Though statutory welfare
ensures a bare minimum of facilities and reasonably
good working conditions, employers are free to
provide, or not to provide, non- statutory welfare.
However, practically all organizations in India
provide non- statutory measures in varying degrees.
44
Statutory Welfare After Independence, the Govt. of India
passed several acts. The statutory schemes are those
schemes that are compulsory to provide by an
organization as compliance to the laws governing
employee health and safety.
e.g.:- the Factories Act, the Employees' State
Insurance Act, the Minimum Wages Act, the payment of
Wages Act, and the Industrial Dispute Act, to ensure
a fair deal to employees in various aspects of their
jobs
NON-STATUTORY WELFARE SCHEMES
The non-statutory schemes differ from
organization to organization and from industry to
industry. Many non-statutory welfare schemes may
include the following schemes:
EMPLOYEE SATISFACTION
The needs and priorities of creative employees
seem to differ dramatically from those of workers in
older, less innovative industries. With the right
environmental factors, for example, an employee
producing widgets of some kind can be productive and
happy for years while doing a repetitive daily task.
However, a cell biologist who has to run the same
45

assay for more than a week will be screaming for
relief. Satisfied employees tend to be more
productive, creative and committed to their
employers.
DefinitionAcademicians and the executives commonly use the
term job satisfaction. In the words of Feldman and
Arnold “Job satisfaction is the amount of overall
positive effect or feelings that individuals have
towards their jobs.”
Job satisfaction is the amount of pleasure or
contentment associated with a job. If we like our job
intensely, we will experience high job satisfaction.
Kinds of Job SatisfactionThere are different kinds of job satisfaction.
Overall job satisfaction is actually a combination of
intrinsic and extrinsic job satisfaction:
Intrinsic job satisfaction is when employees
consider only the kind of job they do, the
tasks that make up the job.
Extrinsic job satisfaction is when employees
consider the conditions of job, such as their
pay, co-workers etc.
These two types of satisfaction are different,
46

and it helps to look at jobs from both points of
view. For example, if an employee is dissatisfied
with the current job, two questions can be asked to
him:-“to what extend is due to the kind of work he is
doing?” and “To what extend is it due to the
conditions of his work?” If it is primarily the kind
of work he is doing, it is intrinsic job
dissatisfaction
DimensionsThe level of job satisfaction is effected by a
wide range of variables relating to individuals,
social, cultural, organizational and environmental
factors relating as stated below:-
Individual factorsPersonality, education, intelligence, age,
abilities, marital status, orientation to work etc
are some of the individual factors to job
satisfaction.
Social factorsSome of social factors are relationships with co-
workers, group working and norms, opportunities for
interaction, informal relations etc.
47

Cultural factorsCultural factors are those factors, which are
related to attitudes, beliefs and values.
Organizational factorsNature and size, formal structure, personnel
policies and procedures, industrial relations, nature
of work, technology and work organizations,
supervision, leadership, management systems, working
conditions etc.
Environmental factorsEconomic, social, technical and government
influences are some of the environmental factors to
job satisfaction.
Determination of job satisfaction The following are the determinants of job
satisfaction
Nature of the jobJob satisfaction is related to the aptitude of
the employee. If the employee is given a work for
which he has no aptitude, the job will provide no
attraction to him.
48

Nature of supervisionThe employee-centered supervisory style enhances
job satisfaction as the leader looks after sub-
ordinates carefully, displays friendship, respect etc
towards them.
Working conditionsThe work will be more attractive if working
conditions are congenial to the task a worker
proposes to accomplish. Good working conditions
involve adequate light, comfortable temperature,
attractive salary etc.
Rewards Economic rewards play a significant role in
influencing job satisfaction for two reasons. First,
money is an important instrument to fulfill one’s
needs; and secondly, employees often see pay as a
reflection of management’s concern for them.
Opportunities for promotionThe desire for promotion is generally strong
among higher-level employees as it involves change in
job content, pay, responsibility, autonomy, status
and the like.
Employee morale
49

The workers will be loyal to the organization if
their morale is higher. The rates of absenteeism and
labour turnover will also be low because of
psychological satisfaction from the job.
RESEARCH METHODOLOGY
Definition of Research Methodology In the words of renowned researcher Clifford
Woody, ”research involves defining and redefining
problems; formulating suggested solutions or
hypothesis; collecting, evaluating and organizing
50

data, reaching conclusions and making deductions and
carefully testing the conclusions to find out if they
fit the formulating hypothesis or not” Redman and
Mory defined research as “a systematized effort to
gain knowledge”
Universe In any statistical investigation we are
interested in studying various characteristics of
individuals (or items) of a particular group. This
group of individuals under study is known as
population or Universe. The universe of this study
comprises of all the employees working in
Deshabhimani.
Meaning of Research Design The term design means drawing an outline,
planning, or arranging details. It is a process of
making decision before the situation arises in which
the decision has to be carried out.
Research design is planning a strategy
conducting research. It plans as to what is to be
observed, how it is to be observed, how to record
observation, how to analyze or interpret observations
and how to generalize. Research design is, thus a
detailed plan of how the goals of research will be
51

achieved.
Types of Research Design1) Descriptive Research
2) Explanatory Research
3) Exploratory Research
In this particular project, the researcher has
used descriptive research design.
Descriptive Research Design The major goal of a descriptive research is
to describe events, phenomena and situation. Since
description is made based on scientific observation.
It is expected to be more accurate and precise than
casual.
Sample Design A sample deign is apportion of people drawn
from a larger population. It will be representative
of the population only if it has same basic
characteristics of the population.
Sampling The method of selecting a sample from the
population is known as sampling.
Types of Sampling
52
There are two types of sampling.
A. Probability Sampling
Probability sampling is one in which every
unit of the population has equal probability of
being selected for the sample. It offers high
degree of representatives. However, this method is
expensive, time – consuming and relatively
complicated since it requires a large sample size
and the units selected are usually widely
scattered.
B. Non- Probability Sampling
Non- probability sampling makes no claim
for representatives, as no unit gets the chance of
being selected. The researcher decides which sample
units should be chosen.
DATA COLLECTION METHOD Data collection method is divided into two.
That is primary data and secondary data.
Primary data
Primary data is the information collected
during the course of an experiment in experimental
53

research. It can also be obtained through observation
or through direct communication with the person
associated with the selected subject by conducting
survey and interviews.
Secondary Data
Secondary data is the data, which has
already been collected and examined earlier by other
investigators. While making use of secondary data the
investigators has to first determine the source from
where the secondary data can be obtained. In this
method, the researcher is not at all aware of the
problems related to how the data was originally
collected. In this study the secondary data sources
comprises of company manuals, reports, magazines etc.
Sampling Period Sampling period is the duration taken for
conducting a particular research. In this particular
project, the researcher has taken 60 days to complete
the project.
Sampling Extent Defining the population of interest for
business research is the first step in sampling
process. In general, target population is defined in
54

terms of elements, sampling unit, extent and period.
The definition should be in line with the objectives
of the research study.
This project was conducted at Deshabhimani,
Cochin.
Sampling Frame The sample is drawn of the complete list.
In this study, the sampling frame comprises of
employee register of Deshabhimani.
Sampling Size The sample size plays a crucial role in the
sampling process. It is the number of respondents
taken in to consideration for the research process.
In this process, the researcher has taken 100
respondents as the sample size.
55

STATISTICAL TOOLS
A. Chi- square
A chi- square test or χ2 test, is
any statistical hypothesis test in which the sampling
distribution of the test statistics a chi- squared
distribution when the null hypothesis is true,
meaning that the sampling distribution (if null
hypothesis is true) can be made to approximate a chi-
squared distribution as closely as desired by making
the sample size large enough.
56
The formula for chi- square is-
χ² = ∑ (Oij -Eij) ²
Eij
B. Correlation
The word correlation refers to the
mutual relationship or co variation or association
between two (or more) variables. Either correlation
can be positive or it can be negative. The linear
relationship or association between two series. X and
Y are measured by calculating a coefficient, which is
called the coefficient of correlation, usually by the
symbol ∂.
r = n∑xy−(∑x−∑y)
√n∑x2(∑x)2−√n∑y2− ( y)∑ 2
C. Regression
Regression relationship is an average
relationship between a dependent and independent
variable. The regression coefficient indicates change
in the dependent variable for a unit change in the
independent variable.
Regression equation of x on y is x−¿ x=¿bxy¿ )
57

Where bxy = nΣxy−(Σx×Σy)
nΣy²−(Σy )²
Regression equation of y on x is y−y ¿ bxy¿ )
Where bxy = nΣxy−(Σx×Σy)
nΣx²−(Σx )²
ANALYSIS OF FINDINGS
The primary data of the study are based on
the responses of group of non-managerial employees.
The opinion of this respondent was gathered using
structured questionnaire, the findings are based on
the responses received from fifty respondents. All
the responses collected were tabulated and analyzed.
Statistical tools used for analysis are simple
percentage analysis method, weighted average method
and Chi-square test.
.
58

Table no: 1
Age group of the employees
Ages Number of
respondent
s
Percentag
e of
responden
ts25- 35 20 20
36- 45 32 32
46- 55 28 28
56-65 20 20
Total 100 100
Source: primary data
Chart No: 1
Age group of the respondents
59

25-35 35-45 45-55 55-650
5
10
15
20
25
30
35
NO OF RESPONDENTSPERCENTAGE OF RESPONDENTS
InterpretationThe table and chart shows that majority of the
respondents belongs to the group of 36-45 .i.e.
around 32%. Next category is 46-55 which
constitutes around 28%. Below 35 years of age,
there are only 20 employees. These constitute good
number of aged workers in the organization.
Table no: 2
Qualification of employees
60

Source: primary data
Chart No: 2
Qualification of respondents
SSLCPRE-DEGREEGRADUATIONPOST-GRADUATION
Interpretation
The table shows that out of 100 employees who
61
Qualificat
ion
Number of
respondent
s
Percentage
of
respondent
sSSLC 20 20
Pre-
Degree
10 10
Graduation 46 46
Post-
Graduation
24 24
Total 100 100

participated in the survey 24% of them were
postgraduates, 46% of them were graduates and 10%
have
pre-
degree.
20 % of
them
were
SSLC.
Table
no: 3
Income of respondents
62
Income Number of
responden
ts
Percentage
of
respondent
s10000-
15000
40 40
15000-
20000
0 0
20000-
25000
42 42
25000-
30000
9 9
Total 100 100

Source: primary data
Chart No: 3
Income of respondents
10000-1500015000-2000020000-2500025000-30000
Interpretation
From the above chart and table, it is derived that
40% of the respondents get the wages between 10000
and 15000. 42% of the respondents get the wages
between 20000 and 25000 and 9% of them were get the
wages between 25000 and 30000.
Table no: 4
Experience of the employees
63
Experien
ce
Number
of
responde
nts
Percentag
e of
responden
ts1- 10 32 3211- 20 12 12
21- 30 42 4231- 40 14 14
Total 100 100

Source: primary data
Chart No: 4
Experience of the employees
1 to 10 11 to 20 21 to 30 31 to 400
5
10
15
20
25
30
35
40
45
NUMBER OF RESPONDENTS PERCENTAGE OF RESPONDENTS
Interpretation
The above table and the chart shows that out of 100
employees who participated in the survey 14% of the
employees have an experience of more than 30 years.
In addition, 42% of employees have more than 20 years
of experience .12% of employees have experience
between 11- 20 years. Moreover, 32% of employees have
only below 10 years of service.
Table No: 5
Working environment of the organization
64
Sou
rc e:
primary data
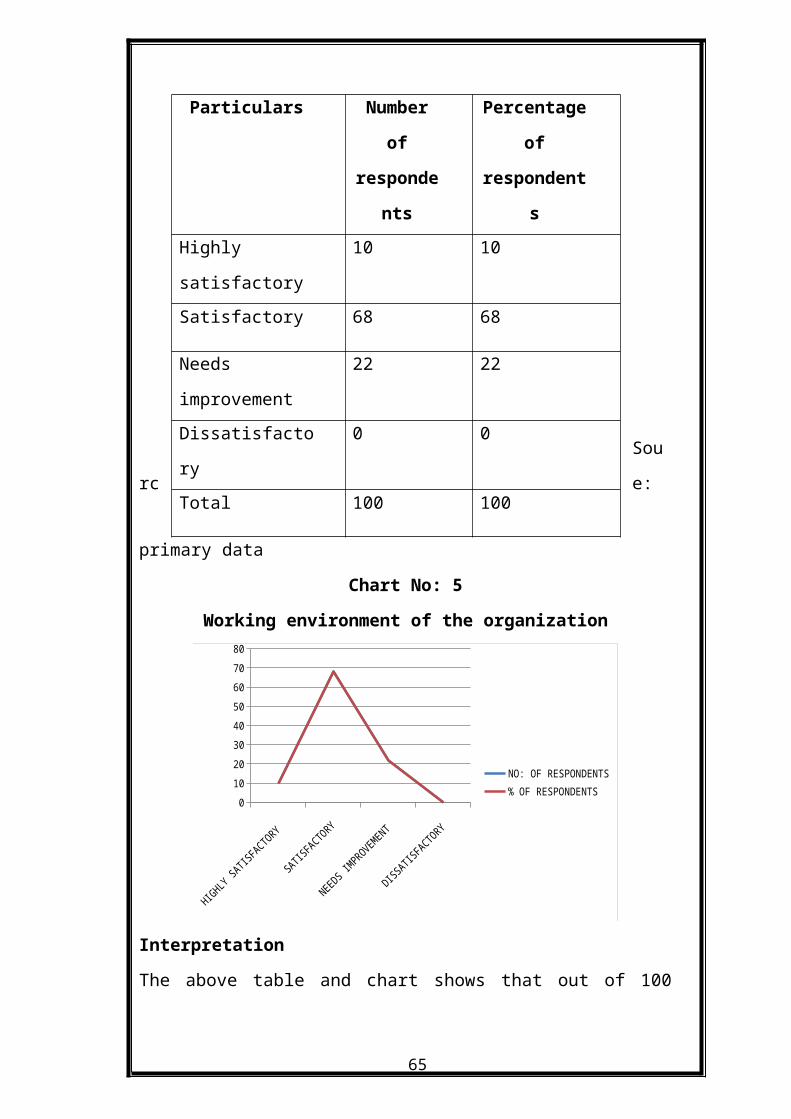
Chart No: 5
Working environment of the organization
HIGHLY
SATIS
FACTOR
Y
SATISF
ACTORY
NEEDS
IMPROV
EMENT
DISSAT
ISFACT
ORY
01020304050607080
NO: OF RESPONDENTS% OF RESPONDENTS
Interpretation
The above table and chart shows that out of 100
65
Particulars Number
of
responde
nts
Percentage
of
respondent
sHighly
satisfactory
10 10
Satisfactory 68 68
Needs
improvement
22 22
Dissatisfacto
ry
0 0
Total 100 100

employees who participated in the survey 10% of
employees are highly satisfied with the working
environment. 68% are just satisfied, 22% of the
employees needs improvement.
Table No: 6
Medical benefits provided by the organization
Source: primary data
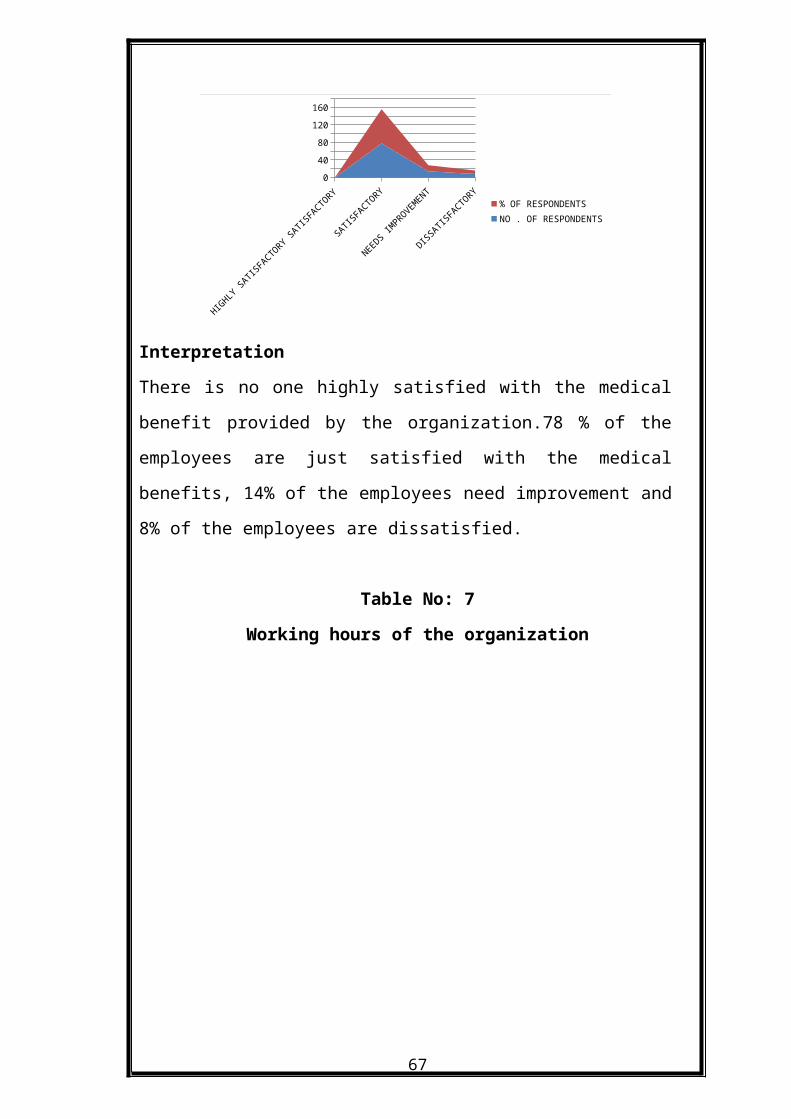
Chart No: 6
Medical benefits provided by the organization
66
Particulars Number of
respondents
Percentag
e of
responden
tsHighly
satisfactor
y
0 0
satisfactor
y
78 78
Needs
improvement
14 14
dissatisfac
tory
8 8
Total 100 100
HIGHLY SATISFACTORY SATISFACTORY
SATISFACTORY
NEEDS IMPROVEMENT
DISSATISFACTORY
04080
120160
% OF RESPONDENTSNO . OF RESPONDENTS
Interpretation
There is no one highly satisfied with the medical
benefit provided by the organization.78 % of the
employees are just satisfied with the medical
benefits, 14% of the employees need improvement and
8% of the employees are dissatisfied.
Table No: 7
Working hours of the organization
67

Source: primary data
Chart No: 7
Working hours of the organization
Highly
Satis
factor
y
Satisf
actory
Need I
mprove
ment
Dissat
isfact
ory020406080
100120140160
% of respondentsNo of respondents
68
Particulars Number
of
responde
nts
Percentage
of
respondent
sHighly
satisfactory
22 22
Satisfactory 70 70
Needs
improvement
8 8
Dissatisfact
ory
0 0
Total 100 100

Interpretation
The
table shows that 22% of the employees are highly
satisfied with the working hours. 70% of the
employees are just satisfied, 8 % needs improvement
Table No: 8
General ambiance of the organization
69
Particulars Number
of
responde
nts
Percentage
of
respondent
sHighly
satisfactory
36 36
Satisfactory 48 48
Needs
improvement
16 16
Dissatisfact
ory
0 0
Total 100 100

Source: primary data
Chart No: 8
General ambiance of the organization
highly satisfactorysatisfactoryneed improvementdissatified
Interpretation
The table shows that majority of the employees are
satisfied with the general ambiance provided by the
company.36 percentage of the employees are highly
satisfied. 48% of the employees are satisfied and 16%
of the employees need improvement.
Table No: 9
Conveyance allowance offered by the organization
70

Source: primary data
Chart No: 9
Conveyance allowance offered by the organization
Highly SatisfactorySatisfactoryNeeds ImprovementDissatisfactory
71
Particulars Number
of
responde
nts
Percentage
of
respondents
Highly
satisfactory
10 10
Satisfactory 70 70
Needs
improvement
12 12
Dissatisfacto
ry
8 8
Total 100 100

Interpretation
Table shows
that 10 %
of the
employees are highly satisfied with the conveyance
allowance provided by the organization. 70% are just
satisfied, 12% of the employees need improvement and
only 8% of them are dissatisfied.
Table No: 10
Regular increments
72
Particulars Number of
respondents
Percentage
of
respondentsYes 100 100
No _ _
Total 100 100

Source: primary data
Chart No: 10
Regular increments
Yes No020406080
100120140160180200
% of respondentsNo.of respondents
Interpretation
Table shows that 100% of the employees are agreed
with the regular increments.
Table No: 11
Leave policy of the organization
73

Source: primary data Chart No: 11
Leave policy of the organization
74
Particular
s
Number
of
responde
nts
Percentage of
respondents
Highly
satisfacto
ry
14 14
Satisfacto
ry
64 64
Needs
improvemen
t
18 18
Dissatisfa
ctory
4 4
Total 100 100

Highly Stisfactory
Satisfactory
Needs Improvement
Dissatisfactory
010203040506070
No.of respondents% of respondents
Interpretation
From the table 14% of the employees are highly
satisfied with the leave policy provided by the
organization. 64% of the employees are satisfied with
the leave policy, 18% of employees need improvement
and 4% are dissatisfied.
Table No: 12
Relation between trade union and the employees
75

Source
:
primary data
Chart No: 12
Relation between trade union and the employees
Highly
Satis
factor
y
Satisf
actory
Needs
Improv
ement
Dissat
isfact
ory
020406080
100120140
% of respondentsNo.of respondents
76
Particulars Number
of
responde
nts
Percentage
of
respondent
sHighly
satisfactory
14 14
Satisfactory 66 66
Needs
improvement
10 10
Dissatisfacto
ry
10 10
Total 100 100
Interpretation
From
the
table
14%
of
the
employees are highly satisfied with the relationship
of trade union with the employees. 66% are just
satisfied and 20% of employees need improvement and
10 % dissatisfied.
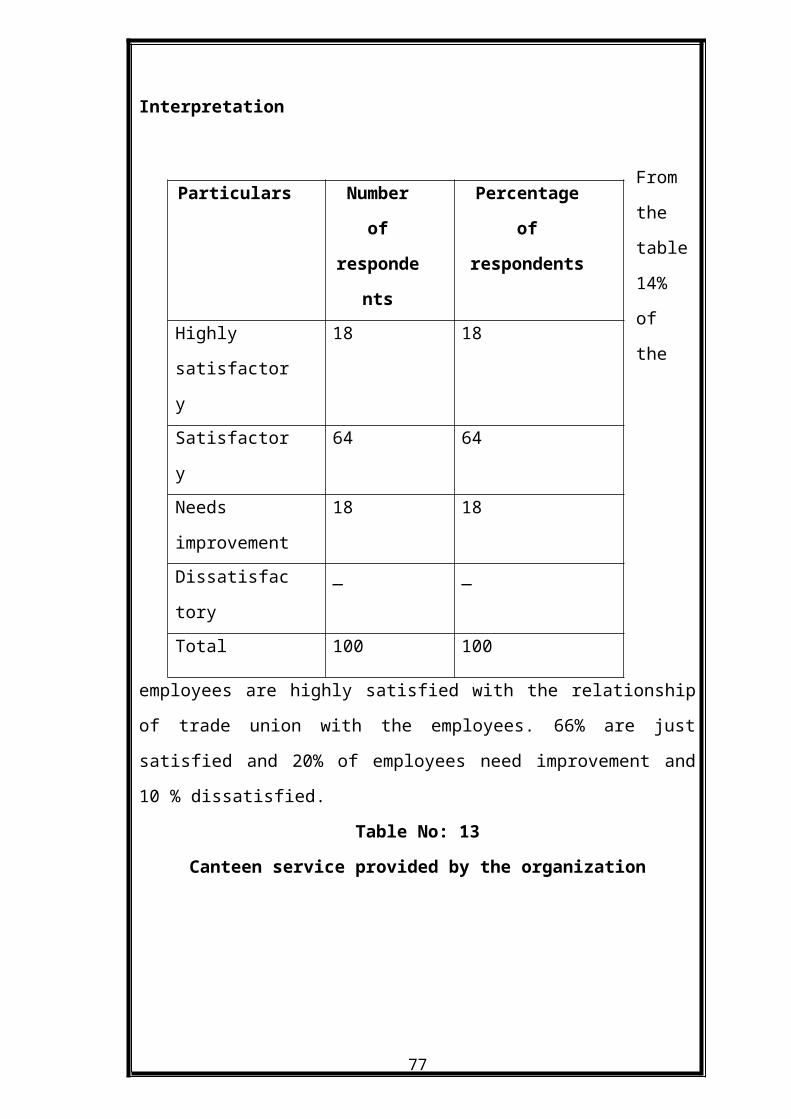
Table No: 13
Canteen service provided by the organization
77
Particulars Number
of
responde
nts
Percentage
of
respondents
Highly
satisfactor
y
18 18
Satisfactor
y
64 64
Needs
improvement
18 18
Dissatisfac
tory
_ _
Total 100 100

Source: primary data
Chart No: 13
Canteen service provided by the organization
Highly SatisfactorySatisfactoryNeeds improvementDissatisfactory
Interpretation
Table shows that majority of the employees are
satisfied with the canteen service provided by the
company. 18% of employees are highly satisfied and
only 18% of employees need improvement.
Table No: 14
78

Organization take care of the employees working in
night shift
Source: primary data
Chart No: 14
Organization take care of the employees working in
night shift
No. of respondents % of respondents0
102030405060708090
100
YesNo
Interpretation
79
Particulars Number of
respondents
Percentage of
respondentsYes 100 100
No _ _
Total 100 100

From the table 100% of the employees are agreeing
with the statement.
Table
No: 15
Job
security
80
Particulars Number
of
responde
nts
Percentage
of
respondent
sHighly
satisfactory
18 18
Satisfactory 60 60
Needs
improvement
10 10
Dissatisfact
ory
12 12
Total 100 100

Source: primary data
Chart No: 15
Job security
Highy
Satisf
actory
Satisf
actory
Needs
improv
ement
Dissat
isfact
ory
0
10
20
30
40
50
60
70
No.of Respondents% of respondents
Interpretation
From the table majority of the employees are
satisfied with the job security. 18% of the employees
are highly satisfied.10percentage of the employees
need improvement and 12% of the employees are
dissatisfied
Table No: 16
Safety measures taken by the company
81

Source: primary data
Chart No: 16
Safety measures taken by the company
Highly Satisfactory
Satisfactory
Needs improvement
Dissatisfactory
020406080
100120140160
% of respondentsNo. of respondents
82
Particulars Number of
respondent
s
Percentage
of
respondent
sHighly
satisfactory
12 12
Satisfactory 68 68
Needs
improvement
12 12
Dissatisfact
ory
8 8
Total 100 100

Interpretation
From the table and chart, it shows that 12% of
employees are highly satisfied with the safety
measures provided by the company. 68% of employees
are satisfied. 12% of employees need improvement and
only 8% of employees are dissatisfied with the safety
measures provided by the company.
Table No: 17
Retirement benefits
Source: primary data
83
Particular
s
Number
of
responde
nts
Percentage of
respondents
Highly
satisfacto
ry
12 12
Satisfacto
ry
72 72
Needs
improvemen
t
12 12
Dissatisfa
ctory
4 4
Total 100 100

Chart No: 17
Retirement benefits
Highly
Satis
factor
y
Satisf
actory
Needs
improv
ement
Dissat
isfact
ory0
1020304050607080
No. of respondents% of respondents
Interpretation
Table shows that 72% of employees are satisfied with
the retirement benefits provided by the company. 12%
of employees are highly satisfied, 12% of employees
need improvement, and only 4% of employees are
dissatisfied.
Table No: 18
Designation with respect to experience
84

Sou
rce :
primary data
Chart No: 18
Designation with respect to experience
Highly
Satis
factor
y
Satisf
actory
Needs
improv
ement
Dissat
isfact
ory010203040506070
No.of respondents% of respondents
Interpretation
85
Particulars Number of
responden
ts
Percentage
of
respondent
sHighly
satisfactory
22 22
Satisfactory 66 66
Needs
improvement
12 12
Dissatisfacto
ry
_ _
Total 100 100

From the table 22% of employees are highly satisfied
with their designation level. 66% of employees are
just satisfied and only 12% of employees need
improvement.
Table No: 19
Hygienic conditions in latrines and urinals
86
Particulars Number of
respondents
Percentage of
respondentsAbove average 36 36
Average 64 64
Below average _ _
Total 100 100

Source: primary data
Chart No: 19
Hygienic conditions in latrines and urinals
Above average Average Below average0
10
20
30
40
50
60
70
No.of repondents% of respondents
Interpretation
From the table 36% of the employees value the
hygienic condition maintained in the latrines and
urinals as above average. 64% of the employees value
it as average.
Table No: 20
Recreational activities provided by the company
87

Source: primary data
Chart No: 20
Recreational activities provided by the company
Highly SatisfactorySatisfactoryNeeds improvementDissatisfactory
Interpretation
From the table 40% of the employees are satisfied
88
Particulars Number of
responden
ts
Percentage
of
respondentsHighly
satisfactory
12 12
Satisfactory 40 40
Needs
improvement
48 48
Dissatisfactor
y
_ _
Total 100 100

with the recreational activities provided by the
company.12percentage of employees highly satisfied,
and 48% of employees need improvement.
Table No: 21
HRA allowances provided by the company
Source: primary data
Chart No: 21
HRA allowances provided by the company
89
Particulars Number of
responden
ts
Percentage
of
respondentsHighly
satisfactory
18 18
Satisfactory 56 56
Needs
improvement
24 24
Dissatisfactor
y
2 2
Total 100 100

Highly SatisfactorySatisfactoryNeeds improvementDissatisfactory
Interpretation
From the table 18% of employees are highly satisfied
with the HRA allowances provided by the company. 56%
of employees are just satisfied, 24% of employees
need improvement and 2% of employees are
dissatisfied.
Table No: 22
Transportation facility
90

Source: primary data
Chart No: 22
Transportation facility
91
Particulars Number of
responden
ts
Percentage
of
respondentsHighly
satisfactory
23 23
Satisfactory 54 54
Needs
improvement
13 13
Dissatisfacto
ry
10 10
Total 100 100
highly
satis
factor
y
satisf
actory
needs
improv
ement
dissat
isfact
ory0
10
20
30
40
50
60
no:of responentspercentage of respondents
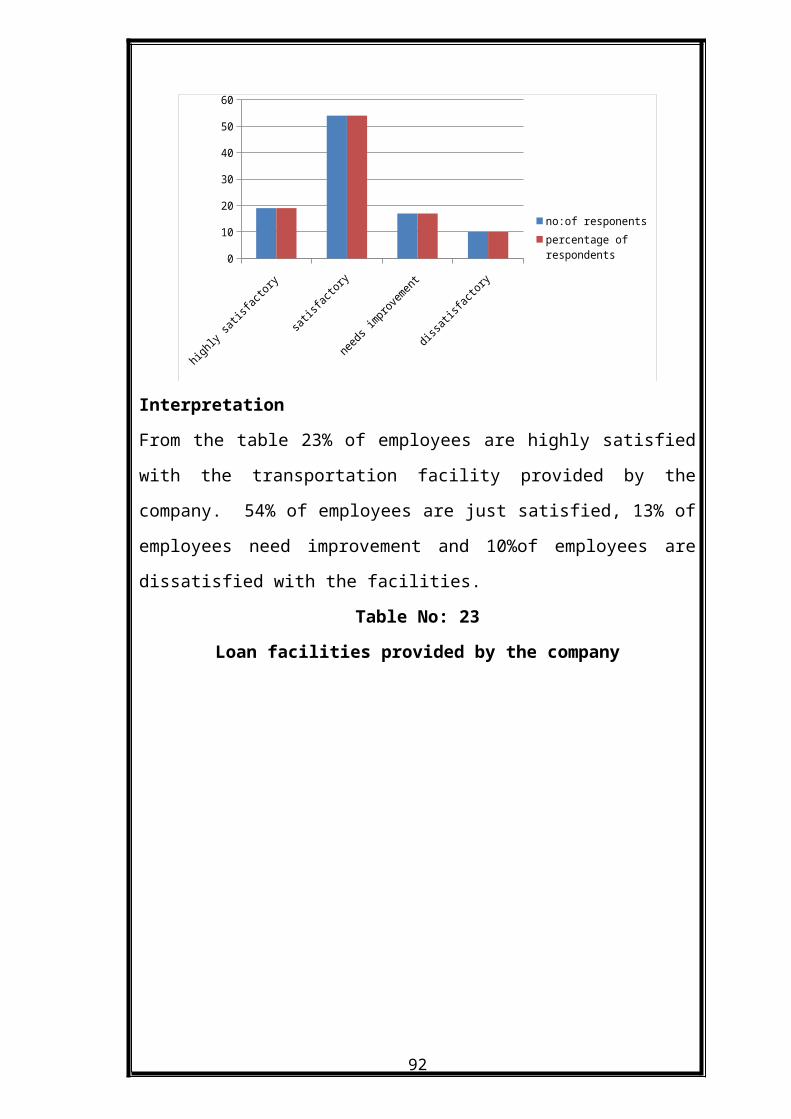
Interpretation
From the table 23% of employees are highly satisfied
with the transportation facility provided by the
company. 54% of employees are just satisfied, 13% of
employees need improvement and 10%of employees are
dissatisfied with the facilities.
Table No: 23
Loan facilities provided by the company
92

Source: primary data
Chart No: 23
93
Particulars Number of
responden
ts
Percentage
of
respondentsHighly
satisfactory
19 19
Satisfactory 54 54
Needs
improvement
17 17
Dissatisfacto
ry
10 10
Total 100 100

Loan facilities provided by the company
highly
satis
factor
y
satisf
actory
needs
improv
ement
dissat
isfact
ory0
10
20
30
40
50
60
no:of responentspercentage of respondents
Interpretation
Table shows that only 19% of employees are highly
satisfied with the loan facility provided by the
company. 54% of employees are just satisfied, 17% of
employees need improvement and 10% of employees are
dissatisfied.
Table No: 24
Educational allowance provided by the company
94

Source: primary data
Chart No: 24
Educational allowance provided by the company
95
Particulars Number of
responden
ts
Percentage
of
respondentsHighly
satisfactory
12 12
Satisfactory 48 48
Needs
improvement
24 24
Dissatisfacto
ry
16 16
Total 100 100

Highly SatisfactorySatisfactoryNeeds improvementDissatisfactory
Interpretation
From the table 12% of the employees are highly
satisfied with the educational allowances provided by
the company. 48% are satisfied, 24% of the employees
need improvement and 16 % of employees are
dissatisfied.
Table No: 25
Drinking water facility provided by the company
96

Source: primary data
Chart No: 25
Drinking water facility provided by the company
97
Particulars Number of
responden
ts
Percentage
of
respondentsHighly
satisfactory
42 42
Satisfactory 36 36
Needs
improvement
22 22
Dissatisfacto
ry
_ _
Total 100 100

Highly
Satis
factor
y
Satisf
actory
Needs
improv
ement
Dissat
isfact
ory0102030405060708090
% of respondentsNo. of respondents
Interpretation
From the table 42% of the employees are highly
satisfied with the drinking water facility provided
by the company. 36% are satisfied 22% of the
employees need improvement.
Table No: 26
Stress at work place
98

Source: primary data
Chart No: 26
Stress at work place
No. of respondents % of respondents0
10
20
30
40
50
60
YesNo
99
Particulars Number of
respondents
Percentage of
respondentsYes 60 60
No 40 40
Total 100 100

Interpretation
Table shows that 60% of the employees agree with that
they are suffering stress at work place and 40% of
the employees disagree.
Table No: 27
Overall satisfaction with the employee welfare
activities
100
Particulars Number
of
responde
nts
Percentage
of
respondent
s Excellent 16 16
Good 50 50
Average 34 34
Poor _ _
Total 100 100

Source: primary data
Chart No: 27
Overall satisfaction with the employee welfare
activities
Highly ExcellentGoodAveragePoor
Interpretation
Table shows that 16% of the employees are excellent
with the overall satisfaction of the welfare
facilities provided by the company. 50% are good, 34%
of the employees are average in welfare activities.
Table No: 28
101

Maternity leave provided by the company
Source: primary data
Chart No: 28
Maternity benefits provided by the company
No. of respondents % of respondents0
102030405060708090100
YesNo
Interpretation
The table shows that 94% of the employees are
agreeing with the maternity benefits provided by the
102
Particulars Number
of
responde
nts
Percentage
of
respondent
sYes 94 94No 6 6
Total 100 100

company and. 6% are disagreeing.
Table
No:
29
Stress control programmes
Source: primary data
Chart No: 29
Stress control programmes
103
Particulars Number
of
responde
nts
Percentage
of
respondent
sYes 38 38No 62 62
Total 100 100

No. of respondents % of respondents0
10
20
30
40
50
60
70
YesNo
Interpretation
The table shows that 38% of the employees are
agreeing with the stress control programmes provided
by the company and 62% are disagreeing.
FORMING HYPOTHESIS
HYPOTHESIS 1
To analyze, if there is a relationship between
working environment and overall satisfaction of the
organization.
HYPOTHESIS 2
To analyze, if there is a relationship between
Satisfaction of employees regarding conveyance
allowance and transportation facilities provided by
104

the organization.
HYPOTHESIS 3
To analyze, if there is a relationship between
stress and programmes for reduce stress provide by
the organization.
TESTING TOOLS
1. Chi-Square Test
2. Correlation
3. Regression
CHI-SQUARE TEST
Hypothesis 1:
105
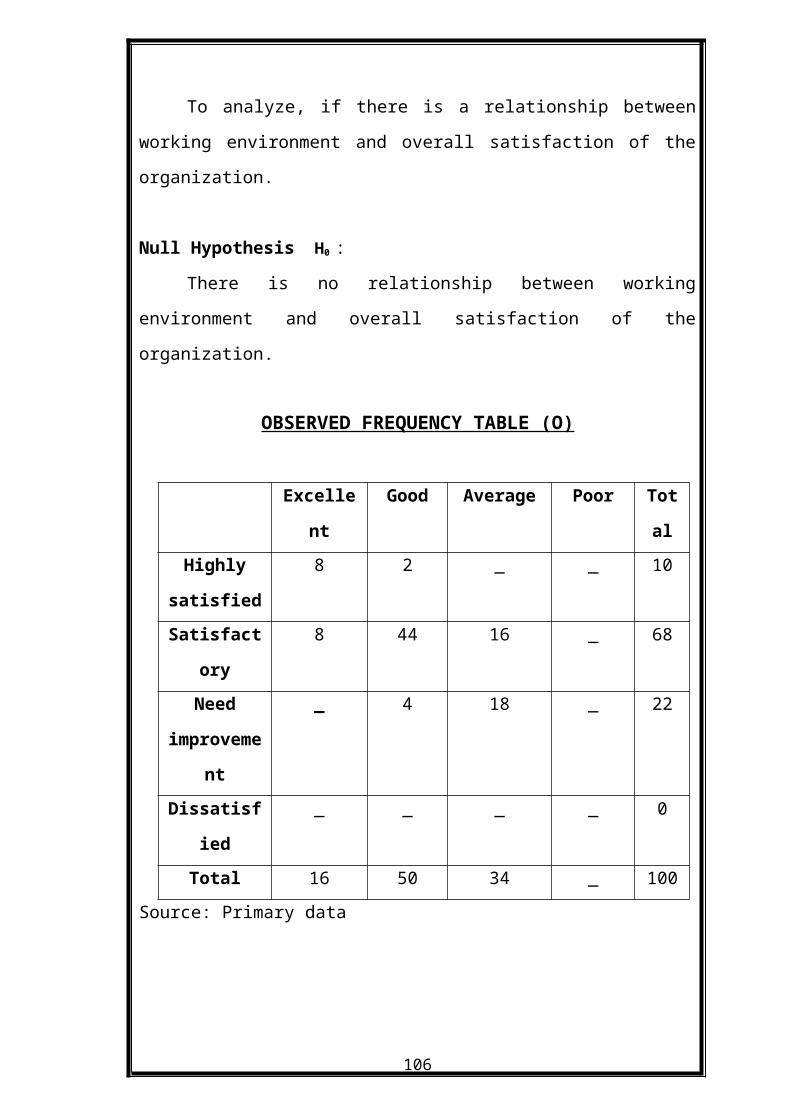
To analyze, if there is a relationship between
working environment and overall satisfaction of the
organization.
Null Hypothesis H0 :
There is no relationship between working
environment and overall satisfaction of the
organization.
OBSERVED FREQUENCY TABLE (O)
Excelle
nt
Good Average Poor Tot
alHighly
satisfied
8 2 _ _ 10
Satisfact
ory
8 44 16 _ 68
Need
improveme
nt
_ 4 18 _ 22
Dissatisf
ied
_ _ _ _ 0
Total 16 50 34 _ 100Source: Primary data
106
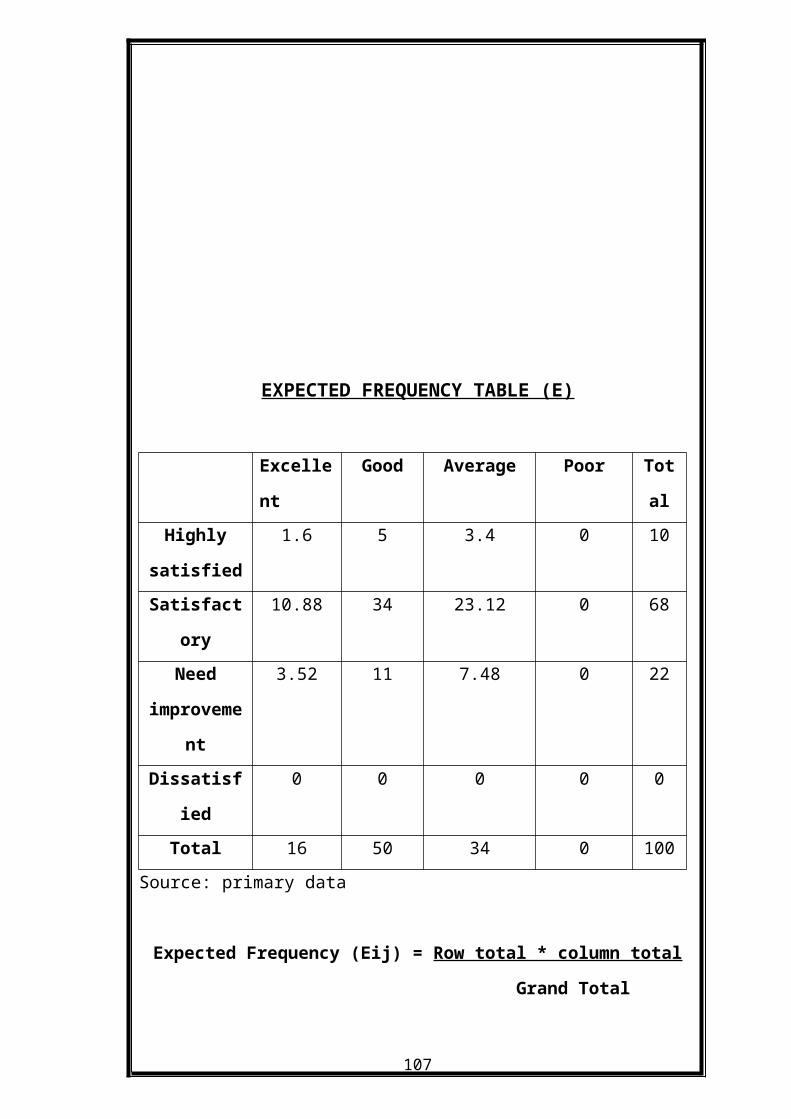
EXPECTED FREQUENCY TABLE (E)
Excelle
nt
Good Average Poor Tot
alHighly
satisfied
1.6 5 3.4 0 10
Satisfact
ory
10.88 34 23.12 0 68
Need
improveme
nt
3.52 11 7.48 0 22
Dissatisf
ied
0 0 0 0 0
Total 16 50 34 0 100Source: primary data
Expected Frequency (Eij) = Row total * column total
Grand Total
107

CHI-SQUARE TABLE
Oij Eij (Oij- Eij)² (Oij- Eij)²/
Eij8 1.6 40.96 25.68 10.88 8.2944 0.76230 3.52 12.3904 3.520 0 0 1.82 5 9 2.941144 34 100 4.4545
108

4 11 49 3.40 0 0 2.19260 3.4 11.56 14.795516 23.12 50.6944 00 7.48 110.6704 00 0 0 00 0 0 00 0 0 00 0 0 00 0 0 0
Oij =∑
100
Eij =∑
100
(Oij- Eij)²∑
= 392.5696
(Oij- Eij)²/∑
Eij
= 59.466
We have, χ² = [(Oij- Eij) ²∑ = 59.466 (Calculated
value)
Eij
Degrees of freedom (U) = (C- 1) (R- 1)
= (4- 1)
(4- 1)
= 9
109

Level of significance = 5%
Table value = 16.919
Computed χ² value = 59.466
Table χ² value =16.919
Since the calculated value is greater than the
table value, reject the null hypothesis. Therefore,
the hypothesis 1 is accepted and we accept the
hypothesis 1 i.e.
Hence,
There is relationship between working environment
and overall satisfaction with employee welfare
activities of the organization.
110
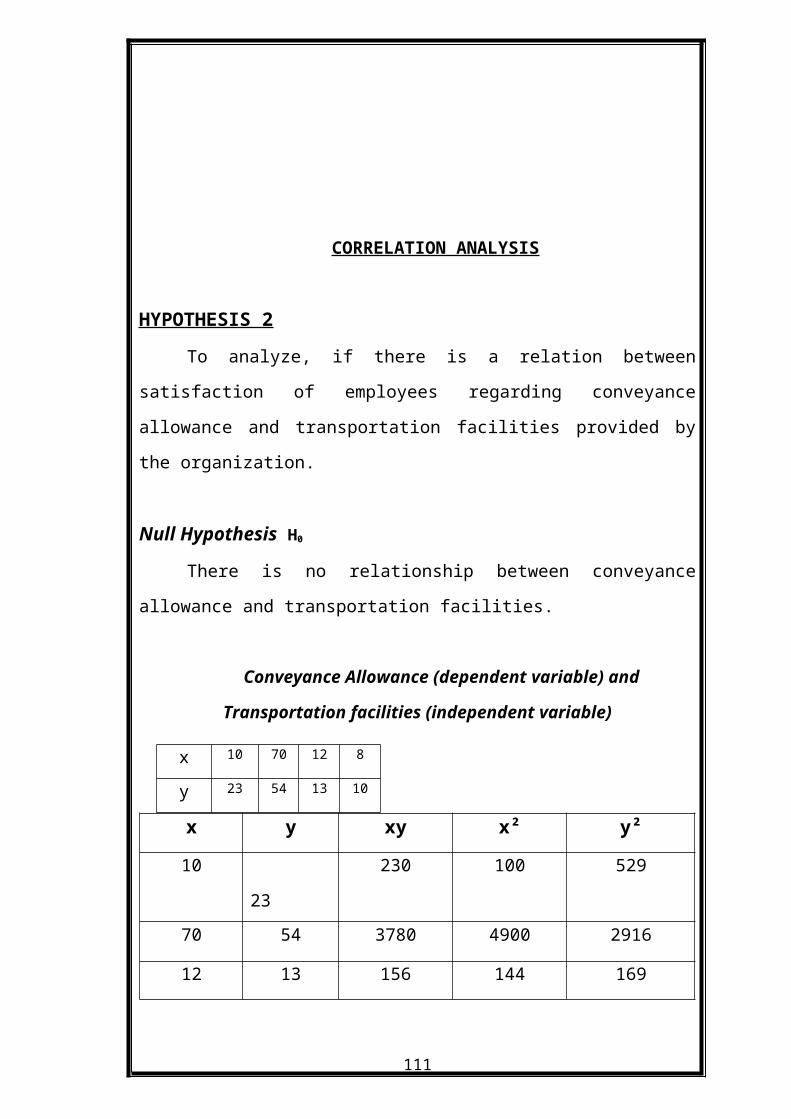
CORRELATION ANALYSIS
HYPOTHESIS 2To analyze, if there is a relation between
satisfaction of employees regarding conveyance
allowance and transportation facilities provided by
the organization.
Null Hypothesis H0
There is no relationship between conveyance
allowance and transportation facilities.
Conveyance Allowance (dependent variable) and
Transportation facilities (independent variable)
x y xy x² y²
10
23
230 100 529
70 54 3780 4900 2916
12 13 156 144 169
111
x 10 70 12 8
y 23 54 13 10
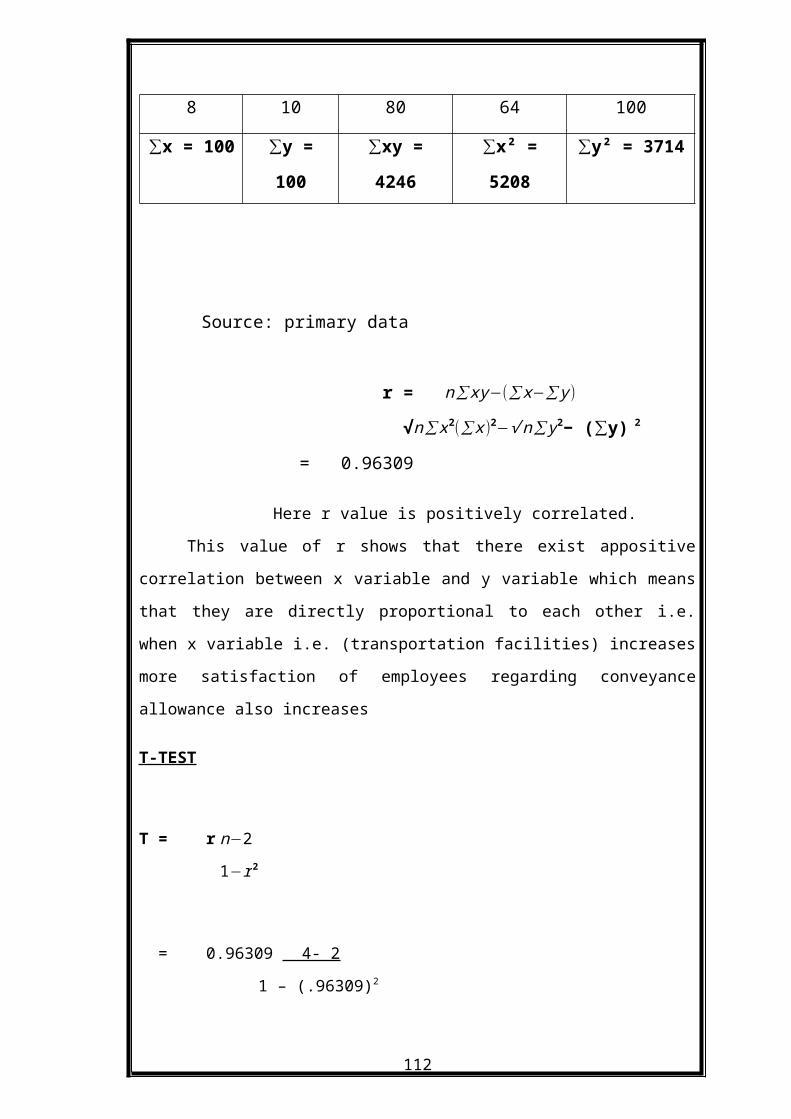
8 10 80 64 100
x = 100∑ y =∑
100
xy =∑
4246
x² =∑
5208
y² = 3714∑
Source: primary data
r = n∑xy−(∑x−∑y)
√n∑x2(∑x)2−√n∑y2− ( y)∑ 2
= 0.96309
Here r value is positively correlated.
This value of r shows that there exist appositive
correlation between x variable and y variable which means
that they are directly proportional to each other i.e.
when x variable i.e. (transportation facilities) increases
more satisfaction of employees regarding conveyance
allowance also increases
T-TEST
T = r n−2
1−r2
= 0.96309 4- 2
1 – (.96309)2
112

= 60.19(Calculated value)
Degree of Freedom = (r – 1) (c -1)
= (2 – 1) (4 – 1)
= 1×3
= 3
Table value for 3 degree of freedom at 5% level of
significance = 2.353
Since the calculated value is greater than the table
value, null hypothesis is rejected
i.e. There is relationship with conveyance allowance and
transportation facilities.
CORRELATION ANALYSIS
HYPOTHESIS 2
To analyze, if there is a relationship between
job security and overall satisfaction of the
organization.
113

Null Hypothesis H0
There is no relationship between job security and
overall satisfaction of the organization.
Job Security (dependent variable) and Overall Satisfaction of the
Organization (independent variable)
x y x² y² xy16 18 256 324 28850 60 2500 3600 300034 10 1156 100 3400 12 0 144 0
x =∑
100
y = 100∑ x² =∑
3912
y² =∑
4168
xy∑
=3628
r = n∑xy−(∑x−∑y)
√n∑x2(∑x)2−√n∑y2− ( y)∑ 2
= 0.735
Here, r is positively correlated
The value of r shows that there exist positive
correlation between x variable and y variable which
means that they are directly proportional to each
114
x 16 50 34 0
y 18 60 10 12

other i.e. when x variable (overall satisfaction of
the organization) increases. If more job security are
also increases.
T-TEST
T = r n−2
1−r2
= 0.735 4- 2
1 – (0.735)2
= 1.52
Degree of Freedom = (r – 1) (c -1)
= (2 – 1) (4 – 1)
= 1×3
= 3
Table value for 3 degree of freedom at 5% level of
significance = 2.353
Since the calculated value is greater than the table
value, null hypothesis is rejected
i.e. There is relationship with job security and
overall satisfaction of the organization.
115
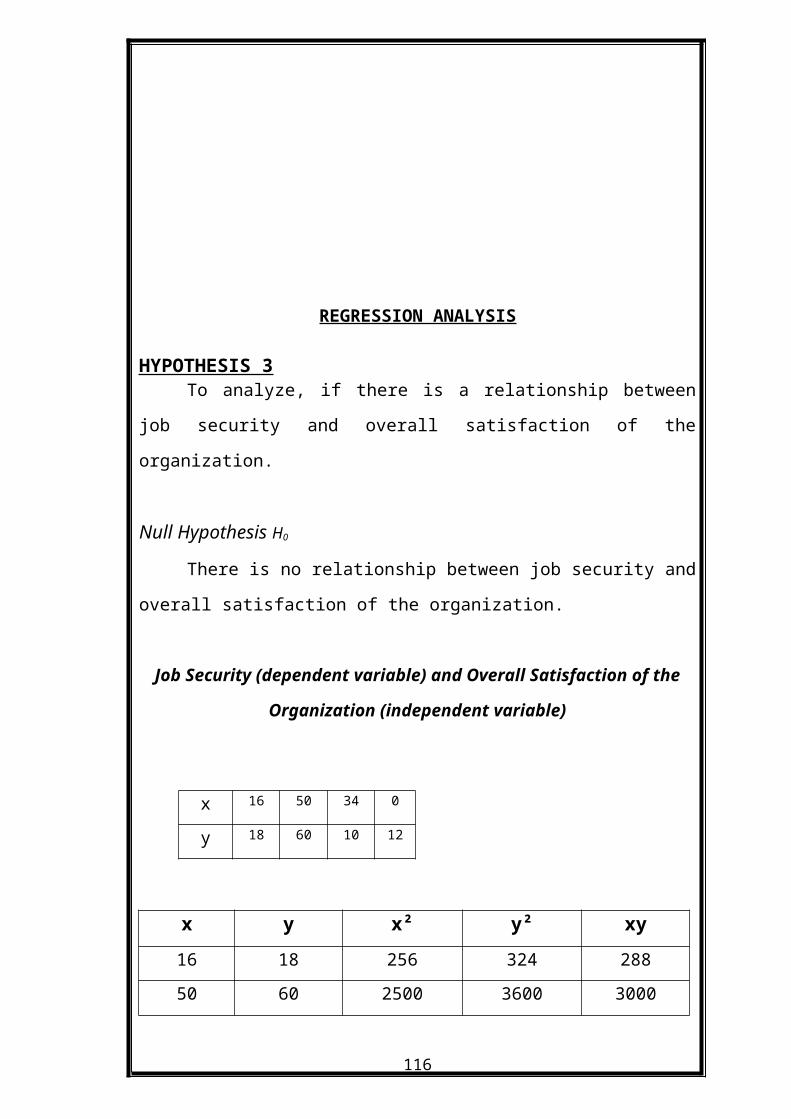
REGRESSION ANALYSIS
HYPOTHESIS 3To analyze, if there is a relationship between
job security and overall satisfaction of the
organization.
Null Hypothesis H0
There is no relationship between job security and
overall satisfaction of the organization.
Job Security (dependent variable) and Overall Satisfaction of the
Organization (independent variable)
x y x² y² xy16 18 256 324 28850 60 2500 3600 3000
116
x 16 50 34 0
y 18 60 10 12

34 10 1156 100 3400 12 0 144 0
x =∑
100
y = 100∑ x² =∑
3912
y² =∑
4168
xy∑
=3628
REGRESSION X on YRegression equation x on y is
x−¿ x=¿bxy¿ )
Where bxy = nΣxy−(Σx×Σy)
nΣy²−(Σy )²
= 4×3628 −10000
4× 4168−10000
= 0.676x= 100 ÷ 4 = 25y = 100 ÷ 4 = 25
x−¿ x=¿bxy¿ )
x- 25 = 0.676(y-25)
x- 25 = 0.676y -16.9
x- 25 = 0.676 y – 16.9 + 25
x = 0.676y + 8.1
Therefore, the regression equation x on y is
x = 0.676y + 8.1
117

REGRESSION Y on X Regression equation of y on x isy−y ¿ bxy¿ )
Where bxy = nΣxy−(Σx×Σy)
nΣx²−(Σx )²
= 4 × 3628 – 10000
4× 3912 – 10000
= 0.798x= 100 ÷ 4 = 25y = 100 ÷ 4 = 25y−y ¿ bxy¿ )
y- 25 = 0.798(x-25)
y- 25 = 0.798x -
y- 25 = 0.798x– 19.95 + 25
y = 0.798 x +5.05
Therefore, the regression equation x on y is
y =0.798x +5.05
118

0 10 20 30 40 50 600
10
20
30
40
50
60
70
18
60
1012
y
X Axis
Y Axis
Above graph shows value of x and y and extent of
correlation between variable x and variable y
119

FINDINGS
The analysis and interpretation of the data with
reference to the study has revealed the following
facts.
32% of the respondents belongs to the group of
36- 45. Next category is 46- 55 which
constitutes around 28%. Below 35 years of age,
there are only 20 employees. These constitute
good number of young workers in the
organization.
24% of the employees were postgraduates, 46% of
them were graduates and 10% have pre- degree.
20% of them were SSLC.
40% of the respondents get the wages between
10000 and 15000. Only 9% of the respondents get
the wages between 25000 and 30000 and 42% of
the respondents get wages between 20000 and
25000.
Out of 100 employees who participated in the
survey, 14% of the employees have an experience
of more than 30 years. Moreover, 42% of
employees have more than 20 years of experience
.12% of employees have experience between 11-
20 years. In addition, 32% of employees have
only below 10 years of service.
120

10% of employees are highly satisfied with the
working environment. 68% are just satisfied,
22% of the employees need improvement with the
working environment.
78% of the employees are just satisfied with
the medical benefits, 14% of the employees need
improvement and 8% of the employees are
dissatisfied.
22% of the employees are highly satisfied with the
working hours. 70% of the employees are just
satisfied, 8% needs improvement with the working
hours.
48% of the employees are satisfied with the
general ambiance provided by the company. 36% of
the employees are highly satisfied and 16% of the
employees need improvement.
10% of the employees are highly satisfied with the
conveyance allowance provided by the organization.
70% are just satisfied, 12% of the employees need
improvement and only 8% of them are dissatisfied.
100% of the employees are agreeing with the
regular increments.
14% of the employees are highly satisfied with the
leave policy provided by the organization.64% of
the employees are satisfied with the leave policy,
18% of employees need improvement and 4% are
121

dissatisfied.
14% of the employees are highly satisfied with the
relationship of trade union with the employees.
66% are just satisfied and 10% each of employees
need improvement and dissatisfied.
64% of the employees are satisfied with the
canteen service provided by the company. 18% of
employees are highly satisfied and only 18% of
employees need improvement.
100% of the employees are agreeing with the
statement organization take care of the employees
in night shift.
60% of the employees are satisfied with the job
security. 18% of the employees are highly
satisfied and only 10% of the employees need
improvement and 12% of the employees are
dissatisfied with the job security provided by the
company.
12% of employees are highly satisfied with the
safety measures provided by the company. 68% of
employees are just satisfied, 12% of employees
need improvement and only 8% of employees are
dissatisfied with the safety measures provided by
the company.
72% of employees are satisfied with the retirement
benefits provided by the company. 12% of employees
122

are highly satisfied 12% of employees need
improvement and only 4% of employees are
dissatisfied with the retirement benefits.
22% of employees are highly satisfied with their
designation level. 66% of employees are just
satisfied and only 12% of employees need
improvement.
36% of the employees are value the hygienic
condition maintained in the latrines and urinals
as above average. 64% of the employees value it as
average.
40% of the employees are satisfied with the
recreational activities provided by the company.
12% of employees highly satisfied, and 48% of
employees need improvement.
18% of employees are highly satisfied with the HRA
allowances provided by the company. 56% of
employees are just satisfied, 24% of employees
need improvement and 2% of employees are
dissatisfied.
23% of employees are highly satisfied with the
transportation facility provided by the company.
54% of employees are just satisfied .13% of
employees need improvement and 10% 0f employees
are dissatisfied.
18% of employees are highly satisfied with the
123

loan facility provided by the company. 54% of
employees are just satisfied, 17% of employees
need improvement and 10% of employees are
dissatisfied.
12% of the employees are highly satisfied with the
educational allowances provided by the company.
48% are satisfied, 24% of the employees need
improvement and 16 % of employees are
dissatisfied.
42% of the employees are highly satisfied with the
drinking water facility provided by the company.
36% are satisfied, 22% of the employees need
improvement.
60% of the employees are agreeing with that they
were suffering stress at work place and 40% of the
employees are disagreeing.
16% of the employees have rated excellent, 50%
have rated good and the rest 34% have rated
average for the overall satisfaction with employee
welfare.
94% of the employees agree that their company
provides them maternity benefits. While the rest
6% are of the opinion that they do not get any
maternity benefit.
38% of the employees agree that their company
provides stress control programmes.
124

By doing the test it is found that,
1. There is relationship between working environment
and overall satisfaction with employee welfare
activities of the organization.
2. There is relationship with conveyance allowance and
transportation facilities.
3. There is relationship between job security and
overall satisfaction of the organization.
125

SUGGESTIONS
From the study on the impact of employee welfare
on employee satisfaction, giving the following
suggestions and hope that it will help the
organization to increase the satisfaction of the
employees and thus become more productive.
Working hours
Company has to make sure that the working hours
and working conditions are giving satisfaction to
their employees.
Transportation facilities
Company has to take care into consideration about
the transportation facilities of their employees.
Night shift allowance
A fair night shift allowance should be maintained
126

by the organization that may motivate them to work.
Recreational facilities
Since majority of the employees are dissatisfied
with the recreational facilities company must provide
more emphasis for such activities. It will help to
make a sense of participation and belongings in the
employees and finally boost their performance.
Compensation
Giving satisfactory and fair amount of
compensation can probably eliminate most of the
labour disputes.
Medical benefits
Sickness benefit is useful to an employee who is
unable to work due to illness. In order to provide
social security during illness, long term hazards or
any other health hazards allowance should be given.
Life insurance
Insurance should be provided to cover for the
risks on the lives of a number of individual’s less
than one contract. This must be given to the
employees who work with an employer without evidence
of insurability.
127
Drinking water
Effective arrangements shall be made to provide
and maintain at points conveniently situated for all
workers employed therein, a sufficient supply of
drinking water should be provided in the premises.
Spittoons
There shall be provided a sufficient number of
spittoons at convenient places and they shall be
maintained in a clean and hygienic condition.
Pay and promotion
Higher pay and better opportunities for promotion
lead to higher job satisfaction.
Experience
Job satisfaction tends to go up with increasing
years of experience. Nevertheless, it may decrease
after about twenty years especially if employees do
not realize their job expectations.
Grievance
Effective grievance management is an important
and integral part of human resource management.
Company should take care of employee’s grievance
128

otherwise, they will become collective disputes.
Knowledge of rules
The employees must be informed clearly about what
constitutes good behavior and the rewards that may
emanate from it.
Employee satisfaction
Level of satisfaction of majority respondents is
clustered in the satisfactory region. The management
may take steps to convert satisfaction level from
satisfactory is highly satisfactory.
129

CONCLUSION
Welfare measures are those, which are
directed towards the workers, which is more than an
added advantage for the company. It is very necessary
to seek the co-operation of the labour force in order
to increase the production and to earn high profit.
The cooperation of the workers is possible only when
they are fully satisfied with their work and added
advantage like labour health, safety and welfare
activities.
After conducting the study, it has noticed
some loop holes in the welfare policies of the
company, which have been mentioned in the
suggestions. If the company works out on these
suggestions then it will definitely improve the
130

welfare activities of the company and its overall
effect will increase satisfaction level of employees.
This will result in increase in production and
profitability of the company.
It has attempted to link two variables
namely Welfare measures Vs Employee satisfaction. In
the analysis, a few factors of welfare measures came
out, which have linkage with employee satisfaction.
The research study has given me immense opportunity
to learn about the implementation of health, safety
and welfare measures. It has a practical exposure to
various aspects learned through theory classes. Above
all, I had the real feel of a corporate world.
BIBLIOGRAPHY
n Moser .C. A. and G. Kalton. . Survey Methods in
131

Social Investigation. London: William Heinemann
Ltd. 2nd edition 1958, P69- 74
n Goode, William J. and Paul K. Hatt.Metkods in
Social Research. New York: McGraw- Hill.3rd
edition 1988, P31- 40
n Individual Department Manuals and Documents.
n www.deshabhimani.com
n www.wikipedia.com
132

Topic: A study on the “Employee Satisfaction
towards Welfare Facilities”
In Deshabhimani, Cochin
NAME :
AGE :
SEX :
QUALIFICATION: SSLC Pre- Degree
Graduation Post- Graduation
INCOME : 10000- 15000
15000- 20000 20000- 25000 More
than 25000
1) From how many years you are working with this
organization.
a) 1- 10 years b) 11- 20 years
c) 21- 30 years d) 31- 40 2) How do you rate the working environment of the
organization?
a) Highly satisfactory b)
Satisfactory c) Needs improvement
d) Dissatisfactory
133

3) How do you rate the medical benefits provided by
the organization for the employees and their
families?
a) Highly satisfactory b)
Satisfactory c) Needs improvement
d) Dissatisfactory
4) How do you rate the working hours of the
organization?
a) Highly satisfactory b)
Satisfactory c) Needs improvement
d) Dissatisfactory
5) How do you rate the general ambiance of the
organization?
a) Highly satisfactory b) Satisfactory
c) Needs improvement
d) Dissatisfactory
6) How do you rate the conveyance allowance offered
by the organization?
a) Highly satisfactory b)
Satisfactory c) Needs improvement
d) Dissatisfactory
134

7) Do you get regular increments?
a) Yes b) No
8) How do you rate the leave policy of the
organization?
a) Highly satisfactory b)
Satisfactory c) Needs improvement
d) Dissatisfactory
9) How do you rate the relation between trade union
and the employees?
A) Highly satisfactory b)
Satisfactory c) Needs improvement
d) Dissatisfactory
10) How do you rate the canteen service provided by
the organization?
a) Highly satisfactory b)
Satisfactory c) Needs improvement
d) Dissatisfactory
11) Does the organization take care of the employees
working in night shift?
a) Yes b) No
12) How secure do you feel in your job?
135
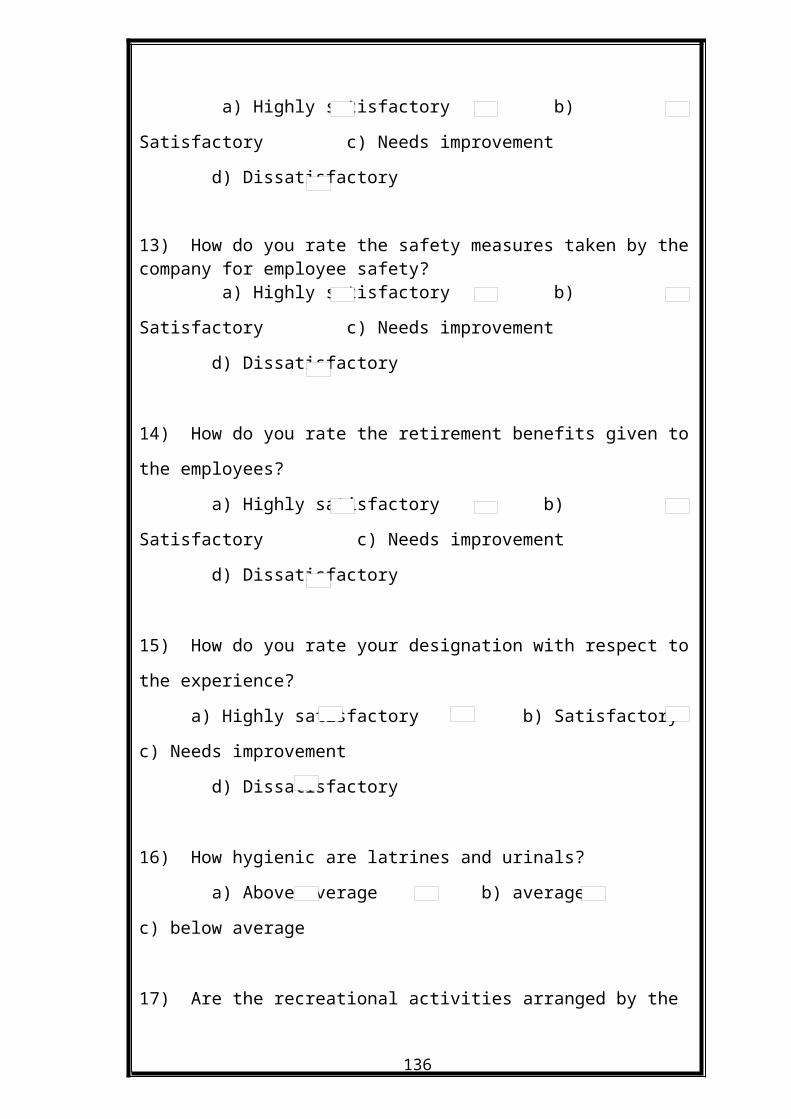
a) Highly satisfactory b)
Satisfactory c) Needs improvement
d) Dissatisfactory 13) How do you rate the safety measures taken by thecompany for employee safety? a) Highly satisfactory b)
Satisfactory c) Needs improvement
d) Dissatisfactory
14) How do you rate the retirement benefits given to
the employees?
a) Highly satisfactory b)
Satisfactory c) Needs improvement
d) Dissatisfactory
15) How do you rate your designation with respect to
the experience?
a) Highly satisfactory b) Satisfactory
c) Needs improvement
d) Dissatisfactory
16) How hygienic are latrines and urinals?
a) Above average b) average
c) below average
17) Are the recreational activities arranged by the
136

company satisfactory?
a) Highly satisfactory b)
Satisfactory c) Needs improvement
d) Dissatisfactory
18) Is the HRA allowance provided by the company
satisfactory?
a) Highly satisfactory b)
Satisfactory c) Needs improvement
d) Dissatisfactory 19) How do you rate the transportation facility
provided by the company for the employees?
a) Highly satisfactory b)
Satisfactory c) Needs improvement
d) Dissatisfactory
20) How do you rate the loan facilities made
available to the employees?
a) Highly satisfactory b)
Satisfactory c) Needs improvement
d) Dissatisfactory
21) Is the educational allowance provided by the
company satisfactory?
a) Highly satisfactory b)
Satisfactory c) Needs improvement
137

d) Dissatisfactory
22) Are you satisfied with the drinking water
facilities provided?
a) Highly satisfactory b)
Satisfactory c) Needs improvement
d) Dissatisfactory
23) Do you come across stress at your workplace?
a) Yes b) No
24) Rate the overall satisfaction with employee
welfare activities of the organization?
a) Excellent b) Good
c) Average
d) Poor
25) Does the company provide maternity leave to
female employees?
a) Yes b) No
26) Does the company provide any programmes to reduce
stress?
a) Yes b) No
138

139