Deposition of nanosized latex particles onto silica and cellulose surfaces studied by optical...
12
Journal of Colloid and Interface Science 303 (2006) 460–471 www.elsevier.com/locate/jcis Deposition of nanosized latex particles onto silica and cellulose surfaces studied by optical reflectometry Jörg Kleimann a , Guy Lecoultre a , Georg Papastavrou a , Stéphane Jeanneret a , Paolo Galletto a , Ger J.M. Koper b , Michal Borkovec a,∗ a Department of Inorganic, Analytical, and Applied Chemistry, University of Geneva, Science II, 30 Quai Ernest Ansermet, CH-1211 Geneva 4, Switzerland b Department of Chemical Technology, Delft University of Technology, Julianalaan 136, NL-2628 BL Delft, The Netherlands Received 3 July 2006; accepted 8 August 2006 Available online 15 September 2006 Abstract Deposition of positively charged nanosized latex particles onto planar silica and cellulose substrates was studied in monovalent electrolyte solu- tions at pH 9.5. The deposition was probed in situ with optical reflectometry in a stagnation point flow cell. The surface coverage can be estimated reliably with island film theory as well as with a homogeneous film model, as confirmed with atomic force microscopy (AFM). The deposition kinetics on the bare surface was of first order with respect to the particle concentration, whereby the deposition rate was close to the value expected for a perfect collector. The efficiency coefficient, which was defined as the ratio of the experimental and theoretical deposition rate constants, was in the range from 0.3 to 0.7. Subsequently, the surface saturated and a limiting maximum coverage was attained (i.e., blocking). These trends were in qualitative agreement with predictions of the random sequential absorption (RSA) model, where electrostatic interactions between the particles were included. It was observed, however, that the substrate strongly influenced the maximum coverage, which was substantially higher for silica than for cellulose. The major conclusion of this work was that the nature of the substrate played an important role in a saturated layer of deposited colloidal particles. © 2006 Elsevier Inc. All rights reserved. Keywords: Stagnation point flow cell; Island film theory; Atomic force microscopy; AFM; Ellipsometry; Random sequential absorption model; RSA model 1. Introduction Current interest in understanding colloidal particle deposi- tion is motivated by its substantial relevance to many branches of applied sciences and industrial process engineering [1–7]. Medical sciences offer probably one of the most relevant exam- ples, namely, the deposition of bacteria on teeth [5]. Their depo- sition on enamel precedes its eventual attack, which is followed by the formation of caries and tooth decay. Equally, environ- mental engineers have devoted substantial efforts to studying deposition of bacteria and other microorganisms on mineral surfaces [6,8]. This process is relevant because it determines the travel distance of microorganisms in the subsurface zone, and its understanding is primordial when groundwater from * Corresponding author. E-mail address: [email protected] (M. Borkovec). aquifers is being used as municipal water supply. Filtration and water purification is another area where particle deposition is of substantial importance [1–4]. Deposited mineral or organic particles decrease the performance of filtration membranes and lead to their fouling. As a final example, let us mention that deposition of particles onto textile fibers is relevant in the de- velopment of dirt-repellent fabrics or in the modification of their properties by deposition of colloidal particles with spe- cific functions [9,10]. The first studies addressing particle deposition from a fun- damental point of view used chromatographic techniques, and various porous media served as the collector surfaces in ques- tion [3,7,11–14]. While such systems were close to some prac- tical applications, the detailed interpretation of these experi- ments was complicated by the inherent heterogeneities of the porous media and the resulting hydrodynamics of the flow fields. Adamczyck and his co-workers were the first to cir- cumvent this problem by studying colloidal particle deposi- 0021-9797/$ – see front matter © 2006 Elsevier Inc. All rights reserved. doi:10.1016/j.jcis.2006.08.006
-
Upload
independent -
Category
Documents
-
view
2 -
download
0
Transcript of Deposition of nanosized latex particles onto silica and cellulose surfaces studied by optical...

Journal of Colloid and Interface Science 303 (2006) 460–471www.elsevier.com/locate/jcis
Deposition of nanosized latex particles onto silica and cellulose surfacesstudied by optical reflectometry
Jörg Kleimann a, Guy Lecoultre a, Georg Papastavrou a, Stéphane Jeanneret a, Paolo Galletto a,Ger J.M. Koper b, Michal Borkovec a,∗
a Department of Inorganic, Analytical, and Applied Chemistry, University of Geneva, Science II, 30 Quai Ernest Ansermet, CH-1211 Geneva 4, Switzerlandb Department of Chemical Technology, Delft University of Technology, Julianalaan 136, NL-2628 BL Delft, The Netherlands
Received 3 July 2006; accepted 8 August 2006
Available online 15 September 2006
Abstract
Deposition of positively charged nanosized latex particles onto planar silica and cellulose substrates was studied in monovalent electrolyte solu-tions at pH 9.5. The deposition was probed in situ with optical reflectometry in a stagnation point flow cell. The surface coverage can be estimatedreliably with island film theory as well as with a homogeneous film model, as confirmed with atomic force microscopy (AFM). The depositionkinetics on the bare surface was of first order with respect to the particle concentration, whereby the deposition rate was close to the value expectedfor a perfect collector. The efficiency coefficient, which was defined as the ratio of the experimental and theoretical deposition rate constants, wasin the range from 0.3 to 0.7. Subsequently, the surface saturated and a limiting maximum coverage was attained (i.e., blocking). These trends werein qualitative agreement with predictions of the random sequential absorption (RSA) model, where electrostatic interactions between the particleswere included. It was observed, however, that the substrate strongly influenced the maximum coverage, which was substantially higher for silicathan for cellulose. The major conclusion of this work was that the nature of the substrate played an important role in a saturated layer of depositedcolloidal particles.© 2006 Elsevier Inc. All rights reserved.
Keywords: Stagnation point flow cell; Island film theory; Atomic force microscopy; AFM; Ellipsometry; Random sequential absorption model; RSA model
1. Introduction
Current interest in understanding colloidal particle deposi-tion is motivated by its substantial relevance to many branchesof applied sciences and industrial process engineering [1–7].Medical sciences offer probably one of the most relevant exam-ples, namely, the deposition of bacteria on teeth [5]. Their depo-sition on enamel precedes its eventual attack, which is followedby the formation of caries and tooth decay. Equally, environ-mental engineers have devoted substantial efforts to studyingdeposition of bacteria and other microorganisms on mineralsurfaces [6,8]. This process is relevant because it determinesthe travel distance of microorganisms in the subsurface zone,and its understanding is primordial when groundwater from
* Corresponding author.E-mail address: [email protected] (M. Borkovec).
0021-9797/$ – see front matter © 2006 Elsevier Inc. All rights reserved.doi:10.1016/j.jcis.2006.08.006
aquifers is being used as municipal water supply. Filtration andwater purification is another area where particle deposition isof substantial importance [1–4]. Deposited mineral or organicparticles decrease the performance of filtration membranes andlead to their fouling. As a final example, let us mention thatdeposition of particles onto textile fibers is relevant in the de-velopment of dirt-repellent fabrics or in the modification oftheir properties by deposition of colloidal particles with spe-cific functions [9,10].
The first studies addressing particle deposition from a fun-damental point of view used chromatographic techniques, andvarious porous media served as the collector surfaces in ques-tion [3,7,11–14]. While such systems were close to some prac-tical applications, the detailed interpretation of these experi-ments was complicated by the inherent heterogeneities of theporous media and the resulting hydrodynamics of the flowfields. Adamczyck and his co-workers were the first to cir-cumvent this problem by studying colloidal particle deposi-

J. Kleimann et al. / Journal of Colloid and Interface Science 303 (2006) 460–471 461
tion to flat substrates by in situ optical microscopy in well-defined flow geometries (e.g., stagnation point, parallel plate)[15–18]. These authors focused on the deposition of cationicmicrometer-sized particles onto negatively charged glass sur-faces, and they were able to accurately characterize the timeevolution of the deposition process and the structure of the par-ticle deposits. These pioneering studies have demonstrated thatthe initial stages of the particle deposition were consistent witha first-order rate process with respect to the particle concentra-tion, and that the observed deposition rates were determinedby the transport step to the surface acting as a perfect sink.It was further reported that the deposition rate decreased withprogressive surface coverage, leading to blocking of the sur-face and constant maximum coverage of the saturated surface inthe limit of long times. This phenomenon was commonly inter-preted within the random sequential adsorption (RSA) model.In this RSA model, one attempts to place circular discs ran-domly on a planar surface. Whenever a disk is placed on anunoccupied part of the surface, it is attached irreversibly. If anyoverlap with a previously deposited disk occurs, this attempt isrejected. It was shown that this model is capable of explainingmany features of the saturation of the surface. In particular, theobserved maximum coverage was indeed close to the theoret-ical jamming limit of 0.547 and the time dependence close tosaturation obeyed the predicted power law [15–18]. The RSAmodel thus treats the surface as a perfect collector.
Such studies were extended to sub-micrometer-sized parti-cles more recently. Such systems were studied ex situ by scan-ning electron microscopy or atomic force microscopy (AFM)or in situ by ellipsometry, reflectometry, or fluorescence mi-croscopy [11,12,19–26]. These studies have shown that sat-urated deposits of small charged colloidal particles lead to amaximum coverage well below the theoretical RSA value. Thephenomenon is caused by the electrostatic repulsion betweenthe depositing particles and becomes important when the par-ticle radius, a, becomes comparable to the Debye length, κ−1,which characterizes the thickness of the diffuse layer [18,19,27]. The effect could be explained by considering a larger effec-tive radius of the depositing particles, which resulted from therepulsive forces due to the overlap of the diffuse layers. Whensuch particles deposited onto the surface, they would necessar-ily lead to a lower maximum coverage. While the effect is mostrelevant when κa � 1, it becomes negligible when κa � 1.Therefore, this effect is expected to be most pronounced fornanosized particles, while for microsized particles it is smalland hard to observe.
As our understanding of particle deposition onto well-defined mineral substrates is improving, open questions arerefocusing on the specific role of the substrates and of theparticles [28–30]. This study represents a further step in thisdirection. We present a direct comparison between the deposi-tion of nanosized amidine particles on silica and on cellulosesubstrates. Such comparative studies have not been performedin the past. While silica substrates have been investigated, littleis known about the properties of cellulose as a collector. Nev-ertheless, cellulose represents a very important substrate and isrelevant as a carrier material for filters, in papermaking, and in
Fig. 1. Schematic representation of the negatively charged substrates and the de-posited positively charged nanosized particles. Silica surface of about 100 nmon a silicon wafer (left) and cellulose surface of about 10 nm on the same sil-ica substrate (right). The corresponding refractive indices are given and theyinclude the numbering of the layers used in Appendix A.
the textile industry to model cotton [31–33]. To study deposi-tion on cellulose under well-defined conditions, a planar andhomogeneous cellulose film is required. Several procedures forproducing such films have been proposed [32–35]. We havechosen to graft chemically thin cellulose film to a silica sub-strate [32,33]. The silica substrate is an oxidized silicon waferwith a silica layer about 100 nm in thickness, which is wellsuited for the reflectometry studies. Such silica and cellulosesubstrates are used to study deposition of positively chargednanosized latex particles (see Fig. 1).
2. Experimental
2.1. Reflectometry setup
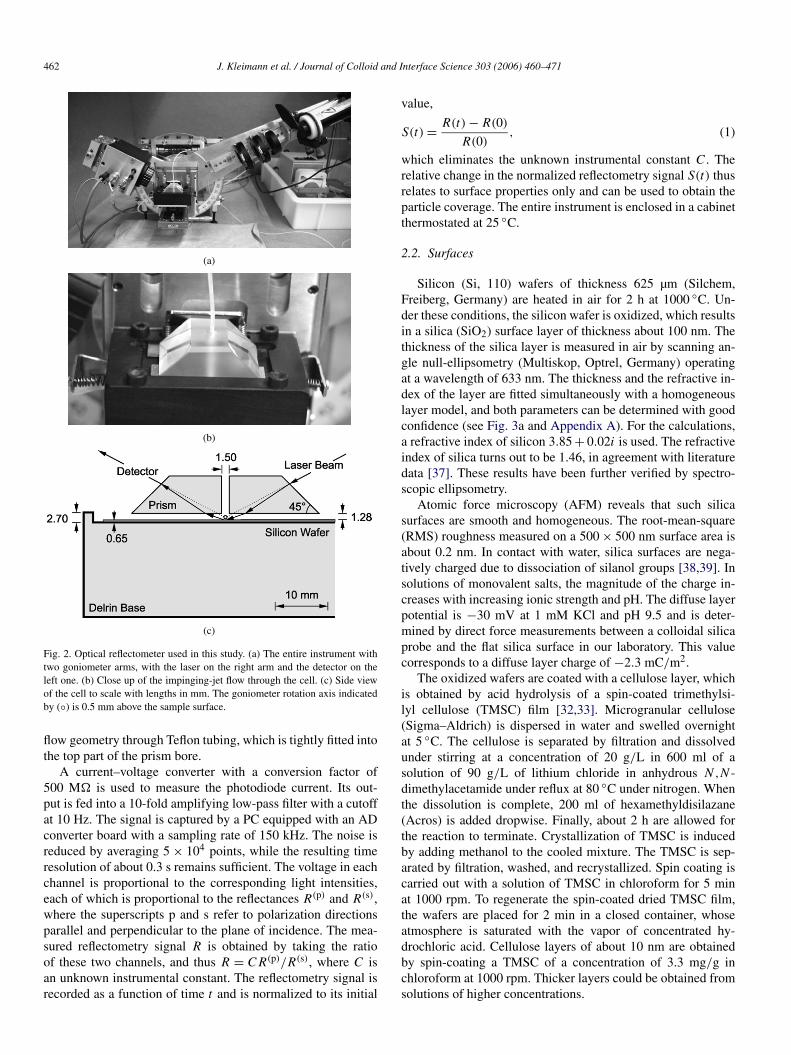
We have constructed an optical reflectometer, much in thespirit of the AKZO Nobel laboratories and Wageningen Uni-versity [36]. Our setup consists of a double manual goniometerand a cell holder placed close to its horizontal rotary axis (seeFig. 2). The arms are driven by two cogwheels and worm screwswith a small helix angle, which make the system self-locking.The longer goniometer arm supports a He–Ne laser operatingat 633 nm as the light source, a beam-stop, a neutral-density fil-ter serving as an attenuator, a linear polarizer, and a half-waveplate. The other arm carries the detector, consisting of a pin-hole, an attenuator, and a polarizing beam splitter cube. Thetwo light beams coming out of the cube correspond to polariza-tions in the directions parallel and perpendicular to the plane ofincidence, and they are measured by two photo diodes (Hama-matsu S2386-18K). The cell holder can be translated in threeperpendicular directions and tilted around two perpendicularaxes, and thus allows full control of the position and orientationof the surface under investigation. The clamping cell accommo-dates a horizontally oriented wafer as the sample, two spacersof h = 1.28 mm, and a capped 90◦ prism (BK7 glass) with avertical bore hole with radius ρ = 0.75 mm. The sample solu-tion is impinged vertically to the surface in a stagnation point
462 J. Kleimann et al. / Journal of Colloid and Interface Science 303 (2006) 460–471
(a)
(b)
(c)
Fig. 2. Optical reflectometer used in this study. (a) The entire instrument withtwo goniometer arms, with the laser on the right arm and the detector on theleft one. (b) Close up of the impinging-jet flow through the cell. (c) Side viewof the cell to scale with lengths in mm. The goniometer rotation axis indicatedby (◦) is 0.5 mm above the sample surface.
flow geometry through Teflon tubing, which is tightly fitted intothe top part of the prism bore.
A current–voltage converter with a conversion factor of500 M� is used to measure the photodiode current. Its out-put is fed into a 10-fold amplifying low-pass filter with a cutoffat 10 Hz. The signal is captured by a PC equipped with an ADconverter board with a sampling rate of 150 kHz. The noise isreduced by averaging 5 × 10⁴ points, while the resulting timeresolution of about 0.3 s remains sufficient. The voltage in eachchannel is proportional to the corresponding light intensities,each of which is proportional to the reflectances R(p) and R(s),where the superscripts p and s refer to polarization directionsparallel and perpendicular to the plane of incidence. The mea-sured reflectometry signal R is obtained by taking the ratioof these two channels, and thus R = CR(p)/R(s), where C isan unknown instrumental constant. The reflectometry signal isrecorded as a function of time t and is normalized to its initial
value,
(1)S(t) = R(t) − R(0)
R(0),
which eliminates the unknown instrumental constant C. Therelative change in the normalized reflectometry signal S(t) thusrelates to surface properties only and can be used to obtain theparticle coverage. The entire instrument is enclosed in a cabinetthermostated at 25 ◦C.
2.2. Surfaces
Silicon (Si, 110) wafers of thickness 625 µm (Silchem,Freiberg, Germany) are heated in air for 2 h at 1000 ◦C. Un-der these conditions, the silicon wafer is oxidized, which resultsin a silica (SiO2) surface layer of thickness about 100 nm. Thethickness of the silica layer is measured in air by scanning an-gle null-ellipsometry (Multiskop, Optrel, Germany) operatingat a wavelength of 633 nm. The thickness and the refractive in-dex of the layer are fitted simultaneously with a homogeneouslayer model, and both parameters can be determined with goodconfidence (see Fig. 3a and Appendix A). For the calculations,a refractive index of silicon 3.85 + 0.02i is used. The refractiveindex of silica turns out to be 1.46, in agreement with literaturedata [37]. These results have been further verified by spectro-scopic ellipsometry.
Atomic force microscopy (AFM) reveals that such silicasurfaces are smooth and homogeneous. The root-mean-square(RMS) roughness measured on a 500 × 500 nm surface area isabout 0.2 nm. In contact with water, silica surfaces are nega-tively charged due to dissociation of silanol groups [38,39]. Insolutions of monovalent salts, the magnitude of the charge in-creases with increasing ionic strength and pH. The diffuse layerpotential is −30 mV at 1 mM KCl and pH 9.5 and is deter-mined by direct force measurements between a colloidal silicaprobe and the flat silica surface in our laboratory. This valuecorresponds to a diffuse layer charge of −2.3 mC/m2.
The oxidized wafers are coated with a cellulose layer, whichis obtained by acid hydrolysis of a spin-coated trimethylsi-lyl cellulose (TMSC) film [32,33]. Microgranular cellulose(Sigma–Aldrich) is dispersed in water and swelled overnightat 5 ◦C. The cellulose is separated by filtration and dissolvedunder stirring at a concentration of 20 g/L in 600 ml of asolution of 90 g/L of lithium chloride in anhydrous N,N -dimethylacetamide under reflux at 80 ◦C under nitrogen. Whenthe dissolution is complete, 200 ml of hexamethyldisilazane(Acros) is added dropwise. Finally, about 2 h are allowed forthe reaction to terminate. Crystallization of TMSC is inducedby adding methanol to the cooled mixture. The TMSC is sep-arated by filtration, washed, and recrystallized. Spin coating iscarried out with a solution of TMSC in chloroform for 5 minat 1000 rpm. To regenerate the spin-coated dried TMSC film,the wafers are placed for 2 min in a closed container, whoseatmosphere is saturated with the vapor of concentrated hy-drochloric acid. Cellulose layers of about 10 nm are obtainedby spin-coating a TMSC of a concentration of 3.3 mg/g inchloroform at 1000 rpm. Thicker layers could be obtained fromsolutions of higher concentrations.

J. Kleimann et al. / Journal of Colloid and Interface Science 303 (2006) 460–471 463
(a)
(b)
Fig. 3. Ellipsometric angles as a function of the reflection angle with the bestfit of a homogeneous layer model. (a) Silica layer 98 nm in thickness witha refractive index of 1.46 on silicon with a refractive index of 3.85 + 0.02i.(b) A cellulose layer of 23 nm of a refractive index of 1.50 on a native silicalayer 3.6 nm in thickness on silicon. The latter quantity was determined priorto the deposition of the cellulose film.
Scanning angle ellipsometry in air yields independently thethickness and refractive index of cellulose films thicker than20 nm on native silica layers, whereby the properties of the pre-viously characterized silica layer must be used as input (seeFig. 3b). The resulting refractive index of 1.50 agrees well withthe value of 1.51 determined previously by spectroscopic el-lipsometry [40]. For cellulose films around 10 nm, only thethickness can be determined reliably and the known refractiveindex of the layer must be used as input. The latter films wereused for all deposition experiments.
AFM imaging reveals that the cellulose surfaces are rathersmooth, with an RMS roughness value around 2 nm. Thelateral dimensions of the surface inhomogeneities are about20 nm. Such cellulose films are negatively charged in wa-ter, whereby the magnitude of the charge increases with in-creasing pH and increasing concentration of a monovalent salt.Their diffuse layer potential is around −10 mV in 1 mMKCl and at pH 9.5, corresponding to a diffuse layer charge of
Table 1Characteristics of the amidine latex particles used
Amidine particles Radius (nm) Polydispersity
CVaSurface charge density
(mC/m2)cTEMa DLSb
AL-10 7.5 9.0 0.23 17AL-20 12 13 0.22 30AL-40 22 23 0.13 34AL-50 27 27 0.16 44AL-70 34 35 0.13 48
a Number-weighted mean radius and coefficient of variation (CV) from trans-mission electron microscopy (TEM).
b From hydrodynamic radius measured by dynamic light scattering (DLS).c Surface charge density obtained by conductivity titration. The particles are
positively charged.
−0.8 mC/m2. More details on these cellulose substrates can befound elsewhere [32].
2.3. Particles
Amidine latex (AL) particles are purchased from InterfacialDynamics Corporation (Portland, OR, USA). Their propertiesare summarized in Table 1. Their number-weighted mean radiiand the coefficients of variation (CV) have been measured bytransmission electron microscopy (TEM) by the manufacturer.Hydrodynamic radii are measured by dynamic light scattering(DLS) in our laboratory (ALV-NIBS, Langen, Germany) withparticle suspensions in 0.1 mM KCl at volume fractions around10−4. These values agree reasonably well with the values deter-mined by TEM. The AL-40 particles were also investigated byAFM imaging, and the size distribution has been obtained (seeFig. 4). The experimental details are given in the next section.From the AFM experiments, a number-weighted mean radiusof 19 nm and a CV around 0.25 are obtained. These valuesare in good agreement with the TEM values given in Table 1.Surface charge densities were determined with conductometrictitrations and surface area measurements by the manufacturer(see Table 1). The particles are positively charged, whereby thesign of the charge was verified by electrophoresis (Zetasizer2000, Malvern) under experimental conditions of pH 9.5 in ourlaboratory.
2.4. Deposition experiments
A previously characterized silica or cellulose substrate ismounted into the cell, and the spacers, together with the prism,are put in place. The laser arm is turned in the 90◦ position andthe surface is aligned normal to the incident beam by tiltingthe cell. The prism bore is centered on the beam by translat-ing it horizontally. The background electrolyte KCl solutionof pH 9.5 is impinged onto the surface after passing a peri-staltic pump and an air-bubble filter. The constant flow rate ismaintained at 1–2 ml min. At this point, the angle of the lasergoniometer arm is adjusted to 62◦. The cell, filled with inert saltsolution, is moved horizontally so that the laser reflects at thestagnation point. The angle of the detector arm is set so that thedetector intensities are maximized. In this way, the incident an-gle at the surface is 71◦, which is close to the Brewster angle.
464 J. Kleimann et al. / Journal of Colloid and Interface Science 303 (2006) 460–471
(a)
(b)
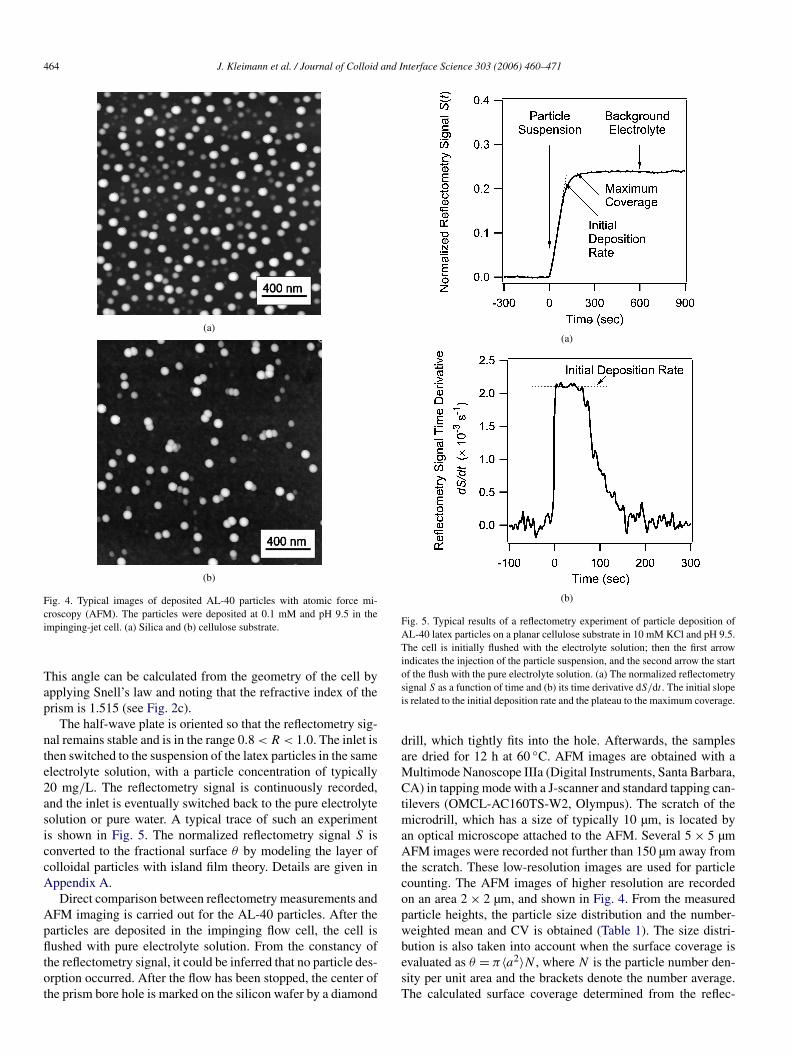
Fig. 4. Typical images of deposited AL-40 particles with atomic force mi-croscopy (AFM). The particles were deposited at 0.1 mM and pH 9.5 in theimpinging-jet cell. (a) Silica and (b) cellulose substrate.
This angle can be calculated from the geometry of the cell byapplying Snell’s law and noting that the refractive index of theprism is 1.515 (see Fig. 2c).
The half-wave plate is oriented so that the reflectometry sig-nal remains stable and is in the range 0.8 < R < 1.0. The inlet isthen switched to the suspension of the latex particles in the sameelectrolyte solution, with a particle concentration of typically20 mg/L. The reflectometry signal is continuously recorded,and the inlet is eventually switched back to the pure electrolytesolution or pure water. A typical trace of such an experimentis shown in Fig. 5. The normalized reflectometry signal S isconverted to the fractional surface θ by modeling the layer ofcolloidal particles with island film theory. Details are given inAppendix A.
Direct comparison between reflectometry measurements andAFM imaging is carried out for the AL-40 particles. After theparticles are deposited in the impinging flow cell, the cell isflushed with pure electrolyte solution. From the constancy ofthe reflectometry signal, it could be inferred that no particle des-orption occurred. After the flow has been stopped, the center ofthe prism bore hole is marked on the silicon wafer by a diamond
(a)
(b)
Fig. 5. Typical results of a reflectometry experiment of particle deposition ofAL-40 latex particles on a planar cellulose substrate in 10 mM KCl and pH 9.5.The cell is initially flushed with the electrolyte solution; then the first arrowindicates the injection of the particle suspension, and the second arrow the startof the flush with the pure electrolyte solution. (a) The normalized reflectometrysignal S as a function of time and (b) its time derivative dS/dt . The initial slopeis related to the initial deposition rate and the plateau to the maximum coverage.
drill, which tightly fits into the hole. Afterwards, the samplesare dried for 12 h at 60 ◦C. AFM images are obtained with aMultimode Nanoscope IIIa (Digital Instruments, Santa Barbara,CA) in tapping mode with a J-scanner and standard tapping can-tilevers (OMCL-AC160TS-W2, Olympus). The scratch of themicrodrill, which has a size of typically 10 µm, is located byan optical microscope attached to the AFM. Several 5 × 5 µmAFM images were recorded not further than 150 µm away fromthe scratch. These low-resolution images are used for particlecounting. The AFM images of higher resolution are recordedon an area 2 × 2 µm, and shown in Fig. 4. From the measuredparticle heights, the particle size distribution and the number-weighted mean and CV is obtained (Table 1). The size distri-bution is also taken into account when the surface coverage isevaluated as θ = π〈a2〉N , where N is the particle number den-sity per unit area and the brackets denote the number average.The calculated surface coverage determined from the reflec-

J. Kleimann et al. / Journal of Colloid and Interface Science 303 (2006) 460–471 465
tometry signal is compared with AFM imaging, whereby 500to 1500 particles are counted at a minimum of three differentspots.
3. Results and discussion
Deposition of positively charged nanosized latex particles onnegatively charged substrates is studied in situ by reflectometry.Table 1 summarizes the particle properties. Two types of planarsubstrates are being used: first, the silica layer of about 100 nmin thickness grown on a silicon wafer, and second, a chemicallygrafted cellulose layer of about 10 nm to the former substrate.The two systems are schematically depicted in Fig. 1.
3.1. General characteristics of the deposition process
Consider a typical deposition experiment of AL-40 parti-cles onto a cellulose substrate in 10 mM KCl and pH 9.5. Thetime dependence of the measured reflectometry signal is shownin Fig. 5a. The experiment is carried out as follows. The sub-strate is mounted in the reflectometer cell and flushed with theKCl electrolyte solution of pH 9.5. The reflectometer is ad-justed, and from now on the reflectometry signal is recorded.At time zero, the inlet is switched to a corresponding particlesuspension in the same electrolyte (arrow, Fig. 5a). The rapidincrease of the reflectometry signal indicates that particles aredepositing on the surface. As the surface coverage increases,the deposition rate decreases due to surface saturation, and thedeposition process terminates about after 5 min. After this de-position period, the surface coverage remains constant, as in-dicated by a constant reflectometry signal. Finally, the systemis flushed again with the pure background electrolyte solution(arrow, Fig. 5a). From the constancy of the reflectometry signalone infers that the deposited particles are irreversibly adsorbed.We have never observed any particle desorption under such con-ditions.
The reflectometry signal is converted to the surface cover-age with an optical island model. This island model treats thedeposited particles as discrete objects and the silica and cel-lulose surface layers as homogeneous and isotropic. Detailsare given in Appendix A. For two typical samples, the relativereflectometry signal S is shown as a function of the surface cov-erage θ (Fig. 6, solid line). One observes that for low coveragethe two quantities are proportional to each other, while the de-pendence becomes stronger at higher coverage. The results ofthe island model are very similar to the classical homogeneouslayer model (Fig. 6, dashed line). The deviations between thetwo models are below 4%, and thus both models can be con-sidered as equivalent. Note that the conversion depends on thenature of the substrate, and thus the thickness of the layer oneach new substrate must be determined independently.
The island model is directly tested by AFM imaging of thedeposited particles in the dry state (see Fig. 4). The images re-veal the notable polydispersity of the particles (see Table 1).On the silica substrate, the particles are well separated, as onewould expect due to the existing repulsion between adsorbedparticles. On the cellulose substrate, however, the particles tend
(a)
(b)
Fig. 6. Relation between the surface coverage θ and the normalized reflectom-etry signal S. The solid lines are calculations based on the homogeneous layermodel and island film theory. The data points were measured by AFM. (a) Sil-ica layer 88 nm in thickness and (b) cellulose layer of 10 nm on top of theformer surface.
to aggregate. We suspect that this feature is an artifact result-ing from the drying process. During the drying process, theparticles experience strong attractive capillary forces. Since thecellulose film is expected to be relatively soft, weakly charged,and possibly hairy, the deposited particles are less firmly at-tached to the surface than in the case of silica, and thus oneobtains more aggregates on the dried cellulose film. An addi-tional reason for the formation of aggregates on the cellulosesurface is its heterogeneity. Nevertheless, the particles can bestill counted reliably. The number of adsorbed particles is con-verted to the surface coverage and shown to agree reasonablywell with the coverage predicted from the reflectometry (seeFig. 6).
While the results from all deposition experiments are quali-tatively similar, two important characteristics of the depositionprofiles vary, namely, the initial deposition rate and the maxi-mum coverage (see Fig. 5a). These two quantities will be ana-lyzed in detail in the following two subsections.

466 J. Kleimann et al. / Journal of Colloid and Interface Science 303 (2006) 460–471
(a)
(b)
Fig. 7. Dependence of the initial deposition rate dθ/dt on the particle volumefraction φ in solution. The experiment was carried out with AL-40 particles in10 mM KCl and at pH 9.5. The solid lines have unit slope as expected from afirst order rate process with respect to the particle concentration. (a) Silica and(b) cellulose substrate.
3.2. Initial deposition rate
The initial slope of the deposition profile is related to the ini-tial deposition rate to the empty collector surface (see Fig. 5a).We found that this quantity is conveniently evaluated from thetime derivative of the deposition profile (see Fig. 5b). Thisderivative must show a clear initial plateau, from which the ini-tial deposition rate dθ/dt |t=0 can be evaluated reliably. Thisquantity is found to be proportional to the particle volume frac-tion in solution φ over a wide concentration range (see Fig. 7).This finding confirms the fact that the particle deposition isinitially a first order rate process with respect to the particleconcentration, namely
(2)dθ
dt= kdepφ,
where kdep is the deposition rate constant. The deposition rateconstant involves the steady-state flux of particles toward thesurface, which has been theoretically evaluated for the stagna-
tion point flow geometry assuming perfect sink conditions atthe surface. The result leads to the deposition rate constant [41]
(3)k(0)dep =
(3
4a
)0.776
ρ
(νD2α Re
)1/3,
where a is the particle radius, ρ the radius of the bore holeof the cell, ν � 8.9 × 10⁻⁷ m2/s the kinematic viscosity ofwater, D the particle diffusion coefficient, and Re = uρ/ν theReynolds number. The average flow velocity u is determinedfrom the volume flow rate, dV/dt = πuρ2. The dimension-less flow-intensity parameter α is known for the impinging jetgeometry. With Re � 22 and h/ρ � 1.7, we have α � 13 in ourcase [41].
The diffusion coefficient is measured by dynamic light scat-tering and expressed as the hydrodynamic radius with theStokes–Einstein relation (see Table 1). The first term in paren-theses in Eq. (3) converts from the commonly used adsorbedmass to the surface coverage, and the remaining part representsthe transport velocity to the surface [18,41]. The experimentaldata can be expressed as a dimensionless efficiency coefficient
(4)β = kdep
k(0)dep
,
which quantifies the deviation between the experimentally ob-served deposition rate and the one predicted by the perfect sinkmodel. The efficiency coefficients are reported in Figs. 8 and 9,and one can see that these values are relatively constant and thatthey fall in the range of 0.3–0.7.
The efficiency coefficient depends neither on the substratenor on the ionic strength (see Fig. 8). Only for the silica sub-strate does one observe a modest enhancement efficiency coef-ficient at low salt levels. This enhancement is probably causedby attractive electrostatic interactions between the positivelycharged particles and the negatively charged substrate. Theseinteractions become important at low salt levels and have beenreported for deposition as well as in particle heteroaggregation[13,42].
For both substrates, the efficiency coefficient increases withincreasing particle size (see Fig. 9). This increase is unex-pected. Nevertheless, a similar trend was reported earlier forthe deposition of negatively charged particles to silica, whichwas positively charged by adsorption of positively chargedpoly(propylene imine) dendrimers [25]. These authors have re-lated this trend to the surface charge heterogeneities in theadsorbed dendrimer layer. They argued that the contact areabetween the particle and the collector increases with increas-ing particle size, and thus leads to a larger sticking coefficient.The present explanation is hardly applicable to the presentsituation, since the present substrates are much more homo-geneous than the surfaces with adsorbed dendrimers. Possi-bly the phenomenon is related to discreetness of charge ef-fects.
3.3. Maximum coverage
During particle deposition, repulsive interactions betweenthe particles that are approaching the surface and the ones al-

J. Kleimann et al. / Journal of Colloid and Interface Science 303 (2006) 460–471 467
(a)
(b)
Fig. 8. Efficiency coefficient β as a function of the ionic strength for AL-40particles. Experiments were carried out at pH 9.5 and a particle volume fractionaround 2 × 10⁻⁵. The solid lines serve to guide the eye. (a) Silica and (b)cellulose substrate.
ready adsorbed lead to progressive blocking of the surface.After a transient period, the surface saturates and maximumcoverage is attained (see Fig. 5a). Several authors have reporteda strong decrease of the maximum coverage with decreasingsalt level and rationalized this phenomenon by including theelectrostatic interactions between the adsorbing particles intothe RSA model [18,19,27,43].
The effect of electrostatic repulsive interactions on the max-imum coverage can be estimated as follows. The actual radiusof the particles, a, is replaced by a larger effective radius, aeff,which is obtained by defining an energy threshold on the orderof the thermal energy kBT . Within the RSA model, the maxi-mum surface coverage becomes
(5)θmax = θjam(a/aeff)2,
where θjam � 0.547 is the RSA jamming limit for hard disks.At sufficiently large center-to-center separations r , a pairof charged colloidal particles interacts through the screened
(a)
(b)
Fig. 9. Efficiency coefficient β as a function of the particle size. Experimentswere carried out at pH 9.5 and a particle volume fraction around 2 × 10⁻⁵. Thesolid lines serve to guide the eye. (a) Silica and (b) cellulose substrate.
Coulomb potential
(6)u(r) = Z2e2
4πε0ε
(eκa
1 + κa
)2e−κr
r,
where Z is the effective particle charge in units of the elemen-tary charge e, ε0ε is the dielectric permittivity of water, andκ−1, the Debye length, is given by κ2 = 2e2NAI/(ε0εkBT ),where I is the ionic strength and NA is Avogadro’s number. Forhigh surface charge densities, the effective charge saturates to aconstant value, and for sufficiently high salt concentrations thisvalue can be well approximated as [19]
(7)Z = (a/LB)(4κa + 6),
where LB = e2/(4πε0εkBT ) � 0.72 nm is the Bjerrum length.The effective radius aeff is evaluated by solving λu(2aeff) =kBT , where λ defines the actual energy threshold. By settingλ = 2.8, the solution of this equation represents a good approxi-mation to the more rigorous procedure based on the low-densityexpansion of the pair correlation function on the surface. Themodel predicts an increasing maximum surface coverage withincreasing ionic strength and attains the jamming coverage

468 J. Kleimann et al. / Journal of Colloid and Interface Science 303 (2006) 460–471
(a)
(b)
Fig. 10. Maximum coverage θmax as a function of the dimensionless screening parameter κa obtained in this study (left column) and its comparison with literaturedata on planar substrates (right column). The screening parameter κa increases with the ionic strength I as κa ∝ √
I . In all graphs, the lines represent calculationsbased on the RSA model with electrostatic interactions for particle radii of 7 and 34 nm, respectively. The particle radii of the particles used in the experiments areindicated. (a) Silica and (b) cellulose or polymer modified surface. System details are given in Table 2.
θjam � 0.547 at high ionic strengths. Further details on the RSAof charged particles are given elsewhere [43,44].
Fig. 10 presents the experimental maximum coverage as afunction of the dimensionless screening parameter κa, whereκ is the inverse Debye length and a the particle radius. Notethat the screening parameter increases with increasing ionicstrength. The presently obtained experimental data (left) arecompared with literature deposition data on flat substrates(right) [19–23,45]. Table 2 gives further details on these sys-tems. The experimental data are compared with the predictionsof the RSA model (lines). The advantage of the representationas a function of the dimensionless screening parameter κa isthat the particle size dependence turns out to be very weak. Forthis reason, only the two theoretical curves corresponding to theextreme values for particle radii of 7 and 34 nm are given.
The left column shows the currently obtained maximumcoverage on silica (top) and cellulose (bottom). At low ionicstrengths the coverage is substantially higher for silica than forcellulose. Deposition onto silica is substantially underestimatedby the RSA model at low salt levels (Fig. 10a, left column).
Table 2Studies reporting maximum coverage of deposited colloidal particles on flatsubstrates
Substrate Particles Radius(nm)
Reference
Silica Amidine latex 7–34 Present studyCellulose Amidine latex 7–34 Present studyMica Amidine latex 26, 60, 95 Semmler et al. [19]Poly(vinyl imidazole)on silica
Silica particles 9, 16, 45 Bohmer et al. [20]
Silanized mica Sulfate latex 470 Adamczyk andWarszynsky [45]
Mica Amidine latex 58 Johnson and Lenhoff [21]Modified glass Sulfate latex 72 Johnson [22]Germanium glass Carboxyl latex 34 Kun and Fendler [23]
Similar, but less pronounced deviations have been reported forthe deposition of colloidal particles onto other flat mineral sub-strates (Fig. 10a, right column) [19,21–23]. The origin of thesedeviations could be related to the fact that the charge of theparticles is reduced by adsorption of counterions, that the ap-

J. Kleimann et al. / Journal of Colloid and Interface Science 303 (2006) 460–471 469
proximations inhered to the simplified RSA description ceaseto be valid, or that the interactions between the particles aremodified by the nature of the substrate. Since the maximumcoverage is substantially higher for silica than for cellulose, wesuspect that the last explanation is the correct one. The inter-actions between the particles close the substrate are probablyweakened by additional screening due to the counterions in thediffuse layer near the highly charged substrate, while this effectis absent for a more weakly charged substrate. The unequivocaldemonstration that the maximum coverage is influenced by thenature of the substrate on represents the most important findingof this paper.
The deposition to cellulose follows the RSA model verywell at low ionic strength, while some deviations can be ob-served at higher salt levels (Fig. 10b, left column). A similartrend is observed for a polymer-coated substrate (Fig. 10b,right column) [20]. The surface in the latter study has beenmodified by adsorption of partially quarternized poly(vinylimidazole). The low line charge density of the adsorbed poly-electrolyte is expected to lead to a small surface chargedensity of the substrate, thus supporting our suggestion thatthe charge of the substrate plays an important role. Thepresented literature data further suggest that the nature ofthe substrate has a substantial effect on the maximum cov-erage attained during the deposition process. Thereby, thecharge density of the substrate plays probably an importantrole.
4. Conclusion
The deposition of positively charged nanosized latex parti-cles to planar silica and cellulose substrates has been studiedin a stagnation point flow cell with optical reflectometry andatomic force microscopy (AFM). The deposition kinetics is ini-tially of first order with respect to the particle concentration,and the deposition rates are close to the value expected from thehydrodynamic perfect-sink model. The efficiency coefficient β
in the range of 0.3–0.7 increases with decreasing ionic strengthfor the strongly charged silica substrate, while it remains ap-proximately constant for the weakly charged cellulose. Afteran initial transient, the surface saturates and one attains a maxi-mum coverage. The maximum coverage increases strongly withthe ionic strength and is relatively independent of the particleradius, when represented as a function of the dimensionlessscreening parameter κa. These trends are in agreement withthe RSA model, where electrostatic interactions between theparticles are included. In contrast to the RSA model, however,a strong influence of the substrate on the maximum coverage.The charge density of the substrate seems to represent an im-portant factor, whereby one expects a higher surface coveragefor more charged substrates. The main conclusion is of this pa-per is that the nature of the substrate plays an important role indetermining the properties of the saturated layer of depositedcolloidal particles. Theoretical work and additional experimen-tal studies with different substrates are needed in to clarify theorigin of this effect, especially where κa � 1.
Acknowledgments
This work was supported by Givaudan AG, Dübendorf, theprogram TopNano21 administered by the Swiss Commissionof Technology and Innovation, the National Science Founda-tion, and the University of Geneva. The authors thank ChristianQuellet, Remco Fokking, Jaro Ricka, and Henk Verpoorte forhelpful discussions, and Markus Textor and Laurent Feuz formaking spectroscopic ellipsometry available to us.
Appendix A
The optical models evaluate the reflection properties of asolid layer, on which the colloidal film is deposited (see Fig. 1).Theoretical ellipsometric angles and reflectometry signals areobtained with an extended version of the Abelès matrix method[37,46,47].
Consider a stack of homogeneous plane-parallel layers la-beled by m = 0,1, . . . ,M , each of which has a refractive indexnm. The stack is illuminated through the semi-infinite medium0 (water) at an angle ϑ0 relative to the normal of the interfaceand terminated by another semi-infinite medium M . The Fres-nel complex-amplitude reflection and transmission coefficientsfor an interface between the two layers m and m + 1 are givenby [37]
r(p)
m,m+1 = nm+1cm − nmcm+1
nm+1cm + nmcm+1,
t(p)
m,m+1 = 2nmcm
nm+1cm + nmcm+1,
r(s)m,m+1 = nmcm − nm+1cm+1
nmcm + nm+1cm+1,
(A.1)t(s)m,m+1 = 2nmcm
nmcm + nm+1cm+1,
where sm are determined by Snell’s law, nm+1sm+1 = nmsm,with s0 = sinϑ0 and cm obtained from the trigonometric rela-tion s2
m + c2m = 1. The Abelès matrix for such a stack of layers
can be written as [37]
(A.2)A(k) = I(k)0,1
M−1∏m=1
LmI(k)m,m+1,
where k = p, s refers to the polarization direction and a phasematrix Lm,m+1 and an interface matrix I(k)
m,m+1 have been in-troduced. The phase matrix describes the phase shift due to thelayer,
(A.3)Lm,m+1 =(
e−iΔm 00 e+iΔm
),
where Δm = 2πnmcmdm/λ, with dm being the thickness oflayer m and λ the wave length of the light in vacuum. The inter-face matrix accounts for the modification of the electric fieldsupon reflection and transmission and reads
(A.4)I(k)m,m+1 = 1
t(k)m,m+1
(1 r
(k)m,m+1
r(k)m,m+1 1
).

470 J. Kleimann et al. / Journal of Colloid and Interface Science 303 (2006) 460–471
The complex reflectivity coefficients of the complete stackof layers can then be calculated from the ratio of the matrixelements,
(A.5)r(k) = A(k)21
A(k)11
,
and from those, one directly obtains the ellipsometric ratio
(A.6)ρ = r(p)
r(s)= tanΨ eiΔ,
where we have introduced the two ellipsometric angles Ψ
and Δ. The overall reflectances are given by
(A.7)R(k) = ∣∣r(k)∣∣2
,
yielding the measured signal R = CR(p)/R(s). The unknownconstant C is eliminated when the signal is normalized to itsinitial value (cf. Eq. (1)).
A colloidal film deposited on the substrate changes the op-tical properties of the interface between the ambient medium(m = 0) and the top layer (m = 1). The Abelès matrix for theentire stack of layers can be written as
(A.8)A(k) = M(k)0,1
M−1∏m=1
LmI(k)m,m+1,
where the matrix M(k)0,1 now replaces the interface matrix I(k)
0,1in Eq. (A.1) and accounts for the properties of the depositedparticles.
The simplest approach is to treat the colloidal particle filmas an additional homogeneous layer F. Applying Eq. (A.1), oneobtains
(A.9)M(k)0,1 = I(k)
0,FLFI(k)F,1,
where the layer matrix LF for the film invokes an optical thick-ness of the film dF, and the interface matrices I(k)
0,F and I(k)F,1 re-
quire its refractive index nF. For particles of radius a and refrac-tive index nP, the layer thickness is dF = 2a and the refractiveindex of the film nF can be estimated from the Maxwell–Garnetequation
(A.10)n2
F − n20
n2F + 2n2
0
= ϕn2
P − n20
n2P + 2n2
0
,
where ϕ is the particle volume fraction within the film, whichcan be expressed in terms of the surface coverage θ as ϕ =2θ/3. Since the colloidal particle film is treated as a homo-geneous layer, one may also refer to an effective medium ap-proach.
The discrete character of the colloidal particle film is treatedwithin the island theory. The colloidal film assumed to be em-bedded in the aqueous phase, and the film matrix can be nowexpressed as [46,47]
M(k)0,1 = J(k)
0,FLFI(k)F,1,
where the layer matrix invokes the distance of the particles cen-ters from the surface dF = a. The interface matrix is given by
(A.11)J(k)0,F = 1
t(k)
(1 −r
(k)F
r(k)
(t(k)
)2 − (r(k)
)2
),
F F F F
where the reflection and transmission coefficients are approxi-mated as
r(p)F = iX
1 − iX− iY
1 − iY, t
(p)F = 1 + XY
(1 − iX)(1 − iY ),
(A.12)r(s)F = iZ
1 − iZ, t
(s)F = 1
1 − iZ,
with the abbreviations
(A.13)X = n30s
20
2c0β̄, Y = c0
2n0γ̄ , Z = 1
2n0c0γ̄
and the two following constitutive coefficients:
(A.14)γ̄ = 8πa
λn2
0n2
P − n20
n2P + 2n2
0
θ and β̄ = γ̄
n40
.
The latter are related to the polarizabilities in the directionsparallel and perpendicular to the surface. The above relationsdefine the island model, which explicitly treats the lateral het-erogeneity of the adsorbed particle film.
The more rigorous approach is to express the effect of theentire particle film in terms of the matrix
(A.15)M(k)0,1 = 1
t(k)0,1
(1 −r
(k)1,0
r(k)0,1 t
(k)0,1t
(k)1,0 − r
(k)0,1r
(k)1,0
),
where the entering complex amplitude reflection and transmis-sion coefficients are known up to second order in the film thick-ness [48,49]. This approach can be referred to as the generalisland film theory. In the present case, the results do not dif-fer by more than 4% from the simple island model discussedabove.
References
[1] A.E. Childress, M. Elimelech, Environ. Sci. Technol. 34 (2000) 3710–3716.
[2] J.A. Redman, S.B. Grant, T.M. Olson, M.K. Estes, Environ. Sci. Tech-nol. 35 (2001) 1798–1805.
[3] J.N. Ryan, M. Elimelech, Colloids Surf. A 107 (1996) 1–56.[4] R.B. Bai, C. Tien, J. Colloid Interface Sci. 186 (1997) 307–317.[5] R. Bos, J.H. de Jonge, B. van de Belt-Gritter, J. de Vries, H.J. Busscher,
Langmuir 16 (2000) 2845–2850.[6] N. Tufenkji, M. Elimelech, Langmuir 20 (2004) 10818–10828.[7] D. Grolimund, M. Elimelech, M. Borkovec, K. Barmettler, R. Kret-
zschmar, H. Sticher, Environ. Sci. Technol. 32 (1998) 3562–3569.[8] S.F. Simoni, H. Harms, T.N.P. Bosma, A.J.B. Zehnder, Environ. Sci. Tech-
nol. 32 (1998) 2100–2105.[9] G. Manning, Inside Cosmetics (1998) 26–31.
[10] C. Quellet, M. Schudel, R. Ringgenberg, Chimia 55 (2001) 421–428.[11] V. Privman, H.L. Frisch, N. Ryde, E. Matijevic, J. Chem. Soc. Faraday
Trans. 87 (1991) 1371–1375.[12] N. Ryde, N. Kallay, E. Matijevic, J. Chem. Soc. Faraday Trans. 87 (1991)
1377–1381.[13] M. Elimelech, J. Colloid Interface Sci. 164 (1994) 190–199.[14] M. Elimelech, C.R. O’Melia, Langmuir 6 (1990) 1153–1163.[15] Z. Adamczyk, B. Siwek, M. Zembala, P. Warszynski, J. Colloid Interface
Sci. 130 (1989) 578–587.[16] Z. Adamczyk, M. Zembala, B. Siwek, P. Warszynski, J. Colloid Interface
Sci. 140 (1990) 123–137.[17] Z. Adamczyk, B. Siwek, M. Zembala, P. Weronski, Langmuir 8 (1992)
2605–2610.

J. Kleimann et al. / Journal of Colloid and Interface Science 303 (2006) 460–471 471
[18] Z. Adamczyk, P. Warszynski, Adv. Colloid Interface Sci. 63 (1996) 41–149.
[19] M. Semmler, E.K. Mann, J. Ricka, M. Borkovec, Langmuir 14 (1998)5127–5132.
[20] M.R. Bohmer, E.A. van der Zeeuw, G.J.M. Koper, J. Colloid InterfaceSci. 197 (1998) 242–250.
[21] C.A. Johnson, A.M. Lenhoff, J. Colloid Interface Sci. 179 (1996) 587–599.
[22] C.A. Johnson, Ph.D. thesis, University of Delaware,1996.[23] R. Kun, J.H. Fendler, J. Phys. Chem. B 108 (2004) 3462–3468.[24] Y. Luthi, J. Ricka, M. Borkovec, J. Colloid Interface Sci. 206 (1998) 314–
321.[25] R.C. van Duijvenbode, G.J.M. Koper, J. Colloid Interface Sci. 239 (2001)
581–583.[26] L. Schaffner, B.G.R. Nyffenegger, R. Walter, J. Ricka, J. Kleimann, J.
Hotz, C. Quellet, Colloids Surf. A 286 (2006) 39–50.[27] M.R. Oberholzer, J.M. Stankovich, S.L. Carnie, D.Y.C. Chan, A.M.
Lenhoff, J. Colloid Interface Sci. 194 (1997) 138–153.[28] V.V. Hardikar, D.V. Goia, E. Matijevic, Colloids Surf. A 159 (1999) 121–
133.[29] N. Ryde, E. Matijevic, J. Colloid Interface Sci. 169 (1995) 468–475.[30] D.A. Antelmi, O. Spalla, Langmuir 15 (1999) 7478–7489.[31] D. Klemm, B. Philipp, T. Heinze, U. Heinze, W. Wagenknecht, Compre-
hensive Cellulose Chemistry, Wiley–VCH, Weinheim, 1998.[32] I.L. Radtchenko, G. Papastavrou, M. Borkovec, Biomacromolecules 6
(2005) 3057–3066.[33] E. Kontturi, P.C. Thune, J.W. Niemantsverdriet, Langmuir 19 (2003)
5735–5741.
[34] C. Geffroy, M.P. Labeau, K. Wong, B. Cabane, M.A. Cohen Stuart, Col-loids Surf. A 172 (2000) 47–56.
[35] C.L. McCormick, P.A. Callais, B.H. Hudchinson Jr., Macromolecules 18(1985) 2394–2401.
[36] J.C. Dijt, M.A. Cohen Stuart, G.J. Fleer, Adv. Colloid Interface Sci. 50(1994) 79–101.
[37] R.M.A. Azzam, N.M. Bashara, Ellipsometry and Polarized Light, North-Holland, Amsterdam, 1979.
[38] T. Hiemstra, J.C.M. Dewit, W.H. van Riemsdijk, J. Colloid InterfaceSci. 133 (1989) 105–117.
[39] M. Kobayashi, M. Skarba, P. Galletto, D. Cakara, M. Borkovec, J. ColloidInterface Sci. 292 (2005) 139–147.
[40] L. Bergstrom, S. Stemme, T. Dahlfors, H. Arwin, L. Odberg, Cellulose 6(1999) 1–13.
[41] T. Dabros, T.G.M. van de Ven, Colloid Polym. Sci. 261 (1983) 694–707.[42] W. Lin, M. Kobayashi, M. Skarba, C. Mu, P. Galletto, M. Borkovec, Lang-
muir 22 (2006) 1038–1047.[43] Z. Adamczyk, Adv. Colloid Interface Sci. 100 (2003) 267–347.[44] P. Schaaf, J.C. Voegel, B. Senger, J. Phys. Chem. B 104 (2000) 2204–
2214.[45] Z. Adamczyk, P. Warszynsky, Adv. Colloid Interface Sci. 63 (1996) 41–
149.[46] G.J.M. Koper, Colloids Surf. A 165 (2000) 39–57.[47] E.S. Kooij, H. Wormeester, E.A.M. Brouwer, E. van Vroonhoven, A. van
Silfhout, B. Poelsema, Langmuir 18 (2002) 4401–4413.[48] D. Bedeaux, J. Vlieger, Optical Properties of Surfaces, Imperial College
Press, London, 2002.[49] M.T. Haarmans, D. Bedeaux, Thin Solid Films 258 (1995) 213–223.